
Submitted:
15 February 2024
Posted:
19 February 2024
You are already at the latest version
Abstract
In order to improve the yield of the therapeutic agent N-methylsansalvamide (SA), optimization of stationary liquid fermentation conditions was carried out on an endophytic strain, Fusarium sp. R1, at flask level. Using a One-Factor-At-a-Time approach, the fermentation conditions for SA production were determined as follows: fermentation time of 13 d, 24 oC, initial pH of 6.5, seed age of 24 h, inoculum size of 5.0% (v/v), loading volume of 50% (v/v), 20.0 g/L salinity, and sucrose, tryptone, and yeast extract were found to be the best sources of carbon and nitrogen. Using response surface methodology, the optimal medium compositions consist of 22.5 g/L sucrose, 16.5 g/L tryptone, and 0.024 g/L yeast extract. Verification tests suggested that the SA yield under these optimal conditions reached up to 536.77 ± 2.67 mg/L, which was increased by almost ten times the initial yield (54.05 ± 3.45 mg/L). The findings indicate that a high SA production yield can be achieved by static culture of strain R1 under the proper fermentation conditions using a low-cost medium. This study paves the way towards industrial-scale SA production by strain R1 for new drug development.
Keywords:
Cyclic pentadepsipeptide
; Fusarium
; Fermentation condition
; Fermentation medium composition
; Response surface methodology
1. Introduction
Plant endophytic fungi are one of the richest sources of secondary metabolites with novel structure and biodiversity [1], which have potential roles in the development of new drugs and agents of biological control [2]. Fusarium, a type of endophytic fungus, is capable of producing a wide variety of secondary metabolites [3] (alkaloids, peptides, amides, terpenoids, quinones, and pyranones) [4].
Cyclopeptides as drug candidates possess several advantages, including high binding affinity and selectivity for protein ligands, higher lipophilicity, and membrane permeability [5]. Sansalvamide A was the first cytotoxic cyclic pentapeptide to be discovered from Fusarium #CNL 292, which is associated with the marine higher plant Halodule wrightii, and it consists of four hydrophobic amino acids [phenylalanine (L-Phe), two leucines (L-Leu), and one valine (L-Val)] and one hydroxy acid [leucic acid (O-Leu)] [6]. N-methylsansalvamide (SA), one cyclic pentadepsipeptide originally produced by strain Fusarium sp. CNL-619, consists of four hydrophobic amino acids [L-Phe, L-Leu, N-methylleucine, and L-Val] and one hydroxy acid (O-Leu) (Figure 1) [7]. Park et al., found that SA possesses an excellent inhibitory effect on colon tumors; its IC50 concentration was observed at 24.05 ± 1.07 μM [8], suggesting it has therapeutic potential in the treatment of cancer disease.
To increase the production of metabolites during microbial fermentation, the production medium and fermentation conditions must be optimized. The best fermentation conditions (such as pH, temperature, agitation speed, etc.) and medium components (such as carbon and nitrogen sources, etc.) are optimized for the design of the production medium.
One-Factor-At-a-Time (OFAT) design has been the most favored choice for designing the fermentation conditions [9]. Response surface methodology (RSM) is an effective mathematical and statistical technique for planning experiments, analyzing the effects of variables, creating models, and finding the best combinations of variables for producing adaptive and desired responses [10]. Due to the extremely low production of SA, it is necessary to improve SA yield in stationary liquid fermentation conditions. With the aim of improving SA production by the endophytic fungus strain R1, optimization of fermentation conditions was carried out in this work using OFAT design and RSM, which were respectively used to screen medium compositions and fermentation conditions.
2. Materials and Methods
2.1. Strain and Cultivation
Strain R1 was isolated from the coastal plant Rumex madaio Makino, collected from Putuo Island (Zhoushan, China), and was identified as Fusarium sp. on the basis of its 18S rRNA sequence (GenBank accession No. MF376147) and ITS sequence (GenBank accession No. ON545070) [11]. This strain R1 had been deposited at the China General Microbiological Culture Collection Center with the accession number CGMCC No. 17763.
Strain R1 was incubated on potato dextrose agar (PDA) plates at 30 oC for 4 days. One agar-grown mycelial plug was transferred to culture broth in 1-L Erlenmeyer flasks that contained 500-mL of potato dextrose broth (PDB) medium, followed by shaking at 180 rpm at 30 oC for 72 hours.
2.2. Fermentation Process
The primary fermentation medium consisted of glucose-peptone-yeast extract (GPY) medium, 10.0 g/L glucose, 5.0 g/L tryptone, 2.0 g/L yeast extract, and 2.0 g/L sea salt. An aliquot of 20 mL of seed culture (5.0%, v/v) was inoculated into 1-L Erlenmeyer flasks containing 400-mL of GPY medium and then cultivated for 13 days under static conditions at 25 oC.
2.3. Analytical Method for SA
By the end of fermentation, all mycelia in the shake flask were collected and separated from the broth using gauze, followed by ultrasonic-assisted extraction with ethanol (20:1, mL:g) for 30 min at room temperature. After filtration with filter paper, all filtrate was evaporated at 40 oC in vacuum to afford the crude extract and subsequently dissolved in 15 mL of chromatographic methanol, followed by filtration with an organic membrane filter (0.22 μm) and then preserved at 4 oC before HPLC analysis. SA analysis was conducted on a HPLC apparatus (LC-20AT, Shimadzu, Japan) equipped with a Phenomenex C18 column (5 μm, 4.6×250 mm) and a UV detector at 210 nm in isocratic mode with a flow rate of 1.0 mL/min (Figure 2a). The mobile phase consisted of water and acetonitrile containing 0.1% formic acid in a ratio of 30:70 (v/v). The standard curve equation for SA quantification (Figure 2b) was obtained as follows:
y = 16604 x - 36020, R2 = 0.9999
2.4. Effects of Fermentation Conditions on SA Yield
The effects of fermentation conditions, including fermentation time, temperature, initial pH, seed age, inoculum size, loading volume, and sea salt concentration, on SA yield were carefully observed using the OFAT approach. The general medium compositions for all OFAT experiments consisted of 10.0 g/L glucose, 5.0 g/L tryptone, 2.0 g/L yeast extract, and 2.0 g/L sea salt, and the general fermentation conditions for SA production were as follows: fermentation time of 13 d, temperature of 25 oC, initial pH of 7.5, seed age of 72 h, inoculum amount of 5.0% (v/v), and loading volume of 40% (v/v). All factors were individually evaluated at various levels below: (i) fermentation time (4, 8, 11, 12, 13, 14, 15, 16, 17 d), (ii) fermentation temperature (20, 24, 28, 30, 34, 37 oC), (iii) initial pH (4.0, 4.5, 5.0, 5.5, 6.0, 6.5, 7.0), (iv) seed age (24, 48, 72, 96, 120 h), (v) inoculum size (v/v) (2.0, 4.0, 5.0, 8.0, 10.0%), (vi) loading volume (v/v) (10, 20, 30, 40, 50, 60%), (vii) sea salt concentration (0, 2.0, 8.0, 15.0, 20.0, 25.0, 30.0 g/L). All experiments were performed in triplicate.
2.5. Effects of Carbon and Nitrogen Sources on SA Yield
The effects of various carbon and nitrogen sources on SA yield were also evaluated using the OFAT experiments. The carbon source glucose in the fermentation medium (10.0 g/L glucose, 5.0 g/L tryptone, 2.0 g/L yeast extract, and 2.0 g/L sea salt) was respectively substituted by other carbon sources, including sugar, glucose, maltose, glycerol, lactose, and sucrose at 10.0 g/L. And two nitrogen sources (tryptone and yeast extract) were respectively replaced by other nutritional elements, including beef extract, yeast extract, water-soluble soybean meal, soy peptone, tryptone, casein peptone, and soy bean flour at 7.0 g/L.
2.6. Determination of Central Values for Response Surface Design
Owing to the fact that the central values of medium compositions for optimization were unsuccessfully obtained through the above single-factor experiments, both the Plackett-Burman design (PBD) and the steepest ascent method (SAM) were employed. A set of 12 experiments were conducted to evaluate the effects of three variables (sucrose, tryptone, and yeast extract), each of which had high and low levels (Table 1). The difference between the average response at two levels was used to evaluate the impact of each variable.
According to the results obtained from the above PBD experiments, the step size for each variable in SAM was appropriately designed (Table 2). And each central value of factors (sucrose, tryptone, and yeast extract) for response surface experiments was further fixed on the basis of their effects on SA yield.
2.7. Response Surface Methodology for Optimization of Medium Compositions
In order to optimize the medium compositions for SA production, a sequence of 17 tests was carried out using Box-Behnken design (BBD). All data were the mean of three parallel experiments (Table 3).
2.8. Experimental Data Processing
The software Design-Expert (Version 13.0.0, Stat-Ease Inc., Minneapolis, USA) was used to conduct PBD and BBD experiments as well as data analysis.
2.9. Verification Experiments
To verify the validity of the optimal fermentation conditions and medium compositions for SA production, three groups of parallel experiments were carried out. All data were averaged and presented as mean ± standard deviation (SD).
3. Results
3.1. Effects of Fermentation Conditions on SA yield
3.1.1. Effect of Fermentation Time on SA Production
Microbial biomass is essential for the biosynthesis and accumulation of secondary metabolites (SMs). SM production is affected by the amounts of nutritional materials, which gradually decreases in the flask during fermentation process. Usually, microorganisms undergo senescence and autolysis by releasing digestive enzymes that break down their SMs [12]. As shown in Figure 3a, fermentation time strongly affects SA yield, which increased in a time-dependent manner within the range of 4 to 11 days and then slightly decreased, followed by obvious enhancement. Highest yield of SA reached up to 89.17 ± 6.06 mg/L on day 13. Strain R1 mycelial growth during the first 4 days of incubation, which can partly explain the low production of SA at this stage. Subsequently, the mycelium growth entered a stagnant period and began to accumulate secondary metabolism SA. After day 13, SA production decreased due to nutrient depletion in the fermentation medium. Therefore, a fermentation time of 13 days was chosen as the optimal duration for the experiment.
3.1.2. Effect of Temperature on SA Production
Temperature is one of the important factors that affect the rates of various enzymatic reactions in the biosynthesis pathway of microbial SMs [13,14]. Maintaining the proper temperature throughout the fermentation process is crucial to the efficient production of the target metabolite. As presented in Figure 3b, the SA yield varied at different fermentation temperatures and reached the highest level (129.32 ± 0.60 mg/L) at 24 oC and subsequently decreased under higher temperatures. Strain R1 produced SA through anaerobic fermentation. Consequently, SA was produced at a higher rate at lower ambient temperatures when there was more dissolved oxygen present in the culture medium. However, excessively low temperatures may reduce the enzyme activity, leading to a decrease in the contents of SA. Therefore, 24 oC was chosen as the optimal fermentation temperature in this experiment.
3.1.3. Effect of Initial pH on SA Production
The pH of fermentation broth could affect intramolecular forces and change the shapes of enzymes involved in SM biosynthesis and the electrical charge of cell membranes [15].As shown in Figure 3c, SA yield was gradually improved with the increasing initial pH, which ranged from 4.0 to 6.5 and reached the top level (52.22 ± 9.45 mg/L) at pH 6.5. This result suggested that highly acidic conditions (pH ≤ 4) are not suitable for the production of SA, and strain R1 is highly efficient in SA production under faintly acidic conditions. Therefore, the pH value of 6.5 was chosen as the optimal pH for this investigation.
3.1.4. Effect of Seed Age on SA Production
Microbial seeds in the logarithmic growth phase have a strong capability of reproduction and grow more rapidly [16]. Therefore, in the experiment, we select microbial seeds at the logarithmic growth stage for higher production of SA. As shown in Figure 3d, the SA yield increased to the highest level (104.16 ± 2.16 mg/L) at the seed age of 24 h and gradually decreased over time owing to mycelial aging. Therefore, the best seed age was 24 hours.
3.1.5. Effect of Inoculum Size on SA Production
Inoculum size in a fixture container could affect the growth rate of strains [17]. An inoculum with a small size can prolong the lag phase, and an inoculum with a large size will cause niches to overlap excessively, hence inhibiting the production of SA. As shown in Figure 3e, the results suggested that with an increase in inoculation amount, the SA yield gradually increased and reached its maximum (121.77 ± 5.20 mg/L) at 5.0% (v/v) inoculum size, followed by a slow decline at a larger amount of inoculation. Therefore, the optimal inoculum size was shown to be 5.0% (v/v).
3.1.6. Effect of Loading Volume on SA Production
The microbial growth and metabolism are influenced by its loading volume in a fixed container. An appropriate amount of loading volume can ensure the oxygen and nutrient demands of strains during fermentation [18]. And different liquid volumes can lead to variations in the mycelial surface area of strain R1. Therefore, selecting the appropriate liquid volume is crucial for increasing the yield of strain R1. As shown in Figure 3f, the yield of SA gradually increased in a loading volume-dependent manner and reached the highest level (98.64 ± 3.90 mg/L) when the liquid loading amount was 50% (v/v), and the surface area of strain R1 was 100.46 cm2. This suggests that the mycelium size, dissolved oxygen content, and nutrient supply are all appropriate for the SA fermentation process of strain R1 at 50% (v/v) liquid volume.
3.1.7. Effect of Concentration of Sea Salt on SA Production
Strain R1 is halophilic since it grows well at various concentrations of sea salt. As shown in Figure 3g, it is essential to add sea salt to the culture base, which does not produce SA when it does not contain sea salt. This may be because strain R1 that is separated from the coastal sea plants and adapts to the growing environment containing sea salt. Therefore, adding sea salt to the medium facilitates the metabolism of enzymes in strain R1 and promotes the production of SA. With the increase in sea salt concentration in the fermentation medium, SA yield was slightly enhanced and reached its maximum (145.93 ± 6.40 mg/L) at 20.0 g/L, followed by a decrease at higher concentrations of sea salt. The best concentration of sea salt was 20.0 g/L.
3.2. Effect of Carbon and Nitrogen Sources on SA Production
Studying carbon and nitrogen sources influence on production through traditional optimization. Microorganisms require carbon sources to obtain energy and enhance SM biosynthesis [19]. As shown in Figure 4A, after glucose was replaced in the original medium with sugar, glucose, maltose, glycerin, sucrose, lactose, the SA production in decreasing order was with sucrose, glycerin, maltose, sugar, glucose, lactose. Sucrose as a carbon source resulted in the highest SA production, reaching 162.30 ± 16.79 mg/L, whereas the SA production resulting from lactose was the lowest among the carbon sources that were tested in this research. Various carbon sources displayed different effects on SA production. The maximum SA yield (162.30 ± 16.79 mg/L) was achieved when sucrose was used as a carbon source, suggesting it was the most favorable carbon source for SA biosynthesis.
A high-quality nitrogen source is crucial for efficient fermentation [20]. As shown in Figure 4B, the same content of beef extract, yeast extract, water-soluble soybean meal, soy peptone, soy bean flour, tryptone, casein peptone, tryptone and yeast extract replaced the nitrogen in the original medium. The SA production in decreasing order was with tryptone and yeast extract, casein peptone, tryptone, beef extract, water-soluble soybean meal, soy peptone, yeast extract, soy bean flour. As a result, the impact of nitrogen sources on the production of SA is apparent, and it is preferable to use animal nitrogen instead of plant nitrogen. Casein peptone or a combination of tryptone and yeast extract as a nitrogen source was more favorable for SA production, which yield was 112.31 ± 14.42 mg/L and 114.65 ± 3.45 mg/L, respectively. In respect to fermentation cost, tryptone and yeast extract were selected as the best nitrogen sources, Additionally, tryptone and yeast extract are the most easily accessed energy sources.
3.3. Central Values Analysis
The Plackett-Burman design (PBD) is a valuable methodology for examining the impact of medium composition. The total number of experiments carried out by PBD is n + 1, where n is the number of variables. In this research, PBD was employed to assess the positive and negative effects of sucrose, yeast extract, and tryptone on SA yield. Table 4 presents the design matrix for twelve runs, incorporating three variables, along with the corresponding responses for SA yield. The data was analyzed using regression analysis, with SA yield (Y) as the response variable. The resulting regression equation is as follows:
where Y, A, B, and C, respectively represent the predicted SA yield, sucrose, yeast extract, and tryptone.
Y = 20.5 + 0.479 A - 4.66 B + 5.88 C
The PBD results indicated that tryptone and sucrose had a significant positive impact on SA yield, and yeast extract showed a negative effect (Table 5). Specifically, higher concentrations of tryptone and sucrose and lower yeast extract in the fermentation medium enhanced SA production.
To optimize the response values of each main factor for subsequent response surface analysis, the steepest ascent test was conducted to approach the maximum response value region. According to the result of PBD and the equation of the step length of the steepest ascent method, in the SAM experiments, each step for sucrose, tryptone, and yeast extract concentrations was set at 2.5, 4.0, and 0.7 g/L, respectively. The findings indicated a trend of increasing and then decreasing in the production of SA, suggesting the reliability of the test design, as shown in Table 6. The results suggested that the maximum yield of SA (385.33 ± 14.72 g/L) was achieved when the 3nd experiment was run (Table 6). Therefore, these concentrations of sucrose, yeast extract, and tryptone were chosen to set up basal points for BBD. As the sucrose and tryptone increased, the yeast extract decreased gradually, and the production of SA increased along the path, reaching the peak of 385.33 ± 14.72 mg/L, then decreased, which suggested that the optimal values were close to those in test 3 (20.0 g/L sucrose, 0.6 g/L yeast extract, and 14 g/L tryptone). Therefore, this point was chosen to set up basal concentrations for BBD.
3.4. Response Surface Methodology Analysis
To further increase SA production, a total of 17 statistical experiments for BBD were carried out to investigate the individual and interactive effects of three medium components (sucrose, yeast extract, and tryptone) and determine the optimal concentrations on SA yield (Table 7).
The following equation can be used in regression analysis to determine the impact of these factors on the response value when SA yield is used as the response value:
where Y, A, B, and C, respectively represent the predicted SA yield, sucrose, yeast extract, and tryptone. The variance analysis of the secondary polynomial model presented in Table 8 includes a statistical evaluation of the significance of the model equation using the F test for the analysis of variance (ANOVA).
Y = 511.89 A - 58.21 A - 46.98 B + 46.91 C - 68.80 A B + 44.58 A C - 43.93 A2 - 41.35 B2 - 107.49 C2
The p-value less than 0.05 indicated that the model term was significant. The coefficient of determination suggested that the model explains 92.81% of the variation in SA yield observed in the experiment. The calibrated coefficient of determination (R2adj) is 0.8356. Therefore, this regression equation can be used to predict SA yield. The primary terms A, B, and C, as well as the interaction terms AB and the secondary term C2, were found to be significant, indicating that the factors had non-linear effects on SA yield.
To investigate the effect of the optimum level of each variable and its interaction on SA yield, three-dimensional (3D) response surfaces (Figure 5) and contour plots (Figure 6) were plotted for any two independent variables. These plots exhibit a clear convex form with a downward trend, highlighting the ideal levels for maximizing SA yield. The model predicted a maximum SA yield of 537.64 mg/L when the concentrations of sucrose, tryptone, and yeast extract were set at 22.5, 16.5, and 0.024 g/L, respectively.
3.5. Verification Experiment
The suitability of the model equation for predicting the best response values was verified under optimal conditions. The result predicted by RSM was validated by carrying out an experiment using the best-predicted SA production. The actual SA yield was 536.77 ± 2.67 mg/L, which was in good agreement with the calculated values (537.64 mg/L), demonstrating that the model developed in this study adequately reflected the predicted optimization of SA production.
4. Discussion
SA has therapeutic potential and could lead to the development of novel drugs for cancer. Based on the information from the literature, SA production requires Marine Broth 2216 medium as a substrate, which was cultivated under static conditions at 25 oC for 21 days [7]. Although the development of sequencing technologies and bioinformatics tools that enable the quick and systematic identification of known and cryptic biosynthetic gene clusters (BGCs) provides tools to improve production yield [21]. In contrast to the genetic techniques utilized for SA production, the process parameters were initially optimized by the traditional methods described in this paper, which are characterized by their brevity and enhanced efficiency. The selection of ideal cultural conditions for statistical optimization was based on the OFAT design and optimization of fermentation medium components by RSM. Similar to our study, Lee focused on the effects of variables on the production of SA analogues, neoN-methylsansalvamide, and optimum culture conditions on cereal substrates using RSM [22]. There are currently no reports of the optimization of SA conditions for the production of Fusarium spp, the experimental research results will hopefully serve as useful feedback information for improvements for improving the yield of SA.
Fermentation conditions were optimized for SA production using an OFAT approach. PBD is a widely accepted approach used for the production of SMs. SAM typically performs additional optimization on the key variables that PBD screened in order to assess interaction effects and look for ideal conditions. In this study, sucrose and tryptone were identified as positive factors, and yeast extract was identified as a negative factor for SA production by PBD. These three factors were further optimized by SAM. It was found that when the content of sucrose increased from 15.0 to 20.0 g/L, the content of tryptone increased from 6.0 to 14.0 g/L, and the content of yeast extract decreased from 2.0 to 0.6 g/L, the production of SA greatly increased. Thus, choosing the optimal content of carbon and nitrogen plays an important role in the microbial metabolism. RSM has often been used as a subsequent process to optimize the content of medium components. In this study, the yield of SA reached 536.77 ± 2.67 mg/L (10-fold increase) in the medium optimized with RSM. The non-statistical and statistical tools used in the optimization process play a crucial role in determining the medium compositions and the optimal values of the factors with higher accuracy. Additionally, the response surface methodology program can predict the results for various medium formulations, which can be beneficial for researchers aiming for low-cost production by creating different strategic models.
In conclusion, we successfully utilized the RSM and OFAT approaches to optimize the conditions of stationary liquid fermentation and the components of the medium for SA production by strain R1 at the flask level. The optimal conditions were determined as follows: a fermentation time of 13 days, a temperature of 24 oC, an initial pH of 6.5, a seed age of 24 hours, an inoculum size of 5.0% (v/v), a loading volume of 50% (v/v), sucrose concentration of 22.5 g/L, tryptone concentration of 16.5 g/L, yeast extract concentration of 0.024 g/L, and sea salt concentration of 20.0 g/L. Under these optimal conditions, the SA yield reached up to 536.77 ± 2.67 mg/L, which was approximately 10 times higher than that of the original conditions. These results indicate that rational optimization of fermentation conditions and medium can effectively improve SA yield and pave the way for large-scale SA production by strain R1 for new drug development.
Author Contributions
Author Contributions: Conceptualization, project administration and funding acquisition, H.Z.; methodology, Y.S. and Y.B.; software, Z.C.; formal analysis, N.P.; investigation, Y.S., Y.B. and Z.C.; resources, N.P.; data curation, Y.S.; writing—original draft preparation, Y.S.; writing— review and editing, Y.S., H.Z. All authors have read and agreed to the published version of the manuscript.
Funding
This research was funded by the National Key Research and Development Program of China (2022YFC2804203).
Institutional Review Board Statement
Not applicable.
Informed Consent Statement
Not applicable.
Data Availability Statement
Not applicable.
Conflicts of Interest
The authors declare no conflict of interest.
References
- Gangadevi, V.; Muthumary, J. Taxol, an anticancer drug produced by an endophytic fungus Bartalinia robillardoides Tassi, isolated from a medicinal plant, Aegle marmelos Correa ex Roxb. World Journal of Microbiology and Biotechnology 2007, 24, 717–724. [Google Scholar] [CrossRef]
- Gangadevi, V.; Muthumary, J. A novel endophytic Taxol-producing fungus Chaetomella raphigera isolated from a medicinal plant, Terminalia arjuna. Appl Biochem Biotechnol 2009, 158, 675–684. [Google Scholar] [CrossRef]
- Toghueo, R.M.K. Bioprospecting endophytic fungi from Fusarium genus as sources of bioactive metabolites. Mycology 2020, 11, 1–21. [Google Scholar] [CrossRef]
- Li, M.; Yu, R.; Bai, X.; Wang, H.; Zhang, H. Fusarium: a treasure trove of bioactive secondary metabolites. Nat Prod Rep 2020, 37, 1568–1588. [Google Scholar] [CrossRef]
- Liu, S.; Gu, W.; Lo, D.; Ding, X.Z.; Ujiki, M.; Adrian, T.E.; Soff, G.A.; Silverman, R.B. N-methylsansalvamide a peptide analogues. Potent new antitumor agents. J Med Chem 2005, 48, 3630–3638. [Google Scholar] [CrossRef]
- Belofsky, G.N.; Jensen, P.R.; Fenical, W. Sansalvamide: A new cytotoxic cyclic depsipeptide produced by a marine fungus of the genus Fusarium. Tetrahedron Letters 1999, 40, 2913–2916. [Google Scholar] [CrossRef]
- Cueto, M.; Jensen, P.R.; Fenical, W. N-methylsansalvamide, a cytotoxic cyclic depsipeptide from a marine fungus of the genus Fusarium. Phytochemistry 2000, 55, 223–226. [Google Scholar] [CrossRef]
- Park, J.; Moon, S.K.; Lee, C. N-methylsansalvamide elicits antitumor effects in colon cancer cells in vitro and in vivo by regulating proliferation, apoptosis, and metastatic capacity. Front Pharmacol 2023, 14, 1146966. [Google Scholar] [CrossRef]
- Kheiralla, Z.H.; El-Gendy, N.S.; Ahmed, H.A.; Shaltout, T.H.; Hussein, M.M.D. One-factor-at-a-time (OFAT) optimization of hemicellulases production from Fusarium moniliformein submerged fermentation. Energ Source Part A 2018, 40, 1877–1885. [Google Scholar] [CrossRef]
- Guo, F.Z.; Zheng, H.R.; Cheng, Y.W.; Song, S.; Zheng, Z.X.; Jia, S. Medium optimization for epsilon-poly-L-lysine production by Streptomyces diastatochromogenes using response surface methodology. Lett Appl Microbiol 2018, 66, 124–131. [Google Scholar] [CrossRef]
- Liu, Y.Y.; Xu, M.J.; Tang, Y.Q.; Shao, Y.L.; Wang, H.; Zhang, H.W. Genome features and antiSMASH analysis of an endophytic strain Fusarium sp. R1. Metabolites 2022, 12, 521. [Google Scholar] [CrossRef]
- Xie, L.; Xie, J.; Chen, X.; Tao, X.; Xie, J.; Shi, X.; Huang, Z. Comparative transcriptome analysis of Monascus purpureus at different fermentation times revealed candidate genes involved in exopolysaccharide biosynthesis. Food Res Int 2022, 160, 111700. [Google Scholar] [CrossRef]
- Daniel, R.M.; Danson, M.J. Temperature and the catalytic activity of enzymes: a fresh understanding. FEBS Lett 2013, 587, 2738–2743. [Google Scholar] [CrossRef]
- Xu, X.; Chu, X.; Du, B.; Huang, C.; Xie, C.; Zhang, Z.; Jiang, L. Functional characterization of a novel violacein biosynthesis operon from Janthinobacterium sp. B9-8. Appl Microbiol Biotechnol 2022, 106, 2903–2916. [Google Scholar] [CrossRef]
- Zhang, X.; Li, X.; Zhao, X.; Li, Y. Factors affecting the efficiency of a bioelectrochemical system: a review. RSC Adv 2019, 9, 19748–19761. [Google Scholar] [CrossRef]
- Long, R.; Yang, W.; Huang, G. Optimization of fermentation conditions for the production of epothilone B. Chem Biol Drug Des 2020, 96, 768–772. [Google Scholar] [CrossRef]
- Kumar, V.; Ahluwalia, V.; Saran, S.; Kumar, J.; Patel, A.K.; Singhania, R.R. Recent developments on solid-state fermentation for production of microbial secondary metabolites: Challenges and solutions. Bioresour Technol 2021, 323, 124566. [Google Scholar] [CrossRef]
- Hammarlund, E.U.; Flashman, E.; Mohlin, S.; Licausi, F. Oxygen-sensing mechanisms across eukaryotic kingdoms and their roles in complex multicellularity. Science 2020, 370. [Google Scholar] [CrossRef]
- Singh, V.; Haque, S.; Niwas, R.; Srivastava, A.; Pasupuleti, M.; Tripathi, C.K. Strategies for fermentation medium optimization: an in-depth review. Front Microbiol 2016, 7, 2087. [Google Scholar] [CrossRef]
- He, H.; Li, Y.; Zhang, L.; Ding, Z.; Shi, G. Understanding and application of Bacillus nitrogen regulation: A synthetic biology perspective. J Adv Res 2023, 49, 1–14. [Google Scholar] [CrossRef]
- Kang, H.S.; Kim, E.S. Recent advances in heterologous expression of natural product biosynthetic gene clusters in Streptomyces hosts. Curr Opin Biotechnol 2021, 69, 118–127. [Google Scholar] [CrossRef] [PubMed]
- Lee, H.S.; Phat, C.; Nam, W.S.; Lee, C. Optimization of culture conditions of Fusarium solani for the production of neoN-methylsansalvamide. Biosci Biotechnol Biochem 2014, 78, 1421–1427. [Google Scholar] [CrossRef] [PubMed]
Figure 1.
Chemical structure of N-methylsansalvamide (SA).
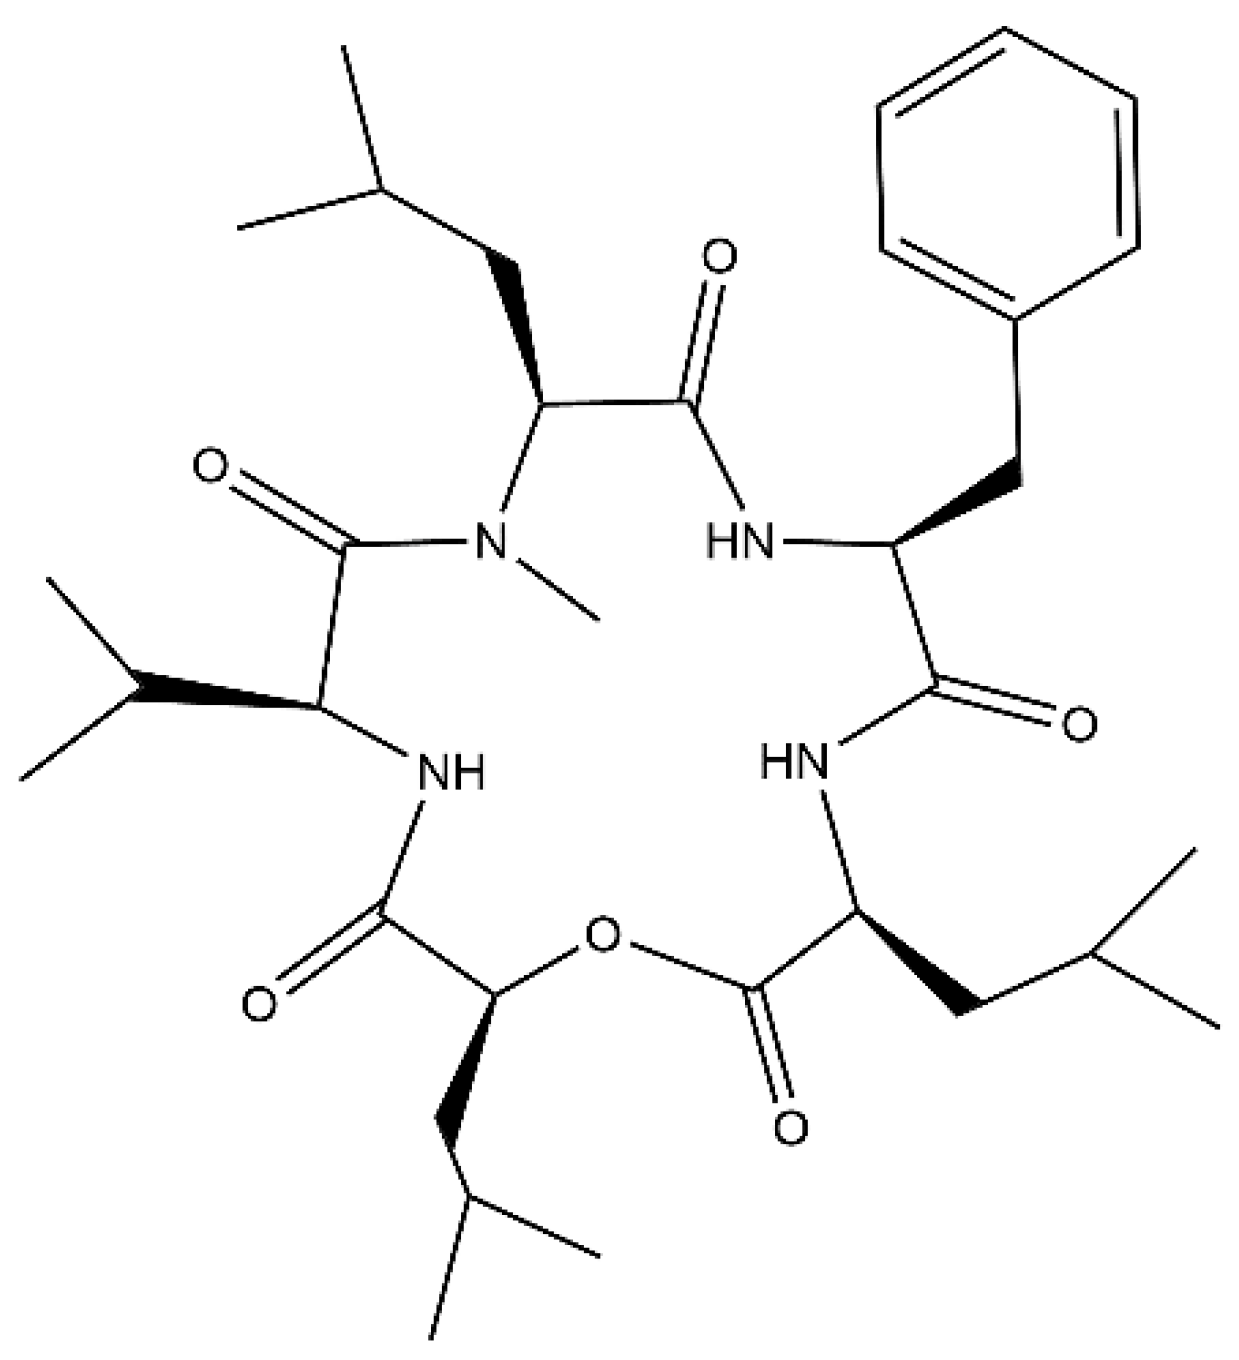
Figure 2.
HPLC profile of crude extract of strain R1 (a) and standard curve for SA (b).
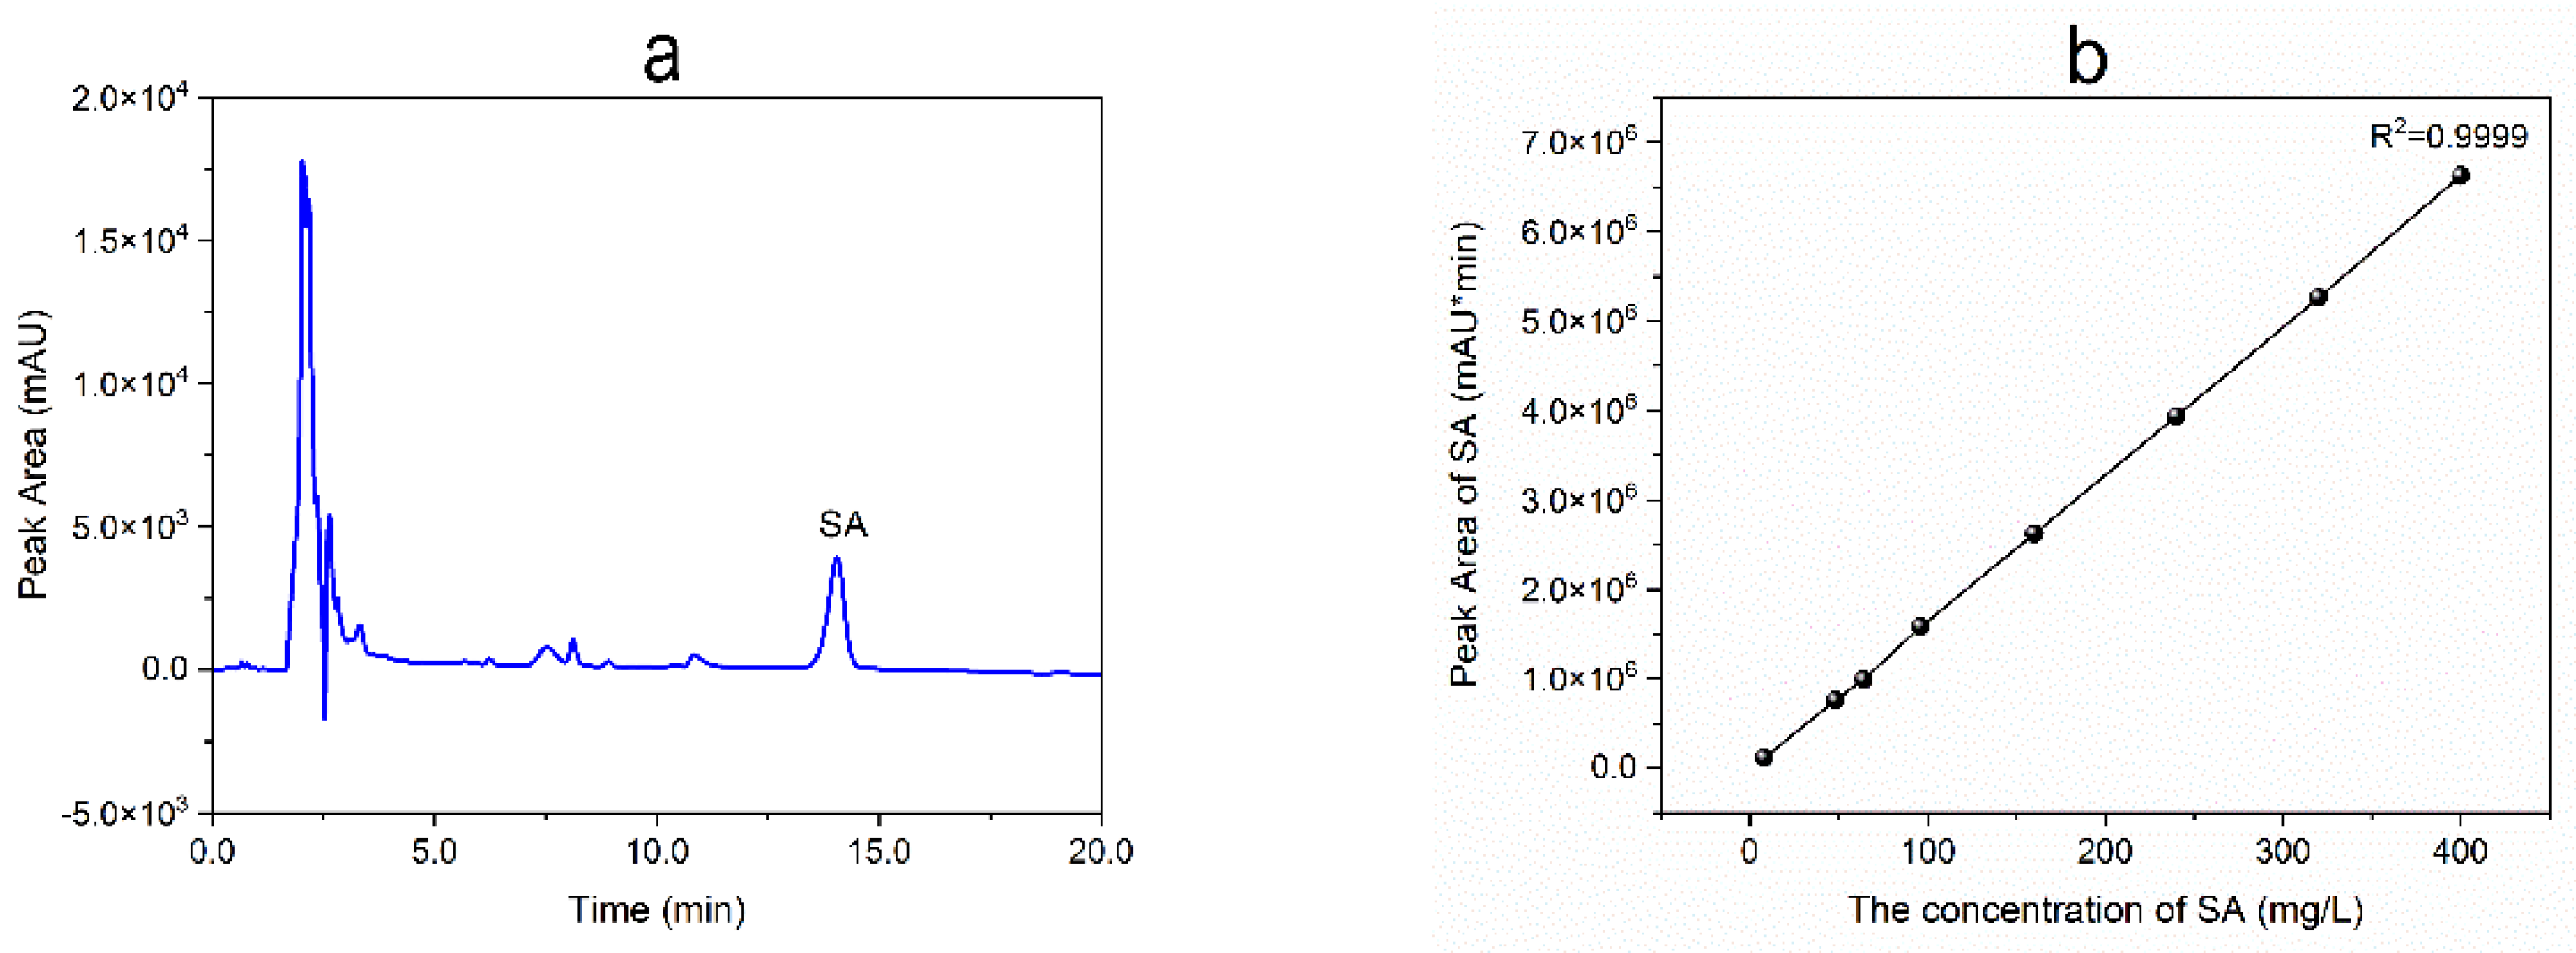
Figure 3.
Effects of fermentation conditions of SA production using the OFAT approach. (a) Fermentation time; (b) Temperature; (c) Initial pH; (d) Seed age; (e) Inoculum size; (f) Loading volume; (g) Concentration of sea salt.
Figure 3.
Effects of fermentation conditions of SA production using the OFAT approach. (a) Fermentation time; (b) Temperature; (c) Initial pH; (d) Seed age; (e) Inoculum size; (f) Loading volume; (g) Concentration of sea salt.
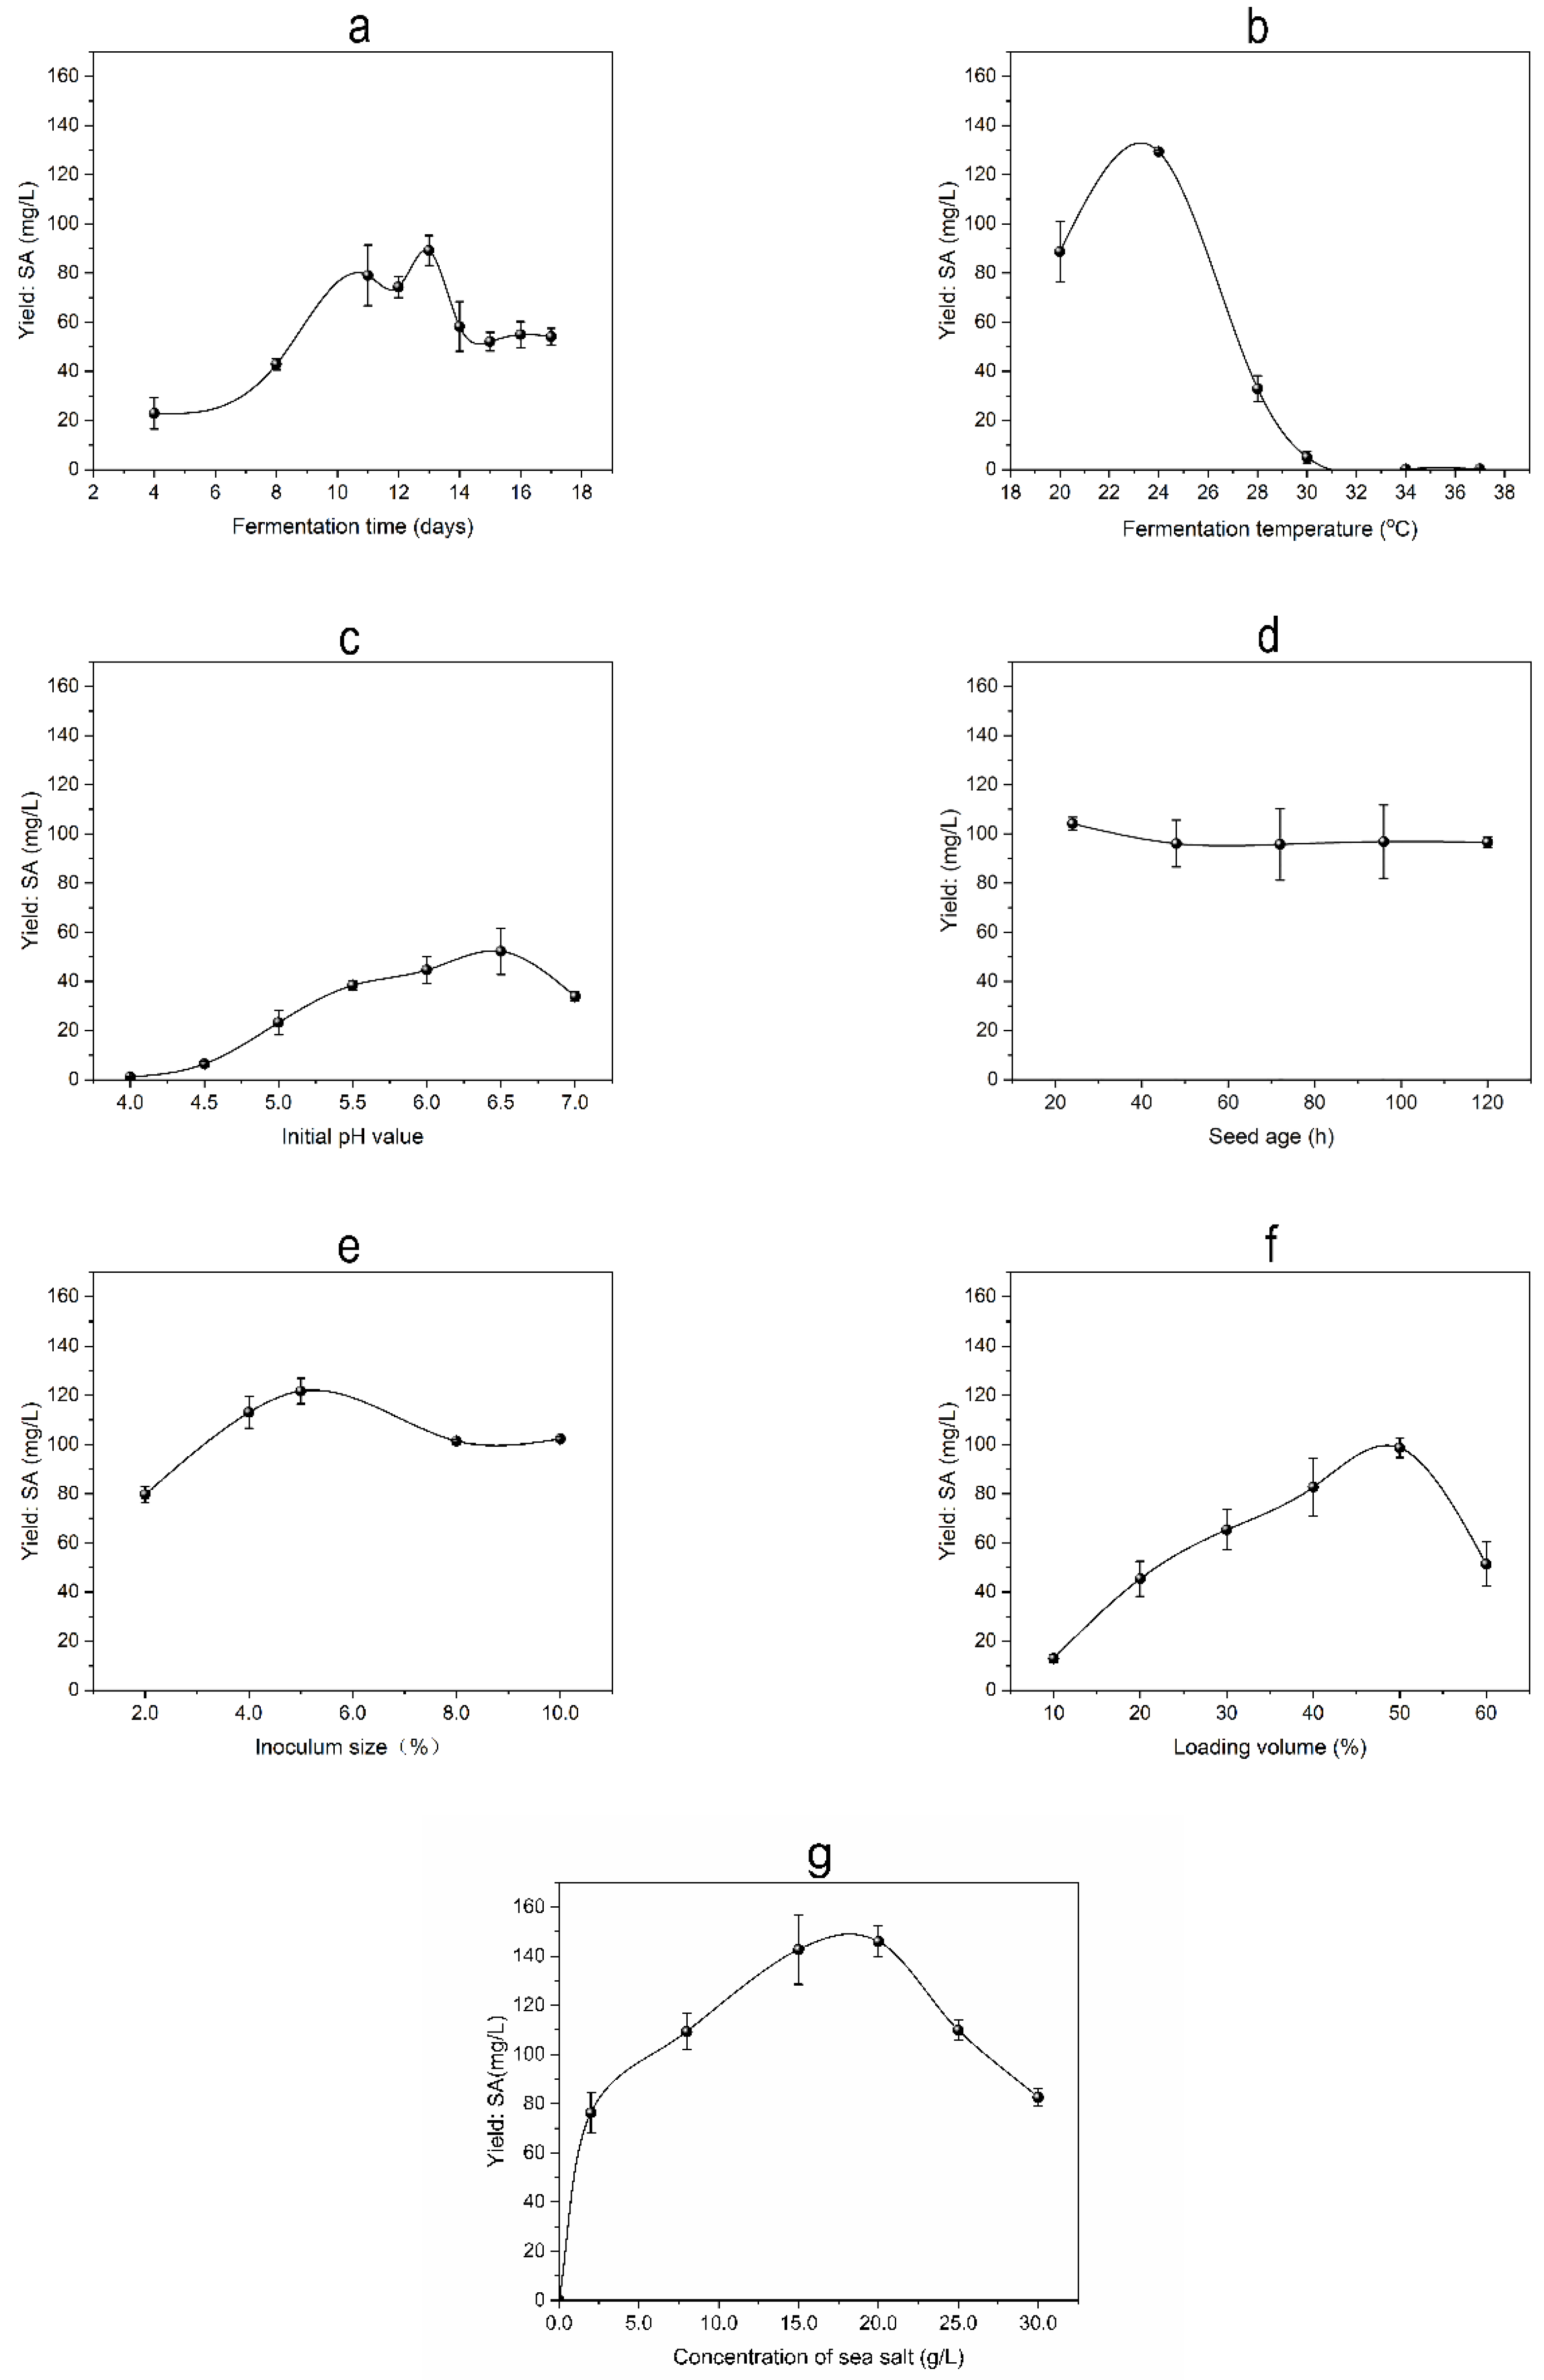
Figure 4.
Effects of carbon and nitrogen sources on SA yield. (A) Carbon sources: A-a sugar, A-b glucose, A-c maltose, A-d glycerin, A-e sucrose, A-f lactose; (B) Nitrogen sources, B-a beef extract, B-b yeast extract, B-c water-soluble soybean meal, B-d soy peptone, B-e soy bean flour, B-f tryptone, B-g casein peptone, B-h tryptone and yeast extract.
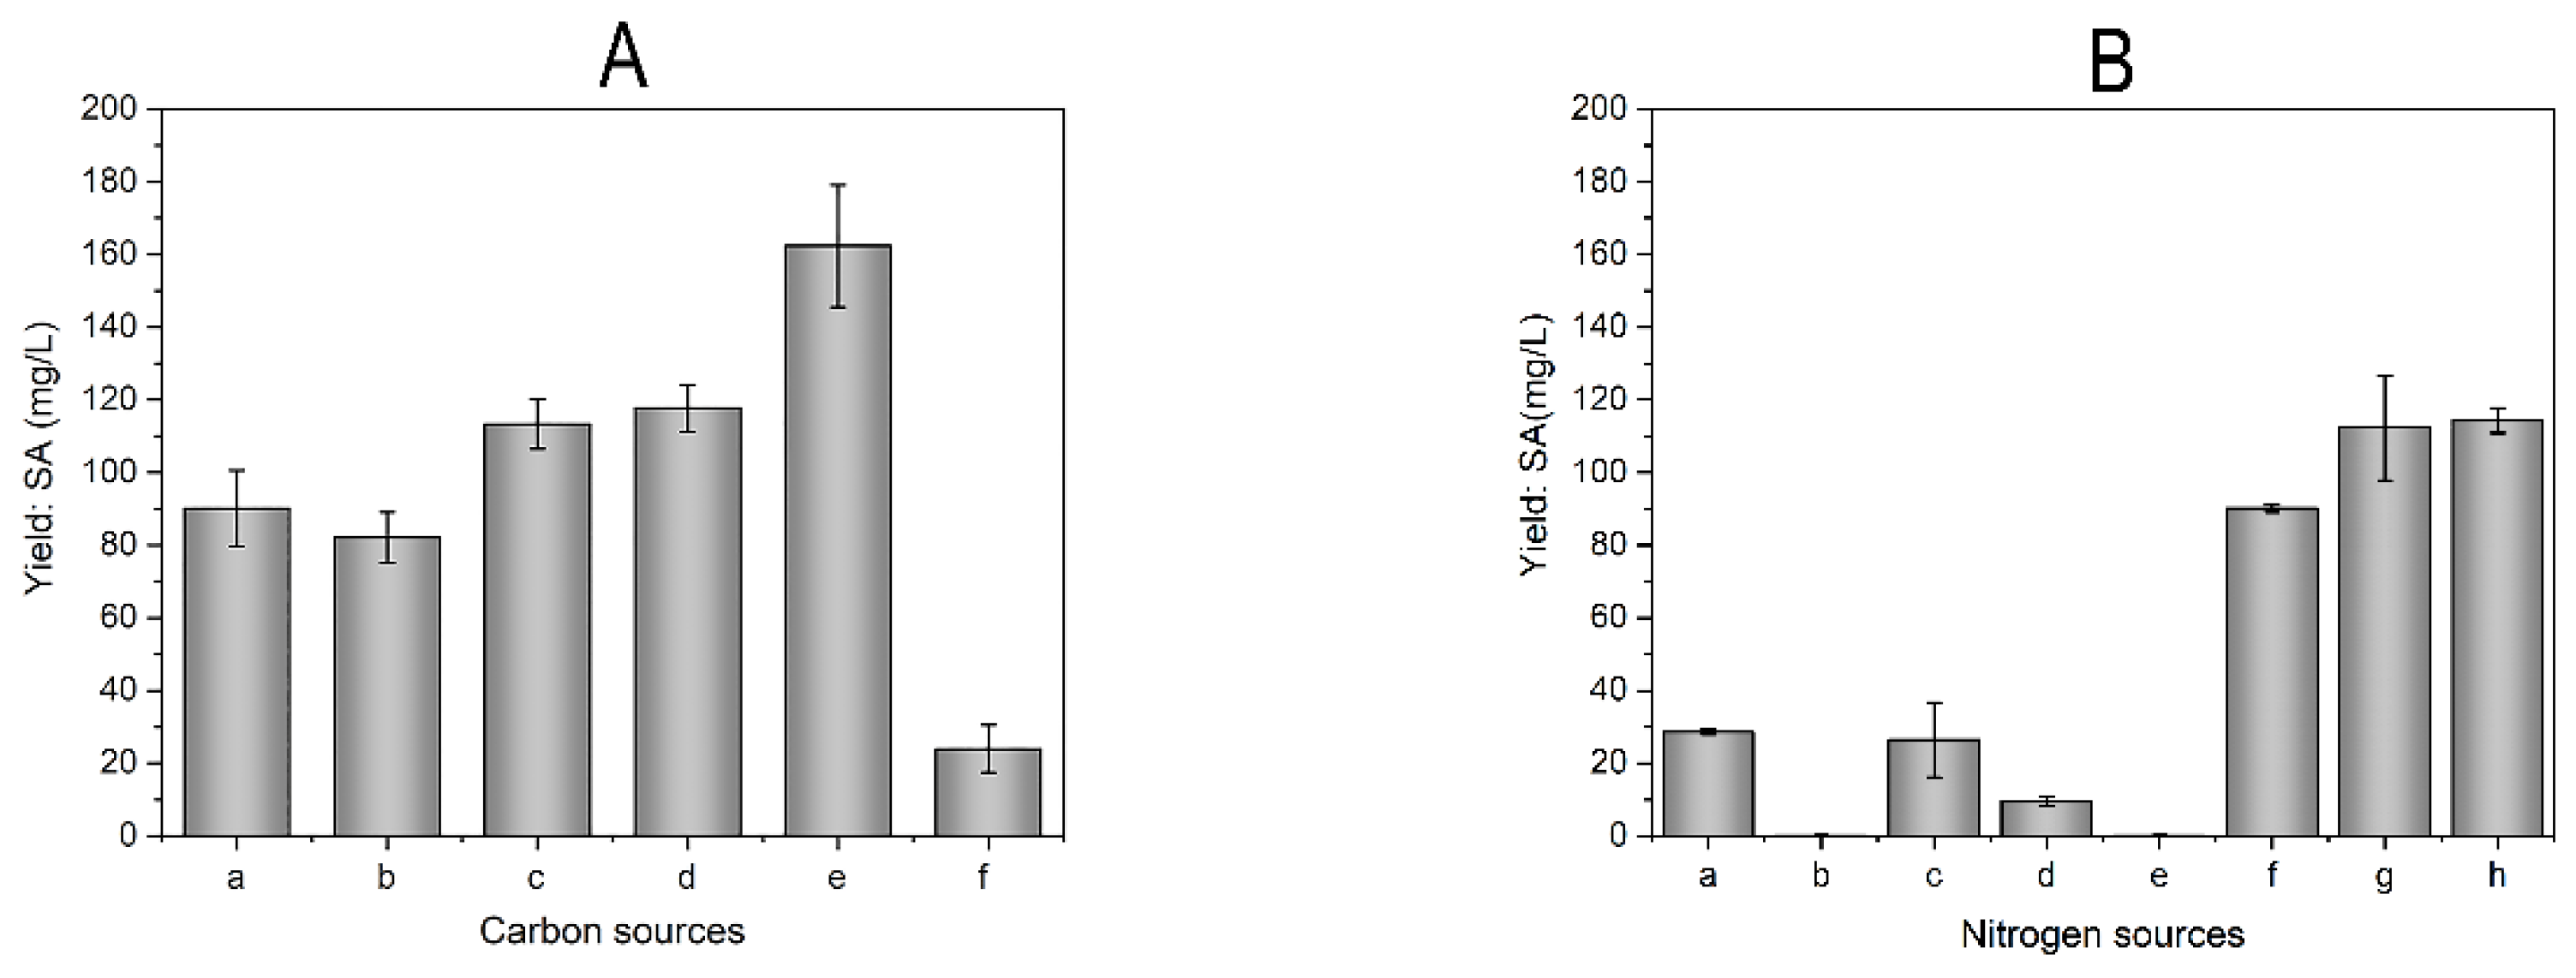
Figure 5.
3D response surface for SA production by strain R1. (a) interaction between yeast extract and sucrose; (b) interaction between sucrose and tryptone; (c) interaction between tryptone and yeast extract.
Figure 5.
3D response surface for SA production by strain R1. (a) interaction between yeast extract and sucrose; (b) interaction between sucrose and tryptone; (c) interaction between tryptone and yeast extract.
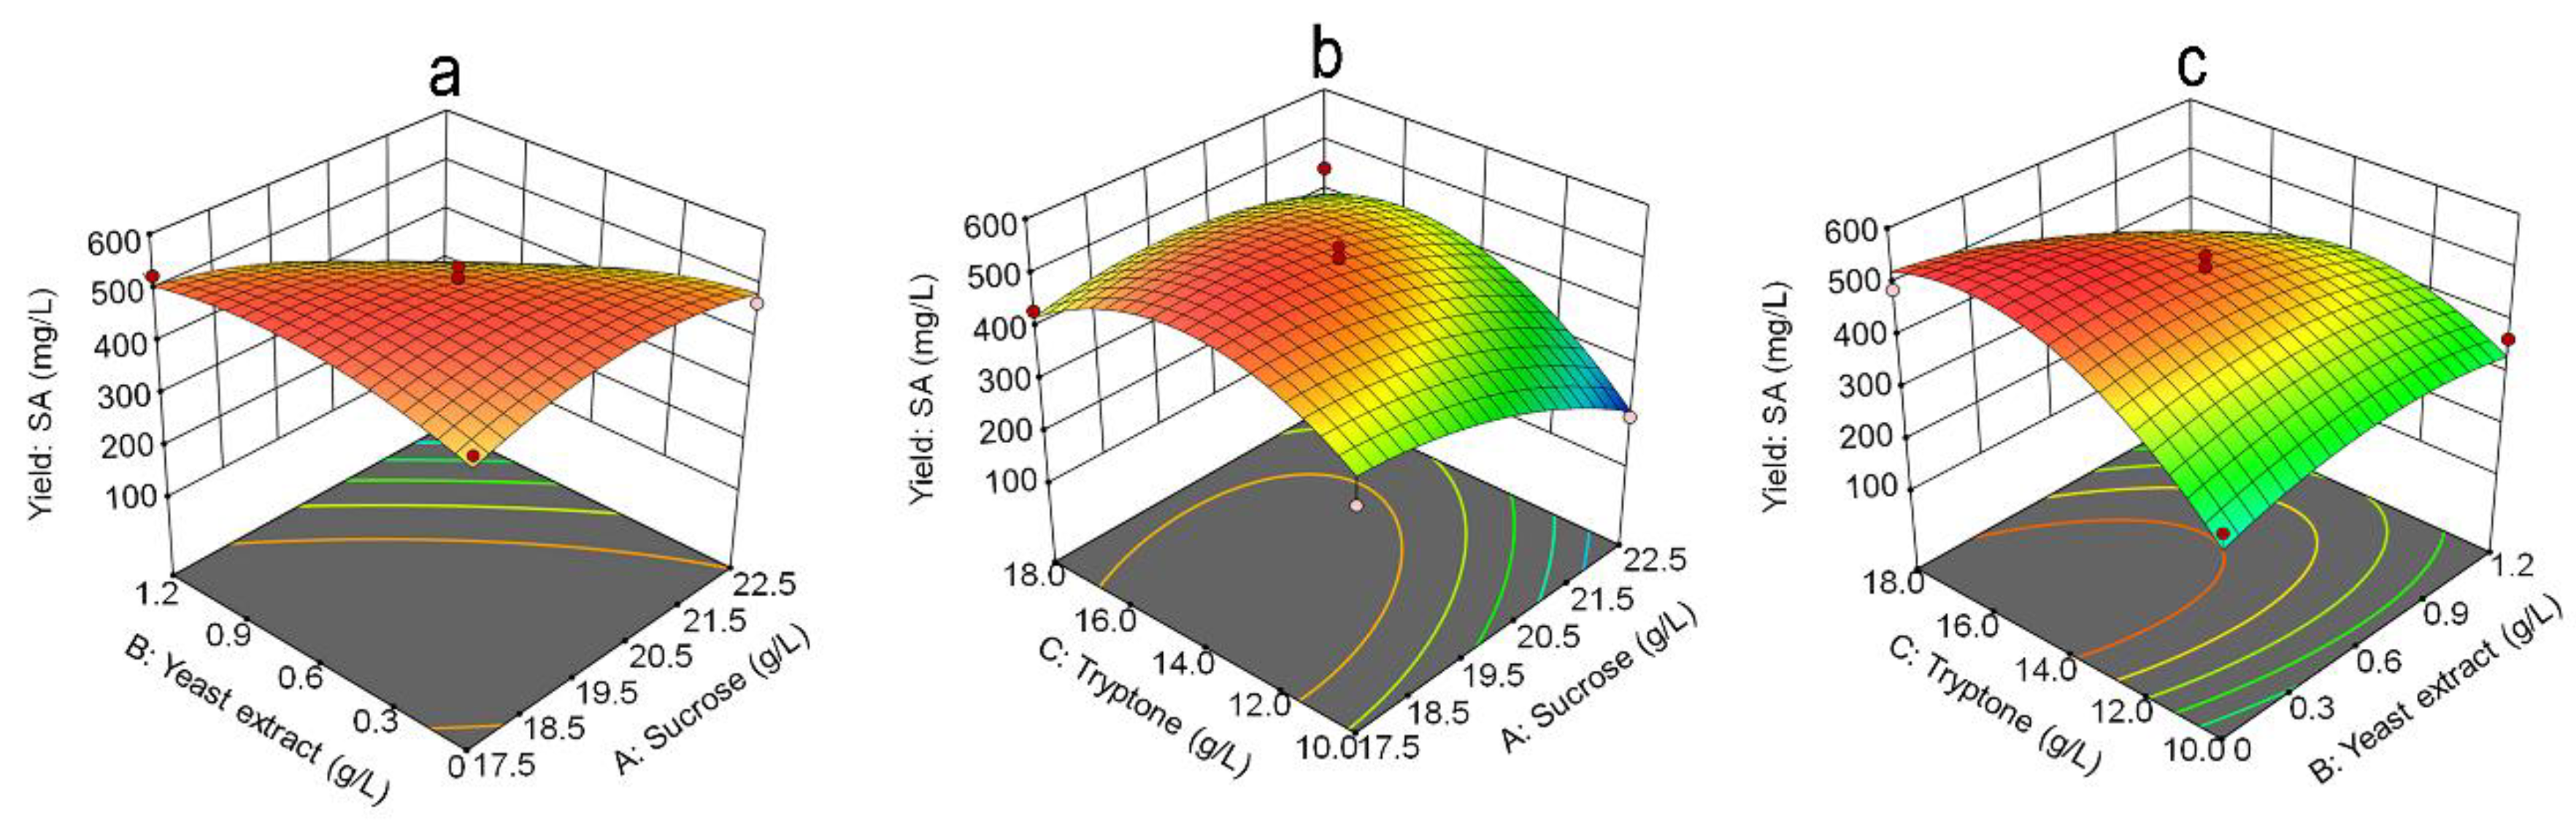
Figure 6.
Corresponding contour line for SA production by strain R1. (a) interaction between yeast extract and sucrose; (b) interaction between sucrose and tryptone; (c) interaction between tryptone and yeast extract.
Figure 6.
Corresponding contour line for SA production by strain R1. (a) interaction between yeast extract and sucrose; (b) interaction between sucrose and tryptone; (c) interaction between tryptone and yeast extract.
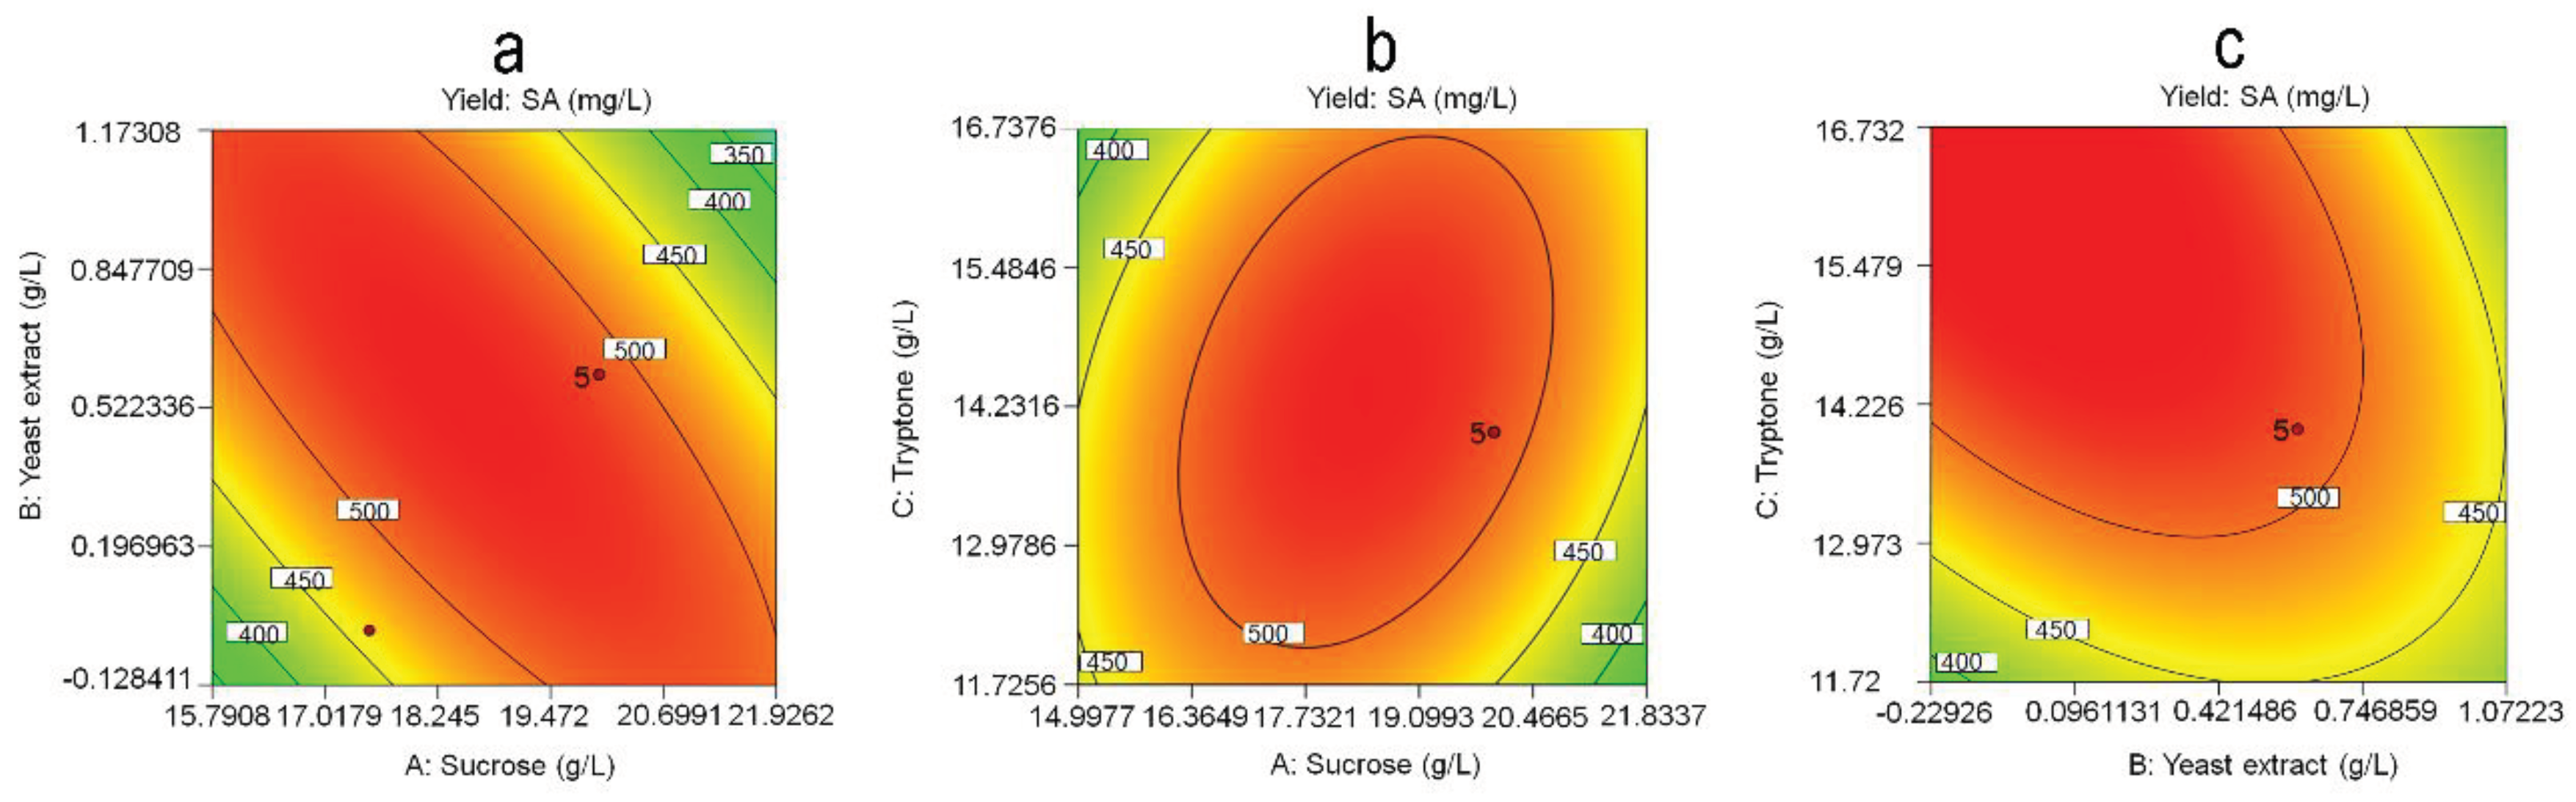

Table 1.
Factors and levels of the Plackett-Burman design.
| Factor | Code | Levels (g/L) | |
| -1 | 1 | ||
| Sucrose | A | 10.0 | 20.0 |
| Yeast Extract | B | 1.0 | 3.0 |
| Tryptone | C | 2.0 | 10.0 |
Table 2.
Experimental design of steepest ascent method.
| Run | Sucrose (g/L) | Yeast Extract (g/L) | Tryptone (g/L) |
| 1 | 15.0 | 2.0 | 6.0 |
| 2 | 17.5 | 1.3 | 10.0 |
| 3 | 20.0 | 0.6 | 14.0 |
| 4 | 22.5 | 0.0 | 18.0 |
| 5 | 25.0 | 0.0 | 22.0 |
Table 3.
Levels and codes of variables used for Box-Behnken design.
| Factor | Code | Levels (g/L) | ||
| -1 | 0 | 1 | ||
| Sucrose | A | 17.5 | 20.0 | 22.5 |
| Yeast Extract | B | 0.0 | 0.6 | 1.2 |
| Tryptone | C | 10.0 | 14.0 | 18.0 |
Table 4.
Plackett-Burman design factor and level table (n=9).
| Run | Sucrose (g/L) | Yeast Extract (g/L) | Tryptone (g/L) | SA Yield (mg/L) |
|---|---|---|---|---|
| 1 | 1 | -1 | 1 | 252.16±47.92 |
| 2 | -1 | 1 | 1 | 166.16±36.95 |
| 3 | -1 | 1 | -1 | 117.98±7.26 |
| 4 | 1 | 1 | -1 | 78.42±3.37 |
| 5 | 1 | -1 | -1 | 51.87±15.95 |
| 6 | -1 | -1 | 1 | 193.20±40.28 |
| 7 | -1 | 1 | 1 | 166.16±36.95 |
| 8 | -1 | -1 | -1 | 62.70±4.22 |
| 9 | -1 | -1 | -1 | 62.72±4.30 |
| 10 | 1 | 1 | -1 | 78.46±2.78 |
| 11 | 1 | 1 | 1 | 127.88±12.66 |
| 12 | 1 | -1 | 1 | 252.09±20.33 |
Table 5.
Regression analysis of the Plackett-Burman design.
| Code | t test | P | Significance |
|---|---|---|---|
| Sucrose | 0.51 | 0.625 | 3 |
| Yeast Extract | -0.99 | 0.352 | 2 |
| Tryptone | 4.99 | 0.001 | 1 |
Table 6.
The results of the steepest ascent experiment.
| Run | Sucrose (g/L) | Yeast Extract (g/L) | Tryptone (g/L) | SA Yield (mg/L) |
|---|---|---|---|---|
| 1 | 15.0 | 2.0 | 6.0 | 124.46±29.43 |
| 2 | 17.5 | 1.3 | 10.0 | 235.21±10.30 |
| 3 | 20.0 | 0.6 | 14.0 | 385.33±14.72 |
| 4 | 22.5 | 0.0 | 18.0 | 380.16±10.02 |
| 5 | 25.0 | 0.0 | 22.0 | 174.23±36.71 |
Table 7.
The Box-Behnken design and the corresponding results.
| Run | Sucrose (g/L) | Yeast Extract (g/L) | Tryptone (g/L) | SA Yield (mg/L) |
|---|---|---|---|---|
| 1 | 1 | -1 | 0 | 466.08±40.67 |
| 2 | 1 | 0 | 1 | 445.36±0.75 |
| 3 | -1 | 0 | 1 | 432.88±48.14 |
| 4 | 0 | 0 | 0 | 515.68±21.21 |
| 5 | 0 | 0 | 0 | 471.36±14.85 |
| 6 | 0 | -1 | -1 | 328.08±21.44 |
| 7 | 0 | 0 | 0 | 517.52±18.83 |
| 8 | -1 | -1 | 0 | 484.64±11.47 |
| 9 | 0 | 1 | -1 | 367.68±27.35 |
| 10 | -1 | 0 | -1 | 364.72±24.64 |
| 11 | 0 | -1 | 1 | 488.40±5.72 |
| 12 | -1 | 1 | 0 | 524.72±7.55 |
| 13 | 0 | 0 | 0 | 537.36±18.32 |
| 14 | 0 | 1 | 1 | 268.00±19.87 |
| 15 | 1 | 0 | -1 | 198.88±2.78 |
| 16 | 1 | 1 | 0 | 230.96±21.64 |
| 17 | 0 | 0 | 0 | 517.52±28.04 |
Disclaimer/Publisher’s Note: The statements, opinions and data contained in all publications are solely those of the individual author(s) and contributor(s) and not of MDPI and/or the editor(s). MDPI and/or the editor(s) disclaim responsibility for any injury to people or property resulting from any ideas, methods, instructions or products referred to in the content. |
© 2024 by the authors. Licensee MDPI, Basel, Switzerland. This article is an open access article distributed under the terms and conditions of the Creative Commons Attribution (CC BY) license (http://creativecommons.org/licenses/by/4.0/).
Copyright: This open access article is published under a Creative Commons CC BY 4.0 license, which permit the free download, distribution, and reuse, provided that the author and preprint are cited in any reuse.


