Submitted:
18 February 2024
Posted:
19 February 2024
You are already at the latest version
Abstract
Aiming at the problem of UAV cluster configuration reconstruction, in order to obtain the cluster reconstruction method, the theory and simulation of cluster reconstruction control strategy is studied by simplifying the model,deducing the theoretical formula and analyzing the example. Taking 10 UAVs cluster as an example, the distribution of UAVs in different configurations was analyzed. According to the change of cluster configuration, the principle of formation reconstruction and the execution ability of configuration, the cluster capability was analyzed. The group behavior is modeled by group behavior rules, reconfiguration topology analysis and reconfiguration cost measurement. Based on the cluster parameters and configuration characteristics, simulation experiments were carried out to obtain the change curve of the reconstruction cost and time and the trajectory movement diagram of the UAV in different configurations.
Keywords:
UAV cluster
; formation reconstruction
; cluster control
; topological analysis
; motion trajectory
1. Introduction
With the development of artificial intelligence and UAV technology, UAV cluster has attracted more and more attention [1]. Compared with individuals, clusters have greater advantages in the difficulty and complexity of executing tasks, but different from a single or fewer drone formations, clusters have dozens or even more drones, and their formation control has become a prerequisite for use. Many scholars have conducted a lot of theoretical and experimental research on UAV formation control [2,3,4,5,6,7,8]. The methods of algorithm design, communication interaction and obstacle avoidance control are commonly used to analyze the formation change of UAV cluster formation. Liao [9] has studied the UAV formation reconstruction control based on the variable step size MPC-APCMPIO algorithm, and established the UAV movement model and the virtual leader group formation control structure. Fu [10] realized the reconstruction method of distributed obstacle avoidance control of UAV formation by designing the position and speed consistency control law among UAV, each UAV and virtual leader. Song [11] divided the route planning of UAV formation change into two stages: rough planning and fine planning, and completed UAV formation change under two scenarios. Peng [12] regards UAV formation transformation as a minimum matrix transformation problem and proposes a UAV formation flight algorithm based on greedy path strategy to solve the sub-optional solution of this problem. The above studies have discussed formation control methods, but there are few studies on the measurement of cluster capability and reconstruction cost in UAV cluster formation reconstruction.
Therefore, this paper first analyzes the cluster capability measurement according to the cluster configuration change, formation reconstruction principle, and configuration execution ability. Then the group behavior is modeled by group behavior rules, reconfiguration topology analysis, and reconfiguration cost measurement. Finally, based on the cluster parameters and configuration characteristics, simulation experiments were carried out to obtain the change curve of the reconstruction cost with time and the trajectory movement diagram of the UAV in different configurations. The main contributions of this paper are as follows:
- Carry out the mechanism analysis of cluster reconstruction and give the measurement method of cluster capability.
- Modeling the cluster behavior rules and formation reconfiguration cost for reconfiguration strategy.
- Analyzing the simulation analysis by reconstructing cluster variety of 10 drone formation as an example, obtained the related characteristic of the cluster refactoring changes.
2. Related Work
2.1. Basic Conception
A cluster is composed of multiple groups, and a Group is composed of multiple units. Of course, a group can also be subdivided into a group I and a Group II, etc. A group I consists of multiple groups II, and a group II consists of groups of a lower group, up to the smallest group of 2 or 3 individuals. The purpose of using cluster strategy is to achieve “1+1>2 “effect.
2.2. Flight Formation Mechanism
A cluster drones usually maintain a certain formation during formation flight, the common formation has echelons, wedges, columns, horizontal lines, serpentine teams, etc., the configuration is triangular, humanoid, diamond, arrow, dart, wedge, room shape, etc. In the same way, drone clusters fly in organized formations when carrying out missions, and not every drone flies completely free. Although the scale of the cluster is much larger than the traditional formations with several sorties, there are still similarities in the flight formation. As shown in Figure 1, the formation of the three-aircraft formation is basically the same as that of the multi-aircraft cluster.
2.3. Control Logic Method
Cluster motion control is the modeling of relationships between units and groups, groups and clusters, usually following the basic rules of “separation”, “cohesion” and “alignment”. There are many similarities between drone cluster and biological cluster [13]. There is no central control node in biological cluster, and there is no traditional command and control station in UAV cluster. Each UAV makes decisions and actions independently according to its own perceived information [14].
The control structure of UAV cluster can be divided into three categories: centralized control, distributed control and distributed control [15]. Centralized control uses one center or multiple sub-centers to effectively control the cluster. Some studies also refer to the sub-center mode as hierarchical control [16]. Contact with assigned drones through the center. Distributed control mimics biological groups, where individuals are connected to each other and work together to accomplish tasks through information exchange. Distributed control [17], also known as hybrid control [18], realizes the full control of UAV clusters through the combination of centralized mutual cooperation and distributed autonomy [19].
3. Clustering Capability Measure
3.1. Ability Formation Mechanism
Suppose that cluster C is composed of m groups G, each group contains k (unequal) unit U, a total of n, the cluster capacity is represented by E, the group capacity is represented by Ei, and the unit capacity is represented by ej. The UAV cluster shown in Figure 2, whether it is unit-to-group central point Gi0 or group-to-cluster central point C0, will generate capability contribution.
The contribution coefficient a expressed as function f(s) related to the distance s, measured as equation 1; Distance s represents the distance between an unit and the central point of the group, or the distance between the group and the central point of the group. smax represents the maximum distance an unit or group can contribute. The measures of group capacity Ei and group capacity E are shown in equation 2 and 3 respectively.
3.2. Principle of Formation Reconstruction
The cluster control of UAVs follows the principle of maximum cluster capability Emax, so the cluster formation is always restructured around maintaining maximum capability. Considering the wide scope of the UAV cluster mission area airspace, each group is a scattered point relative to the cluster, and each UAV can be approximately regarded as one overlapping point in the center of its group relative to the cluster. Therefore, at the three levels of clusters, groups and units, not only is the distance Sj from each UAV j in each group Qi to the group center Qi0 equal, but the Sj of different groups is also approximately equal, expressed as the group radius S1, so the ability contribution coefficient of individuals to the group α denoted as α1. Similarly, relative to the whole task area, the distance between different groups from the cluster center can also be considered as approximately equal, expressed as the cluster radius S2, then the ability contribution coefficient of the group to the cluster α denoted as α2. Thus, the approximate measure Es of cluster capability E can be obtained.
The mission airspace range is denoted as S, the number of UAVs performing cluster tasks is n, and the density of UAVs is denoted as ρ. The metric calculation is shown in equation 5.
The density threshold is expressed as θ, when ρ<θmin, let α2=0; When ρ>θmax, let S1=0. In this case, the approximate measure of clustering capability E is Eρ, as shown in equation 6.
3.3. Comparison of Configuration Execution Ability
In this study, a cluster consisting of 10 UAVs was taken as an example. Among the common configurations of the formation, triangle, diamond, arrow and snake configurations as shown in Figure 3 were selected for comparison.
The radius of the executable task is denoted by S2, the area of the task coverage area is denoted by Sf, and the area coverage coefficient is denoted by γ, then its measurement is shown in equation 7.
Configuration execution capability is represented as Z, which is mainly affected by cluster capability E and area coverage coefficient γ. The measurement method is shown in equation 8.
Cluster flight is constrained by configuration. Assuming that different configurations can all fly according to the pattern shown in Figure 4, for cluster flight, the UAV in the dotted circle represents the center of the group and the cluster radius S2.
Without considering the scaling of cluster configuration, the regional coverage coefficients γ are equal at the same cluster radius S2. However, the group ability E of triangle, diamond, arrow and snake configurations is not equal, which is mainly affected by group ability Ei. Assuming that the radius S1 of each population in different configurations is also equal, not only the clustering ability E is equal, but also the configuration execution ability Z is equal.
4. Cluster Behavior Modeling
4.1. Group Behavior Rule
Cluster behavior is multiple groups behavior movement around a task, and its center is the cluster center under the task goal and the group center under the task subgoal. What determines the change of cluster configuration is the dynamic change of group behavior, so cluster behavior can be regarded as the behavioral interaction between groups and the adjustment of functions within groups. According to the division of responsibilities, group G in cluster C can be divided into three categories: task group T, guarantee group P and reserve group B.
Task group T has a clear mission and is distributed in the task area when executing the task. The security group P and the reserve group B can be in a group Gi, and the reserve group B can either undertake the security work of the security group P or take over the security work at any time. Therefore, the group relationship of the cluster is shown in equation 9, where the symbol⊕represents the group fusion relationship.
Therefore, the group behavior mainly includes: (1) The reserve group B supports the existing task group T and guarantees the replacement of group P. (2) A new sub-target task group Ti is formed, which is fully supported by the reserve group B or assigned part of the existing task group T; (3) Assign new sub-targets to existing task group Tj by default, and those that are not supported by reserve group B and other groups Tm remain group Tj.
4.2. Reconstruction Topology Analysis
Taking triangular to diamond reconstruction as an example, as shown in Figure 5, when a new group G4 is generated, G2 and G3 contribute UAV U6 and formation F1 composed of U7 and U10 respectively. At this time, the initial state of G4 is obtained, and the group presents a disorder state. Then G4 group internal adjustment into the final attitude, at this time the diamond cluster into a stable state. The diamond cluster includes the new groups G2′, G3′, and G4, as well as G1′(equal to the original group G1).
Group G4 can be generated by G1, G2, and G3 contributing U1, U6, and U10, respectively. In this case, the formation reconstruction can directly enter the final posture G4 without internal group adjustment. But different groups support drones for new groups depending on their circumstances. When each group can contribute drones to the new group, it is necessary to maintain the topological stability of the original configuration of the cluster. The triangular configuration of cluster C is denoted C1, the diamond configuration is denoted C2, and G4 is denoted by C3, then C2=C1+C3. Let (C, d) be a compact metric space, and if f: C1→C1, then C1 and C1 are homeomorphic when d(f)≤δ, and f is topologically stable. It can be seen that triangle, diamond and arrow are mutually stable configurations, but snake with the above three reconstructions is unstable. Configuration reconstruction is generally based on its stability, but individual selection is based on the principle of minimum loss.
4.3. Cost Measurement Mechanism
Taking the reconstruction in Figure 5 as an example, the reconstruction cost W includes three parts: the cost of the formation process W1, the cost of internal group attitude adjustment W2 and the cost of group catch-up W3. The cost is a function related to distance L and time t.
Set energy consumption V(t) within individual unit distance and energy consumption coefficient η within group unit distance. The initial state distance of G4 of U6 from the triangular configuration to the diamond configuration is L1, and the formation F1 composed of U7 and U10 (quantity is denoted by k) to G4 is the initial state distance L2, so the process cost W1 metric is:
The transition from the disordered state of group G4 to the stable state is the adjustment of the position of k unmanned aerial vehicles within the new group G4 to ensure a flight attitude of group G4, the flight distance L3, so the cost of attitude adjustment within the group W2 is measured as:
In the stable state, the velocity of group G4 is not consistent with the velocity in the direction of movement of part of the group in C1 configuration. At this time, the group pursuit cost W3 that G4 needs to consume in order to reach the cluster velocity and reach the configuration position L3 is measured as follows:
5. Simulation Experiment
5.1. Models and Constraints
Considering that the above configuration is a two-dimensional planar graph, the cluster is a three-dimensional spatial space in actual flight, so a three-dimensional coordinate cluster model is established. Figure 6 is the schematic diagram of the reconstructed three-dimensional coordinate model of the cluster. Formation F1 and UAV U6 first fly horizontally towards the center G40 of the new group G4, and the center of F1 and U6 coincide with the vertical projection of G40 in the Z direction. Then fly from the initial state to their respective stable positions according to the group G4 attitude.
Constraints: (1) All groups in the cluster and all drones in the cluster can fly at different plane heights; (2) Ignoring the UAV steering problem during cluster reconstruction, the velocity v has three directions (x, y, z); (3) Do not consider the additional energy consumption of upward flight; (4) Keep the original flight shape unchanged when the formation is reconstructed towards the group center; (5) In the stable state, there are no multiple UAVs in the vertical Z direction.
5.2. Simulation Analysis
There are 10 points are randomly generated in the three-dimensional space, and then clustered into 3 clusters. Each point of each cluster is arranged according to the formation configuration, and the Central Line of the cluster is a triangle, forming a triangle configuration cluster. Then, points are adjusted adaptively from the three clusters to form diamond, arrow and snake shapes respectively, and the fourth cluster is generated, so as to obtain the change curve of the relationship between cost and time, and the trajectory movement of points when forming different configurations. The simulation process of cluster formation reconstruction is shown in the algorithm in Table 1.
The motion position change of the reconstructed particle is obtained by simulation. When reconstructed into diamond shape, arrow shape and snake shape, its motion trajectory is shown in Figure 7, Figure 8 and Figure 9, respectively.
At the same time, the cost curves of three different configurations are obtained, as shown in Figure 10. The cost of diamond reconstruction is the least, the time of arrow reconstruction is the longest, and the cost of snake reconstruction is the most.
6. Conclusion
Through theoretical formula derivation and simulation experiment, the UAV cluster reconfiguration research is carried out, and the cluster movement trajectory diagram and the change curve of the reconfiguration cost and time are obtained. The results show that the diamond reconstruction cost is the least, the arrow reconstruction time is the longest and the snake reconstruction cost is the most when the triangle is adjusted to the other three shapes.
Author Contributions
Conceptualization, J.P. and J.S.; methodology, J.P.; software, J.S.; validation, W.C., P.H. and J.L.; formal analysis, W.C.; investigation, J.S.; writing—original draft preparation, J.P.; writing—review and editing, P.H.; visualization, J.S.; supervision, J.P. All authors have read and agreed to the published version of the manuscript.
Acknowledgments
Thanks to the Key Laboratory of Advanced Perception and Intelligent Control for providing simulation experiment equipment.
Conflicts of Interest
The authors declare no conflicts of interest. The authors declare that they have no known competing financial interests or personal relationships that could have appeared to influence the work reported in this paper.
References
- Tang J, Ruan Y R, Lao S Y, et al. UAV cluster collision avoidance method[M]. Beijing: Science Press, 2021: 1-9.
- Qi X G, Wu X Y, Liu L F. Reliability evaluation of ad hoc network for UAV swarm formation[J]. Control and Decision, 2024, 39(02): 689-696. [CrossRef]
- Zhang Y, Yu H, Yang X X, et al. UAV cluster group formation adaptive tracking-includes control[J]. Journal of Beijing University of Aeronautics and Astronautics, 2024: 1-15. [CrossRef]
- Hu Y X, Zhao C C, Jia C L. Synchronous path formation control of UAV swarm based on robot operating system (ROS)[J]. Acta Aeronautica et Astronautica Sinica, 2022, 43(S1): 100-109. [CrossRef]
- Liu G, Tang J, Liu C, et al. Survey of cooperative behavior modeling technology for unmanned aerial vehicles clusters[J]. Systems Engineering and Electronic, 2021, 43(08): 2221-2231. [CrossRef]
- Li Q, Chen Y, Liang K. Predefined-time formation control of the quadrotor-UAV cluster’position system[J]. Applied Mathematical Modelling, 2023, 116: 45-64. [CrossRef]
- Petrenko V, Tebueva F, Antonov V, et al. Method and algorithm for task allocation in a heterogeneous group of UAVs in a clustered field of targets[J]. Journal of King Saud University-Computer and Information Sciences, 2023, 35(6): 101580. [CrossRef]
- Shao X, Liu H, Zhang W, et al. Path driven formation-containment control of multiple UAVs: A path-following framework[J]. Aerospace Science and Technology, 2023, 135: 108168. [CrossRef]
- Liao J, Cheng J, Xin B, et al. UAV swarm formation reconfiguration control based on variable-stepsize MPC-APCMPIO algorithm[J]. Science China Information Sciences, 2023, 66(11): 212207. [CrossRef]
- Fu X, Pan J, Wang H, et al. A formation maintenance and reconstruction method of UAV swarm based on distributed control with obstacle avoidance[C]//2019 Australian & New Zealand Control Conference (ANZCC). IEEE, 2019: 205-209. [CrossRef]
- Song B, Zuo Y, Huang S, et al. UAV Formation Transformation Based on Two-Stage Path Planning Method[C]//Journal of Physics: Conference Series. IOP Publishing, 2022, 2363(1): 012022. [CrossRef]
- Peng Z, Bai C, Hu S. UAV formation algorithm based on rapid and effective formation transformation in the air[C]//AIP Conference Proceedings. AIP Publishing, 2019, 2122(1). [CrossRef]
- Duan H B, Li P. Autonomous control for unmanned aerial vehicle swarms based on biological collective behaviors[J]. Science and technology Guide, 2017, 35(07): 17-25. [CrossRef]
- Duan H B, Qiu H X. Unmanned aerial vehicle swarm autonomous control based on swarm intelligence[M]. Beijing: Science Press, 2018: 21-24.
- Liu D W, Zhai J D, Wei L, et al. UAV cluster task planning and collaborative system architecture[J]. Acta Armamentarii, 2023, 44(S2): 191-198. [CrossRef]
- Kuai W. The development of autonomous control for UAV clusters[J]. Informatization Research, 2023, 49(05): 1-5+25.
- Bassett D S, Wymbs N F, Porter M A, et al. Dynamic reconfiguration of human brain networks during learning[J]. Proceedings of the National Academy of Sciences, 2011, 108(18): 7641-7646. [CrossRef]
- Zhang S X, Li J J, Yin S, et al. Analysis of drone swarm combat[J]. Modern Information Technology, 2020, 4(12): 22-24. [CrossRef]
- Ren X J, Geng R M, Liang C Z. Research on cluster cooperative formation control technology of UAV[J]. Technology Innovation and Application, 2024, 14(03): 8-12. [CrossRef]
Figure 1.
Schematic diagram of similar in formation and cluster.
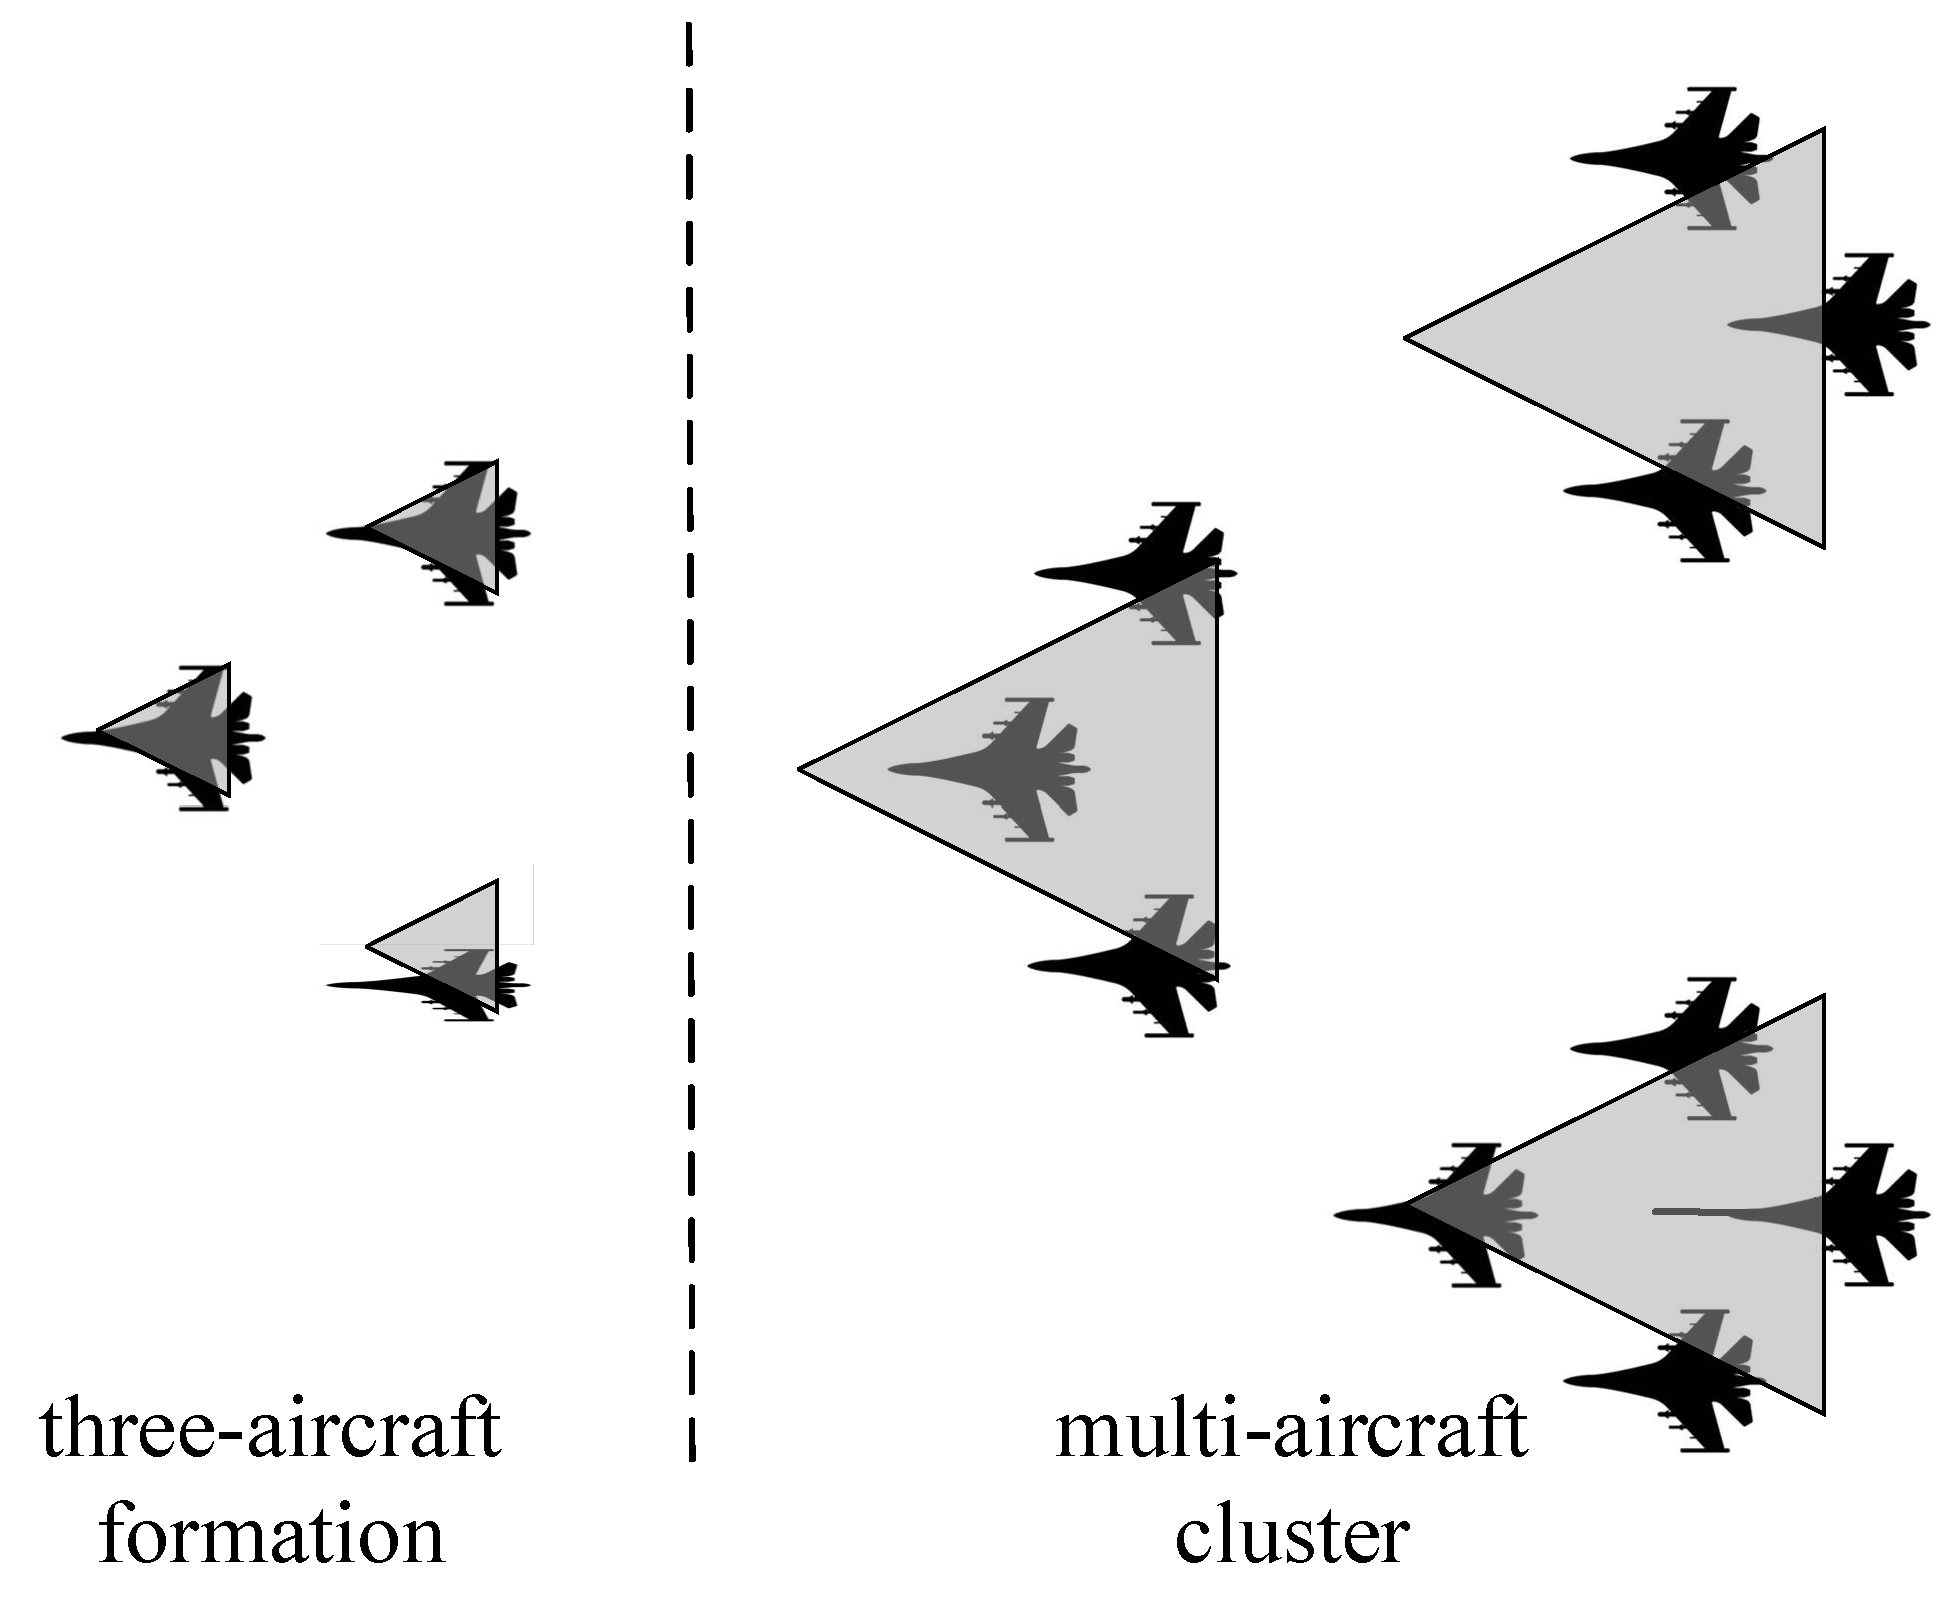
Figure 2.
Schematic diagram of UAV cluster capability contribution.
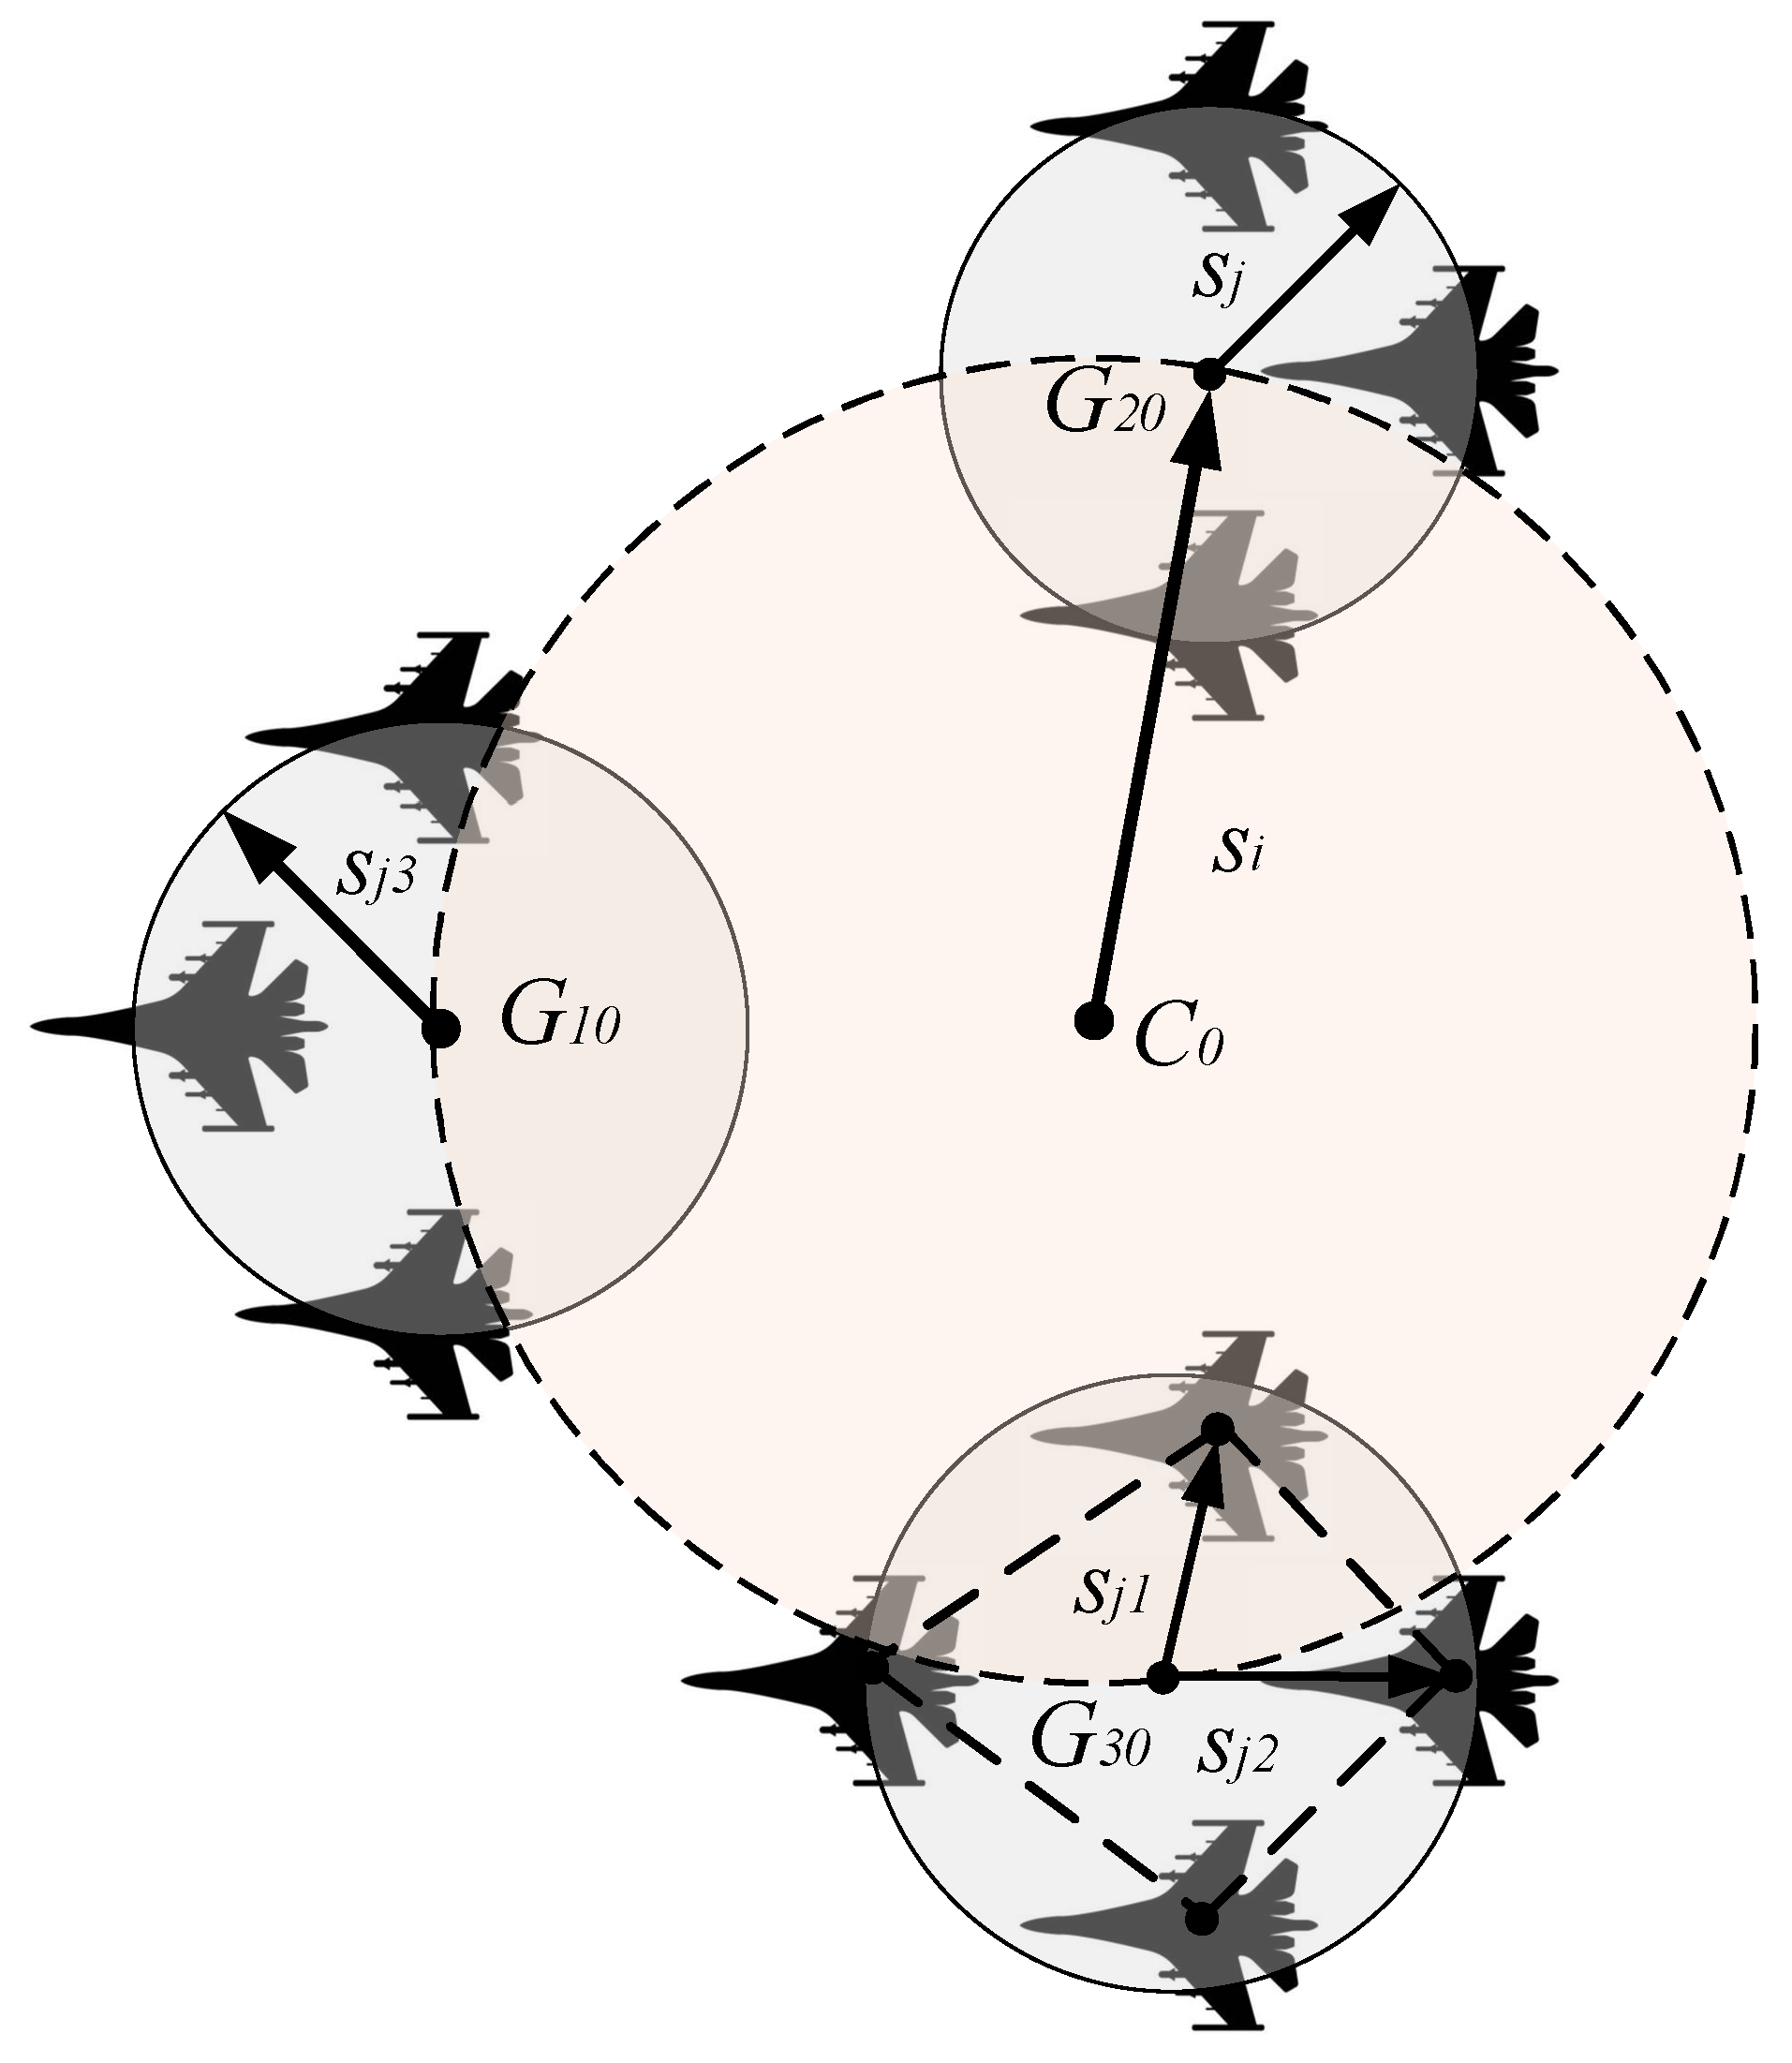
Figure 3.
Cluster configuration of 10 UAVs.
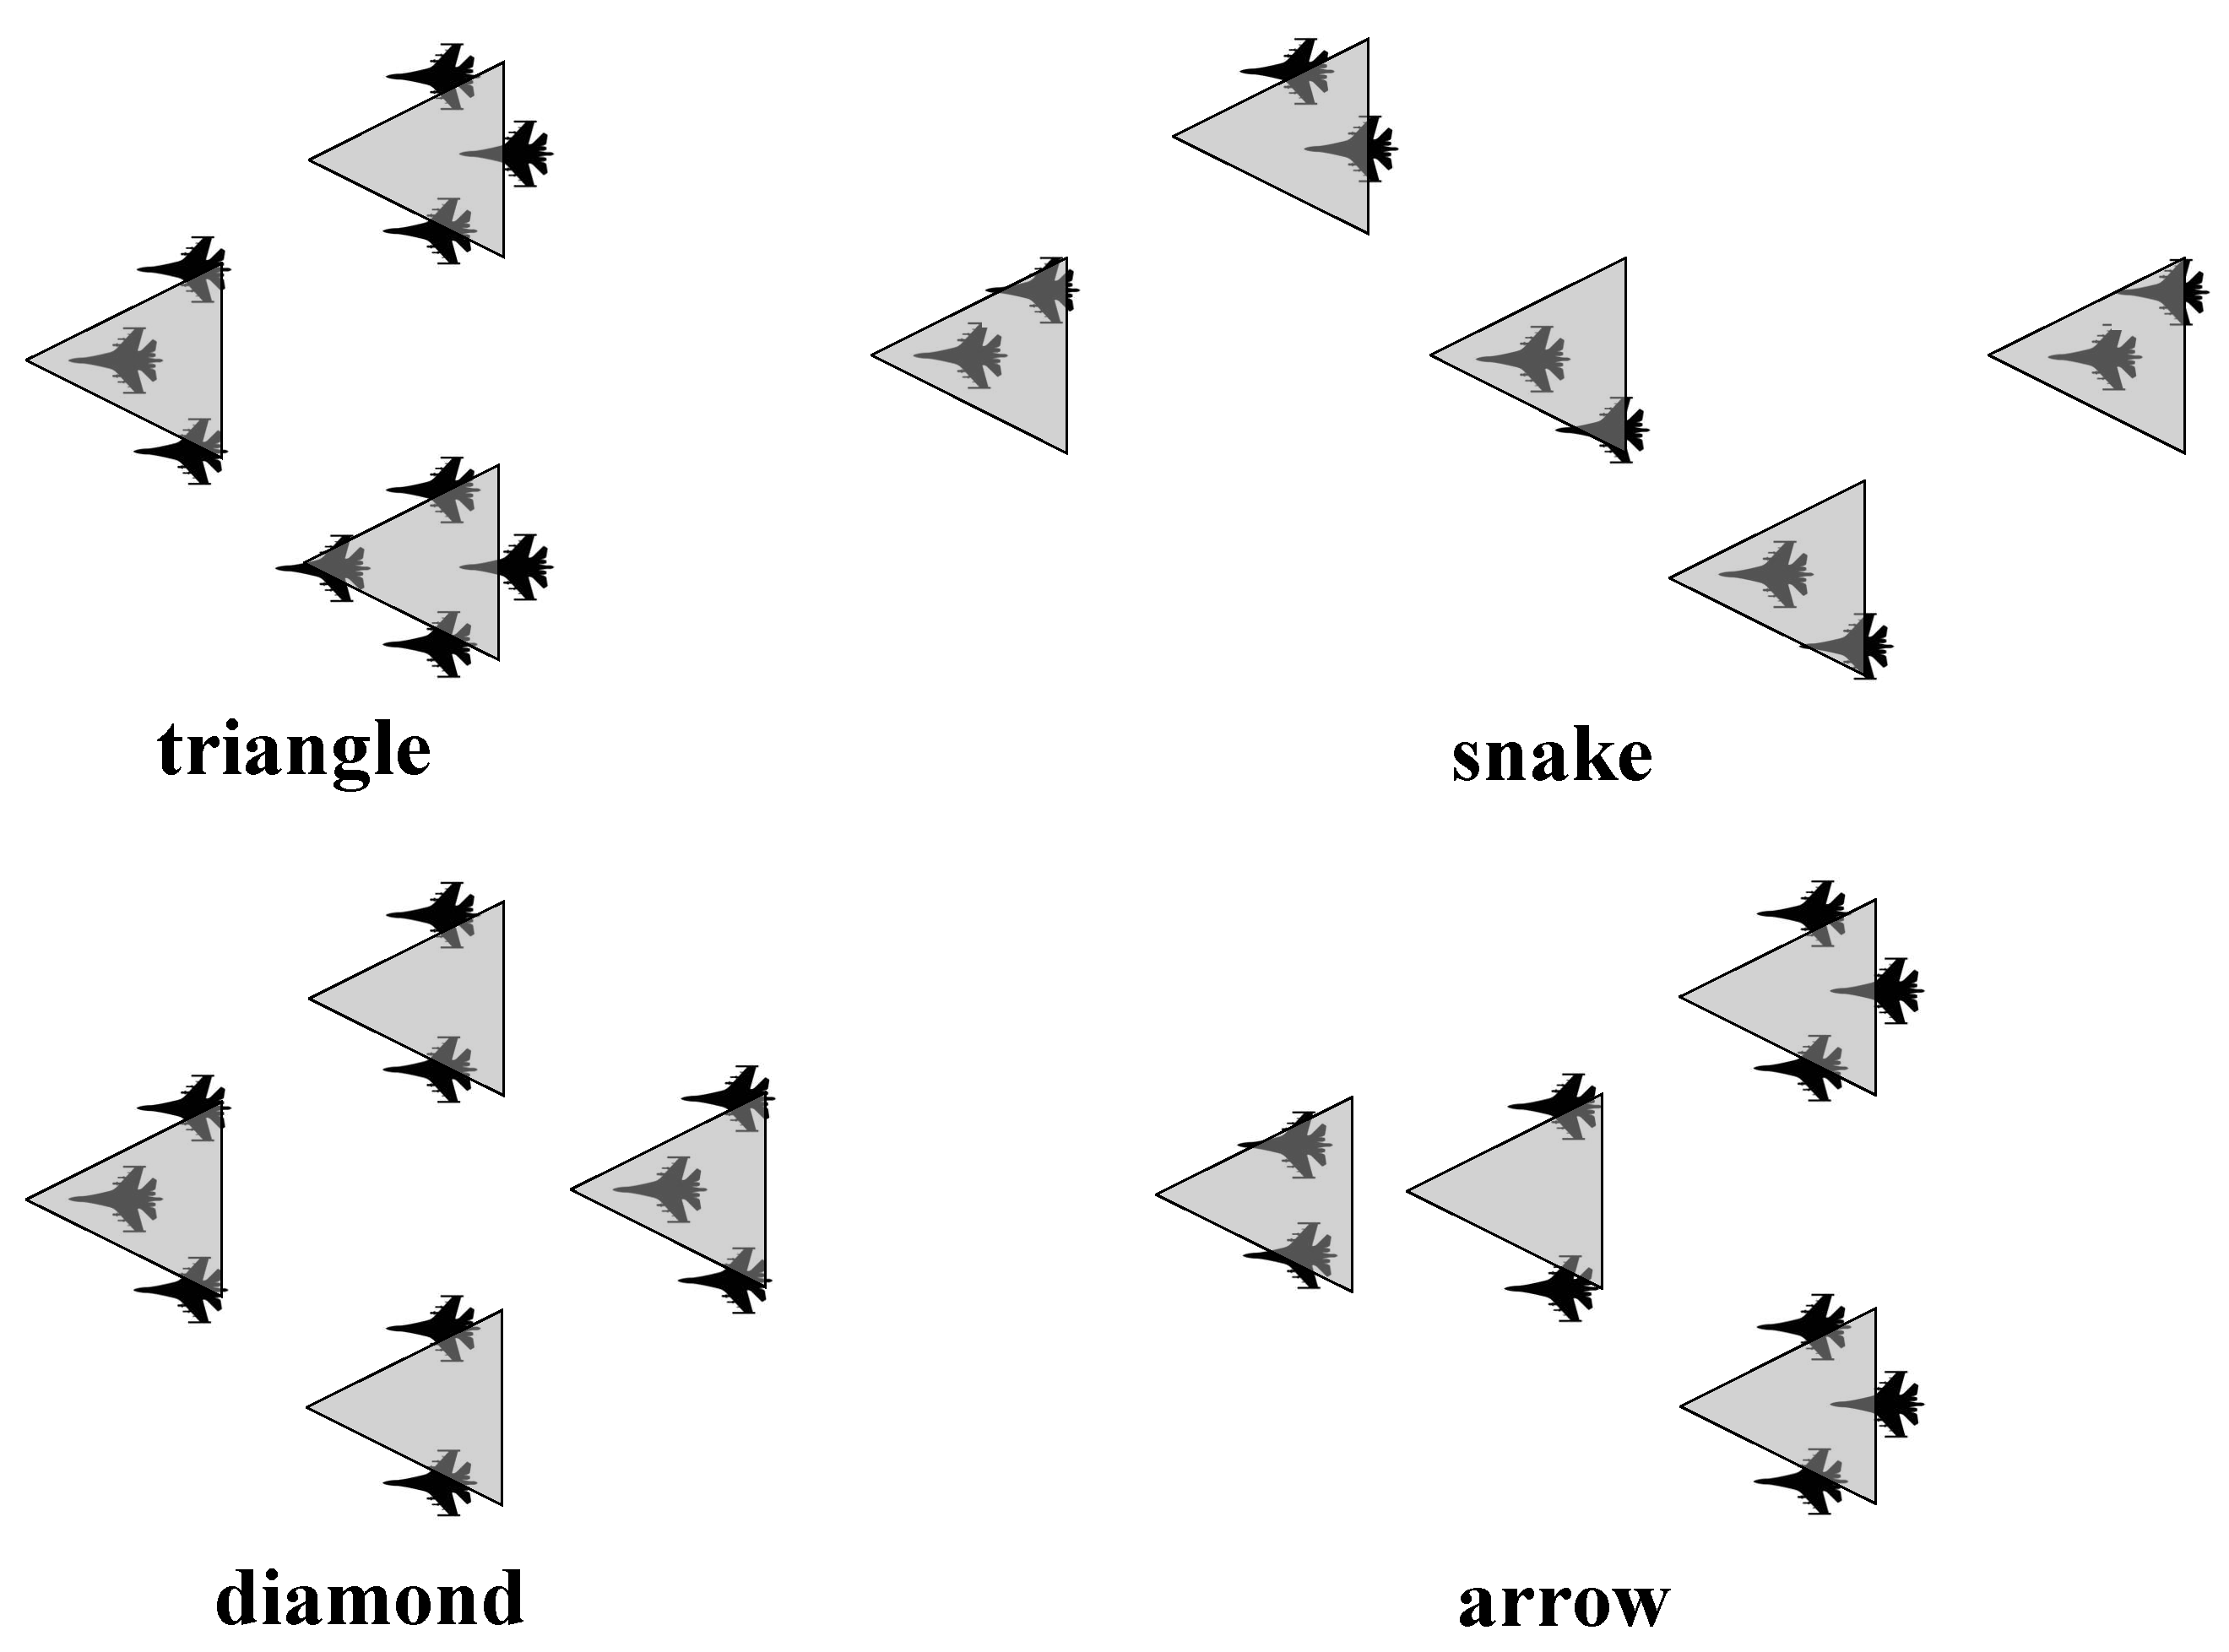
Figure 4.
Constraint diagram of formation of different configurations.
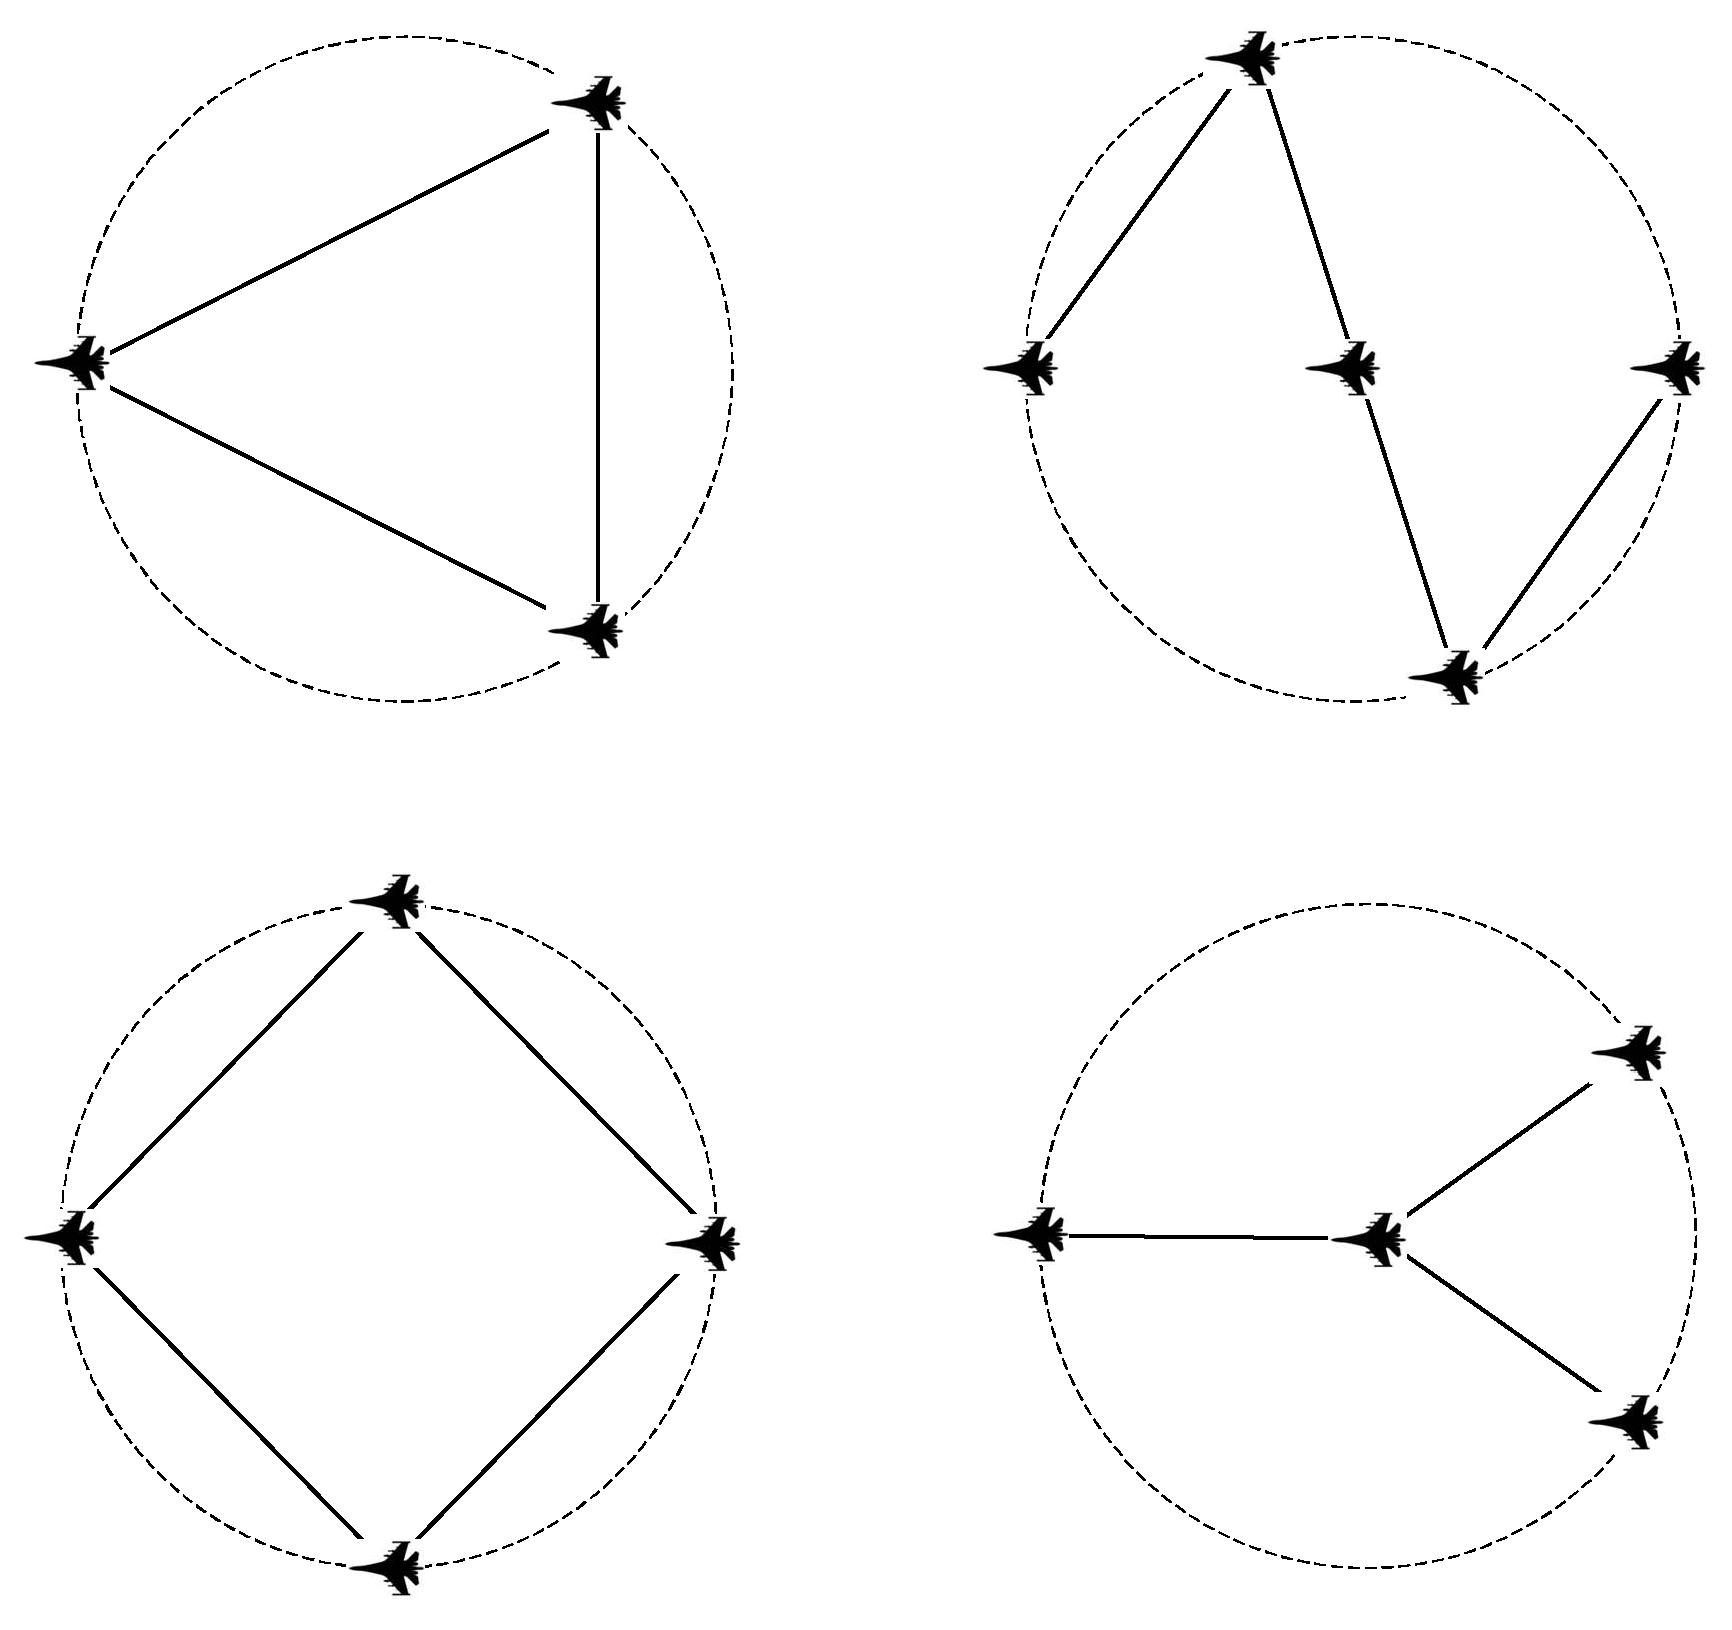
Figure 5.
Schematic diagram of triangle reconstruction diamond.
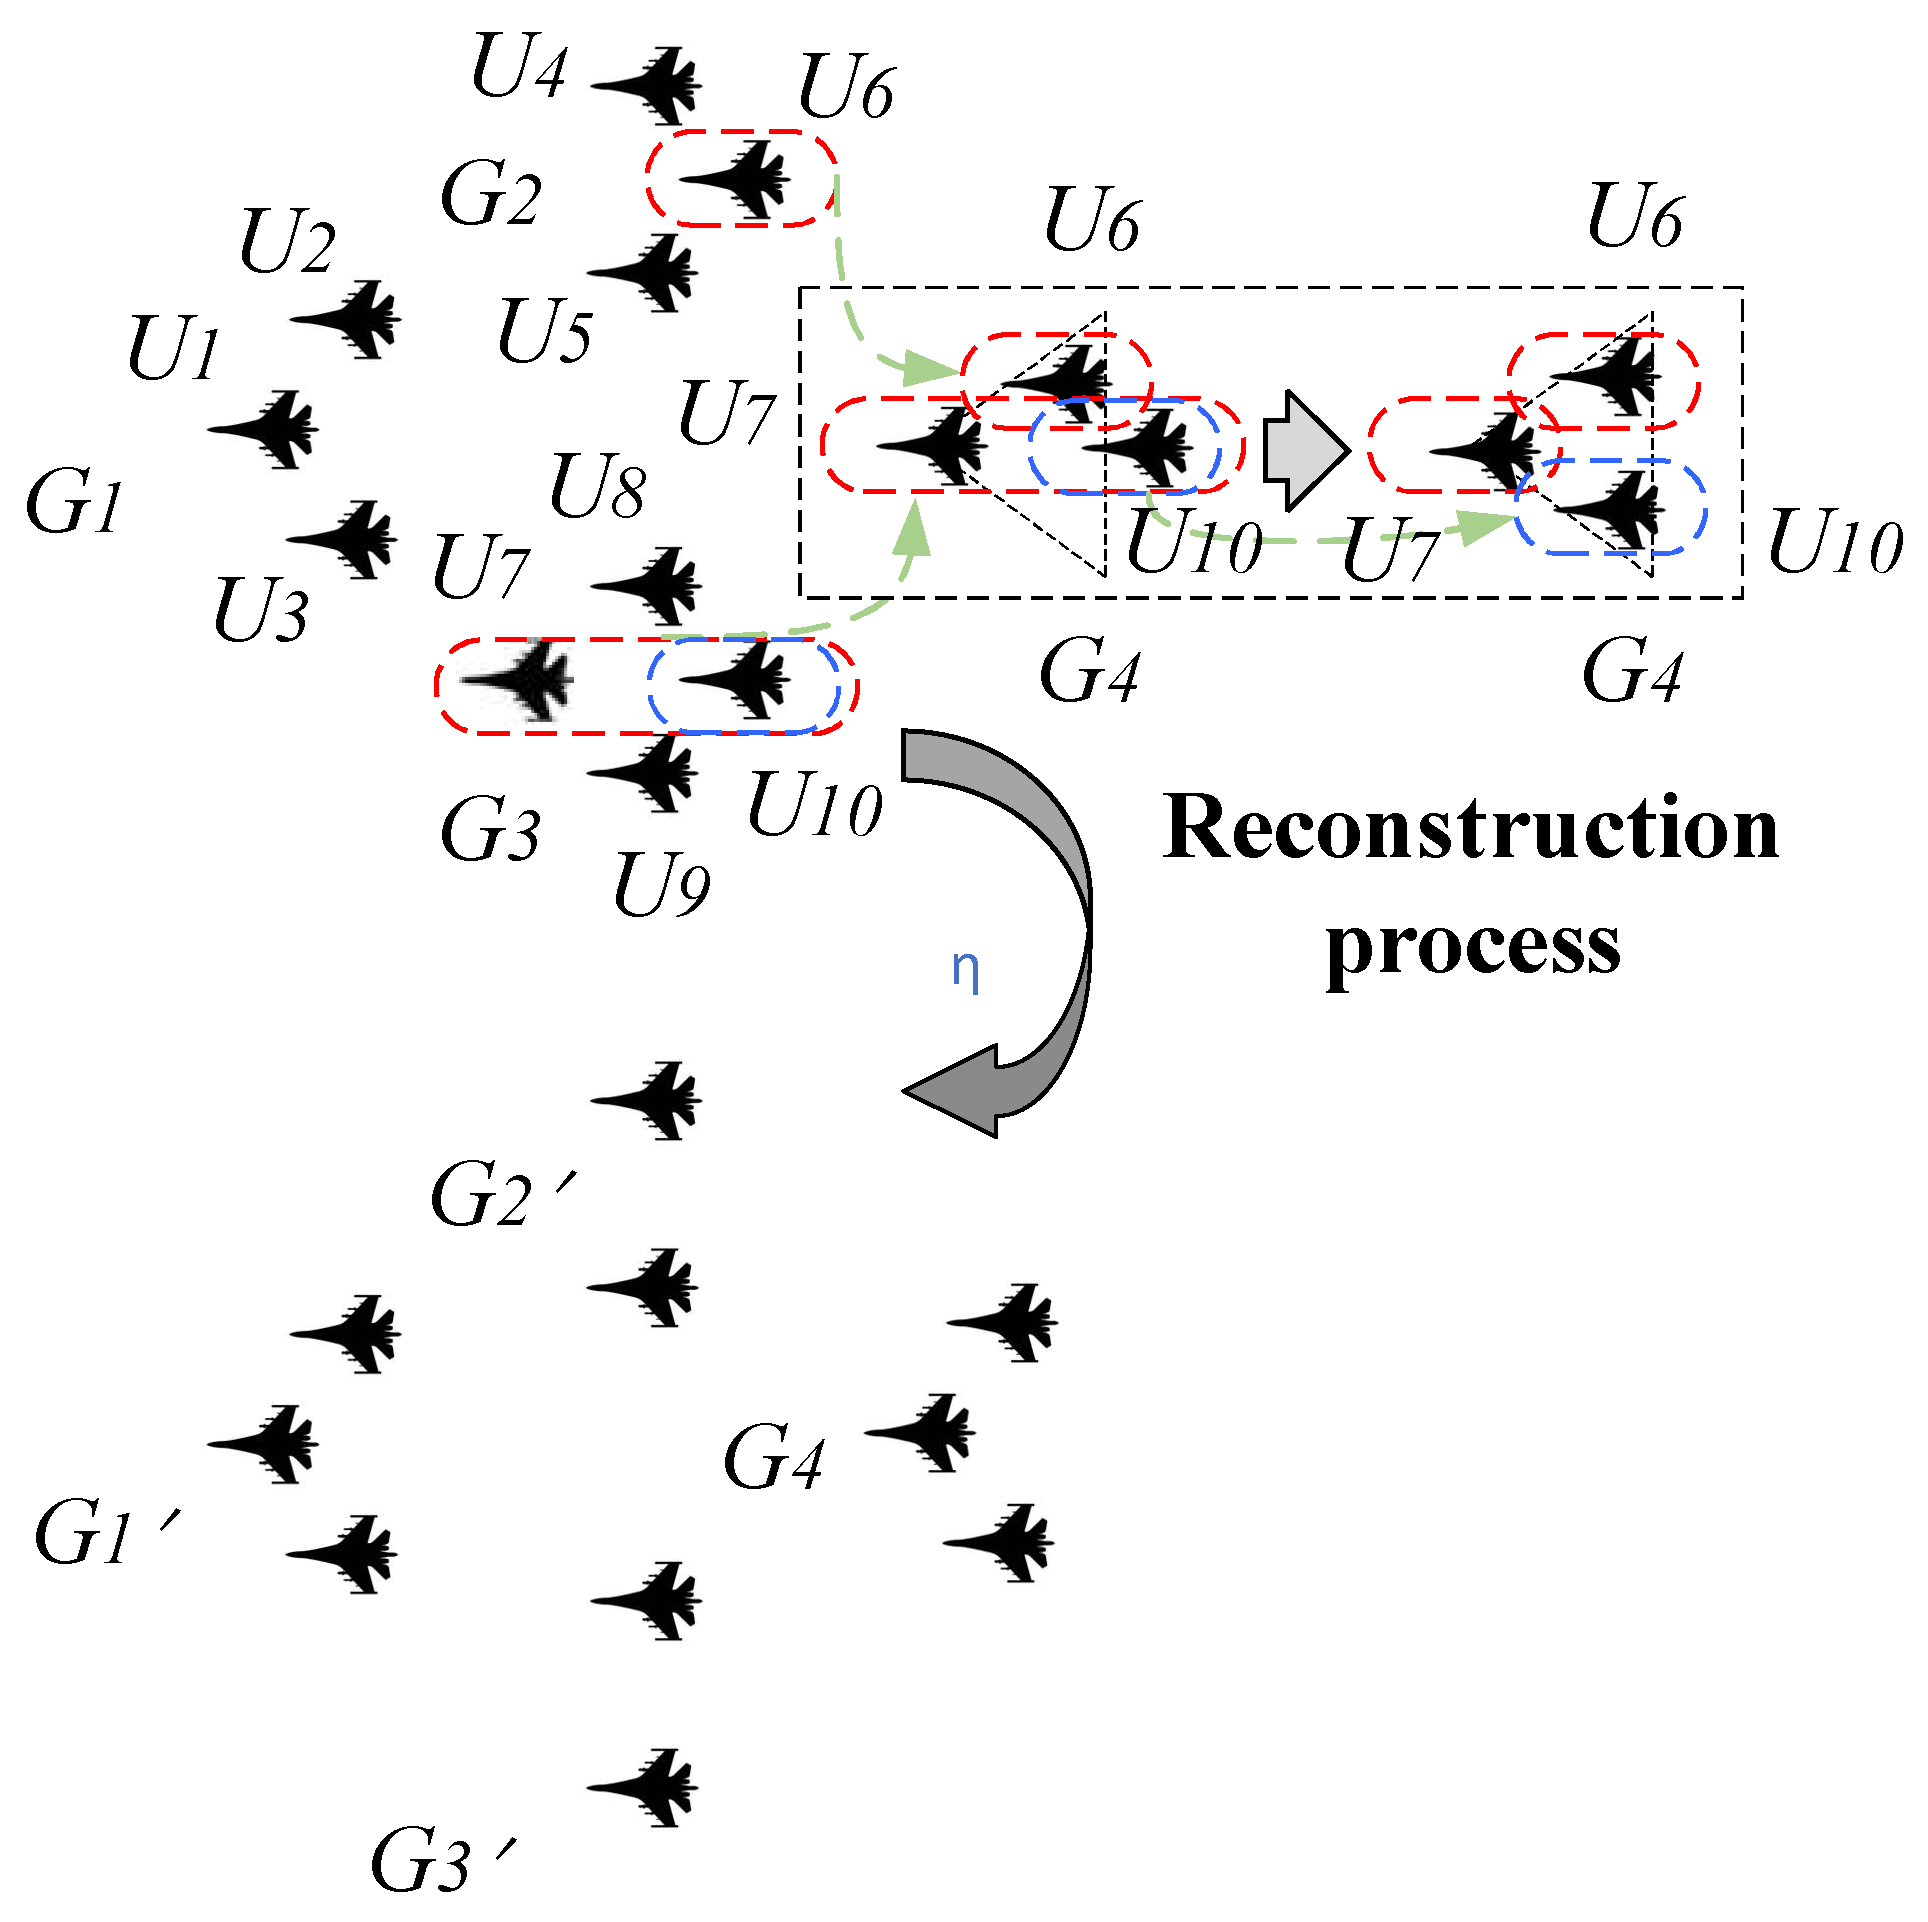
Figure 6.
Schematic diagram of cluster reconstruction three-dimensional coordinate model.
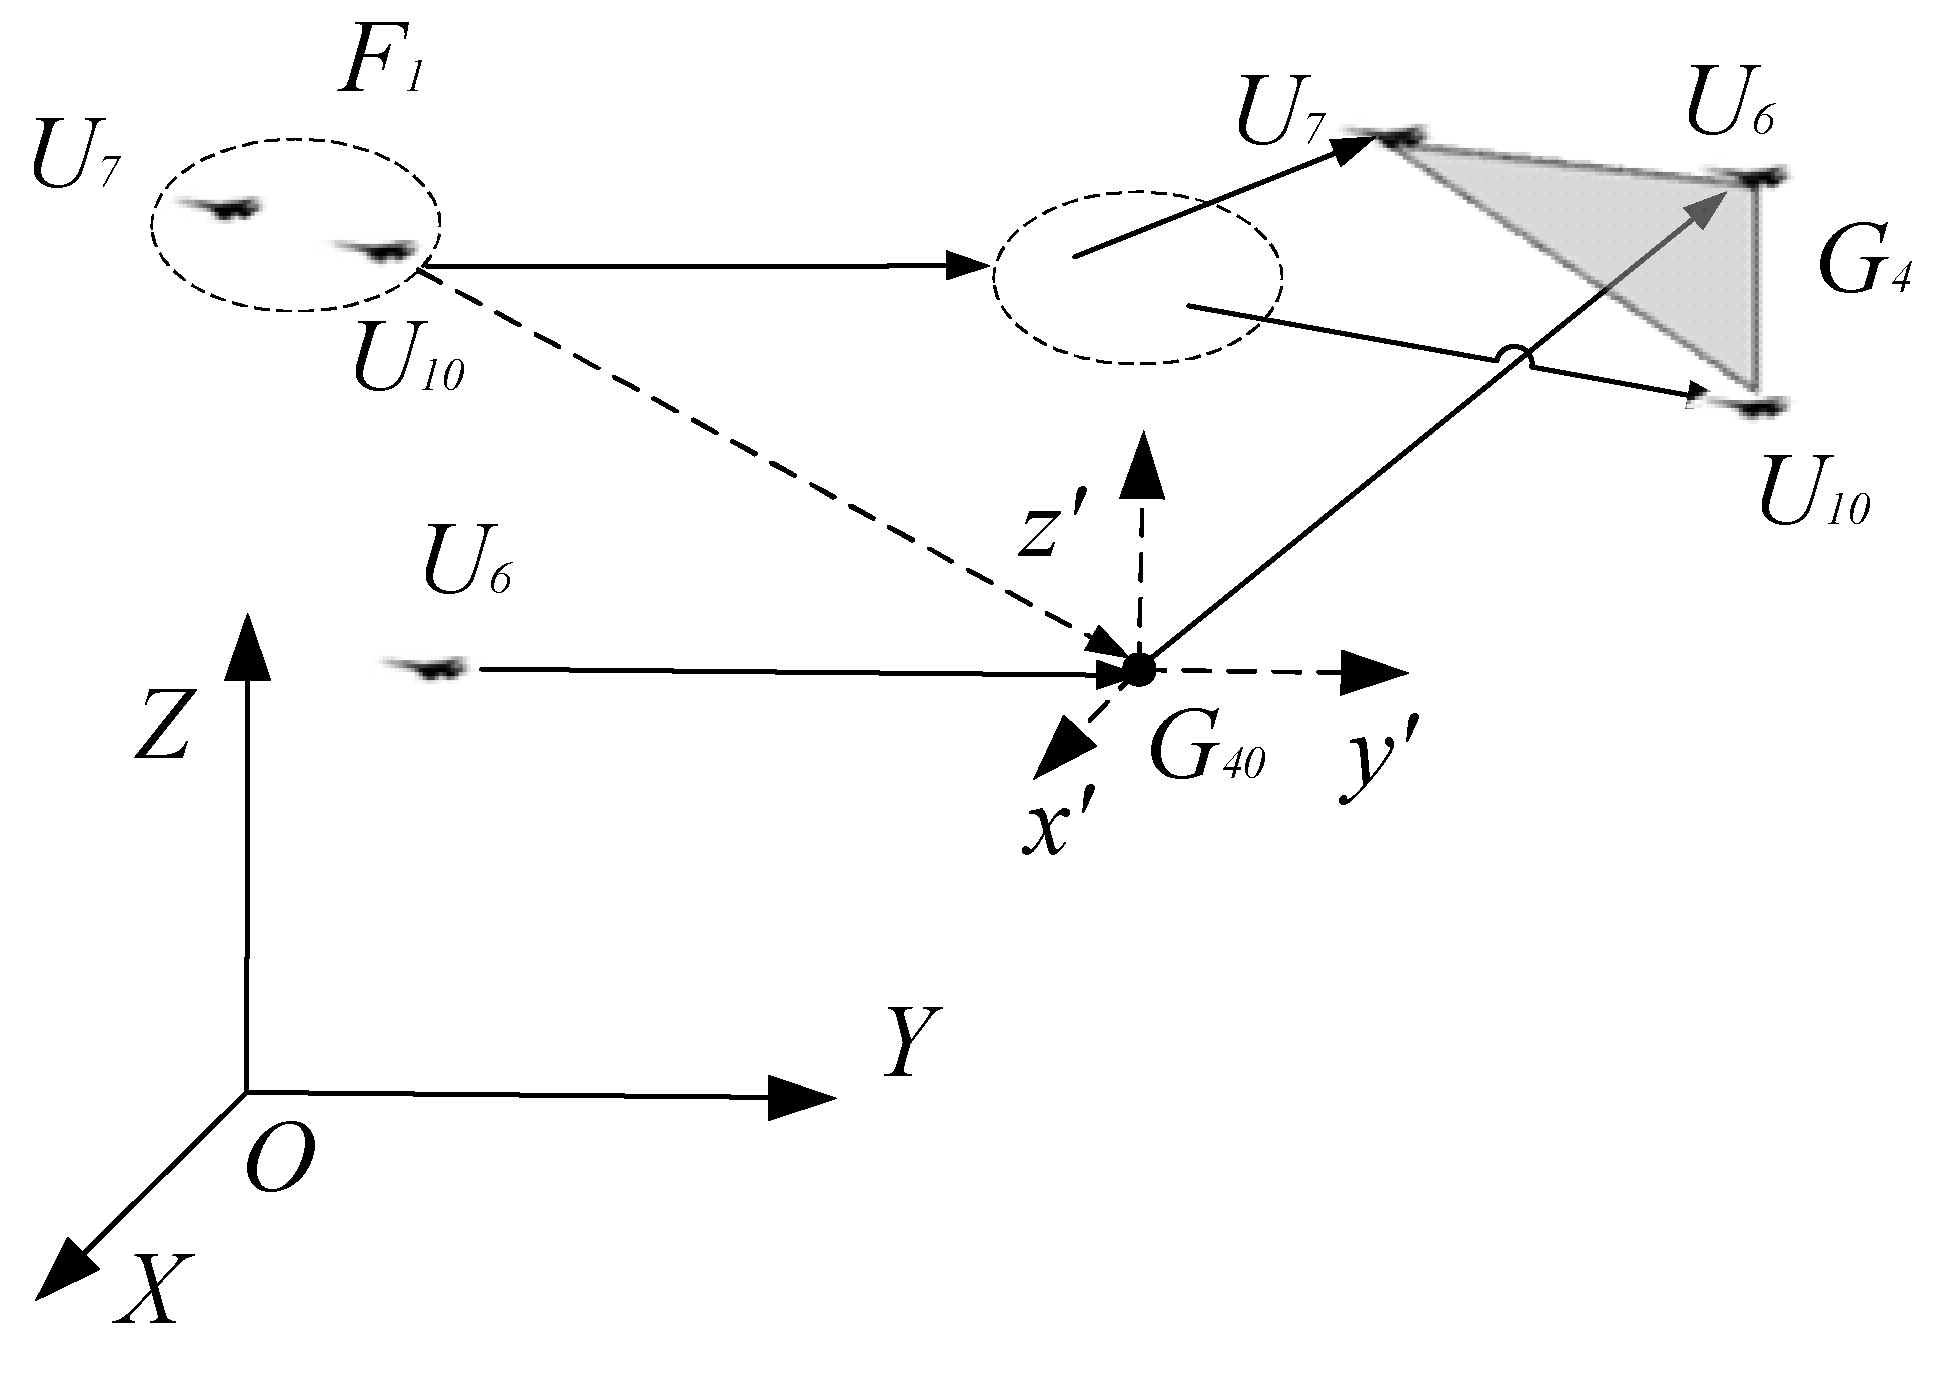
Figure 7.
The motion route is reconstructed as a diamond shape.
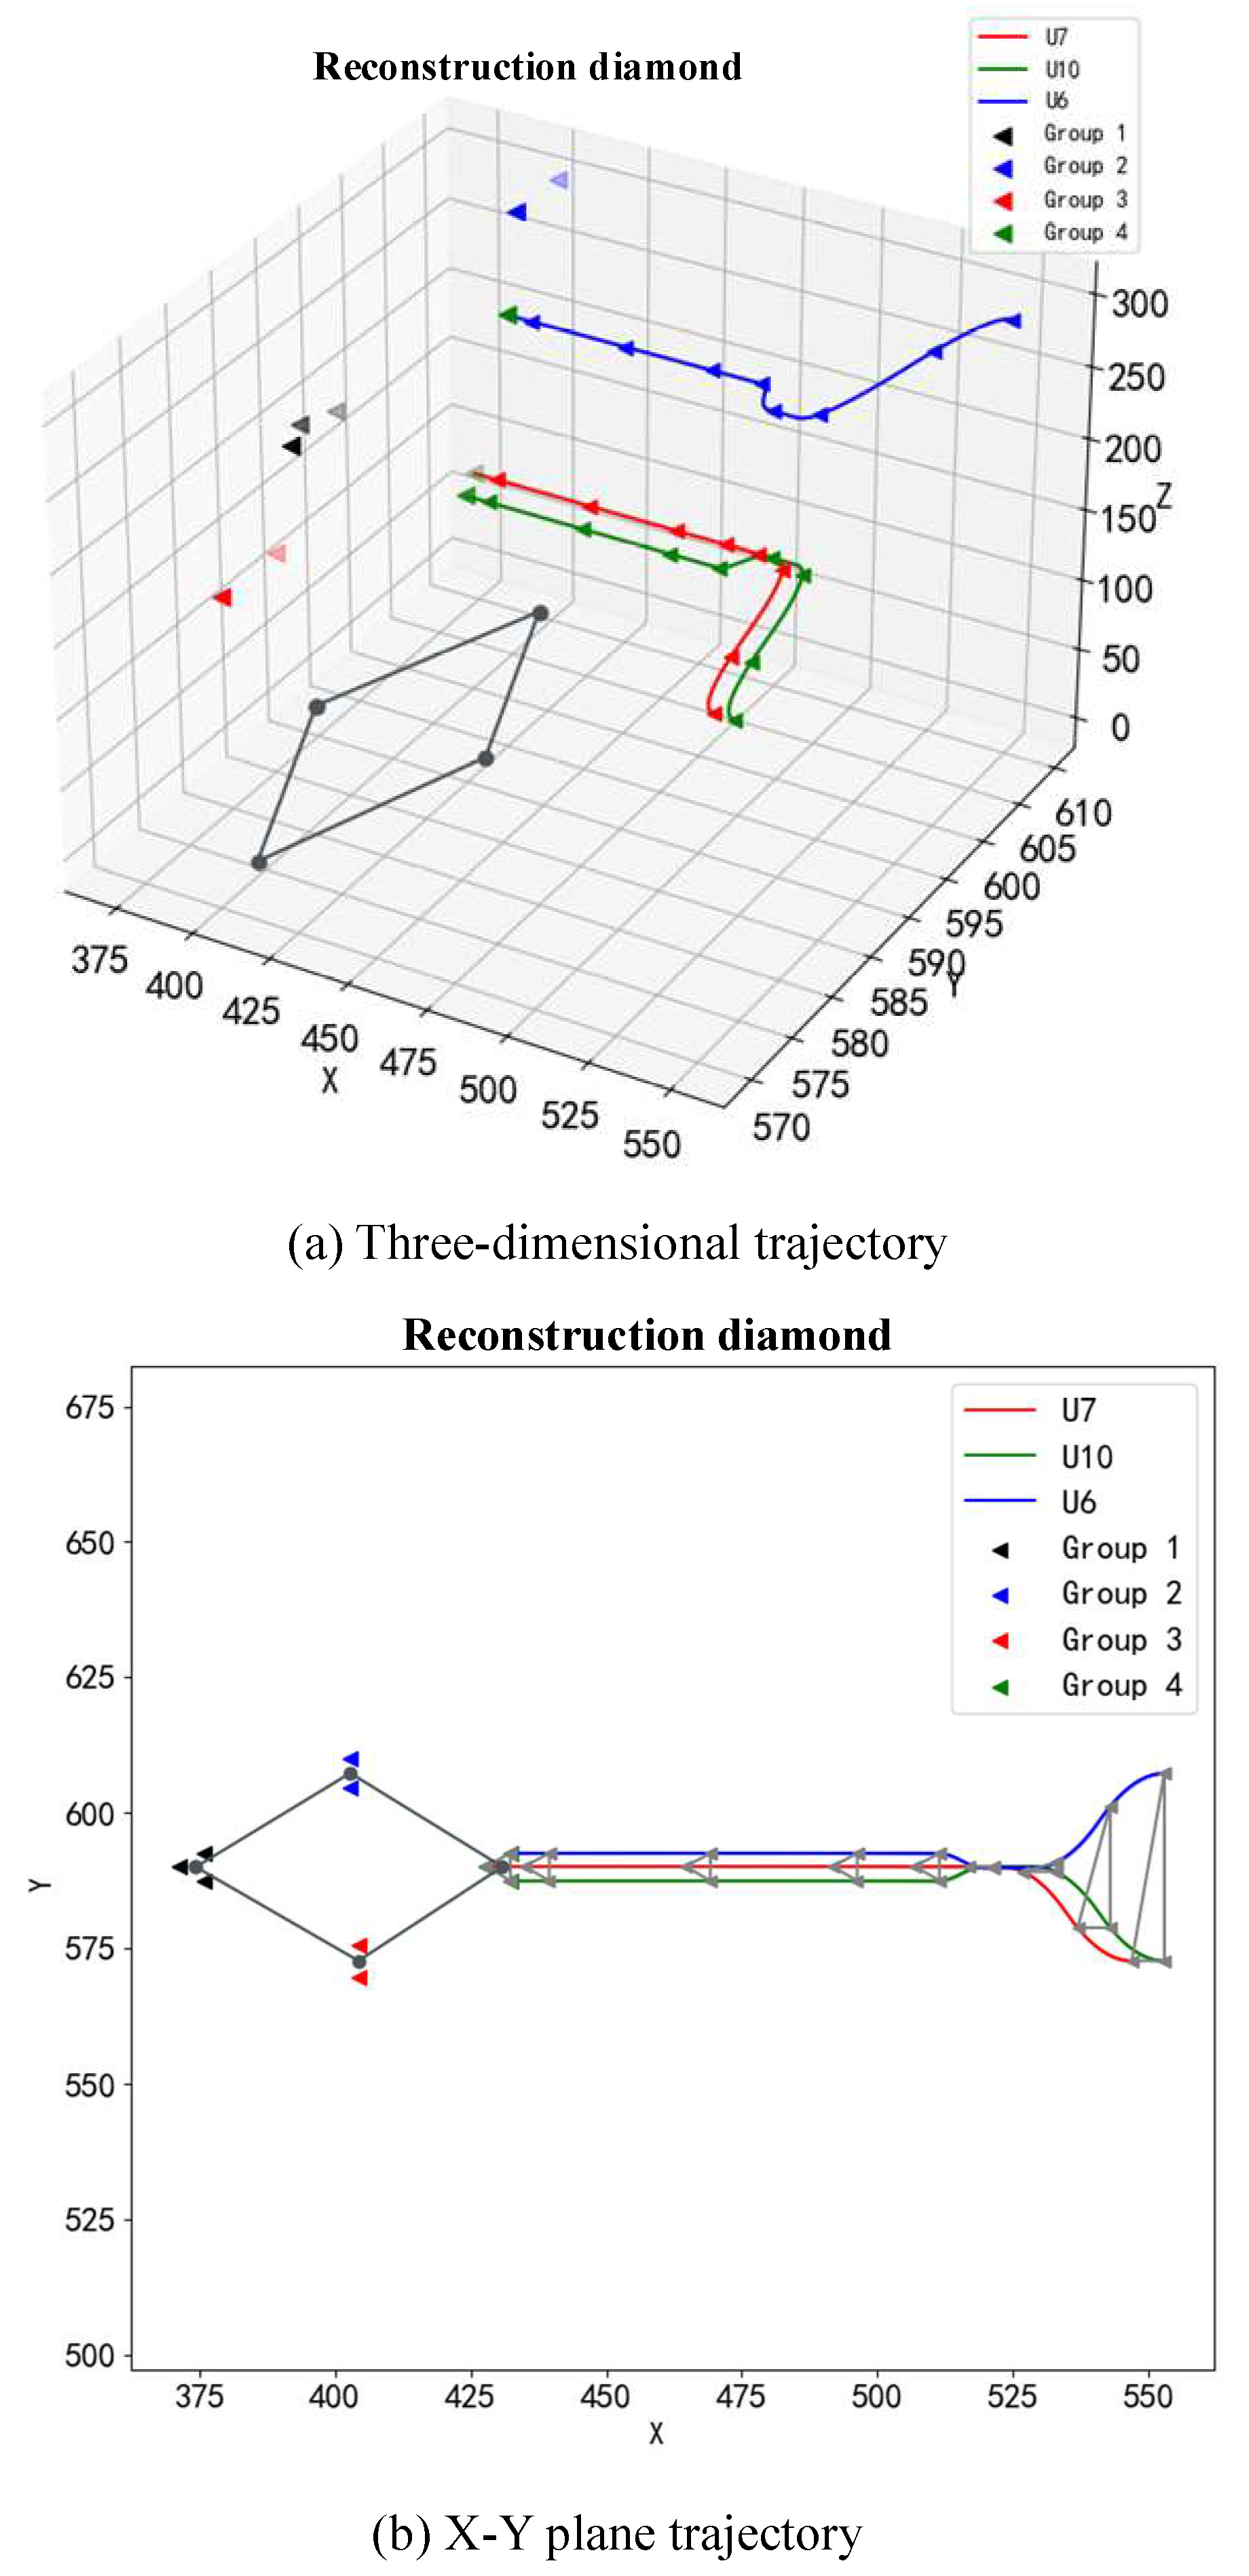
Figure 8.
The motion route is reconstructed as a arrow shape.
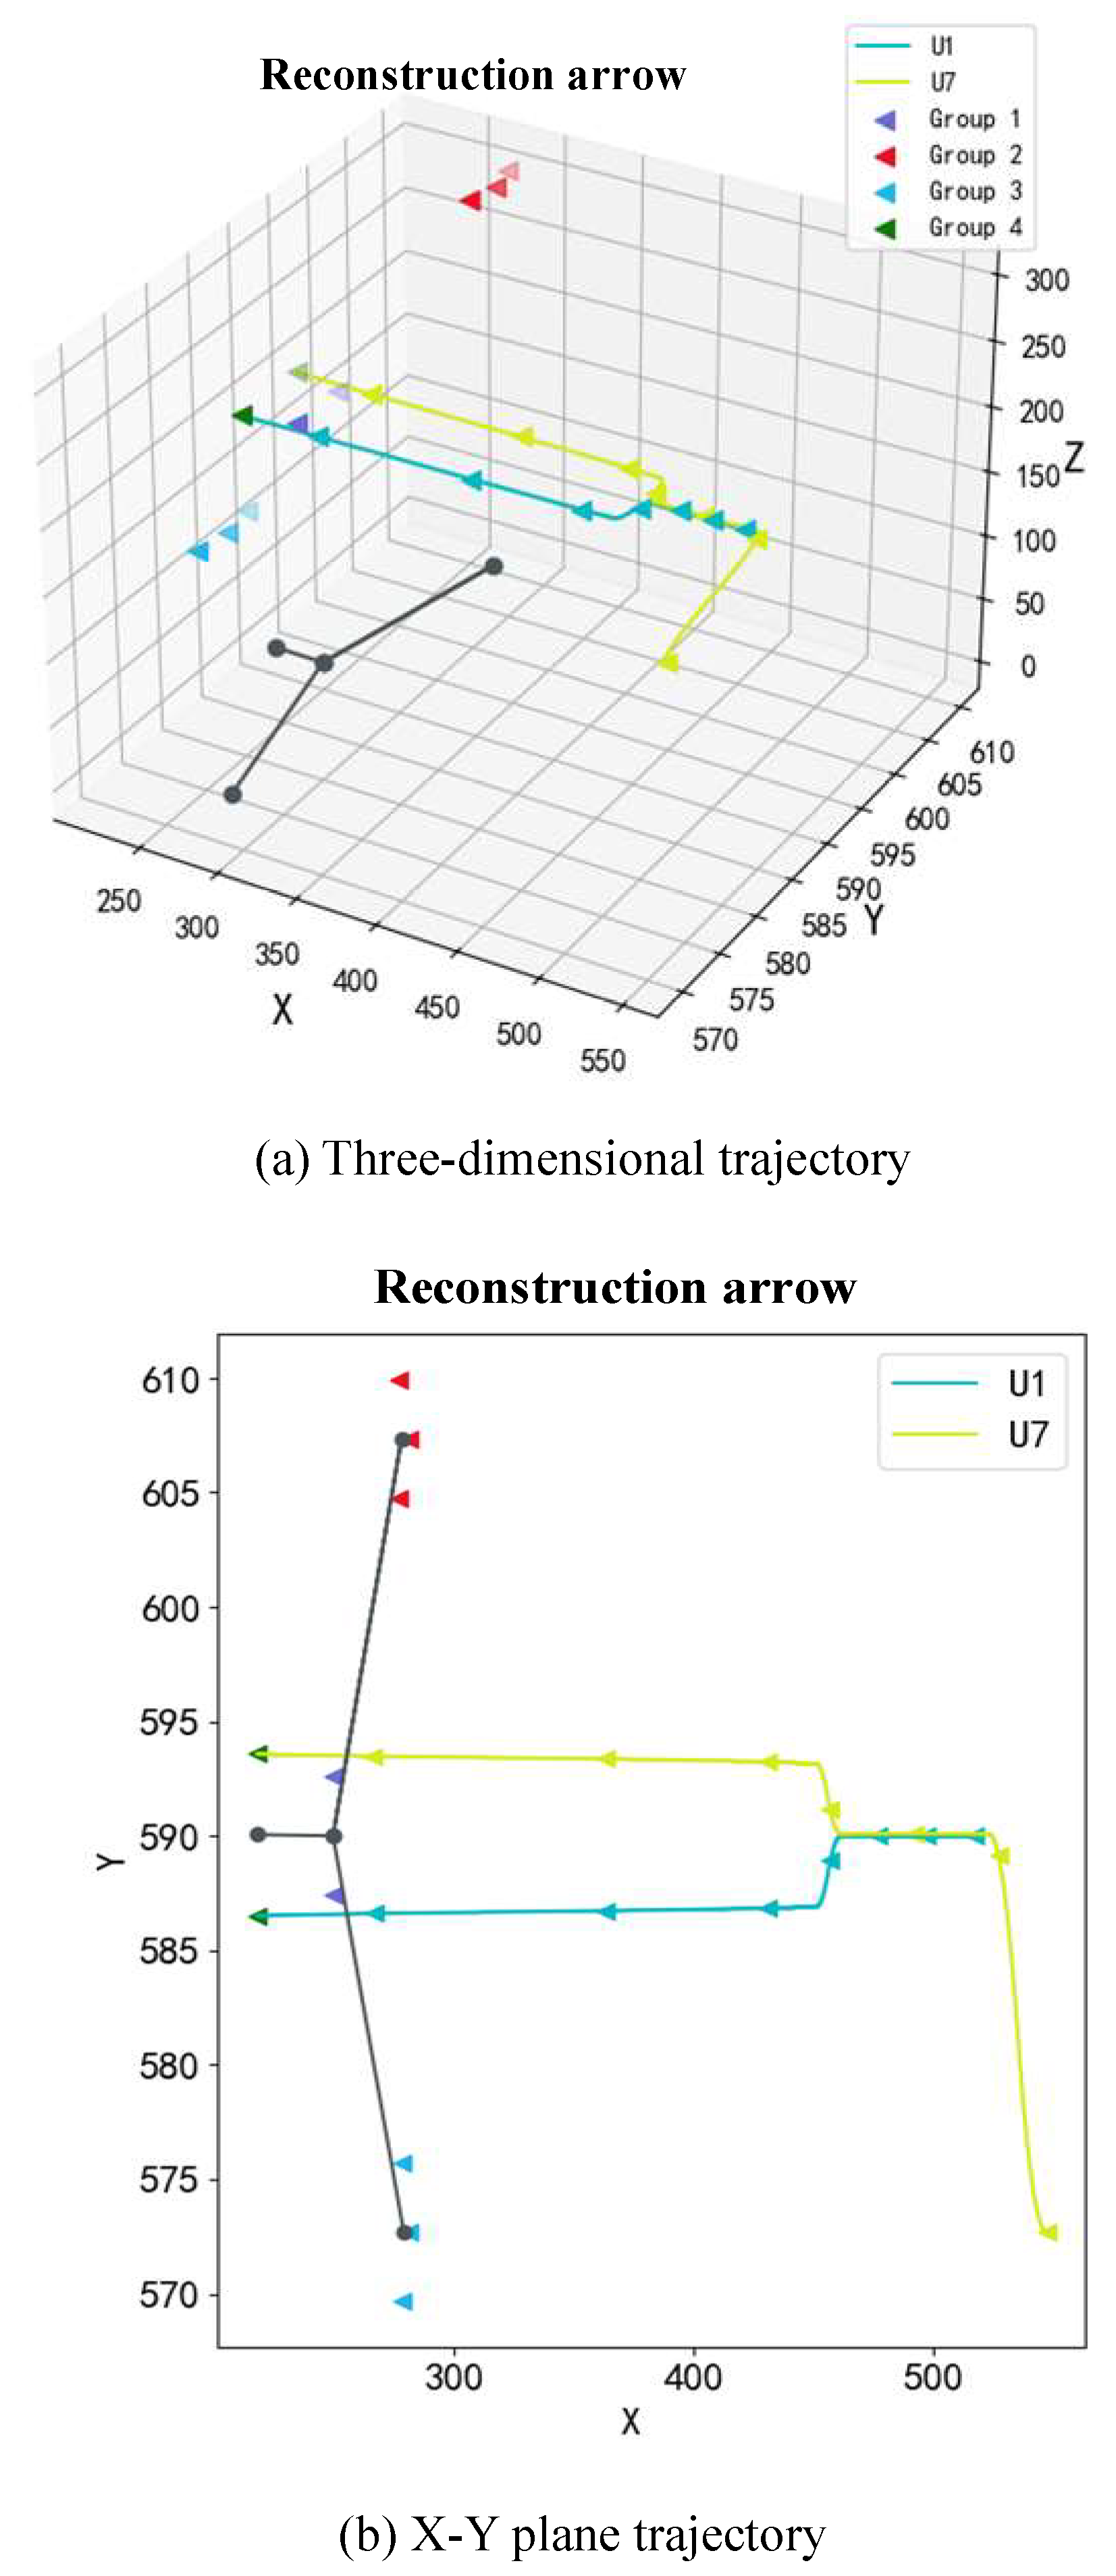
Figure 9.
The motion route is reconstructed as a snake shape.
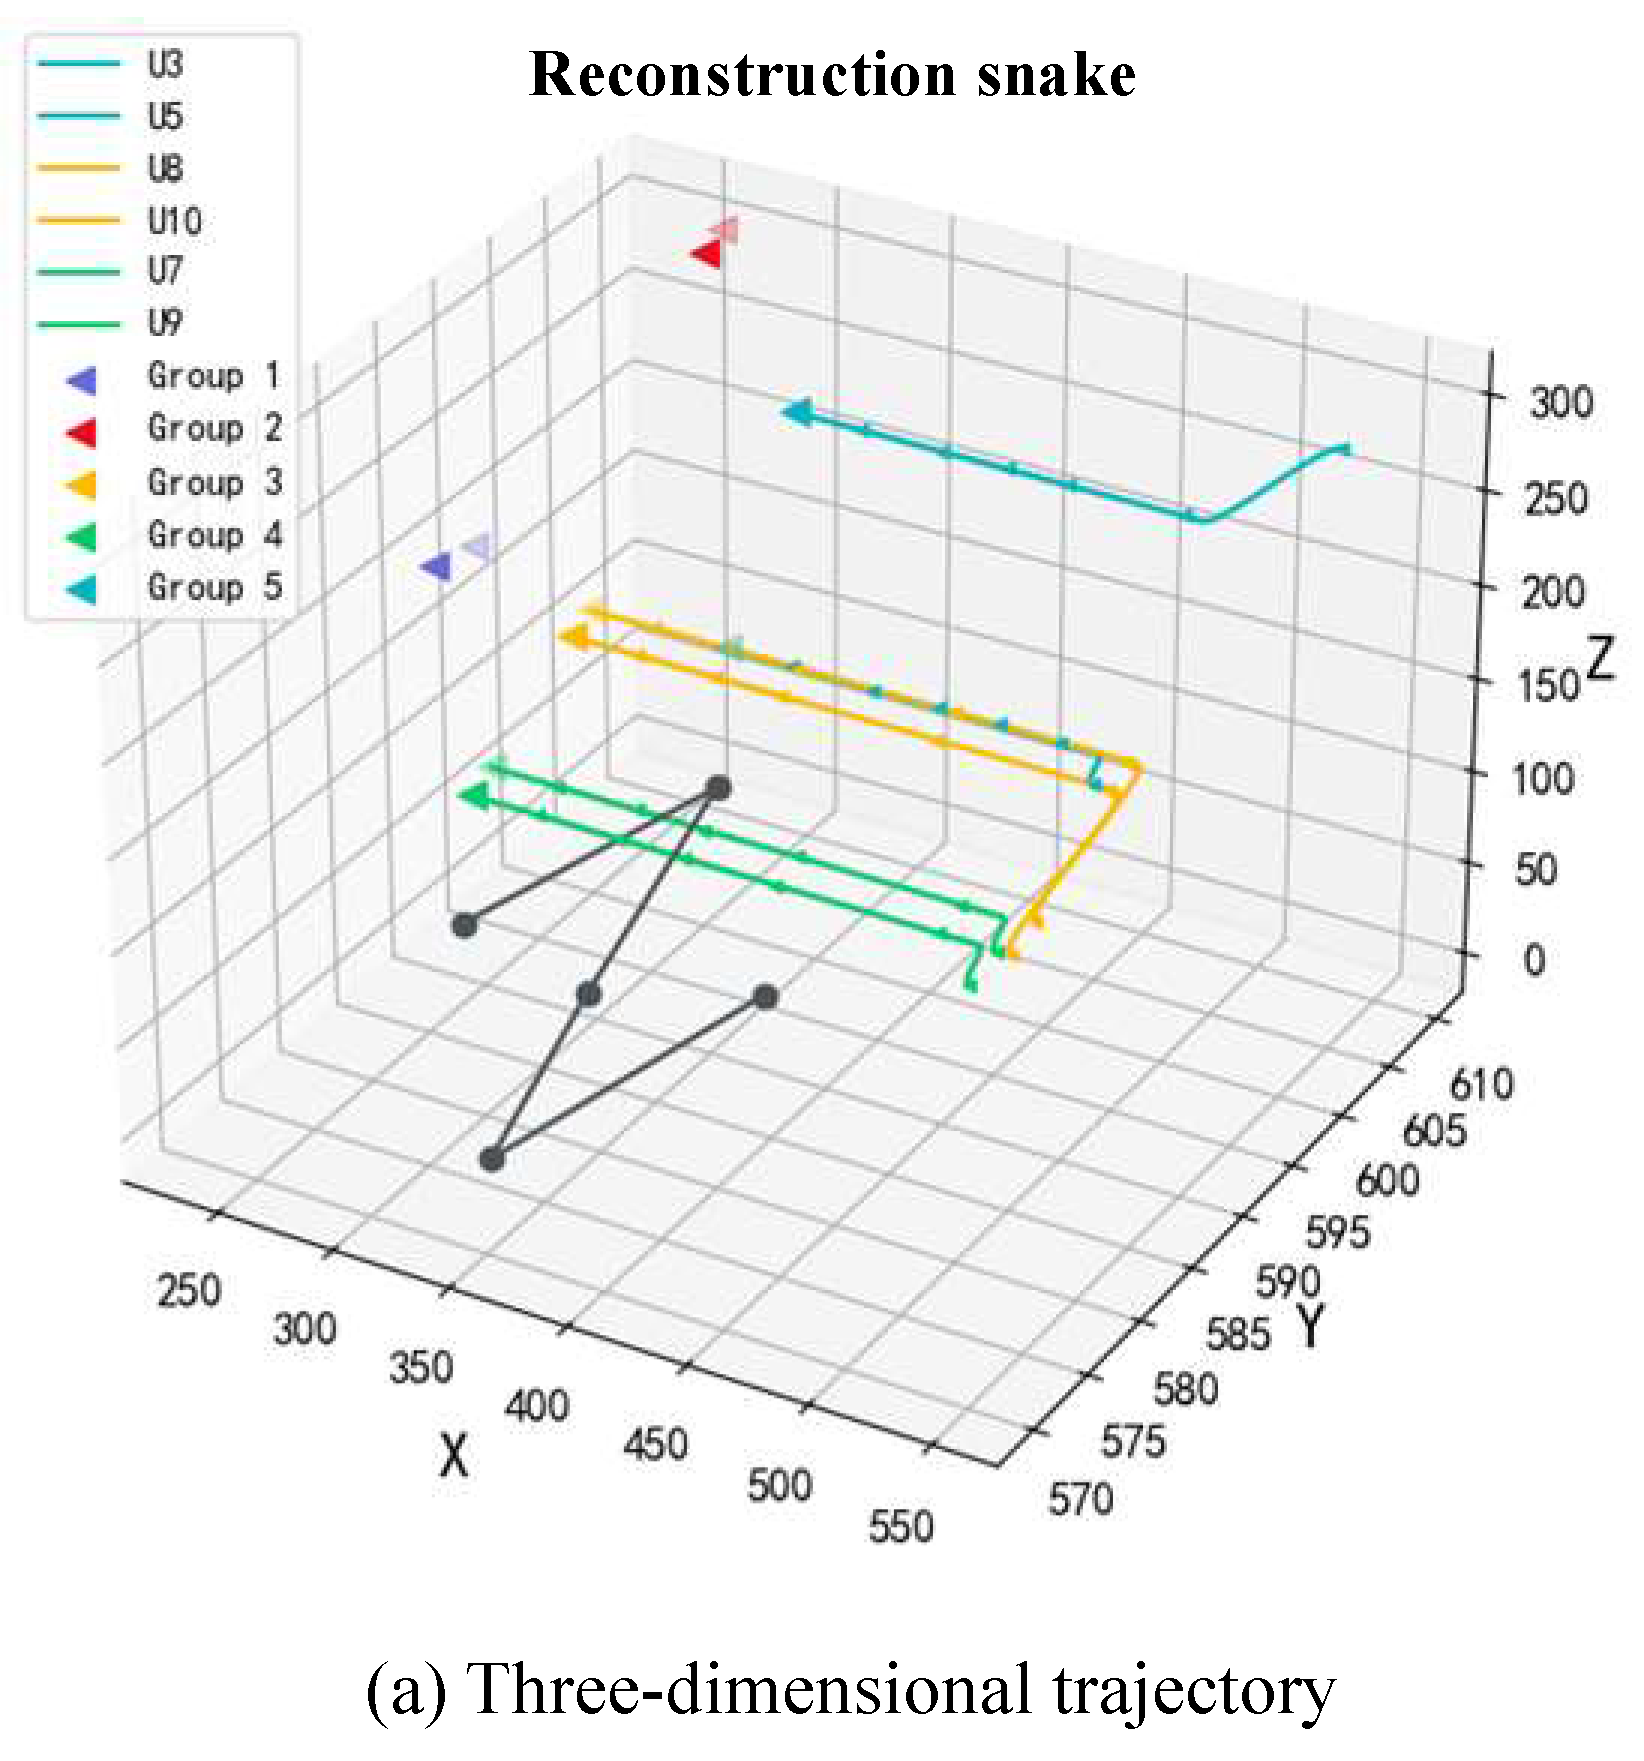
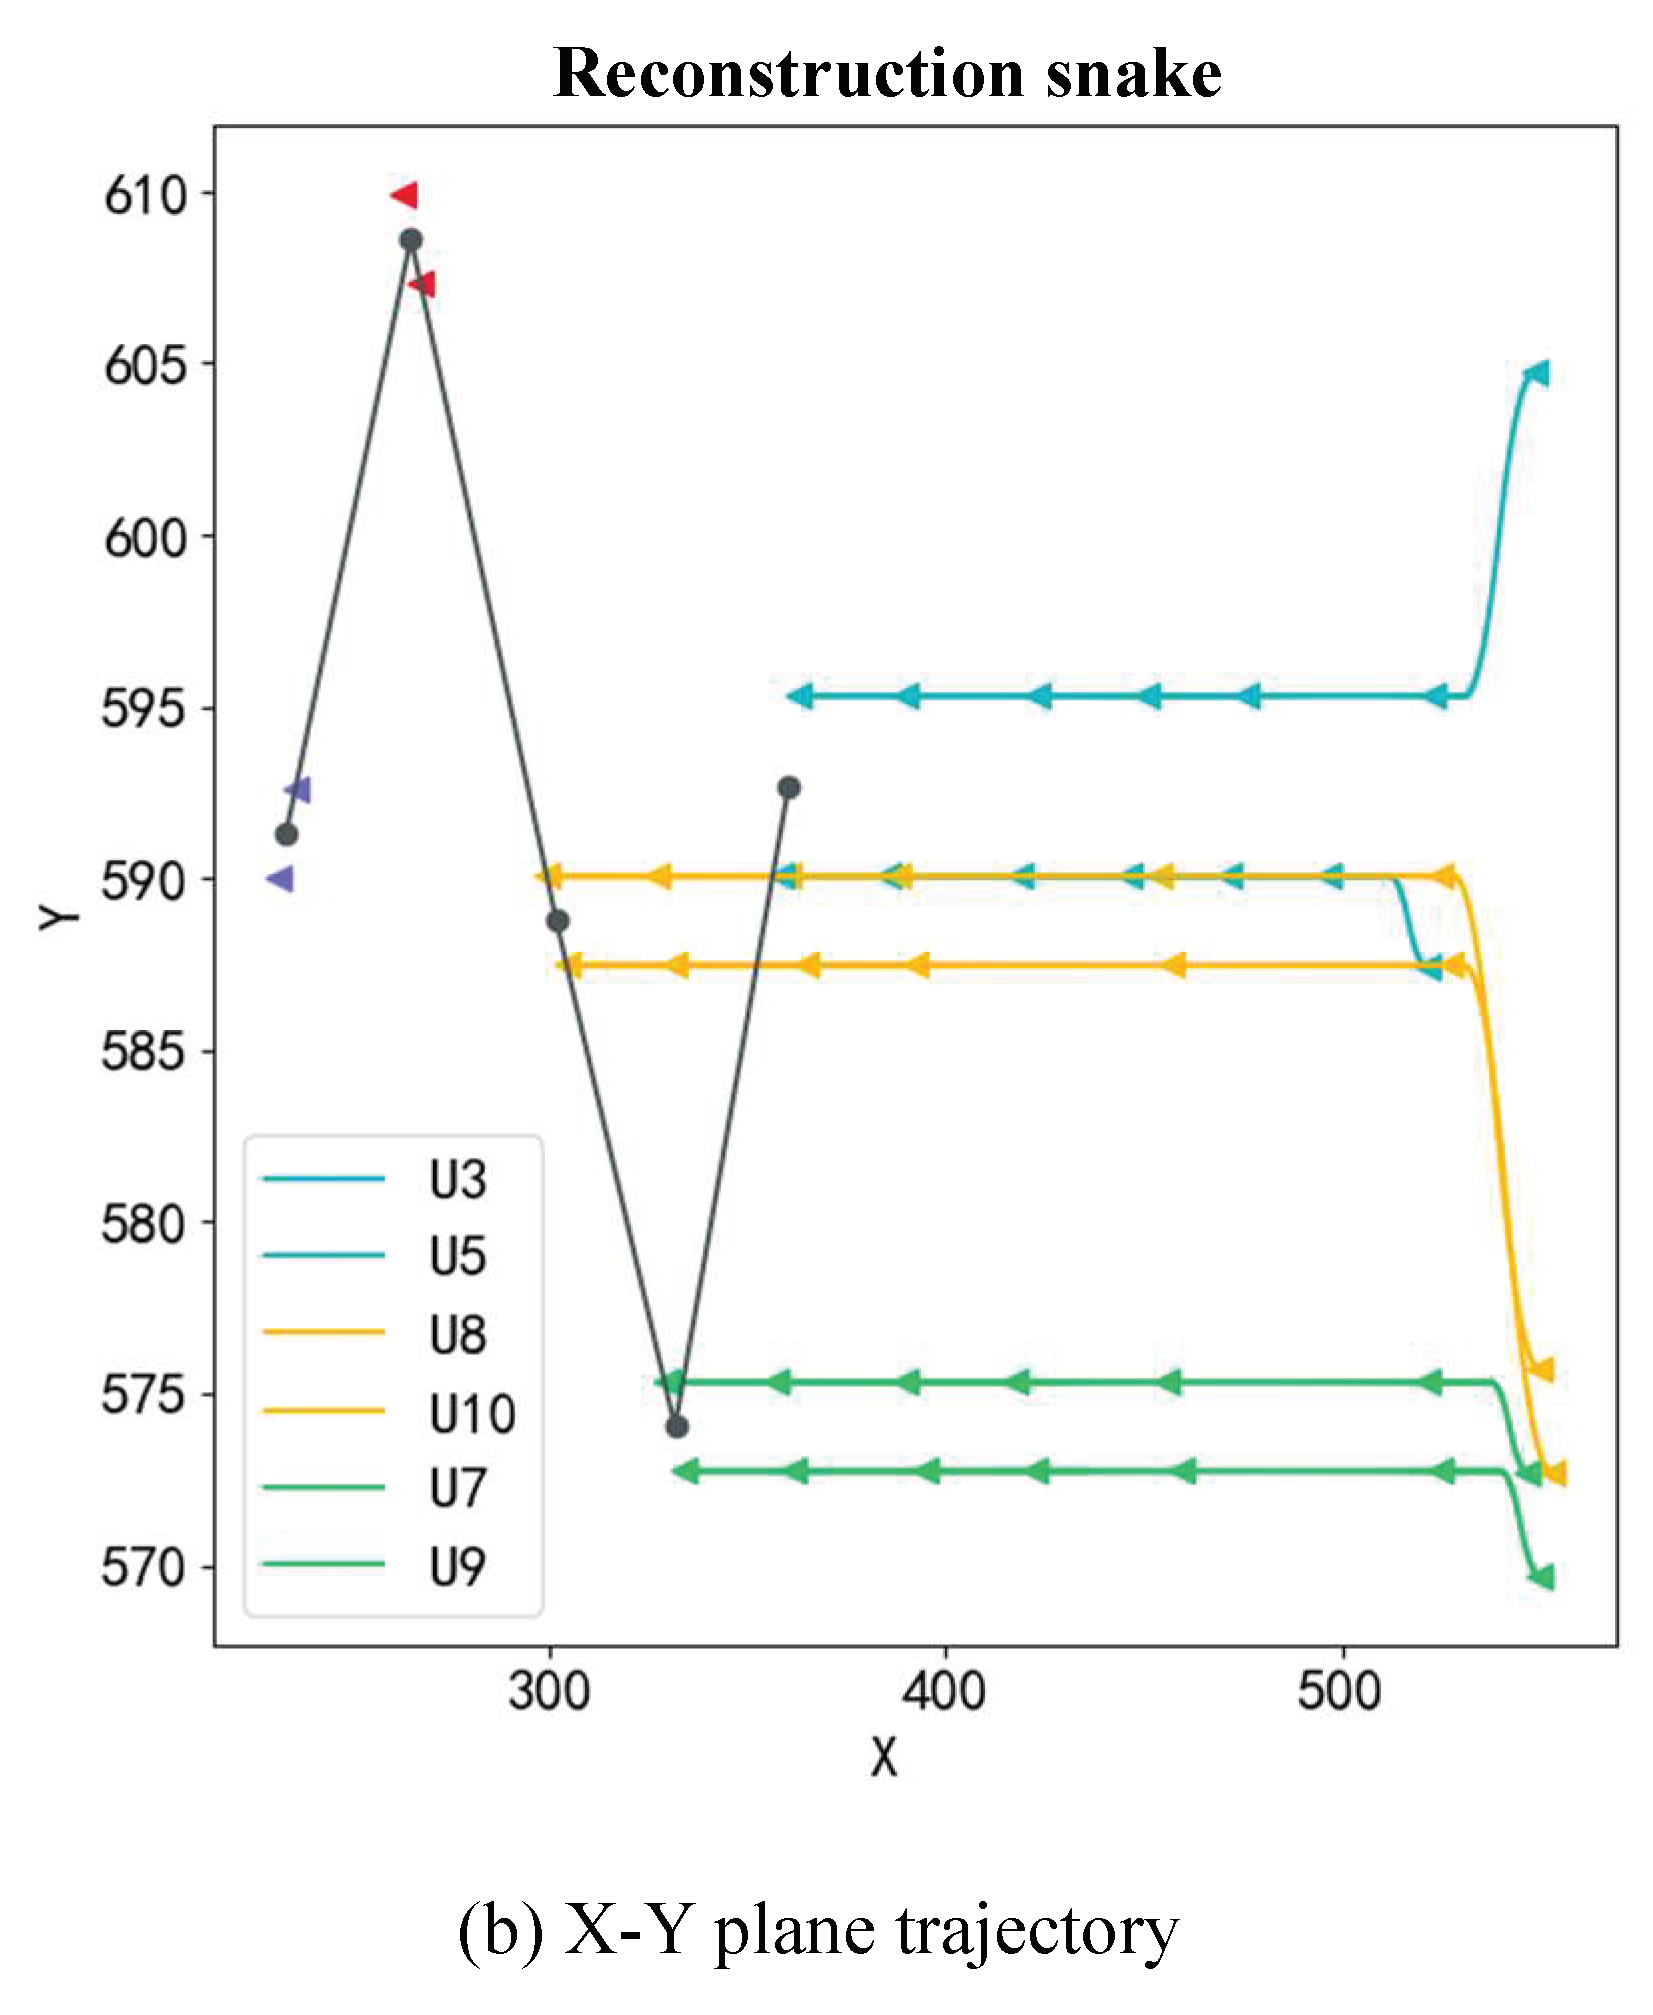
Figure 10.
The cost curves of three different configurations.
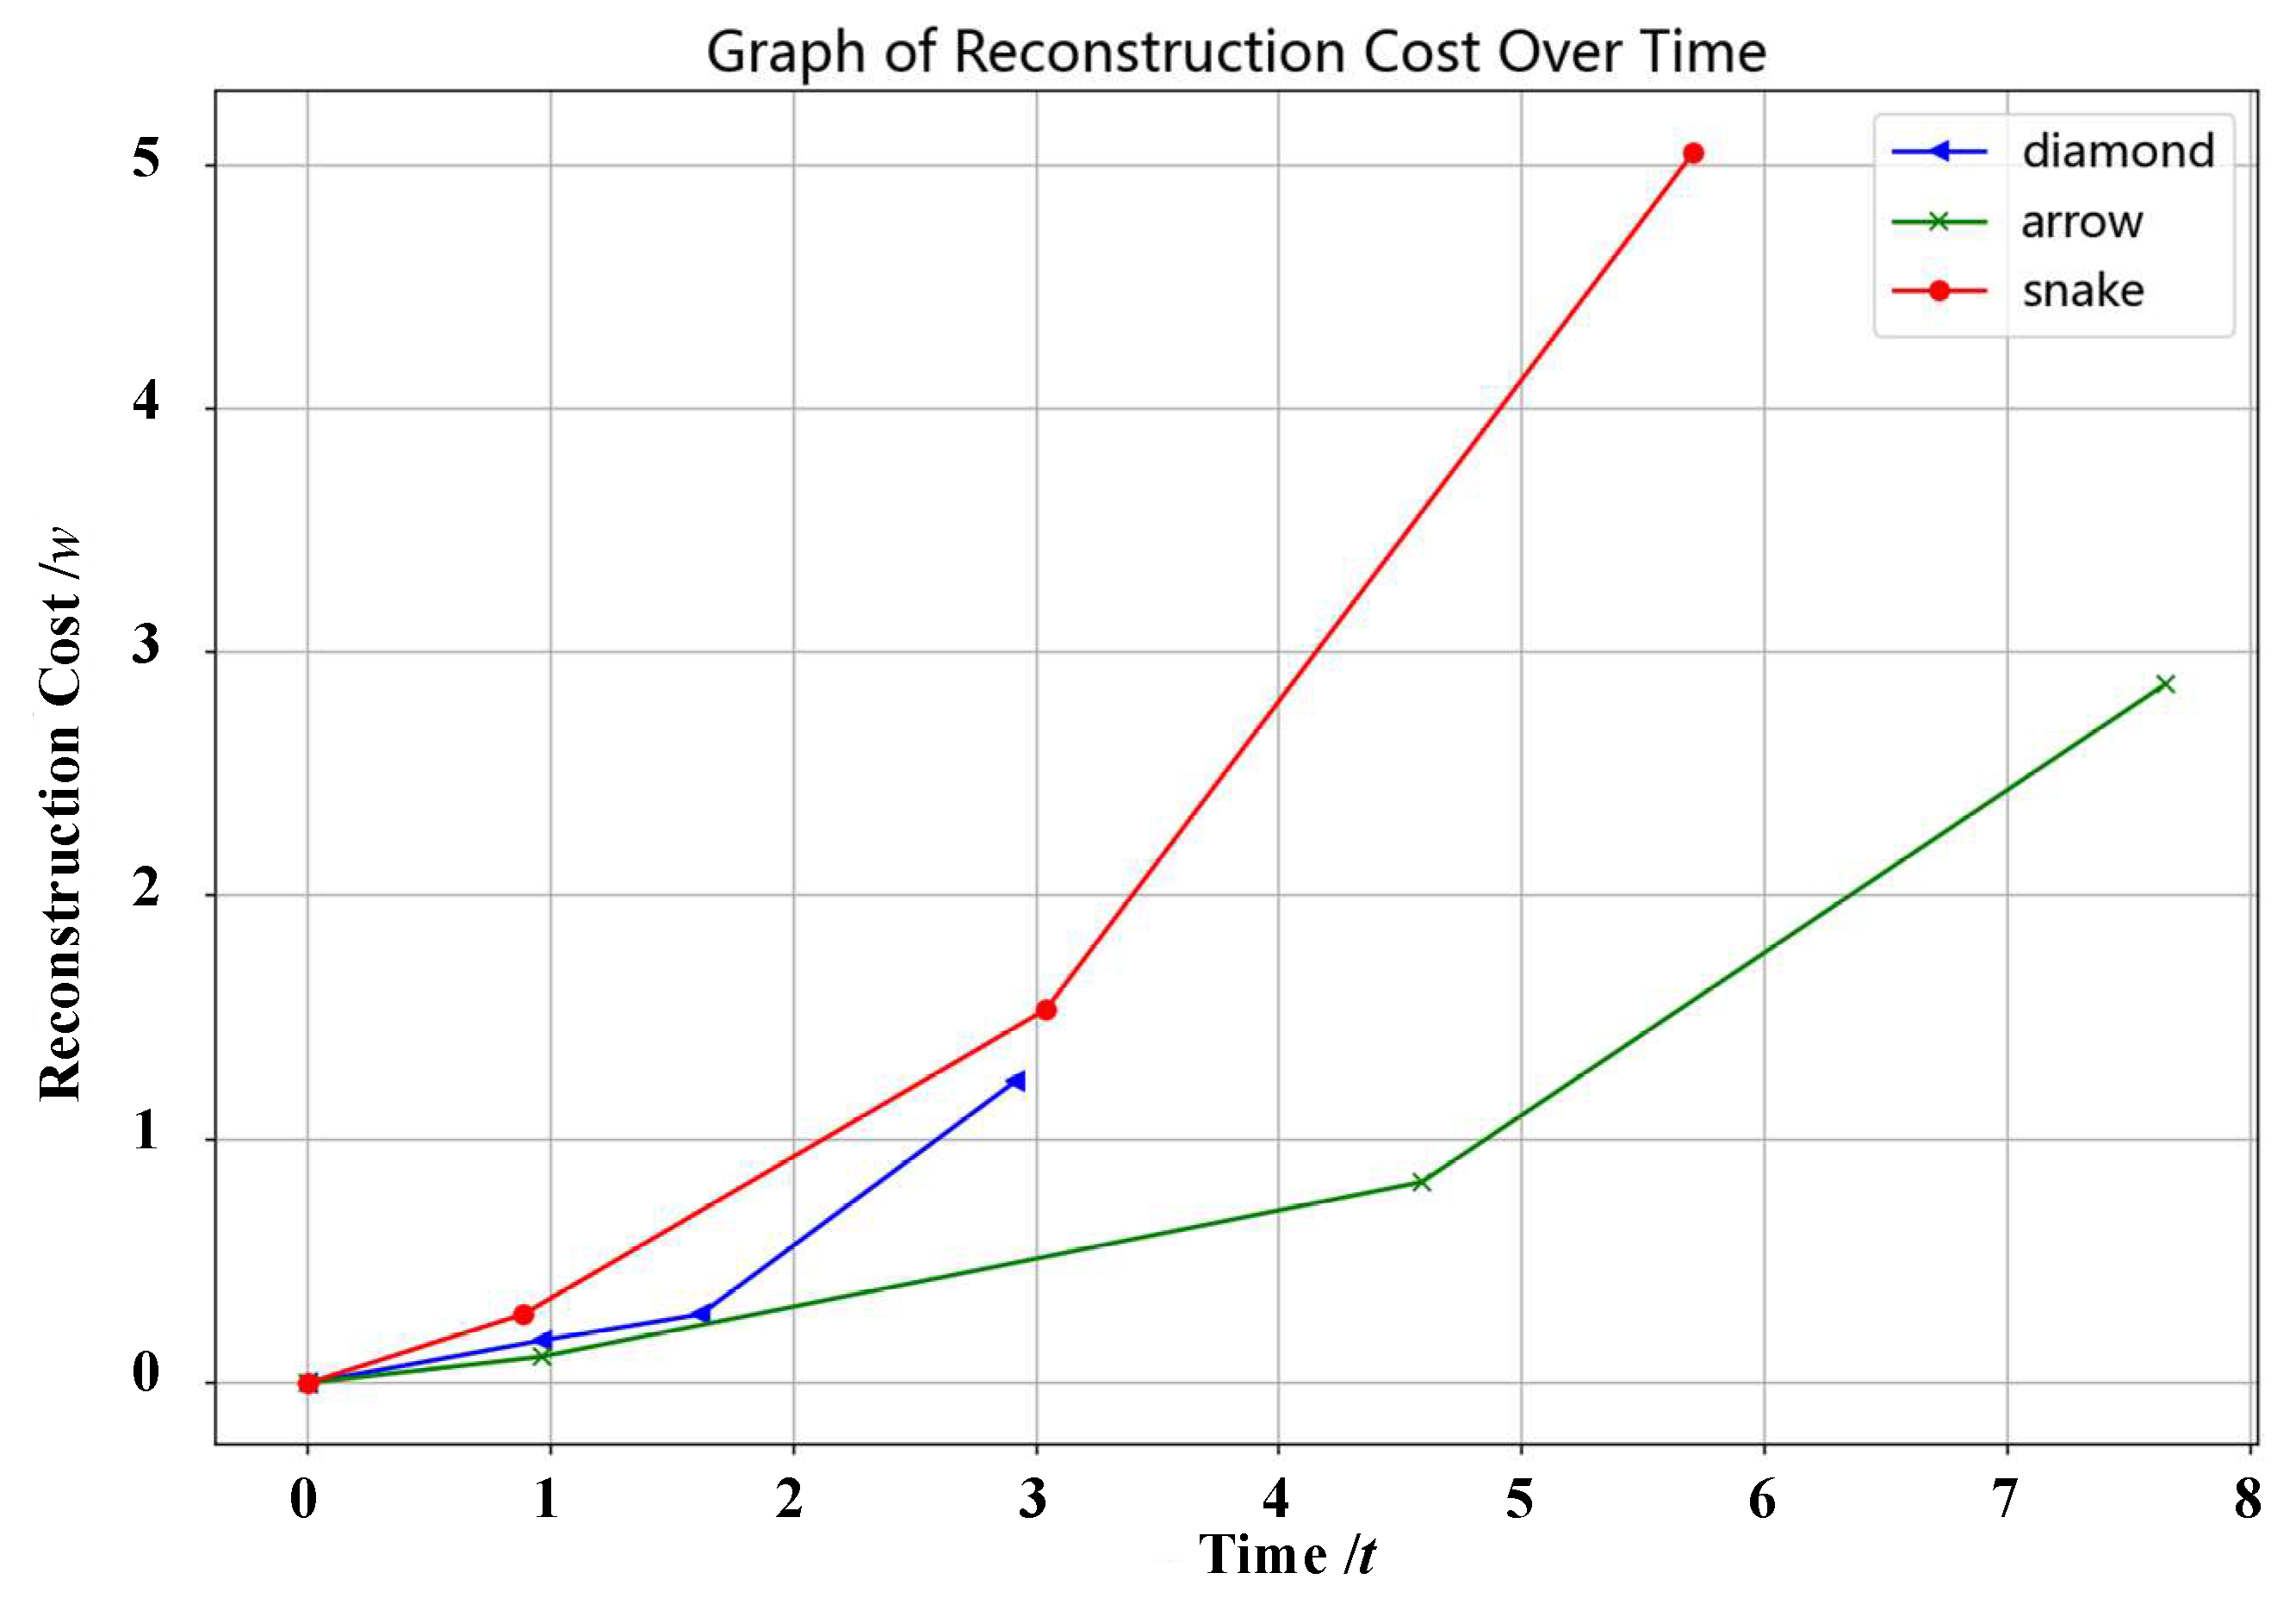

Table 1.
Algorithm process of simulation experiment.
| Algorithm Cluster configuration reconstruction | |
|---|---|
| Input: | Number of particles n; Particle position PL; Particle dimension d; Cluster speed vQ; Particle initial velocity v0, Renewal velocity v; Airspace scope A[(Xmin, Xmax), (Ymin, Ymax), (Zmin, Zmax)]; Population consumption coefficient η; |
| Output: | Particle position PL; Reconstructed particle velocity variation vt; |
| Step 1: | It randomly generates n particles in A; |
| Step 2: | Let n particles cluster to form 3 clusters; |
| Step 3: | The 3 clusters are distributed according to the triangular configuration in Figure 3, and the height of each UAV remains unchanged; |
| Step 4: | According to the reconstruction process in Figure 5 and the reconstruction model in Figure 6, particles are transferred to form group G4; |
| Step 5: | The reconstruction cost Wr was measured by calculating formula (11); |
| Step 6: | Similarly, the reconstruction costs Wa and Ws of triangular configuration to arrow and snake are measured respectively. |
Disclaimer/Publisher’s Note: The statements, opinions and data contained in all publications are solely those of the individual author(s) and contributor(s) and not of MDPI and/or the editor(s). MDPI and/or the editor(s) disclaim responsibility for any injury to people or property resulting from any ideas, methods, instructions or products referred to in the content. |
© 2024 by the authors. Licensee MDPI, Basel, Switzerland. This article is an open access article distributed under the terms and conditions of the Creative Commons Attribution (CC BY) license (http://creativecommons.org/licenses/by/4.0/).
Copyright: This open access article is published under a Creative Commons CC BY 4.0 license, which permit the free download, distribution, and reuse, provided that the author and preprint are cited in any reuse.


