Submitted:
14 February 2024
Posted:
15 February 2024
You are already at the latest version
Abstract
Assessment of health-related quality of life (HRQoL) after pediatric traumatic brain injury (TBI) has been limited in children and adolescents due to a lack of disease-specific instruments. To fill this gap, the Quality of Life after Traumatic Brain Injury for Children and Adolescents (QOLIBRI-KID/ADO) was developed for the German-speaking population. Reference values from a comparable general population are essential for comprehending the impact of TBI on health and well-being. This study examines the validity of the German QOLIBRI-KID/ADO in a general pediatric population in Germany and provides reference values for use in clinical practice. Overall, 1997 children and adolescents aged 8-17 years from the general population and 300 from the TBI population participated in the study. The questionnaire was tested for reliability and validity. A measurement invariance (MI) approach was used to assess the comparability of the HRQoL construct between both samples. Reference values were determined by percentile-based stratification according to factors that significantly influenced HRQoL in regression analyses. The QOLIBRI-KID/ADO demonstrated strong psychometric properties. The HRQoL construct was measured largely equivalently in both samples, and reference values could be provided. The QOLIBRI-KID/ADO was considered reliable and valid for assessing HRQoL in a general German-speaking pediatric population, allowing for clinically meaningful comparisons between general and TBI populations.
Keywords:
reference values
; general population
; patient-reported outcome measure (PROM)
; health-related quality of life
; children and adolescents
; traumatic brain injury
1. Introduction
Pediatric traumatic brain injury (TBI) is a serious and common injury in children and adolescents [1,2]. It can have a variety of short- and long-term consequences for affected individuals and their families [e.g., 3,4], moving from an acute injury to a chronic condition with far-reaching impacts on people’s lives [4]. For instance, children who have suffered a TBI may have impaired cognitive and executive functioning, and memory [5,6]. They are also at increased risk for developing mental health and behavioral problems, at both subclinical and clinical level [7]. In fact, experiencing a TBI during childhood increases the likelihood of psychosocial problems in adulthood [8]. A TBI can result in functional impairment [9], decreased mobility [10], and reduced health-related quality of life (HRQoL) in children and adolescents [11,12,13].
HRQoL can be defined as “[a] child’s goals expectations, standards or concerns about their overall health and health-related domains“ [14] (p. 2). Although there is no gold standard definition, the multidimensionality of the construct is a central component [15]. Usually it comprises physical, social, and psychosocial (including emotional and cognitive) domains [16].
HRQoL can be measured generically and disease-specifically. Generic instruments capture a broad spectrum of quality of life and health status. In addition, they can be applied to both healthy and diseased individuals, so that results are comparable within these groups. In contrast, disease-specific instruments capture specific problems or symptoms of a disease that a generic measure may neglect. Disease-specific measures are therefore only applicable to individuals with a specific condition and can be used to measure changes after treatment [15,17]. It has been shown that disease-specific generic instruments are preferable for various diseases [15,18] as well as specifically for TBI [19] when it comes to accurate differentiation of HRQoL. Thus far, the generic Pediatric Quality of Life Inventory (PedsQL) [20] has been the primary instrument used to assess pediatric HRQoL. Alternatives such as the Child Health Questionnaire (CHQ) [21], KINDL [22] or 36-Item Short Form Health Questionnaire (SF-36) [23] provide additional options, but likewise map generic HRQoL. Until now, there were no TBI-specific, self-reported HRQoL measures for children and adolescents [24]. This is a notable omission, as HRQoL following TBI is often impaired compared to normative data [11,12,25] or other health conditions such as cardiac or orthopedic conditions [26], as demonstrated by generic assessment measures.
For this reason, the Quality of Life after Brain Injury in Children and Adolescents (QOLIBRI-KID/ADO) [27] was developed. It is the first disease-specific pediatric patient-reported outcome measure (PROM) for this population. The QOLIBRI-KID/ADO comprises 35 items and was developed through a systematic iterative process that involved focus group interviews, international and national expert interviews, and Delphi panels [28]. It is intended for use by children and adolescents aged 8-17 years. The questionnaire is suitable for longitudinal evaluation due to its theoretical alignment with the adult version [29,30] and acquisition of the six-factor structure. The QOLIBRI-KID/ADO questionnaire comprises six scales, including Cognition, Self, Daily Life and Autonomy, Social Relationships, Emotions, and Physical Problems.
Assessing and interpreting HRQoL with a PROM can be challenging for patients and healthcare professionals alike [31]. Only clinical evaluation can determine whether a change in post-injury HRQoL compared to the general population is clinically relevant. Therefore, clinicians, researchers, and patients can benefit from using reference values [32]. The aim of this study is thus to provide these reference values using data from a German-speaking general pediatric population sample.
2. Materials and Methods
2.1. Study Design
Data for the pediatric general population sample were derived from an online panel-based, self-reported, cross-sectional study. The sample of children and adolescents after TBI used for the MI analyses was recruited cross-sectionally using self-report in a face-to-face interview (online or in person).
2.2. Participants
2.2.1. General Population Sample
The general population sample was recruited using the services of two marketing agencies (dynata and respondi; https://www.dynata.com and https://www.bilendi.co.uk, last access on 04.12.23). These agencies contacted adults with children between the ages of 8 and 17 during March and April 2022. The parents were provided with information about the data collection procedure including its purpose and privacy policy. Participation took place only after the adults provided their consent for the collection of sensitive health information for their children. Parents reported socio-demographic information, including whether their child had sustained a TBI or was currently experiencing a life-threatening illness. If either situation applied, the survey was terminated. If not, parents were asked to confirm their child’s presence. If the child was unavailable, the survey could be resumed at a later time. If the child was present, they were invited to take part and were referred to the pediatric questionnaires upon agreement. After finishing the questionnaire, parents were given compensation in the form of vouchers or tokens.
The survey was initiated by 5057 individuals, out of which 2164 completed it. Participants were excluded if they provided contradictory responses (one-sided responses regardless of the item polarity), completed the survey in under five minutes, provided inconsistent (e.g., selected a disease while reporting that they were completely healthy), unusable (e.g., cryptic comments), or no disease information (e.g., a comment in the text box without specifying a health condition). For further details, see Figure 1A.
2.2.2. TBI Sample
From April 2017 to January 2022, data were collected for the TBI sample at eleven hospitals in Germany. Study details and data collection were communicated to parents, children, and adolescents, who provided written informed consent. To be eligible for the study, participants had to be between 8 and 17 years of age, diagnosed with TBI (at least 3 months and no more than 10 years after injury), have their TBI severity assessed by the Glasgow Coma Scale (GCS) [33] or clinical description of severity, be an outpatient or beginning inpatient discharge, and have the ability to comprehend and respond to questions.
Epilepsy prior to the TBI, spinal cord injury, persistent vegetative state (i.e., minimal consciousness by GCS), severe premorbid mental disorder (such as psychosis or autism), terminal disease, or very severe polytrauma (as evaluated by the examiner) led to exclusion from the study. Approximately 5000 eligible families were contacted, and 300 children and adolescents were included in the final study sample. For more details, see Figure 1B.
2.3. Ethical Approval
Both studies were conducted in compliance with German laws and regulations as well as the ICH Harmonized Tripartite Guideline for Good Clinical Practice (“ICH GCP”) and the World Medical Association Declaration of Helsinki Ethical Principles for Medical Research Involving Human Subjects”). Participants and/or legal guardians obtained informed consent according to the German General Data Protection Regulation (GDPR). The Ethics Committee of the University Medical Center Goettingen approved the study (application no. 19/4/18).
2.4. Materials
2.4.1. Sociodemographic and Health-Related Data
The study collected socio-demographic information including age, gender, and (parental) education level. Furthermore, the parents of the children included in the general population sample were asked to provide details concerning their children’s health status. The health status consisted of nine categories, including disorders of the central nervous system, abuse of alcohol and/or psychotropic drugs, active or uncontrolled systemic diseases, psychiatric disorders, severe sensory deficits, use of psychotropic or other medications, intellectual disabilities or other neurobehavioral disorders, pre-/peri-/postnatal problems, as well as other issues. If one category was selected, the child was considered to have at least one chronic condition.
Clinical data on TBI severity, time since TBI, and functional recovery/disability were collected in the TBI sample. The King’s Outcome Scale for Childhood (KOSCHI) [34] was utilized to determine the functional recovery/disability at testing time, covering the following categories: intact recovery (5b), good recovery (5a), upper moderate disability (4b), lower moderate disability (4a), upper severe disability (3b), lower severe disability (3a).
2.4.2. Quality of Life after Brain Injury in Children and Adolescents (QOLIBRI-KID/ADO)
The QOLIBRI-KID/ADO is a PROM designed to assess TBI-specific HRQoL in children and adolescents between the ages of 8 and 17. The questionnaire comprises 35 items, which respondents answer using a five-point Likert-type scale (“Not at all” = 1, “Slightly” = 2, “Moderately” = 3, “Quite” = 4, “Very” = 5). It covers the following domains: Cognition, Self, Daily Life and Autonomy, Social Relationships, Emotions, and Physical Problems. The first four scales measure satisfaction (“How satisfied are you...?”), the last two scales measure feelings of being bothered (“How bothered are you by...?”). To ensure consistent interpretation, the items of these last two scales are inversely recoded. The scale scores and the total score are converted linearly to a 0–100 scale, with higher values corresponding to better HRQoL. For the items to be relevant to the general population, the instructions and items with TBI-specific content were modified. Detailed information on the modified wording can be found in Appendix A – Table A1.
2.4. Statistical Analyses
2.4.1. Descriptive Statistics, Reliability, and Differential Item Functioning Analyses
Descriptive statistics were calculated, including the mean, standard deviation, and skewness. Skewness was determined to be symmetric (≤ |0.5|), moderate (|0.5| < x ≤ |1|), or high (> |1|) [35]. Internal consistency was evaluated using Cronbach’s α at both the scale and total score levels. Additionally, McDonald’s ω was calculated for the scales and the total score. A Cronbach’s α value between 0.7 and 0.95 was considered good [36], while a McDonald’s ω value above 0.8 was deemed to be good [37]. Corrected-item-total-correlations (CITC) were computed, and items with values exceeding 0.4 were considered consistent [38].
Differential item functioning (DIF) using logistic ordinal regression approach combined with item response theory (LORDIF) was conducted to examine the appropriateness of aggregating data from children and adolescents from the general population. A second DIF analysis was performed to gain a better understanding of potential item-level differences between the TBI and general population samples. For this purpose, two LORDIF models were compared for each item: one including only the level of the latent trait (i.e., item-level HRQoL), and another including the level of the latent trait, age category (for aggregation of age, i.e., children vs. adolescents) or sample type (for sample differences, i.e., TBI vs. general population), and the interaction of both variables (HRQoL*age category or HRQoL*sample type). DIF was considered absent if a non-significant difference (p > 0.01) was found and the associated effect size (McFadden’s pseudo R2) was small (R2 < 0.05) [39]. In cases where DIF was not present, responses were treated as independent of age and sample type.
2.4.2. Construct Validity of QOLIBRI-KID/ADO in the General Population Sample
The factorial structure was assessed using confirmatory factor analysis (CFA) with a robust weighted least squares estimator for ordinal data. A six-factor model was examined. To assess model goodness of fit, we utilized the following fit indices (desired values are in parentheses): χ2 value (p > 0.05), ratio of χ2 value and degrees of freedom (χ2/df ≤ 2) [40], comparative fit index (CFI ≥ 0.95) [41], Tucker-Lewis index (TLI ≥ 0.95) [41], root mean square error of approximation (close to excellent fit RMSEA < 0.05; moderate fit 0.05 ≤ RMSEA < 0.10) [42,43] with 90% confidence interval (CI90%), and standardized root mean square residual (SRMR < 0.08) [41]. Scaled χ2-based fit indices were reported (i.e., CFI, TLI, and RMSEA) to ensure robustness of the results. All indices were considered simultaneously, as the cut-offs for the ordinal data should be interpreted with caution [44].
We conducted multiple linear regressions to assess construct validity and identify potential confounders for later stratification of reference values. The QOLIBRI-KID/ADO was utilized as the outcome measure. Sex, age, and health status were treated as covariates, including all possible second-order interactions (such as sex × age and sex × health status). The total score was tested with a significance level of 5% and the scales were tested with a Bonferroni correction (i.e., 5%/6 = 0.8%).
2.4.3. Measurement Invariance Across Samples
We conducted a multi-group CFA for ordinal categorical outcomes according to Wu and Estabrook [45], revised by Svetina, Rutkowski, and Rutkowski [46], to test whether the measured construct of HRQoL was the same in the general population sample and the TBI sample. Due to missing responses in the low categories for two items (Orientation, Accomplishment) in the TBI sample, the response categories “Not at all” and “Slightly” were combined into one in both samples to allow for MI measurement.
Three models were estimated with increasingly more restricted parameters [46]: first, we estimated a baseline model without any restrictions; second, we restricted the model for equal thresholds across samples; and finally, we added the restriction for equal loadings. Differences were tested using the scaled χ2 difference test with between-model cutoffs. As between-model cut-offs ∆CFI (< 0.01) [47] and ∆RMSEA (≤ 0.01) [48] were used. We assumed equivalent models if the χ2 difference test was non-significant (p > 0.05) and ∆CFI and ∆RMSEA below the cut-offs.
Further analyses were carried out to compare the measurement of the construct between the two samples in cases where the invariance assumption was violated. We compared thresholds between the general population and the TBI sample for significant models, with minimal differences indicated if they did not exceed 5% [49,50]. Additionally, we compared the item factor loadings across the samples.
2.4.4. Reference Values from the General Population Sample
Percentiles, which indicate the threshold below which a certain percentage of observations fall, were used to determine the reference values. The provided data includes percentiles at 2.5%, 5%, 16%, 30%, 40%, 50%, 60%, 70%, 85%, 95%, and 97.5%. Values one standard deviation below the reference mean, which corresponds to the 16th percentile for normally distributed data, were deemed clinically relevant.
2.4.5. Software
3. Results
3.1. Sociodemographic and Health-Related Data
3.1.1. General Population Sample
The study included 1997 children (52.4%) and adolescents (47.6%) from the general population. The average age of the participants was 12.4 years (SD = 2.85), with a balanced sex ratio (50.4% male). Most children and adolescents attended preparatory high school (29.6%), primary school (27.8%), or secondary school (26.7%). Approximately 12.5% of the children and adolescents had at least one chronic health condition. For details of the demographic information, see Table 1.
Of those with a chronic health condition, the majority had only one (11%), with a maximum of three (0.2%). “Other” (4.9%), “intellectual disabilities or other neurobehavioral disorders” (4.7%) and “psychiatric disorders” (2.2%) were the most commonly reported categories.
3.1.2. TBI Sample
A total of 300 children (50.7%) and adolescents (49.3%) who experienced TBI were included in the analyses. The majority were males (59.3%) and had suffered a mild TBI (71.7%) 4.51 (SD = 2.78) years prior to study enrollment. Most of them achieved a good level of recovery (89.6%; KOSCHI scores of 5a and 5b). Please refer to Appendix A – Table A2 for further details.
3.2. Descriptive Statistics, Reliability, and Differential Item Functioning Analyses
The average QOLIBRI-KID/ADO total score for the children and adolescents in the general population sample yielded 73.0 (SD = 13.5), which exhibited symmetry (S = -0.38). All items were moderately skewed to the left with a mean skewness of M = 0.74 (SD = 0.31) and a range of -0.27 to -1.74. The internal consistency of the QOLIBRI-KID/ADO total score for the general population sample was excellent, as demonstrated by Cronbach’s α (0.94) and McDonald’s ω (0.95). Alpha coefficients for the scales ranged from 0.80 to 0.86, and McDonald’s ω coefficients were between 0.83 to 0.90. Excluding none of the items improved the Cronbach’s α of a scale. The CITC value for all items was above 0.4, except for item Orientation, which was already below 0.4 for the TBI version with the CITC [27]. Table 2 presents detailed psychometric properties.
The DIF analyses between children and adolescents in the general population sample yielded statistically significant results (p < 0.01) for approximately half of the items. These items include Decision between two, Accomplishment, Daily independence, Getting out and about, Manage at school, Decision making, Support from others, Ability to move, Open up to others, Relationship with friends, Attitudes of others, and Clumsiness. However, none of the items had a McFadden’s R2 value greater than 0.05. This suggests that the effects were minimal and can be considered negligible. Thus, analyzing aggregated data was considered appropriate. For further information on the DIF analyses results, refer to Appendix A - Table A3.
DIF analyses revealed significant differences (p < 0.01) between the TBI and general population samples in most items, including Talking to others, Remembering, Decision-making, Orientation, Accomplishment, Appearance, Self-esteem, Future, Daily independence, Getting out and about, Managing at school, Social activities, Ability to move, Family relationships, Friendships, Loneliness, Clumsiness, Other injuries, Headaches, Pain, and Seeing/Hearing, as well as Life changes. However, most of the McFadden’s R2 values for the significant items were less than 0.01, indicating that these differences are negligible. Exceptions were found for the items Accomplishment, Appearance, Daily Independence, Family Relationship, and Other Injuries items, but even in these cases, McFadden’s R2 did not exceed 0.05, suggesting that the differences were again negligible. Overall, the samples can be considered comparable, allowing for direct item comparison. See Appendix A – Table A4 for more detailed information.
3.3. Construct Validity of QOLIBRI-KID/ADO in the General Population Sample
Results of the CFA were satisfactory for the six-factor structure: χ2(545) = 4500.654, p < 0.001, χ2/df = 8.258, CFI = 0.929, TLI = 0.922, RMSEA[90% CI] = 0.060[0.059; 0.062]; SRMR = 0.051. All values met the required cut-offs, except for the χ2 value and the ratio of the χ2 value and degrees of freedom.
Regression analysis showed that gender (β = 1.17, t(1992) = 1.98, p = 0.047) and health status (β = 9.10, t(1992) = 10.17, p < 0.001) had significant effects on the QOLIBRI-KID/ADO total score. Results indicated that children and adolescents with a chronic health condition had lower HRQoL compared to those without, while male gender was associated with higher HRQoL compared to female gender. Similar results were found across all scales with statistically significant findings for the influence of health status (p < 0.001). Gender did not have a significant effect on the scales, except for the Emotions scale (β = 4.22, t(1992) = 3.95, p < 0.001). A second-order regression analysis revealed a significant interaction between age and gender in the total score (β = 3.76, t (1988) = 3.19, p = 0.001). Among the scales, a significant interaction was found only for the Emotions (β = 7.61, t(1988) = 3.57, p < 0.001) and Physical Problems scales (β = 6.73, t(1992) = 3.08, p = 0.002). Further examination of the models for the total score are shown in Table 3. Details on the scales can be found in Appendix A – Table A5 and Table A6. These results suggest that when providing reference values, it is important to separate them by age, gender, and presence of chronic health conditions.
3.4. Measurement Invariance Across Samples
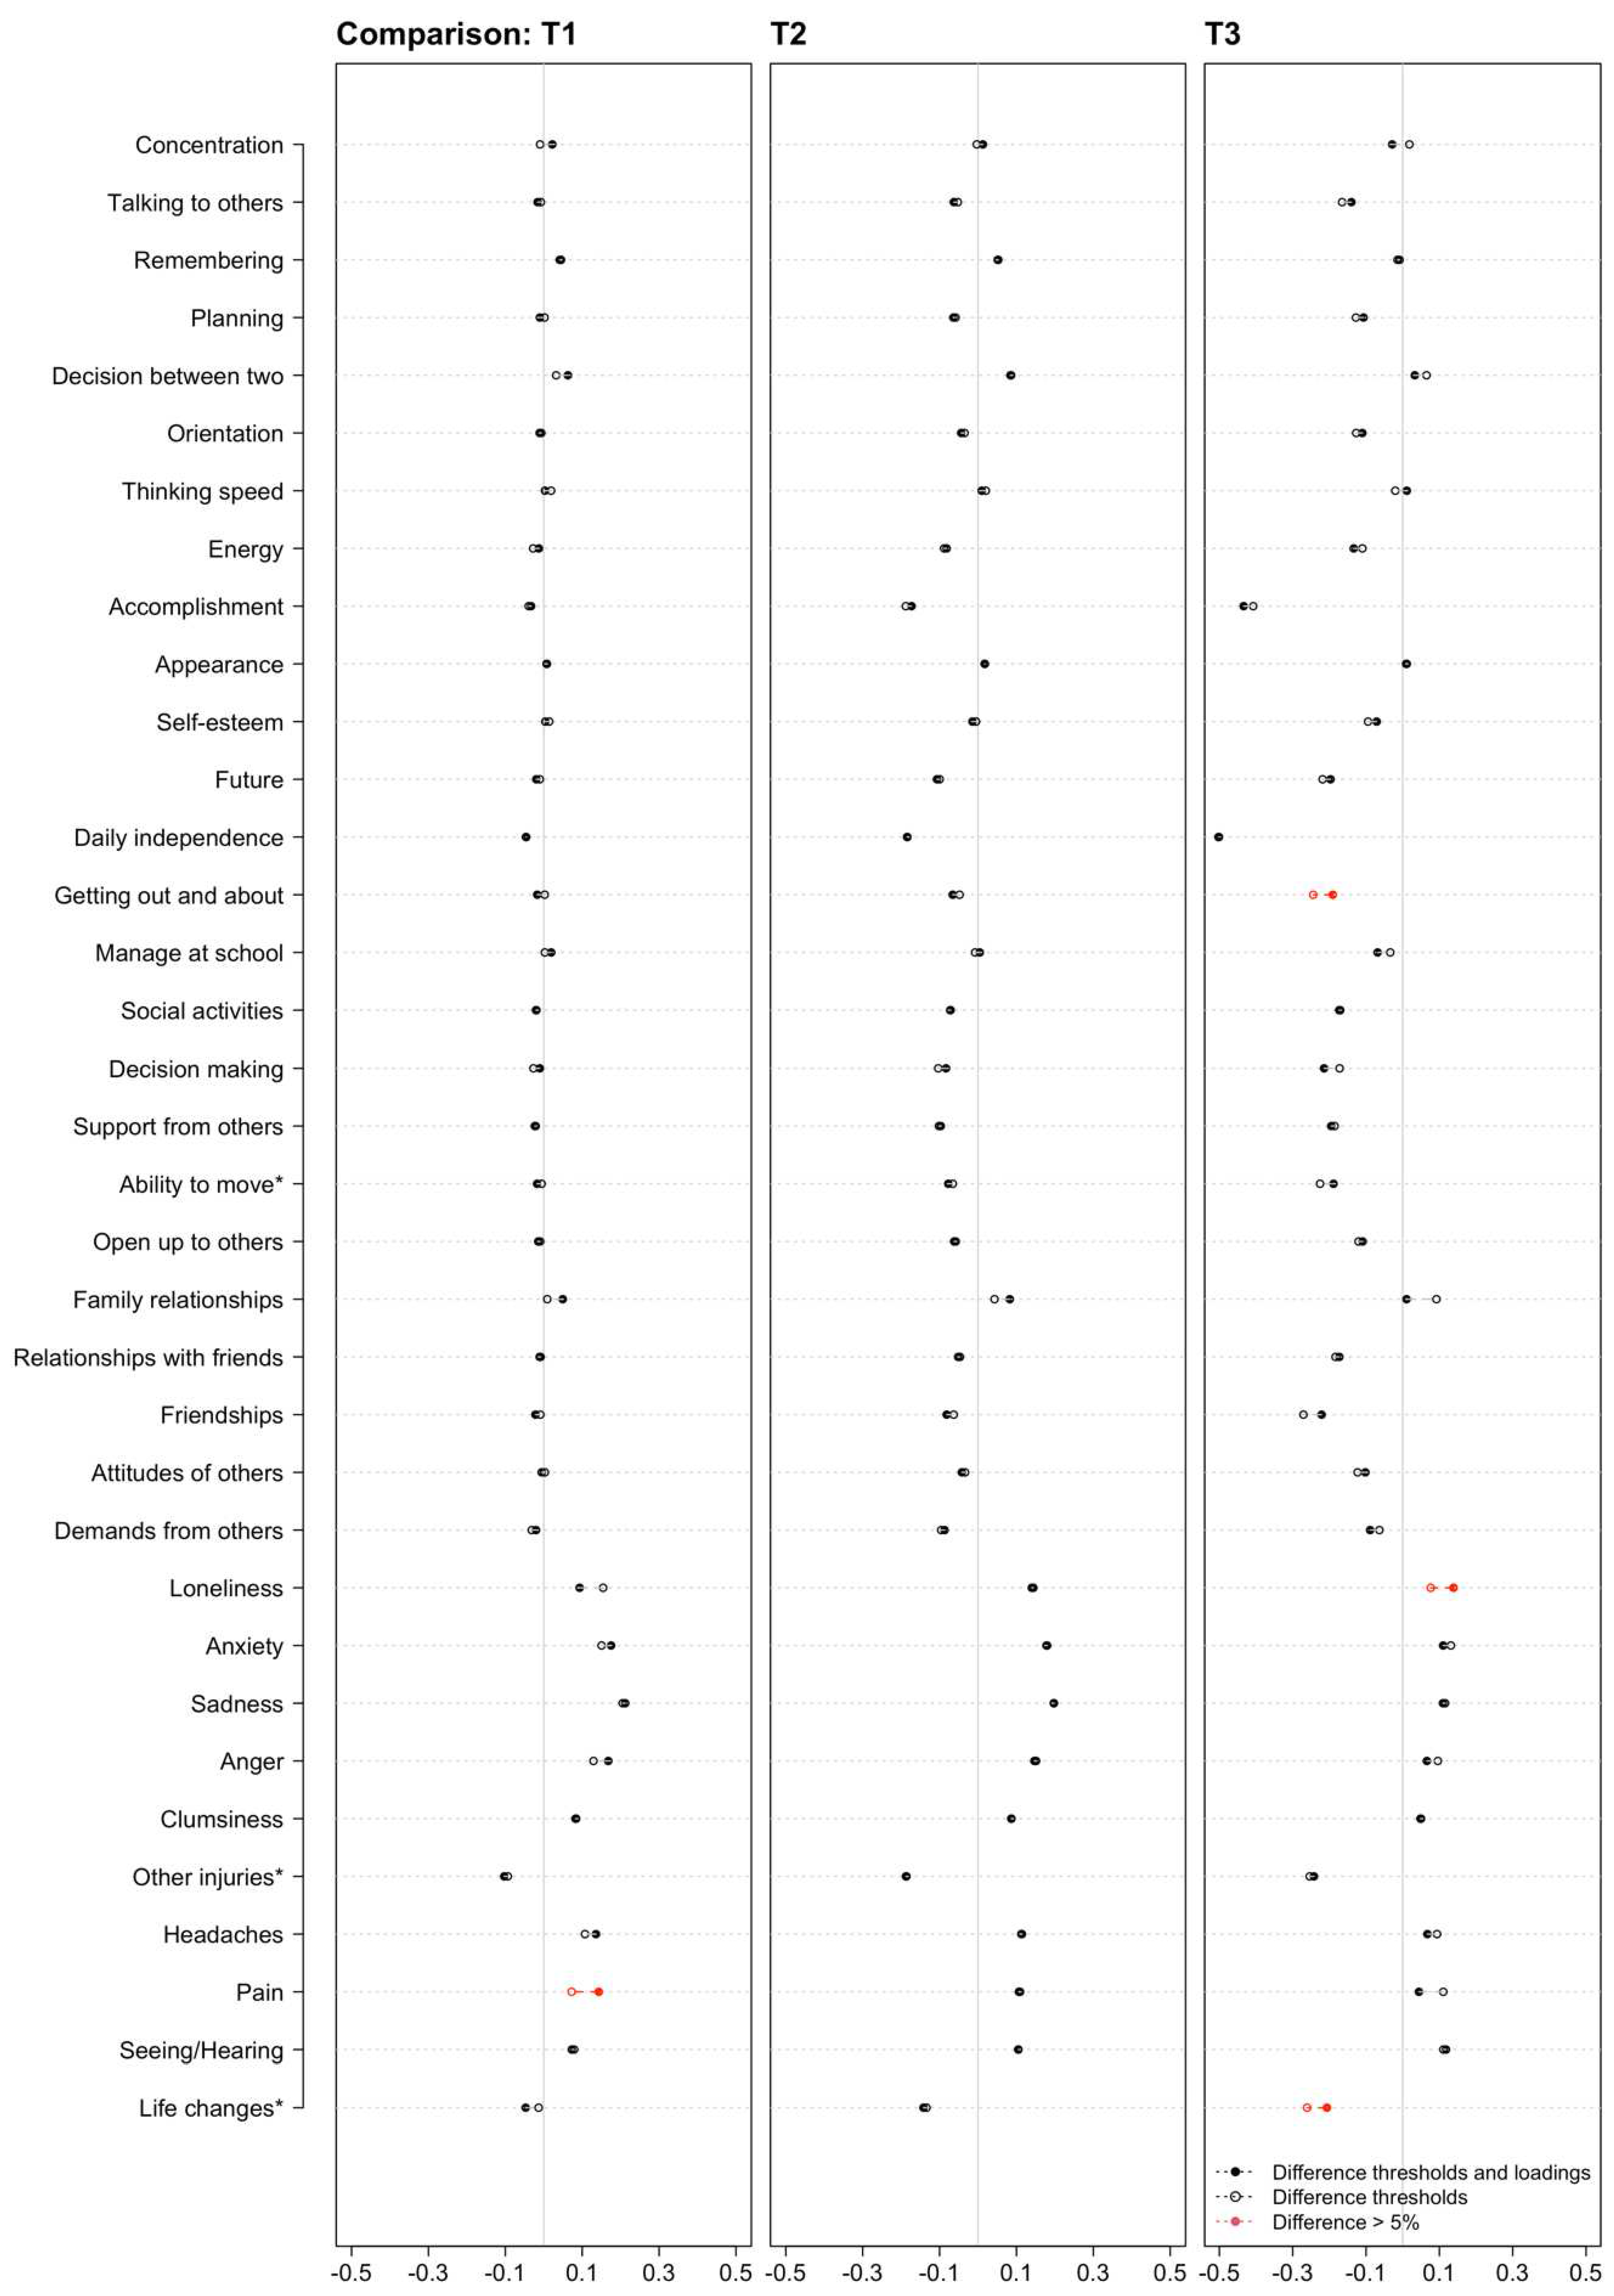
The baseline and thresholds models did not differ significantly between the TBI sample and the general population sample (ΔCFI<0.01, ΔRMSEA = 0.001, p = 0.064). However, there was a significant difference between the thresholds and the thresholds and loadings model (ΔCFI = - 0.002, ΔRMSEA = -0.002, p < 0.001) (Table 4). As such, this implies that the models are not equivalent and that variations in the QOLIBRI-KID/ADO score cannot be attributed to “true” construct differences [55]. However, a closer examination of the differences in thresholds between the two significant models in the two samples showed that most of the differences were less than 5% (see Appendix - Figure A1). Figure 2 shows the differences in the factor loadings between the two models. For most of the items, the confidence intervals of the factor loadings overlapped and followed a similar pattern. The exceptions were Concentration, Remembering, Planning (only for thresholds and loadings model), Appearance, Daily independence, Manage at school, Decision making, Family relationship, Attitudes of others (only for thresholds and loadings model), Anxiety, Sadness, Anger, Other injuries, Headaches, Pain and Life changes (only for thresholds and loadings model). Under these circumstances and considering the cut-off values of the ΔCFI and ΔRMSEA, it can be concluded that the construct of HRQoL is largely comparable in both groups.
3.5. Reference Values from the General Population Sample
Although our regression analyses showed that chronic health conditions have an impact on HRQoL, we cannot provide separate reference values for individuals from this subgroup due to the small sample size compared to healthy subjects. In Table 5, we present the reference values for the QOLIBRI-KID/ADO total score for the general pediatric population in good health (i.e., without any chronic health conditions, representing an ideal health norm). The interpretation can be performed as follows: Assuming a total score of 83 on the QOLIBRI-KID/ADO for a 15-years-old male post-TBI patient, his score falls within the 70% and 85% percentiles compared to a general population sample. Therefore, the patient’s HRQoL is within the average range and is not clinically relevant. In conclusion, the patient’s health and well-being do not appear to be a cause for concern. The scale scores can be treated uniformly. In this instance, it may be beneficial to examine a particular symptom domain, such as cognitive or emotional, for clinical significance to better narrow down potential areas of concern.
Alternatively, a threshold of one standard deviation below the mean can be utilized to identify clinically significant low HRQoL. For scores falling below this threshold, seeking further diagnosis and treatment is indicated. Participants from the general pediatric population are less inclined to report such a HRQoL. For a male adolescent, critical HRQoL can identified with a cut-off value of 64 for the total score, while for the Cognition scale, it is 61, for the Self scale it is 60, for the Daily Life and Autonomy scale it is 68, for the Social Relationships scale it is 62, for the Emotions scale it is 50, for the Physical Problems scale it is 46, and so on. An interactive web application for the reference values tables is available at https://reference-values.shinyapps.io/Tables_Reference_values/ (tab “QOLIBRI-KID/ADO”, last access 04.12.23).
4. Discussion
The aim of this study was to provide reference values for the QOLIBRI-KID/ADO obtained from a German-speaking general population of children and adolescents. For this purpose, we examined the psychometric properties, including reliability, factorial and construct validity. We carried out MI analyses to compare the assessment of HRQoL between the general population and the TBI samples. The QOLIBRI-KID/ADO represents the first TBI-specific pediatric PROM developed to measure HRQoL in children and adolescents after TBI. We adjusted TBI-related content to suit the general population of children and adolescents and found that the QOLIBRI-KID/ADO is a reliable and valid instrument for evaluating the HRQoL. MI analyses revealed that HRQoL is assessed similarly in both the general and TBI samples, with minor limitations, enabling fair score comparisons. We present reference values stratified by age and gender. The analyses suggest that QOLIBRI-KID/ADO can be applied to the general pediatric population to provide reference values for research and clinical practice, but further research and discussion is needed to address certain issues.
Although DIF analyses revealed significant differences for the age groups, these differences can be considered negligible due to very small effect sizes. Thus, the questionnaire is applicable to children and adolescents as Steinbuechel et al. [27] found for the TBI version of the QOLIBRI-KID/ADO. They also found a slightly larger effect for the item Daily independence, which was still considered a small effect requiring no further differentiation between children and adolescents. DIF analyses between the samples revealed small significant effects for the items Accomplishment, Appearance, Daily independence, Family relationship and Other injuries. The small effects in these items could be due to variety of reasons. A meta-analysis found that children and adolescents with various chronic diseases had a lower body image than healthy peers [56]. Although the body image was more negatively distorted for conditions that affect physical appearance (e.g., obesity, scoliosis), less positive body image was also found for almost invisible conditions such as diabetes. Given that a TBI is a chronic condition, it is likely that the body image of TBI patients will be lower than that of the general population. The limited impact on HRQoL may be attributed to the mild TBI of the majority of study participants. They typically experience fewer or less severe symptoms of TBI [57] and, as a result, presumably undergo fewer changes in their appearance. As previous literature has shown [3,4], a TBI affects not only the individual, but also the family. General worry was common among families, and they reported interference with daily routines and/or concentration [3], especially when healthcare needs were not covered. Additionally, the severity of the TBI was positively associated with limitations in daily routines: The greater the severity, the more families demonstrated a disruption in their daily routines. Interference was found to be correlated with a decrease in PedsQL scores. Although this study only investigated family burden up to one year after TBI, it suggests that these factors should be recognized as early as possible to avoid long-term burden on the family. Therefore, changes in family dynamics may affect the child’s HRQoL years later because the child has been confronted with a serious illness. This, in turn, may impact satisfaction with daily independence and functioning, including accomplishment. Finally, it is possible that children and adolescents in the general population did not suffer any (other) injuries or that they were so minimal that they did not affect HRQoL. Taken together, this may explain the different response behavior between the two samples for these items. However, given that the effects were negligible according to the pseudo-R2 cutoff, DIF between the two samples can be considered absent.
The regression analyses revealed similar factors influencing the total HRQoL score as in the previous literature [e.g., 58,59]. In the current study, the total HRQoL decreases with age and this decrease is greater in girls than in boys. There are studies investigating HRQoL that observe an interaction between age and gender [58,60], but the evidence on the influence of age and/or gender seems to be inconsistent. Looking more closely at the significant interactions, the overall finding is a decreasing HRQoL, with a greater decrease for girls than for boys, although this differs for the individual scales. For example, Baumgarten et al. [60] found that in a representative German sample, younger boys experience worse HRQoL in terms of social support and school environment compared to girls. However, these differences become less significant over time. Additionally, girls tend to have lower HRQoL in adulthood on the Physical Well-Being, Psychological Well-Being, and Parents Relation & Autonomy scales, which is consistent with the general trend of lower HRQoL for girls. Ravens-Sieberer et al. [61] found comparable results in a sample of 13 European countries. Bisegger et al. [62] analyzed seven European countries and found no significant effect of age or gender on HRQoL regarding social support and peers. They also found no significant effect of gender on HRQoL related to school environment and no significant difference on HRQoL related to psychological well-being. Therefore, the results for the interaction of age and gender on HRQoL are mixed and it is difficult to draw consistent conclusions, especially because of the different age groups analyzed in the research studies and the different instruments used to measure HRQoL.
Additionally, existing chronic health conditions like allergies or asthma negatively affect HRQoL. Previous research has demonstrated this phenomenon for numerous chronic health conditions [e.g., 59, 60] and following TBI [11,12,25]. Given these results, a stratification of the reference values by age, gender, and chronic health status seems indicated. We could not provide separated reference values for children and adolescents with chronic health conditions due to the small sample size compared to the sample size of individuals without chronic health conditions. Further research should focus on providing reference values for individuals with chronic health conditions, as chronic conditions become more prevalent in the pediatric population [63,64].
The MI analysis revealed significant findings, indicating that variances in HRQoL between the TBI sample and the general population sample arise from dissimilar compositions or evaluations of the construct [55]. The χ2 difference test analysis revealed the significant result. Here, it is recognized that the χ2 difference test has a high sensitivity to large sample sizes and may identify non-significant equivalence differences with little practical significance [65]. Further analyses were conducted to assess the significance of the variances. The approximated probabilities of selecting a particular response category revealed minimal differences of less than 5% between groups in almost all cases, rendering them negligible. This method and conclusion have previously been implemented in adult general population samples of the QOLIBRI in the United Kingdom [66], the Netherlands [66], and Italy [67]. Moreover, the factor loadings demonstrated a comparable pattern for both groups. After considering the cut-off values of the fit indices for the MI analyses (i.e., ΔCFI and ΔRMSEA) and the results of the DIF analyses, it was determined that the construct was perceived similarly in both groups with minor differences. As a result, different aspects of HRQoL can be assessed and compared between both samples.
4.1. Strengths and Limitations
The study aims to address the lack of research on disease-specific assessment of HRQoL following TBI. Another notable strength of this study is the validation of the QOLIBRI-KID/ADO in a large general pediatric population sample. This enables the provision of reference values and promotes a better understanding of the limitations, or lack thereof, of HRQoL after TBI in children and adolescents. This can be useful in both research and clinical settings.
However, some limitations should be mentioned. The survey was conducted online through a panel where the parents of the children and adolescents from general population in Germany were contacted, introducing the possibility of selection bias towards more privileged social groups [68] who are more likely to participate in online studies [69]. It is possible to question the legitimacy of the data obtained by incentivizing participants with a reward after study completion. An attempt was made to mitigate selection bias by using two different research firms on different platforms. However, the extent of bias remains unknown. The agencies involved did not provide information on invitees and non-participants, rendering a drop-out analysis impossible. Moreover, data collection and verification cannot be monitored [70]. The sample of individuals after TBI utilized in calculating the MI analyses was gathered concurrently with questionnaire development, resulting in a higher number of items than the final questionnaire administered to the general population sample. This could potentially affect the findings. Furthermore, the TBI sample may have been biased due to the low response rate, as discussed earlier [27]. Furthermore, it was comparatively small in relation to the general population sample and not all response categories were utilized. To account for the lack of responses in the TBI sample, the two lowest categories (“Not at all” & “Slightly”) were collapsed prior to conducting MI analyses. Collapsing response categories may lead to lower scale reliability and artificially improve model fit [71]. Despite this, response categories were only modified to ensure consistency in the number of response categories used in both samples and enable MI analyses between samples. Further research involving for MI analyses using the full five-point scale, is therefore recommended.
5. Conclusions
The QOLIBRI-KID/ADO is a valid tool for evaluating disease-specific HRQoL in children and adolescents after TBI. An adapted version of the instrument is applicable to the pediatric population, allowing for meaningful comparisons between children and adolescents with and without TBI and serving as a reference for interpretation of QOLIBRI-KID/ADO scores. The use of reference values in the clinical practice can improve the assessment of disease-specific HRQoL and the evaluation of children and adolescents with TBI. Future research should focus on developing reference values for the general German pediatric population affected by chronic health conditions.
Supplementary Materials
none.
Author Contributions
Conceptualization, L.K. and M.Z.; methodology, L.K. and M.Z.; software, L.K.; formal analysis, L.K.; investigation, N.v.S., K.C., I.K.K.; data curation, L.K. and M.Z.; writing—original draft preparation, L.K.; writing—review and editing, M.Z., K.C., Y.H., N.v.S., A.B., I.K.K.; visualization, L.K.; supervision, M.Z.; project administration, M.Z., K.C., N.v.S.; funding acquisition, M.Z. and N.v.S. All authors have read and agreed to the published version of the manuscript.
Funding
The TBI sample research (principal investigator: NvS) was funded by Dr. Senckenbergische Stiftung/Clementine Kinderhospital Dr. Christ’sche Stiftungen (Germany), and Uniscientia Stiftung (Switzerland). The general population sample research (principal investigator: MZ) was funded by Dr. Senckenbergische Stiftung/Clementine Kinderhospital Dr. Christ’sche Stiftungen (Germany).
Institutional Review Board Statement
The study was conducted in accordance with all relevant laws of Germany, including but not limited to the ICH Harmonized Tripartite Guideline for Good Clinical Practice (ICH GCP) and the World Medical Association Declaration of Helsinki (“Ethical Principles for Medical Research Involving Human Subjects”). The study attained ethical clearance at each recruitment center and obtained the informed consent of all participants in accordance with the German law for data protection (General Data Protection Regulation, GDPR). The Ethics Committee of the University Medical Center in Goettingen approved the study (application no. 19/4/18).
Informed Consent Statement
Informed consent was obtained from all participants involved in the study.
Data Availability Statement
The data presented in this study are available upon request from the corresponding author. Data are not publicly available for privacy reasons. R scripts are available from GitHub https://github.com/mzeldovich/Project-Reference-values. The R-Shiny application with reference values is available at https://reference-values.shinyapps.io/Tables_Reference_values/ (tab QOLIBRI-KID/ADO; last access on 04.12.23).
Acknowledgments
We are grateful to all the investigators and our study participants for helping us in our efforts to improve care and outcomes after pediatric TBI. In particular, we would like to thank all of the investigators who have made it possible to collect data from children and adolescents after TBI used in the comparative analyses: Mattea Ausmeier, Agnes Berghuber, Rieke Boeddeker, Hanna Boenitz, Elena Bonke, Lea Busch, Helena Duewel, Meike Engelbrecht, Nicole Fabri, Anastasia Gorbunova, Shaghayegh Gorji, Louisa Harmsen, Korbinian Heinrich, Sophia Hierlmayer, Stefan Hillmann, Leonard B.Jung, Alexander Kaiser, Sina Kantelhardt, Hanna Klaeger, Maximilian Kluge, Celine Koenig, Lena Kuschel, Clara Lamersdorff, Louisa Lohrberg, Katja Lorenz, Johann de Maeyer, Isabelle Mueller, Philine Mueller, Sophia Mueller, Benjamin Nast-Kolb, Carl JannesNeuse, Lara Pankatz, Johanna von Petersdorff, Jonas Pietersteiner, Julius Poppel, Paul S. Raffelhüschen, Anna-Lena Raidl, Nico Rodo, Maren Roehl, Philine Rojczyk, Dorle Schaper, Emma Schmiedekind, Nils Schoenberg, Paula von Schorlemer, Carolin Singelmann, Victoria Stefan, Inga Steppacher, Lisa F. Umminger, and Tim L. T. Wiegand.
Conflicts of Interest
The authors declare no conflict of interest. The funders had no role in the design of the study; in the collection, analyses, or interpretation of data; in the writing of the manuscript; or in the decision to publish the results.
Appendix A

Table A1.
Original and adapted wordings of the QOLIBRI-KID/ADO.
| Description | Original wording (TBI version) |
Adapted wording (general population version) |
|---|---|---|
| Instruction | The questionnaire is designed for adolescents following an accident/brain injury. | The questionnaire is designed for children and adolescents. |
| Item C7 | How satisfied are you with how you can move (for example, walking, running, using a wheelchair)? | How satisfied are you with how you can move (for example, walking, running)? |
| Item F2 | How much do other injuries that you got at the same time as your accident/brain injury bother you? | How much do injuries bother you? |
| Item F6 | How much do changes in your life after your accident/brain injury bother you? | How much do changes in your life bother you? |
Note. The English translation is only provided to help understand the meaning of the original German items and should not be used for data collection.
Table A2.
Sociodemographic and health-related data of the TBI sample.
| Variable | Children | Adolescent | Total | |
|---|---|---|---|---|
| (N=152) | (N=148) | (N=300) | ||
| Gender | Female | 59 (38.8%) | 62 (41.9%) | 121 (40.3%) |
| Male | 93 (61.2%) | 85 (57.4%) | 178 (59.3%) | |
| Divers | 0 (0%) | 1 (0.7%) | 1 (0.3%) | |
| Time since injury (years/days) | Mean (SD) | 4.15 (2.57) | 4.88 (2.96) | 4.51 (2.78) |
| Median [Min, Max] | 4.00 [0, 9.00] | 5.00 [0, 10.0] | 4.00 [0, 10.0] | |
| Missing | 0 (0%) | 1 (0.7%) | 1 (0.3%) | |
| Severity | Mild | 106 (69.7%) | 109 (73.6%) | 215 (71.7%) |
| Moderate | 16 (10.5%) | 9 (6.1%) | 25 (8.3%) | |
| Severe | 30 (19.7%) | 30 (20.3%) | 60 (20.0%) | |
| Recovery (KOSCHI) | 5b | 129 (84.9%) | 100 (67.6%) | 229 (76.3%) |
| 5a | 15 (9.9%) | 25 (16.9%) | 40 (13.3%) | |
| 4b | 4 (2.6%) | 18 (12.2%) | 22 (7.3%) | |
| 4a | 3 (2.0%) | 5 (3.4%) | 8 (2.7%) | |
| 3b | 1 (0.7%) | 0 (0%) | 1 (0.3%) | |
| 3a | 0 (0%) | 0 (0%) | 0 (0%) | |
Note. N = sample size, SD = standard deviation. 5b = “intact recovery”, 5a = “good recovery”, 4b = “upper moderate disability”, 4a = “lower moderate disability”, 3b = “upper severe disability”, 3a = “lower severe disability”.
Table A3.
DIF analyses for age group (children vs. adolescents) in the general population sample.
| Scale | Item | p | McFadden’s R² | ||
|---|---|---|---|---|---|
| Cognition | Concentration | 0.237 | 0.001 | ||
| Talking to others | 0.073 | 0.001 | |||
| Remembering | 0.499 | < 0.001 | |||
| Planning | 0.891 | < 0.001 | |||
| Decision between two | 0.001 | 0.003 | |||
| Orientation | 0.797 | < 0.001 | |||
| Thinking speed | 0.126 | 0.001 | |||
| Self | Energy | 0.29 | 0.001 | ||
| Accomplishment | < 0.001 | 0.006 | |||
| Appearance | 0.066 | 0.001 | |||
| Self-esteem | 0.735 | < 0.001 | |||
| Future | 0.101 | 0.001 | |||
| Daily Life and Autonomy |
Daily independence | < 0.001 | 0.016 | ||
| Getting out and about | < 0.001 | 0.004 | |||
| Manage at school | < 0.001 | 0.006 | |||
| Social activities | 0.827 | < 0.001 | |||
| Decision making | < 0.001 | 0.004 | |||
| Support from others | < 0.001 | 0.005 | |||
| Ability to move* | < 0.001 | 0.005 | |||
| Social Relationships |
Open up to others | 0.004 | 0.002 | ||
| Family relationship | 0.031 | 0.002 | |||
| Relationship with friends | 0.004 | 0.003 | |||
| Friendships | 0.512 | < 0.001 | |||
| Attitudes of others | 0.001 | 0.003 | |||
| Demands from others | 0.093 | 0.001 | |||
| Emotions | Loneliness | 0.013 | 0.002 | ||
| Anxiety | 0.042 | 0.001 | |||
| Sadness | 0.476 | < 0.001 | |||
| Anger | 0.093 | 0.001 | |||
| Physical Problems |
Clumsiness | 0.001 | 0.002 | ||
| Other injuries* | 0.297 | < 0.001 | |||
| Headaches | 0.328 | < 0.001 | |||
| Pain | 0.296 | < 0.001 | |||
| Seeing/Hearing | 0.371 | < 0.001 | |||
| Life changes* | 0.365 | < 0.001 |
*Items were reworded. p: p-value, p-values in bold are significant at 1%.
Table A4.
DIF analyses for sample type (TBI sample vs. general population sample).
| Scale | Item | p | McFadden’s R² | ||
|---|---|---|---|---|---|
| Cognition | Concentration | 0.450 | < 0.001 | ||
| Talking to others | < 0.001 | 0.005 | |||
| Remembering | 0.002 | 0.002 | |||
| Planning | 0.019 | 0.001 | |||
| Decision between two | < 0.001 | 0.004 | |||
| Orientation | < 0.001 | 0.006 | |||
| Thinking speed | 0.081 | 0.001 | |||
| Self | Energy | 0.414 | < 0.001 | ||
| Accomplishment | < 0.001 | 0.033 | |||
| Appearance | < 0.001 | 0.011 | |||
| Self-esteem | < 0.001 | 0.005 | |||
| Future | 0.003 | 0.002 | |||
| Autonomy | Daily independence | < 0.001 | 0.033 | ||
| Getting out and about | 0.009 | 0.002 | |||
| Manage at school | < 0.001 | 0.009 | |||
| Social activities | 0.002 | 0.002 | |||
| Decision making | 0.307 | < 0.001 | |||
| Support from others | 0.534 | < 0.001 | |||
| Ability to move* | 0.005 | 0.002 | |||
| Social | Open up to others | 0.232 | 0.001 | ||
| Family relationship | < 0.001 | 0.014 | |||
| Relationship with friends | 0.014 | 0.002 | |||
| Friendships | < 0.001 | 0.009 | |||
| Attitudes of others | 0.022 | 0.001 | |||
| Demands from others | 0.278 | 0.001 | |||
| Emotion | Loneliness | < 0.001 | 0.002 | ||
| Anxiety | 0.081 | 0.001 | |||
| Sadness | 0.149 | 0.001 | |||
| Anger | 0.366 | < 0.001 | |||
| Physical | Clumsiness | < 0.001 | 0.002 | ||
| Other injuries* | < 0.001 | 0.021 | |||
| Headaches | < 0.001 | 0.007 | |||
| Pain | < 0.001 | 0.006 | |||
| Seeing/Hearing | < 0.001 | 0.005 | |||
| Life changes* | < 0.001 | 0.015 |
*Items were reworded. p: p-value, p-values in bold are significant at 1%.
Table A5.
Results of Regression Analysis for the scales.
| Scale | Variable | Reference Category | Estimate | S.E. | t | p |
|---|---|---|---|---|---|---|
| Cognition | Intercept | - | 64.62 | 1.01 | 64.08 | <0.001 |
| Age group | Children (8-12y) | 0.16 | 0.63 | 0.25 | 0.800 | |
| Gender | Female | 0.23 | 0.63 | 0.36 | 0.720 | |
| Health status | At least one chronic health complaint | 10.95 | 0.96 | 11.40 | <0.001 | |
| Self | Intercept | - | 65.55 | 1.13 | 58.20 | <0.001 |
| Age group | Children (8-12y) | -3.66 | 0.71 | -5.17 | <0.001 | |
| Gender | Female | 1.24 | 0.71 | 1.75 | 0.080 | |
| Health status | At least one chronic health complaint | 10.51 | 1.07 | 9.80 | <0.001 | |
| Daily Life And Autonomy |
Intercept | - | 71.79 | 1.02 | 70.18 | <0.001 |
| Age group | Children (8-12y) | 0.11 | 0.64 | 0.17 | 0.863 | |
| Gender | Female | -0.05 | 0.64 | -0.09 | 0.932 | |
| Health status | At least one chronic health complaint | 7.86 | 0.97 | 8.07 | <0.001 | |
| Social Relationships |
Intercept | - | 70.55 | 1.07 | 66.17 | <0.001 |
| Age group | Children (8-12y) | -1.22 | 0.67 | -1.82 | 0.070 | |
| Gender | Female | 1.02 | 0.67 | 1.53 | 0.127 | |
| Health status | At least one chronic health complaint | 7.68 | 1.02 | 7.57 | <0.001 | |
| Emotions | Intercept | - | 54.65 | 1.70 | 32.13 | <0.001 |
| Age group | Children (8-12y) | 2.16 | 1.07 | 2.02 | 0.044 | |
| Gender | Female | 4.22 | 1.07 | 3.95 | <0.001 | |
| Health status | At least one chronic health complaint | 9.11 | 1.62 | 5.63 | <0.001 | |
| Physical Problems |
Intercept | - | 55.60 | 1.74 | 31.91 | <0.001 |
| Age group | Children (8-12y) | 1.65 | 1.10 | 1.50 | 0.133 | |
| Gender | Female | 1.76 | 1.09 | 1.61 | 0.109 | |
| Health status | At least one chronic health complaint | 8.59 | 1.66 | 5.18 | <0.001 |
Note. *: interaction between the variables; Estimate: regression coefficient; S.E.: standard error; t: t-value; p: p-value; values in bold are significant at 0.8% for the scale scores (Bonferroni adjusted).
Table A6.
Results of second-order regression analysis for the scales.
| Scale | Variable | Reference Category | Estimate | S.E. | t | p |
|---|---|---|---|---|---|---|
| Cognition | Intercept | - | 64.33 | 1.61 | 40.05 | <0.001 |
| Age group | Children (8-12y) | -0.67 | 1.91 | -0.35 | 0.726 | |
| Gender | Female | 0.31 | 1.91 | 0.16 | 0.871 | |
| Health status | At least one chronic health complaint | 11.98 | 1.67 | 7.15 | <0.001 | |
| Age group * Gender | Children *Female | 2.59 | 1.27 | 2.04 | 0.041 | |
| Age group * Health status | Children *At least one chronic health complaint | -0.52 | 1.92 | -0.27 | 0.788 | |
| Gender * Health status | Female*At least one chronic health complaint | -1.50 | 1.92 | -0.78 | 0.435 | |
| Self | Intercept | - | 65.42 | 1.79 | 36.54 | <0.001 |
| Age group | Children (8-12y) | -8.08 | 2.13 | -3.80 | <0.001 | |
| Gender | Female | 4.34 | 2.13 | 2.04 | 0.041 | |
| Health status | At least one chronic health complaint | 11.50 | 1.87 | 6.16 | <0.001 | |
| Age group * Gender | Children *Female | 3.09 | 1.41 | 2.19 | 0.029 | |
| Age group * Health status | Children *At least one chronic health complaint | 3.29 | 2.14 | 1.54 | 0.124 | |
| Gender * Health status | Female*At least one chronic health complaint | -5.21 | 2.14 | -2.44 | 0.015 | |
| Daily Life and Autonomy |
Intercept | - | 71.98 | 1.63 | 44.24 | <0.001 |
| Age group | Children (8-12y) | -3.50 | 1.93 | -1.81 | 0.070 | |
| Gender | Female | 1.68 | 1.93 | 0.87 | 0.384 | |
| Health status | At least one chronic health complaint | 8.45 | 1.70 | 4.98 | <0.001 | |
| Age group * Gender | Children *Female | 2.96 | 1.29 | 2.30 | 0.022 | |
| Age group * Health status | Children *At least one chronic health complaint | 2.45 | 1.95 | 1.26 | 0.208 | |
| Gender * Health status | Female*At least one chronic health complaint | -3.59 | 1.95 | -1.84 | 0.065 | |
| Social Relationships |
Intercept | - | 70.10 | 1.70 | 41.28 | <0.001 |
| Age group | Children (8-12y) | -3.61 | 2.02 | -1.79 | 0.074 | |
| Gender | Female | 3.72 | 2.02 | 1.84 | 0.065 | |
| Health status | At least one chronic health complaint | 8.49 | 1.77 | 4.80 | <0.001 | |
| Age group * Gender | Children *Female | 1.10 | 1.34 | 0.82 | 0.410 | |
| Age group * Health status | Children *At least one chronic health complaint | 2.10 | 2.03 | 1.03 | 0.301 | |
| Gender * Health status | Female*At least one chronic health complaint | -3.68 | 2.03 | -1.81 | 0.070 | |
| Emotions | Intercept | - | 56.52 | 2.70 | 20.92 | <0.001 |
| Age group | Children (8-12y) | -4.97 | 3.21 | -1.55 | 0.121 | |
| Gender | Female | 3.80 | 3.21 | 1.18 | 0.237 | |
| Health status | At least one chronic health complaint | 9.05 | 2.82 | 3.21 | 0.001 | |
| Age group * Gender | Children *Female | 7.61 | 2.13 | 3.57 | <0.001 | |
| Age group * Health status | Children *At least one chronic health complaint | 3.84 | 3.23 | 1.19 | 0.235 | |
| Gender * Health status | Female*At least one chronic health complaint | -3.64 | 3.23 | -1.13 | 0.260 | |
| Physical Problems |
Intercept | - | 59.71 | 2.77 | 21.55 | <0.001 |
| Age group | Children (8-12y) | -5.94 | 3.29 | -1.81 | 0.071 | |
| Gender | Female | -2.18 | 3.29 | -0.66 | 0.508 | |
| Health status | At least one chronic health complaint | 5.74 | 2.89 | 1.99 | 0.047 | |
| Age group * Gender | Children *Female | 6.73 | 2.19 | 3.08 | 0.002 | |
| Age group * Health status | Children *At least one chronic health complaint | 4.86 | 3.31 | 1.47 | 0.142 | |
| Gender * Health status | Female*At least one chronic health complaint | 0.85 | 3.31 | 0.26 | 0.798 |
Note. *: interaction between the variables; Estimate: non-standardized regression coefficient; S.E.: standard error; t: t-value; p: p-value; values in bold are significant at 0.8% for the scale scores (Bonferroni adjusted).
Figure A1.
Comparison of the difference of the thresholds estimated within the thresholds model and the thresholds and loadings model between the general population sample and the TBI sample. T1 reflects the transition from “Not at all/Slightly” to “Moderately”, T2 from “Moderately” to “Quite”, and T3 from “Quite” to “Very”. Red points indicate a difference of more than 5%. *Reworded items.
References
- Araki, T.; Yokota, H.; Morita, A. Pediatric Traumatic Brain Injury: Characteristic Features, Diagnosis, and Management. Neurol. Med. Chir.(Tokyo) 2017, 57, 82–93. [Google Scholar] [CrossRef]
- Gardner, M.T.; O’Meara, A.M.I.; Miller Ferguson, N. Pediatric Traumatic Brain Injury: An Update on Management. Curr Pediatr Rep 2017, 5, 213–219. [Google Scholar] [CrossRef]
- Aitken, M.E.; McCarthy, M.L.; Slomine, B.S.; Ding, R.; Durbin, D.R.; Jaffe, K.M.; Paidas, C.N.; Dorsch, A.M.; Christensen, J.R.; Mackenzie, E.J.; et al. Family Burden after Traumatic Brain Injury in Children. Pediatrics 2009, 123, 199–206. [Google Scholar] [CrossRef] [PubMed]
- Maas, A.I.R.; Menon, D.K.; Adelson, P.D.; Andelic, N.; Bell, M.J.; Belli, A.; Bragge, P.; Brazinova, A.; Büki, A.; Chesnut, R.M.; et al. Traumatic Brain Injury: Integrated Approaches to Improve Prevention, Clinical Care, and Research. The Lancet Neurology 2017, 16, 987–1048. [Google Scholar] [CrossRef] [PubMed]
- Ramos-Usuga, D.; Benito-Sánchez, I.; Pérez-Delgadillo, P.; Valdivia-Tangarife, R.; Villaseñor-Cabrera, T.; Olabarrieta-Landa, L.; Arango-Lasprilla, J.C. Trajectories of Neuropsychological Functioning in Mexican Children with Traumatic Brain Injury over the First Year after Injury. NRE 2019, 45, 295–309. [Google Scholar] [CrossRef] [PubMed]
- Babikian, T.; Asarnow, R. Neurocognitive Outcomes and Recovery after Pediatric TBI: Meta-Analytic Review of the Literature. Neuropsychology 2009, 23, 283–296. [Google Scholar] [CrossRef] [PubMed]
- Lendt, M.; Müller, K. Langfristige psychosoziale Entwicklung nach schwerem Schädel-Hirn-Trauma im Kindesalter. Monatsschrift Kinderheilkunde 2014, 162, 420–427. [Google Scholar] [CrossRef]
- Scott, C.; McKinlay, A.; McLellan, T.; Britt, E.; Grace, R.; MacFarlane, M. A Comparison of Adult Outcomes for Males Compared to Females Following Pediatric Traumatic Brain Injury. Neuropsychology 2015, 29, 501–508. [Google Scholar] [CrossRef]
- Burd, R.S.; Jensen, A.R.; VanBuren, J.M.; Alvey, J.S.; Richards, R.; Holubkov, R.; Pollack, M.M. Long-Term Outcomes after Pediatric Injury: Results of the Assessment of Functional Outcomes and Health-Related Quality of Life after Pediatric Trauma Study. Journal of the American College of Surgeons 2021, 233, 666–675e2. [Google Scholar] [CrossRef]
- Kissane, A.L.; Eldridge, B.J.; Kelly, S.; Vidmar, S.; Galea, M.P.; Williams, G.P. High-Level Mobility Skills in Children and Adolescents with Traumatic Brain Injury. Brain Injury 2015, 29, 1711–1716. [Google Scholar] [CrossRef]
- Ryan, N.P.; Noone, K.; Godfrey, C.; Botchway, E.N.; Catroppa, C.; Anderson, V. Young Adults’ Perspectives on Health-Related Quality of Life after Paediatric Traumatic Brain Injury: A Prospective Cohort Study. Annals of Physical and Rehabilitation Medicine 2019, 62, 342–350. [Google Scholar] [CrossRef] [PubMed]
- Rauen, K.; Reichelt, L.; Probst, P.; Schäpers, B.; Müller, F.; Jahn, K.; Plesnila, N. Quality of Life up to 10 Years after Traumatic Brain Injury: A Cross-Sectional Analysis. Health Qual Life Outcomes 2020, 18, 166. [Google Scholar] [CrossRef] [PubMed]
- LeBlond, E.; Smith-Paine, J.; Narad, M.; Wade, S.L.; Gardis, M.; Naresh, M.; Makoroff, K.; Rhine, T. Understanding the Relationship between Family Functioning and Health-Related Quality of Life in Very Young Children with Moderate-to-Severe TBI. The Clinical Neuropsychologist 2021, 35, 868–884. [Google Scholar] [CrossRef] [PubMed]
- Fayed, N.; De Camargo, O.K.; Kerr, E.; Rosenbaum, P.; Dubey, A.; Bostan, C.; Faulhaber, M.; Raina, P.; Cieza, A. Generic Patient-Reported Outcomes in Child Health Research: A Review of Conceptual Content Using World Health Organization Definitions. Developmental Medicine & Child Neurology 2012, 54, 1085–1095. [Google Scholar] [CrossRef]
- Matza, L.S.; Swensen, A.R.; Flood, E.M.; Secnik, K.; Leidy, N.K. Assessment of Health-Related Quality of Life in Children: A Review of Conceptual, Methodological, and Regulatory Issues. Value in health 2004, 7, 79–92. [Google Scholar] [CrossRef]
- U.S. Department of Health and Human Services FDA Center for Drug Evaluation and Research; U.S. Department of Health and Human Services FDA Center for Biologics Evaluation and Research; U.S. Department of Health and Human Services FDA Center for Devices and Radiological Health Guidance for Industry: Patient-Reported Outcome Measures: Use in Medical Product Development to Support Labeling Claims: Draft Guidance. Health Qual Life Outcomes 2006, 4, 79. [CrossRef]
- Coghill, D.; Danckaerts, M.; Sonuga-Barke, E.; Sergeant, J. Practitioner Review: Quality of Life in Child Mental Health – Conceptual Challenges and Practical Choices. Journal of Child Psychology and Psychiatry 2009, 50, 544–561. [Google Scholar] [CrossRef]
- Wiebe, S.; Guyatt, G.; Weaver, B.; Matijevic, S.; Sidwell, C. Comparative Responsiveness of Generic and Specific Quality-of-Life Instruments. Journal of Clinical Epidemiology 2003, 56, 52–60. [Google Scholar] [CrossRef]
- von Steinbüchel, N.; Covic, A.; Polinder, S.; Kohlmann, T.; Cepulyte, U.; Poinstingl, H.; Backhaus, J.; Bakx, W.; Bullinger, M.; Christensen, A.-L.; et al. Assessment of Health-Related Quality of Life after TBI: Comparison of a Disease-Specific (QOLIBRI) with a Generic (SF-36) Instrument. Behavioural Neurology 2016, 2016, 1–14. [Google Scholar] [CrossRef]
- Varni, J.W.; Seid, M.; Rode, C.A. The PedsQL: Measurement Model for the Pediatric Quality of Life Inventory. Med Care 1999, 37, 126–139. [Google Scholar] [CrossRef]
- Landgraf, J.M.; Abetz, L.; Ware, J.E. The CHQ User’s Manual; The Health Institute, New England Medical Center: Boston, USA, 1996. [Google Scholar]
- Ravens-Sieberer, U.; Bullinger, M. Assessing Health-Related Quality of Life in Chronically Ill Children with the German KINDL: First Psychometric and Content Analytical Results. Qual Life Res 1998, 7, 399–407. [Google Scholar] [CrossRef]
- Ware, J.E.; Snow, K.K.; Kosinski, M.; Gandek, B. SF-36 Health Survey Manual and Interpretation Guide; The Health Institute, New Endland Medical Center: Boston, MA, 1993. [Google Scholar]
- Krenz, U.; Timmermann, D.; Gorbunova, A.; Lendt, M.; Schmidt, S.; von Steinbuechel, N. Health-Related Quality of Life after Pediatric Traumatic Brain Injury: A Qualitative Comparison between Children’s and Parents’ Perspectives. PLoS ONE 2021, 16, e0246514. [Google Scholar] [CrossRef]
- Souza, L.M.d.N.; Braga, L.W.; Filho, G.N.; Dellatolas, G. Quality-of-Life: Child and Parent Perspectives Following Severe Traumatic Brain Injury. Developmental Neurorehabilitation 2007, 10, 35–47. [Google Scholar] [CrossRef]
- Erickson, S.J.; Montague, E.Q.; Gerstle, M.A. Health-Related Quality of Life in Children with Moderate-to-Severe Traumatic Brain Injury. Developmental Neurorehabilitation 2010, 13, 175–181. [Google Scholar] [CrossRef]
- Von Steinbuechel, N.; Zeldovich, M.; Greving, S.; Olabarrieta-Landa, L.; Krenz, U.; Timmermann, D.; Koerte, I.K.; Bonfert, M.V.; Berweck, S.; Kieslich, M.; et al. Quality of Life after Brain Injury in Children and Adolescents (QOLIBRI-KID/ADO)—The First Disease-Specific Self-Report Questionnaire after Traumatic Brain Injury. JCM 2023, 12, 4898. [Google Scholar] [CrossRef]
- Hsu, C.-C.; Sandford, B.A. The Delphi Technique: Making Sense of Consensus. Practical Assessment, Research, and Evaluation 2007, 12, 1–8. [Google Scholar] [CrossRef]
- von Steinbuechel, N.; Wilson, L.; Gibbons, H.; Hawthorne, G.; Höfer, S.; Schmidt, S.; Bullinger, M.; Maas, A.; Neugebauer, E.; Powell, J.; et al. Quality of Life after Brain Injury (QOLIBRI): Scale Development and Metric Properties. Journal of Neurotrauma 2010, 27, 1167–1185. [Google Scholar] [CrossRef] [PubMed]
- von Steinbuechel, N.; Wilson, L.; Gibbons, H.; Hawthorne, G.; Höfer, S.; Schmidt, S.; Bullinger, M.; Maas, A.; Neugebauer, E.; Powell, J.; et al. Quality of Life after Brain Injury (QOLIBRI): Scale Validity and Correlates of Quality of Life. Journal of Neurotrauma 2010, 27, 1157–1165. [Google Scholar] [CrossRef] [PubMed]
- Cappelleri, J.C.; Bushmakin, A.G. Interpretation of Patient-Reported Outcomes. Stat Methods Med Res 2014, 23, 460–483. [Google Scholar] [CrossRef] [PubMed]
- Marquis, P.; Chassany, O.; Abetz, L. A Comprehensive Strategy for the Interpretation of Quality-of-Life Data Based on Existing Methods. Value in Health 2004, 7, 93–104. [Google Scholar] [CrossRef] [PubMed]
- Teasdale, G.; Jennett, B. Assessment of Coma and Impaired Consciousness. A Practical Scale. Lancet 1974, 2, 81–84. [Google Scholar] [CrossRef]
- Crouchman, M. A Practical Outcome Scale for Paediatric Head Injury. Archives of Disease in Childhood 2001, 84, 120–124. [Google Scholar] [CrossRef] [PubMed]
- Bulmer, M.G. Principles of Statistics; Dover Publications: New York, 1979; ISBN 978-0-486-63760-0. [Google Scholar]
- Terwee, C.B.; Bot, S.D.M.; de Boer, M.R.; van der Windt, D.A.W.M.; Knol, D.L.; Dekker, J.; Bouter, L.M.; de Vet, H.C.W. Quality Criteria Were Proposed for Measurement Properties of Health Status Questionnaires. Journal of Clinical Epidemiology 2007, 60, 34–42. [Google Scholar] [CrossRef] [PubMed]
- Feißt, M.; Hennigs, A.; Heil, J.; Moosbrugger, H.; Kelava, A.; Stolpner, I.; Kieser, M.; Rauch, G. Refining Scores Based on Patient Reported Outcomes – Statistical and Medical Perspectives. BMC Med Res Methodol 2019, 19, 167. [Google Scholar] [CrossRef] [PubMed]
- The Whoqol Group The World Health Organization Quality of Life Assessment (WHOQOL): Development and General Psychometric Properties. Social Science & Medicine 1998, 46, 1569–1585. [CrossRef]
- Choi, S.; Gibbons, L.; Crane, P. Lordif: An R Package for Detecting Differential Item Functioning Using Iterative Hybrid Ordinal Logistic Regression/Item Response Theory and Monte Carlo Simulations. Journal of statistical software 2011, 39, 1–30. [Google Scholar] [CrossRef] [PubMed]
- Cole, D.A. Utility of Confirmatory Factor Analysis in Test Validation Research. Journal of Consulting and Clinical Psychology 1987, 55, 584–594. [Google Scholar] [CrossRef] [PubMed]
- Hu, L.; Bentler, P.M. Cutoff Criteria for Fit Indexes in Covariance Structure Analysis: Conventional Criteria versus New Alternatives. Structural Equation Modeling: A Multidisciplinary Journal 1999, 6, 1–55. [Google Scholar] [CrossRef]
- Finch, W.H.; French, B.F. A Simulation Investigation of the Performance of Invariance Assessment Using Equivalence Testing Procedures. Structural Equation Modeling: A Multidisciplinary Journal 2018, 25, 673–686. [Google Scholar] [CrossRef]
- Steiger, J.H.; Lind, J.C. Statistically Based Tests for the Number of Common Factors. Presented at the Psychometric Society Annual Meeting, Iowa City, IA, 1980.
- Xia, Y.; Yang, Y. RMSEA, CFI, and TLI in Structural Equation Modeling with Ordered Categorical Data: The Story They Tell Depends on the Estimation Methods. Behav Res 2019, 51, 409–428. [Google Scholar] [CrossRef]
- Wu, H.; Estabrook, R. Identification of Confirmatory Factor Analysis Models of Different Levels of Invariance for Ordered Categorical Outcomes. Psychometrika 2016, 81, 1014–1045. [Google Scholar] [CrossRef] [PubMed]
- Svetina, D.; Rutkowski, L.; Rutkowski, D. Multiple-Group Invariance with Categorical Outcomes Using Updated Guidelines: An Illustration Using Mplus and the Lavaan/Semtools Packages. Structural Equation Modeling: A Multidisciplinary Journal 2020, 27, 111–130. [Google Scholar] [CrossRef]
- Hirschfeld, G.; Brachel, R. von Improving Multiple-Group Confirmatory Factor Analysis in R – A Tutorial in Measurement Invariance with Continuous and Ordinal Indicators. 2014. [Google Scholar] [CrossRef]
- Cheung, G.W.; Rensvold, R.B. Evaluating Goodness-of-Fit Indexes for Testing Measurement Invariance. Structural Equation Modeling: A Multidisciplinary Journal 2002, 9, 233–255. [Google Scholar] [CrossRef]
- Guilfoyle, M.R.; Seeley, H.M.; Corteen, E.; Harkin, C.; Richards, H.; Menon, D.K.; Hutchinson, P.J. Assessing Quality of Life after Traumatic Brain Injury: Examination of the Short Form 36 Health Survey. Journal of Neurotrauma 2010, 27, 2173–2181. [Google Scholar] [CrossRef] [PubMed]
- McCauley, S.R.; Wilde, E.A.; Anderson, V.A.; Bedell, G.; Beers, S.R.; Campbell, T.F.; Chapman, S.B.; Ewing-Cobbs, L.; Gerring, J.P.; Gioia, G.A.; et al. Recommendations for the Use of Common Outcome Measures in Pediatric Traumatic Brain Injury Research. Journal of Neurotrauma 2012, 29, 678–705. [Google Scholar] [CrossRef] [PubMed]
- R Core Team R: A Language and Environment for Statistical Computing 2021.
- Rich, B. Table1: Tables of Descriptive Statistics in HTML 2021.
- Revelle, W. Psych: Procedures for Personality and Psychological Research 2021.
- Rosseel, Y. Lavaan: An R Package for Structural Equation Modeling. J. Stat. Soft. 2012, 48. [Google Scholar] [CrossRef]
- Putnick, D.L.; Bornstein, M.H. Measurement Invariance Conventions and Reporting: The State of the Art and Future Directions for Psychological Research. Developmental Review 2016, 41, 71–90. [Google Scholar] [CrossRef]
- Pinquart, M. Body Image of Children and Adolescents with Chronic Illness: A Meta-Analytic Comparison with Healthy Peers. Body Image 2013, 10, 141–148. [Google Scholar] [CrossRef]
- Babikian, T.; Merkley, T.; Savage, R.C.; Giza, C.C.; Levin, H. Chronic Aspects of Pediatric Traumatic Brain Injury: Review of the Literature. Journal of Neurotrauma 2015, 32, 1849–1860. [Google Scholar] [CrossRef]
- Michel, G.; The KIDSCREEN group; Bisegger, C.; Fuhr, D.C.; Abel, T. Age and Gender Differences in Health-Related Quality of Life of Children and Adolescents in Europe: A Multilevel Analysis. Qual Life Res 2009, 18, 1147–1157. [Google Scholar] [CrossRef]
- Silva, N.; Pereira, M.; Otto, C.; Ravens-Sieberer, U.; Canavarro, M.C.; Bullinger, M. Do 8- to 18-Year-Old Children/Adolescents with Chronic Physical Health Conditions Have Worse Health-Related Quality of Life than Their Healthy Peers? A Meta-Analysis of Studies Using the KIDSCREEN Questionnaires. Qual Life Res 2019, 28, 1725–1750. [Google Scholar] [CrossRef] [PubMed]
- Baumgarten, F.; Cohrdes, C.; Schienkiewitz, A.; Thamm, R.; Meyrose, A.-K.; Ravens-Sieberer, U. Gesundheitsbezogene Lebensqualität und Zusammenhänge mit chronischen Erkrankungen und psychischen Auffälligkeiten bei Kindern und Jugendlichen: Ergebnisse aus KiGGS Welle 2. Bundesgesundheitsbl 2019, 62, 1205–1214. [Google Scholar] [CrossRef]
- Ravens-Sieberer, U.; Gosch, A.; Rajmil, L.; Erhart, M.; Bruil, J.; Power, M.; Duer, W.; Auquier, P.; Cloetta, B.; Czemy, L.; et al. The KIDSCREEN-27 Quality of Life Measure for Children and Adolescents: Psychometric Results from a Cross-Cultural Survey in 13 European Countries. Value in Health 2008, 11, 645–658. [Google Scholar] [CrossRef]
- Bisegger, C.; Cloetta, B.; von Bisegger, U.; Abel, T.; Ravens-Sieberer, U.; the European Kidscreen group. Health-Related Quality of Life: Gender Differences in Childhood and Adolescence. Sozial- und Präventivmedizin SPM 2005, 50, 281–291. [Google Scholar] [CrossRef] [PubMed]
- Van Cleave, J. Dynamics of Obesity and Chronic Health Conditions Among Children and Youth. JAMA 2010, 303, 623. [Google Scholar] [CrossRef] [PubMed]
- Perrin, J.M.; Anderson, L.E.; Van Cleave, J. The Rise In Chronic Conditions Among Infants, Children, And Youth Can Be Met With Continued Health System Innovations. Health Affairs 2014, 33, 2099–2105. [Google Scholar] [CrossRef] [PubMed]
- Davidov, E.; Meuleman, B.; Cieciuch, J.; Schmidt, P.; Billiet, J. Measurement Equivalence in Cross-National Research. Annu. Rev. Sociol. 2014, 40, 55–75. [Google Scholar] [CrossRef]
- Gorbunova, A.; Zeldovich, M.; Voormolen, D.; Krenz, U.; Polinder, S.; Haagsma, J.; Hagmayer, Y.; Covic, A.; Real, R.; Asendorf, T.; et al. Reference Values of the QOLIBRI from General Population Samples in the United Kingdom and The Netherlands. JCM 2020, 9, 2100. [Google Scholar] [CrossRef]
- Krenz, U.; Greving, S.; Zeldovich, M.; Haagsma, J.; Polinder, S.; von Steinbuechel, N.; on behalf of the CENTER-TBI Participants and Investigators. Reference Values of the Quality of Life after Brain Injury (QOLIBRI) from a General Population Sample in Italy. JCM 2023, 12, 491. [Google Scholar] [CrossRef]
- Heiervang, E.; Goodman, R. Advantages and Limitations of Web-Based Surveys: Evidence from a Child Mental Health Survey. Soc Psychiat Epidemiol 2011, 46, 69–76. [Google Scholar] [CrossRef]
- Wright, K.B. Researching Internet-Based Populations: Advantages and Disadvantages of Online Survey Research, Online Questionnaire Authoring Software Packages, and Web Survey Services. Journal of Computer-Mediated Communication 2006, 10, 00–00. [Google Scholar] [CrossRef]
- Evans, J.R.; Mathur, A. The Value of Online Surveys: A Look Back and a Look Ahead. INTR 2018, 28, 854–887. [Google Scholar] [CrossRef]
- Rutkowski, L.; Svetina, D.; Liaw, Y.-L. Collapsing Categorical Variables and Measurement Invariance. Structural Equation Modeling: A Multidisciplinary Journal 2019, 26, 790–802. [Google Scholar] [CrossRef]
Figure 1.
Flow chart for sample composition: A. general population sample and B. TBI sample.
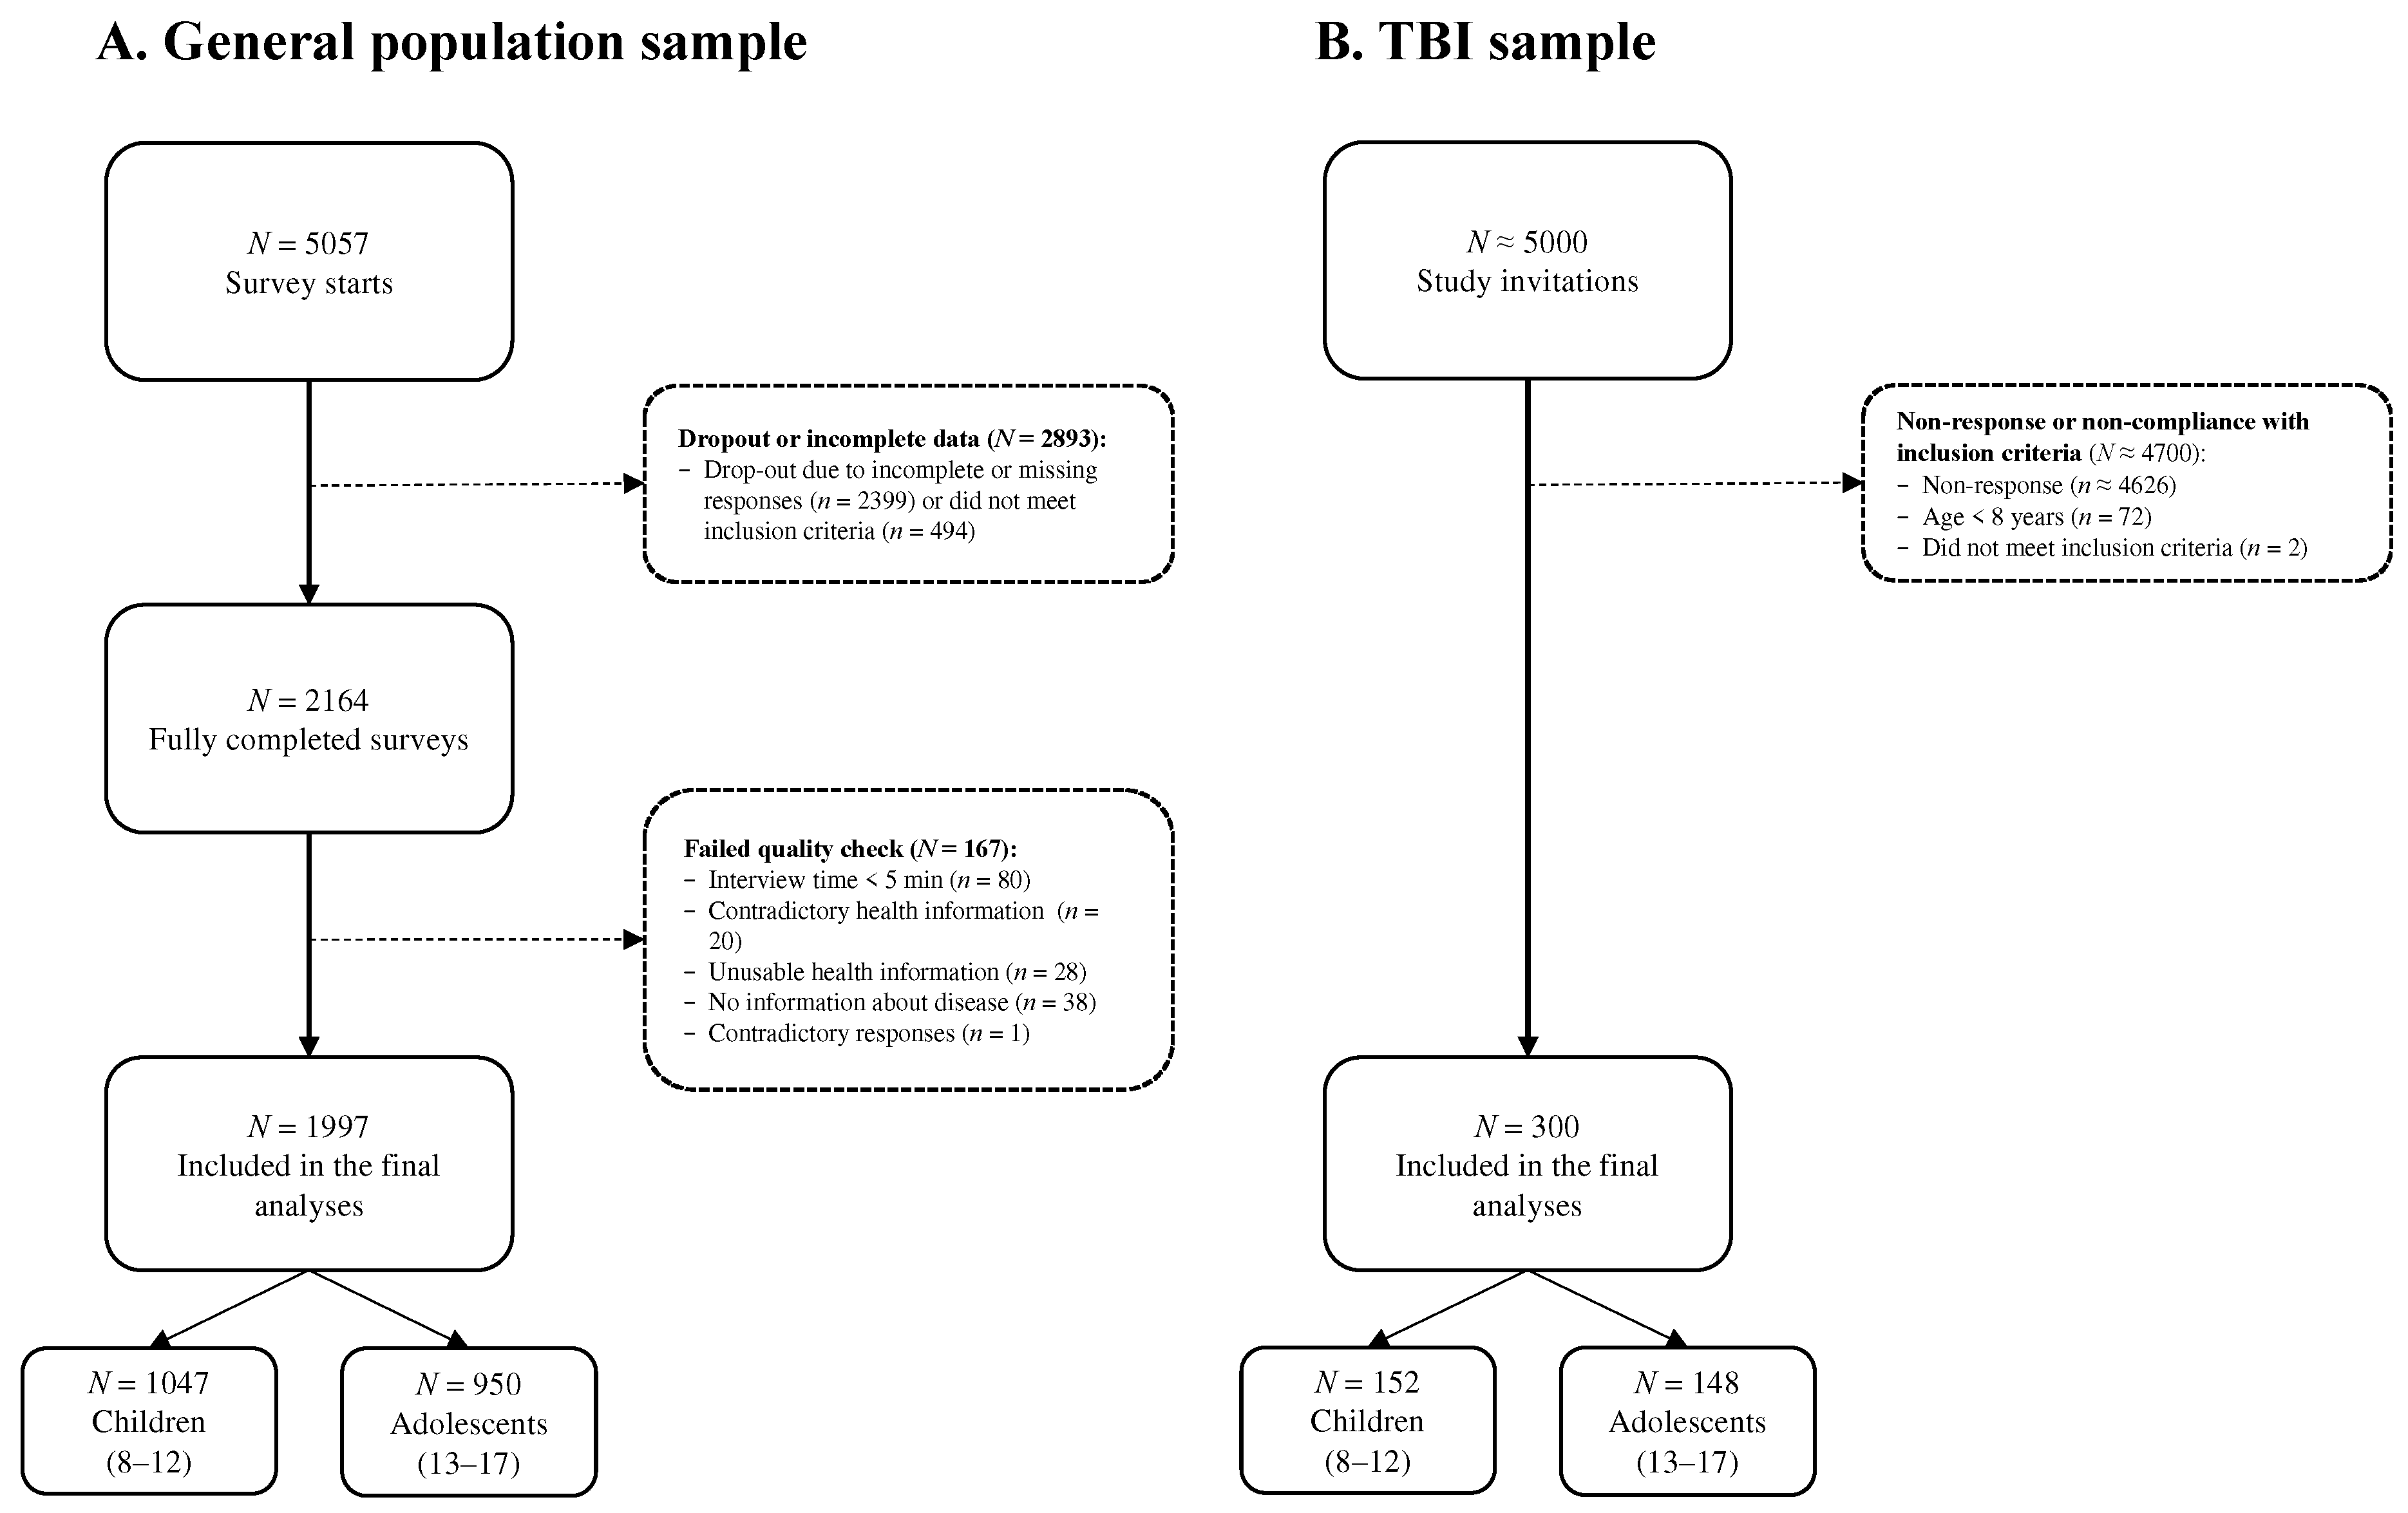
Figure 2.
Comparison of standardized factor loadings between the models with increasing constraints (i.e., threshold model vs. threshold and loadings model) between general population and TBI sample.
Figure 2.
Comparison of standardized factor loadings between the models with increasing constraints (i.e., threshold model vs. threshold and loadings model) between general population and TBI sample.
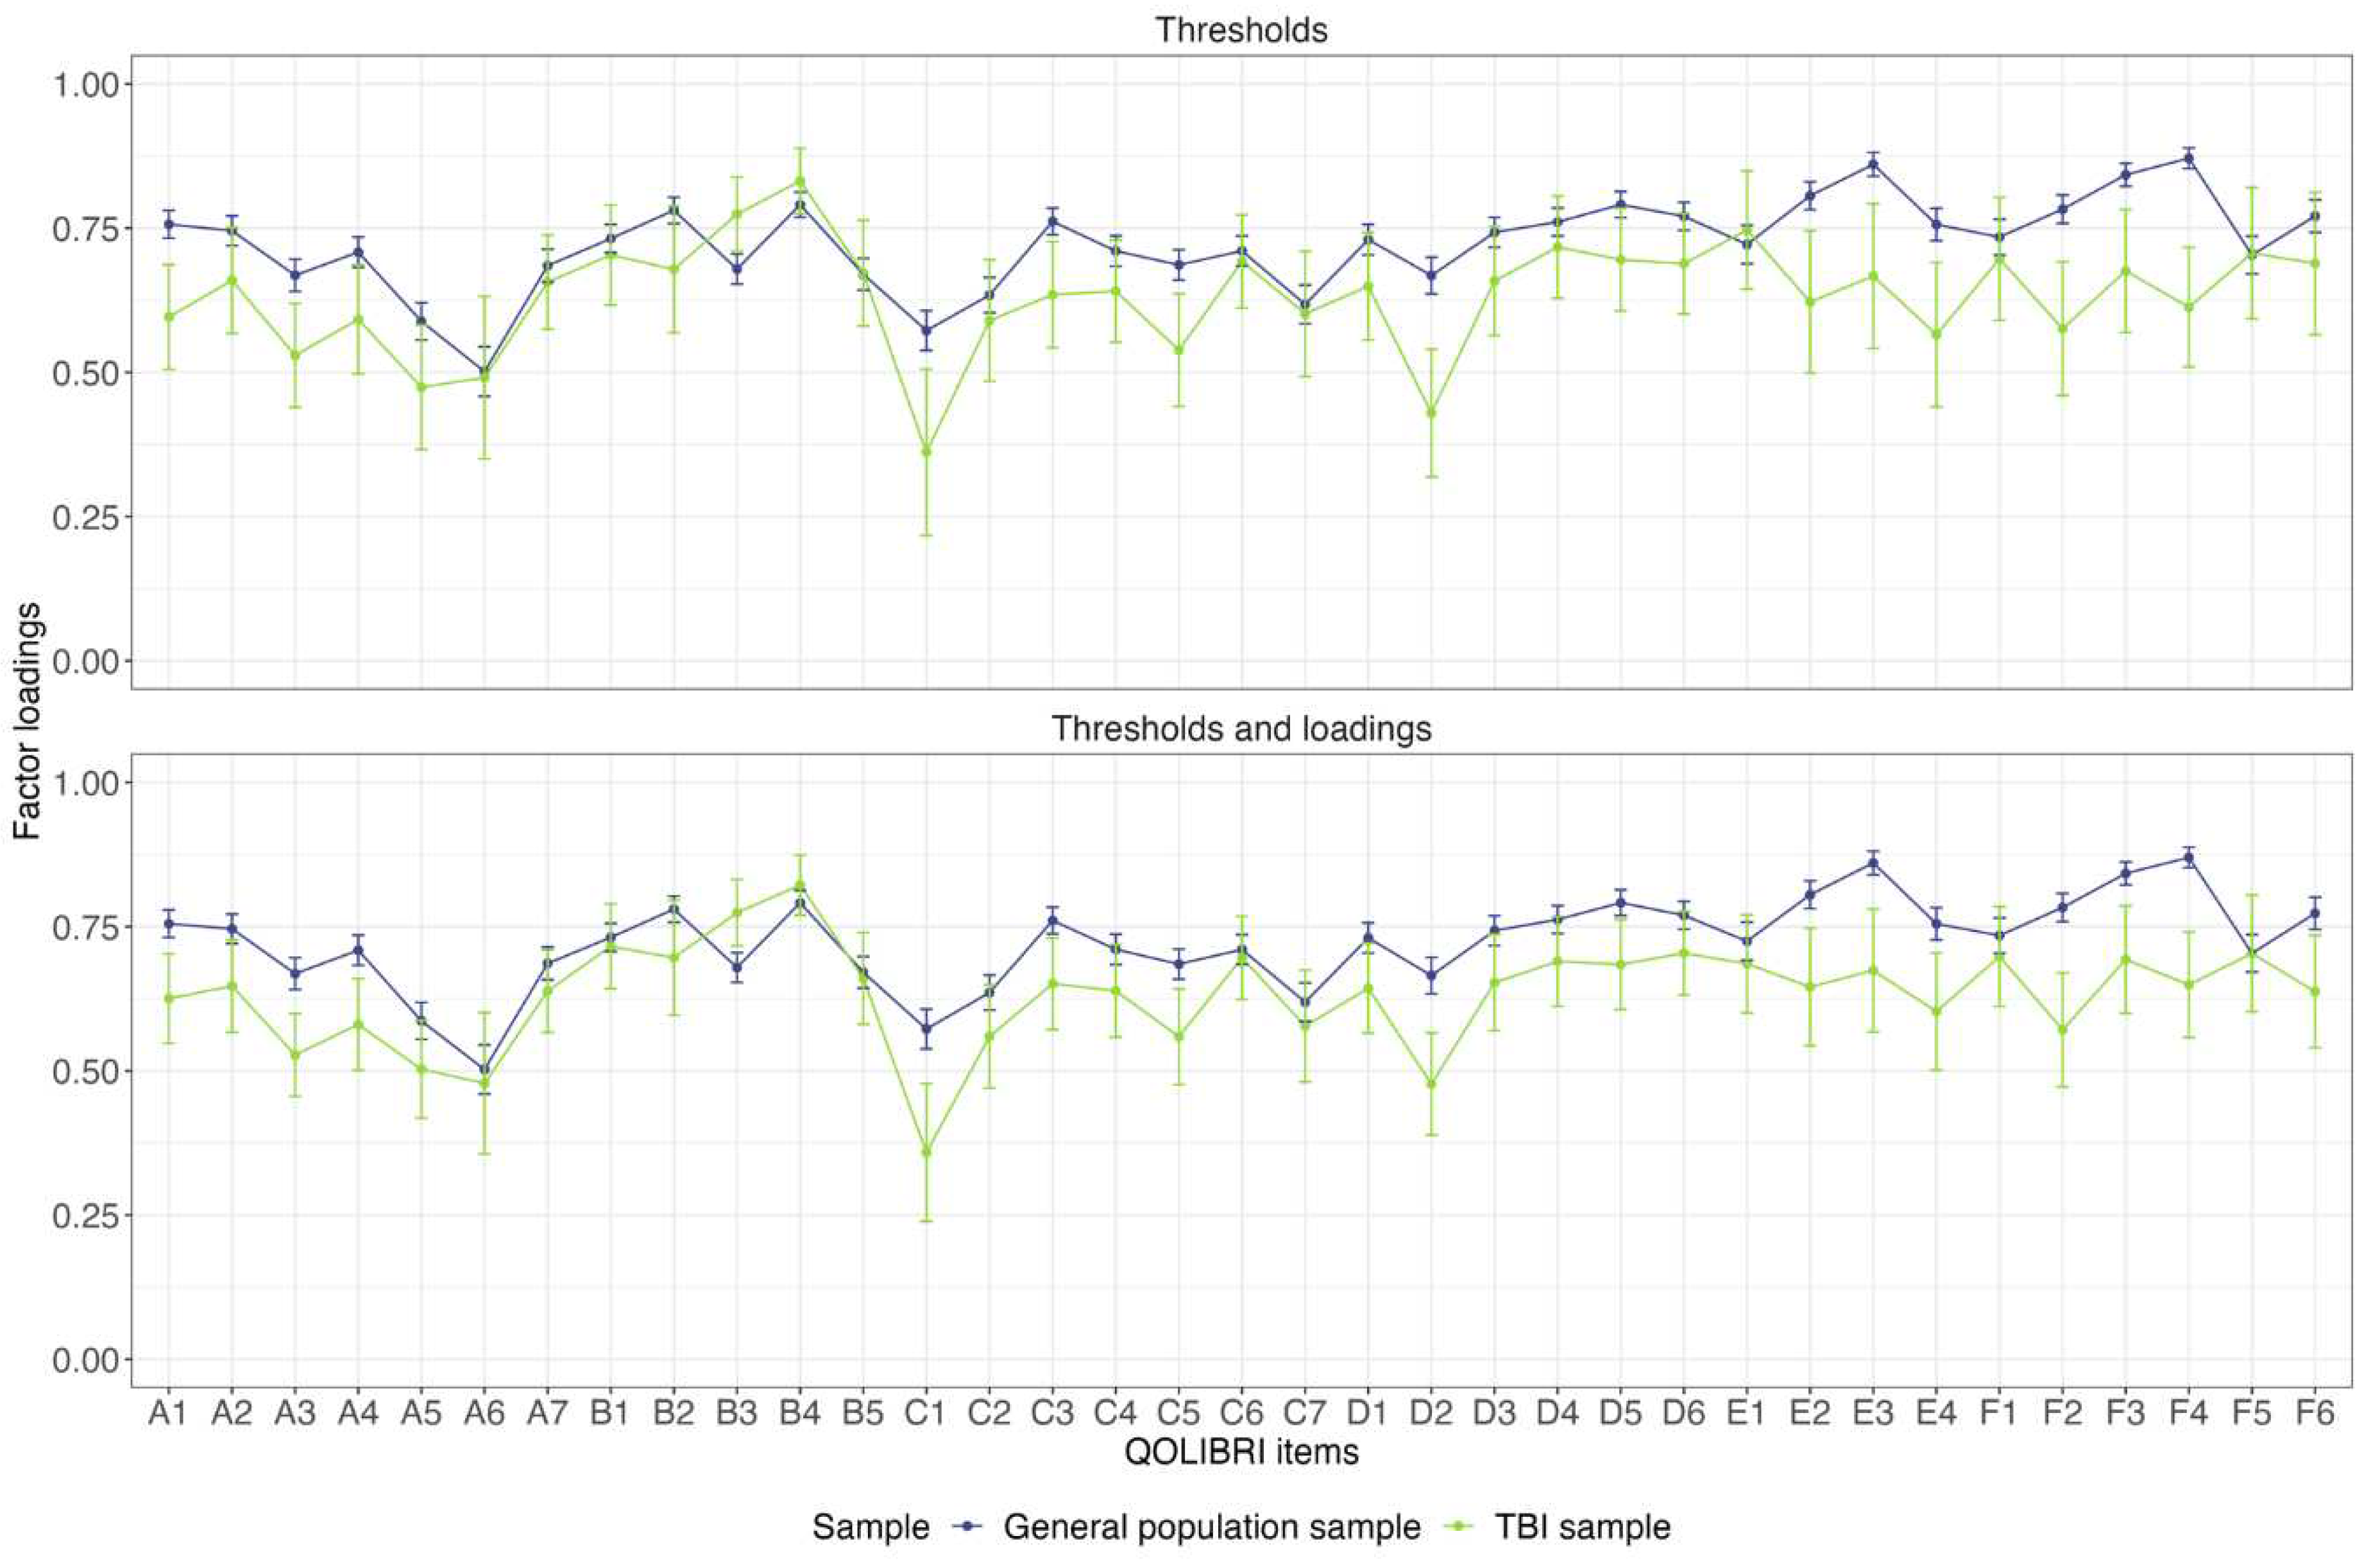
Table 1.
Sociodemographic and Health-Related Data of the General Population Sample.
| Children (N = 1047) |
Adolescents (N = 950) |
Total (N = 1997) |
||
|---|---|---|---|---|
| Age (years) | Mean (SD) | 10.0 (1.42) | 15.0 (1.39) | 12.4 (2.85) |
| Median [Min, Max] | 10.0 [8.00, 12.0] | 15.0 [13.0, 17.0] | 12.0 [8.00, 17.0] | |
| Gender | Female | 523 (50.0%) | 484 (50.9%) | 1007 (50.4%) |
| Male | 524 (50.0%) | 465 (48.9%) | 989 (49.5%) | |
| Divers | 0 (0%) | 1 (0.1%) | 1 (0.1%) | |
| Education | None | 0 (0%) | 6 (0.6%) | 6 (0.3%) |
| Not identified* | 15 (1.4%) | 15 (1.6%) | 30 (1.5%) | |
| Primary school | 556 (53.1%) | 0 (0%) | 556 (27.8%) | |
| Special school | 47 (4.5%) | 36 (3.8%) | 83 (4.2%) | |
| Secondary school | 46 (4.4%) | 73 (7.7%) | 119 (6.0%) | |
| Secondary school/middle school | 190 (18.1%) | 343 (36.1%) | 533 (26.7%) | |
| Vocational school | 0 (0%) | 78 (8.2%) | 78 (3.9%) | |
| Preparatory high school | 193 (18.4%) | 399 (42.0%) | 592 (29.6%) | |
| Integration assistance at school | Yes | 145 (13.8%) | 125 (13.2%) | 270 (13.5%) |
| No | 902 (86.2%) | 819 (86.2%) | 1721 (86.2%) | |
| Missing | 0 (0%) | 6 (0.6%) | 6 (0.3%) | |
| Number of chronic health conditions | One and more | 122 (11.7%) | 127 (13.4%) | 249 (12.5%) |
| None | 925 (88.3%) | 823 (86.6%) | 1748 (87.5%) |
Note. *Due to implausible data (8-12 years & vocational school and 13-17 years & primary school, which is very unlikely in the German school system), the category “not identifiable” was added. SD = standard deviation, N = sample size.
Table 2.
Psychometric properties of the QOLIBRI-KID/ADO in the general population sample.
| Scale | Item | Cronbach’s α ª |
McDonald’s ω |
Alpha if item omittedª |
Item-total-correlationsª | CITC | |
|---|---|---|---|---|---|---|---|
| Cognition | 0.80 | 0.84 | |||||
| Concentration | 0.76 | 0.75 | 0.63 | ||||
| Talking to others | 0.77 | 0.69 | 0.55 | ||||
| Remembering | 0.76 | 0.71 | 0.58 | ||||
| Planning | 0.77 | 0.7 | 0.57 | ||||
| Decision between two | 0.79 | 0.62 | 0.46 | ||||
| Orientation | 0.80 | 0.54 | 0.36 | ||||
| Thinking speed | 0.76 | 0.71 | 0.58 | ||||
| Self | 0.80 | 0.83 | |||||
| Energy | 0.77 | 0.73 | 0.55 | ||||
| Accomplishment | 0.76 | 0.75 | 0.59 | ||||
| Appearance | 0.77 | 0.74 | 0.57 | ||||
| Self-esteem | 0.74 | 0.79 | 0.65 | ||||
| Future | 0.77 | 0.72 | 0.55 | ||||
| Daily Life and Autonomy | 0.80 | 0.83 | |||||
| Daily independence | 0.79 | 0.63 | 0.47 | ||||
| Getting out and about | 0.77 | 0.72 | 0.59 | ||||
| Manage at school | 0.78 | 0.67 | 0.53 | ||||
| Social activities | 0.77 | 0.72 | 0.60 | ||||
| Decision making | 0.77 | 0.71 | 0.57 | ||||
| Support from others | 0.78 | 0.66 | 0.51 | ||||
| Ability to move* | 0.79 | 0.63 | 0.47 | ||||
| Social Relationships | 0.84 | 0.86 | |||||
| Open up to others | 0.81 | 0.73 | 0.59 | ||||
| Family relationship | 0.82 | 0.69 | 0.54 | ||||
| Relationship with friends | 0.81 | 0.76 | 0.63 | ||||
| Friendships | 0.80 | 0.77 | 0.64 | ||||
| Attitudes of others | 0.80 | 0.79 | 0.68 | ||||
| Demands from others | 0.82 | 0.72 | 0.58 | ||||
| Emotions | 0.82 | 0.84 | |||||
| Loneliness | 0.81 | 0.76 | 0.57 | ||||
| Anxiety | 0.76 | 0.84 | 0.69 | ||||
| Sadness | 0.73 | 0.87 | 0.75 | ||||
| Anger | 0.81 | 0.77 | 0.59 | ||||
| Physical Problems | 0.86 | 0.90 | |||||
| Clumsiness | 0.86 | 0.68 | 0.54 | ||||
| Other injuries* | 0.83 | 0.81 | 0.71 | ||||
| Headaches | 0.82 | 0.83 | 0.74 | ||||
| Pain | 0.82 | 0.86 | 0.78 | ||||
| Seeing/Hearing | 0.85 | 0.73 | 0.60 | ||||
| Life changes* | 0.85 | 0.71 | 0.58 | ||||
| Total score | 0.94 | 0.95 |
Note. *Reworded items. ªStandardized alpha coefficients are reported. CITC: Corrected Item-total-correlations.
Table 3.
Results of regression analysis for the QOLIBRI-KID/ADO total score.
| Model | Variable | Reference category | Estimate | S.E. | t | p |
|---|---|---|---|---|---|---|
| Model without interactions | Intercept | - | 64.52 | 0.94 | 68.68 | <0.001 |
| Age group | Children (8–12y) | -0.15 | 0.59 | -0.25 | 0.801 | |
| Gender | Female | 1.17 | 0.59 | 1.98 | 0.047 | |
| Health status | At least one chronic health condition | 9.10 | 0.89 | 10.17 | <0.001 | |
| Model with interaction | Intercept | - | 65.32 | 1.49 | 43.76 | <0.001 |
| Age group | Children (8–12y) | -4.19 | 1.77 | -2.37 | 0.018 | |
| Gender | Female | 1.72 | 1.77 | 0.97 | 0.333 | |
| Health status | At least one chronic health condition | 9.20 | 1.56 | 5.91 | <0.001 | |
| Age group * Gender | Children *Female | 3.76 | 1.18 | 3.19 | 0.001 | |
| Age group * Health status | Children *At least one chronic health condition | 2.49 | 1.78 | 1.40 | 0.163 | |
| Gender * Health status | Female*At least one chronic health condition | -2.66 | 1.78 | -1.49 | 0.136 |
Note. Estimate: non-standardized regression coefficient; S.E.: standard error; t: t-value; p: p-value; values in bold are significant at 5%.
Table 4.
Results of the Measurement Invariance (MI) analyses.
| Samples | Constraints | χ2 (df) | p | χ2/df | CFI | TLI | RMSEA [90% CI] | SRMR | χ2 (df) | Δ χ2 | Δ df | p |
|---|---|---|---|---|---|---|---|---|---|---|---|---|
| General population sample vs. TBI sample |
baseline | 4006.65 (1090) | <0.001 | 3.77 | 0.96 | 0.95 | 0.049 [0.047, 0.050] | 0.054 | 4476.6 (1090) | - | - | - |
| thresholds | 4042.66 (1125) | <0.001 | 3.59 | 0.96 | 0.95 | 0.048 [0.046, 0.049] | 0.054 | 4498.7 (1125) | 48.522 | 35 | 0.064 | |
| thresholds and loadings | 3973.81 (1154) | <0.001 | 3.44 | 0.96 | 0.96 | 0.046 [0.045, 0.048] | 0.054 | 4620.0 (1154) | 75.773 | 29 | < 0.001 |
Note. χ2: scaled chi-square statistics; df: scaled degrees of freedom; p: p-value; χ2/df: scaled ratio (cut-off: ≤ 2); CFI: scaled Comparative Fit Index (cut-off: > 0.90); TLI: scaled Tucker-Lewis Index (cut-off: > 0.95); RMSEA [90%CI]: scaled root mean square error of approximation with 90% confidence interval (cut-off: < 0.06); SRMR: scaled Standardized Root Mean Square Residual (cut-off: < 0.08). Values in bold indicate at least satisfactory/mediocre model fit according to the respective cut-offs and/or are within acceptable range.
Table 5.
Reference values for the QOLIBRI-KID/ADO for the general population.
| Low Quality of Life | -1 SD | Md | +1 SD | High Quality of Life | ||||||||||
|---|---|---|---|---|---|---|---|---|---|---|---|---|---|---|
| Gender | Age | Scale | N | 2.50% | 5% | 16% | 30% | 40% | 50% | 60% | 70% | 85% | 95% | 97.50% |
| Male | 8-12 | Total Score | 462 | 50 | 55 | 62 | 68 | 71 | 73 | 76 | 80 | 86 | 95 | 100 |
| Cognition | 46 | 50 | 64 | 68 | 71 | 75 | 79 | 82 | 89 | 100 | 100 | |||
| Self | 45 | 50 | 60 | 70 | 70 | 75 | 80 | 85 | 95 | 100 | 100 | |||
| Daily Life and Autonomy | 50 | 57 | 68 | 71 | 75 | 79 | 82 | 86 | 93 | 100 | 100 | |||
| Social Relationships | 50 | 54 | 67 | 71 | 75 | 79 | 83 | 88 | 96 | 100 | 100 | |||
| Emotions | 12 | 25 | 44 | 52 | 62 | 69 | 75 | 81 | 94 | 100 | 100 | |||
| Physical Problems | 12 | 17 | 38 | 50 | 58 | 67 | 75 | 79 | 92 | 100 | 100 | |||
| 13-17 | Total Score | 401 | 46 | 52 | 64 | 70 | 74 | 76 | 79 | 81 | 89 | 97 | 100 | |
| Cognition | 43 | 50 | 61 | 71 | 75 | 79 | 82 | 86 | 93 | 100 | 100 | |||
| Self | 40 | 50 | 60 | 70 | 70 | 75 | 75 | 80 | 90 | 100 | 100 | |||
| Daily Life and Autonomy | 46 | 50 | 68 | 75 | 79 | 82 | 86 | 89 | 96 | 100 | 100 | |||
| Social Relationships | 50 | 50 | 62 | 71 | 75 | 79 | 83 | 88 | 96 | 100 | 100 | |||
| Emotions | 25 | 31 | 50 | 62 | 69 | 75 | 81 | 88 | 94 | 100 | 100 | |||
| Physical Problems | 17 | 25 | 46 | 58 | 67 | 75 | 79 | 88 | 96 | 100 | 100 | |||
| Female | 8-12 | Total Score | 463 | 48 | 54 | 62 | 68 | 71 | 75 | 78 | 82 | 87 | 96 | 100 |
| Cognition | 48 | 54 | 64 | 70 | 75 | 75 | 82 | 82 | 89 | 100 | 100 | |||
| Self | 40 | 50 | 65 | 70 | 75 | 75 | 80 | 85 | 95 | 100 | 100 | |||
| Daily Life and Autonomy | 50 | 54 | 68 | 75 | 79 | 82 | 86 | 89 | 93 | 100 | 100 | |||
| Social Relationships | 46 | 50 | 67 | 71 | 75 | 79 | 83 | 88 | 92 | 100 | 100 | |||
| Emotions | 12 | 19 | 38 | 56 | 62 | 69 | 75 | 81 | 94 | 100 | 100 | |||
| Physical Problems | 12 | 21 | 37 | 54 | 62 | 71 | 75 | 83 | 92 | 100 | 100 | |||
| 13-17 | Total Score | 422 | 47 | 49 | 61 | 66 | 69 | 73 | 76 | 81 | 88 | 95 | 97 | |
| Cognition | 46 | 50 | 61 | 68 | 71 | 75 | 79 | 82 | 89 | 96 | 100 | |||
| Self | 40 | 45 | 55 | 65 | 70 | 75 | 78 | 85 | 90 | 95 | 100 | |||
| Daily Life and Autonomy | 46 | 50 | 68 | 72 | 75 | 82 | 86 | 89 | 96 | 100 | 100 | |||
| Social Relationships | 42 | 50 | 67 | 71 | 75 | 79 | 82 | 88 | 92 | 100 | 100 | |||
| Emotions | 12 | 19 | 38 | 50 | 62 | 69 | 75 | 81 | 94 | 100 | 100 | |||
| Physical Problems | 17 | 21 | 38 | 50 | 58 | 67 | 75 | 83 | 92 | 100 | 100 | |||
| Total Score | 1748 | 47 | 53 | 62 | 68 | 71 | 74 | 77 | 81 | 88 | 96 | 100 | ||
Note: 50% percentiles represent 50% of the distribution, corresponding to both the median (Md) and the mean; SD: standard deviation; values from −1 standard deviation (16% rounded up to the next integer) to +1 standard deviation (85% rounded up to the next integer) are within the normal range; values below 16% indicate low quality of life and values above 85% indicate high quality of life.
Disclaimer/Publisher’s Note: The statements, opinions and data contained in all publications are solely those of the individual author(s) and contributor(s) and not of MDPI and/or the editor(s). MDPI and/or the editor(s) disclaim responsibility for any injury to people or property resulting from any ideas, methods, instructions or products referred to in the content. |
© 2024 by the authors. Licensee MDPI, Basel, Switzerland. This article is an open access article distributed under the terms and conditions of the Creative Commons Attribution (CC BY) license (http://creativecommons.org/licenses/by/4.0/).
Copyright: This open access article is published under a Creative Commons CC BY 4.0 license, which permit the free download, distribution, and reuse, provided that the author and preprint are cited in any reuse.


