Submitted:
13 February 2024
Posted:
15 February 2024
Read the latest preprint version here
Abstract
This work is aimed at investigating the capabilities and limits of the mid-fidelity numerical solver DUST for the evaluation of wind turbines aerodynamic performance. In particular, this study was conducted by analysing the benchmarks NREL- 5MW and Phase VI wind turbines, widely investigated in literature by from experimental and numerical activities. The work started by simulating simpler configuration of the NREL- 5MW turbine to progressively integrate complexities such as shaft tilt, cone effects and yawed inflow conditions, offering a detailed portrayal of their collective impact on turbine performance. A particular focus was then given to the evaluation of aerodynamic responses from the tower and nacelle, as well as aerodynamic behavior in yawed inflow condition, crucial for optimizing farm layouts. In the second phase, the work was focused on NREL Phase VI turbine due to the availability of experimental data on this benchmark case. Comparison of DUST simulations results with both experimental data and high-fidelity CFD tools shows the robustness and adaptability of this mid-fidelity solver for this applications, thus opening a new scenario for the use of such mid-fidelity tools for the preliminary design of novel wind turbines configurations or complex environments as wind farms, characterised by robust interactional aerodynamics.
Keywords:
Wind Turbine
; Aerodynamics
; Vortex Particle Method
; Computational Fluid Dynamics
1. Introduction
In recent years, the challenge to develop sustainable ways to produce energy has made the interest in wind energy to grow with a high rate. This challenge has been accompanied by an evolution in the methods used evaluate the aerodynamic performance of wind turbines, representing a key-factor for the development of more effective solutions in this field. These methods vary widely in complexity and fidelity, each serving different needs within the industry. To evaluate the aerodynamic performance of wind turbines previous research studies were mainly directed on experiments considering both wind tunnel [1] or wind field measurements. Although the aerodynamics of the wind turbine is extremely complicated, accurate measurements are still essential in wind energy research field even if they require a substantial economical effort. Nevertheless, numerical methods have shown in recent years to be a valid and cheaper alternative to calculate accurately wind turbine aeodynamic performance. Indeed, numerical methods offer a different degree of fidelity based on their mathematical formulation and the computational effort required.
Starting from lower order numerical methods widely used for wind turbines study, blade element momentum (BEM) theory [2] represents a two-dimensional method suitable to provide a fast estimation of aerodynamic forces on rotating blades. However, BEM method does not consider span-wise flow features on the blade and cannot capture the fine details related to boundary layer modelling. Moreover, this method relies on empirical functions to reproduce dynamic stall effects or blade tip loss due to compressibility [3]. Thus, BEM method, while computationally efficient are limited in accuracy, particularly for the simulations of complex flow conditions characterised by interactional aerodynamics or when stall phenomena occurs. On the other hand, Computational Fluid Dynamics (CFD) methods based on Navier-Stokes equations solvers provide more comprehensive and accurate results in wind turbines application, thanks to an effective modelling of blades boundary layer and of a physical representation of their wakes[4]. The trade-off for the increasing accuracy is a significant increase in computational resources and time effort, making CFD less practical for early-stage design and more suited for final validation and detailed analysis of wind turbine applications.
Mid-fidelity numerical methods, widely investigated in recent years particularly for rotary wings applications, strike a balance between computational efficiency and accuracy. These methods, mainly based on Vortex Particle Method (VPM) for wake modelling [5,6], showed to be promising to provide a more accurate representation of both aerodynamic loads and interactional flow physics of wind turbines at a quite lower computational costs with respect to high-fidelity CFD. Thus, these tools can be considered quite interesting to be used for the preliminary design phase of wind turbines configurations or complex environments as wind farms, characterised by robust interactional aerodynamics. Indeed, several mid-fidelity aerodynamic codes were developed in recent years to support the design process of rotary wing applications. Just to cite few examples, DLR developed UPM [7], an unsteady panel and free-wake code originally intended for aeroacoustic simulations of helicopters but recently applied on arbitrary complex configurations as compound rotorcraft [8]. Moreover, GENeral Unsteady Vortex Particle (GENUVP) software ,based on a panel method coupled with a VPM solver, was developed at the National Technical University of Athens (NTUA) for both aerodynamic and aeroacoustic simulations of rotary wing applications, from helicopters to wind turbines [9].
Starting from a collaboration with Airbus, Politecnico di Milano developed the mid-fidelity aerodynamic solver DUST implementing a robust formulation of different aerodynamic elements from lifting lines to surface panels. This numerical solver, based on the use of VPM for wake modelling was thoroughly validated against experiments and high fidelity CFD over several rotorcraft configurations with increasing complexity [10,11,12,13] and now represents one of the most mature mid-fidelity solvers widely used both from academics and industry, particularly for the preliminary design of multi-rotors architectures in aeronautics. Thus, the present work is aimed to provide a thorough validation of DUST solver for a different challenge, i.e., aerodynamics characterisation of wind turbines. The validation of DUST within this work will consist of a meticulous comparison of aerodynamic load and response predictions with those from high-fidelity CFD codes and experimental standards. With this aim, two benchmark test cases widely investigated in wind energy field were selected.
The first benchmark is the NREL (National Renewable Energy Laboratory) offshore 5MW baseline wind turbine (NREL- 5 MW). It was developed as a theoretical framework for validating turbine models [14] and was extensively validated using the NREL BEM model FAST [15]. Indeed, due to the fact that all details of the geometry and airfoil properties of the turbine are publicly available, this three blades turbine, in an upwind, horizontal axis configuration was widely investigated in literature. URANS simulations of the NREL- 5 MW were performed in [16,17,18]. Then, particular interest was given to the study of wake prediction, as shown in [19,20,21]. This wind turbine reference was also used as a good benchmark to validate Fluid Structure Interaction tool chains, as shown in [22,23,24,25,26].
The second benchmark used in this work is represented by NREL Unsteady Aerodynamics Experiment Phase VI (‘NREL Phase VI’), performed on a 20kW, 10m diameter, two-bladed rotor wind turbine in the NASA Ames Research Center wind tunnel [1]. The main purpose of the tests were to acquire measurements on the aerodynamic and structural response of a horizontal axis wind turbine. Many researchers have performed simulations of the NREL Phase VI experiment for validation of their solvers. Sorensen et al. [27] and Langer Moller et al. [28] used a RANS simulation to predict loading and force coefficients, while in Hsu et al. [29] fluid-structure interaction simulations were performed with stabilized multiscale methods on this test case.
The specific goals of the present work were therefore to corroborate the accuracy of DUST against high-fidelity simulations for the NREL- 5 MW wind turbine, with a particular emphasis on the impact of principal wind turbine parameters such as rotor shaft tilt, rotor cone angle, yawed inflow and blade-tower interaction. Moreover, DUST simulations were also performed for the NREL Phase VI small wind turbine to confirm the code’s robustness by comparison with experimental data, focusing on the code’s ability to accurately forecast performance metrics. Generally, this research aims to establish the foundation for broader application of mid-fidelity codes in wind energy, particularly during iterative design and analysis phases requiring a proper balance between computational swiftness and accuracy.
2. DUST software
The mid-fidelity open-source software DUST1 has been developed by Politecnico di Milano since 2017 for the simulation of the interactional aerodynamics of rotorcraft and unconventional aircraft configurations [30]. The code is released under the open-source MIT license. The capabilities of the code have been quite extended in recent years and DUST has been also coupled to the open-source multibody solver MBDyn [31], also developed at Politecnico di Milano, enabling to perform aeroelastic analysis of complete rotorcraft configurations. The mathematical formulation of DUST relies on an integral boundary element formulation of the aerodynamic problem and VPM of the wakes. This choice naturally fits the Helmholtz decomposition of the velocity field from a mathematical point of view and avoids the numerical instabilities occurring with connected models of the wake. A model can be composed of several components, connected to user-defined reference frames, whose position and motion can be defined in a hierarchical way. Different aerodynamic elements allow for different levels of fidelity in the model, ranging from lifting line elements to zero-thickness lifting surfaces and surface panels for thick solid bodies.
Since the VPM is a grid-free Lagrangian approach that models the free vorticity of wakes, a DUST model needs only surface meshes eliminating the need for a volume mesh of the flow surrounding the object being studied. This approach enables a robust representation of the interacting wakes generated by lifting surfaces and bodies, as is typically seen in rotary-wing vehicle applications. A DUST model can be made up of multiple components that use different aerodynamic elements, offering varying levels of accuracy in the model ranging from lifting line elements [32,33] to vortex lattices and surface panels [34].
The lifting line (LL) element used in DUST is a one-dimensional model that represents thin, slender lifting bodies. The element considers the sectional aerodynamic coefficients of lift, drag, and pitching moment calculated on the base on the local angle of attack, the local Reynolds number and the local Mach number. By taking into account the airfoil’s camber and thickness, as well as the effects of viscosity and compressibility, the model is able to accurately calculate aerodynamic loads. However, since the problem is stated in explicit form, numerical instability may occur during aerodynamic or aeroelastic analysis.
The vortex lattice (VL) method offers a discrete representation of the average surface of thin lifting bodies by modeling them as a sheet of vortex rings with an intensity of Γ. This is equivalent to a piecewise-uniform surface doublet distribution. While the VL method accounts for compressibility effects by applying a Prandtl-Glauert correction to the loads, it cannot capture the non-linear behavior of aerodynamic loads. To ensure numerical stability, the VL element utilizes a fully implicit numerical scheme. The non-linear vortex lattice element (NL-VL) has been implemented in order combine a surface discretisation with the capability of LL to use an aerodynamic database to introduce viscous corrections. This hybrid element formulated according to an implicit method allows a higher robustness in terms of accuracy and numerical stability. Further details about the formulations of this quite novel element can be found in [35].
The surface panels (SP) are formulated as a Morino-like problem [36] in implicit form. This allows the SP element to accurately describe the real shape of the component by applying non-penetration boundary conditions in the physical position. However, the SP element is not able to capture the non-linear effects on aerodynamic loads.
The reader is referred to [30] for a complete mathematical formulation of the code.
3. Numerical Models
3.1. NREL-5 MW Configuration
The first test case considered is the NREL- 5 MW offshore wind turbine. It is a three bladed horizontal axis utility scale turbine with a rotor diameter D= 126 m developed by Jonkman et al. [14]. This is a widely used test case for aerodynamics and aeroelasticity research as all details of the turbine geometry and of the operating conditions are public, which is not the case for large scale commercial turbines. NREL- 5 MW machine is a purely theoretical wind turbine and therefore no experimental data is available to validate simulations. However, the extensive simulations conducted on this test case lend substantial credibility to its applicability for this study. A summary of the turbine’s essential features is presented in Table 1.
The blade includes two non-lifting cylindrical segments and a combination of five DU airfoils and one NACA airfoil distributed over 18 spanwise sections. Specifications regarding the airfoil positioning, chord lengths and angles of twist used to build DUST numerical model are detailed in Table 2.
The hub of the NREL- 5 MW wind turbine is positioned 5 m upwind from the tower’s centerline and elevated 90 m above the ground in an undeflected state. This configuration aligns with the vertical distance from the tower top to the hub height, set at . Consequently, the yaw bearing’s elevation above ground or mean sea level (MSL) is established at .
DUST numerical model of this wind turbine includes blades, tower, hub and nacelle. Two different models of the blades are built using both lifting lines (LL) and non-linear vortex lattices (NL-VL). Both aerodynamic elements require input tables containing the aerodynamic coefficients of two-dimensional airfoils to introduce the viscous corrections on the load obtained with the potential solution. The airloads tables are obtained by XFoil [37] simulations performed before the stall region, i.e., for a range of angle of attack between ° and 15 °. Airfoil aerodynamic coefficients in the angle of attack range between ° and 180 °) are obtained through the Viterna method [38]. The tower and the nacelle surface are modelled using surface panels (SP), particularly 2700 elements for the tower and 600 elements for the nacelle. Figure 1 shows the mesh of the complete DUST numerical model of the NREL- 5 wind turbine.
A spatial and time-step sensitivity analysis was performed to select the simulations parameters to be used for the study. A detailed description of this analysis can be found in [39]. Results of spatial sensitivity analysis suggested to select for each blade a discretisation of 75 elements along span-wise direction and 5 elements along chord-wise direction for NL-VL. Time sensitivity analysis suggested the use of 72 steps per revolution for a total duration of the simulation of 50 , corresponding to about 10 rotor revolutions. This parameters choice balances computational efficiency with the fidelity of load pattern capture, thus serving the dual aims of computational economy and detailed aerodynamic characterization. Indeed, one of the main goal of the activity is to evaluate DUST proficiency in capturing the fundamental aerodynamic phenomena pertinent to wind turbine simulations and to ensure that the tool remains computationally economical. As a matter of fact, all the simulations performed in this work were performed using a commercial laptop. In particular, the most expensive simulation of the complete wind turbine requires about 40 minutes using a four cores commercial laptop.
The wind turbine configuration and parameters used in DUST simulations for the NREL- 5 wind turbine are listed in Table 3. A total of four rotor configurations are explored, each addressing different aspects of rotor and wind turbine performance. Configurations C1, C3, and C4 are assessed under direct rated inflow conditions, whereas configuration C2 is evaluated with a yaw inflow angle up to 30 °. Finally, to investigate the blade tower interaction, a full wind turbine configuration was considered, dealing with C4 case rotor modelling.
3.2. NREL Phase VI Configuration
The second test case considered is the NREL Unsteady Aerodynamics Experiment (UAE) Phase VI wind turbine [40] tested at NASA Ames wind tunnel. A summary of the turbine’s essential features is presented in Table 4.
The rotor blades use the NREL S809 airfoil and the relative specifications regarding the chord and twist distributions are detailed in Table 5.
The hub of the NREL Phase VI wind turbine is positioned upwind from the tower’s centerline and elevated above the ground in an undeflected state. The base and tip diameter of the tower are respectively and . DUST numerical model includes the rotor and the tower-nacelle assembly. The tower and the nacelle are modelled by surface panels, respectively using 2700 and 600 elements. For the present test case DUST numerical model of the blades are built using NL-VL elements only. Results of spatial sensitivity analysis reported in details in [39] suggested to select for each blade a discretisation of 50 elements along span-wise direction and 5 elements along chord-wise direction. Simulations of the present test case use the same parameters for time-step and duration selected for the NREL- 5 case. The model of the NREL Phase VI wind turbine is shown in Figure 2.
The wind turbine configuration and parameters used in DUST simulations for the NREL Phase VI wind turbine are listed in Table 6. In particular, simulations considers the single rotor configuration with blade pitch at 3 ° windward, zero yaw and different free-stream velocities and full model configuration with same rotor at two different free-stream velocities.
4. Results and Discussion
4.1. NREL-5 MW Wind Turbine
The first step of the validation process involves simulating the simplest configuration of the wind turbine C1 at rated conditions, not taking into account neither the shaft tilt angle nor blade cone angle . DUST results are compared to the ones obtained with high-fidelity numerical simulation conducted by Dose et al. [22] using RANS approach and by Leng et al. [41].
Figure 3 shows the time histories of aerodynamic power and thrust computed by DUST employing both NL-VL and LL elements compared to [22] CFD results. A convergence of integral loads can be observed for DUST simulations after 30 seconds corresponding almost to 8 revolutions. A good correlation in terms of aerodynamic power between CFD and DUST results, considering both LL and NL-VL elements can be observed. A quite good agreement was found in terms of aerodynamic thrust considering particularly NL-VL elements, while LL elements seems to slightly under-predict the CFD thrust output. Generally, results comparison suggests a quite similar accuracy with respect to CFD that can be obtained from DUST for the calculation of integral loads of a wind turbine at rated inflow condition but with a significant lower computational cost.
Figure 4 shows the comparison of the normal and tangential sectional forces acting along the normalised spanwise coordinate of the blade computed by DUST NL-VL model and high fidelity CFD simulation by Dose et al. [22]. The normal force density comparison illustrated in Figure 4a exhibits a close alignment between DUST and high fidelity CFD data along almost the majority of the blade span. However, near the blade tip DUST slightly underestimate the normal force. This behaviour is expected as wing tip are characterized by a more complex flow regime where three-dimensional phenomena and tip vortices generation typically leads to significant viscous effects and separated flow regions, which can not be accurately captured by DUST mid-fidelity approach. Tangential force density comparison depicted in Figure 4b shows an underestimation of DUST computation before the first 30% of blade span and a slight overestimation in the central spanwise region. High-fidelity CFD model, however, shows a more pronounced decrease in tangential force towards the blade tip with respect to DUST results, that can be reasonably explained, as said before, by the limits of mid-fidelity approach in this region. Generally speaking, the behaviour of the sectional force comparison confirms the capability of DUST to competently reproduces the general force distribution along the blade span.
The performance of a wind turbine are significantly affected by the wind turbine wake, then a crucial step for DUST validation is the ability to correctly capture the wake development and its main features in terms of velocity field. Then, the deficit of the axial velocity in the wake calculated by DUST is compared with the high-fidelity simulation by [42], considering 4 stream wise position located at different distances x downstream from the rotor plane. Velocity profiles comparison is shown in Figure 5 as function of z, representing the distance from the shaft axis parallel to the rotor plane.
A quite good agreement was found between axial velocity profiles in the wake of the wind turbine, particularly near to the rotor disk, i.e., and . Some discrepancies were found at higher distances where CFD results show a slightly larger extension of the wake, probably due to numerical diffusion. Generally, Figure 6 illustrates the wake structure computed by DUST shown as an iso-surface of the vortex Q-criterion. Readers are referred to results reported in [42] to appreciate DUST capability to capture the behaviour of the wake structure computed by CFD.
The influence of blade cone angle and shaft tilt angle on the aerodynamic performance under rated inflow conditions is now explored by comparing results obtained with DUST and high-fidelity CFD by Dose et al. [22] over C1, C3 and C4 cases. Generally, the sensitivity of integral loads to cone and tilt angles variations is minimal. Indeed, adding a blade cone angle a slight increase of the rotor power is observed. On the other hand, introducing a shaft tilt slightly reduces rotor power and thrust. In particular, the integral power and thrust on the rotor are compared in Table 7. Both DUST models provide values quite similar to high-fidelity CFD findings. A difference below 2% is found for power evaluation with both LL and NL-VL elements, while thrust evaluation obtained by DUST with NL-VL is in quite good agreement with CFD. An underestimation of rotor thrust of about 8% is found for LL DUST model with respect to CFD.
Case C4 enabled to provide an insight of the effects of varying freestream velocity, thanks to high-fidelity CFD results from Sørensen and Johansen [16], Lin et al. [17], Wu and Nguyen [18]. Figure 7 compares the computed power and thrust as function of wind speeds. Generally, both DUST models capture the behaviour of power and thrust curves evaluated by CFD, thus confirming the capability to model correctly the effects of wind inflow on rotor performance. In particular, LL elements model tends to slightly overestimate power production below the rated wind speed, while NL-VL elements model slightly overestimates rotor power above the rated speed. Now considering thrust evaluation, LL elements model tends to underestimate CFD high-fidelity data along the entire velocity spectrum, while a quite better agreement is obtained with NL-VL elements model.
Different yawed configurations are then investigated. At first, a yaw angle is considered to assess the integral and the sectional parameters with respect to high fidelity CFD simulation by Dose et al. [22]. Then, other two yaw angles configurations are considered, respectively to be compared with the LES study by yaw [20]. Table 8 compares the integral rotor power and thrust computed for C2 configuration with . Once again, errors in terms of power and thrust with respect to CFD by Dose et al. [22] are below 10% for both DUST models. Compared to the axial flow condition case, power and thrust outputs decrease respectively by 27% and the thrust of 12% in accordance to CFD evaluation by Dose et al. [22].
In order to quantify the local effect on blades subjected to yawed inflow, sectional normal and tangential forces are compared at three different spanwise coordinates in Figure 8 as function of blade azimuthal angle in the last computed revolution. Generally, DUST tends to calculate higher normal and tangential force densities up to 60% of the span coordinate, while lower force densities are found near the blade tip compared to the high-fidelity CFD results that could be attributed to the complex three-dimensional flow effects occurring in this region. Nevertheless, the local behaviour of the forces acting on blades are captured by DUST representation also in yawed conditions.
Another important feature to better understand the capability to capture the wind turbine wake behaviour for yawed configuration is the study of the evolution of the wake center-lines and the associated skew angles. The wake center-lines is an imaginary line that runs through the middle of the wake, marking the trajectory of the region with the highest velocity deficit caused by the wind turbine and represents the path that the wake follows downstream the turbine. This line can be calculated as the integral of the velocity deficit on a wake section perpendicular to the flow direction divided by the area of that section [43]. This method gives an average value that accounts for the different velocities across the entire wake area, providing a singular measure of the wake’s strength. The skew angles, instead, gives a more quantitative analysis of the wake center trajectories. Skew angle is the angular measure between the position vector extending from the rotor disk midpoint and the normal vector to the rotor disc, as shown in Figure 9 and defined in Equation (1). Figure 10 shows the skew angles behaviour calculated by DUST compared with LES results by Kim and Lee [21], for yawed conditions ranging from to . The comparison shows how DUST is capable to evaluate correctly the wake center line evolution and the corresponding skew angles that change with respect to yaw angle and show a peak around .
The final configuration considered deals with the complete case equipped with tower and nacelle for C4 rotor condition. Figure 6 illustrates a visualisation of wake structure computed by DUST for the complete wind turbine shown as an iso-surface of the vortex Q-criterion.
As done before, DUST simulations results using both LL and NL-VL models are compared with the high fidelity CFD calculation by Yu and Kwon [26] and Lin et al. [17]. The results in terms of integral loads comparison are presented in Table 9 for single rotor and full wind turbine.
The introduction of nacelle and tower provides a reduction of the rotor performance for both power and thrust. This behaviour is captured by DUST simulations, thus showing the capability to reproduce interactional effects between rotor wake and tower, as done by CFD. In particular, NL-VL model shows integral values in quite good agreement with high-fidelity CFD [17] as evaluated differences are below than 5% for both power and thrust.
4.2. NREL Phase VI
Firstly, the single rotor performance is considered at four different wind speed. The integral rotor thrust T and torque Q computed by DUST using NL-VL model are compared in Figure 12 with experimental data from Hand et al. [1] activity and with high-fidelity CFD data by Länger-Möller et al. [28]. In these figures the standard deviation of the experimental loads is reported as a banded region.
The thrust and torque values computed by DUST show a good agreement with the overall trend of the high fidelity CFD and the experimental data. In particular, DUST computations fall into the confidence band of the experiments almost in the whole range of wind speed considered by the simulations. Indeed, an apparent difference occurs for torque computations at 7 m/s, probably due to the occurrence of massive flow separations in this condition. Generally, the differences of the integral loads values obtained by DUST with respect to the average experimental values are of the same order of the ones obtained by high-fidelity CFD, thus further confirming the promising capability of the mid-fidelity approach for the evaluation of wind turbine aerodynamic performance with respect to methods requiring a quite higher computational effort.
As done before, blade sectional normal and tangential force are compared respectively in Figure 13 and Figure 14 for the four wind velocities analysed. Once again, the trends of the sectional forces resembles the experimental data, just showing slight offsets along blade span particularly for normal force while higher discrepancies can be found for tangential component particularly at low speed.
The second part of the validation deals with the analysis of the influence of the blade-tower interaction, thus the complete wind turbine configuration was considered by DUST simulations at two wind speeds. An overview of rotor thrust and torque computed by DUST and compared with experiments and high-fidelity CFD data is given respectively in Table 10 and Table 11. Once again, a good agreement of the integral loads values are found for DUST simulations also for the complete wind turbine model, but an exception is found for torque calculation at lower speed analogously to what found before.
A detailed insight on loads behaviour is provided by the time histories of the rotor torque evaluated on the last computed revolution for the full wind-turbine at different wind speeds. Comparisons with experiments shown in Figure 15 distinctly illustrates DUST capability to reproduce the reduction in aerodynamic torque as a blade passes in front of the tower around azimuthal angle of . This reduction, quantified to be approximately 10% relative at 7 m/s with respect to the torque value evaluated when the blade is not influenced by the tower is aligned with experimental observations. At wind speed, the tower influence is still detectable but is considerably lower but DUST representation remains in good agreement with experimental data.
5. Conclusions
The present activity was aimed to the validation of the mid-fidelity numerical solver DUST for the evaluation of wind turbine aerodynamics. This study involved the numerical modelling of two wind turbines widely investigated in literature for numerical tools validation purpose. A thorough comparison of DUST simulations results with both experimental and high-fidelity CFD data showed the capabilities of the mid-fidelity solver to reproduce the rotor integral loads characteristics and sectional loading acting on blades for a complete wind turbine with a degree of accuracy comparable to CFD. In particular, the validation study reports also the capability to capture the effects on performance related to the variation of both the direction and magnitude of inflow speed. Limitations in performance evaluation are just limited to wind turbine operating conditions characterised by robust flow separations. Moreover, thanks to the implemented VPM modelling of the wakes, the solver shows the capability also to reproduce correctly the flow physics involved in wind turbine characterisation. Thus, the outcomes of the present work encourage the use of mid-fidelity approach for the preliminary aerodynamic design of wind turbine configurations requiring a huge number of simulations that could be performed with a quite lower computational effort with respect to high fidelity CFD. In particular, the capability of this VPM-based solver to reproduce interactional flow physics mechanisms of rotary wing machines opens a new scenario for the use of mid-fidelity solvers in the design phase of wind farms.
Author Contributions
Conceptualization, A.S. and A.Z.; methodology, A.S. and A.Z.; software, A.S. and A.F.; validation, A.S., A.F. and A.Z.; formal analysis, A.S. and A.F.; investigation, A.S. and A.F.; resources, A.S. and A.Z.; data curation, A.S. and A.F.; writing—original draft preparation, A.S. and A.F.; writing—review and editing, A.S. and A.Z.; visualization, A.S. and A.F.; supervision, A.S. and A.Z.; project administration, A.Z.; funding acquisition, A.Z. All authors have read and agreed to the published version of the manuscript.
Funding
This research received no external funding
Data Availability Statement
Data would be available on request to authors.
Conflicts of Interest
The authors declare no conflicts of interest.
Abbreviations
The following abbreviations are used in this manuscript:
| x | streamwise coordinate |
| y | transverse coordinate |
| z | vertical coordinate normal to ground |
| u | axial velocity component |
| freestream velocity | |
| lifting line | |
| non-linear vortex lattice | |
| R | Rotor radius |
| D | Rotor diameter |
| P | Aerodynamic Power |
| T | Aerodynamic Thrust |
| Power coefficient | |
| Thrust coefficient | |
| Normal force density | |
| Tangential force density | |
| Normalized span | |
| Normal force density coefficient | |
| Tangential force density | |
| Rotor speed | |
| Pitch Angle | |
| Shaft Tilt angle | |
| Rotor cone angle | |
| Azimuth Angle | |
| Twist Angle | |
| Yaw Angle | |
| Skew Angle |
References
- Hand, M.M.; Simms, D.A.; Fingersh, L.J.; Jager, D.W.; Cotrell, J.R.; Schreck, S.; Larwood, S.M. Unsteady Aerodynamics Experiment Phase VI: Wind Tunnel Test Configurations and Available Data Campaigns 2001. [CrossRef]
- Glauert, H., Airplane Propellers. In Aerodynamic Theory: A General Review of Progress Under a Grant of the Guggenheim Fund for the Promotion of Aeronautics; Springer Berlin Heidelberg: Berlin, Heidelberg, 1935; pp. 169–360. [CrossRef]
- Hansen, M.; Sørensen, J.; Voutsinas, S.; Sørensen, N.; Madsen, H. State of the art in wind turbine aerodynamics and aeroelasticity. Progress in Aerospace Sciences 2006, 42, 285–330. [Google Scholar] [CrossRef]
- Alesbe, I.; Abdel-Maksoud, M.; Aljabair, S. Investigation of the Unsteady Flow Behaviour on a Wind Turbine Using a BEM and a RANSE Method. 2016.
- Cottet, G.H.; Koumoutsakos, P.D.; Petros, D.; others. Vortex methods: Theory and practice; Cambridge University Press, 2000.
- Winckelmans, G.S. Topics in vortex methods for the computation of three-and two-dimensional incompressible unsteady flows. PhD thesis, California Institute of Technology, 1989.
- Yin, J.; Ahmed, S. Helicopter Main-Rotor/Tail-Rotor Interaction. Journal of the American Helicopter Society 2000, 4, 293–302. [Google Scholar] [CrossRef]
- Wentrup, M.; Yin, J.; Kunze, P.; Streit, T.; Wendisch, J.; Schwarz, T.; Pinacho, J.; K, K.; Fukari, R. An overview of DLR compound rotorcraft aerodynamics and aeroacoustics activities within the CleanSky2 NACOR Project. Proceedings of 74th AHS Annual Forum & Technology Display; , 2018.
- Opoku, D.; Triantos, D.; Nitzsche, F.; Voutsinas, S. Rotorcraft Aerodynamic and Aeroacoustic Modelling using Vortex Particle Methods. Proceedings of the 23rd International Congress of Aeronautical Sciences, ICAS; , 2002.
- Montagnani, D.; Tugnoli, M.; Fonte, F.; Zanotti, A.; Droandi, G.; Syal, M. Mid-Fidelity Analysis of Unsteady Interactional Aerodynamics of Complex VTOL Configurations. 45th European Rotorcraft Forum, Sept. 2019, Warsaw, Poland, 2019.
- Zanotti, A.; Algarotti, D. Aerodynamic interaction between tandem overlapping propellers in eVTOL airplane mode flight condition. Aerospace Science and Technology 2022, 124, 107518. [Google Scholar] [CrossRef]
- Droandi, G.; Syal, M.; Bower, G. Analysis of the Interactional Aerodynamics of the Vahana eVTOL Using a Medium Fidelity Open Source Tool. Proceedings of the VFS Aeromechanics for Advanced Vertical Flight Technical Meeting; AHS International, , 2020.
- Piccinini, R. Rotor-rotor aerodynamic interactions for eVTOL aircraft configurations. Master’s thesis, Politecnico di Milano, 2020.
- Jonkman, J.; Butterfield, S.; Musial, W.; Scott, G. Definition of a 5-MW Reference Wind Turbine for Offshore System Development 2009. doi:10.2172/947422. [CrossRef]
- Jonkman, J.M.; Buhl, Jr, M.L. FAST User’s Guide - Updated August 2005 2005. doi:10.2172/15020796. 20 August. [CrossRef]
- Sørensen, N.; Johansen, J. UPWIND, Aerodynamics and aeroelasticity Rotor aerodynamics in atmospheric shear flow 2023.
- Lin, Y.H.; Chen, H.K.; Wu, K.Y. Prediction of aerodynamic performance of NREL offshore 5-MW baseline wind turbine considering power loss at varying wind speeds. Wind Energy 2023, 26, 493–515. Available online: https://onlinelibrary.wiley.com/doi/pdf/10.1002/we.2812. [CrossRef]
- Wu, C.H.K.; Nguyen, V.T. Aerodynamic simulations of offshore floating wind turbine in platform-induced pitching motion. Wind Energy 2017, 20, 835–858. Available online: https://onlinelibrary.wiley.com/doi/pdf/10.1002/we.2066. [CrossRef]
- Rahimi, H.; Hartvelt, M.; Peinke, J.; Schepers, J.G. Investigation of the current yaw engineering models for simulation of wind turbines in BEM and comparison with CFD and experiment. Journal of Physics: Conference Series 2016, 753, 022016. [Google Scholar] [CrossRef]
- Aerodynamics of Horizontal Axis Wind Turbines. In Wind Energy Handbook; John Wiley & Sons, Ltd, 2011; chapter 3, pp. 39–136. Available online: https://onlinelibrary.wiley.com/doi/pdf/10.1002/9781119992714.ch3. [CrossRef]
- Kim, H.; Lee, S. Large Eddy Simulation of Yawed Wind Turbine Wake Deformation. Energies 2022, 15, 6125. [Google Scholar] [CrossRef]
- Dose, B.; Rahimi, H.; Herráez, I.; Stoevesandt, B.; Peinke, J. Fluid-structure coupled computations of the NREL 5MW wind turbine by means of CFD. Renewable Energy 2018, 129, 591–605. [Google Scholar] [CrossRef]
- Hsu, M.C.; Bazilevs, Y. Fluid—Structure Interaction Modeling of Wind Turbines: Simulating the Full Machine. Comput. Mech. 2012, 50, 821–833. [Google Scholar] [CrossRef]
- Leng, J.; Gao, Z.; Wu, M.C.; Guo, T.; Li, Y. A fluid–structure interaction model for large wind turbines based on flexible multibody dynamics and actuator line method. Journal of Fluids and Structures 2023, 118, 103857. [Google Scholar] [CrossRef]
- Imiela, M.; Wienke, F., Towards Multidisciplinary Wind Turbine Design using High-Fidelity Methods. In 33rd Wind Energy Symposium. Available online: https://arc.aiaa.org/doi/pdf/10.2514/6.2015-1462. [CrossRef]
- Yu, D.O.; Kwon, O.J. Predicting wind turbine blade loads and aeroelastic response using a coupled CFD–CSD method. Renewable Energy 2014, 70, 184–196, Special issue on aerodynamics of offshore wind energy systems and wakes. [Google Scholar] [CrossRef]
- Sørensen, N.N.; Michelsen, J.A.; Schreck, S. Navier–Stokes predictions of the NREL phase VI rotor in the NASA Ames 80 ft × 120 ft wind tunnel. Wind Energy 2002, 5, 151–169. Available online: https://onlinelibrary.wiley.com/doi/pdf/10.1002/we.64. [CrossRef]
- Länger-Möller, A.; Löwe, J.; Kessler, R. Investigation of the NREL phase VI experiment with the incompressible CFD solver THETA. Wind Energy 2017, 20, 1529–1549. Available online: https://onlinelibrary.wiley.com/doi/pdf/10.1002/we.2107. [CrossRef]
- Hsu, M.C.; Akkerman, I.; Bazilevs, Y. Finite element simulation of wind turbine aerodynamics: Validation study using NREL Phase VI experiment. Wind Energy 2014, 17, 461–481. Available online: https://onlinelibrary.wiley.com/doi/pdf/10.1002/we.1599. [CrossRef]
- Tugnoli, M.; Montagnani, D.; Syal, M.; Droandi, G.; Zanotti, A. Mid-fidelity approach to aerodynamic simulations of unconventional VTOL aircraft configurations. Aerospace Science and Technology 2021, 115, 106804. [Google Scholar] [CrossRef]
- Savino, A.; Cocco, A.; Zanotti, A.; Tugnoli, M.; Masarati, P.; Muscarello, V. Coupling mid-fidelity aerodynamics and multibody dynamics for the aeroelastic analysis of rotary-wing vehicles. Energies 2021, 14, 6979. [Google Scholar] [CrossRef]
- Gallay, S.; Laurendeau, E. Nonlinear generalized lifting-line coupling algorithms for pre/poststall flows. AIAA Journal 2015, 53, 1784–1792. [Google Scholar] [CrossRef]
- Piszkin, S.T.; Levinsky, E. Nonlinear lifting line theory for predicting stalling instabilities on wings of moderate aspect ratio. Technical report, GENERAL DYNAMICS SAN DIEGO CA CONVAIR DIV, 1976.
- Morino, L.; Kuot, C.C. Subsonic potential aerodynamics for complex configurations: A general theory. AIAA Journal 1974, 12, 191–197. [Google Scholar] [CrossRef]
- Cocco, A.; Colli, A.; Savino, A.; Masarati, P.; Zanotti, A.; others. A non-linear unsteady vortex lattice method for aeroelastic rotor loads evaluation. 48th European Rotorcraft Forum (ERF 2022), 2022, pp. 1–8.
- Morino, L.; Kuot, C.C. Subsonic Potential Aerodynamics for Complex Configurations: A General Theory. AIAA Journal 1974, 12, 191–197. [Google Scholar] [CrossRef]
- Drela, M. XFOIL: An Analysis and Design System for Low Reynolds Number Airfoils. Low Reynolds Number Aerodynamics; Mueller, T.J., Ed.; Springer Berlin Heidelberg: Berlin, Heidelberg, 1989; pp. 1–12. [Google Scholar]
- Viterna, L.A.; Corrigan, R.D. Fixed pitch rotor performance of large horizontal axis wind turbines. 1982.
- Ferreri, A. Thesis: Validation of a mid-fidelity aerodynamic software for wind turbine application 2023.
- Hand, M.M.; Simms, D.A.; Fingersh, L.J.; Jager, D.W.; Cotrell, J.R.; Schreck, S.; Larwood, S.M. Unsteady Aerodynamics Experiment Phase VI: Wind Tunnel Test Configurations and Available Data Campaigns 2001. doi:10.2172/15000240. [CrossRef]
- Leng, J.; Gao, Z.; Wu, M.C.; Guo, T.; Li, Y. A fluid–structure interaction model for large wind turbines based on flexible multibody dynamics and actuator line method. Journal of Fluids and Structures 2023, 118, 103857. [Google Scholar] [CrossRef]
- Fan, Z.; Li, S.; Gao, Z.; Zhang, L.; Zheng, X.; Zhu, W.; Shen, W.; Sjholm, M.; Mikkelsen, T.K.; Wang, T.; Li, Y. On the importance of wind turbine wake boundary to wind energy and environmental impact. Energy Conversion and Management 2023, 277, 116664. [Google Scholar] [CrossRef]
- Bastankhah, M.; Porté-Agel, F. Wind tunnel study of the wind turbine interaction with a boundary-layer flow: Upwind region, turbine performance, and wake region. Physics of Fluids 2017, 29, 065105. [Google Scholar] [CrossRef]
Figure 1.
Mesh of the NREL- 5 wind turbine built for DUST simulations (blades modelled with lifting lines).
Figure 1.
Mesh of the NREL- 5 wind turbine built for DUST simulations (blades modelled with lifting lines).
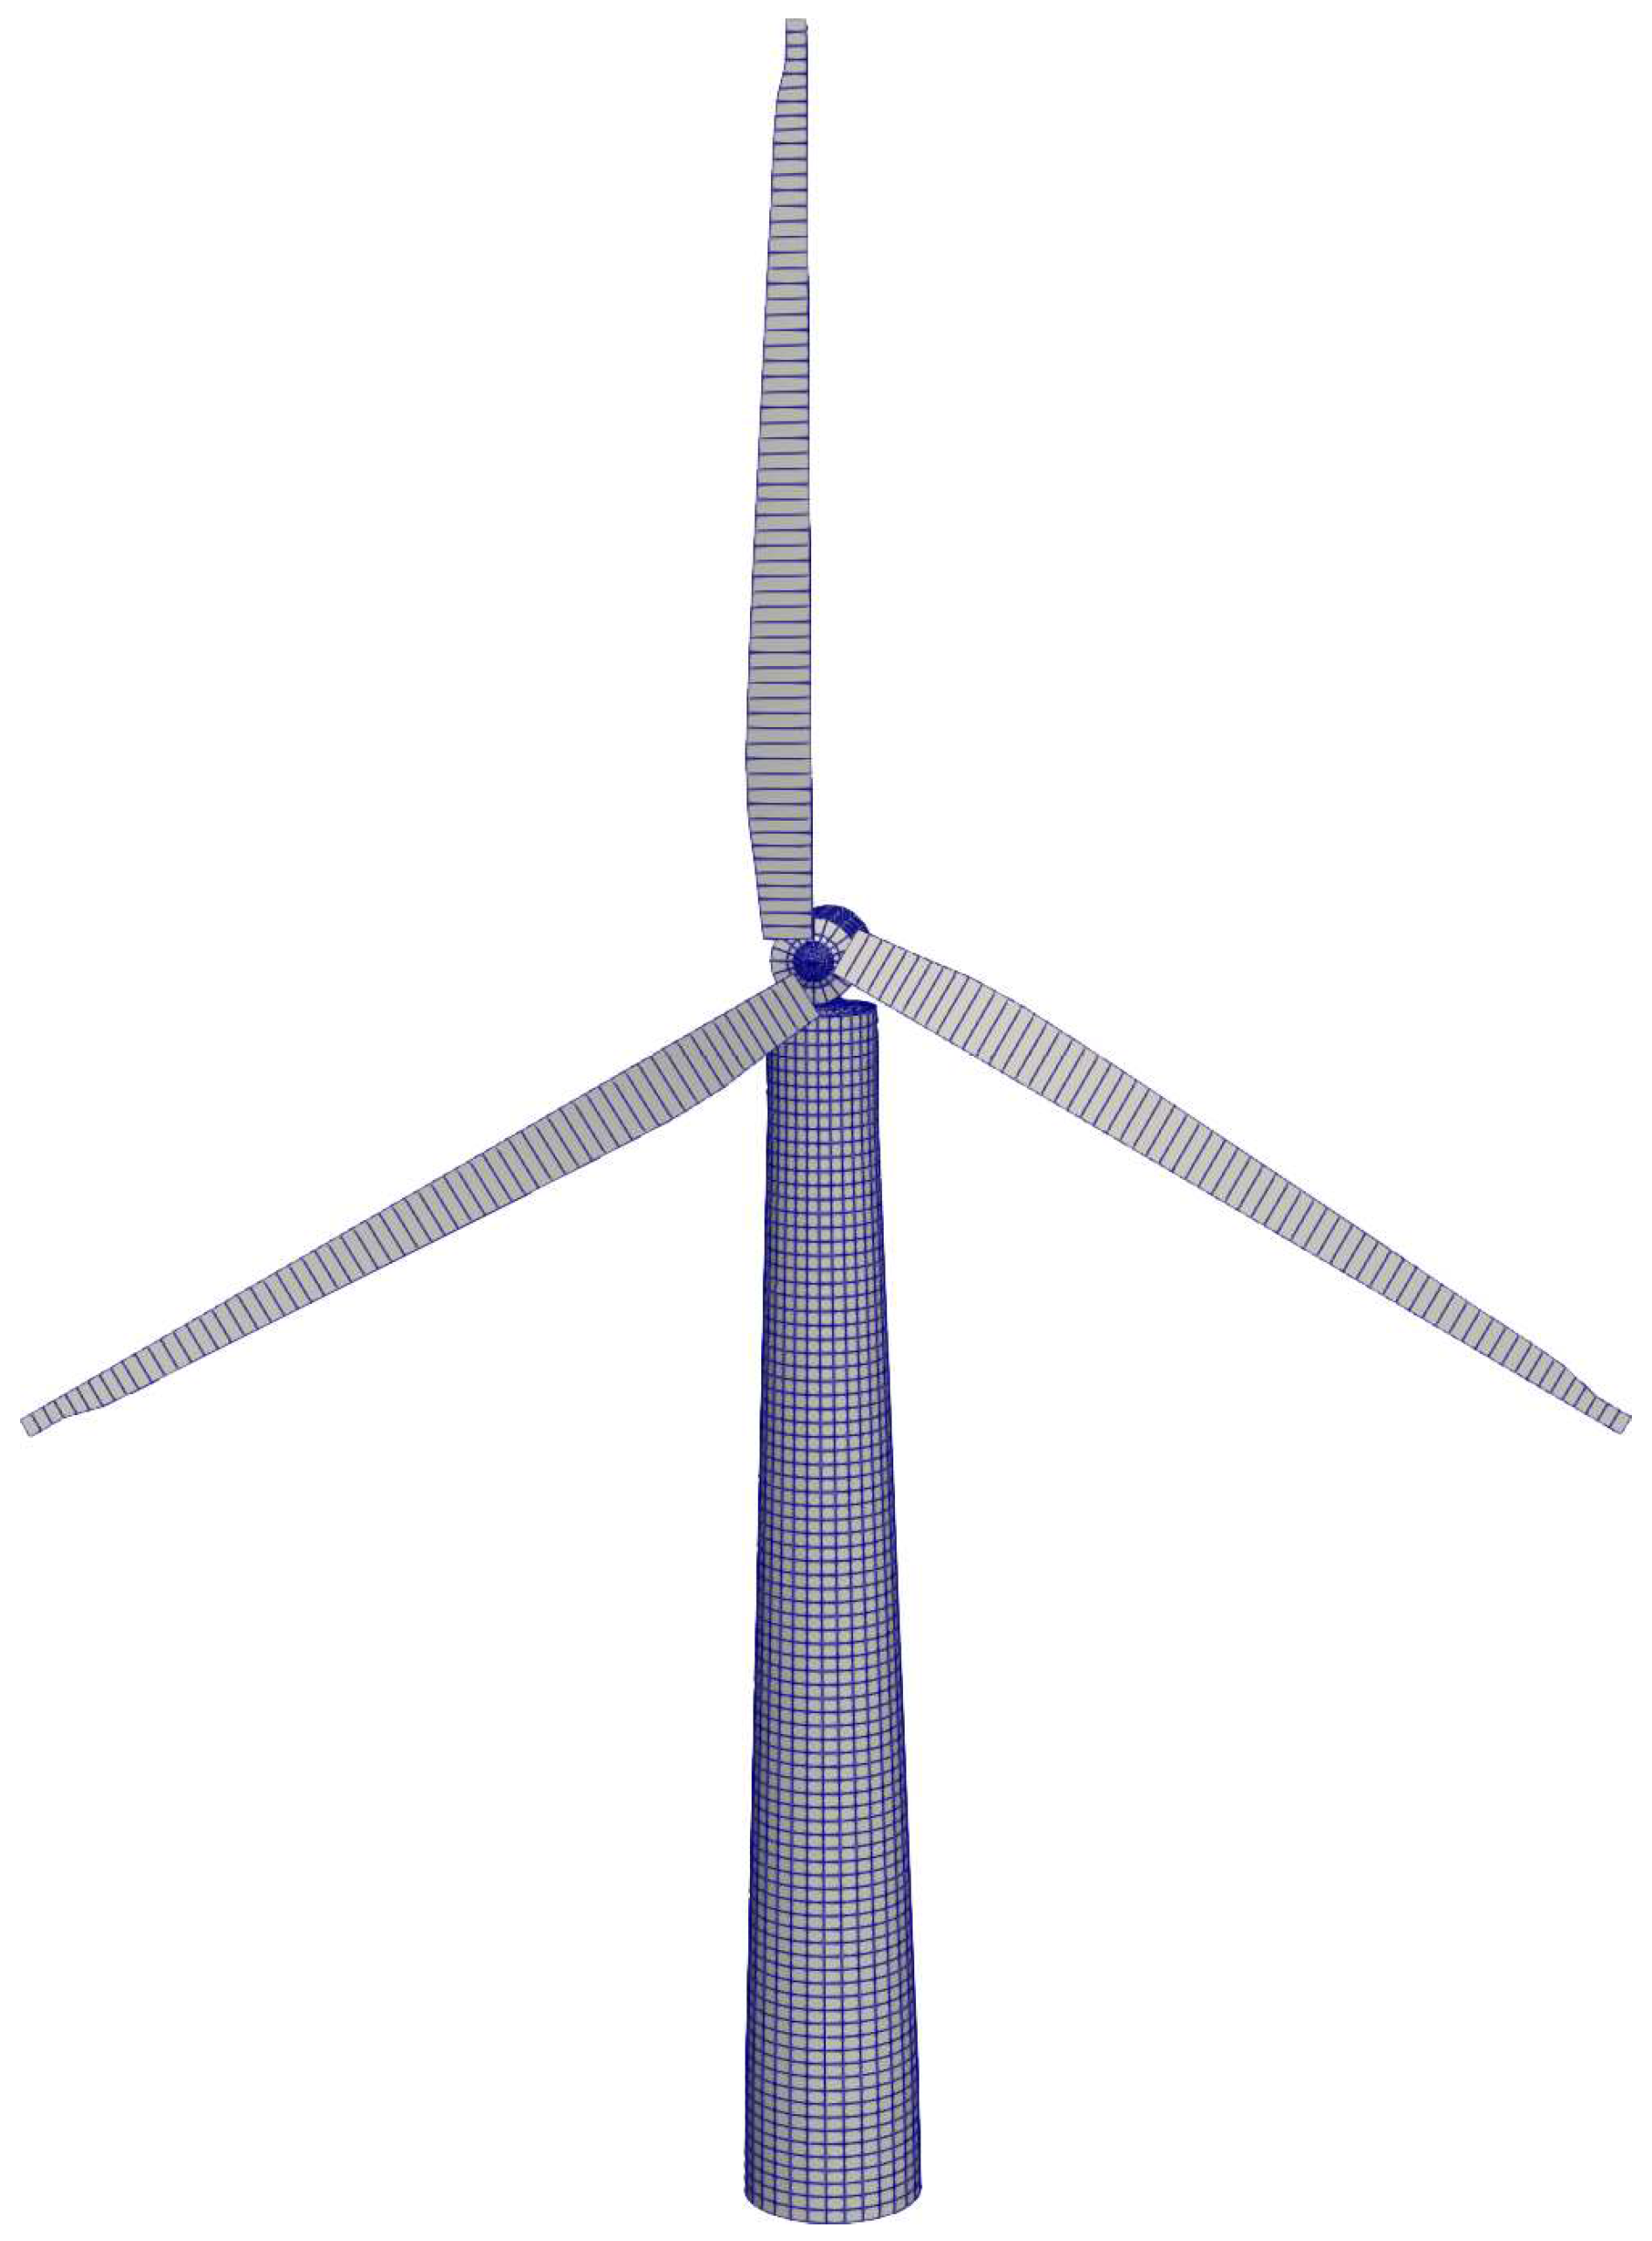
Figure 2.
NREL Phase VI model.
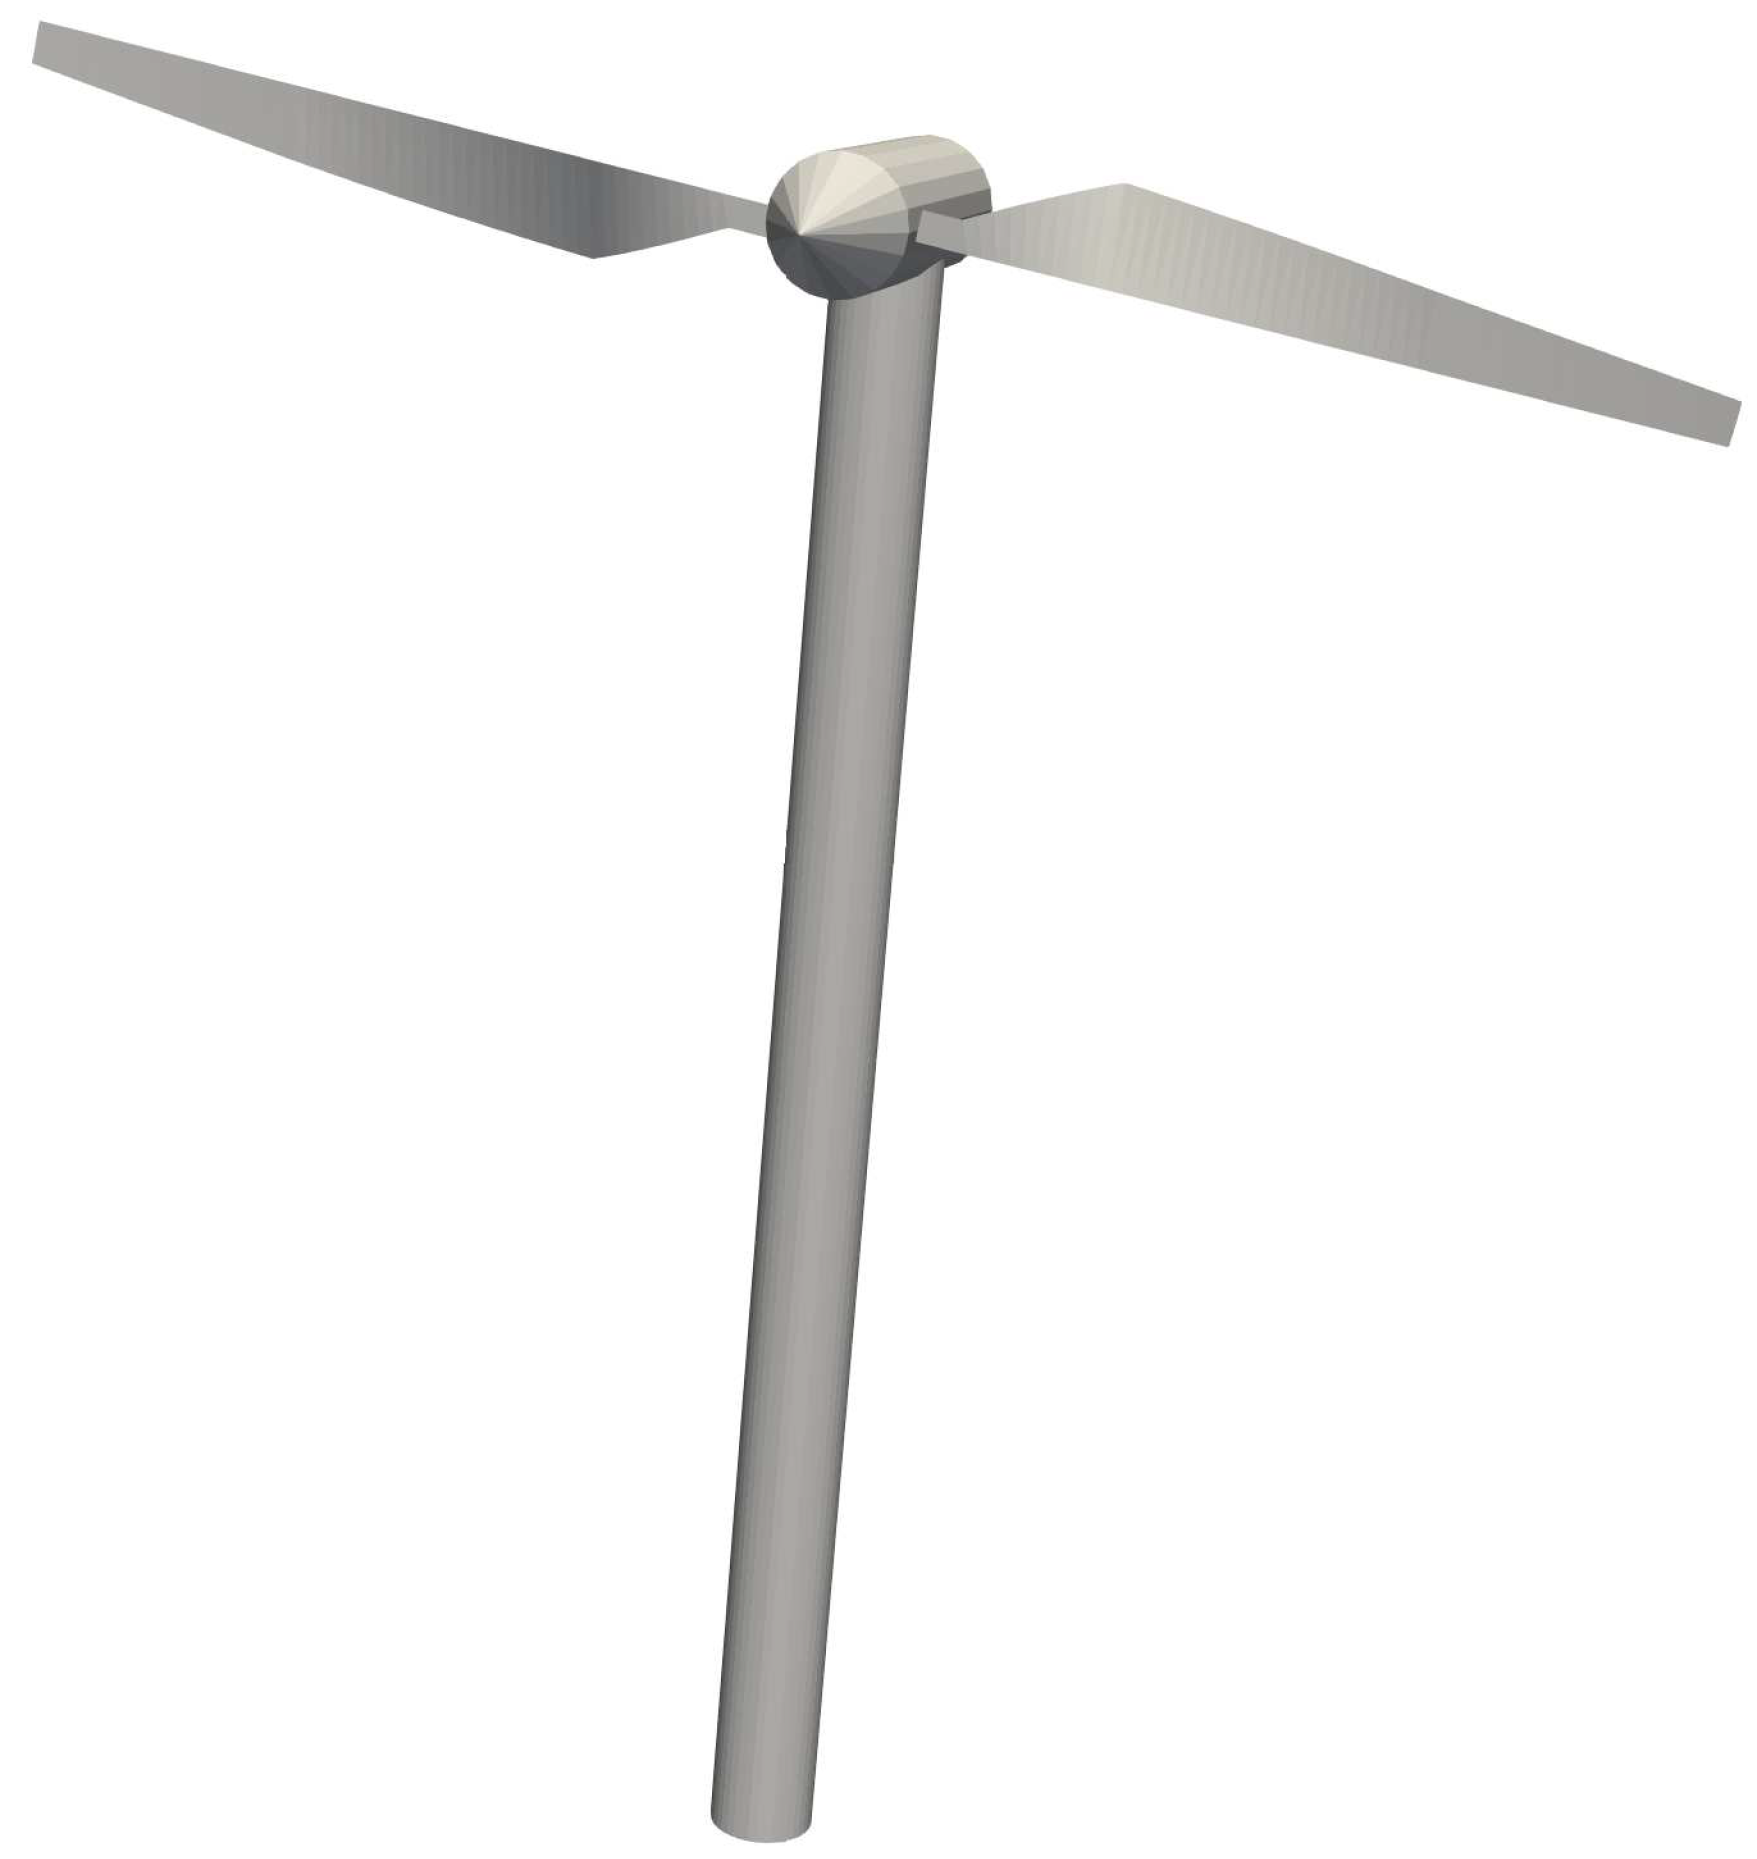
Figure 3.
Comparison of the aerodynamic power and thrust computed by DUST and CFD by Dose et al. [22] for NREL- 5 wind turbine in C1 configuration.
Figure 3.
Comparison of the aerodynamic power and thrust computed by DUST and CFD by Dose et al. [22] for NREL- 5 wind turbine in C1 configuration.
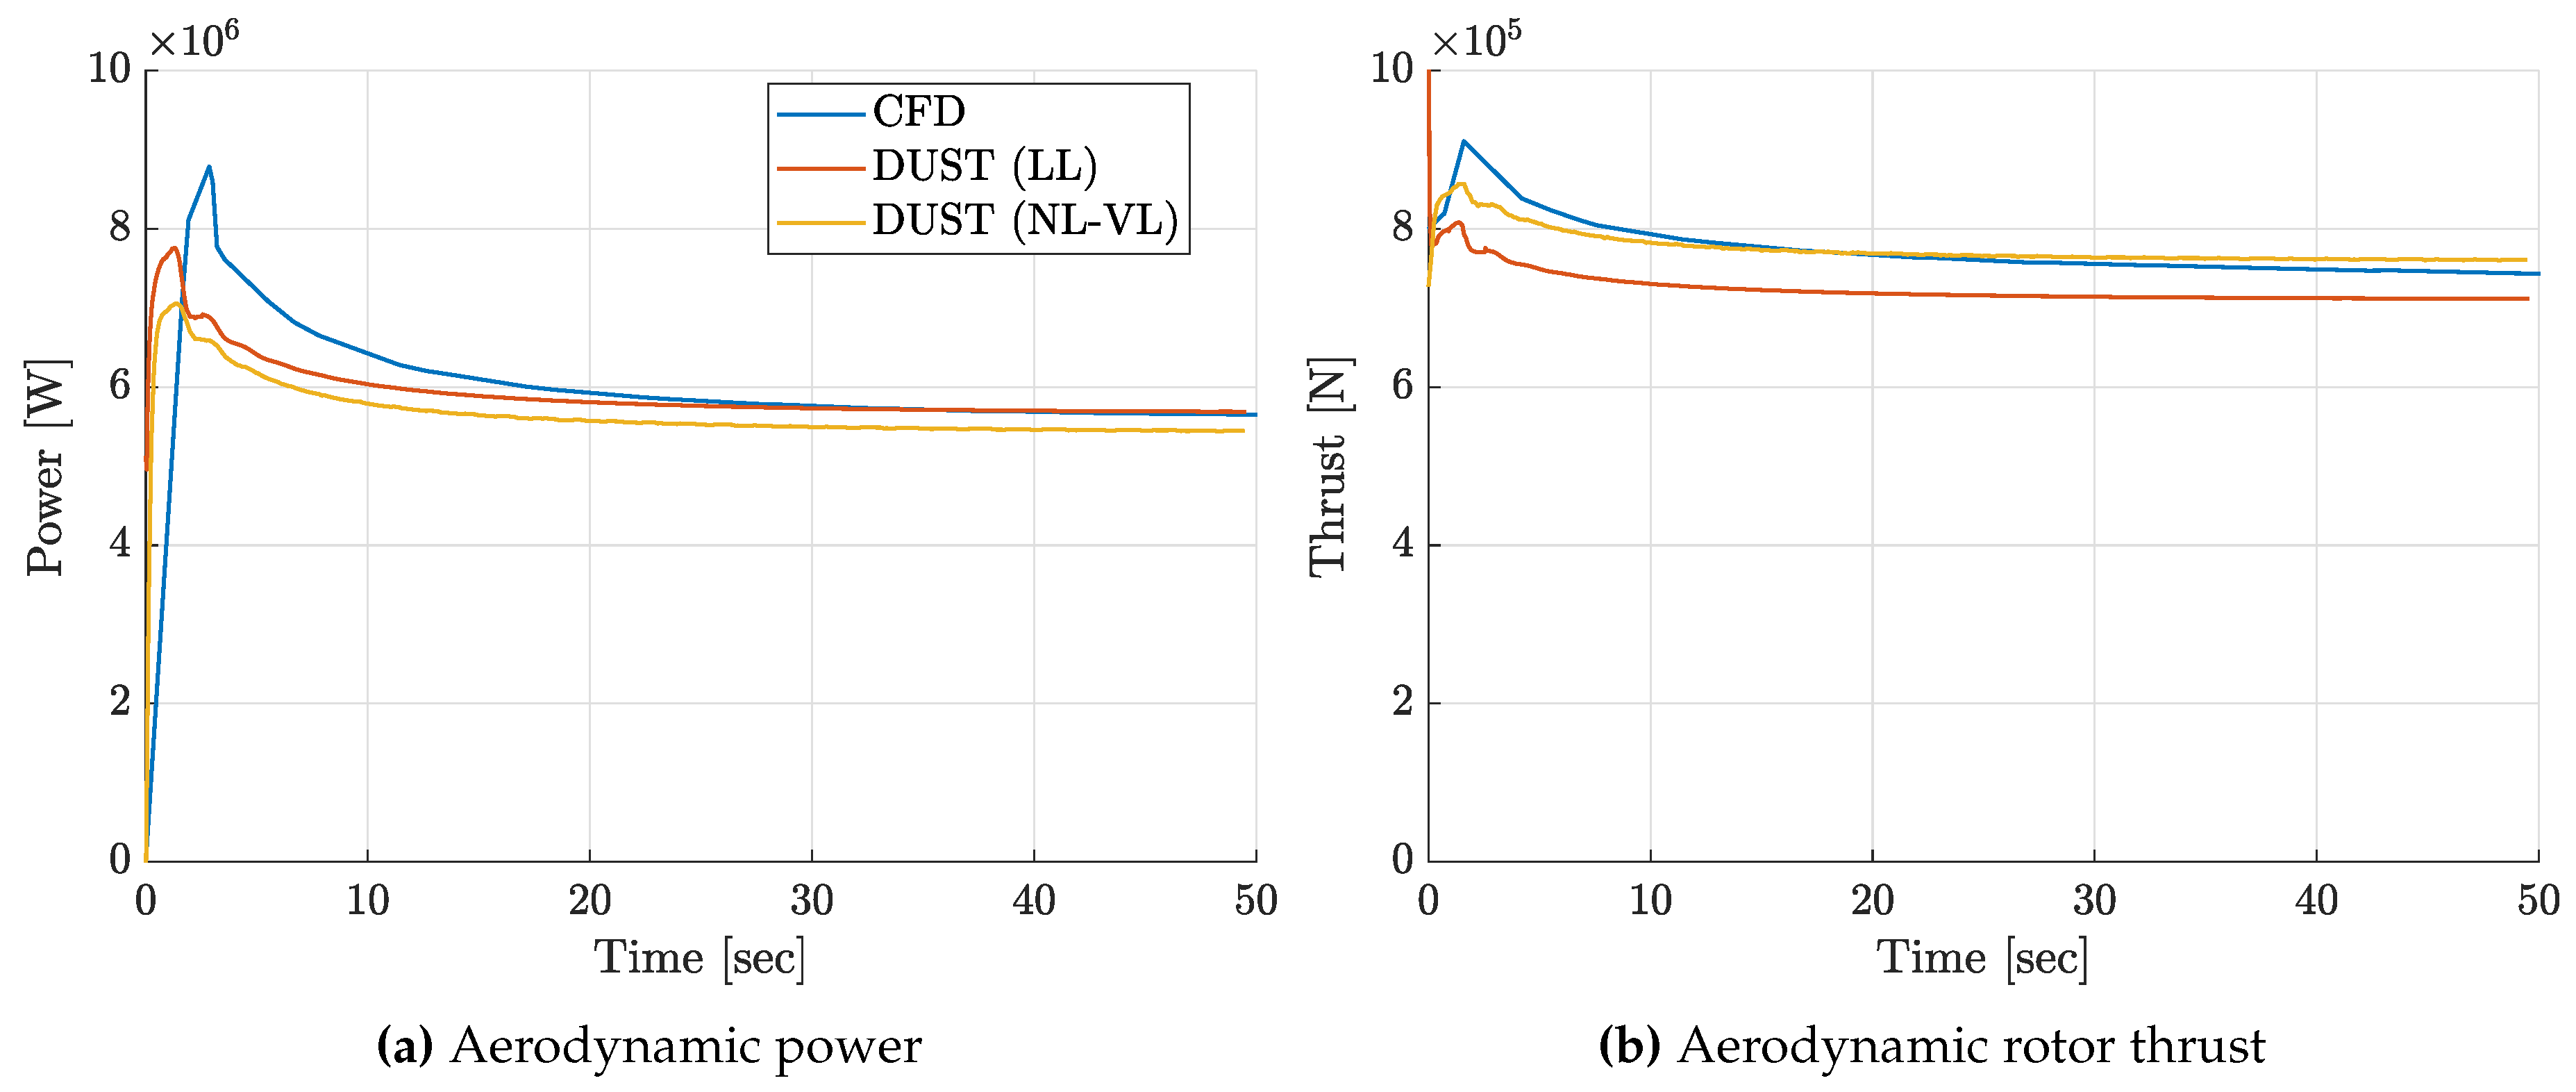
Figure 4.
Blade sectional force comparison computed by DUST (NL-VL) and CFD by Dose et al. [22] for NREL- 5 wind turbine in C1 configuration.
Figure 4.
Blade sectional force comparison computed by DUST (NL-VL) and CFD by Dose et al. [22] for NREL- 5 wind turbine in C1 configuration.
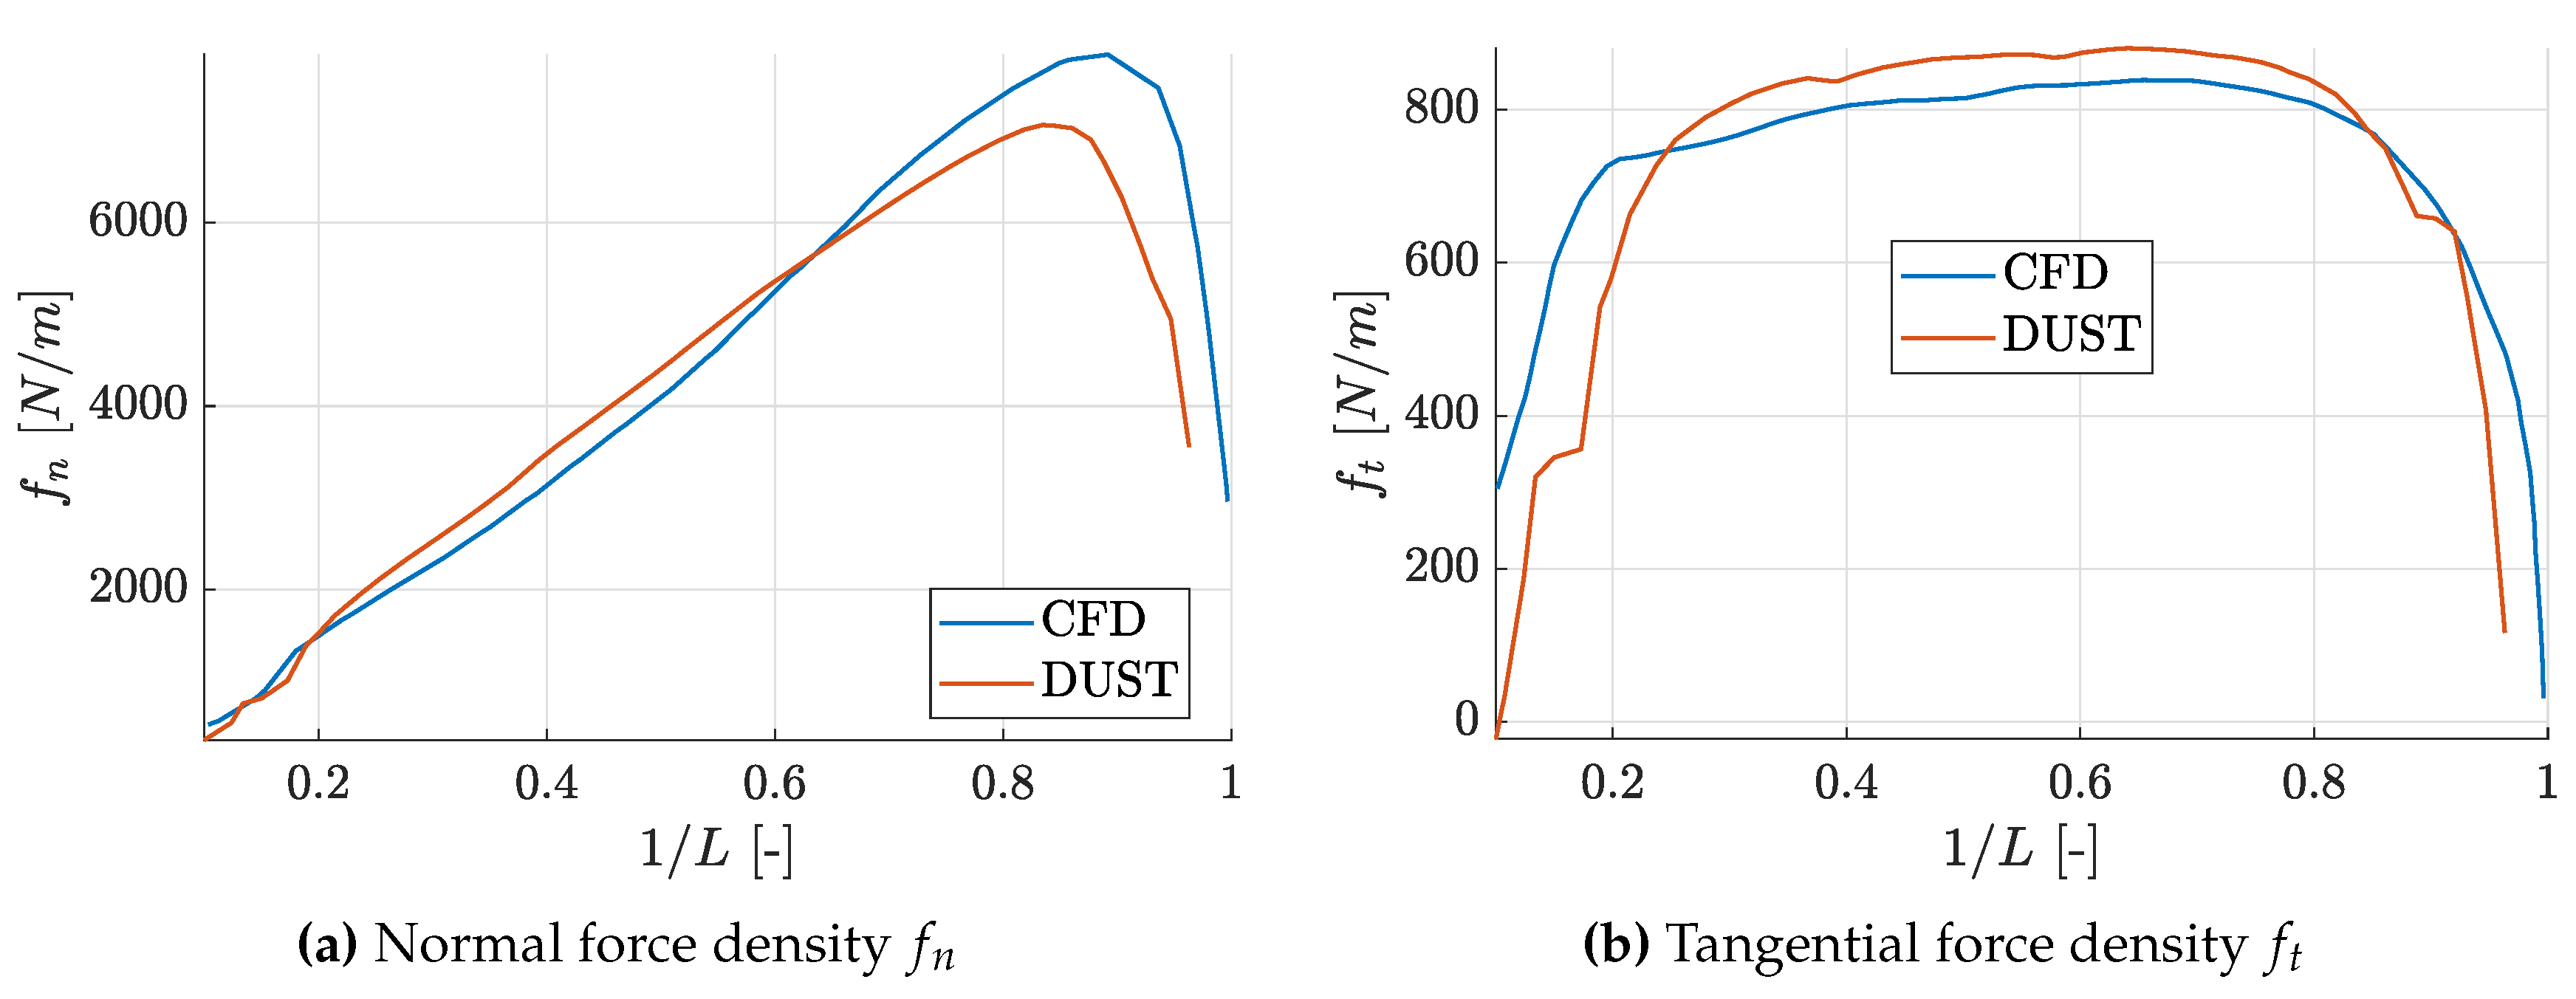
Figure 5.
Comparison of the axial velocity distributions at different downstream locations computed by DUST and CFD by Fan et al. [42] for NREL- 5 wind turbine in C1 configuration.
Figure 5.
Comparison of the axial velocity distributions at different downstream locations computed by DUST and CFD by Fan et al. [42] for NREL- 5 wind turbine in C1 configuration.
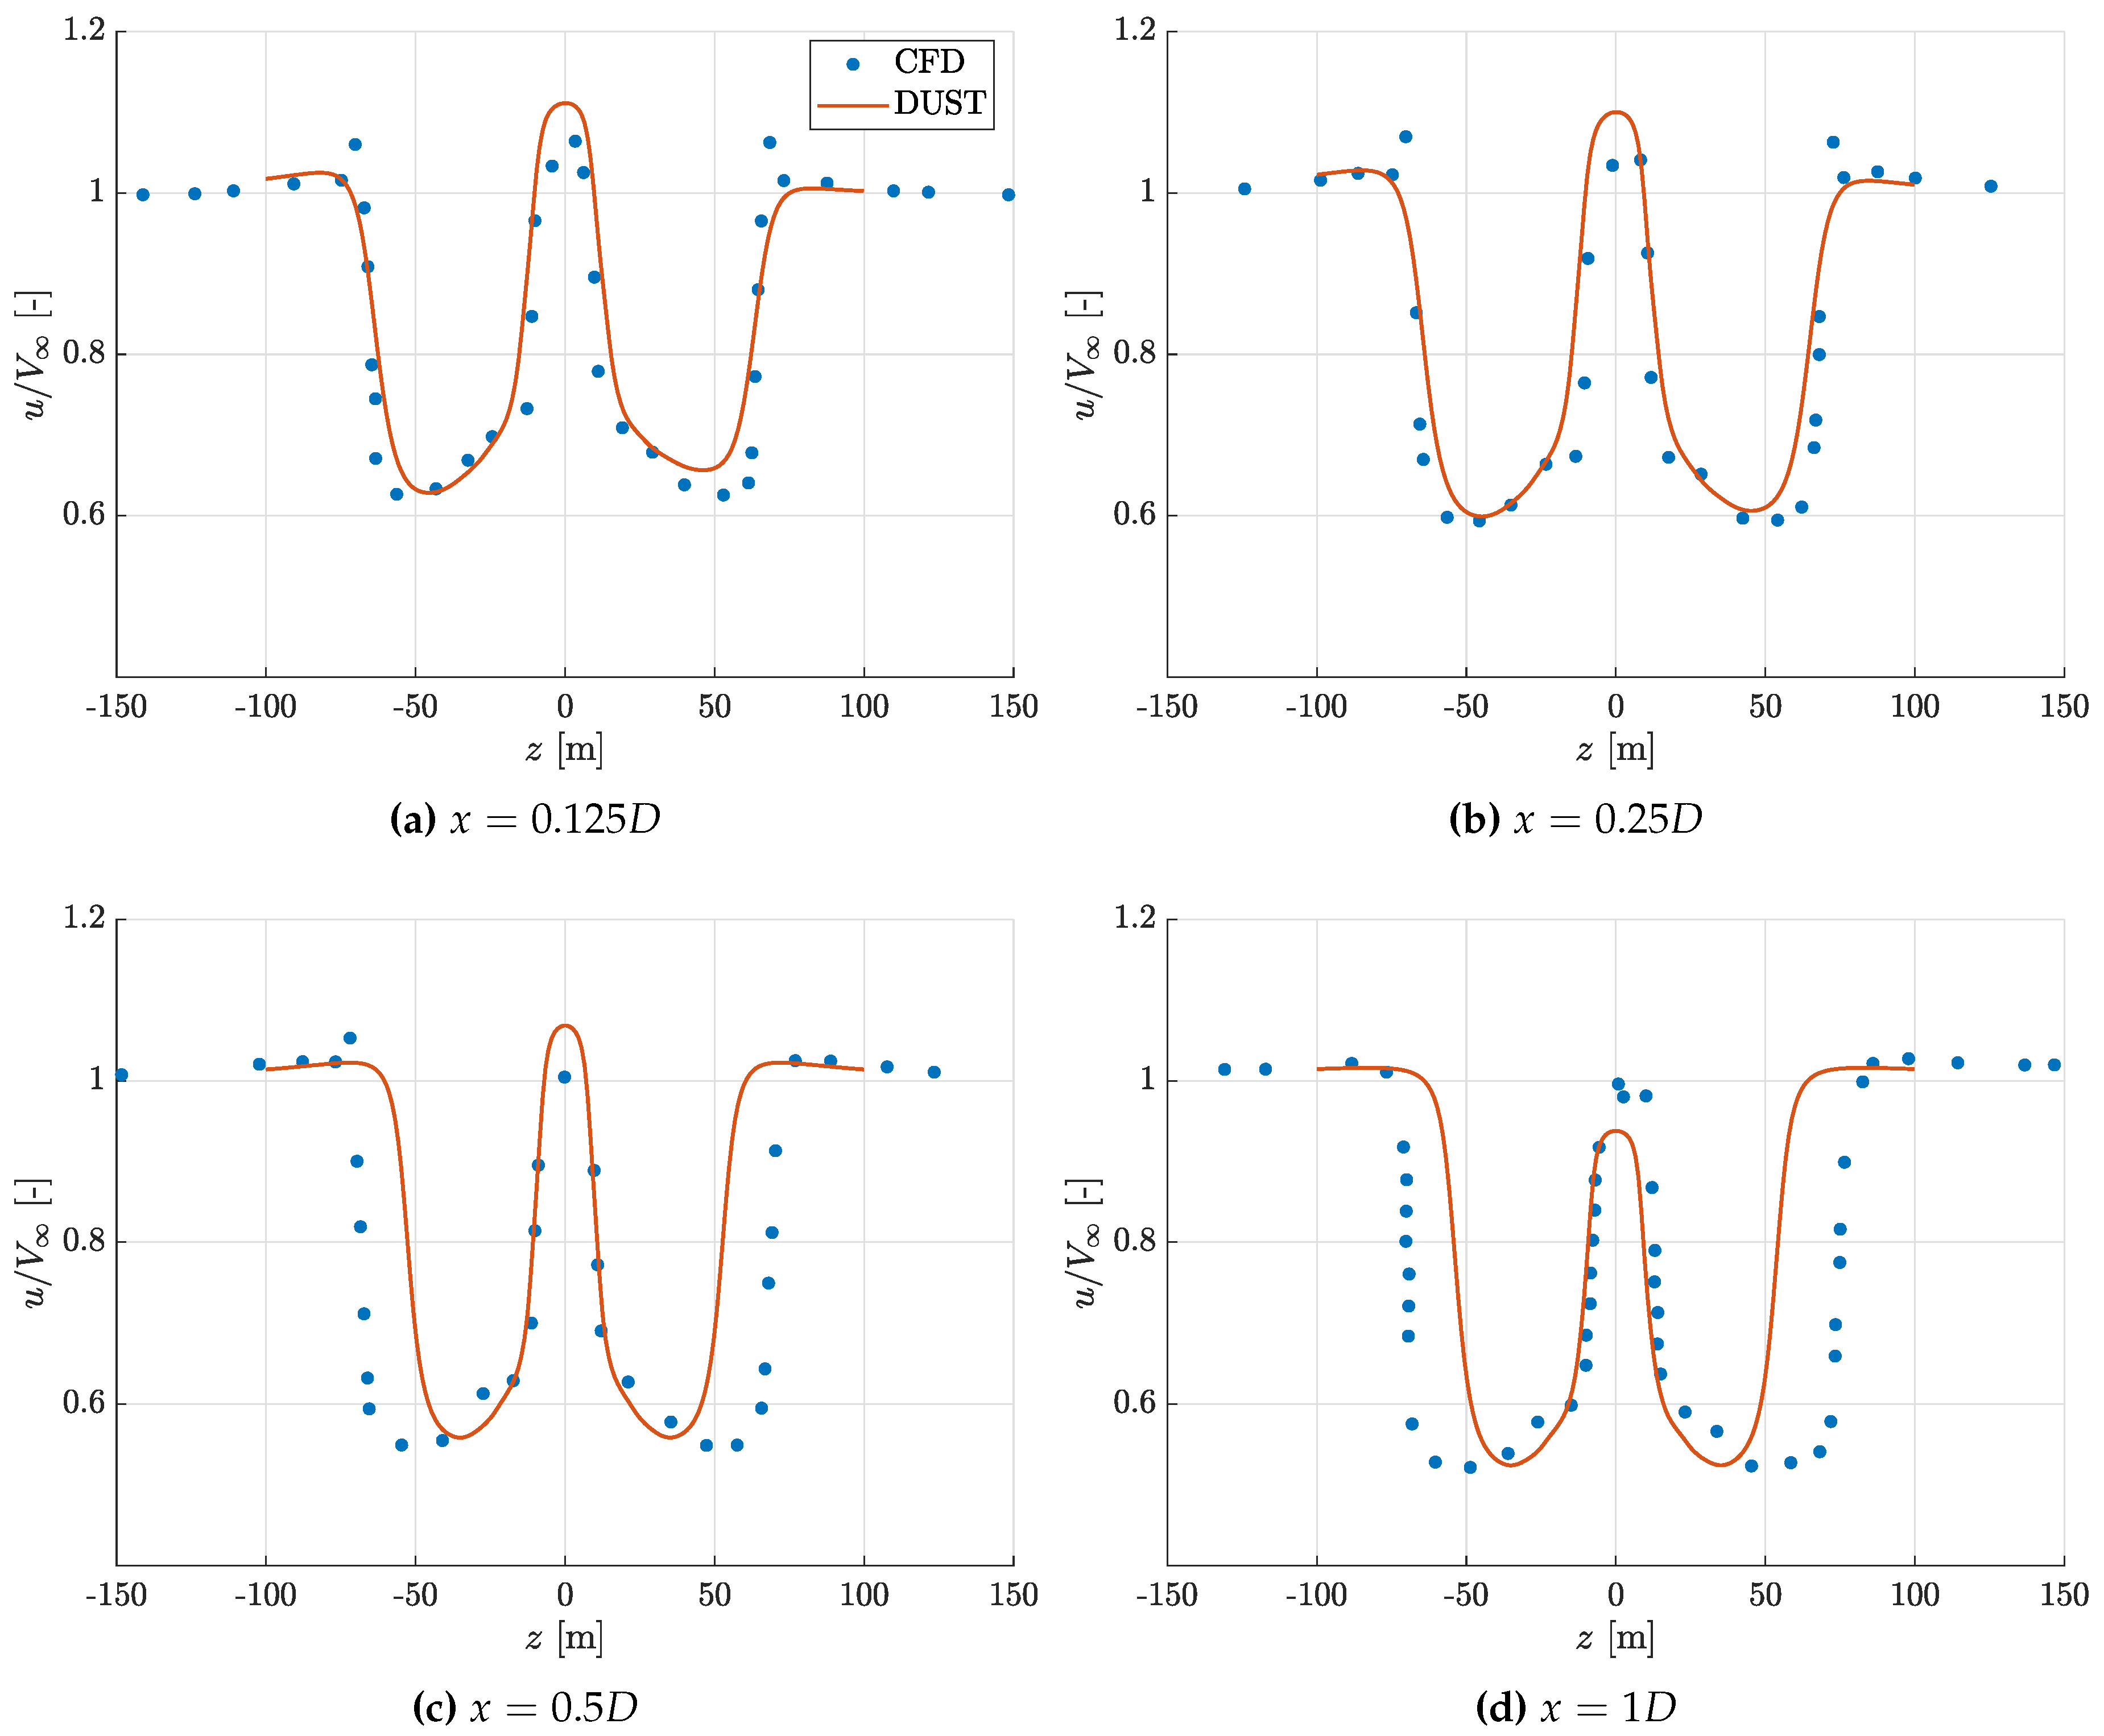
Figure 6.
Instantaneous iso-surface for the vortex criterion Q coloured by the velocity magnitude calculated by DUST for NREL- 5 wind turbine in C1 configuration.
Figure 6.
Instantaneous iso-surface for the vortex criterion Q coloured by the velocity magnitude calculated by DUST for NREL- 5 wind turbine in C1 configuration.
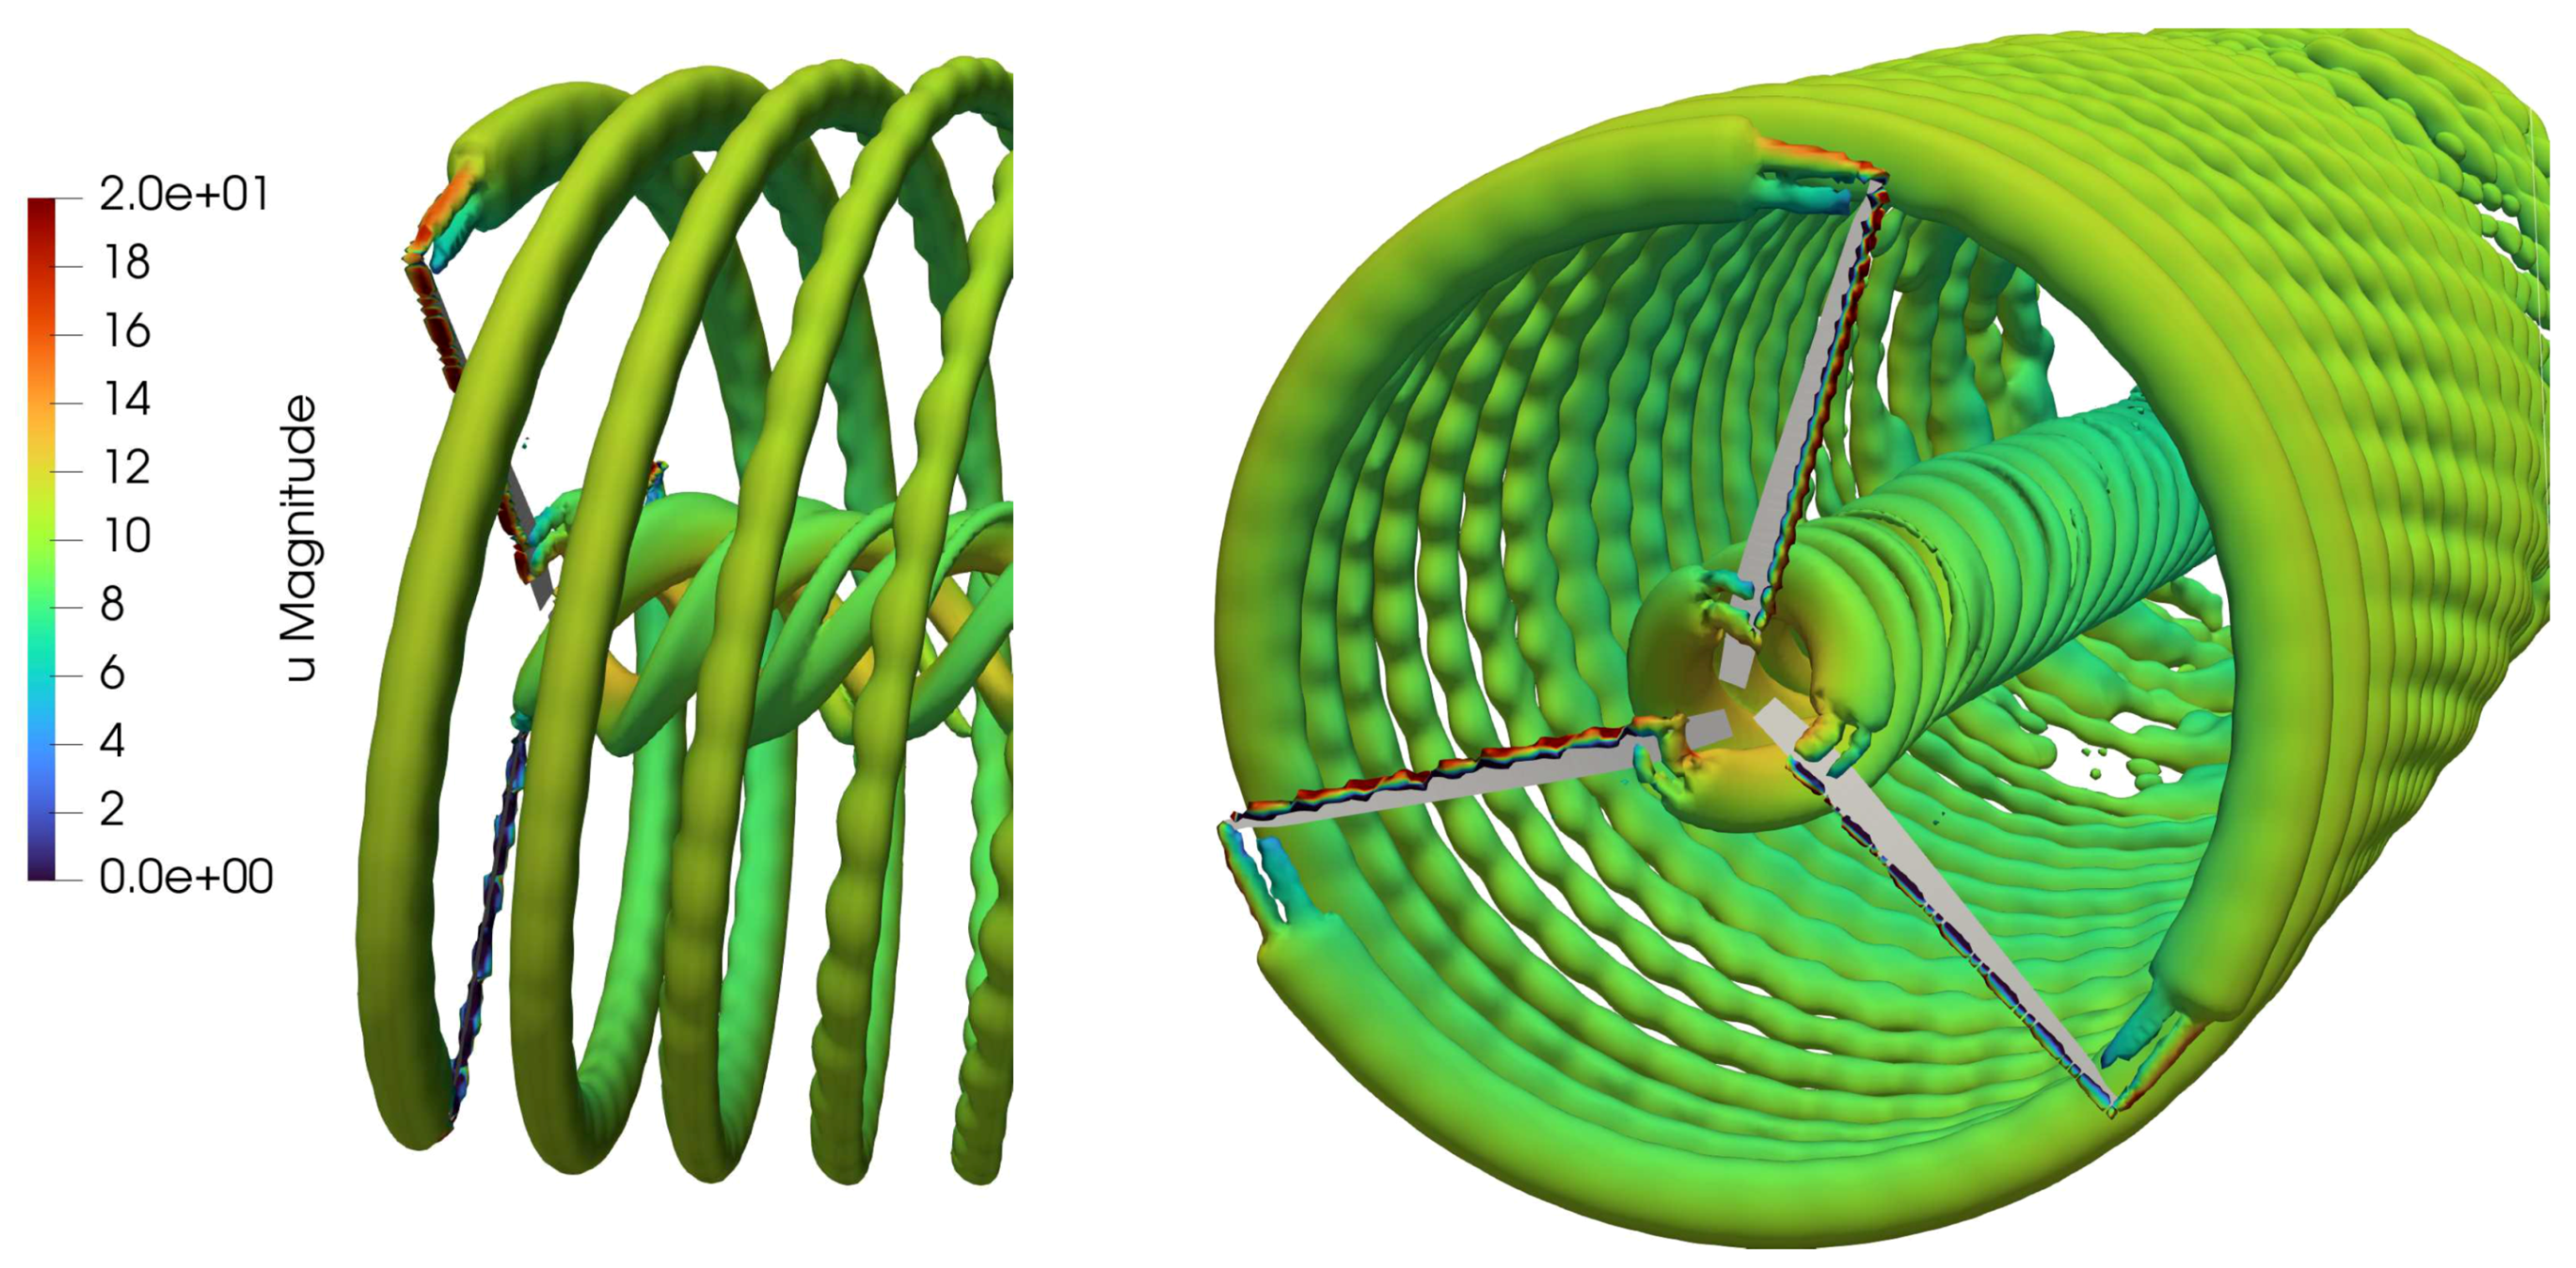
Figure 7.
Comparison of integral rotor power and thrust computed by DUST and high-fidelity CFD by Sørensen and Johansen [16], Lin et al. [17], Wu and Nguyen [18] as function of inflow wind speeds for NREL- 5 wind turbine in C4 configuration.
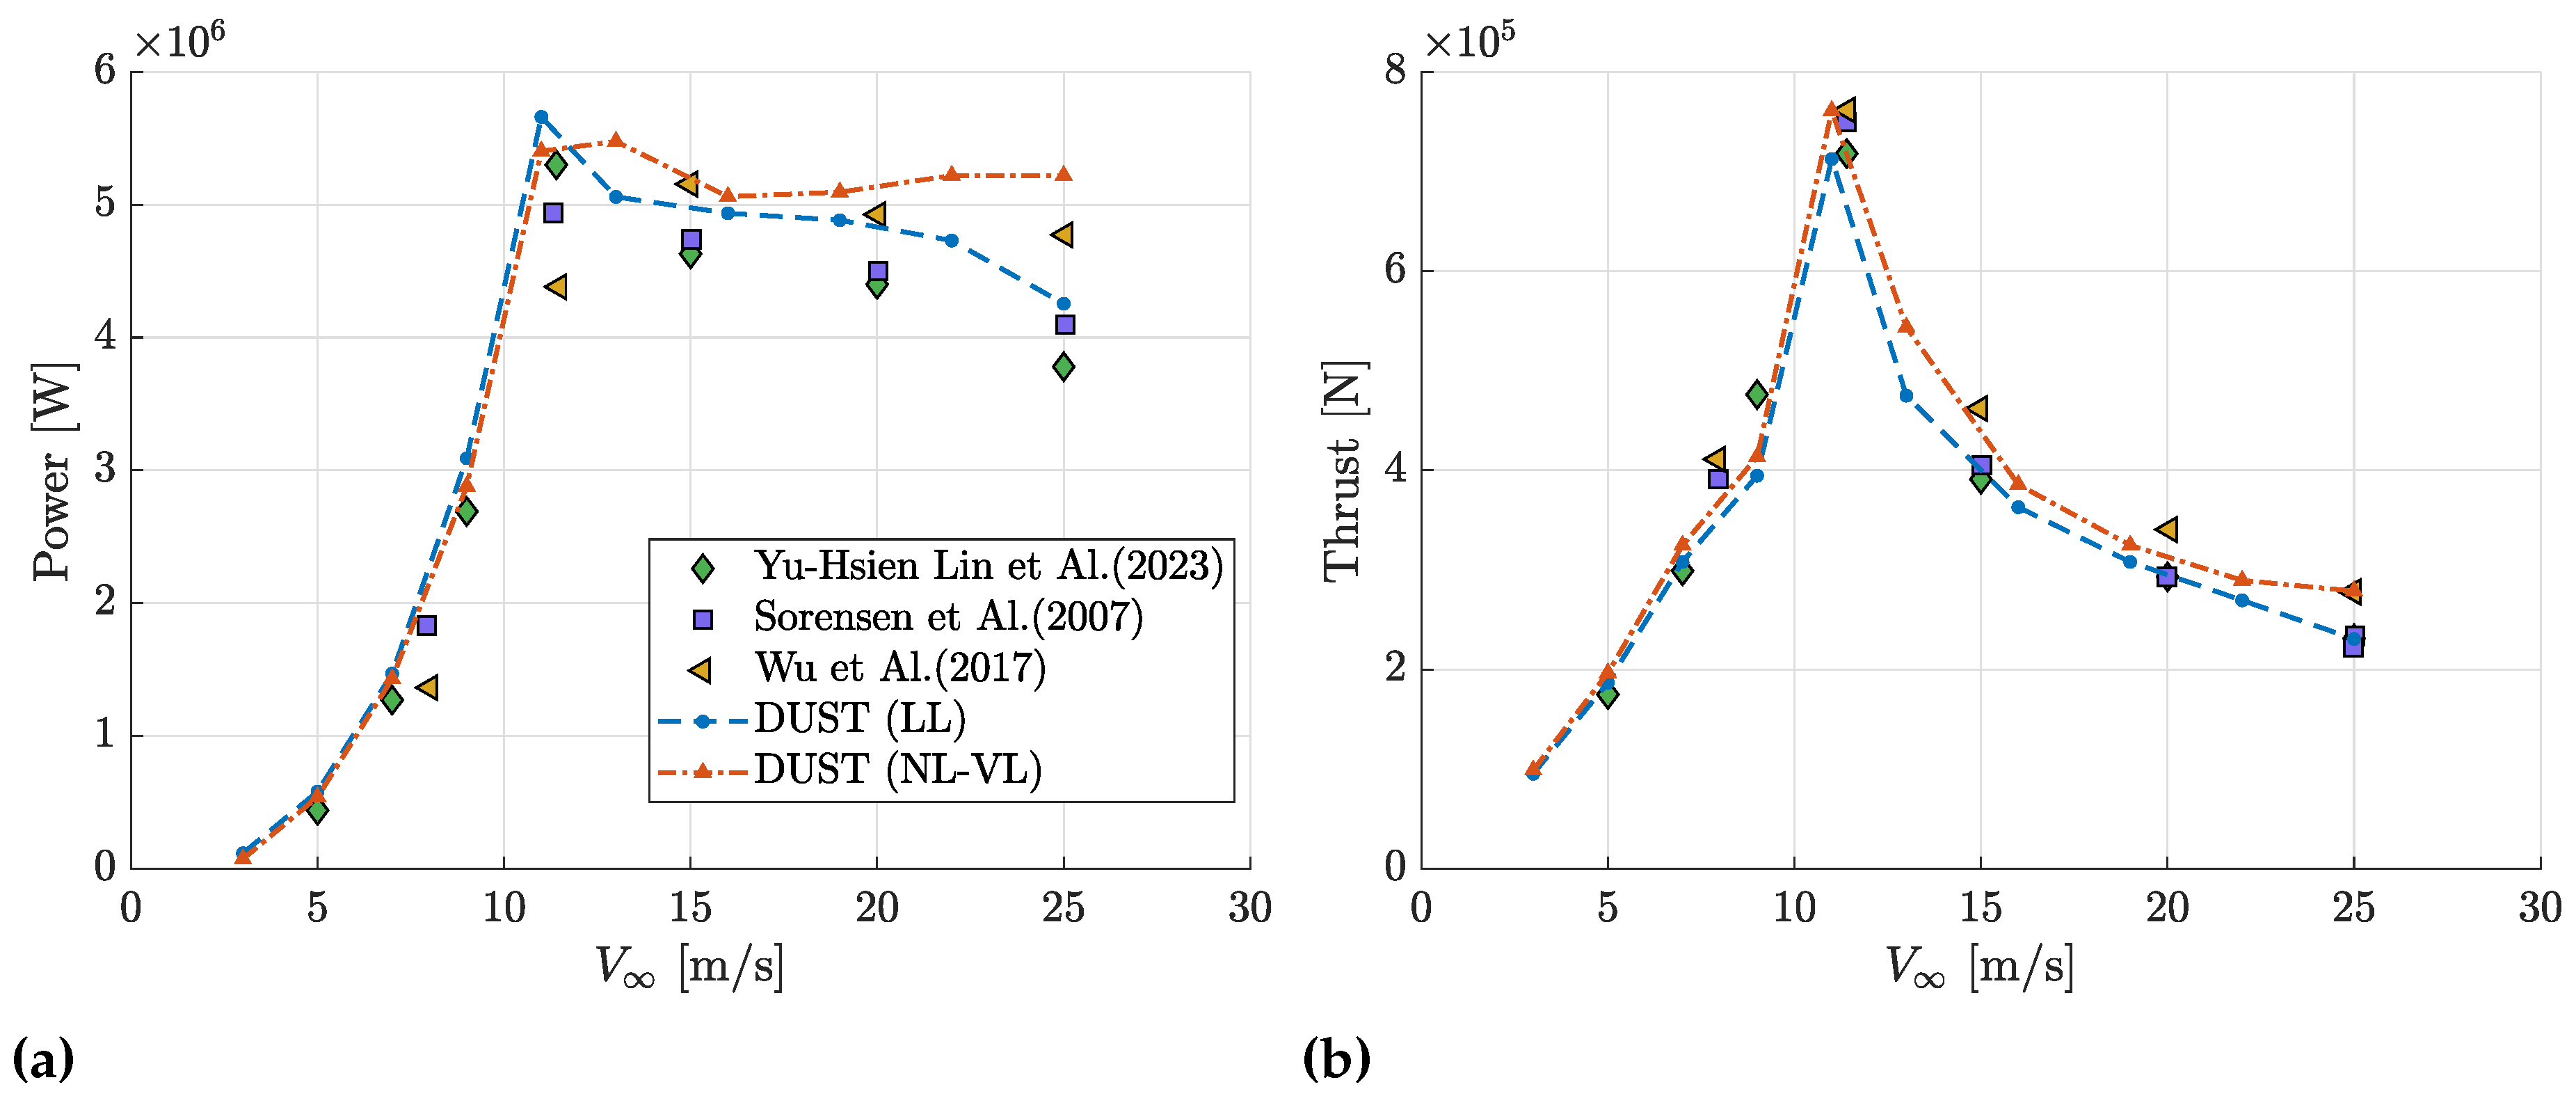
Figure 8.
Blade sectional force comparison computed by DUST (NL-VL) and CFD by Dose et al. [22] for NREL- 5 wind turbine in configuration C2 at rated conditions with 30° yaw. At , the tracked blade points vertically up.
Figure 8.
Blade sectional force comparison computed by DUST (NL-VL) and CFD by Dose et al. [22] for NREL- 5 wind turbine in configuration C2 at rated conditions with 30° yaw. At , the tracked blade points vertically up.
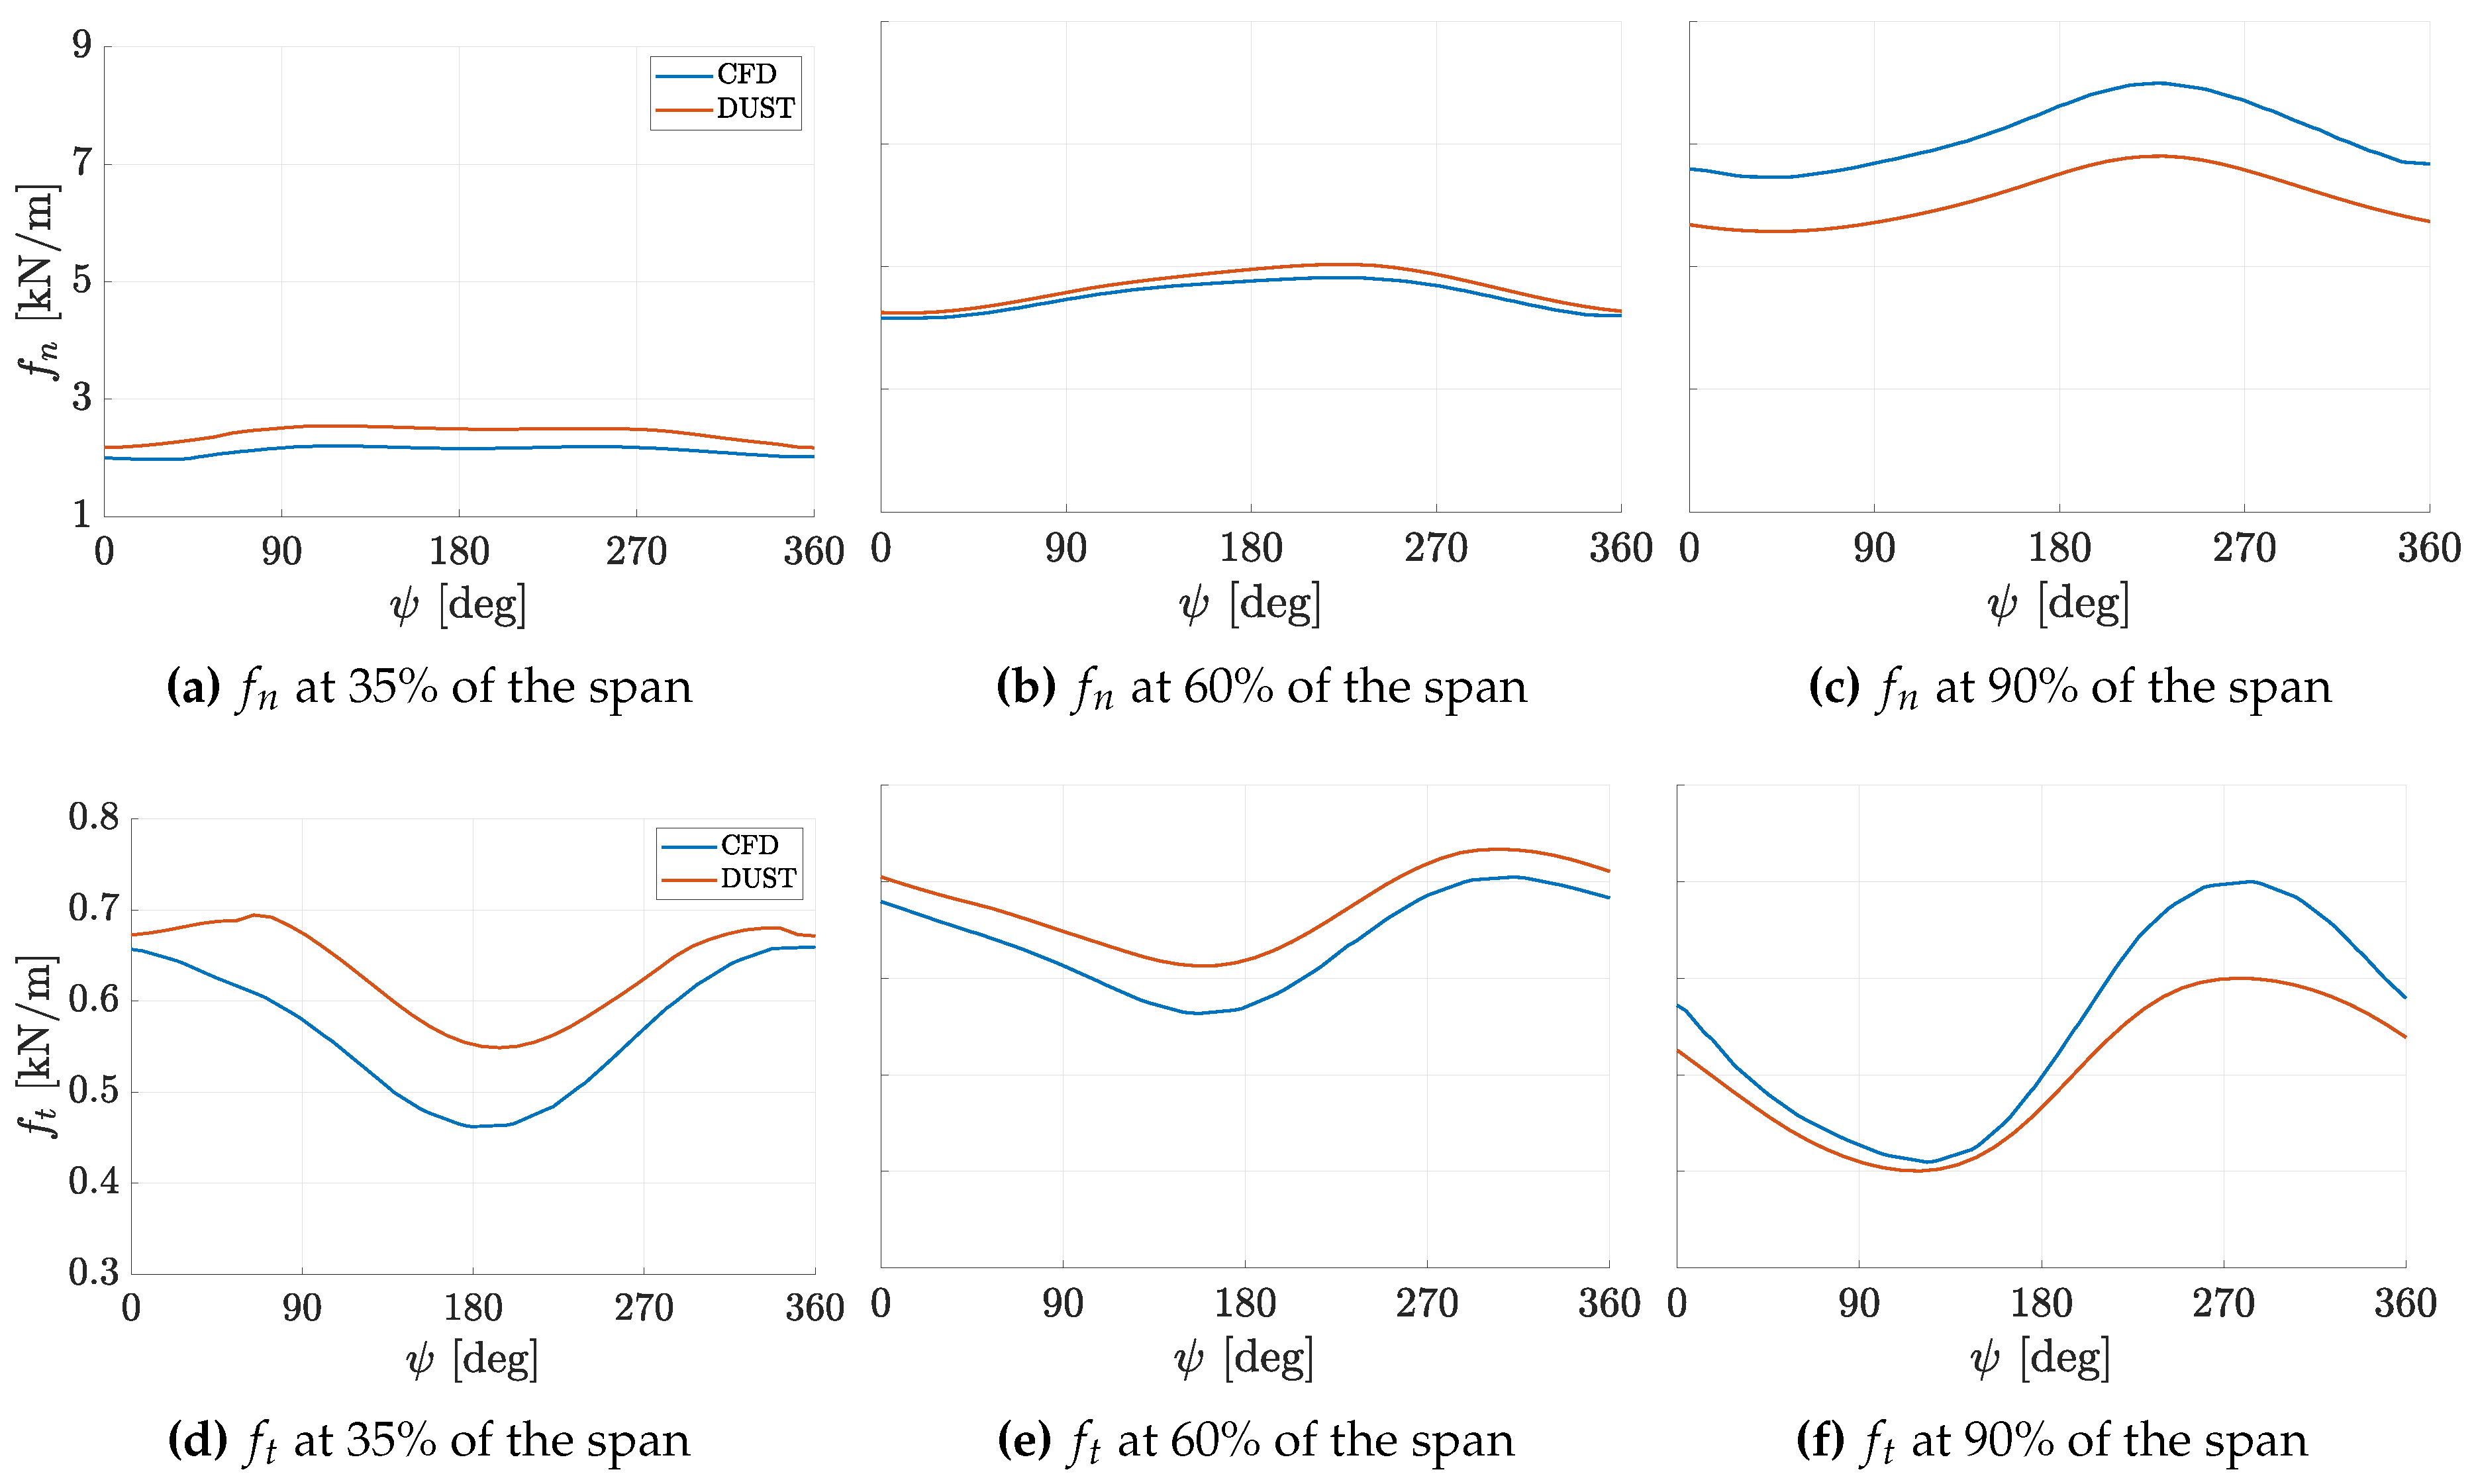
Figure 9.
Skew angle () representation, from [21].
Figure 9.
Skew angle () representation, from [21].
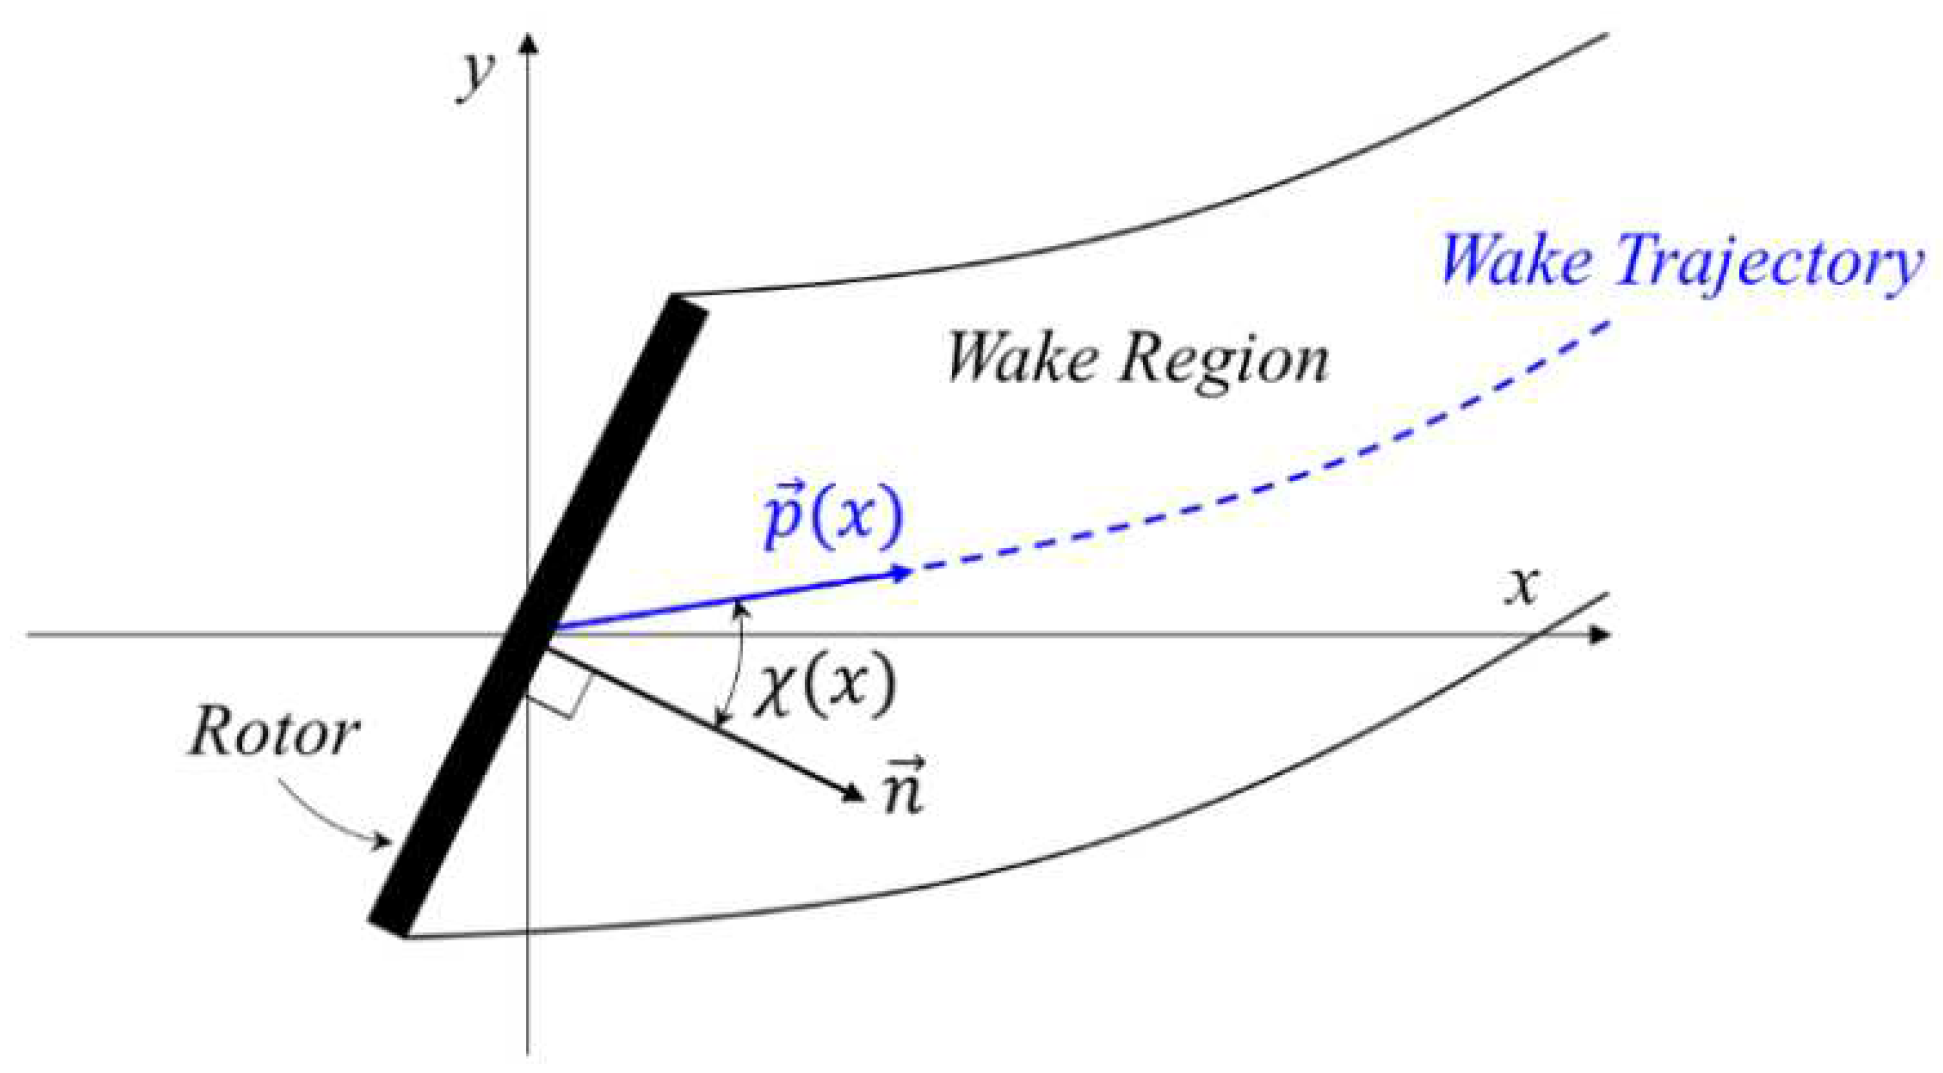
Figure 10.
Comparison of the skew angles for with the results obtained by Kim and Lee [21].
Figure 10.
Comparison of the skew angles for with the results obtained by Kim and Lee [21].

Figure 11.
Instantaneous flow field computed by DUST for the full turbine configuration: iso-surface of Q-Criterion colored by adimensional free-stream velocity.
Figure 11.
Instantaneous flow field computed by DUST for the full turbine configuration: iso-surface of Q-Criterion colored by adimensional free-stream velocity.
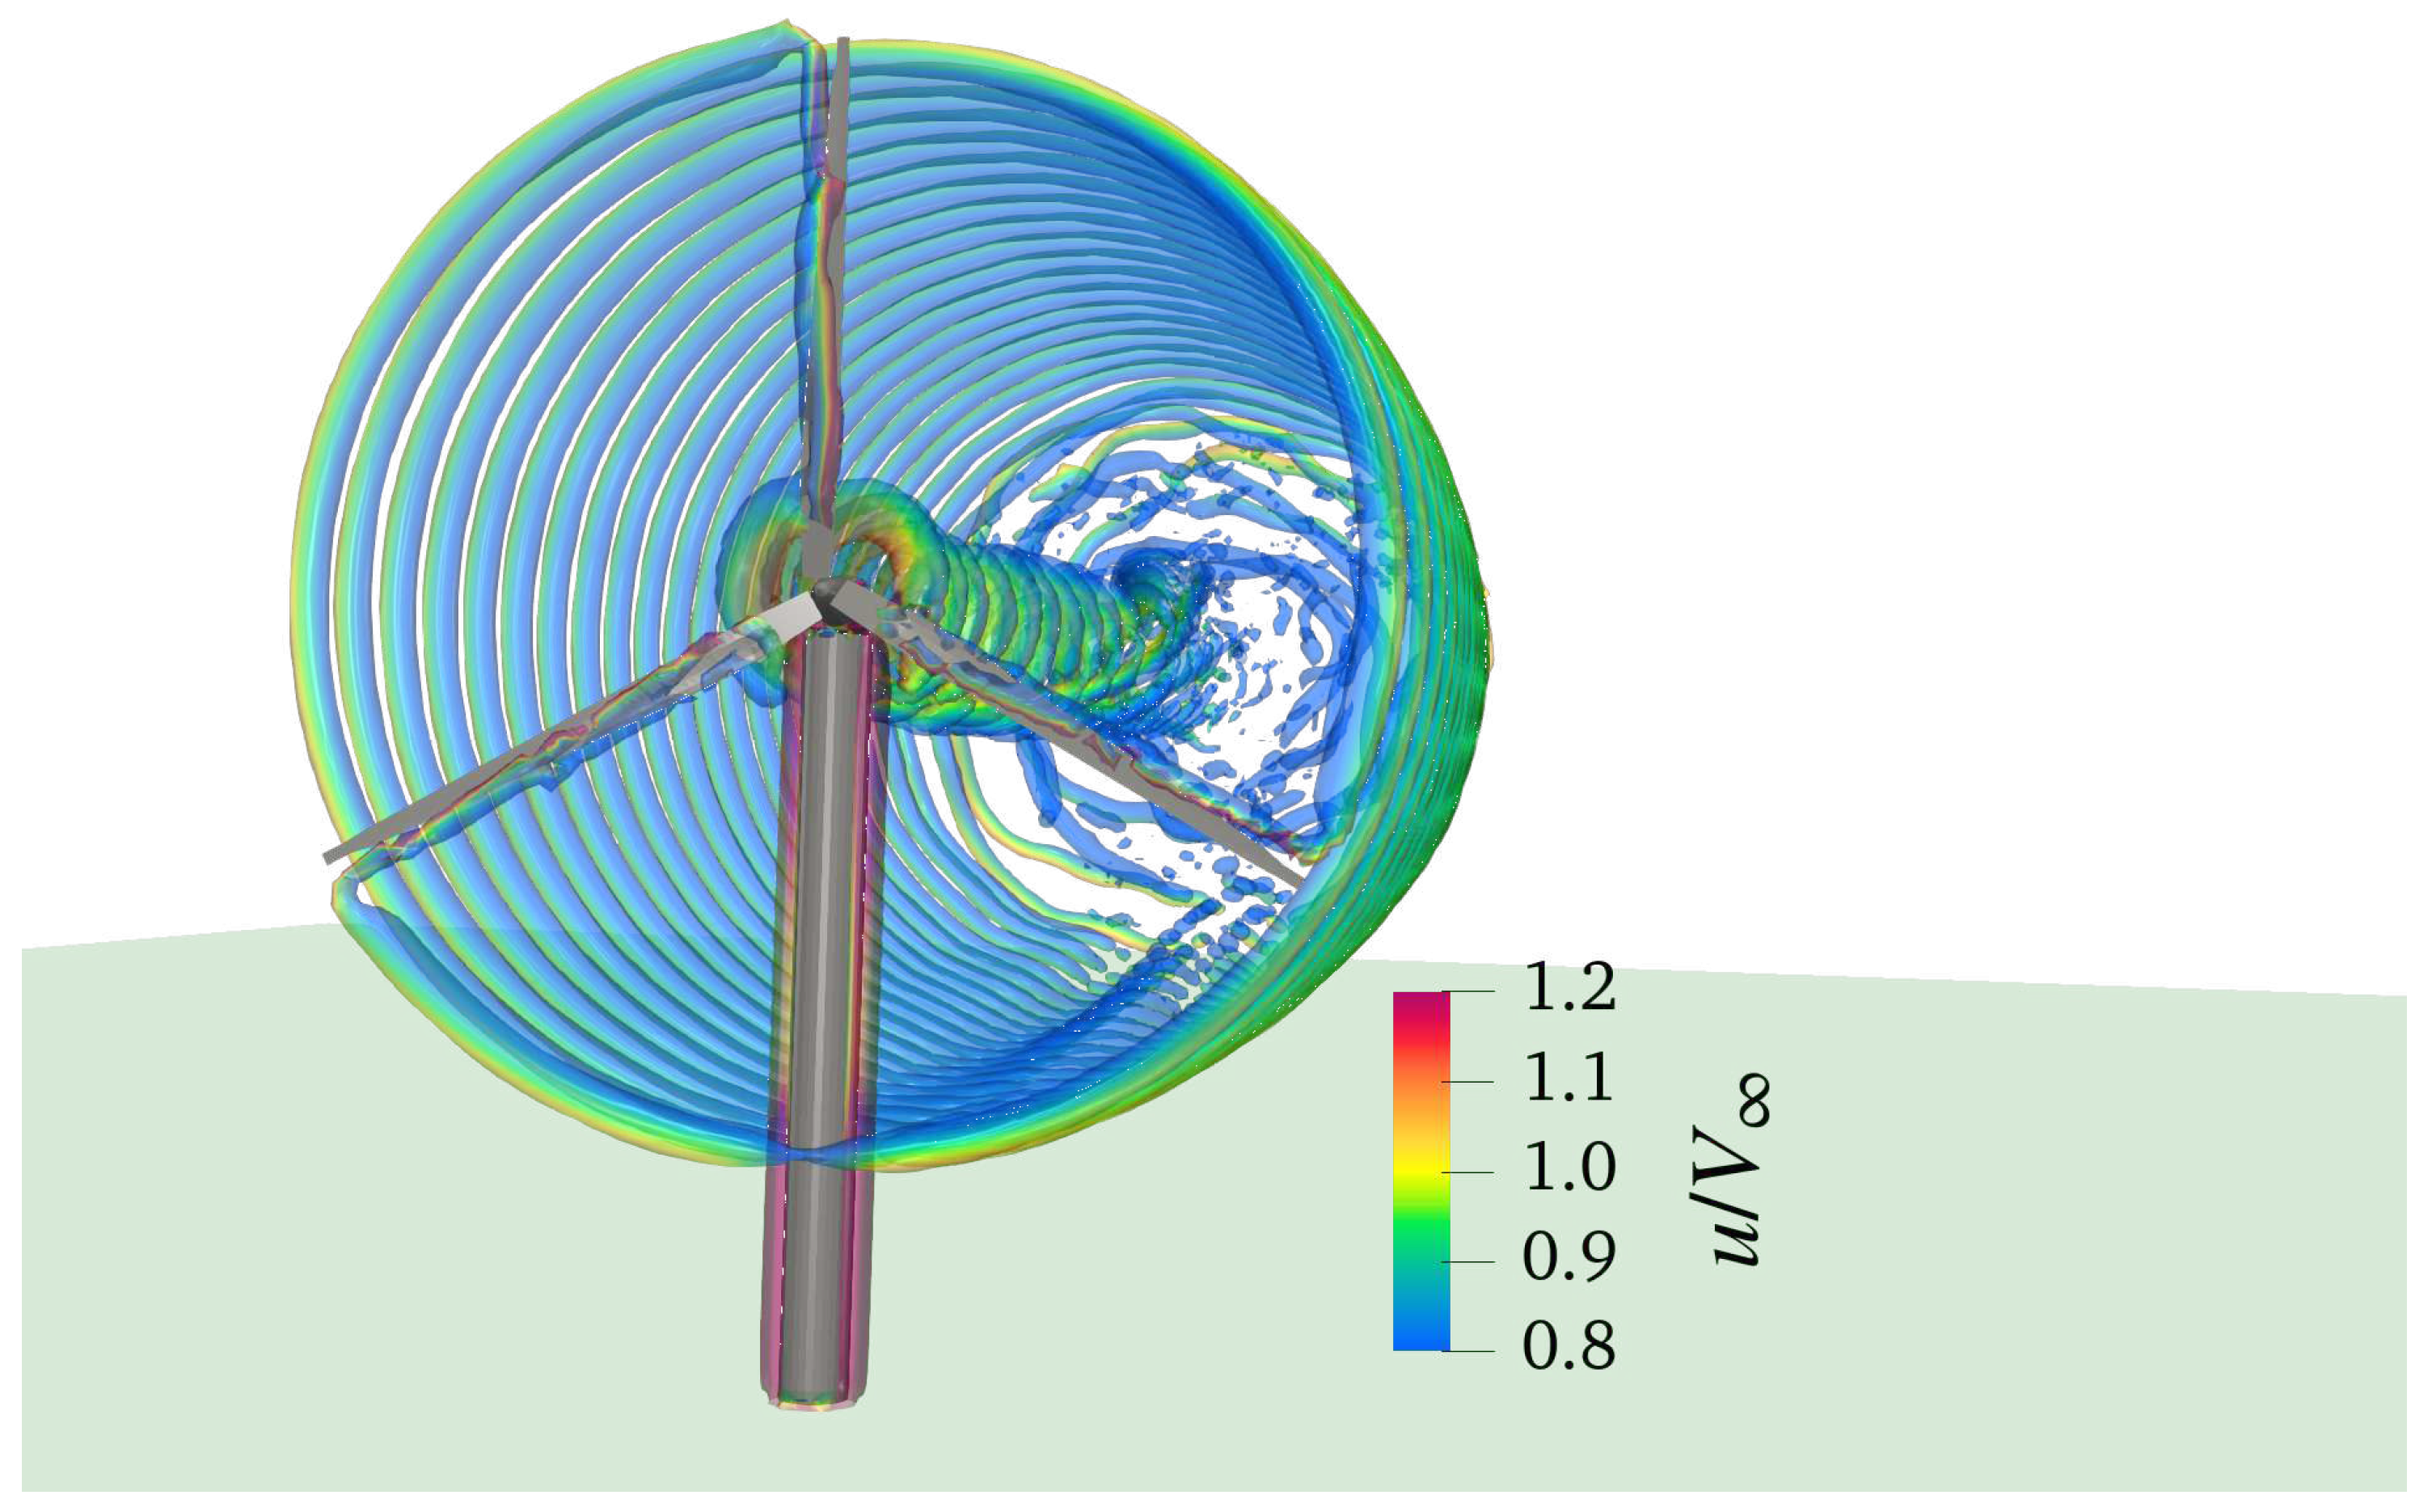
Figure 12.
Comparison of NREL Phase VI single rotor thrust and torque computed by DUST with high-fidelity CFD results from [28] and experimental results from [1].
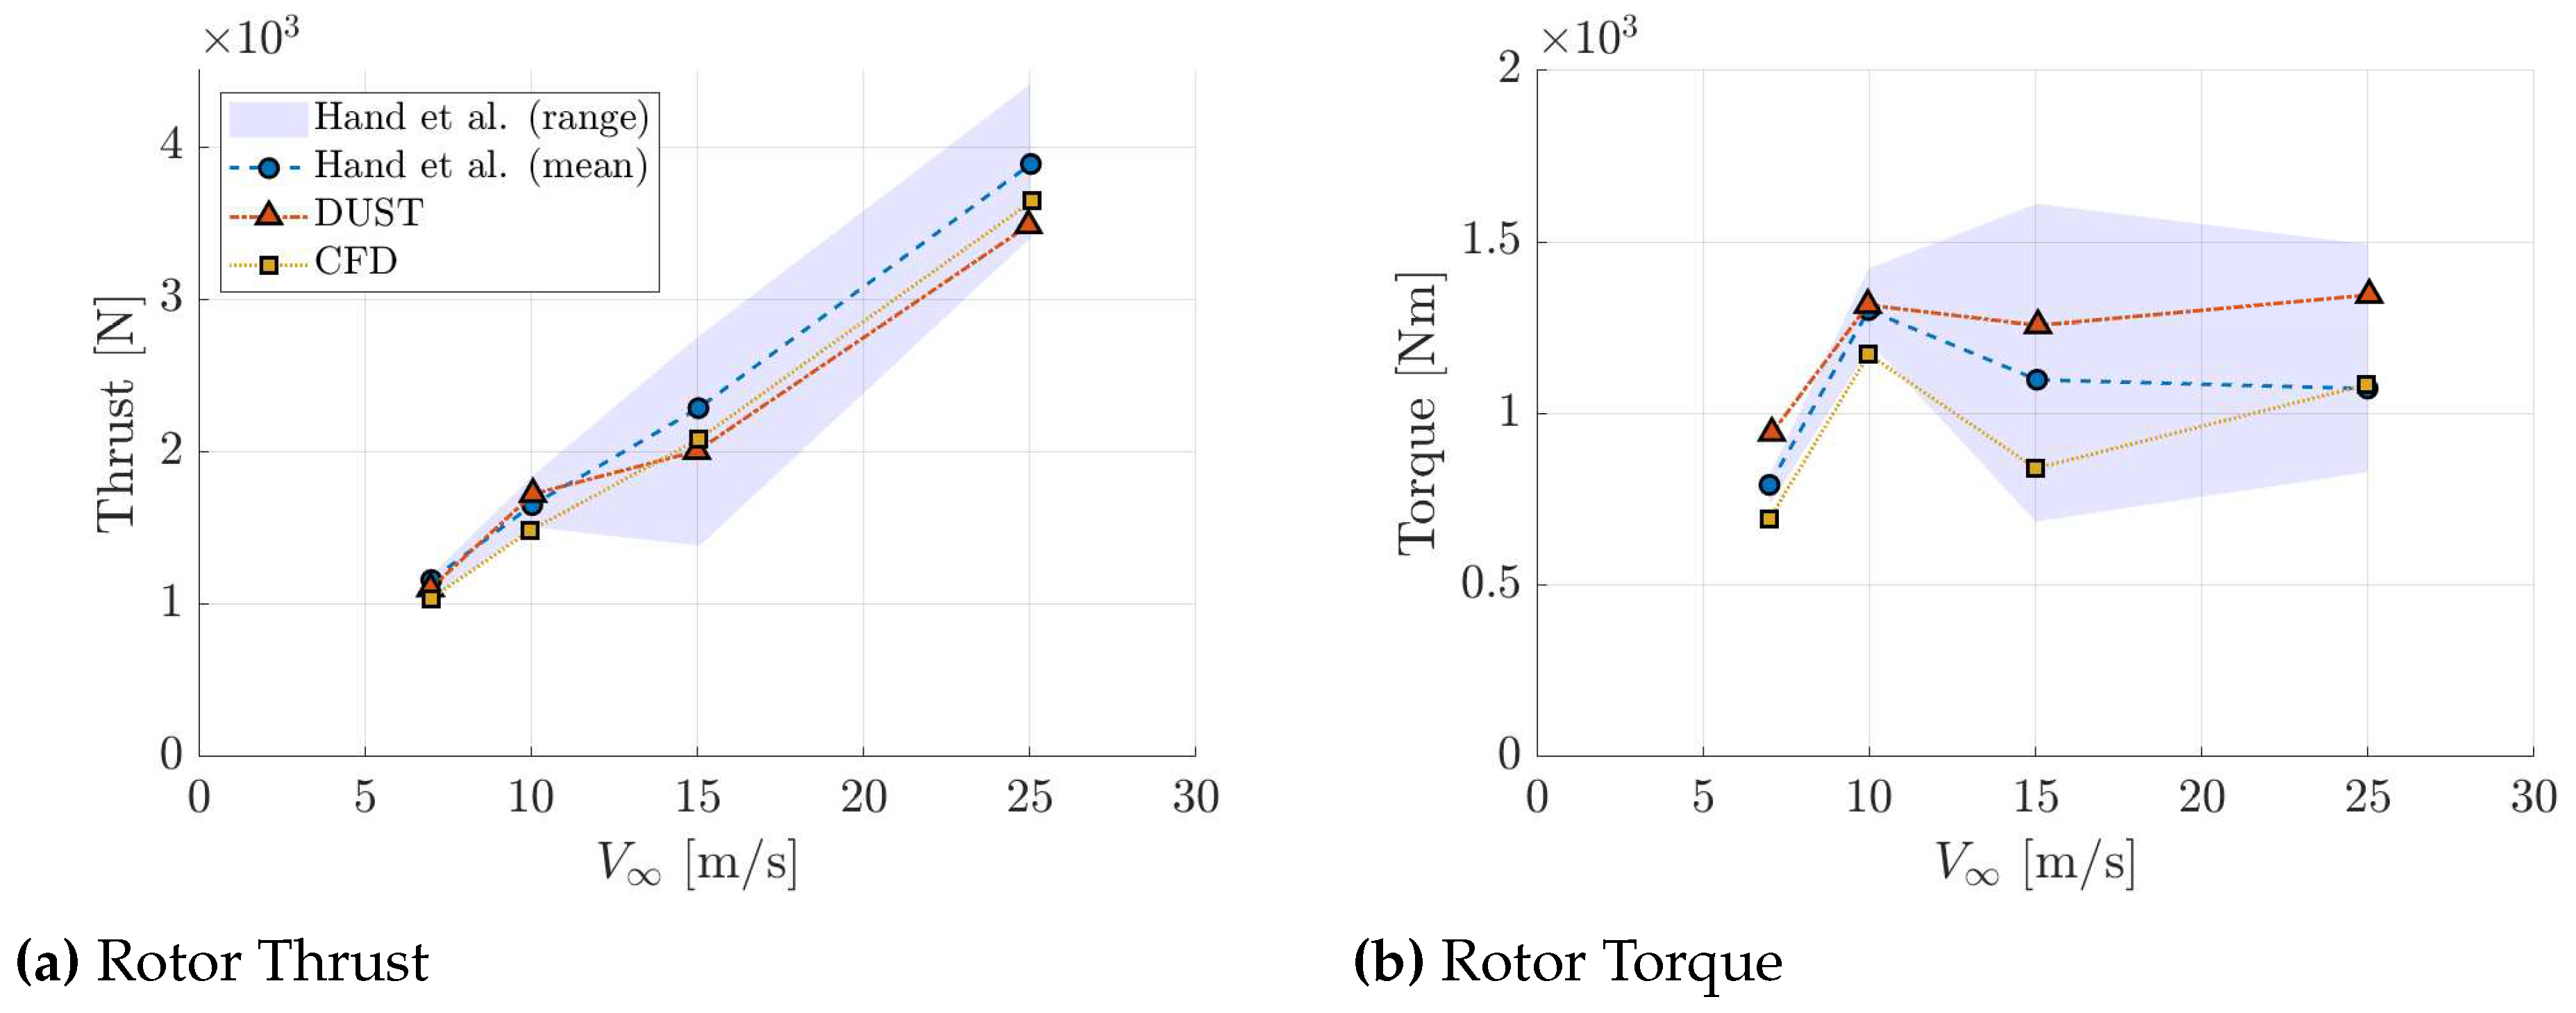
Figure 13.
Normal force coefficient densities for different wind speed compared with experimental results by Hand et al. [1].
Figure 13.
Normal force coefficient densities for different wind speed compared with experimental results by Hand et al. [1].
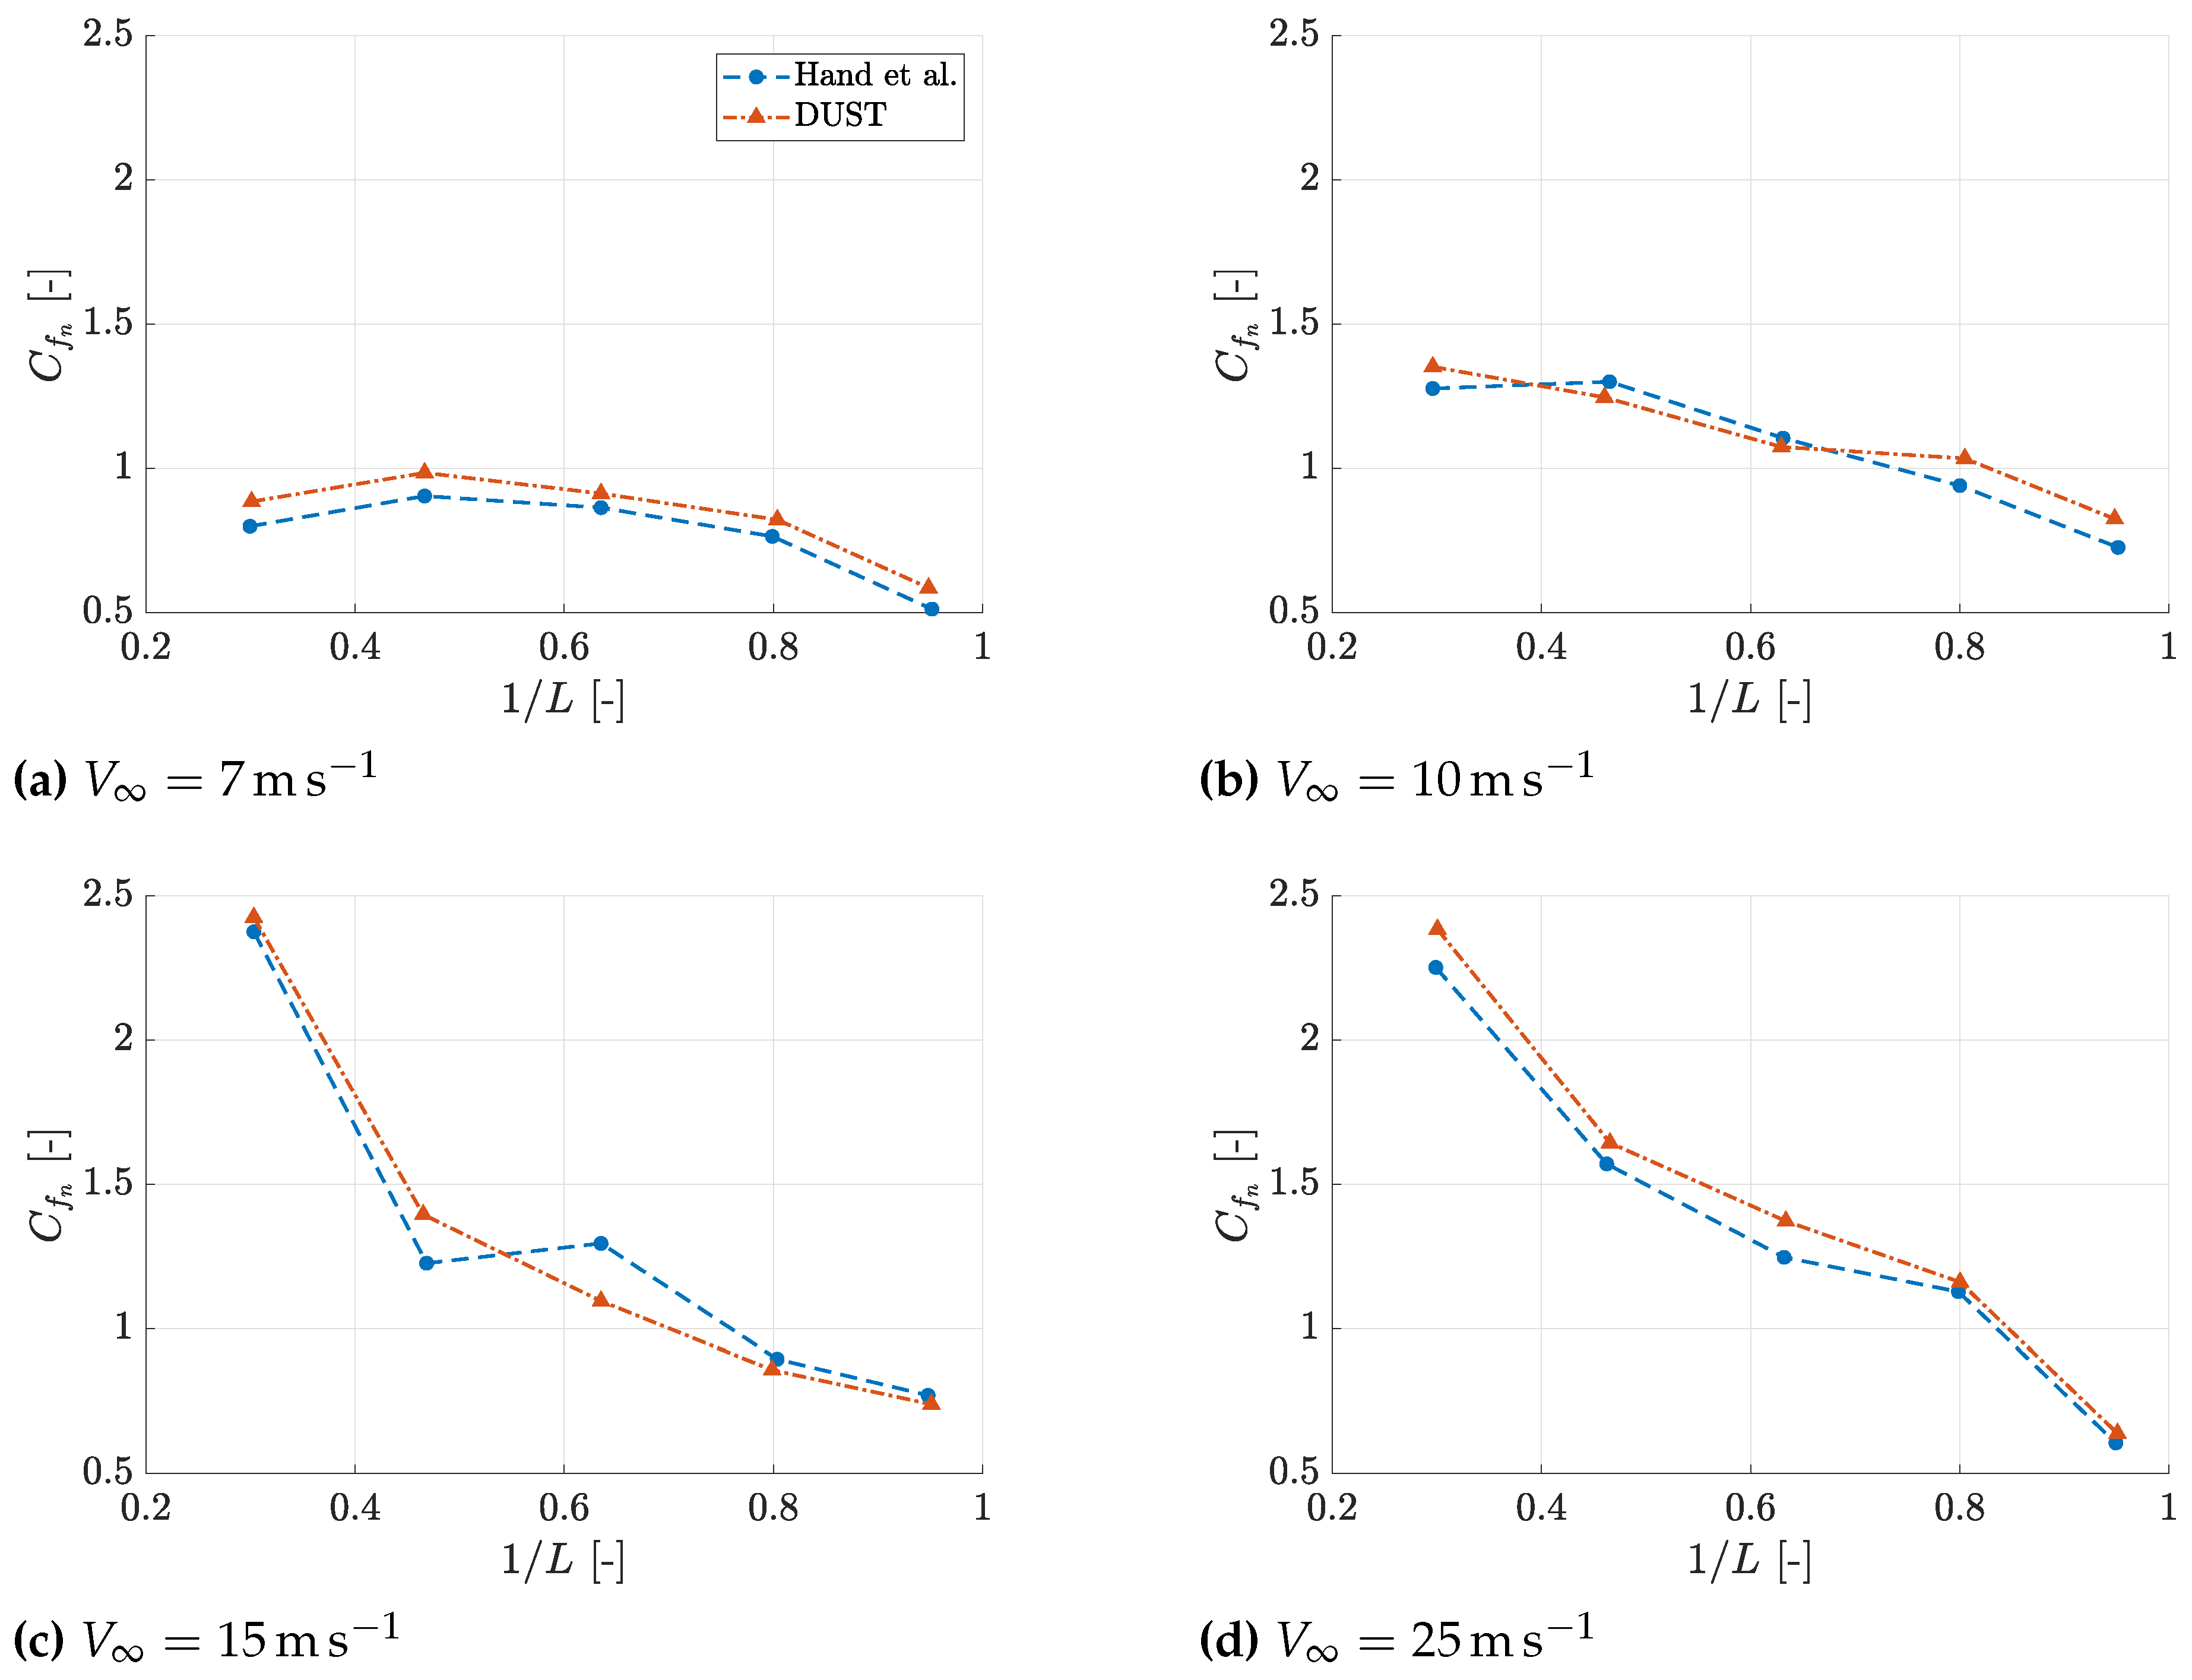
Figure 14.
Tangential force coefficient densities for different wind speed compared with experimental results by Hand et al. [1].
Figure 14.
Tangential force coefficient densities for different wind speed compared with experimental results by Hand et al. [1].
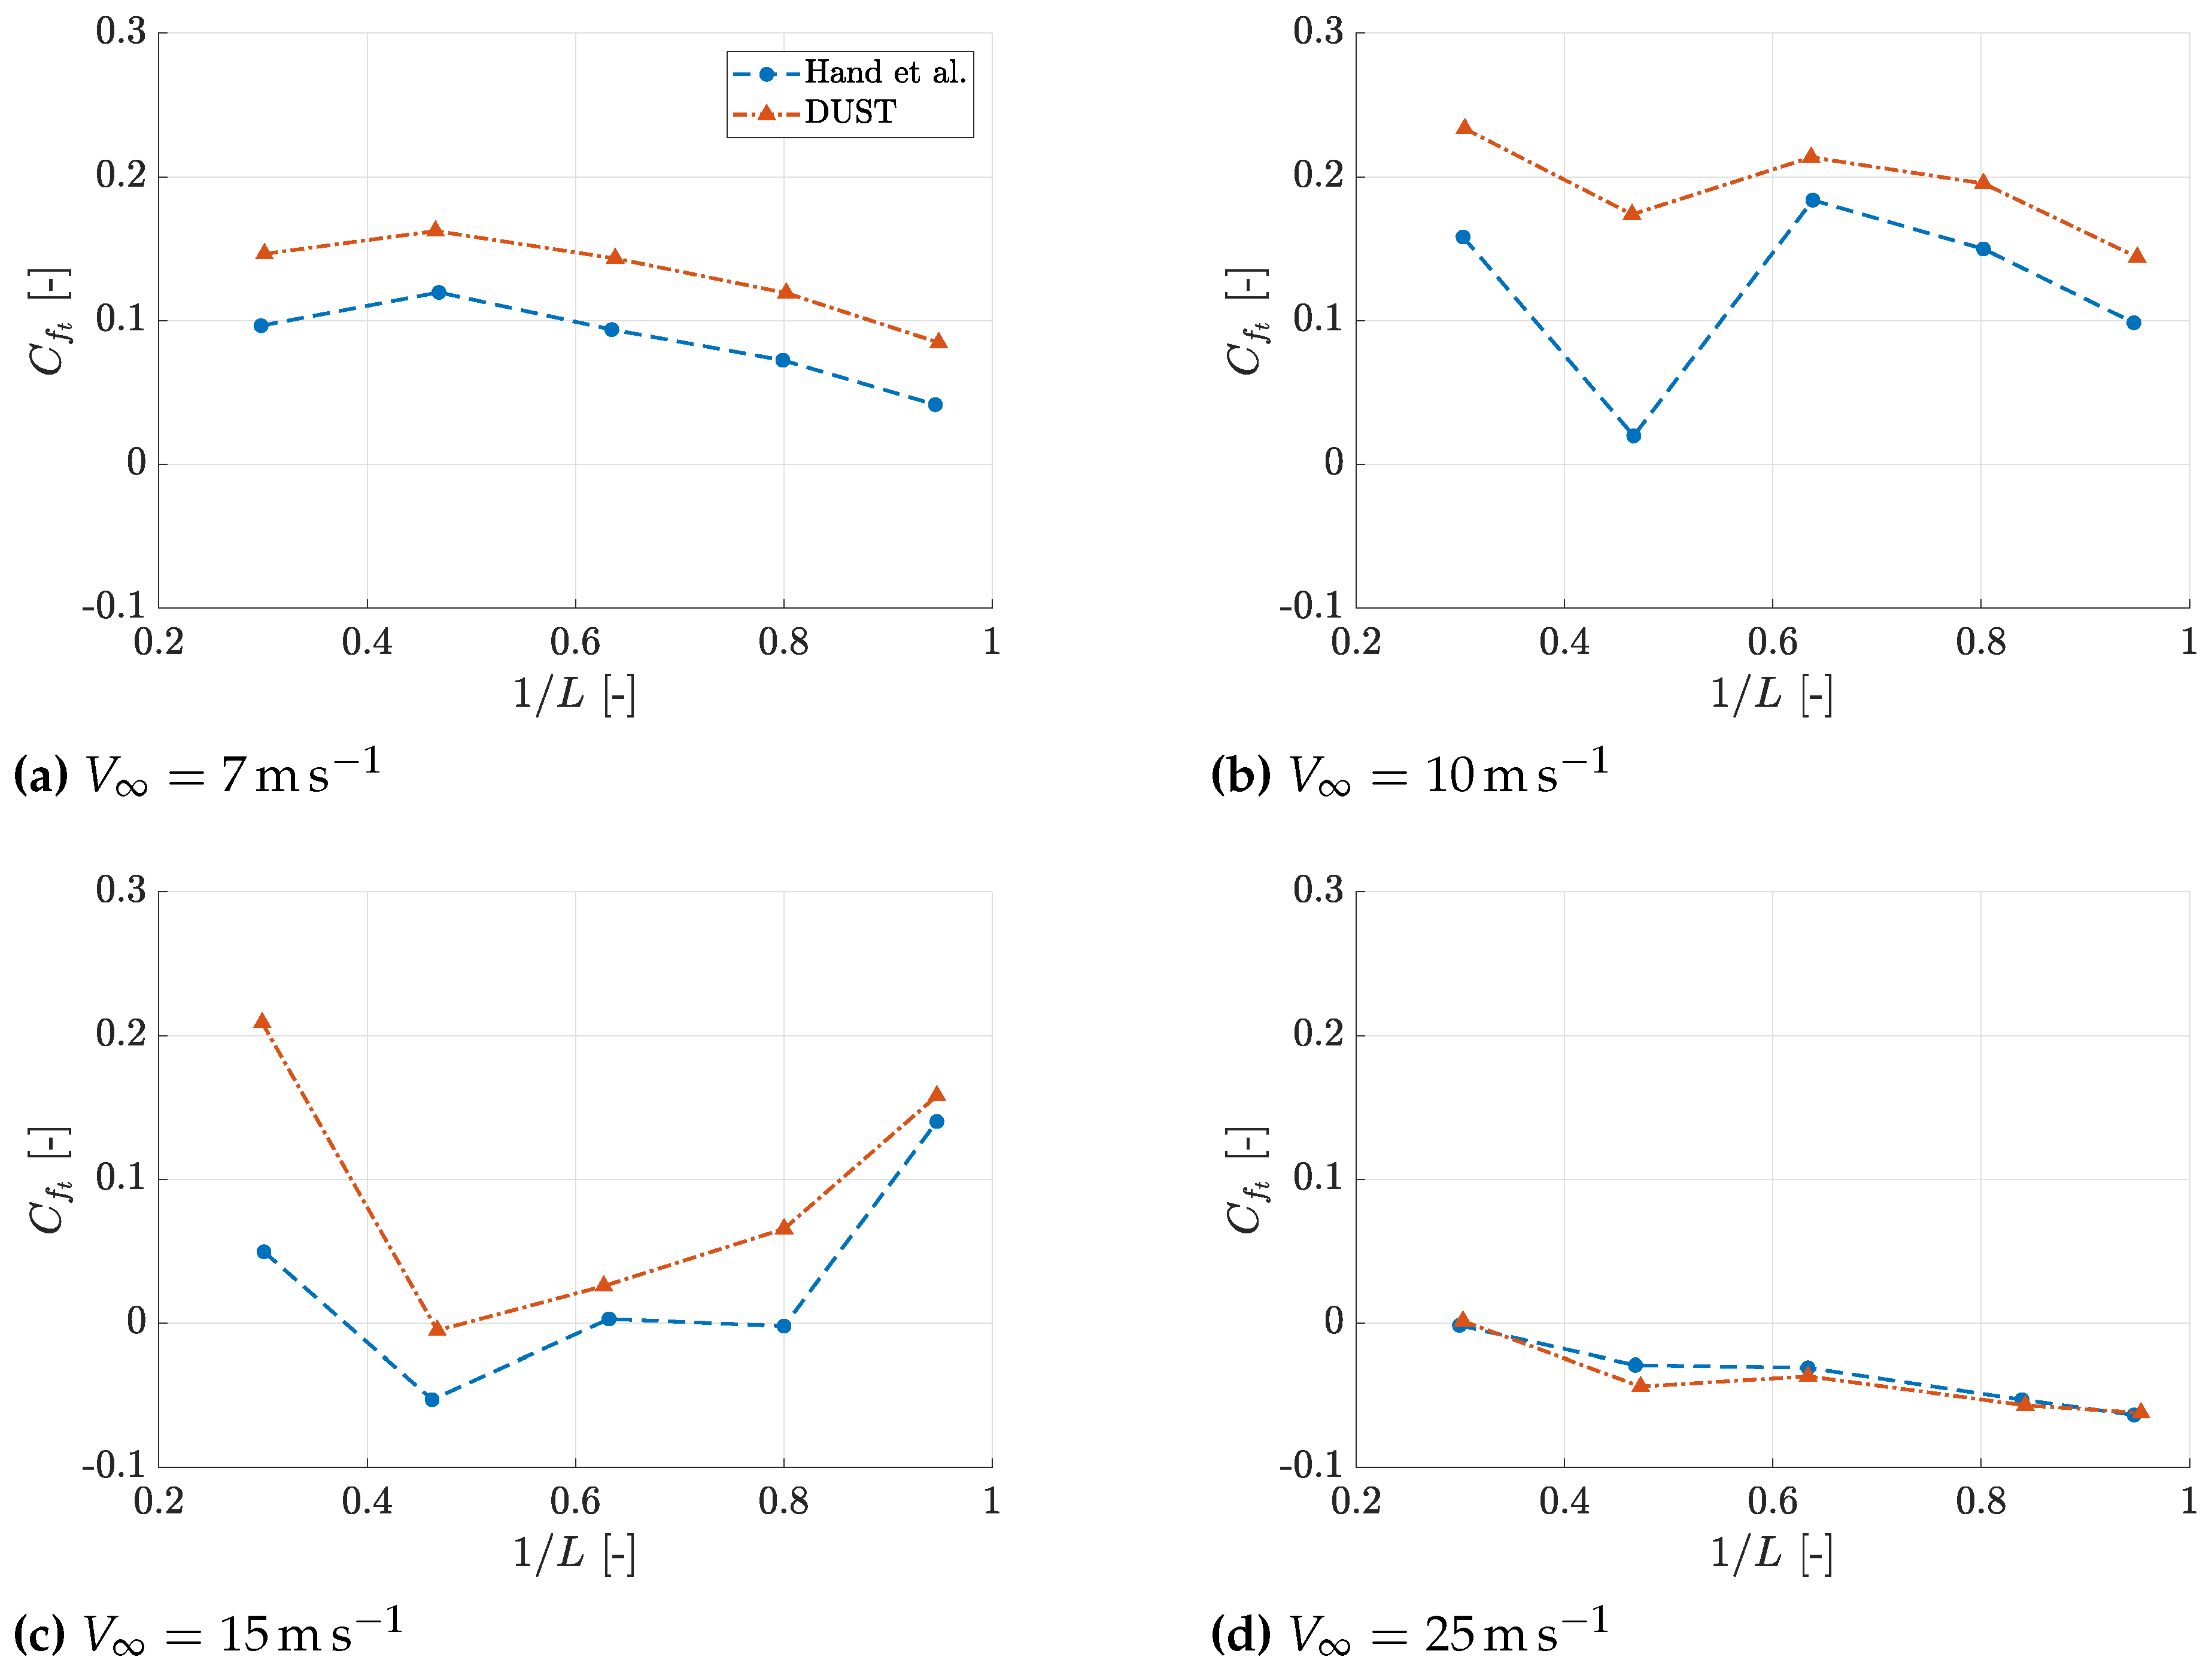
Figure 15.
Comparison of the time history of blade aerodynamic torque over a full revolution compared with high-fidelity results from [29] and experimental results from [1].
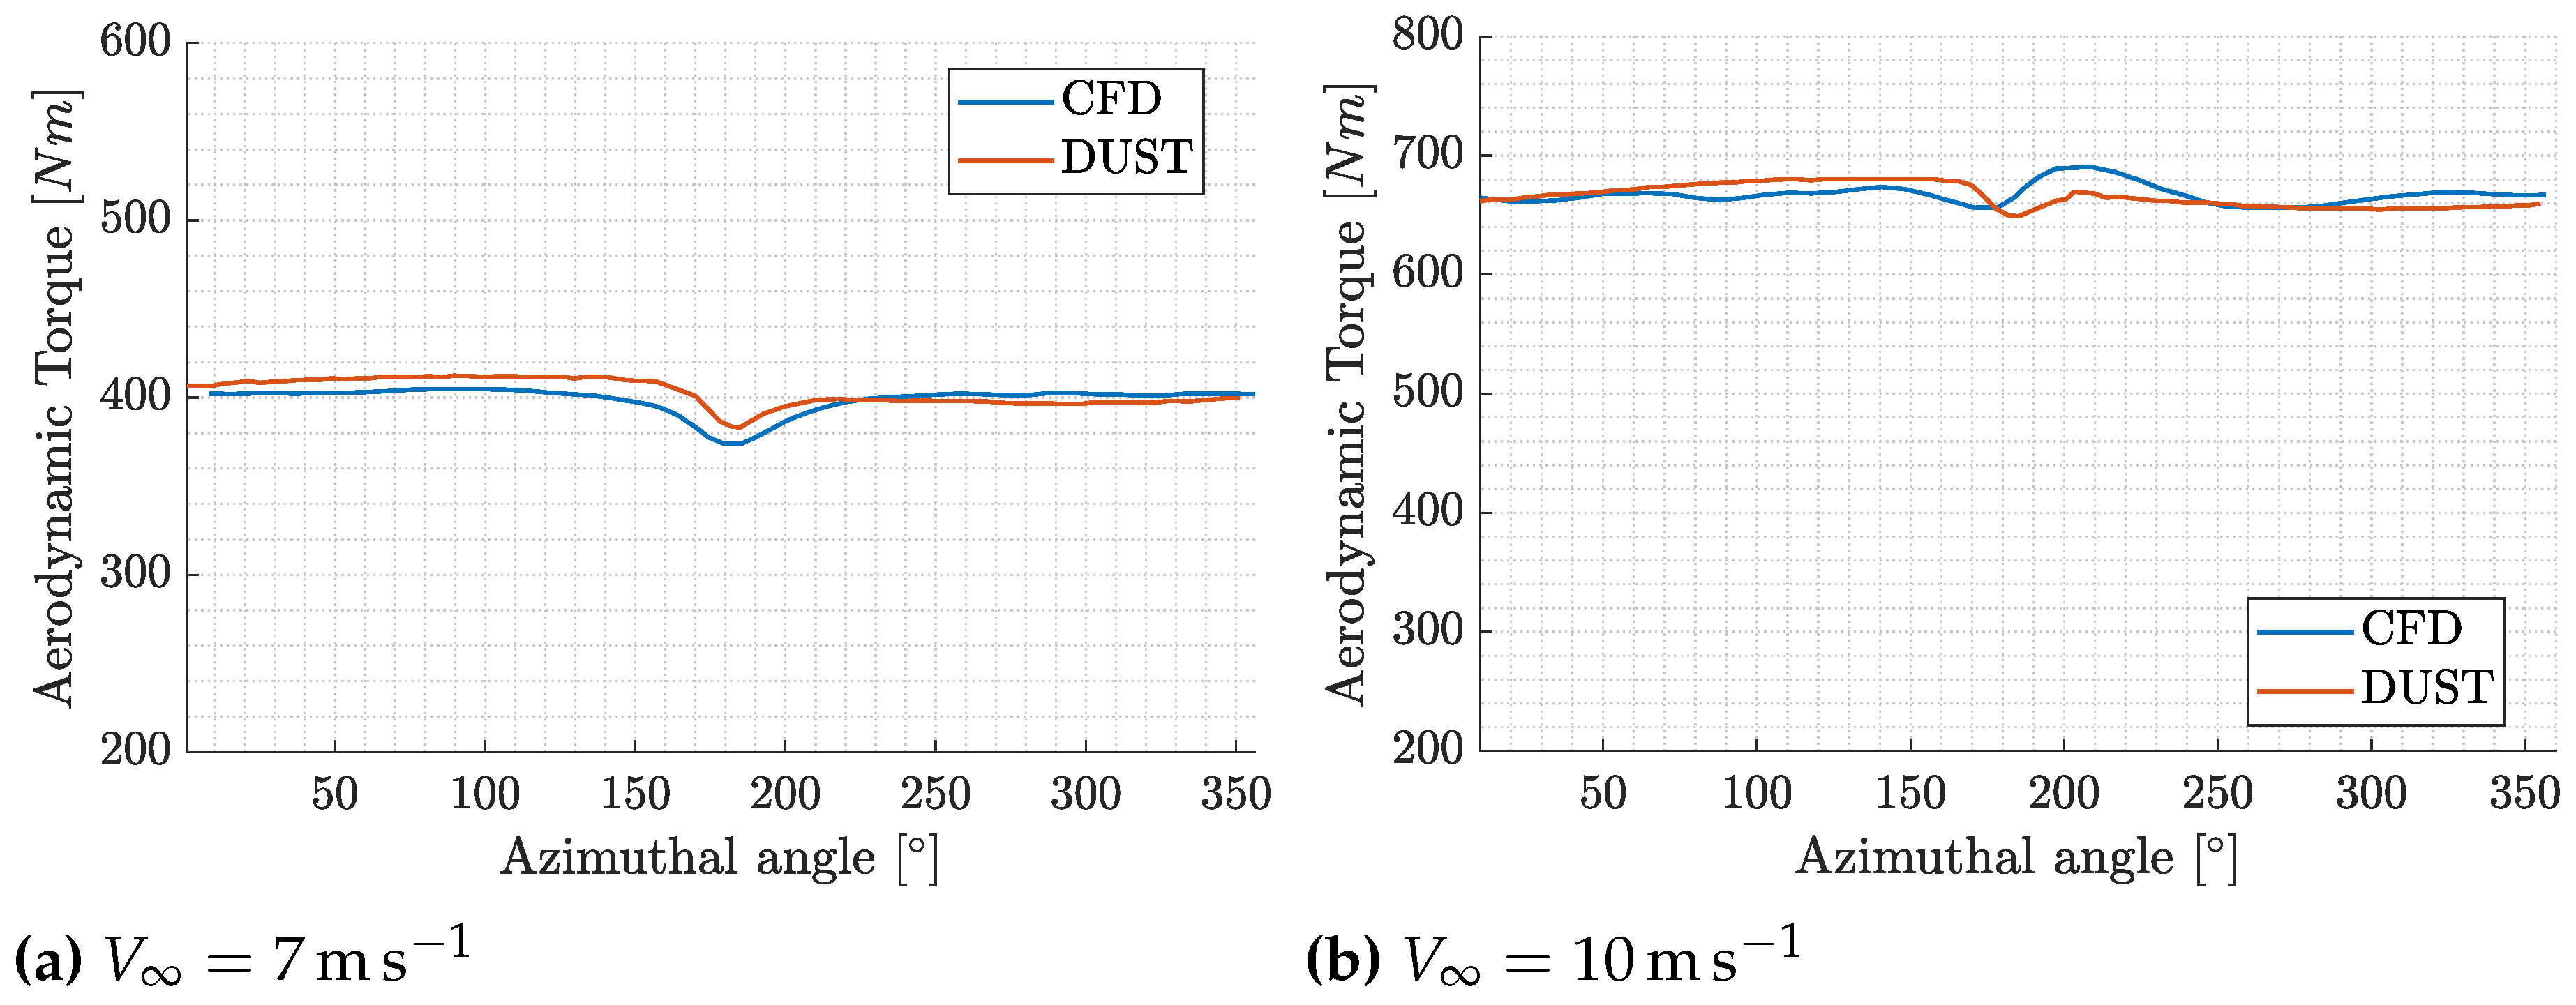

Table 1.
Summary of the NREL- 5 MW wind turbine properties.
| IEC Class/Category | I/B |
| Rated Power | 5 |
| Rotor Orientation | Upwind |
| Configuration | 3 Blades |
| Control | Variable Speed, Collective Pitch |
| Drivetrain | High Speed, Multiple Stage Gearbox |
| Rotor Diameter D | 126 |
| Hub Diameter | 3 |
| Hub Height | 90 |
| Cut-In / Rated / Cut-Out Windspeed | 3/ / / / 25 / |
| Cut-In, Rated Rotor Speed | 6.9 rpm / 12.1 rpm |
| Rated Tip Speed | 80/ |
| Overhang | 5 |
| Shaft Tilt, / Precone, | 5° / ° |
Table 2.
Summary of the main properties of the NREL- 5 MW wind turbine blade.
| Node | Span [ ] | Chord [ ] | Twist, [°] | Airfoil |
|---|---|---|---|---|
| 1 | 0 | 3.542 | 13.308 | Cylinder 1 |
| 2 | 1.37 | 3.542 | 13.308 | Cylinder 1 |
| 3 | 4.10 | 3.854 | 13.308 | Cylinder 1 |
| 4 | 6.83 | 4.167 | 13.308 | Cylinder 2 |
| 5 | 10.25 | 4.557 | 13.308 | DU 99-W-405LM |
| 6 | 14.35 | 4.652 | 11.480 | DU 99-W-350LM |
| 7 | 18.45 | 4.458 | 10.162 | DU 99-W-350LM |
| 8 | 22.55 | 4.249 | 9.011 | DU 97-W-300LM |
| 9 | 26.65 | 4.007 | 7.795 | DU 91-W2-250LM |
| 10 | 30.75 | 3.748 | 6.544 | DU 91-W2-250LM |
| 11 | 34.85 | 3.502 | 5.361 | DU 93-W-210LM |
| 12 | 38.95 | 3.256 | 4.188 | DU 93-W-210LM |
| 13 | 43.05 | 3.010 | 3.125 | NACA 63-618 |
| 14 | 47.15 | 2.764 | 2.319 | NACA 63-618 |
| 15 | 51.25 | 2.518 | 1.526 | NACA 63-618 |
| 16 | 54.67 | 2.313 | 0.863 | NACA 63-618 |
| 17 | 57.40 | 2.086 | 0.370 | NACA 63-618 |
| 18 | 60.13 | 1.419 | 0.106 | NACA 63-618 |
| 19 | 61.50 | 1.419 | 0.106 | NACA 63-618 |
Table 3.
Simulation parameters of the NREL- 5 wind turbine.
| Configuration | Blade cone, | Shaft tilt, | Yaw angle, [°] | Pitch Angle, [°] |
|---|---|---|---|---|
| C1 | 0° | 0° | 0 | 0 |
| C2 | 0° | 0° | [10, 20, 30] | 0 |
| C3 | ° | 0° | 0 | 0 |
| C4 | ° | 5° | 0 | 0 |
Table 4.
Summary of the NREL Phase VI wind turbine properties.
| Rated Power | 19.8 W |
| Rotor Orientation | Upwind |
| Configuration | 2 Blades |
| Control | Stall |
| Rotor Diameter D | |
| Hub Diameter | |
| Hub Height | |
| Cut-In / Rated / Cut-Out Windspeed | 5/ / 10 / / 25 / |
| Cut-In, Rated Rotor Speed | 71.9 rpm / 80 rpm |
| Rated Tip Speed | 42/ |
| Overhang | |
| Shaft Tilt, / Precone, | 0°/0°, °, 18° |
Table 5.
Summary of the main properties of the NREL Phase VI wind turbine blade.
| Node | Span [m] | Chord [m] | Twist [°] | Airfoil |
|---|---|---|---|---|
| 1 | 0.508 | 0.218 | 0.0 | Cylinder |
| 2 | 1.510 | 0.711 | 14.292 | NREL S809 |
| 3 | 2.343 | 0.627 | 4.715 | NREL S809 |
| 4 | 3.185 | 0.542 | 1.115 | NREL S809 |
| 5 | 4.023 | 0.457 | -0.381 | NREL S809 |
| 6 | 4.780 | 0.381 | -1.469 | NREL S809 |
| 7 | 5.029 | 0.355 | -1.815 | NREL S809 |
Table 6.
Simulations parameters of the NREL Phase VI wind turbine.
| Configuration | Blade Pitch, [°] | Yaw angle, [°] | Velocity, [m/s] |
|---|---|---|---|
| Isolated Rotor | 3 | 0 | [7, 10, 15, 25 ] |
| Full Model | 3 | 0 | [7, 10] |
Table 7.
Comparison of integral rotor power and thrust computed by DUST and high-fidelity CFD by Dose et al. [22].
Table 7.
Comparison of integral rotor power and thrust computed by DUST and high-fidelity CFD by Dose et al. [22].
| DUST LL | DUST NL-VL | CFD | ||||
|---|---|---|---|---|---|---|
| Configuration | Power [MW] | Thrust [kN] | Power [MW] | Thrust [kN] | Power [MW] | Thrust [kN] |
| C1 | 5.591 | 712.0 | 5.402 | 778.1 | 5.491 | 771.4 |
| C3 | 5.620 | 713.1 | 5.452 | 771.3 | 5.551 | 772.2 |
| C4 | 5.551 | 701.3 | 5.449 | 770.1 | 5.459 | 768.6 |
Table 8.
Comparison of integral rotor power and thrust computed by DUST and high-fidelity CFD by Dose et al. [22] for configuration C2 with 30° yaw.
Table 8.
Comparison of integral rotor power and thrust computed by DUST and high-fidelity CFD by Dose et al. [22] for configuration C2 with 30° yaw.
| Configuration | Power [MW] | Thrust [kN] |
|---|---|---|
| CFD | 4.24 | 673.7 |
| DUST (LL) | 4.55 | 602 |
| DUST (NL -VL) | 4.47 | 635 |
Table 9.
Comparison of integral rotor power and thrust computed by DUST and high-fidelity CFD by Lin et al. [17] for configuration C4.
Table 9.
Comparison of integral rotor power and thrust computed by DUST and high-fidelity CFD by Lin et al. [17] for configuration C4.
| DUST LL | DUST NL-VL | CFD | ||||
|---|---|---|---|---|---|---|
| Configuration | Power [MW] | Thrust [kN] | Power [MW] | Thrust [kN] | Power [MW] | Thrust [kN] |
| Single Rotor | 5.673 | 713.6 | 5.402 | 761.0 | 5.431 | 734.5 |
| Full Turbine | 5.560 | 709.5 | 5.193 | 745.7 | 5.091 | 694.7 |
Table 10.
Rotor thrust comparison for full NREL Phase VI wind turbine with high-fidelity CFD results from [29] and experimental results from [1].
| [] | DUST - VL [N] | CFD [N] | Exp. Mean [N] | Exp. max [N] | Exp. min [N] |
|---|---|---|---|---|---|
| 7 | 1089 | 1026 | 1149 | 1188 | 1076 |
| 10 | 1657 | 1474 | 1663 | 1805 | 1500 |
Disclaimer/Publisher’s Note: The statements, opinions and data contained in all publications are solely those of the individual author(s) and contributor(s) and not of MDPI and/or the editor(s). MDPI and/or the editor(s) disclaim responsibility for any injury to people or property resulting from any ideas, methods, instructions or products referred to in the content. |
© 2024 by the authors. Licensee MDPI, Basel, Switzerland. This article is an open access article distributed under the terms and conditions of the Creative Commons Attribution (CC BY) license (http://creativecommons.org/licenses/by/4.0/).
Copyright: This open access article is published under a Creative Commons CC BY 4.0 license, which permit the free download, distribution, and reuse, provided that the author and preprint are cited in any reuse.


