
Submitted:
28 October 2024
Posted:
29 October 2024
You are already at the latest version
Abstract
Wang et al. (Nature 623, 340—350; 2023)1 used satellite observations and phenological signatures to map and estimate the extent of planted rubber (Hevea brasiliensis Müll.Arg.), and associated deforestation, for eight Southeast Asian countries. Their assessment implies that planted rubber may have caused over 4 Mha of deforestation since 1993 — a value greater than assumed in setting deforestation policies. Unfortunately, their estimates rely on incorrect methods. In addition, their definition of “deforestation” is misleading because it includes all tree cover loss, not just natural forests, but also from established rubber gardens, and other plantations. Our assessment indicates that since 2001 the actual extent of deforestation associated with planted rubber is approximately one quarter that reported by Wang et al.
Keywords:
remote sensing
; phenology
; land-use-change
; SE Asia
; validation
Objective validation, confidence intervals and area estimates require objective sampling methods [2], but Wang et al.’s approach does not fulfil this requirement. Their validation points were not located according to objective sampling methods, but were selectively clustered, which results in bias. For example, their mapped area for rubber in China is 1.10 Mha (7.8% of the total mapped area) but accounts for 60 percent (182/304 points) of the validation points. In contrast, the mapped rubber in Indonesia totals 4.75 Mha (33.5% of the mapped total) but receives only 4 points (1.3%). Furthermore, their validation is incomplete, as it excludes areas that were viewed as ‘nonforest’ in a reference map in their reference data and thus neglects any error due to undetected rubber plantations in these areas.
We generated our own accuracy metrics and area estimates using visual (nonautomated) checking of high-resolution images and Sentinel-2 time series images. Unlike Wang et al., we included ‘nonforest’, as these areas must also be reflected in accuracy and area estimates. We also distinguished rubber monoculture from ‘Jungle rubber’ (mixed species multistrata agroforest), which by area includes much of the rubber planted in the region [3]—see Supplementary Information for a complete description of our methods.
Our revised accuracy metrics for Wang et al.,’s map were markedly lower than the published values: user and producer accuracies are 48.7 ± 5.7% and 68.1 ± 3.9%, respectively, for ‘Rubber’ (monoculture). When Jungle rubber is included, the user and producer accuracies are 51.7 ± 5.7% and 55.6 ± 4.9%, respectively. These values contrast with the published 99.3 ± 2.0% and 57.2 ± 11.0% values. We infer that the areas mapped as rubber includes considerable areas of nonrubber (Figure 1).
We found that 0.63 Mha of area mapped as rubber by Wang et al. overlaps with areas identified as oil palm (Elaeis guineensis Jacq.) [4,5] (4.4% of the mapped rubber across the six countries). This proportion is highest in Malaysia (22.0%) and Indonesia (7.5%). The commission error for the oil palm dataset (user accuracy >80%) indicates errors in the mapping of rubber. In addition, 10.2% of the rubber plants mapped in Indonesia are recognised pulpwood plantations [6].
Wang et al. adopted the mapped area of 14.15 Mha as their most plausible rubber area extent. However, the mapped area includes extensive errors of omission and commission. In contrast, the area estimate is a statistical measure derived from validation points that aims to provide the actual unbiased area along with (objective) confidence intervals [2]. However, their estimate is performed incorrectly. We developed revised estimates based on our own validation points (Table 1). Furthermore, we estimated the area of planted rubber within old growth humid forest in 2000 [7].
Our estimates of 13.15 ± 3.95 Mha for rubber (including monoculture and mixed) and 10.11 ± 2.99 Mha (only including monoculture) are substantially lower than the estimated 24.59 ± 4.6 reported by Wang et al. for the eight countries. While their ‘conservative’ rubber mapped area (14.15 Mha) lies within the bounds of our estimates, the magnitude of their commission and omission errors and biases are considerable, thus similar values likely reflects chance.
Our deforestation estimates are 0.57 ± 0.30 Mha for rubber monoculture and 0.60 ± 0.30 Mha for all rubber (monoculture and mixed). Wang et al. overestimated deforestation due to rubber both because they confused rubber with other tree crops known to cause considerable deforestation, such as oil palm and pulpwood, and because they did not distinguish tree loss from established rubber gardens, and other plantations versus the loss of natural forest. Wang et al.’s approach consisted of mapping disturbances observed during 1993-2000 and 2001-2016 within the 2021 mapped rubber area. They mention the importance of excluding prior tree plantations [1] but didn’t do so and failed to underline this caveat in their conclusions. Such caveats are often ignored in coverage that reaches policy makers and others encouraging misinterpretation—as an example, see the reporting by Reuters [8].
We explored whether Wang et al.’s assessment of deforestation included land cover change outside recognised old growth humid forest by comparing their putative rubber deforestation (2001-2016) against old growth humid forest in 2001 [7]. Wang et al. acknowledged that the term ‘deforestation’ includes any type of tree cover loss since 1993 and not only the loss of natural forest, such as the conversion or rotation of agroforests, plantation forests, agricultural tree crops and rubber itself. Nonetheless, they assume their measures are useful as generic terms for something called ‘forests’. This represents a major source of uncertainty and potential misunderstandings. We found that 71.2% of the claimed ‘deforestation’ occurred outside recognised old growth humid forests in 2001. This problem is especially acute in Thailand, a country which has a long history of rubber production, with tree loss outside recognised old growth humid forests accounting for 94.6% of the deforestation estimates of Wang et al.
To conclude, Wang et al.’s assessments are misleading. Their rubber maps present high omission and commission errors, and their area estimates are unreliable. Our analysis indicated that the old growth forest converted to rubber plantations in Southeast Asia after 2001 was significantly lower than the mapped 2.98 Mha and estimated 2.49 ± 0.35 Mha (our 95% upper-bound deforestation estimate is 0.90 Mha). As sophisticated satellite methods become increasingly useful for promoting conservation and overseeing land use, adhering to good practices remains essential for ensuring their credibility. We urge Wang et al. to reassess their findings to better inform policy interventions.
+++Supplementary Methods
We assessed the accuracy of the rubber map presented in Wang et al. [1] using established validation practices [2]. These practices estimate area and associated accuracy metrics for mapped land cover classes within a defined region, in this case, ‘rubber’ in Southeast Asia. Although Wang et al. claimed to apply such practices, their failure to use random sampling led to invalid estimates, statistics, and conclusions.
We used stratified random sampling to allocate 300 validation points to each of the three classes: ‘non-forest’, ‘forest’, and ‘rubber’. The ‘forest’ and ‘non-forest’ classifications were derived from an existing land cover map as used by Wang et al. and the ‘rubber’ class was obtained from their classification model.
For each of the 900 validation points, we inspected a 10x10 meter square centred on the point’s location using Google Earth and, where necessary, Sentinel-2 time series. We classified points as ‘forest’ or ‘non-forest’ based on tree cover observed in the sub-meter resolution images. ‘Rubber’ was identified by the distinctive form of rubber trees in high-resolution images. If the identification of rubber trees was unclear, as it was in a few cases, it was verified through assessing phenology in Sentinel-2 time series, as also explained and applied by Wang et al..
We further categorized rubber into rubber ‘monoculture’ (uniform closed-canopy plantations) and ‘jungle’ rubber (isolated or clustered trees within secondary forests or mixed species stands). This allowed evaluation of the Wang et al. map when considering just monoculture rubber, and with regard to both monoculture and jungle rubber. For our monoculture-only assessment, jungle rubber points were classified as ‘forest’.
We calculated three accuracy metrics: Overall accuracy—The proportion of correctly classified pixels across all classes. Producer’s accuracy—The percentage of validation points for a given class correctly classified on the map (omission errors). User’s accuracy—The likelihood that a pixel classified as a specific class on the map is correct on the ground (commission errors).
We estimated the true area planted with rubber following established methods which account for classification errors and also recognise uncertainty by providing confidence intervals [2]. To estimate the deforestation associated with rubber, we constrained our validation to areas classified as old growth humid forest in 2001 (see following paragraph) and estimated the area of rubber within this. We supplemented the original validation points with additional points to ensure 300 per class within the old growth humid forest area. This approach assumes that the 2021 rubber area was forest in 2001 and that this lacks any marked classification errors. If an area was classified as forest in 2001 and later as rubber, we assume that the area was deforested and converted to rubber, but as the mapped rubber areas includes classification errors, we generated a corrected estimate, with confidence intervals, of deforestation associated with rubber expansion.
We assessed the commission error in Wang et al.’s map [1] using previously validated data for planted oil palm and pulpwood [3,4,5]. Based on these we calculated the overlapping area between the rubber extent map and the oil palm and pulpwood maps.
Our ‘old growth humid forest’ layer was derived from Turubanova et al. [6] who call it ‘primary forest’. These authors define this forest ‘as mature natural humid tropical forest cover that has not been completely cleared and regrown in recent history’. These authors further clarify that these forests have ‘no detectable signs of human caused alteration or fragmentation, as delineated per the intact forest landscape (IFL) method’ but ‘include mature humid tropical forests that have experienced partial canopy loss at the 30 m mapped spatial resolution, or are located in proximity to forest loss, or that exist as fragments that do not meet IFL criteria’ [6]. These criteria may include selectively logged forests that remains largely intact, older regrowth forests but exclude predominantly deciduous forests. The exclusion of predominantly deciduous forests suggests any significant deforestation of old growth deciduous forest, for example, in Cambodia, Laos and China, is likely underestimated. Such forests are absent in the main equatorial regions (Sumatra and Borneo) where most rubber-related deforestation was identified by Wang et al. In Java, where deciduous forests could occur, and rubber is locally cultivated, there is little natural forest left outside protected areas [7] and deforestation is likely to be replanting of tree plantations, including rubber.
We also checked our assertion that Wang et al.’s numbers would be misunderstood in media coverage. Cases that illustrate our concerns were readily found. For example, Reuters cited the study as follow [8] ‘The researchers, in a paper published by Nature, said that previous data suggested rubber was a relatively minor problem when it comes to deforestation, compared with commodities like soy and palm oil. But high-resolution satellite data, which helped identify more plantations run by smallholders, suggested that forest losses “greatly exceed” previous estimates. More than 4 million hectares of forest have been lost to rubber plantations since 1993, with two thirds of it in Indonesia, Thailand and Malaysia, they said.’
Author Contributions
All the authors contributed to the ideas presented and writing and approved the final text. AD performed the validation and related analyses.
Data Availability Statement
Our validation dataset can be downloaded from the following public repository: DOI Zenodo: https://doi.org/10.5281/zenodo.10646349. The rubber layers presented by Wang et. al, 2023 are available from https://doi.org/10.5281/zenodo.8425153.The primary humid forest map produced by Turubanova et al., 2018 is available from https://glad.umd.edu/dataset/primary-forest-humid-tropics.
Conflicts of Interest
The authors declare that they have no conflict of interest.
References
- Wang, Y.; et al. High-resolution maps show that rubber causes substantial deforestation. Nature 623, 340-346 (2023).
- Olofsson, P.; et al. Good practices for estimating area and assessing accuracy of land change. Remote sensing of Environment 148, 42-57 (2014).
- Penot, E., Chambon, B. & Wibawa, G. in Proceedings of International Rubber Conference. 1-26.
- Descals, A.; et al. High-resolution global map of smallholder and industrial closed-canopy oil palm plantations. Earth System Science Data 13, 1211-1231 (2021).
- Gaveau, D. L.; et al. Slowing deforestation in Indonesia follows declining oil palm expansion and lower oil prices. PloS one 17, e0266178 (2022).
- Gaveau, D. L.; et al. Rise and fall of forest loss and industrial plantations in Borneo (2000–2017). Conservation Letters 12, e12622 (2019).
- Turubanova, S. , Potapov, P. V., Tyukavina, A. & Hansen, M. C. Ongoing primary forest loss in Brazil, Democratic Republic of the Congo, and Indonesia. Environmental Research Letters 13, 074028 (2018). [CrossRef]
- Reuters. Forest loss from SE Asia rubber is up to 3 times more than thought—study. https://www.reuters.com (2023).
- Whitten, T. , Soeriaatmadja, R. & Afiff, S. The Ecology of Java and Bali. xxiii+ 969 (Periplus Editions,(HK) Ltd., 1996).
Figure 1.
Location and results of sample validation by Wang et al. (left) and by the current study (right). False positives and false negatives reflect commission and omission errors, respectively, for ‘Rubber’. See Supplementary Information for methods.
Figure 1.
Location and results of sample validation by Wang et al. (left) and by the current study (right). False positives and false negatives reflect commission and omission errors, respectively, for ‘Rubber’. See Supplementary Information for methods.
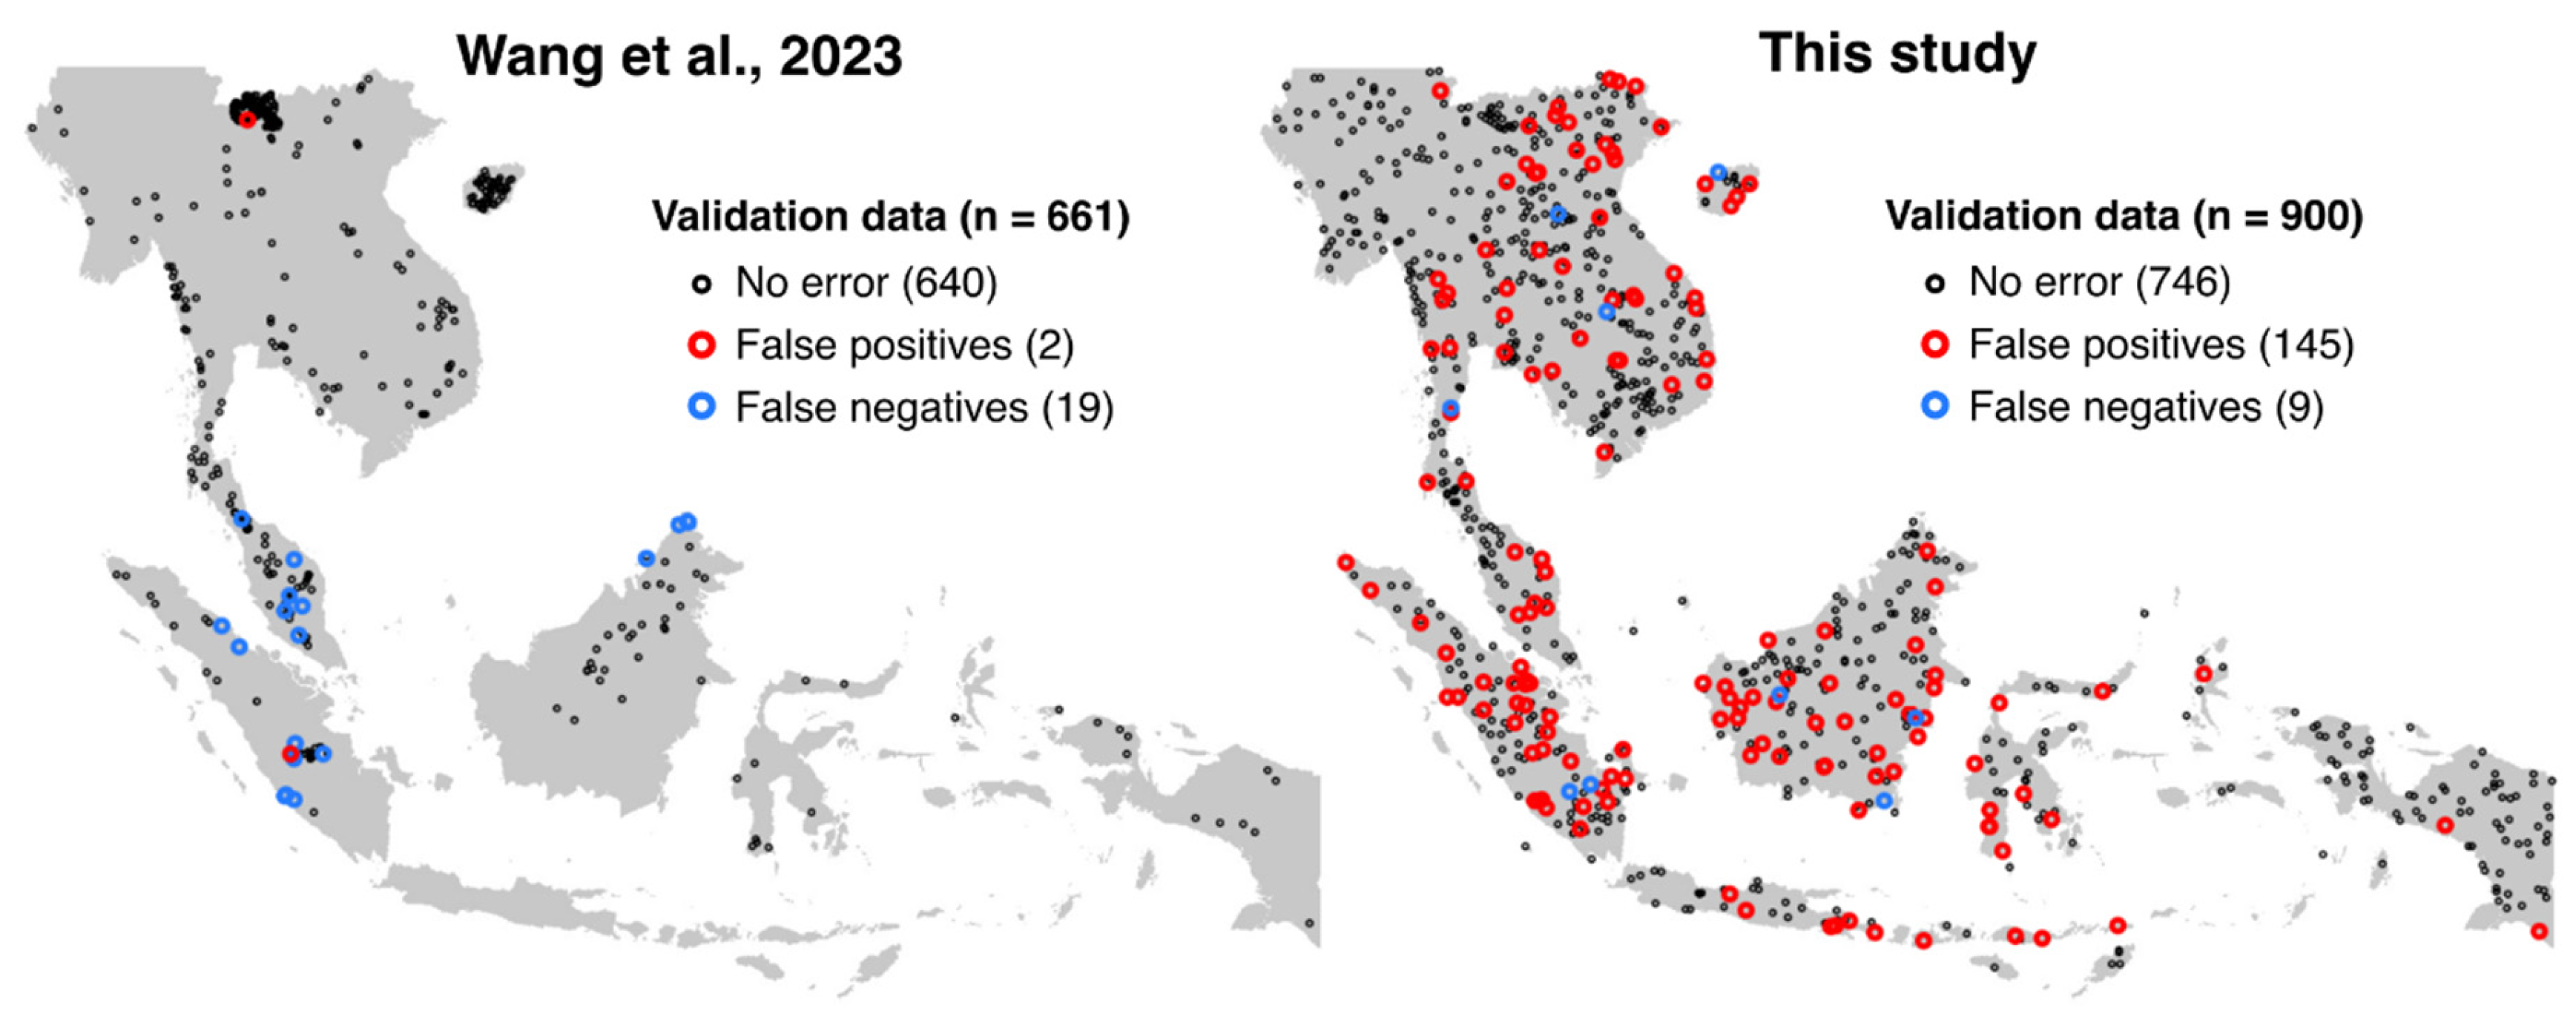

Table 1.
Area estimates based on mapped areas with confidence intervals for Wang et al., as reported in their study [1] and by ours.
Table 1.
Area estimates based on mapped areas with confidence intervals for Wang et al., as reported in their study [1] and by ours.
| Units (Mha) | Mapped area (Wang et al., 2023) | Area estimate (Wang et al., 2023) | Area estimate a (this study) | Area estimate b (this study) |
| Rubber (2021) | 14.15 | 24.59 ± 4.62 | 10.11 ± 2.99 | 13.15 ± 3.95 |
| Rubber deforestation (2001-2016) | 2.98 | 2.49 ± 0.35 | 0.57 ± 0.30 | 0.60 ± 0.30 |
a Monoculture. b Monoculture and mixed/agroforest.
Disclaimer/Publisher’s Note: The statements, opinions and data contained in all publications are solely those of the individual author(s) and contributor(s) and not of MDPI and/or the editor(s). MDPI and/or the editor(s) disclaim responsibility for any injury to people or property resulting from any ideas, methods, instructions or products referred to in the content. |
© 2024 by the authors. Licensee MDPI, Basel, Switzerland. This article is an open access article distributed under the terms and conditions of the Creative Commons Attribution (CC BY) license (https://creativecommons.org/licenses/by/4.0/).
Copyright: This open access article is published under a Creative Commons CC BY 4.0 license, which permit the free download, distribution, and reuse, provided that the author and preprint are cited in any reuse.


