Submitted:
09 February 2024
Posted:
12 February 2024
You are already at the latest version
Abstract
The dynamic global automotive sector is characterized by an ever-evolving demand for high-quality vehicles and accessible prices. This research tackles the issue of scrap reduction in electric motor manufacturing for the automotive industry, specifically in a Chinese company, by employing the PDCA methodology. The paper delves into the company's background and current landscape, while pinpointing the problem: specific production lines segments experiencing hi-pot issues are the primary source of scrap. The overarching goal is to design and implement a strategy that, leveraging the PDCA approach, reduces scrap generated during the eight-months subassembly (armature) manufacturing process, from its current average of 2.92% to 0.7%, ultimately enabling the company to eliminate hi-pot defects.
Keywords:
Plan-Do-Check-Act (PDCA)
; Scrap
; Quality Tools
1. Introduction
Since the early 20th century, the industrial environment has been characterized by fierce competition, rapid changes, and fluctuating demand. Key innovations like robotics, the Internet of Things (IoT) and additive manufacturing have become crucial for technological advancement. These innovations can strengthen a country’s manufacturing capacity, bolster its military industrial power, and enhance industry efficiency, thereby driving talent towards more intricate work tasks [1]. For all companies, reduction costs and increasing competitiveness are paramount goals. This imperative has become even more pronounced due to stricter markets demands. Customers today expect high-quality products and services tailored to their specific needs, deliver faster and more frequently. Frequent customer engagement is crucial for business growth and exceeding quality expectations is the most effective way to foster customer loyalty [2]. Meeting these demands necessitates more flexible production processes. Eliminating non-value-adding activities within the production flow is essential for achieving this goal [3,4,5]. The automotive industry has been a trailblazer in developing and implementing tools to identify, analyze, and mitigate factors that create competitive disadvantages [6].
This case study demonstrates the use of the PDCA methodology to minimize the scrap generated by process variability in a multinational company manufacturing electric motors for the automotive industry. Variations within the “armature” subassembly, involving lamination, epoxy coating, and magnetic wire winding (Figure 1, Figure 2 and Figure 3) were considered. During the period January-September 2022, an average scrap rate of 2.92% was identified from a total production of 1,173,538 units. Figure 4 illustrates the monthly scrap data recorded by the company during this period.
2. Research Design
The problem to be solved focuses on reducing scrap generated during hi-pot testing in the subassembly manufacturing process of electric motors. The hi-pot test, an onsite high voltage withstand test, aims to identify any weak insulation points in the magnetic wire winding [7]. During this test, an extremely high voltage charge, well above the normal operating voltage, is applied between the conductors and their insulation. The test monitors the leakage current flowing through the insulation, essentially verifying whether the product can safely handle high voltage stresses. Any insulation leak triggers an alarm at the armature-level hi-pot tester, indicating improper continuity (a situation that should not occur). Therefore, identifying the root causes of defects originating in this testing phase is crucial. It is necessary to pinpoint the factor or combination of responsible for these defects, be it the lamination process, epoxy coating and/or of the magnetic wire winding. Ultimately, the project aims to enhance quality by minimizing scrap generated during armature manufacturing.
The chosen methodology, informed by on applying PDCA for defects and rejection reduction [8,9], consisted of four key steps: (a) literature review: this involved analyzing published articles with case studies demonstrating the PDCA cycle in action, examining the individual PDCA phases, and exploring the connections between PDCA and other improvement methods, as well as its relationships with quality management systems; (b) case study development: this stage focused on building the specific case for this research project; (c) the analyses of results: after implementing the PDCA cycle, the results obtained were exhaustively analyzed; and finally, (d) conclusions and recommendations: based on the findings, clear conclusions were formulated and practical recommendations for further improvement were provided.
3. Literature Review
3.1. PDCA Methodology
A PDCA cycle, a dynamic model centered on customer satisfaction, drives quality improvement through four distinct phases: plan, do, check and act [10]. It leverages statistical and administrative tools to concretely enhance the performance of a company’s processes, products and services. At its core, PDCA involves crafting a detailed action plan, outlining specific objectives and pre-empting potential challenges. The “Do” phase entails executing the planned actions, followed by a thorough assessment of outcomes in the “Check” phase. If the results prove positive, the “Act” phase involves permanently integrating the changes into the process, with a continuous focus on further refinement [11].
The PDCA cycle Is a powerful tool used in diverse industries, with the automotive sector being a prime example. Among the key reasons for this popularity:
- IATF 16949 Quality Management System & Growth. – when considering tools for improvement within a quality management system based on IATF 16949, or for pursuing dynamic growth and profitability, PDCA stands out as a clear choice.
- Demand & Productivity. – Moreover, automotive industry in one of the most demanding sectors globally, necessitating a systematic approach to boost productivity [12]. This makes PDCA particularly relevant.
A research study by Amaral et al. [13] showcases a successful case in point. An automotive electromechanical component manufacturer implemented PDCA with supporting tools like SIPOC matrix, Chart Control, 5S, and Visual Management. This resulted in in a notable reduction in waste through minimized transport and movements.
The literature also highlights the effectiveness of PDCA in conjunctions with various quality tools for scrap reduction. For example, Silva et al. [14] demonstrate its practical application in minimizing can loss in a beverage company, ultimately leading to significant waste reduction through improved quality and productivity.
Moreover, PDCA’s versatility extends to driving process improvement and continuous optimization. Studies like Singh Sidhu et al. [15] showcases its role as a roadmap for implementing 5S in the agricultural industry, resulting in decreased assembly line cycle time. Similarly, Tahiduzzaman et al. [16] combine 5S with other lean tools (Pareto chart, cause-effect diagram) to achieve quality enhancement and profit increases. Garza-Reyes et al. [17] propose utilizing PDCA for systematic implementation and execution of Environmental-VSM studies (E-VSM). Finally, Goyal et al. [18] present a case study on employing Kaizen and PDCA to reduce material waste.
3.2. Relationship between PDCA and Other Improvement Methodologies
Historically, PDCA has found itself naturally intertwined with various other improvement tools and methodologies. The specialized literature reveals its adaptability: it can serve as a foundational framework for more intricate methodologies, or act as a complementary component within hybrid approaches [19]. Table 1 showcases relationship between PDCA and a selection of six sigma tools.
3.3. Relationship between PDCA and other Improvement Methodologies
The PDCA cycle´s popularity extends beyond more improvement methodologies; its deeply ingrained in most major quality management systems. Standards like ISO 9001, ISO 14001 and ISO 45001 have readily embraced and integrated it. This adoption isn´t without reason: the step-by-step nature of PDCA makes it readily applicable, easily trackable and smoothly auditable. It standardized application aligns perfectly with the requirements of various management systems. For instance, standard ISO 9001:2015 leverages the PDCA cycle to illustrate how its clauses 4 to 10 can be systematically grouped and implemented (see Figure 5). This serves as a powerful testament to the PDCA cycle’s effectiveness and versatility in driving continuous improvement within quality management systems.
Furthermore, ISO 9001 recognizes the power of the PDCA cycle for managing individual processes and the entire system. It emphasis on risk-based thinking, aimed at both capitalizing on opportunities and mitigating adverse outcomes, further enhances the adaptability of PDCA to the demands of modern industry [26]. This flexible approach is precisely what makes PDCA such a valuable tool. For instance, Chiarini and Cherafi research [27] demonstrates this adaptability by developing an implementation guideline for manufacturing companies. This guideline, based on the PDCA model, effectively integrates ISO 9001 requirements with Industry 4.0 technologies. This showcases how PDCA can bridge the gap between established quality management systems and the latest technological advancements.
The positive Impact of PDCA Isn’t restricted to manufacturing; It extends to the service industry. Habibie and Kresiani investigation [28] meticulously analyzes the ISO/IEC 17025:2017 standard clause by clause, exploring its connection to the PDCA concept within the process approach framework. Their findings culminated in a PDCA cycle model specifically tailored to implementing this standard (as seen in Figure 6). This serves as another compelling example of the PDCA cycle’s versatility in diverse organizational contexts.
4. Case Study
Following subsection describes the methodology applied in the present case study.
4.1. The Method Used in this Study Is Illustrated in Figure 7.
The PDCA cycle was used to perform the present project. This cycle comprises four phases: (1) Plan, (2) Do, (3) Check, and (4) Act. Following subsections describe how each PDCA phase was applied in this project
4.1.1. Phase 1. Plan
In this phase, the problem definition using 5W + 2H was addressed. Table 2 shows the obtained information.
Based on the information in Figure 8, the problem of continuity between the winding and metal likely stems from a multifactorial issue. All factors ultimately converge on the presence of an undesirable direct connection, typically by insulation failure. This failure can have various factors, notably:
- (a)
- During the winding process, the wire is inadvertently inserted into the epoxy coating and comes into contact with the laminate.
- (b)
- The lamination itself has a sharp edge that damages the cable, leading to contact (See the magnified image of defective and non-defective parts in Figure 8).
Table 3 details the 3-legged 5 Why analysis utilized to thoroughly investigate the root causes of the error. This approach enabled us to explore three distinct perspectives – specifics, detection, and systemic issues – to gain a comprehensive understanding of the root cause.
Once the first two phases of the methodology proposed in this article have been completed, the following can be concluded:
- (a)
- The armature production line suffers from frequent and costly stoppages due to hi-pot issues. This triggers the generation of scrap, since the piece presents unwanted continuity and cannot be part of the electric motor, so it has to be discarded.
- (b)
- The thin or uneven epoxy coating, crucial for preventing contact between the cable and lamination is identified as a key contributor to the hi-pot failures.
- (c)
- The validation of the epoxy coating addition process is not reliable.
Based on these findings, the “Do “phase should prioritize improvement strategies focused on ensuring the insulation of the lamination and wire winding.
4.1.2. Phase 2 and 3. Do and Check
Phases 2 and 3 focuses on addressing the identified insulation breakdown between the cable and lamination. Key improvement opportunities included:
- Peel strength analysis to evaluate the adhesive strength of the epoxy coating.
- Validation of the epoxy coating addition process.
- Adjusting the voltage at the epoxy coating curing station to optimize curing conditions.
- Testing different thickness of the epoxy coating to find the optimal balance between insulation and production efficiency.
- Evaluate the impact of reverse rolling on the armature shell’s compatibility with the epoxy coating.
Additionally, a Differential Scanning Calorimetry test was conducted to analyze the thermal behavior and curing properties of the epoxy coating for further process optimization.
4.1.2.1. Epoxy Coating Peel Test
The epoxy coating peel test, a crucial component of process validation, evaluates the additive strength of the epoxy coating to the laminated shell. It simulates the forces exerted by the cable during the winding process, providing insights into de coating’s ability to withstand potential detachment under real-world conditions. The test involves applying a controlled tensile force to detach the epoxy coating from the lamination. This is performed using a specialized machine, similar to the one depicted in Figure 9.
The peel test specification requires a detachment force of 6 kgf. However, conducting the test with the armature in a vertical position (as shown in Figure 10a) yielded a significantly higher force of 42.5 kgf. Consulting the company’s headquarters in China revealed that this vertical orientation was incorrect. They advised that the armature should be positioned at an angle between 80° and 90° during the test. This ensures the pushing tip contacts the most sensitive area, where the cable exerts the maximum force.
Re-running the test with the armature tilted, as recommended, resulted in a dramatic decrease in detachment force for the same sample – from 42.5 kgf, to 5.3 kgf. This clearly falls below the specified threshold (see Figure 10b). This incorrect testing procedure likely explains why the epoxy coating exhibits increased susceptibility to cracking and chipping.
4.1.2.2. Validation of the Epoxy Coating Addition Process
To comprehensible validate the production process and verify consistent output quality, a process parameter matrix was documented, encompassing all critical parameters for each phase (laminating degreasing, cooling, epoxy addition, cleaning). Table 4 details the specific parameters, their Max/Min ranges, and average values.
Figure 11 illustrates the epoxy coating curing process for armatures, highlighting the critical temperature points through each phase.
To identify potential areas for process improvements, an initial assessment was conducted. This assessment aimed to determine if the parameters listed in Table 4 exhibited statistical control over critical output characteristics at different process phases. Control charts for individual measurements were generated. Additionally, process capability measures were obtained for critical output characteristics like epoxy thickness and detachment force from both sides of the armature.
Figure 12, Figure 13, Figure 14 and Figure 15 demonstrate stable and predictable processor behavior for the laminating degreasing and epoxy curing temperatures. This consistent performance lays the foundation for developing reliable improvement plans [29]. Figure 16 reveals high process capability in meeting epoxy thickness specifications, consistently achieving values within the 100 – 500 microns range. However, Figure 17 highlight a significant challenge: low process capability in meeting the 6 kgf specification for epoxy detachment force. This deficiency is particularly pronounced on the short side of the armature reinforcement (see Figure 18 for reference).
4.1.2.3. Adjusting the Voltage at the Epoxy Coating Curing Station to Optimize Curing Conditions
To investigate the cause of low detachment force, two targeted were conducted. In the first, the voltage at the curing station was increased from 3 Kv to 3.1 Kv, to explore if enhanced curing could harden de epoxy and prevent cable penetration, a potential contributor of hi-pot failures. This test involved 30 samples with separate detachment force measurements for both short and long sides of the armature (referring to the rotation axis as defined in Figure 21). In second experiment, the thickness of the epoxy coating was increased too, from 0.250 mm to 0.350 mm, aiming to provide a stronger physical barrier against cable abrasion. Again, detachment force was measured on both sides of 30 armatures.
Figure 19 reveals a trend: even after the voltage increase in the curing station, nearly half (46%) of the tested samples on the short side of the armature still fall below the minimum acceptable detachment force. This highlights the need for further investigation and potentially alternative solutions to address the low adhesion issue.
While Figure 20 shows no samples on the long side falling outside the detachment specification, a trend emerges: around 7% of the samples are close to the limit. This proximity to failure pushes the boundaries of acceptable risk and warrant further investigation. To evaluate the effectiveness of this modification is consistently meeting the specification, the company in this case study employs the Ppk index. This index leverages extensive data collected over to factor out external influences on the process. It relies on the standard data of the entire data set (σ = S) as an estimate for process variation, as shown in equation 1. In this case with only one lower specification limit and aiming for higher detachment force values, a higher Ppk indicates better process capability.
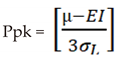 where:
µ = is the average of the data obtained from the variable under study (the force necessary to detach the epoxy coating from the armature, in Kgf.
EI = is the detachment specification (in Kgf).
σL = is the long-run standard deviation (in Kgf).
Compliance analysis based on Figure 21 clearly demonstrates that the implemented curing process modification is unable to meet the specification. Both the short side Ppk of 0 and the long side Ppk of 0.47 fall significantly short of the company’s minimum acceptable value of 1.32.
Figure 21.
Detachment force capability response to curing station voltage increase, (a) Short side armature; (b) Long side armature.
Figure 21.
Detachment force capability response to curing station voltage increase, (a) Short side armature; (b) Long side armature.
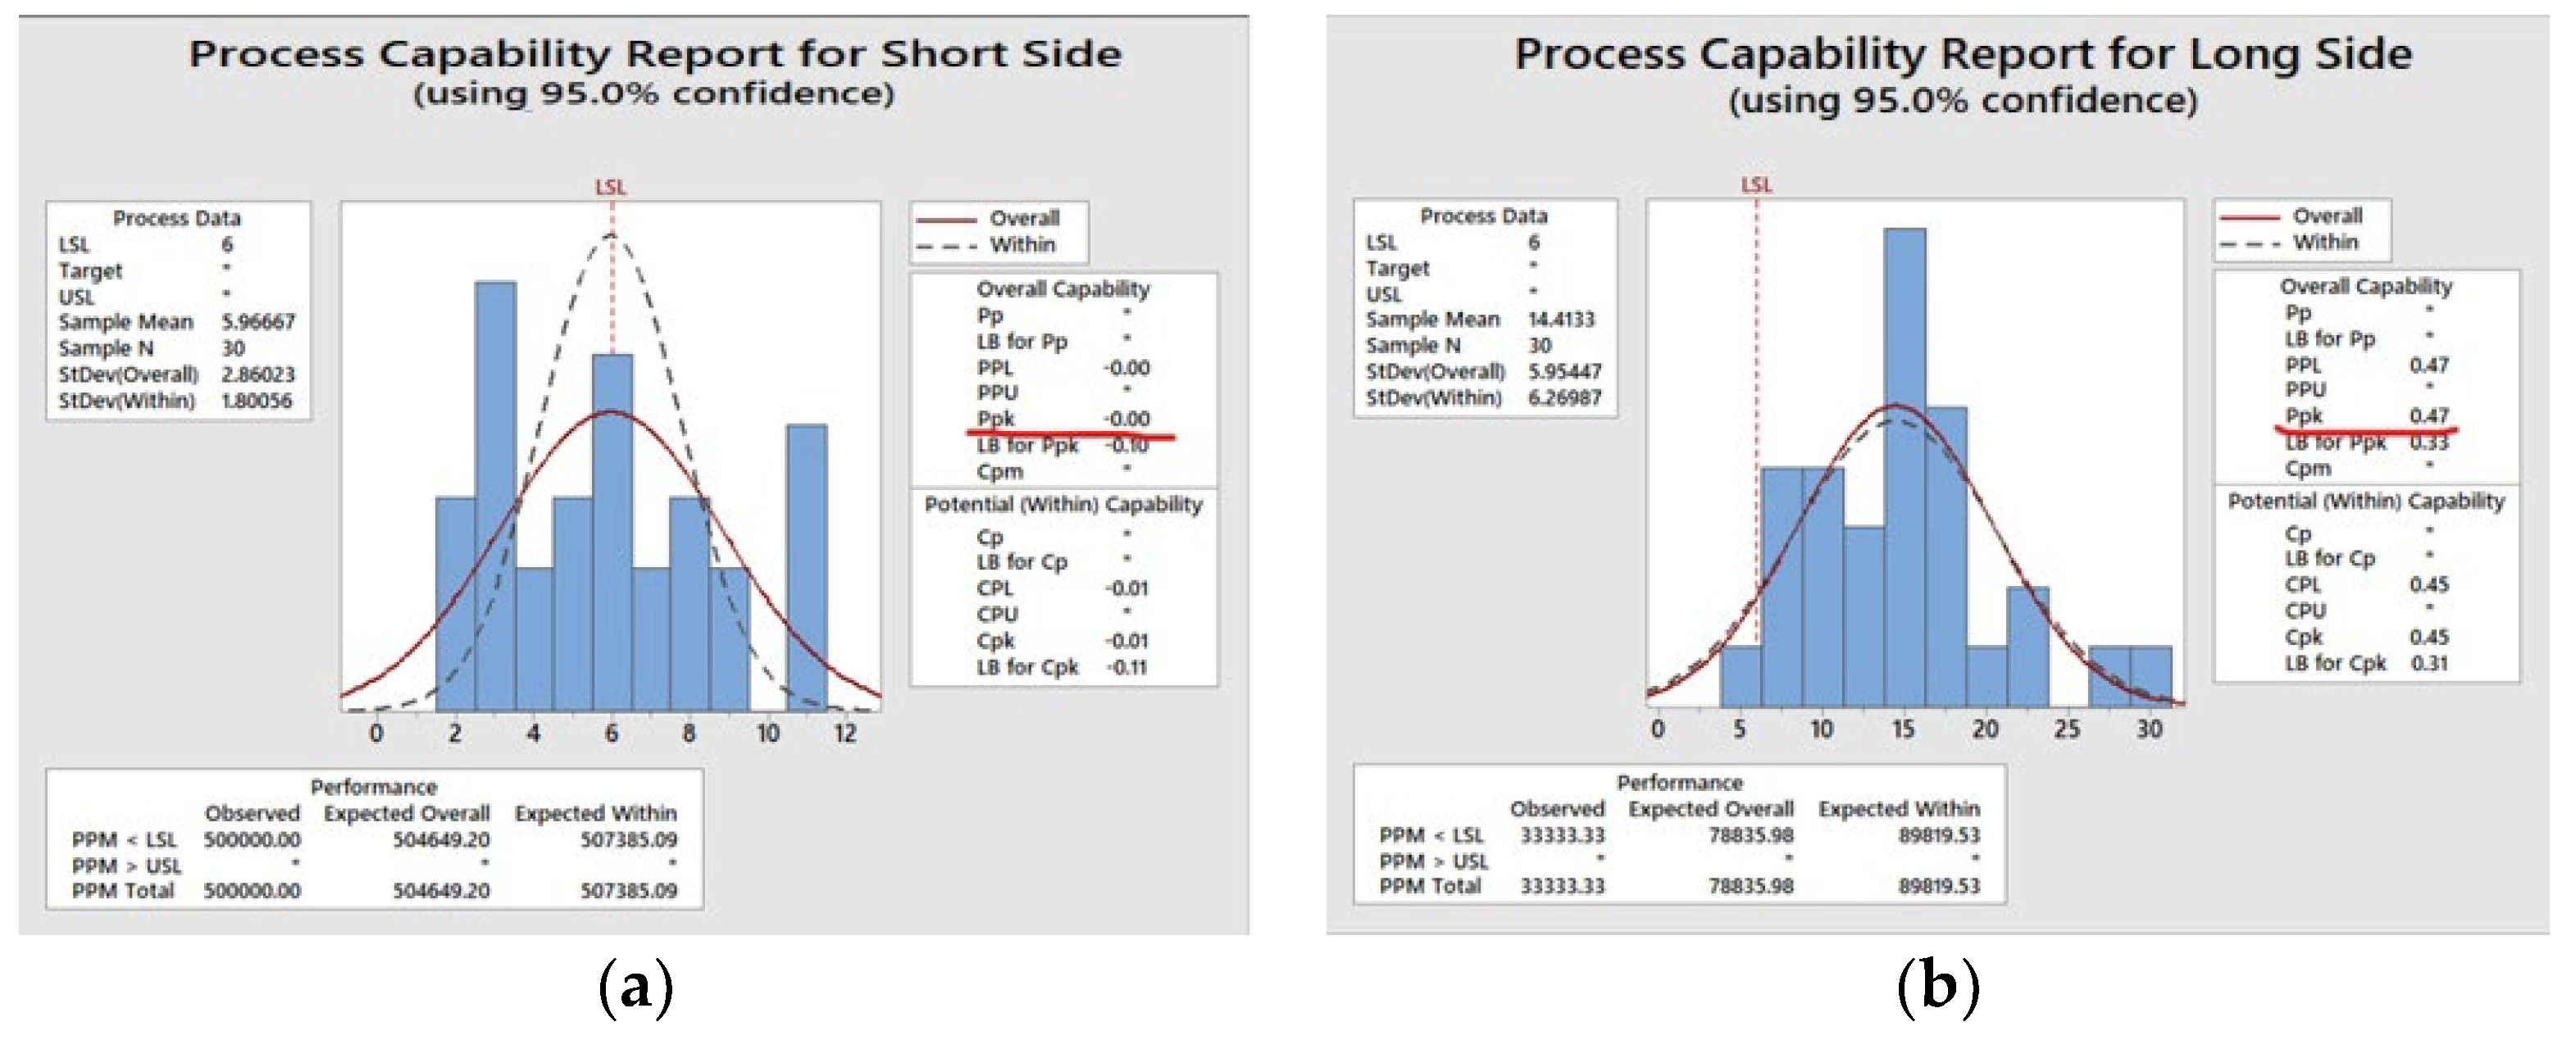
However, it is important to consider a crucial clarification: prior to these experiments, peel strength measurements (see 4.1.2.1. Epoxy Coating Peel Test) were conducted incorrectly, potentially inflated the observed capacities. Therefore, while the current data shows reduced capability compared to those earlier measurements (Figure 19 and Figure 20), it provides a more accurate picture of the process performance.
4.1.2.4. Testing Different Thickness of the Epoxy Coating to Find the Optimal Balance between Insulation and Production Efficiency
To potentially address the low detachment force observed earlier, a second test increased the epoxy coating thickness. From its original 0.250mm, the thickness was raised to a 0.350mm, while maintaining the previously tested curing voltage of 3.1 Kv. Figure 22 and Figure 23 depict the detachment force behavior for this experiment on the short and long sides of 30 test samples, measured using a pull-off test method described in 4.1.2.1.
Increasing the epoxy thickness proved promising, boosting Cpk values on both sides: the short side increased from 0 to 0.05 (see Figure 24a), and the long side from 0.47 to 0.68 (see Figure 24b). While encouraging, these values still fall short of the company’s minimum acceptable Cpk of 1.32, indicating further optimizations are needed.
4.1.2.5. Evaluate the Impact of Reverse Rolling on the Armature Shell’s Compatibility with the Epoxy Coating
Maintaining the voltage range (3.0-3.1 kV) and epoxy thickness (0.200-0.350 mm), a third experiment focused on the lamination rotation based on observed higher break force on the long side. Analysis revealed the lamination has two distinct sides: one flat and one with a raised edge (burr) where the detachment force is applied. Figure 25 shows a lamination side with a prominent burr, while Figure 26 depicts a burr-free side. These burrs caused insufficient insulation, allowing cable insertion to reach the lamination and creating an electrical path between the cable and the metal (continuity). This finding explains the hi-pot failures and highlights the need for a solution to the burr formation during lamination.
Inverting the lamination proved highly successful. In a test with 27 short-side armatures, 100% passed the detachment force test, all staying within the specified parameters (see Figure 27). This significant improvement suggests superior adhesion, potentially eliminating the hi-pot failures encountered before.
Similar to the short side, inverting the lamination yielded favorable results for the long side as well. In a test with 27 long-side armatures, 100% passed the detachment force test, all staying within the specified parameters (see Figure 28). This consistent success across both sides reinforces the potential of inverting the lamination as a solution to address the previously identified detachment force issue.
Implementing inverted lamination in armature manufacturing resulted in a marked improvement in meeting specifications, especially on the short side. As Figure 29a shows, the short side’s Cpk jumped from 0.05 to 1.06 drawing closer to the minimum target of 1.32. While the long side saw a smaller but still positive increase, both sides now exhibit significantly improved process capability. This achievement suggests that inverted lamination could be a key solution to the previously identified detachment force issue. In contrast to the short side, long side Cpk displayed negligible change (see Figure 29b).
4.1.2.6. Differential Scanning Calorimetry Test
To finalize these two PDCA cycle phases and guarantee the epoxy’s performance with the implemented modifications, a Differential Scanning Calorimetry (DSC) study investigated the behavior of epoxy powder during curing temperature changes. This study specifically focused on whether the epoxy degraded under these conditions, as this directly impacts the functionality, quality, and durability of the reinforced motor. As illustrated in Figure 30 and Figure 31, the DSC analysis compared a virgin sample to a cured sample, revealing curing percentage of 84.23%.
To ensure proper performance and adhesion, the percentage of epoxy curing needs to be precisely measured. This is calculated using the following equation:
% Curing = (1- ΔH)/ΔHo X 100
Enthalpy represents the total energy content of a system at constant pressure. In this context, ΔH₀ stands for the energy change when the uncured epoxy fully cures, while ΔH represents the energy change during partial curing. By comparing these values, this formula allows us to accurately assess how much of the curing process the epoxy has undergone. This information is crucial for ensuring the final product meets the desired quality and performance standards. To identify the optimal voltage setting for maximizing epoxy curing percentage, experiments were conducted varying the curing process voltage from 2.8 to 3.3 kV while maintaining the epoxy layer thickness at 150-200 microns (degreasing voltage remained at 2.6 kV). Analysis of both short side (Figure 32) and long side (Figure 33) data revealed that 2.9 kV achieved the highest curing percentage on both sides. This could largely explain the poor breaking force results obtained when increasing the voltage in the curing process discussed in 4.1.2.3.
4.1.3. Phase 4. Act.
This phase solidified and enhanced the previously implemented changes, ensuring the process’s long-term efficiency. These adjustments, emphasizing their impact on meeting specifications, were presented to management. While no modifications were made to the physical equipment or tooling (machinery or tooling remained unchanged), the alterations solely involved adjustments to operating parameters and a new instruction for the turning process in lamination. To ensure the sustainability of these achieved gains, they were documented in the control plan and the organization’s PFMEA. The voltage increase tested in section 4.1.2.3 was not implemented due to the findings of the differential scanning calorimetry (DSC) study.
5. Results
Graph in Figure 34 presents the behavior of the scrap indicator two months after implementing the improvements. The organization aimed for a 0.7% scrap target, which was significantly exceeded. This achievement can be attributed to the improved ability to meet the detachment force specification for the epoxy coating, reducing hi-pot test failures in motors. Specifically, the short side no longer generated around 500,000 pieces outside the specification, a significant factor in exceeding the scrap target.
Beyond process improvements, these changes delivered significant economic benefits. Considering the combined savings in metallic pieces, wire, and epoxy powder, the total annual cost reduction is approximately $135,000 dollars.
5. Discussion and Conclusions
This case study effectively demonstrates the PDCA methodology effectiveness in reducing scrap within the electric motor manufacturing process. Implementing the PDCA cycle significantly enhanced the production process, achieving the scrap reduction goal of 0.7% and exceeding it. This success stemmed from identifying and analyzing the root causes of the hi-pot problem, which were traced back to two main areas: contact with the laminate during the epoxy coating application and sharp edges in the lamination process itself.
Beyond scrap reduction, the study highlights the importance of continuous process improvement and utilizing tools like 5W+2H and 3-legged 5 Why analysis to pinpoint and address defect root causes. Implementing these tools facilitated a targeted and effective approach to problem-solving, ultimately leading to reduced scrap.
Similar tools have been employed by other researchers tackling non-conformity reduction in automotive parts. For instance, Czerwińska et al. [30] successfully combined the 5W+2H method and Ishikawa diagram to identify non-compliance causes in automotive piston casting and finishing. In their study, Realyvásquez-Vargas et al. [31] employed Pareto charts and flowcharts to achieve remarkable defect reductions of 65%, 79%, and 77% across three product models.
Furthermore, focusing specifically on the PDCA cycle’s role in organizational improvements, existing literature offers various practical examples. Silva et al. [32] propose a practical PDCA-based application to reduce the Can Loss Index in a beverage company. Garza-Reyes et al. [33] present an approach based on Deming’s PDCA cycle to systematically implement and conduct environmental VSM (Value Stream Mapping) studies.
Based on the results obtained in this case study, it is recommended to continue seeking improvements related to increasing the capability to meet the detachment force of the epoxy coating specification. Although the goal set in this research was achieved with some margin, it is still necessary to aim for the desirable value of 1.32 for the Ppk in this quality characteristic, as established by the company. A factorial experimental design is recommended for future research, considering different levels of the factors considered in this investigation. This approach will allow for a more comprehensive analysis of the effects of the factors and their interactions on the response variable.
Author Contributions
Conceptualization, J.-D.-J. U.-G.; investigation, M.-A. R.-S.; writing—original draft preparation, O.C.-D.; formal analysis, J.-L.C-E.; writing—review and editing, H.-A.D.-M.; supervision and funding acquisition, J.-M.C.-P.; visualization, O.-A.G.-B.; Methodology, V.-A.M.-R. All authors have read and agreed to the published version of the manuscript.
Funding
This research received no external funding.
Acknowledgments
The authors want to acknowledge to the Tecnológico Nacional de Mexico/Instituto Tecnológico Superior de Fresnillo for allowing us to use their facilities and resources to develop this paper. Also, the authors want to thank the National Council of Science and technology (CONACYT) for their support to continuing performing research.
Conflicts of Interest
Authors declare no conflict of interest.
References
- Abdulla, S. China’s Robotics Patent Landscape. Center for Security and Emerging Technology 2021, 1–30. [Google Scholar]
- Hassan, S.; Gul, D.; Jameel, D.; Akhtar, D.; Naveed, A. Impact of Service Quality on Customer’s Satisfaction in the Airline Industry (A case study of PIA, Oman Airline and Air-Arabia. Elementary Education Online 2021, 20, 7417–7426. [Google Scholar] [CrossRef]
- Palange, A.; Dhatrak, P. Lean manufacturing a vital tool to enhance productivity in manufacturing. Materials Today: Proceedings 2021, 46, 729–736. [Google Scholar] [CrossRef]
- Nallusamy, S. Execution of lean and industrial techniques for productivity enhancement in a manufacturing industry. Materials Today: Proceedings. 2021, 37, 568-575. [CrossRef]
- Arunagiri, P.; Suresh, P.; Jayakumar, V. Assessment of hypothetical correlation between the various critical factors for lean systems in automobile industries. Materials Today: Proceedings, 2020, 33, 35-38. [CrossRef]
- International Labour Organization [ILO]. The future of work in the automotive industry: The need to invest in people’s capabilities and decent and sustainable work. 2020. Available online: http://www.jstor.org/stable/26296382 (accessed on 3 February 2024).
- Jahromi, A. Review of Field Acceptance Hipot & PD Testing of Medium Voltage Underground Cables. IEEE Electrical Insulation Conference (EIC) 2017, 241–244. [Google Scholar] [CrossRef]
- Saiful, M. F. C.; Tjahjono, N.; Fatma, Ch. Peningkatan Grade Kain Sarung dengan Mengurangi Cacat Menggunakan Metode Kaizen dan Siklus PDCA pada PT. X. WIDYA TEKNIKA 2018, 26, 222–231. [Google Scholar] [CrossRef]
- Kurniawan, H. S. E.; Merjani, A. Peningkatan Kualitas Produksi Untuk Mengurangi Unit Cacat Insufficient Epoxy Dengan Metode Pdca Di Area Die Attach (studi kasus di pt. unisem). PROFISIENSI. 2017, 5, 44-50. [CrossRef]
- Nabiilah, A.; Hamedon, Z.; Faiz, M. Improving quality of light commercial vehicle using PDCA approach. Journal of advanced manufacturing technology 2017, 12, 525–534. [Google Scholar]
- Sztorc, M.; Savenkovs, K. The Use of Lean Management Instruments to Shape Business Models of Service Companies. Management and Production Engineering Review 2020, 11, 128–140. [Google Scholar] [CrossRef]
- Rosa, C.; Silva, F.; Pinto-Ferreira, L. Improving the quality and productivity of steel wire-rope assembly lines for the automotive industry. Procedia Manufacturing 2017, 11, 1035–1042. [Google Scholar] [CrossRef]
- Amaral, V.; Ferreira, A.; Ramos, B. Internal Logistics Process Improvement using PDCA: A Case Study in the Automotive Sector. Business Systems Research 2022, 13, 100–115. [Google Scholar] [CrossRef]
- Silva, A.; Madeiros, C.; Kennedy-Vieira, R. Cleaner Production and PDCA cycle: Practical application for reducing the Cans Loss Index in a beverage company. Journal of Cleaner Production 2017, 150, 324–338. [Google Scholar] [CrossRef]
- Singh-Sidhu, B.; Kumar, V.; Bajaj, A. The “5S” Strategy by Using PDCA Cycle for Continuous Improvement of the Manufacturing Processes in Agriculture Industry. International Journal of Research in Industrial Engineering 2013, 2, 10–23. [Google Scholar]
- Tahiduzzaman, M.; Rahman, M.; Kumar-Dey, S.; Kumar_Kapuria, T. Minimization of Sewing Defects of an Apparel Industry in Bangladesh with 5S & PDCA. American Journal of Industrial Engineering 2018, 5, 17–24. [Google Scholar] [CrossRef]
- Garza-Reyes, J.; Torres, J.; Govindan, K.; Cherrafi, A.; Ramanathan, U. A PDCA-based approach to Environmental Value Stream Mapping (E-VSM). Journal of Cleaner Production 2018, 180, 335–348. [Google Scholar] [CrossRef]
- Goyal, A.; Agrawal, R.; Kumar-Chokhani, R.; Saha, C. Waste reduction through Kaizen approach: A case study of a company in India. Waste Management & Research. 2018, 37, 102-107. [CrossRef]
- Kigha, B.; Butu, H.; Owolabi, A.; Wook, J.; Suh, D.; Huh, J. Integrating multi-criteria analysis with PDCA cycle for sustainable energy planning in Africa: Application to hybrid mini-grid system in Cameroon. Sustainable Energy Technologies and Assessments 2020, 37, 1–12. [Google Scholar] [CrossRef]
- Jagusiak-Kocik, M. PDCA cycle as a part of continuous improvement in the production company - a case study. Production engineering archives 2017, 14, 19–22. [Google Scholar] [CrossRef]
- Kumaar-Kathirvel, A.; Paddock-Moore, C.; Chakravorty, S. Plan-Do-Check-Act (PDCA) Based Approach to Business Process Mapping. In Proceedings of the International Conference on Industrial Engineering and Operations Management, Bangalore, India, 16–18 August 2021. [Google Scholar]
- De Lima, J.; Correa, P.; Drumond, R.; Carvalho, A.; Goncalves, R. Ferramentas da qualidade nas indústrias de papel e celulosa da Bahia. Sodebras 2015, 10, 49–54. [Google Scholar]
- Sokovic, M.; Pavletic, D.; Kern-Pipan, K. Quality Improvement Methodologies –PDCA Cycle, RADAR Matrix, DMAIC and DFSS. Journal of achievements in materials and manufacturing engineering 2010, 43, 476–483. [Google Scholar]
- Sunadi, S.; Hardi-Purba, H.; Hasibuan, S. Implementation of Statistical Process Control through PDCA Cycle to Improve Potential Capability Index of Drop Impact Resistance: A Case Study at Aluminum Beverage and Beer Cans Manufacturing Industry in Indonesia. QUALITY INNOVATION PROSPERITY 2020, 24, 104–127. [Google Scholar] [CrossRef]
- Zhong, X.; Wu, X.; Xie, X.; Zhou, Q.; Xu, R.; Wang, J.; He, L.; He, Y.; Qiu, X. A descriptive study on clinical department managers’ cognition of the Plan-Do-Check-Act cycle and factors influencing their cognition. BMC Medical Education 2023, 23, 1–8. [Google Scholar] [CrossRef]
- ISO 9001:2015; Quality Management Systems – Requirements. International Organization for Standardization: Geneva, Switzerland, 2015.
- Chiarini, A.; Cherrafi, A. Integrating ISO 9001 and Industry 4.0. An implementation guideline and PDCA model for manufacturing sector. Total Quality Management & Business Excellence. 2023, 34, 1629-1654. [CrossRef]
- Habibie, M.; Kresiani, R. Implementation of PDCA Cycle in Calibration and Testing Laboratory Based on ISO/IEC 17025:2017. IOP Conf. Series: Materials Science and Engineering. 2019, 598, 1-7. [CrossRef]
- Hernández, C.; Da-Silva, F. Application of Statistical Process Control (SPC) in its Quality control. Tecnología Química. 2016, 36, 104-116.
- Czerwińska, K.; Dwornicka, R.; Pacana, A. Improving Quality Control of Siluminial Castings Used in the Automotive Industry. Proceedings 29th International Conference on Metallurgy and Materials 2020, 1382–1387. [Google Scholar] [CrossRef]
- Realyvásquez-Vargas, A.; Arredondo-Soto, K.; Carrillo-Gutiérrez, T.; Ravelo, G.; Applying the Plan-Do-Check-Act (PDCA) Cycle to Reduce the Defects in the Manufacturing Industry. A Case Study. Applied Sciences 2018, 8, 1–17. [Google Scholar] [CrossRef]
- Silva, A.; Medeiros, C.; Vieira, R. Cleaner Production and PDCA cycle: Practical application for reducing the Cans Loss Index in a beverage company. Journal of Cleaner Production 2017, 150, 324–338. [Google Scholar] [CrossRef]
- Garza-Reyes, J.; Torres, J.; Govindan, K.; Cherrafi, A.; Ramanthan, U. A PDCA-based approach to Environmental Value Stream Mapping (E-VSM). Journal of Cleaner Production 2018, 180, 335–348. [Google Scholar] [CrossRef]
Figure 1.
Lamination sub-process.
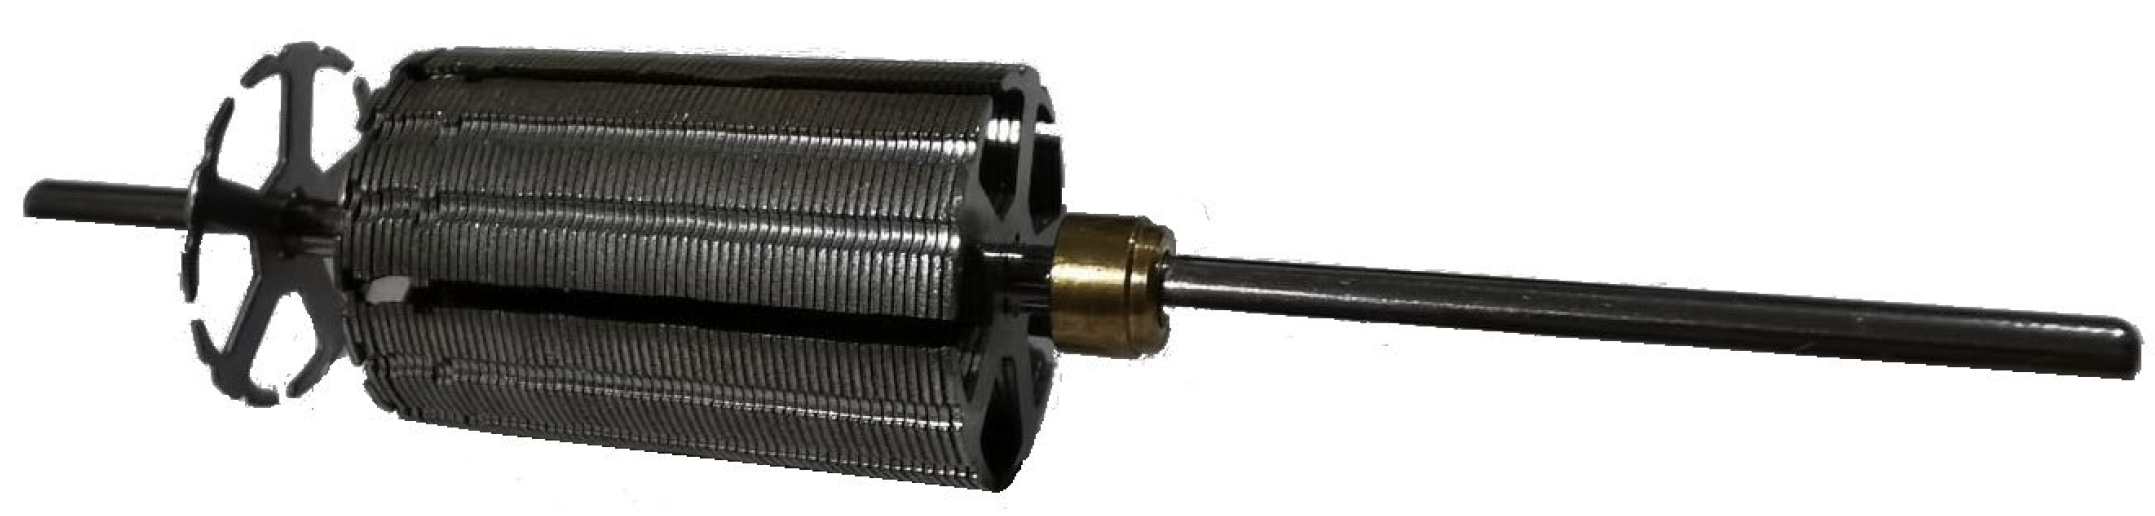
Figure 2.
Epoxy coating addition sub-process.
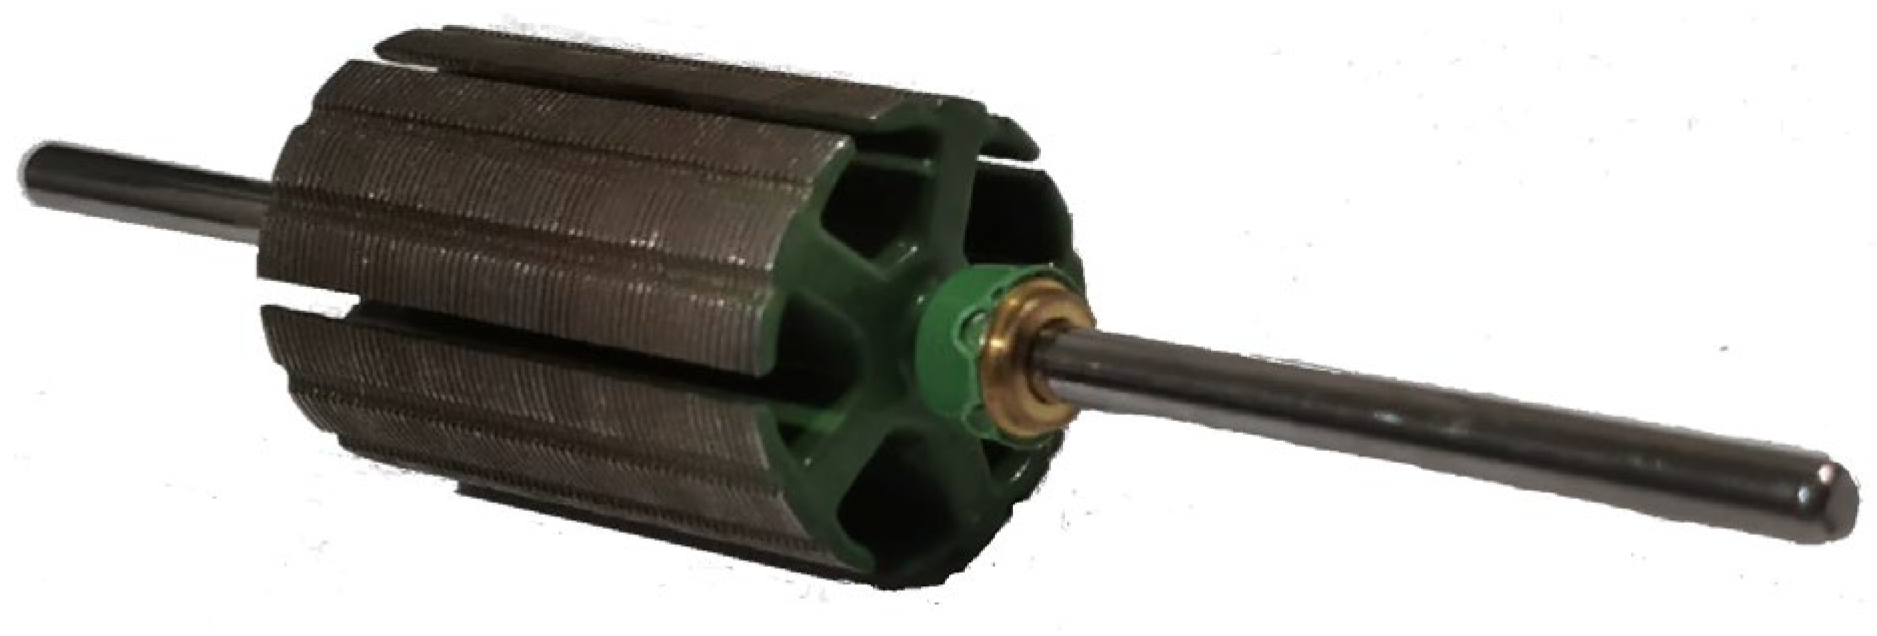
Figure 3.
Winding of magnetic wire sub-process.
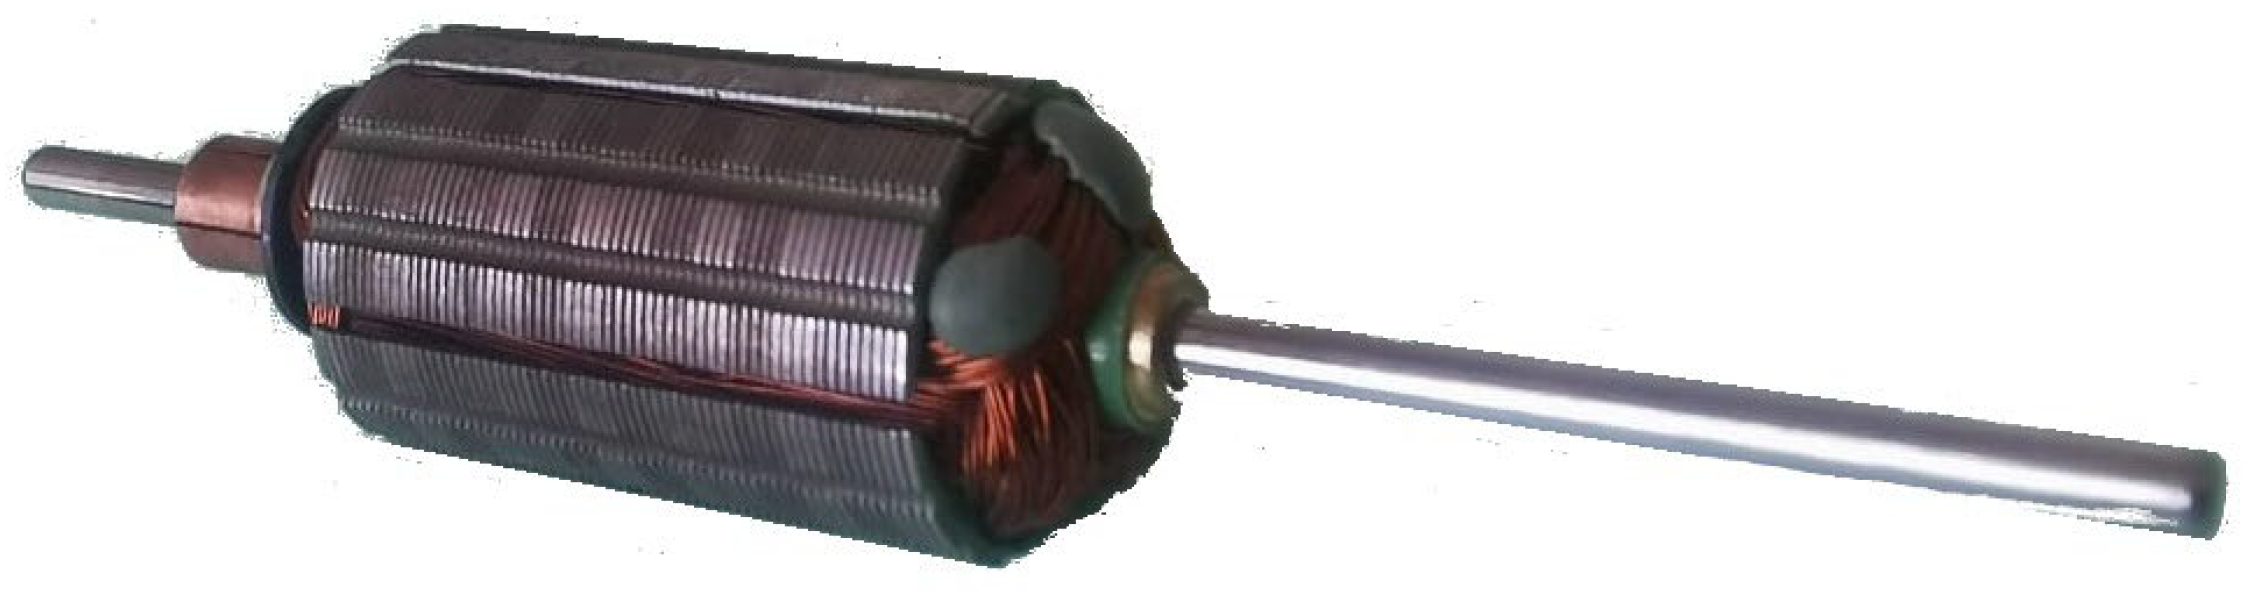
Figure 4.
Scrap per month, January-August 2022.
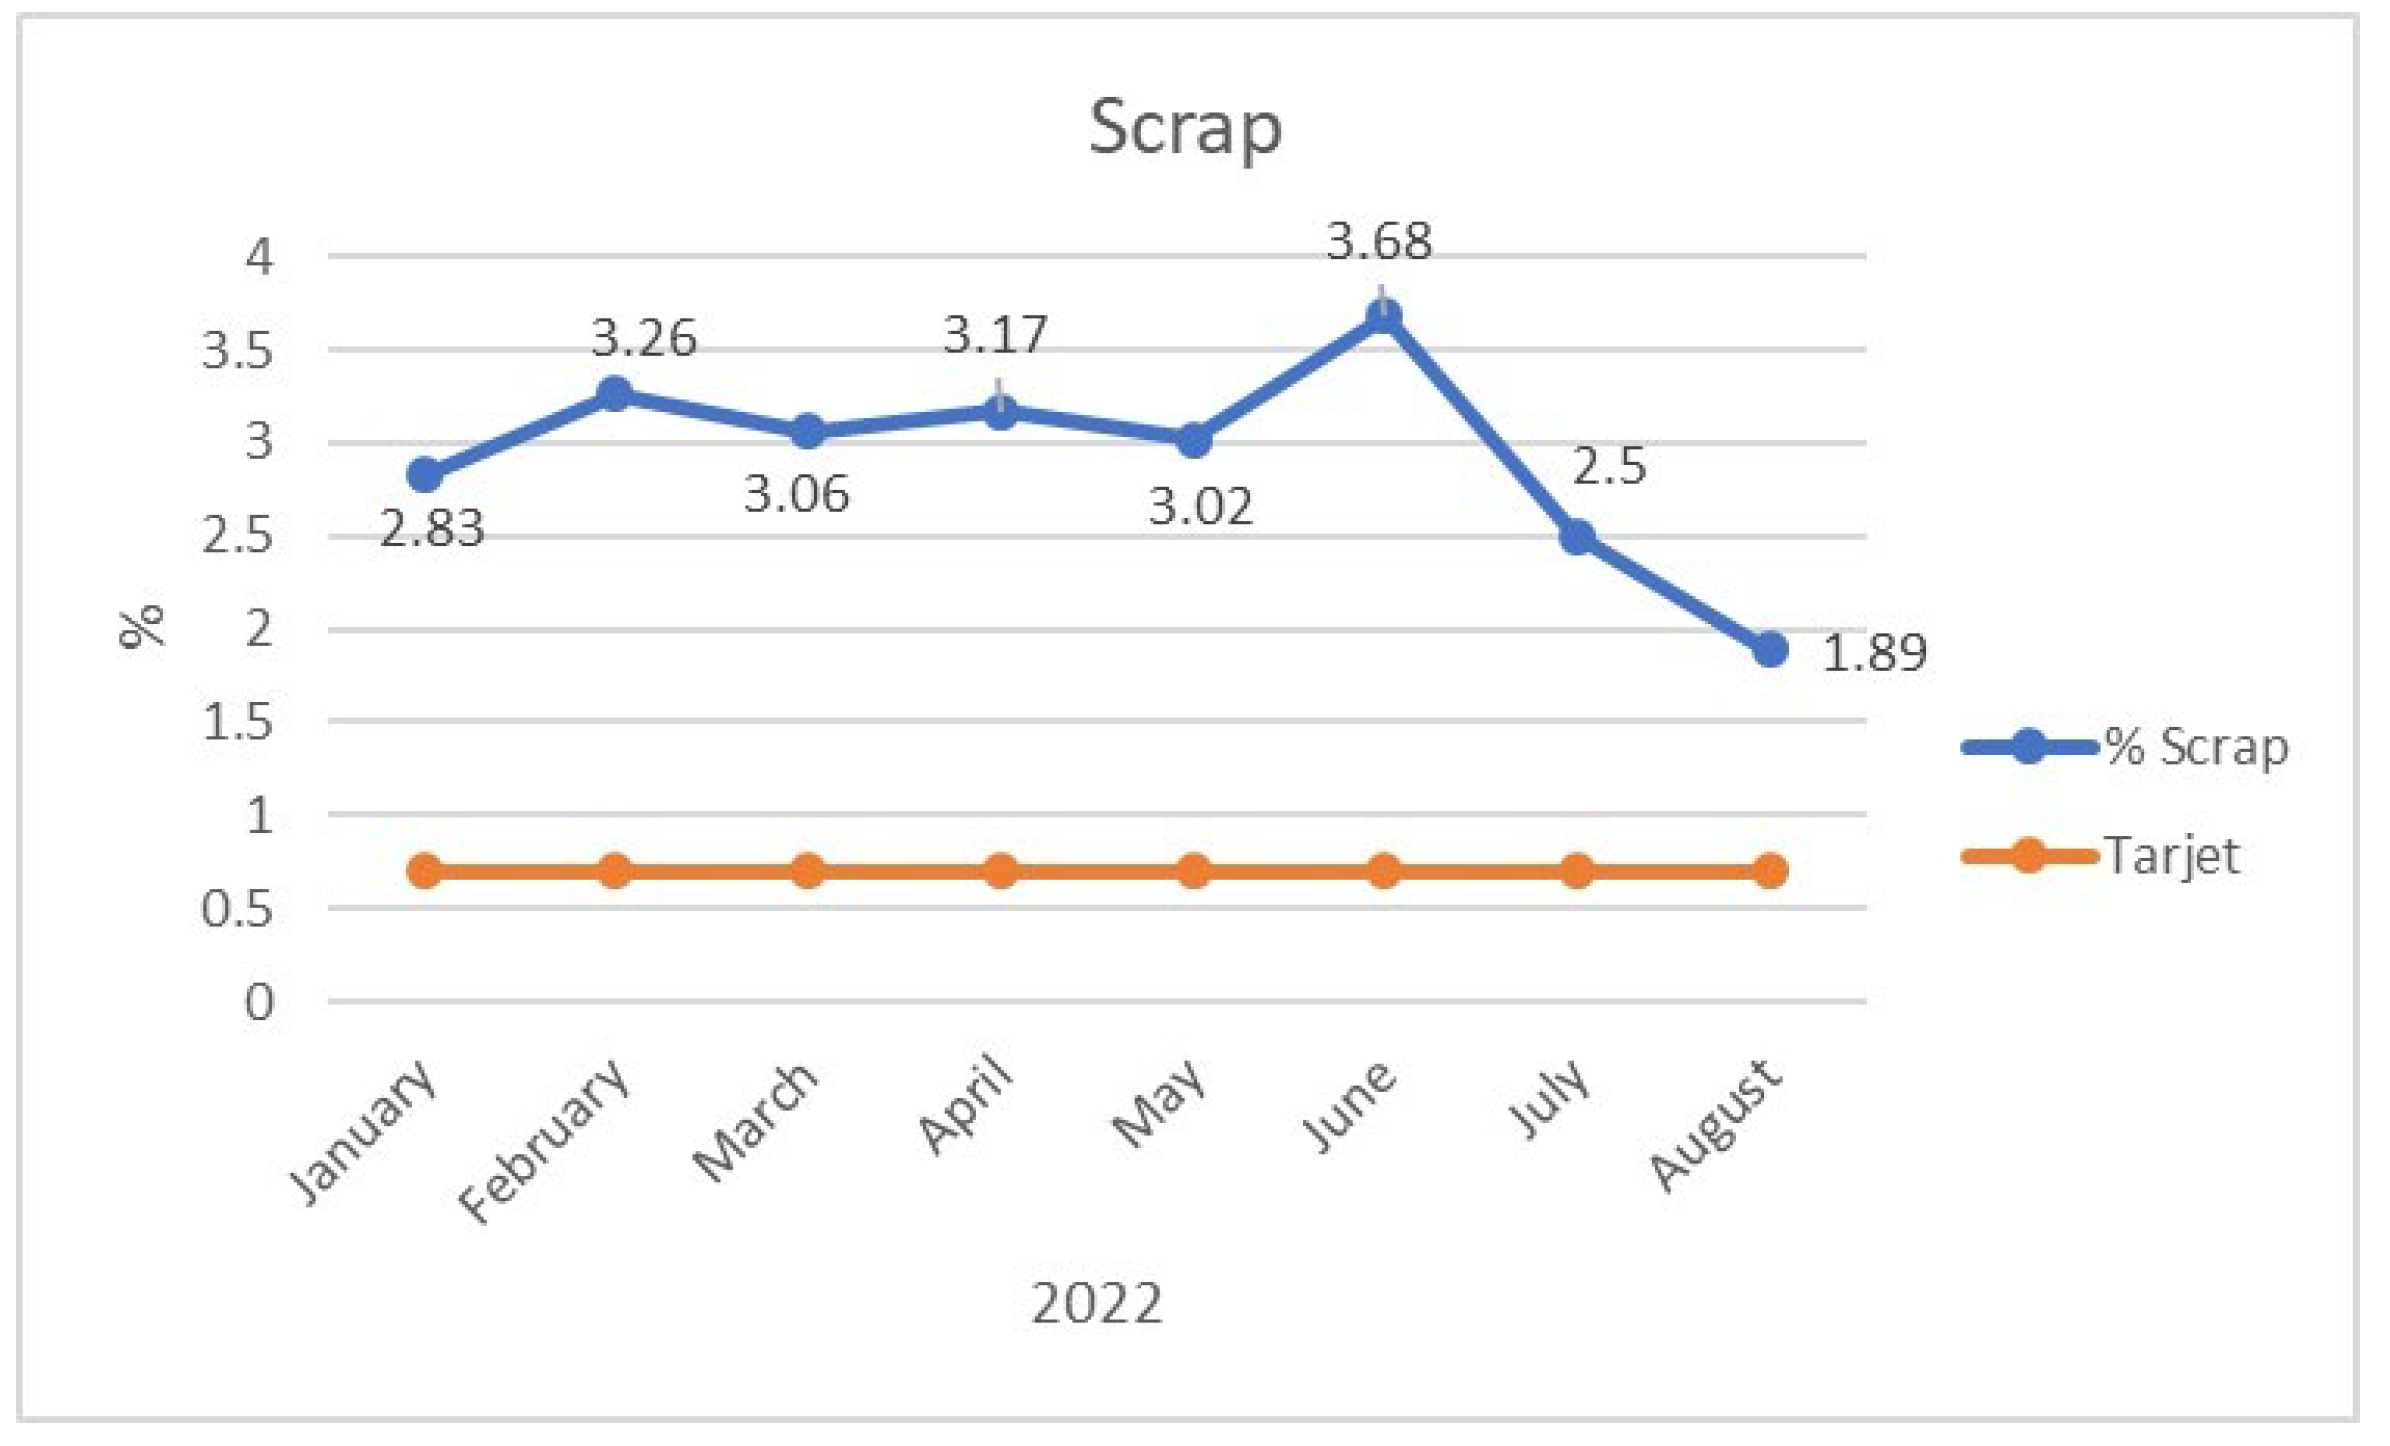
Figure 5.
Representation of ISO 9001:2015 structure in the PDCA cycle [26].
Figure 5.
Representation of ISO 9001:2015 structure in the PDCA cycle [26].
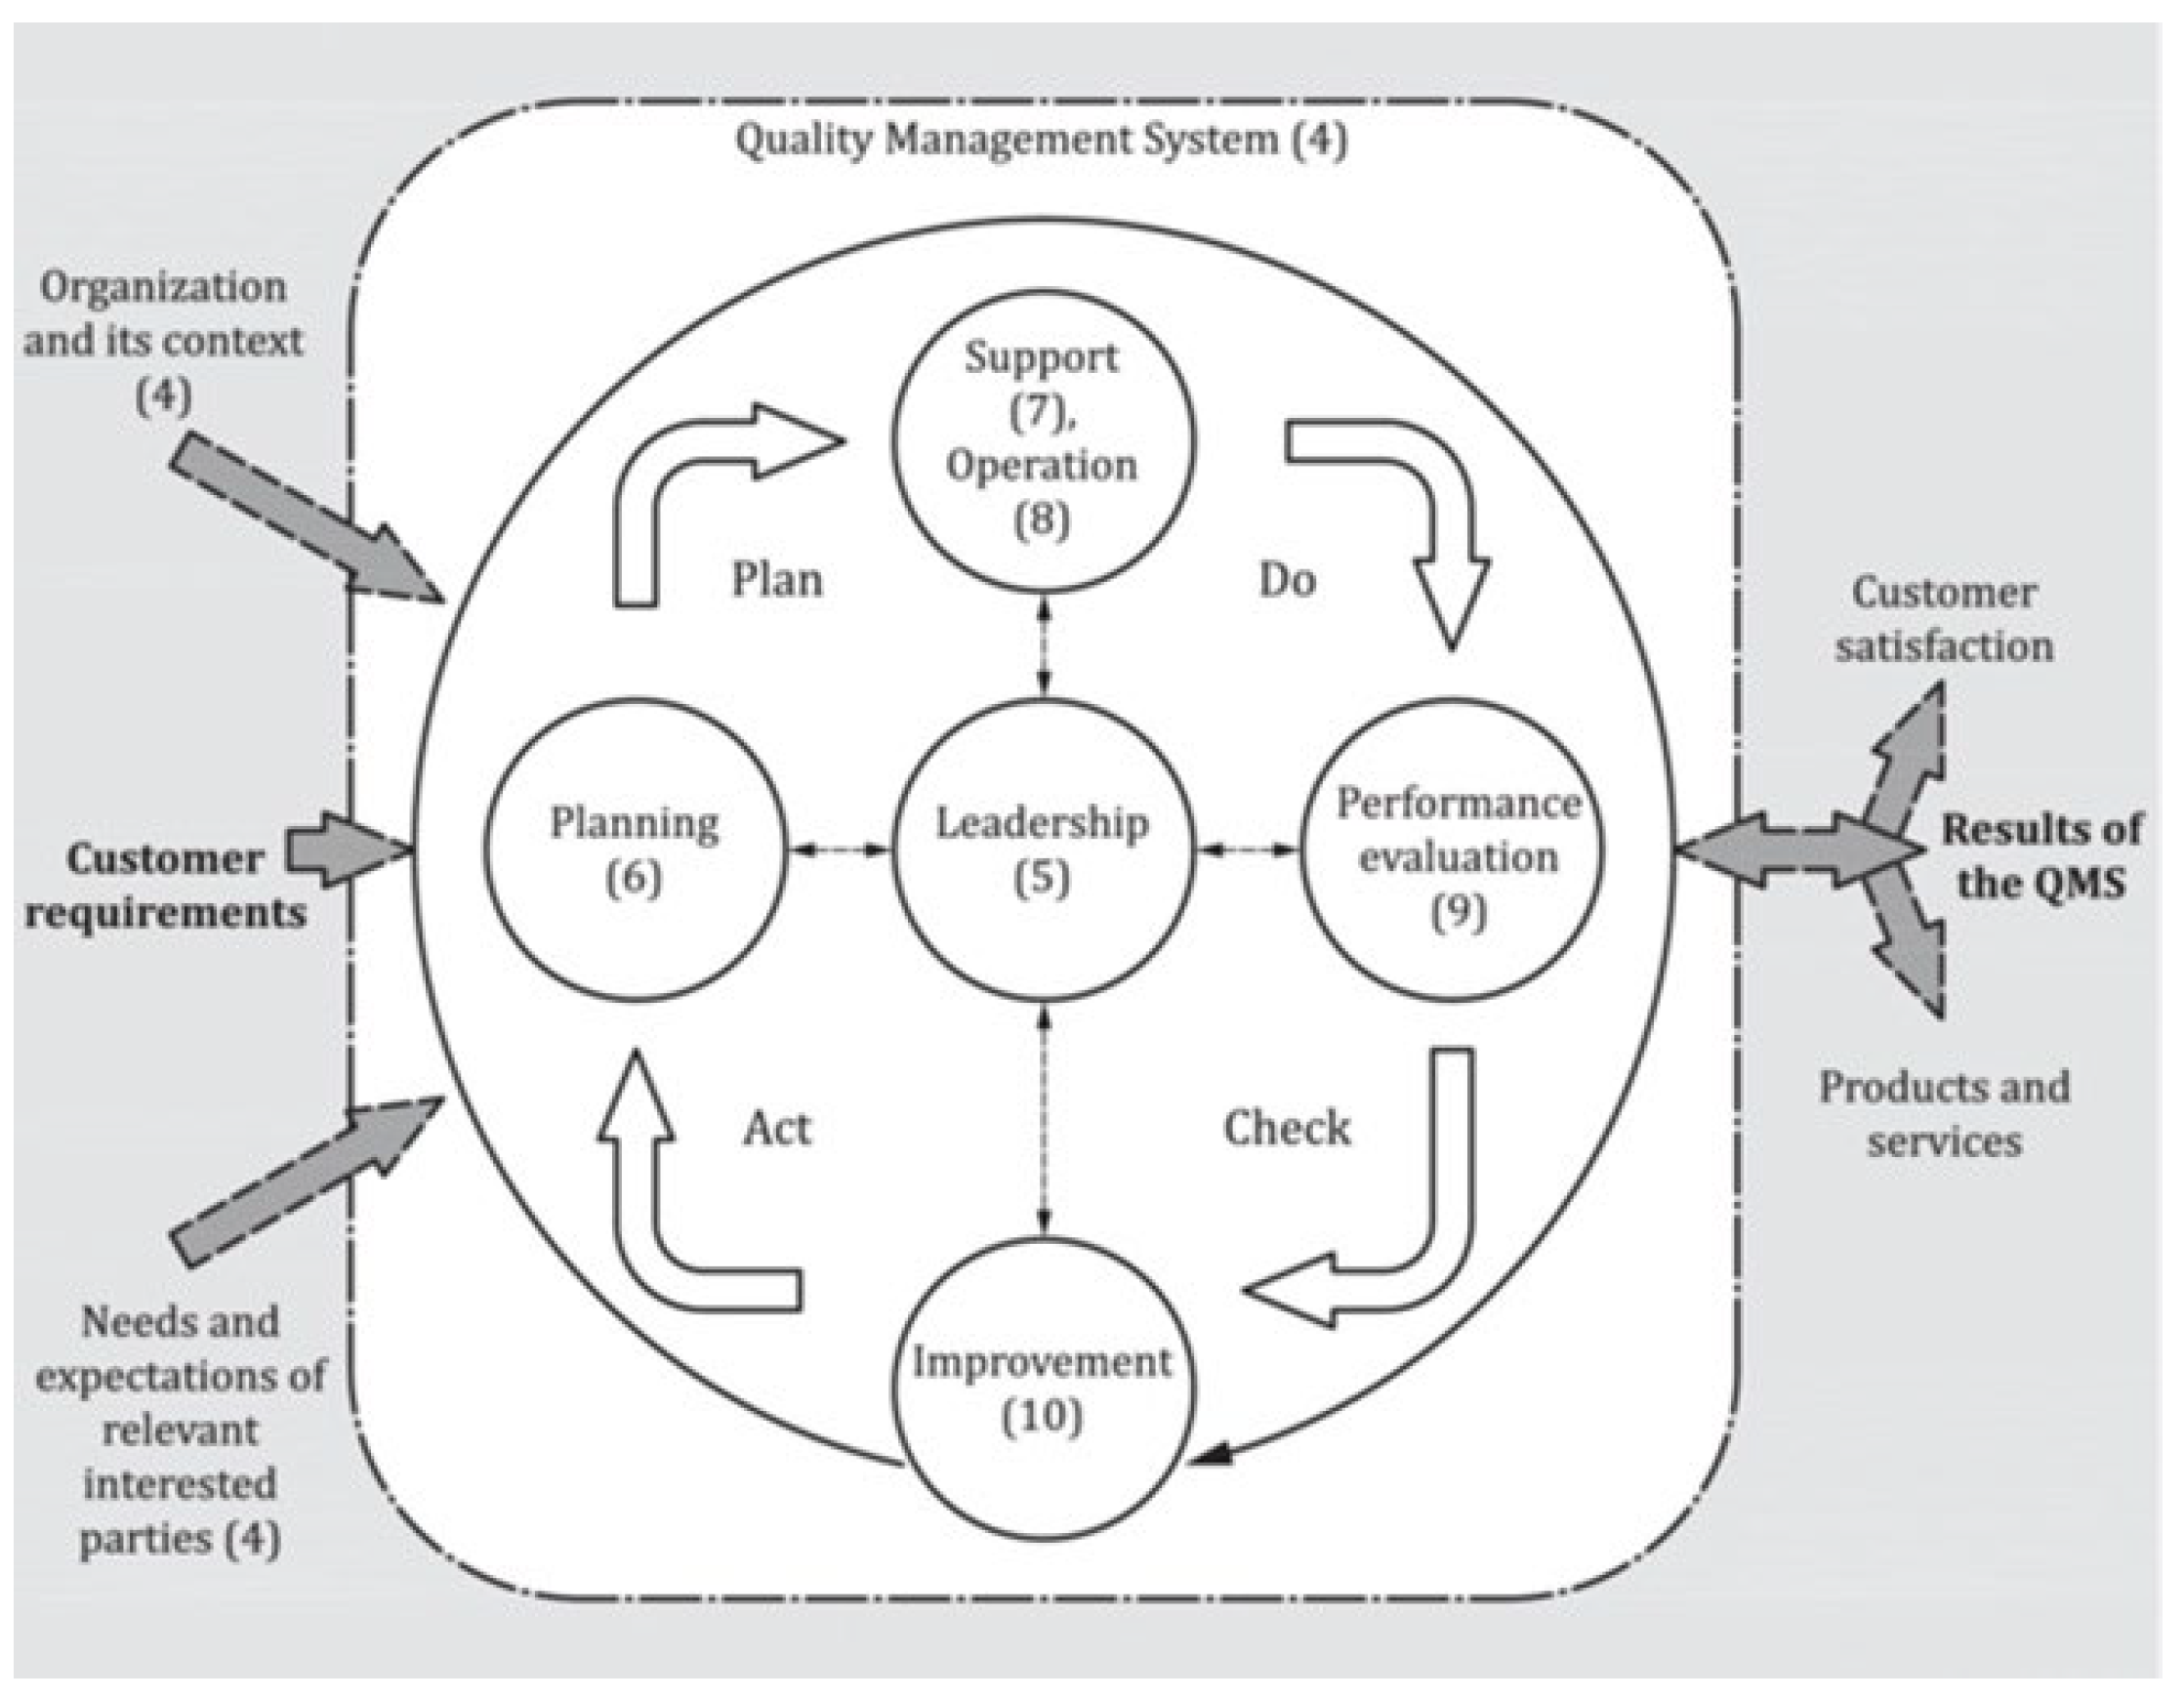
Figure 6.
PDCA modeling based on ISO/IEC 17025:2017 standard [28].
Figure 6.
PDCA modeling based on ISO/IEC 17025:2017 standard [28].
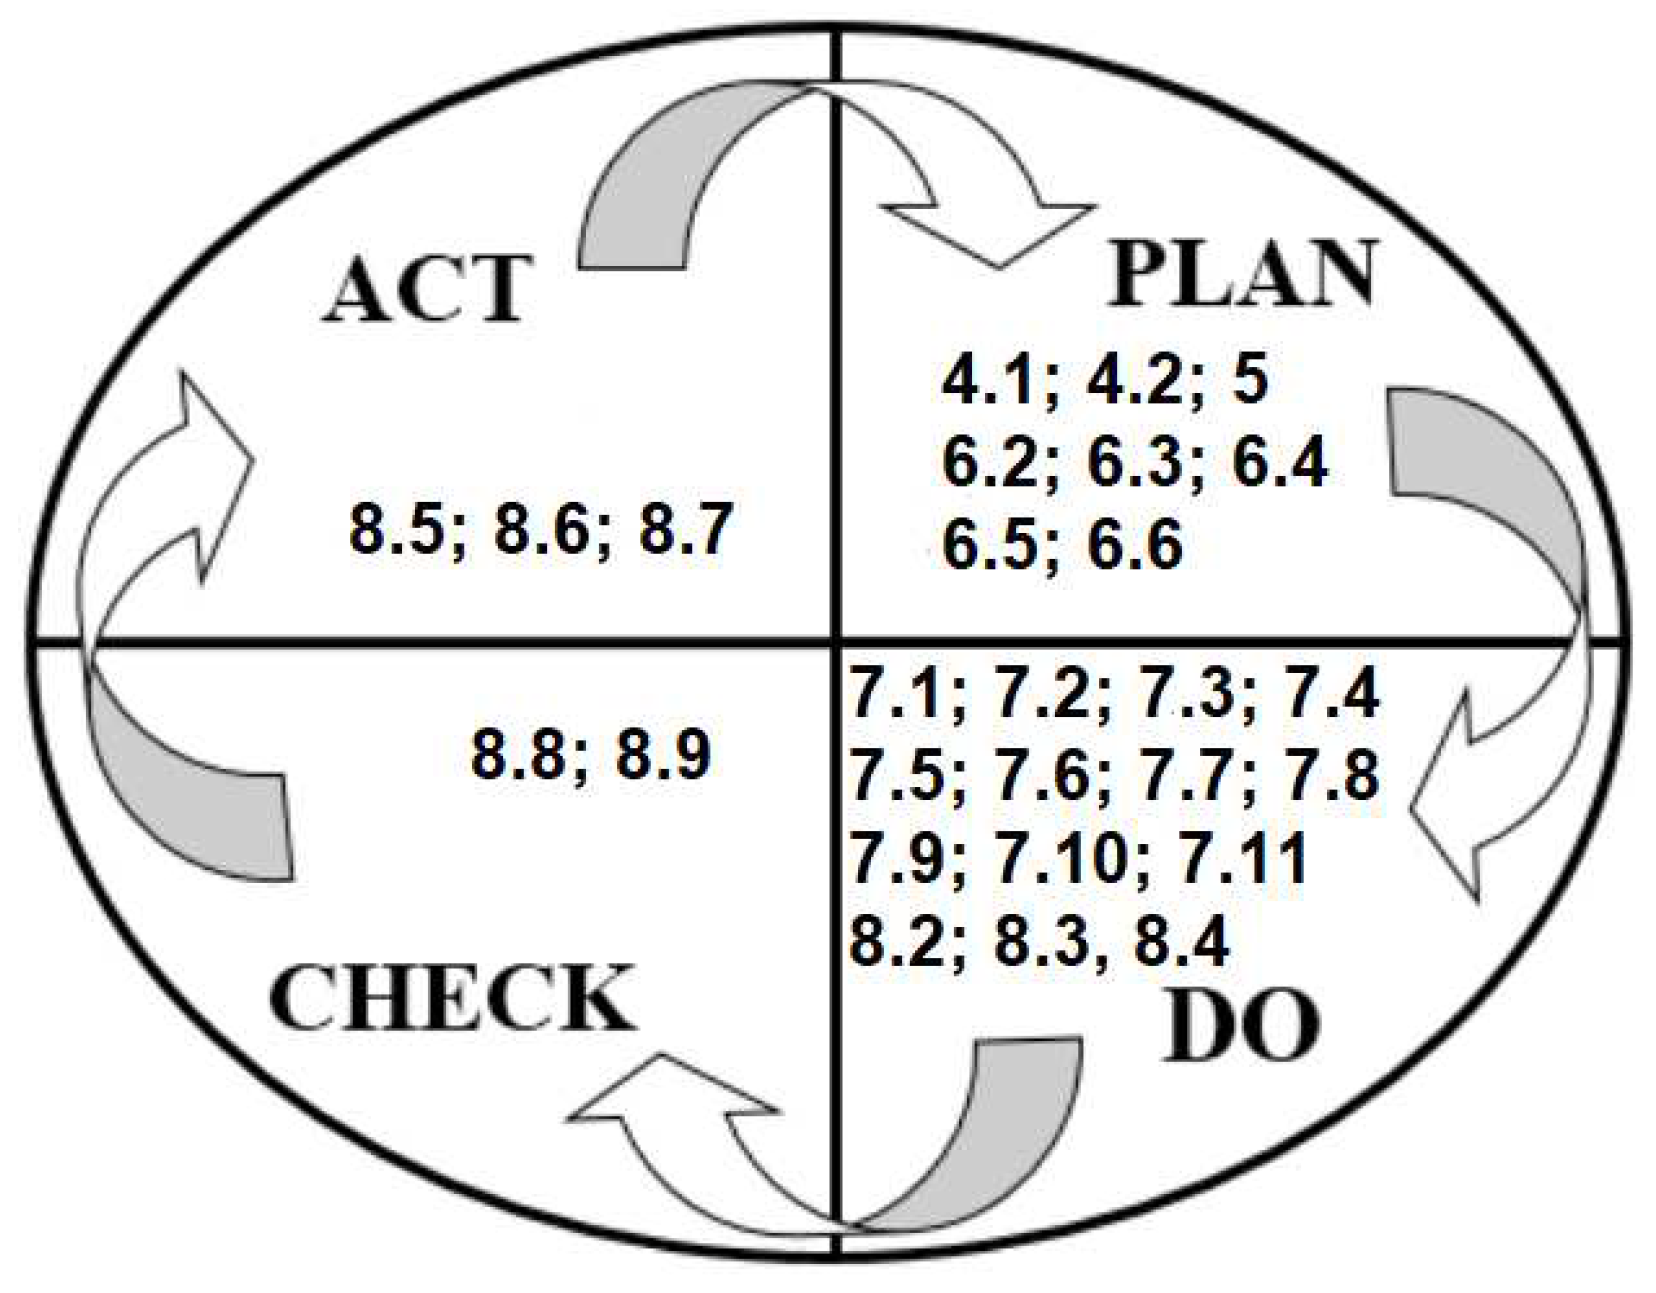
Figure 7.
Research method.
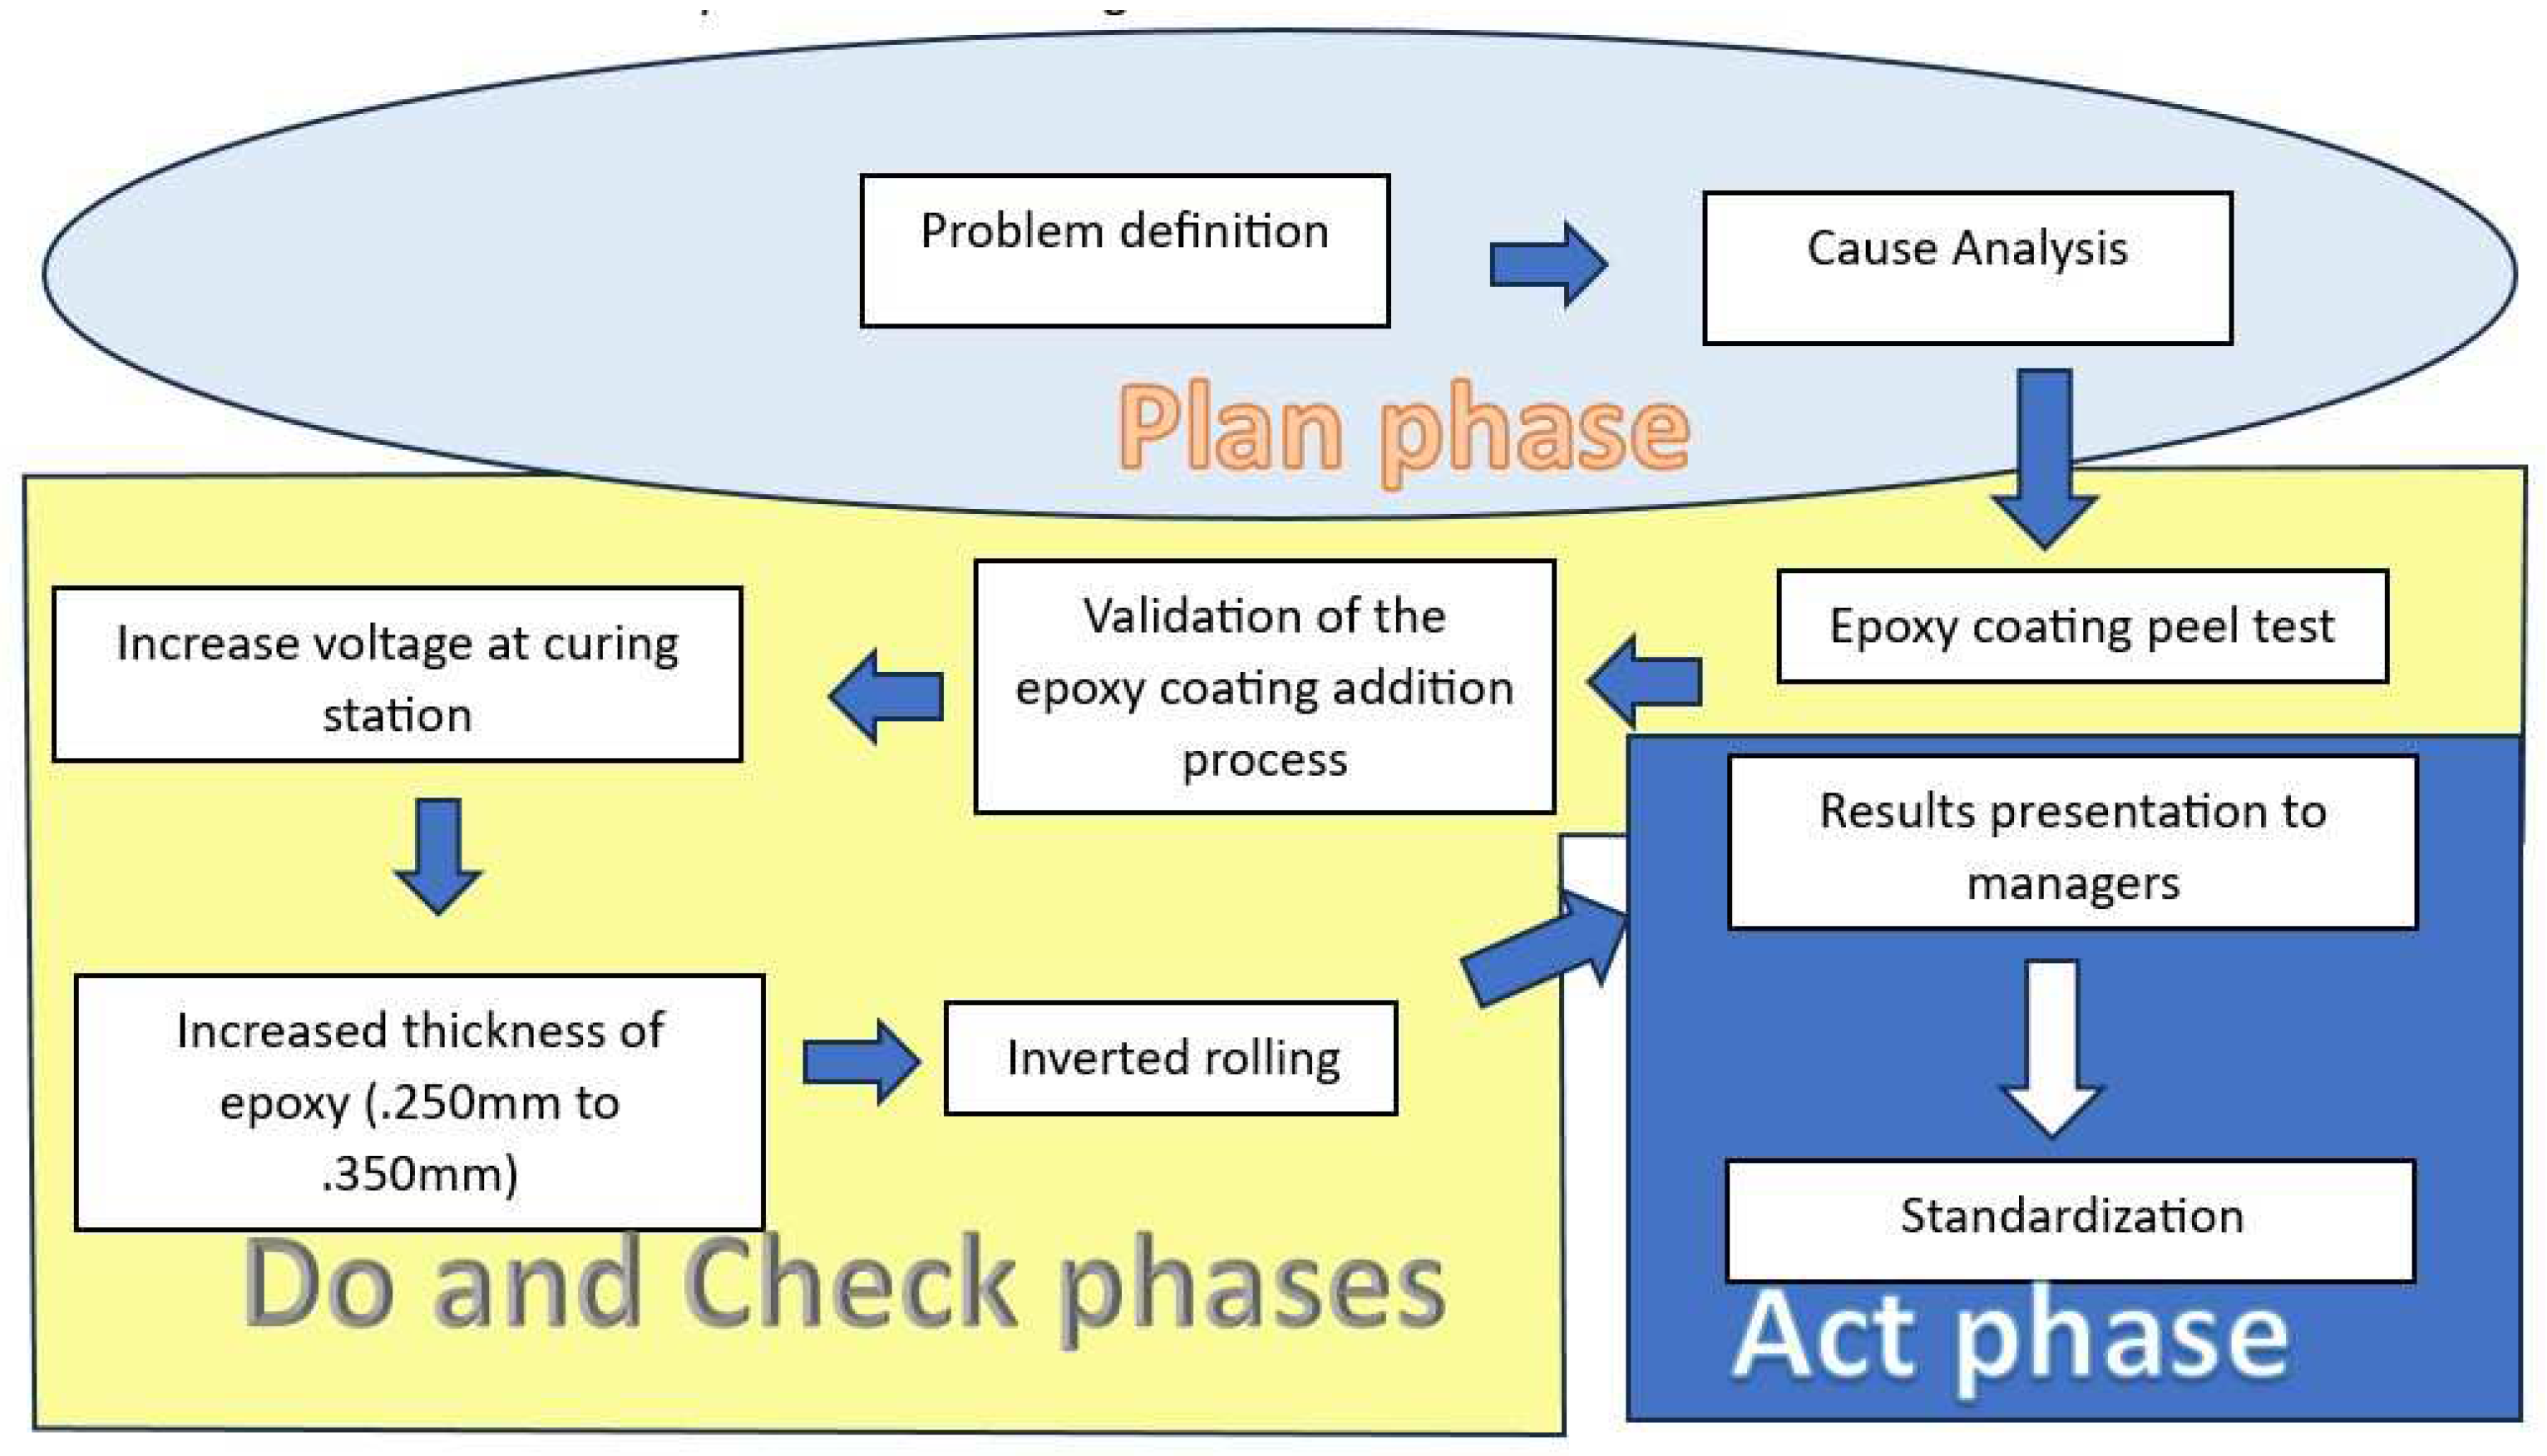
Figure 8.
Example of (a) defective and (b) non-defective part.
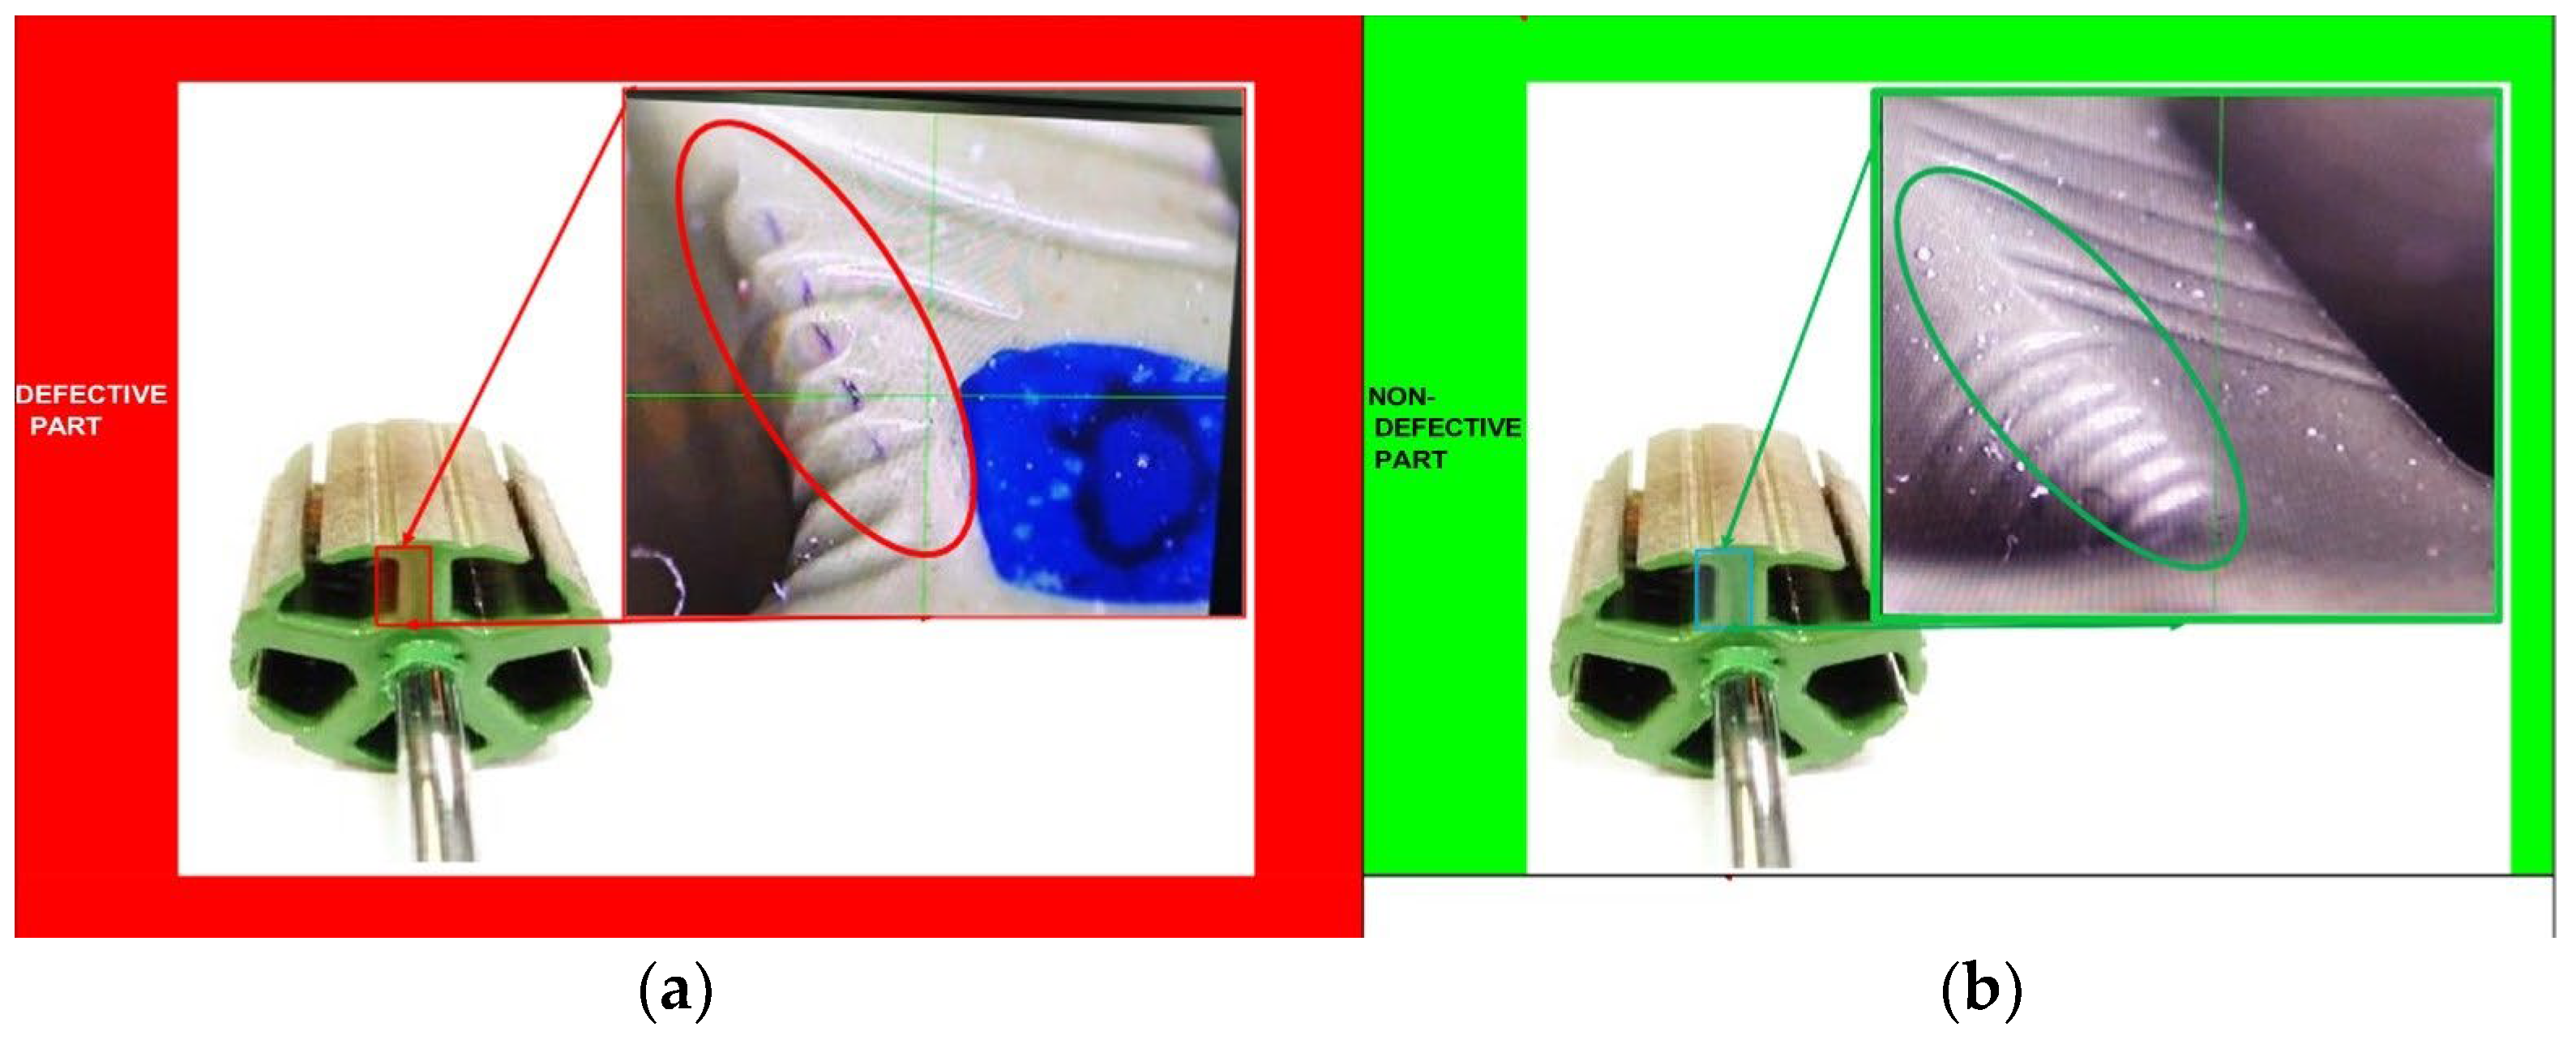
Figure 9.
Testing Machine for Peel Off Epoxy Coating.
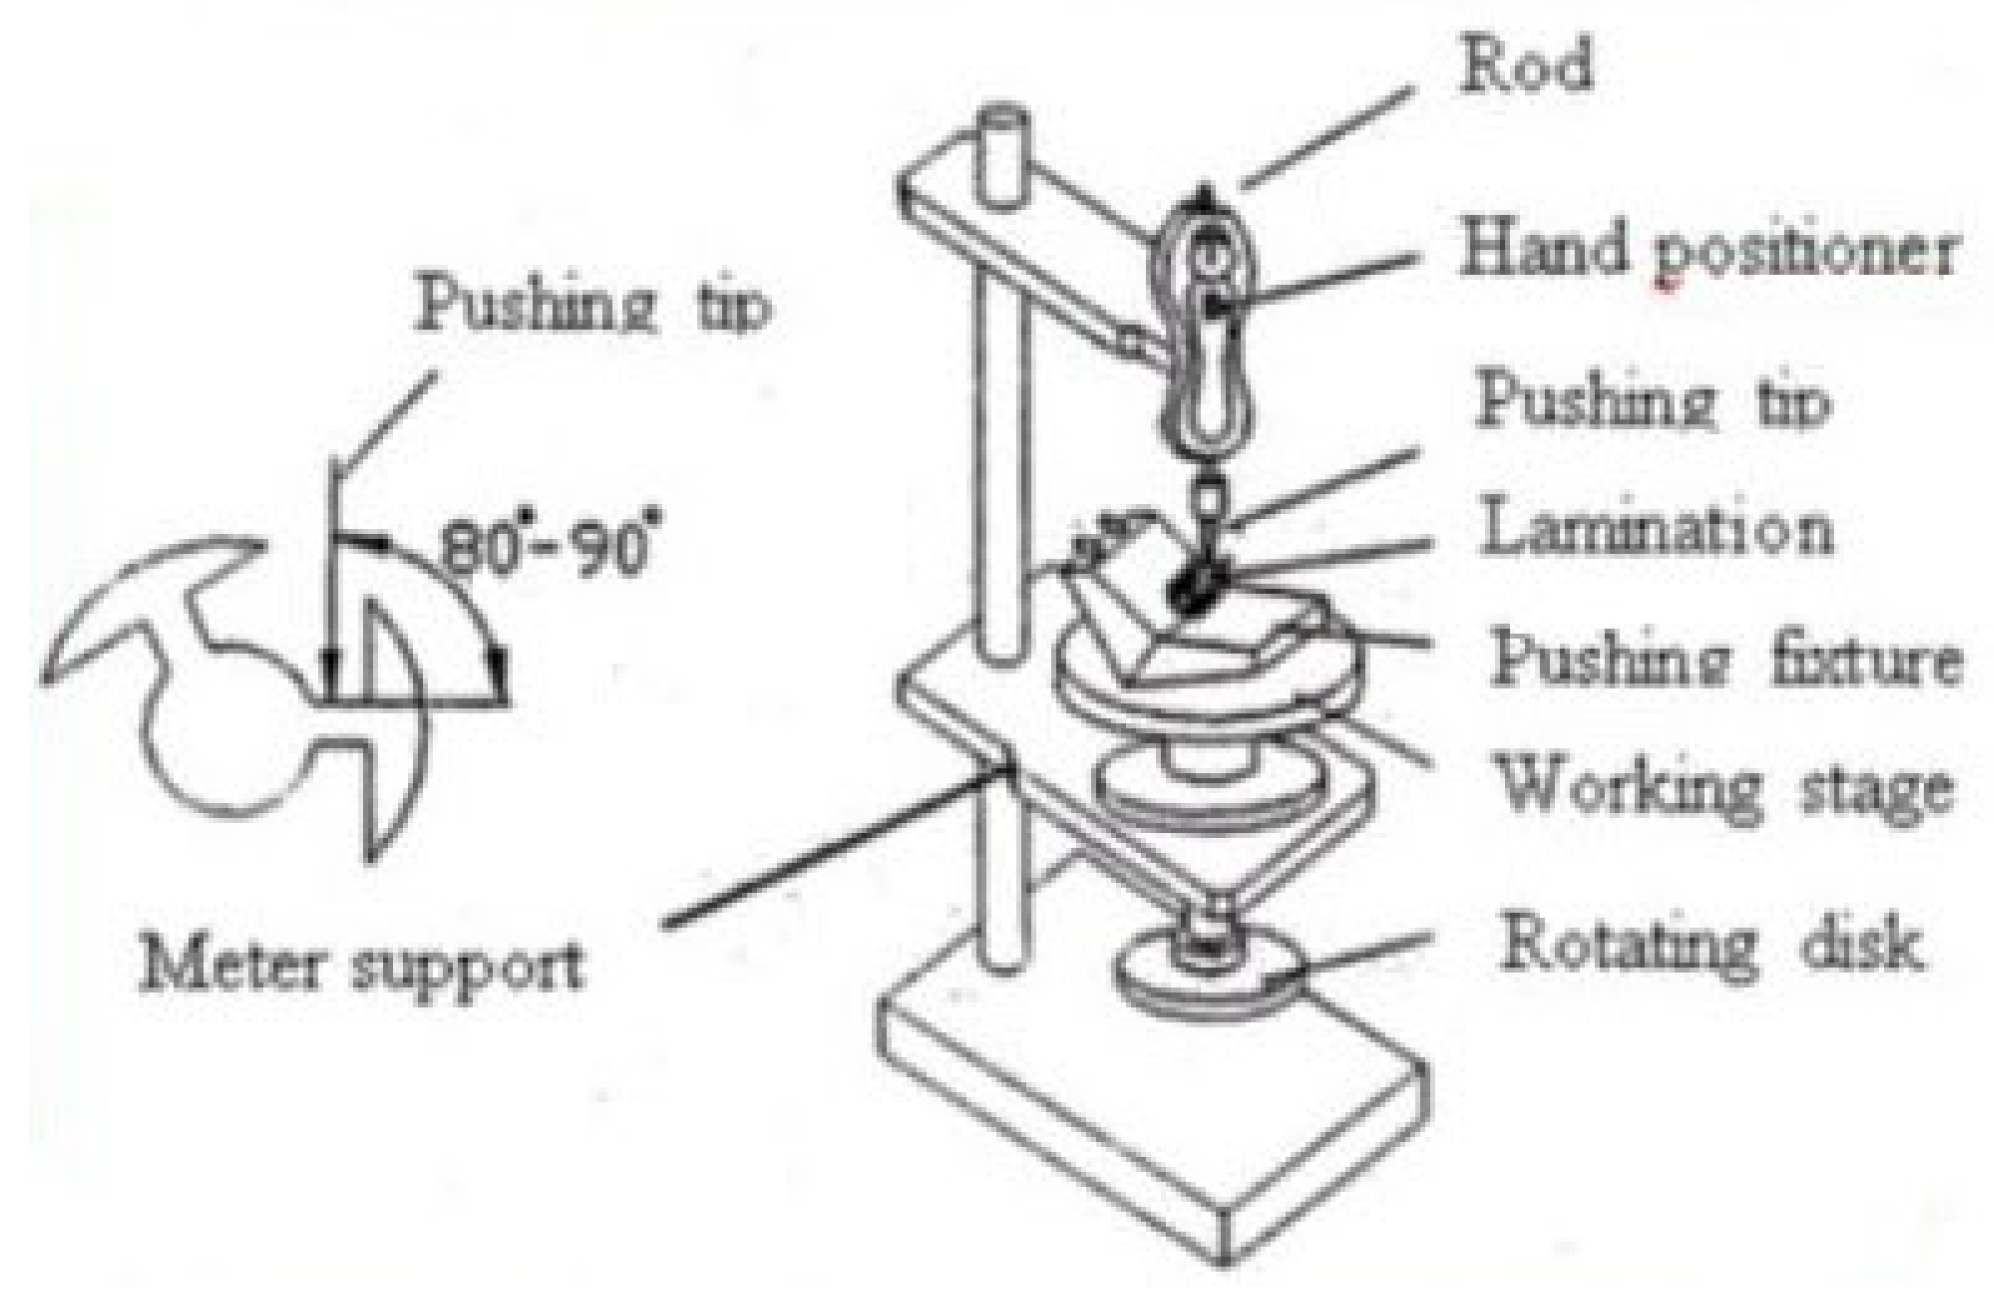
Figure 10.
(a) Force in vertical orientation for epoxy coating detachment; (b) Peel strength of epoxy coating at 80°- 90°.
Figure 10.
(a) Force in vertical orientation for epoxy coating detachment; (b) Peel strength of epoxy coating at 80°- 90°.
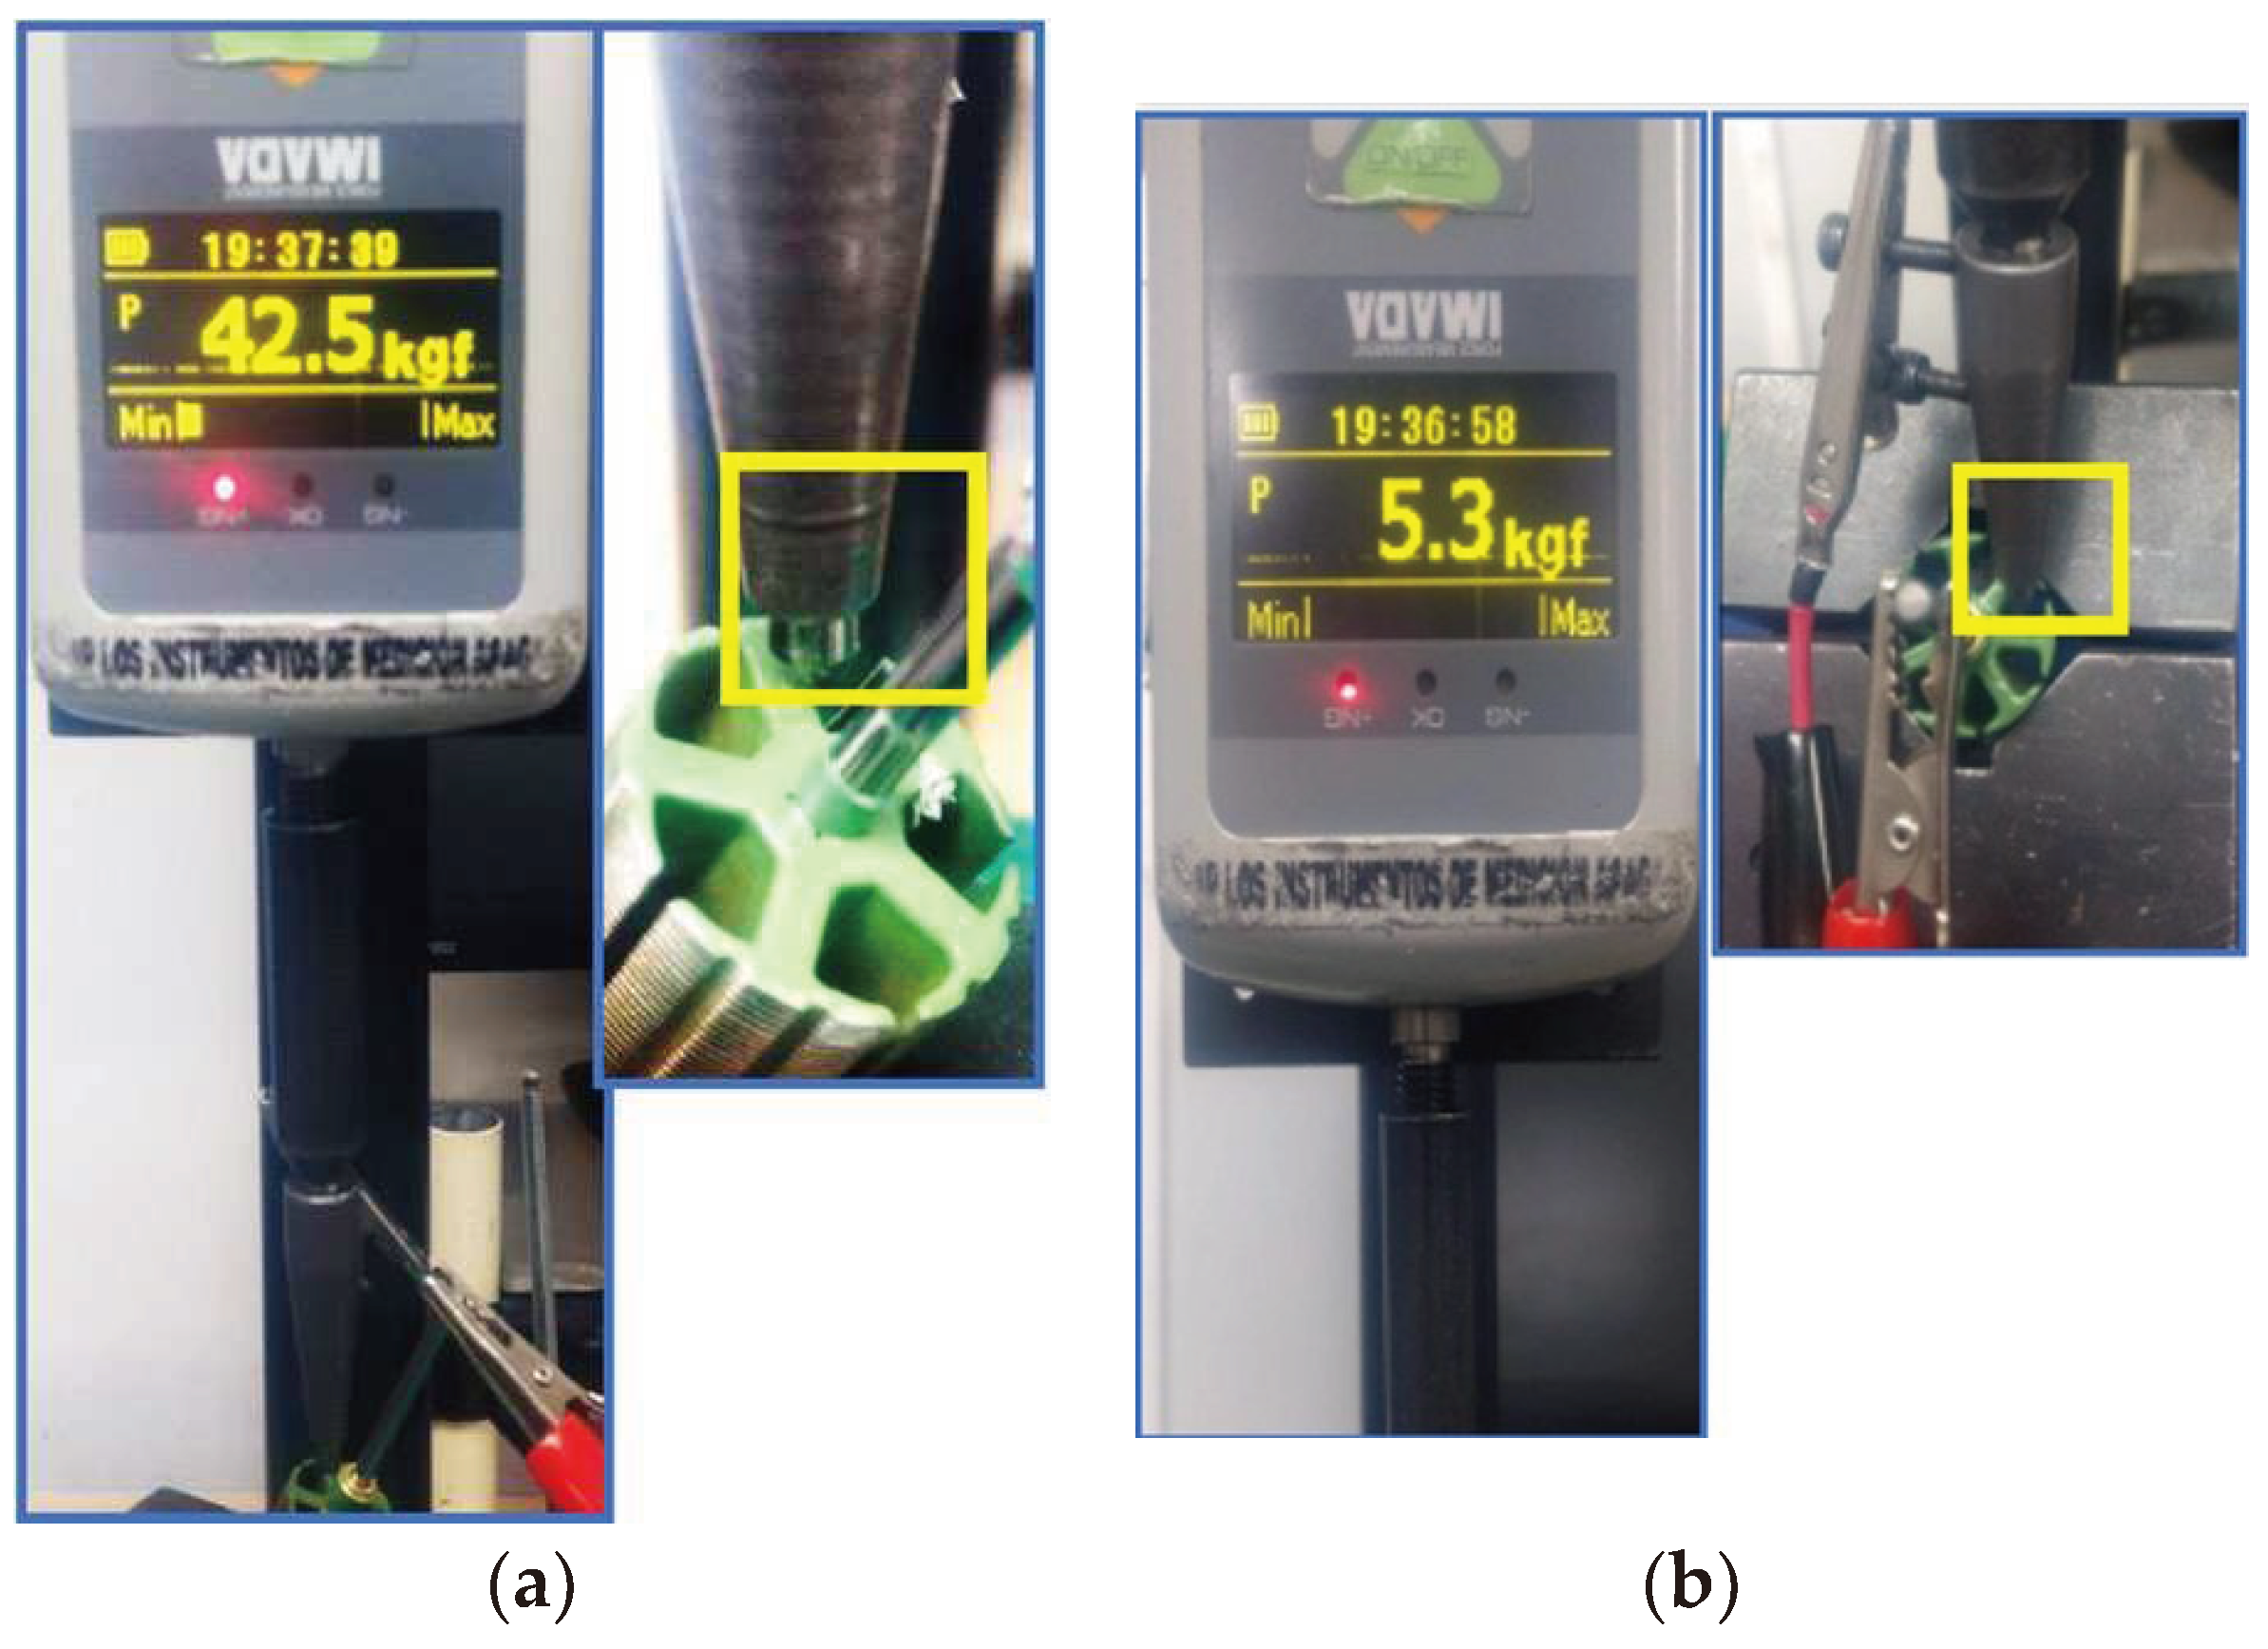
Figure 11.
Testing Machine for Peel Off Epoxy Coating.
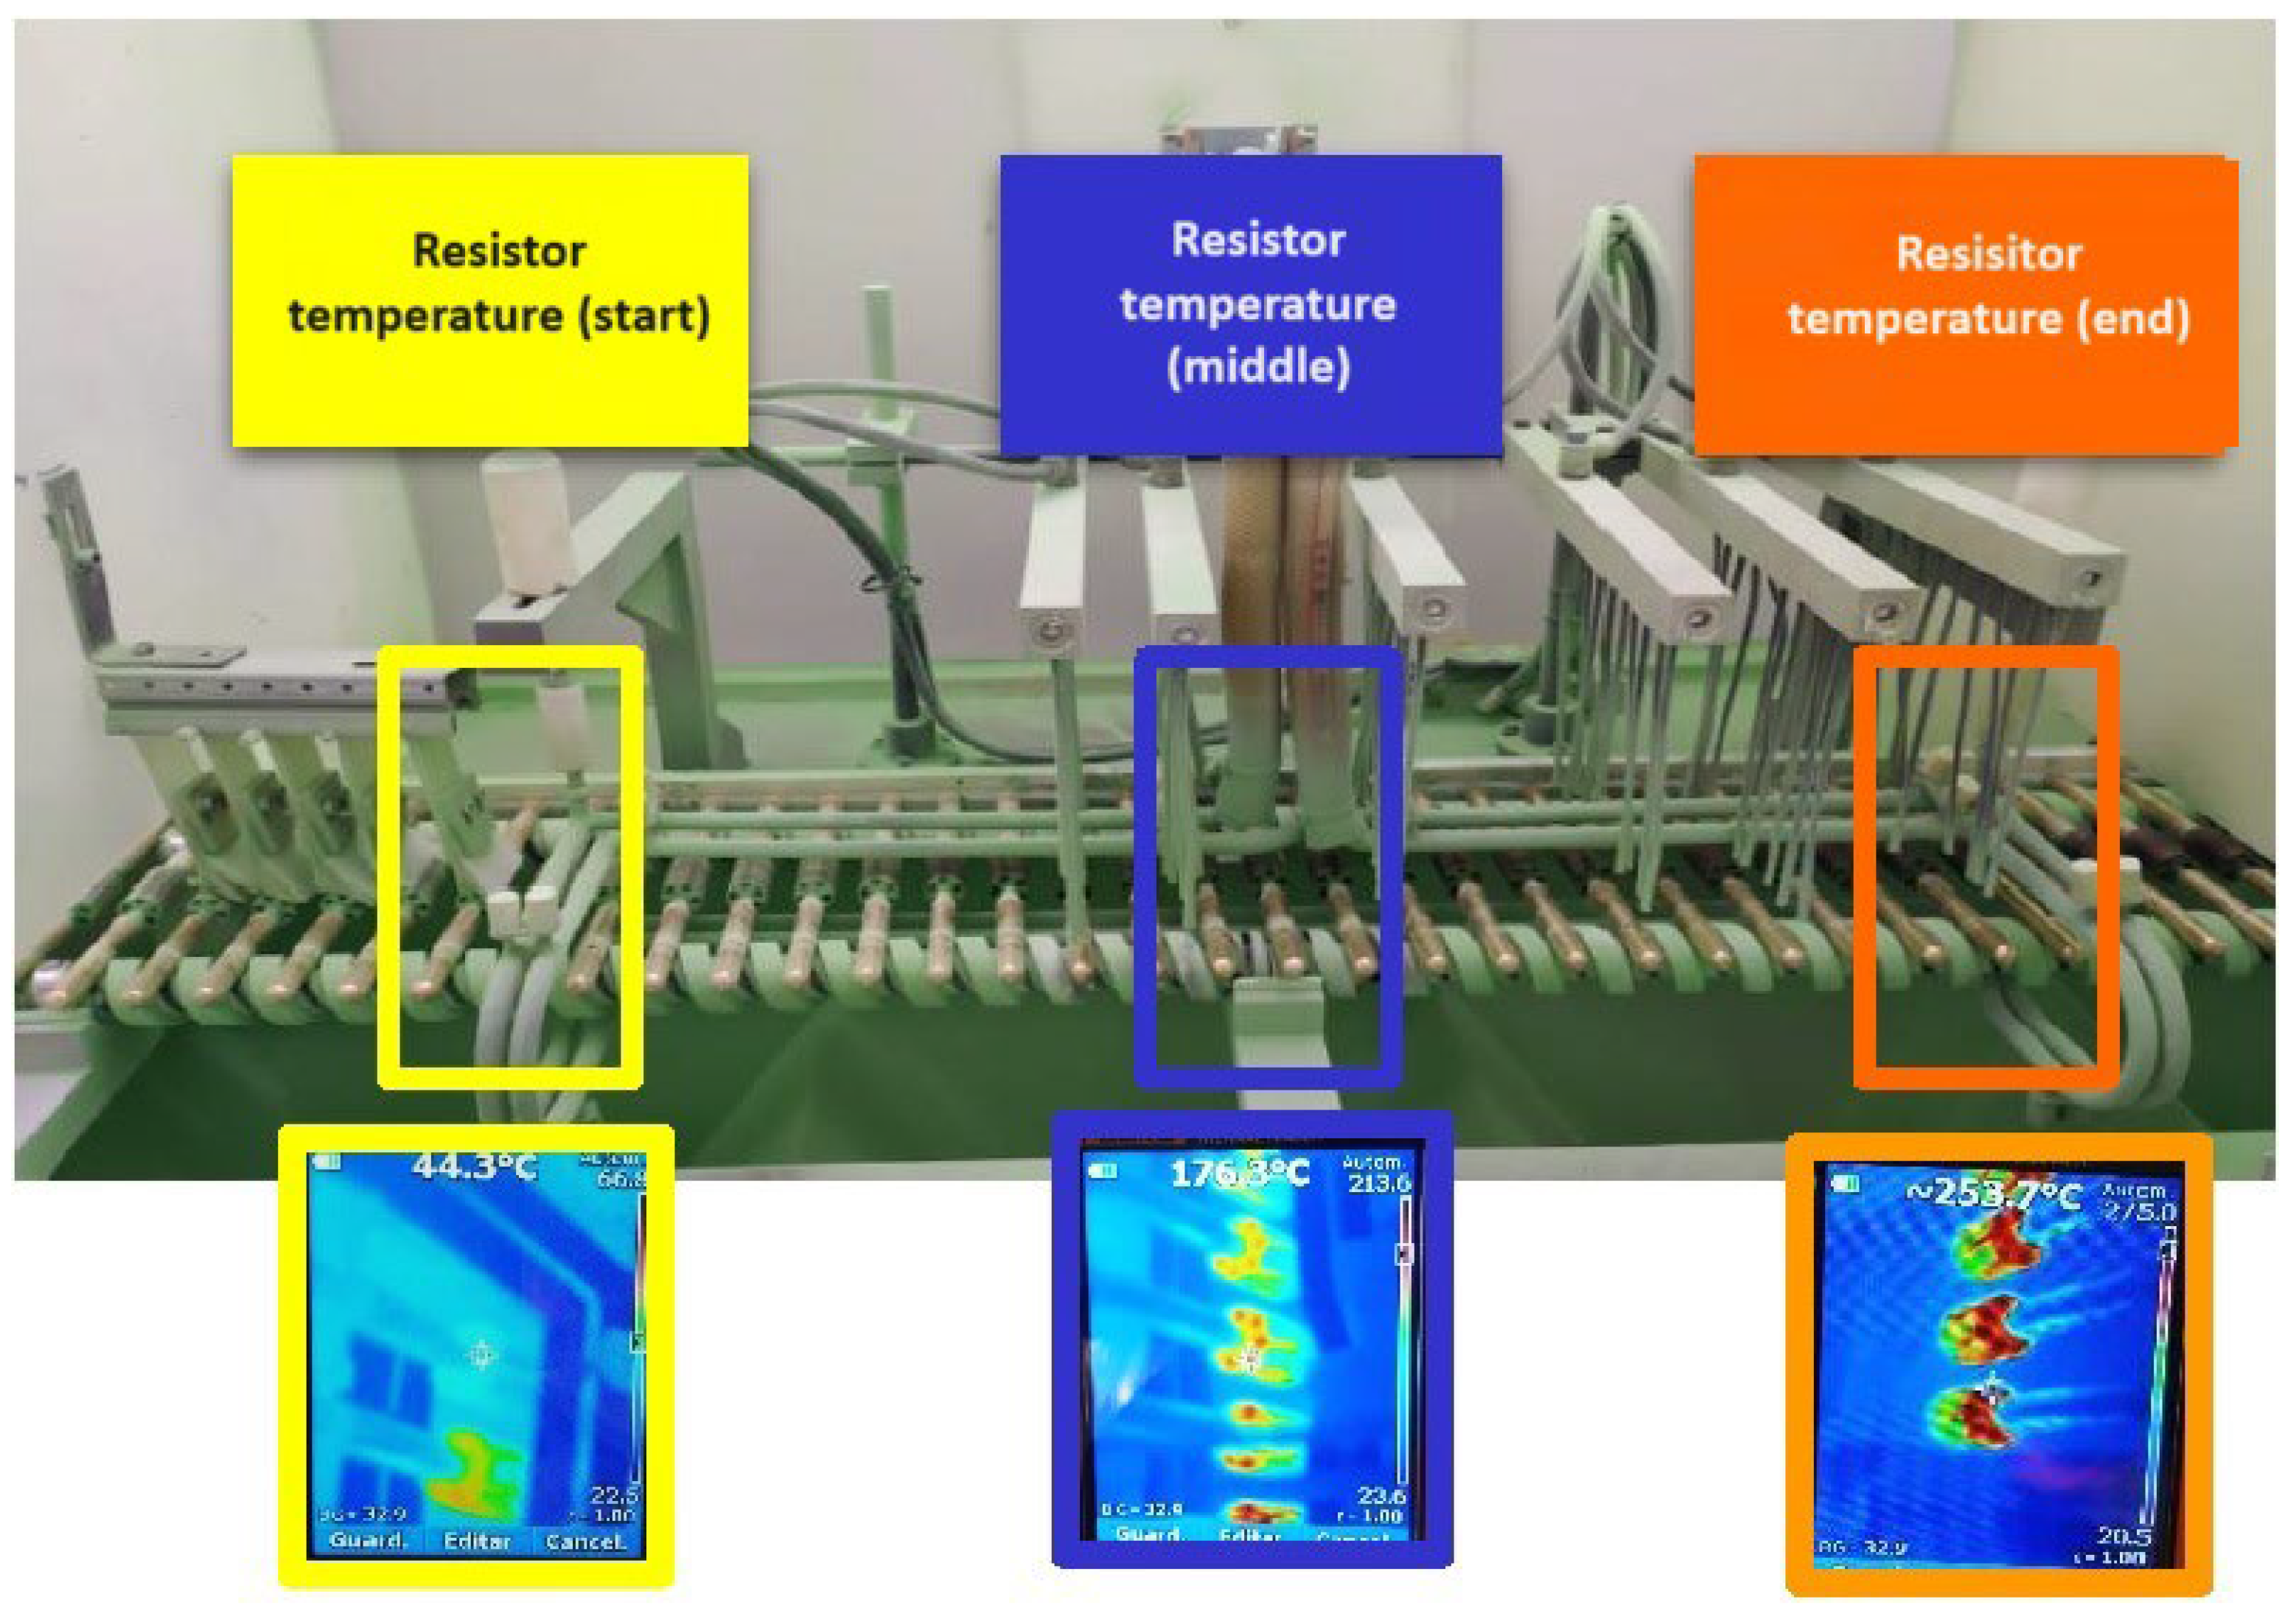
Figure 12.
Individual control chart for armature temperature at the start of laminating degreasing (in °C).
Figure 12.
Individual control chart for armature temperature at the start of laminating degreasing (in °C).
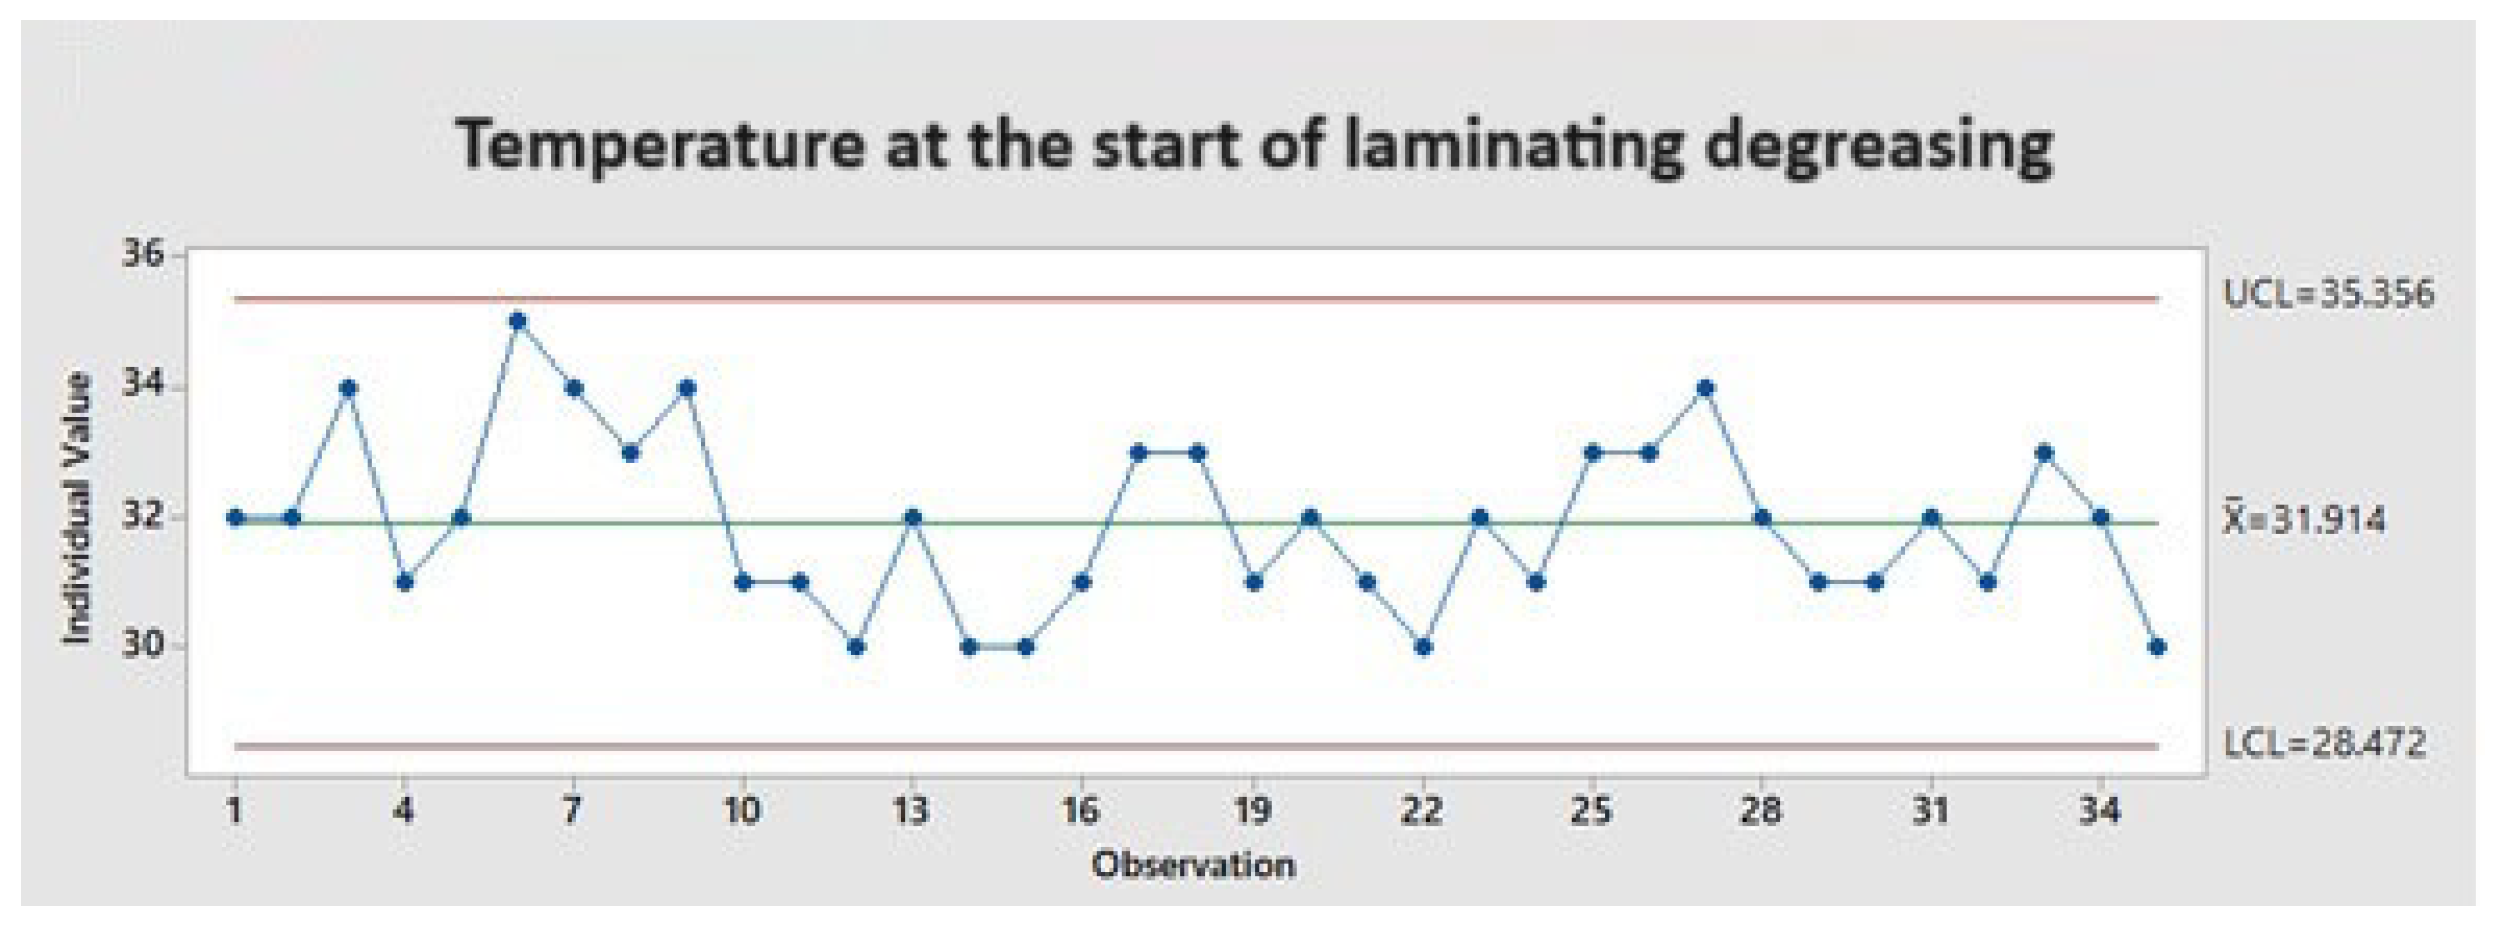
Figure 13.
Individual control chart for armature temperature at the end of laminating degreasing (in °C).
Figure 13.
Individual control chart for armature temperature at the end of laminating degreasing (in °C).
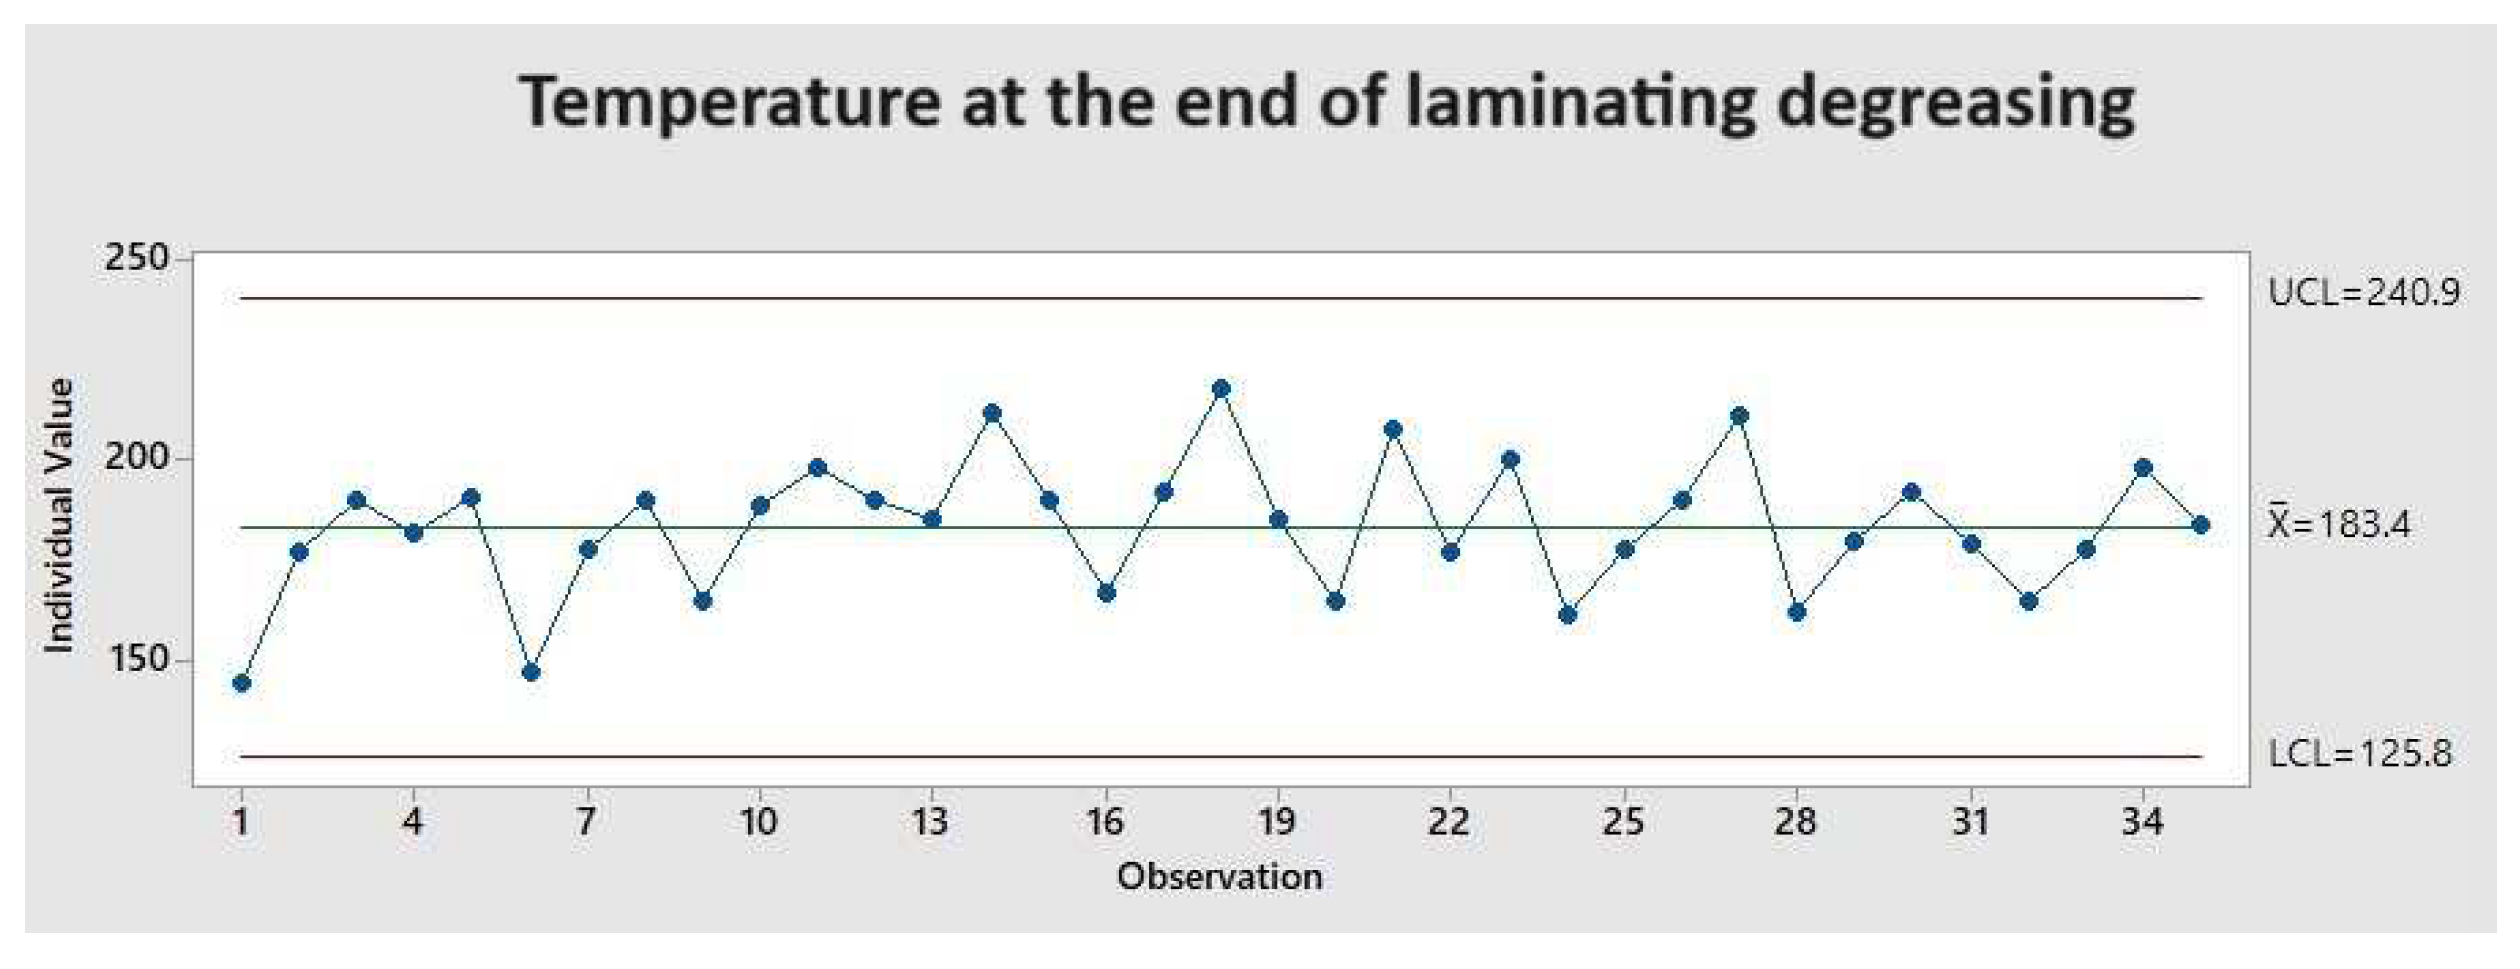
Figure 14.
Individual control chart for armature temperature at the start of epoxy curing (in °C).
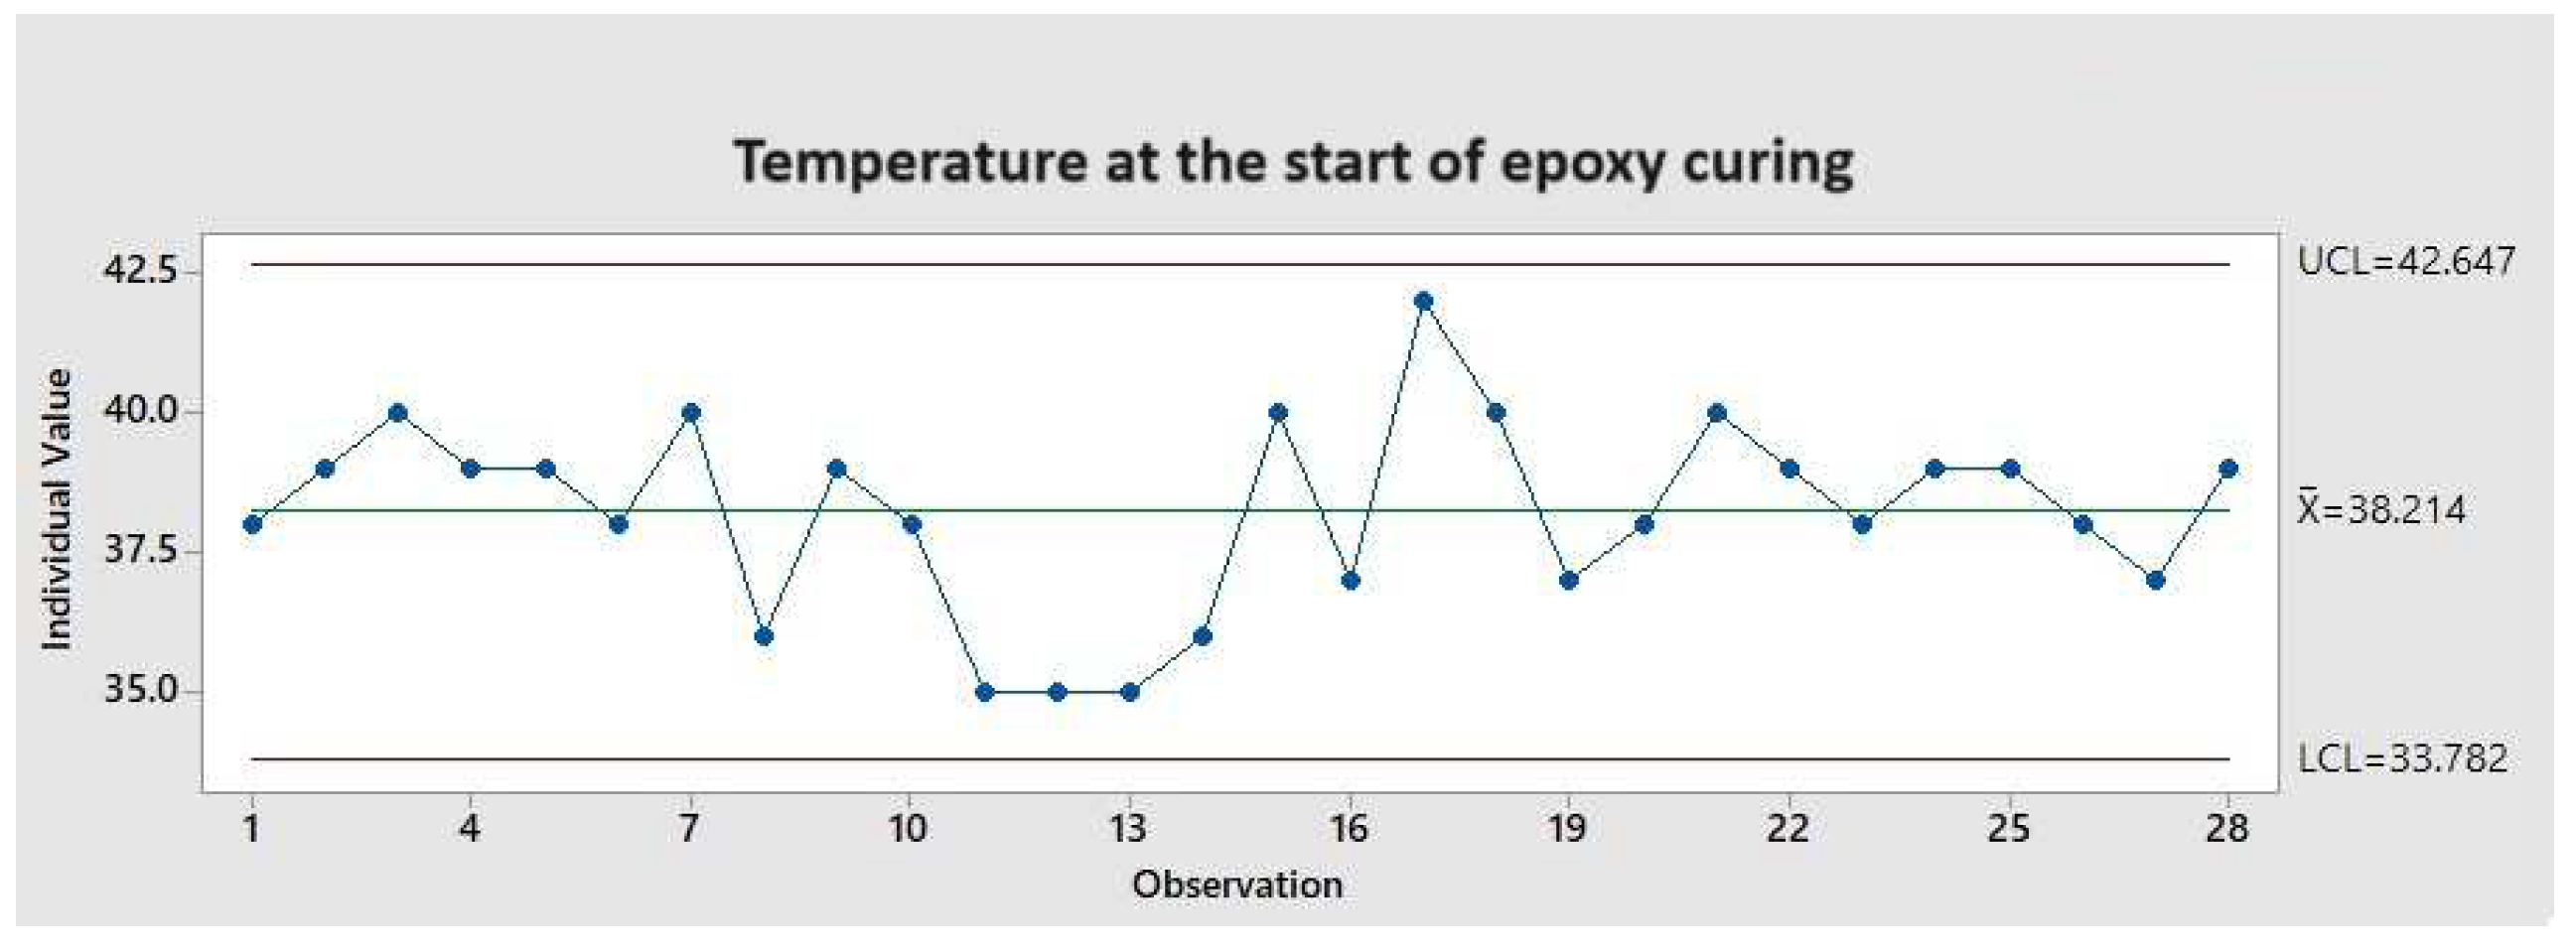
Figure 15.
Individual control chart for armature temperature at the end of epoxy curing (in °C).
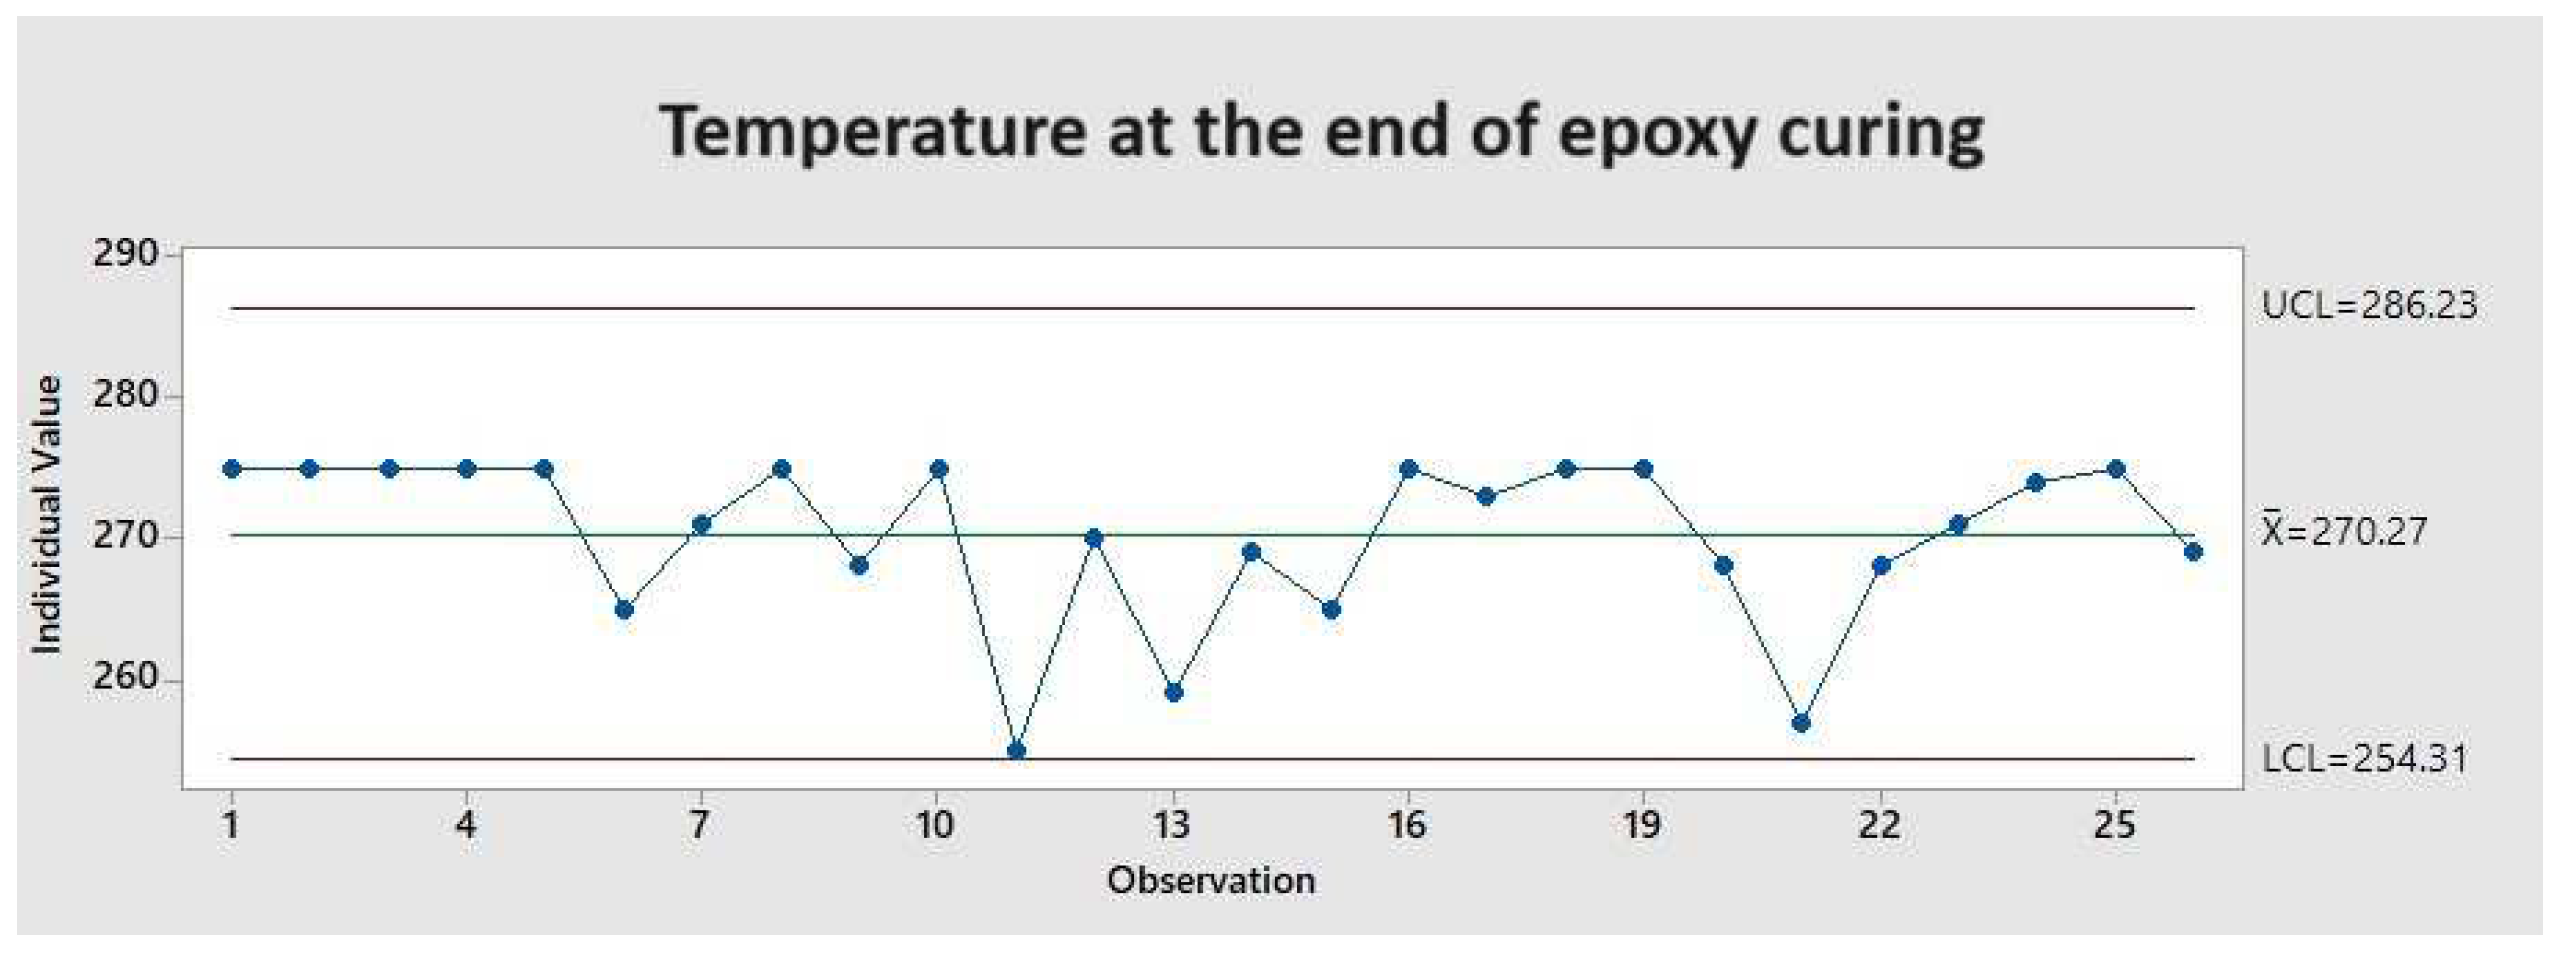
Figure 16.
Process capability measures for epoxy coating thickness, (a) Short side armature; (b) Long side armature.
Figure 16.
Process capability measures for epoxy coating thickness, (a) Short side armature; (b) Long side armature.
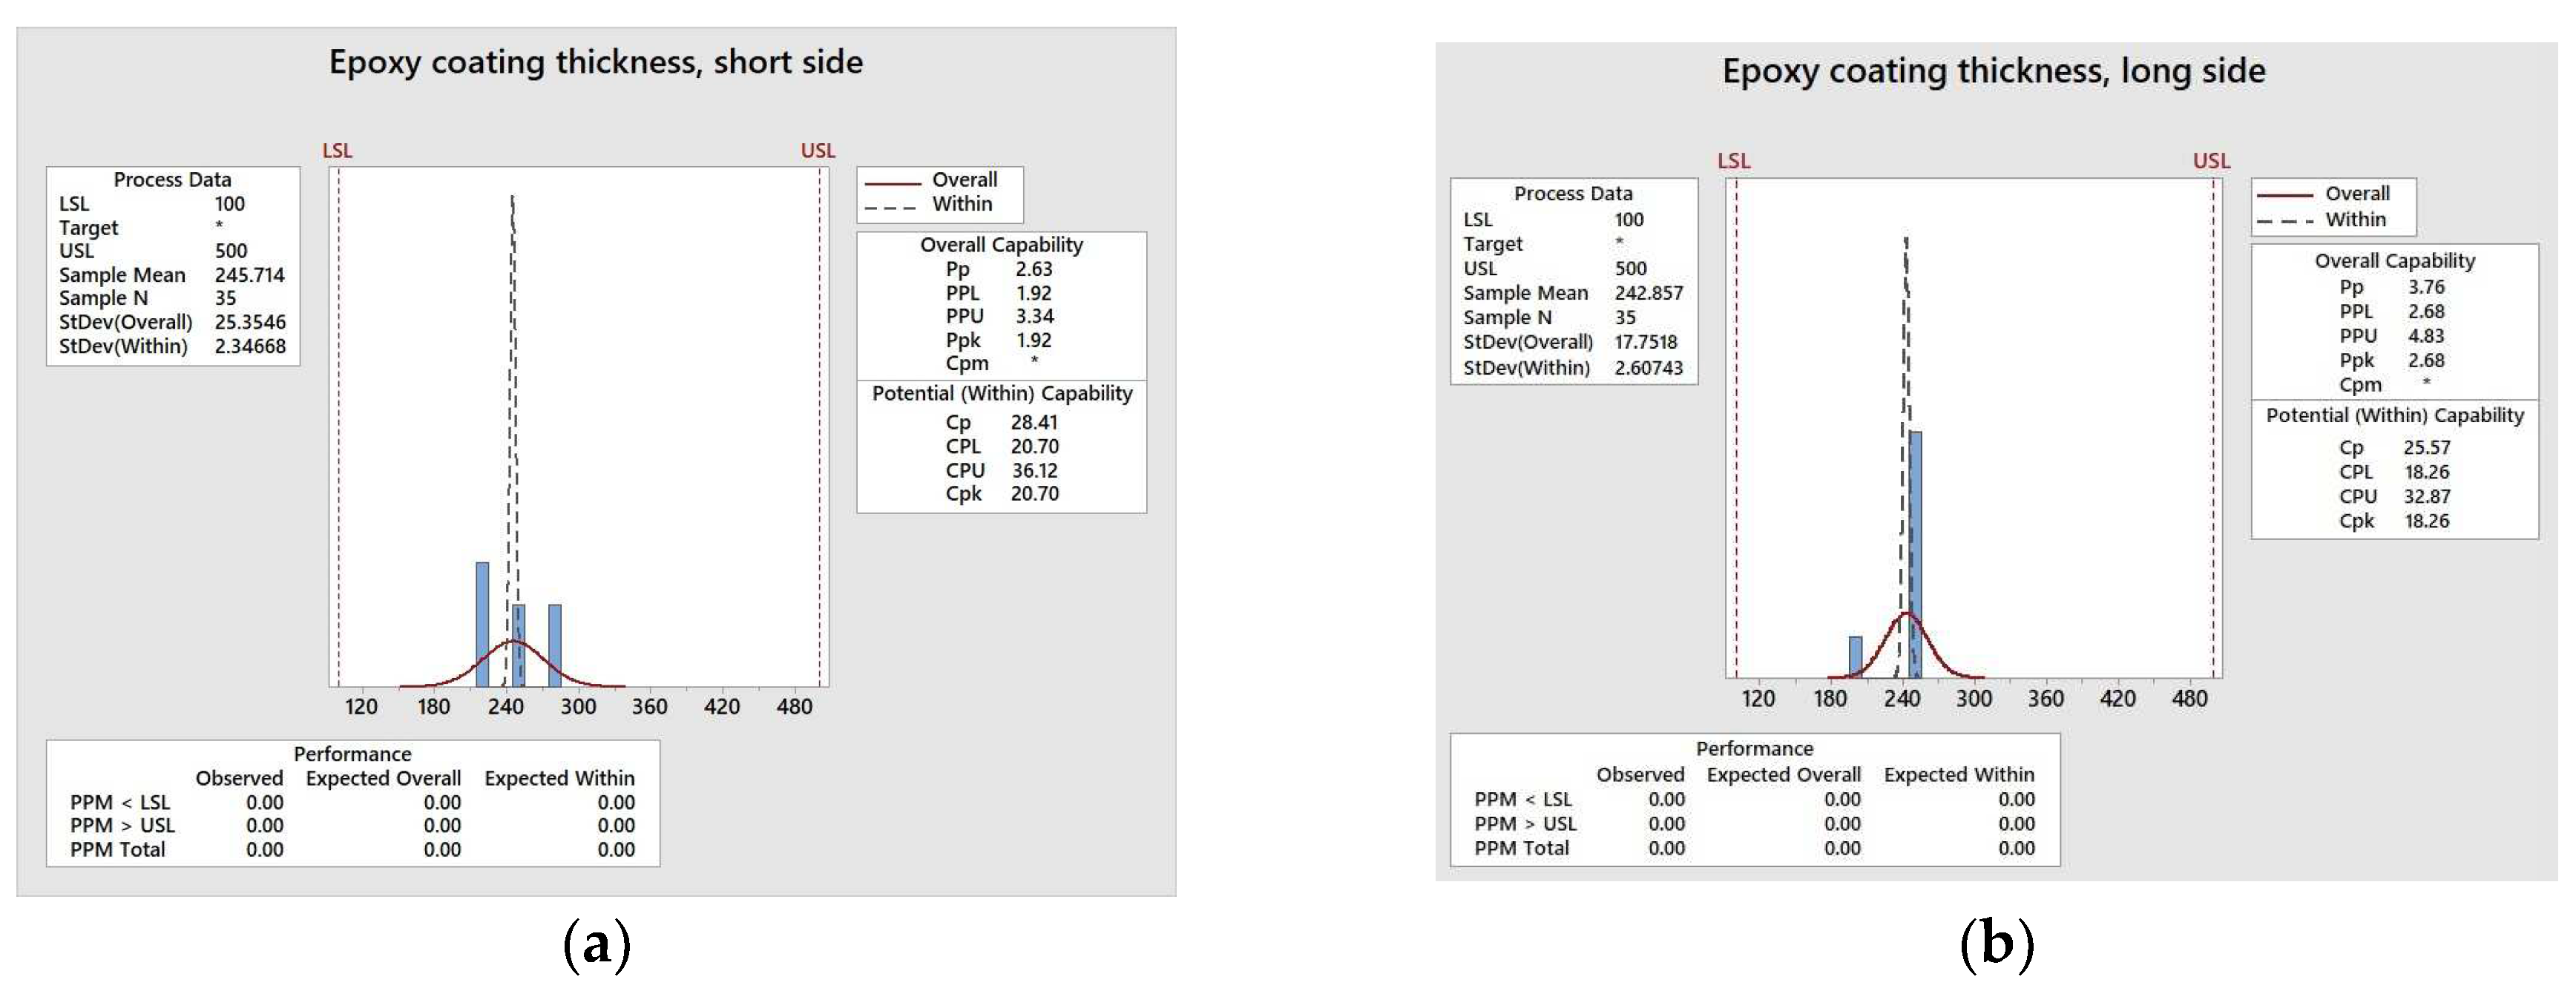
Figure 17.
Process capability measures for epoxy detachment force, (a) Short side armature; (b) Long side armature.
Figure 17.
Process capability measures for epoxy detachment force, (a) Short side armature; (b) Long side armature.
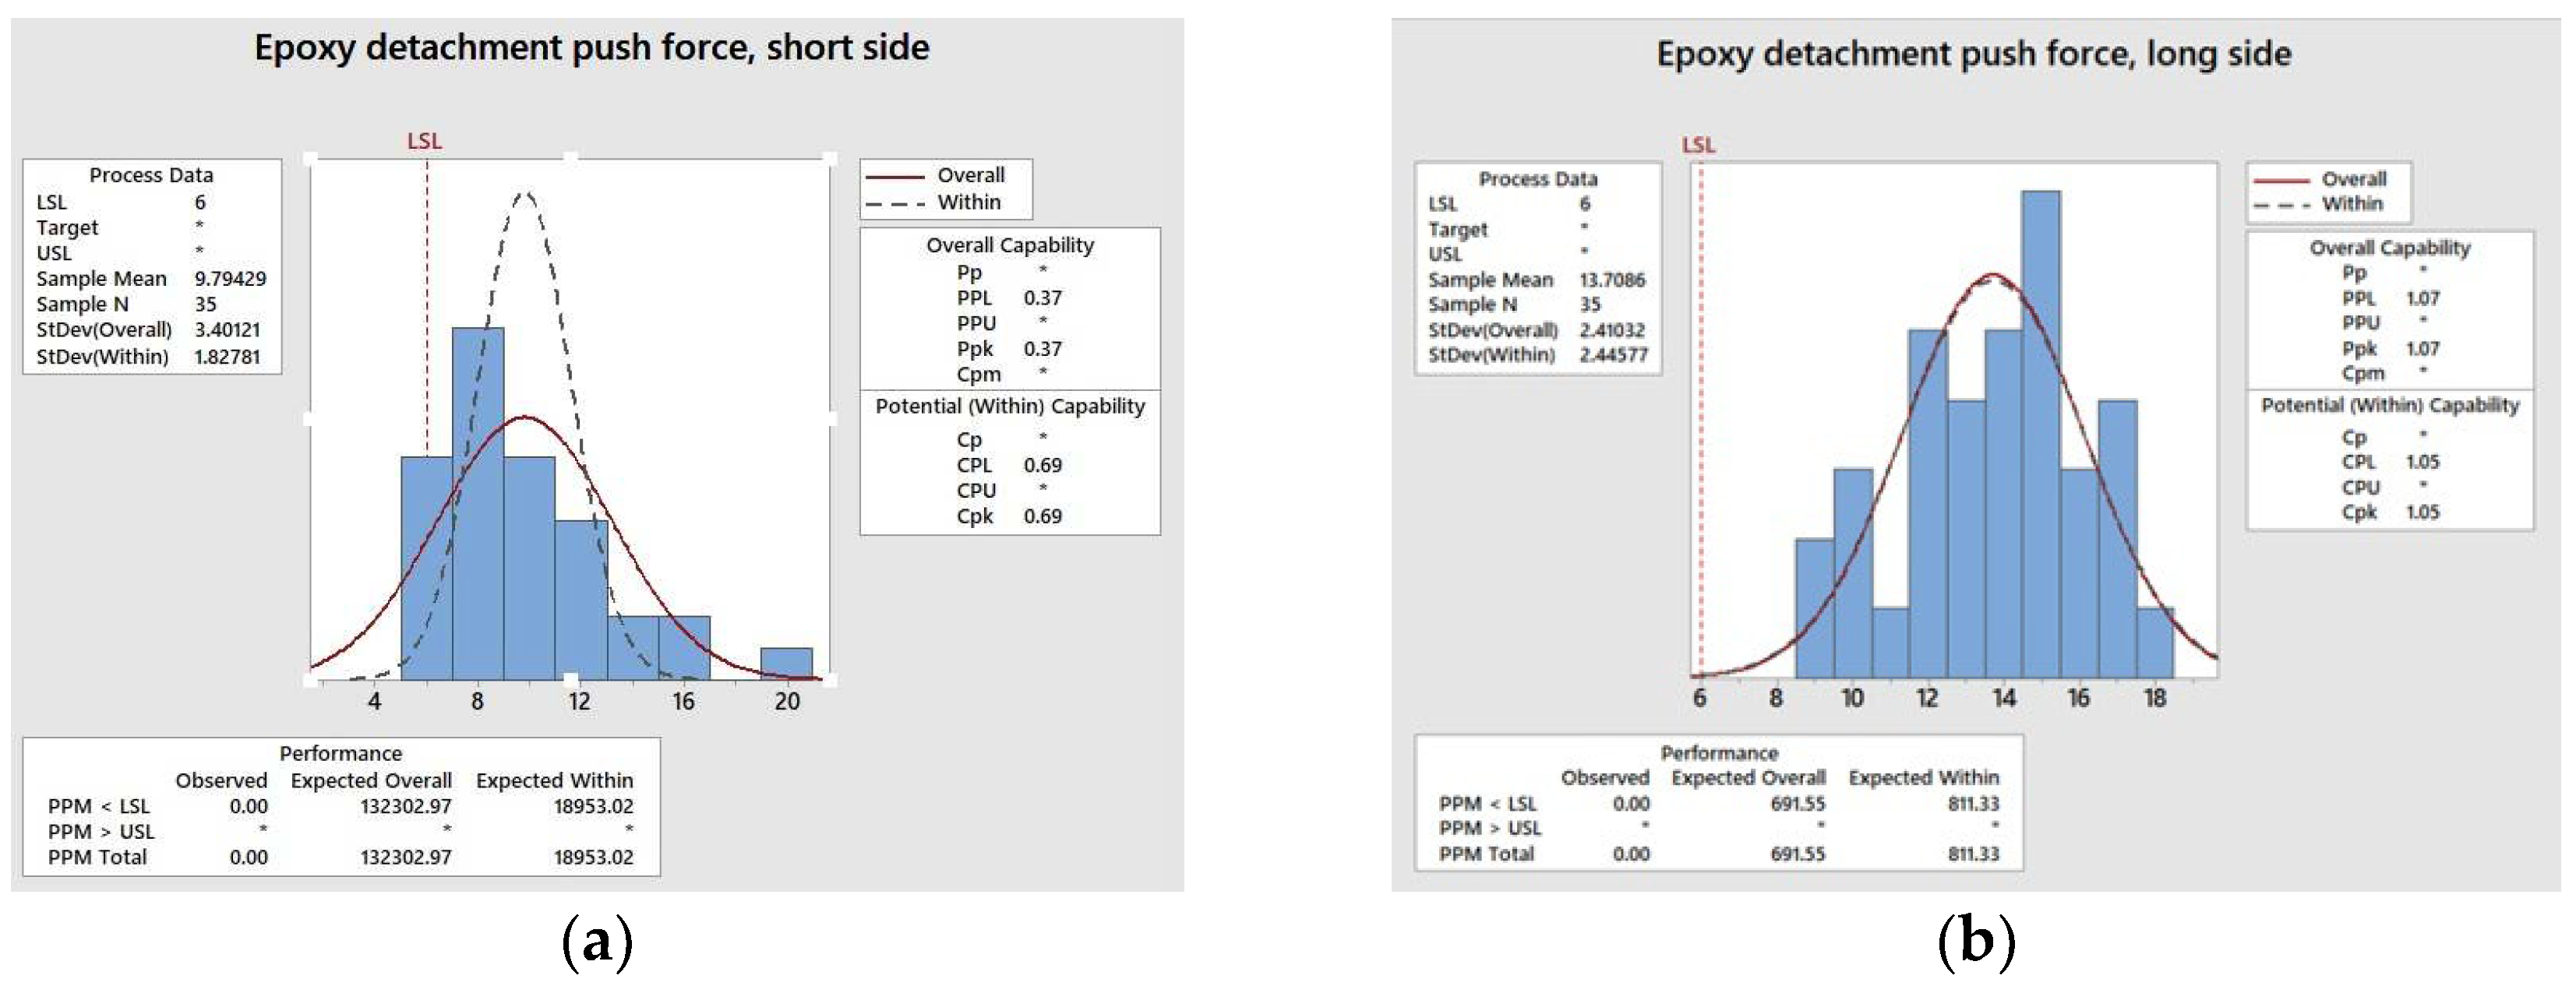
Figure 18.
The two sides of the armature.
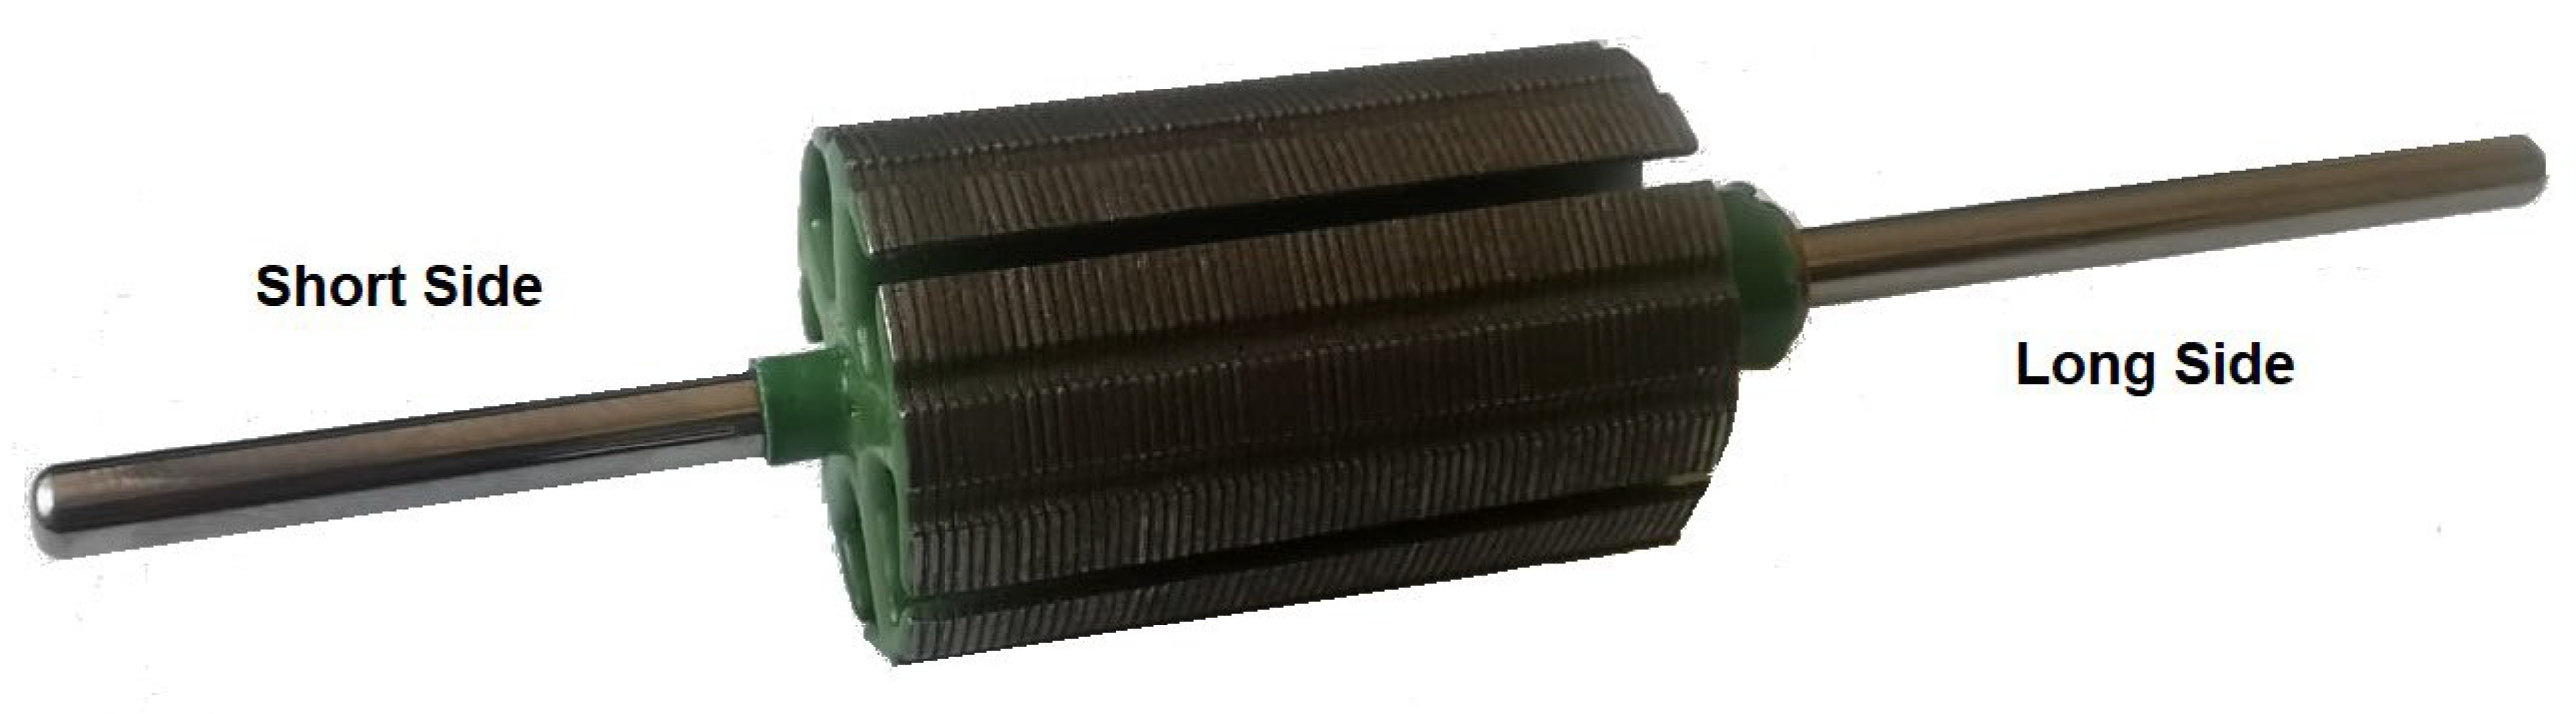
Figure 19.
Impact on breaking force of the short side armature due to increased voltage in curing station.
Figure 19.
Impact on breaking force of the short side armature due to increased voltage in curing station.
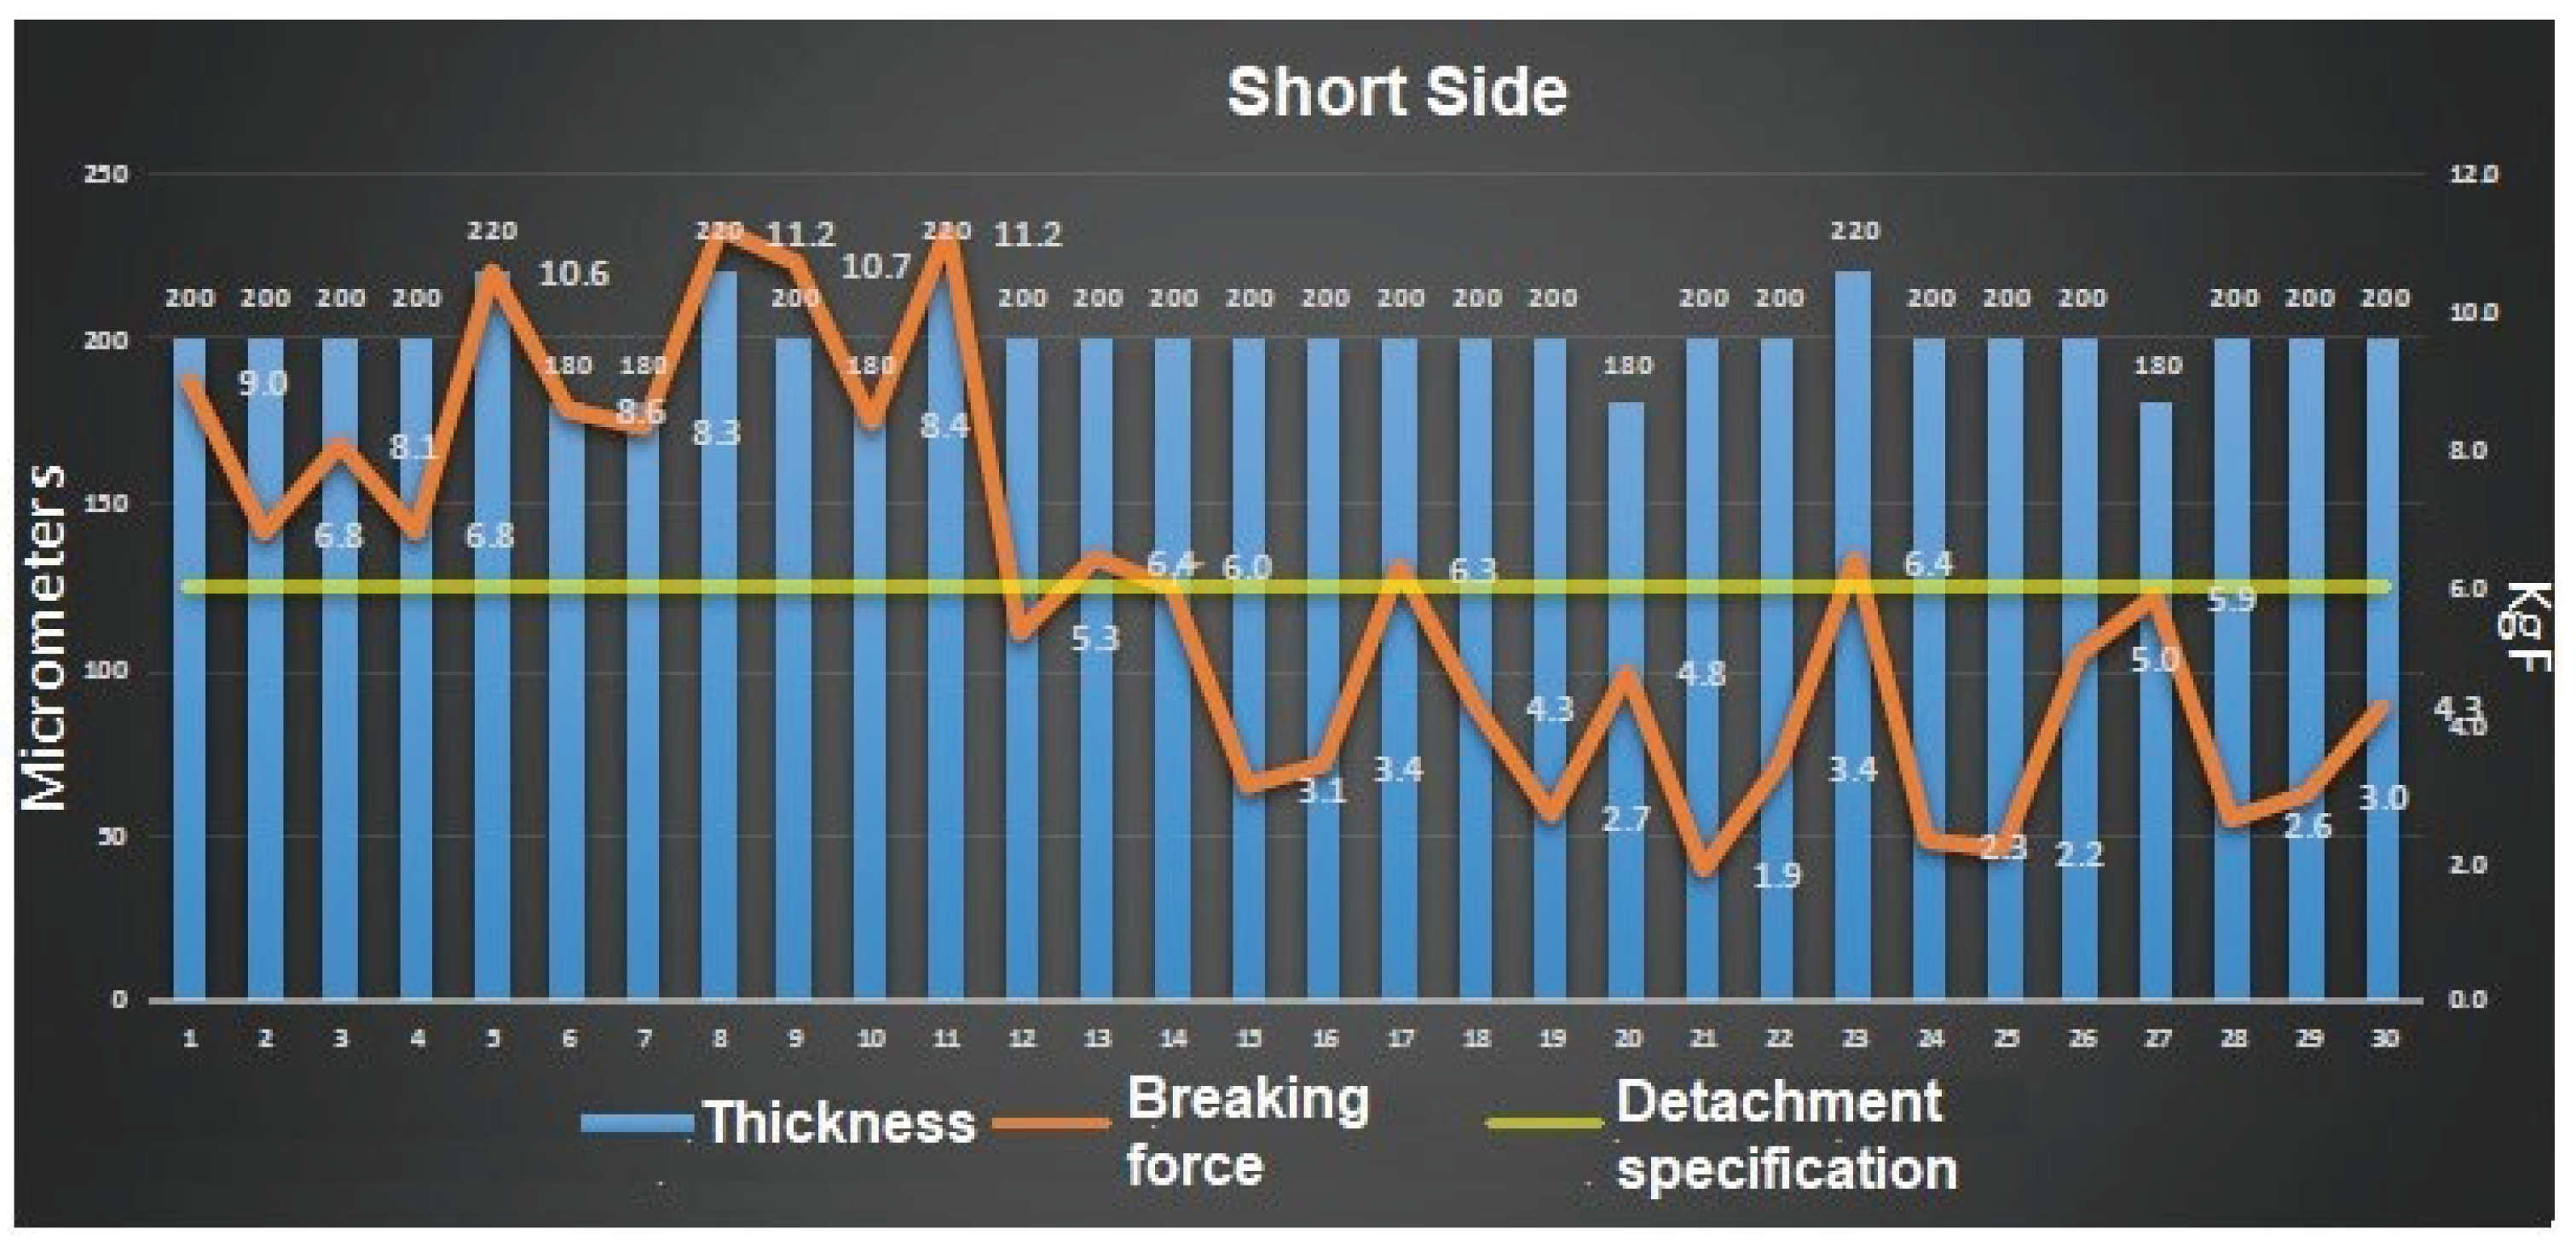
Figure 20.
Impact on breaking force of the long side armature due to increased voltage in curing station.
Figure 20.
Impact on breaking force of the long side armature due to increased voltage in curing station.
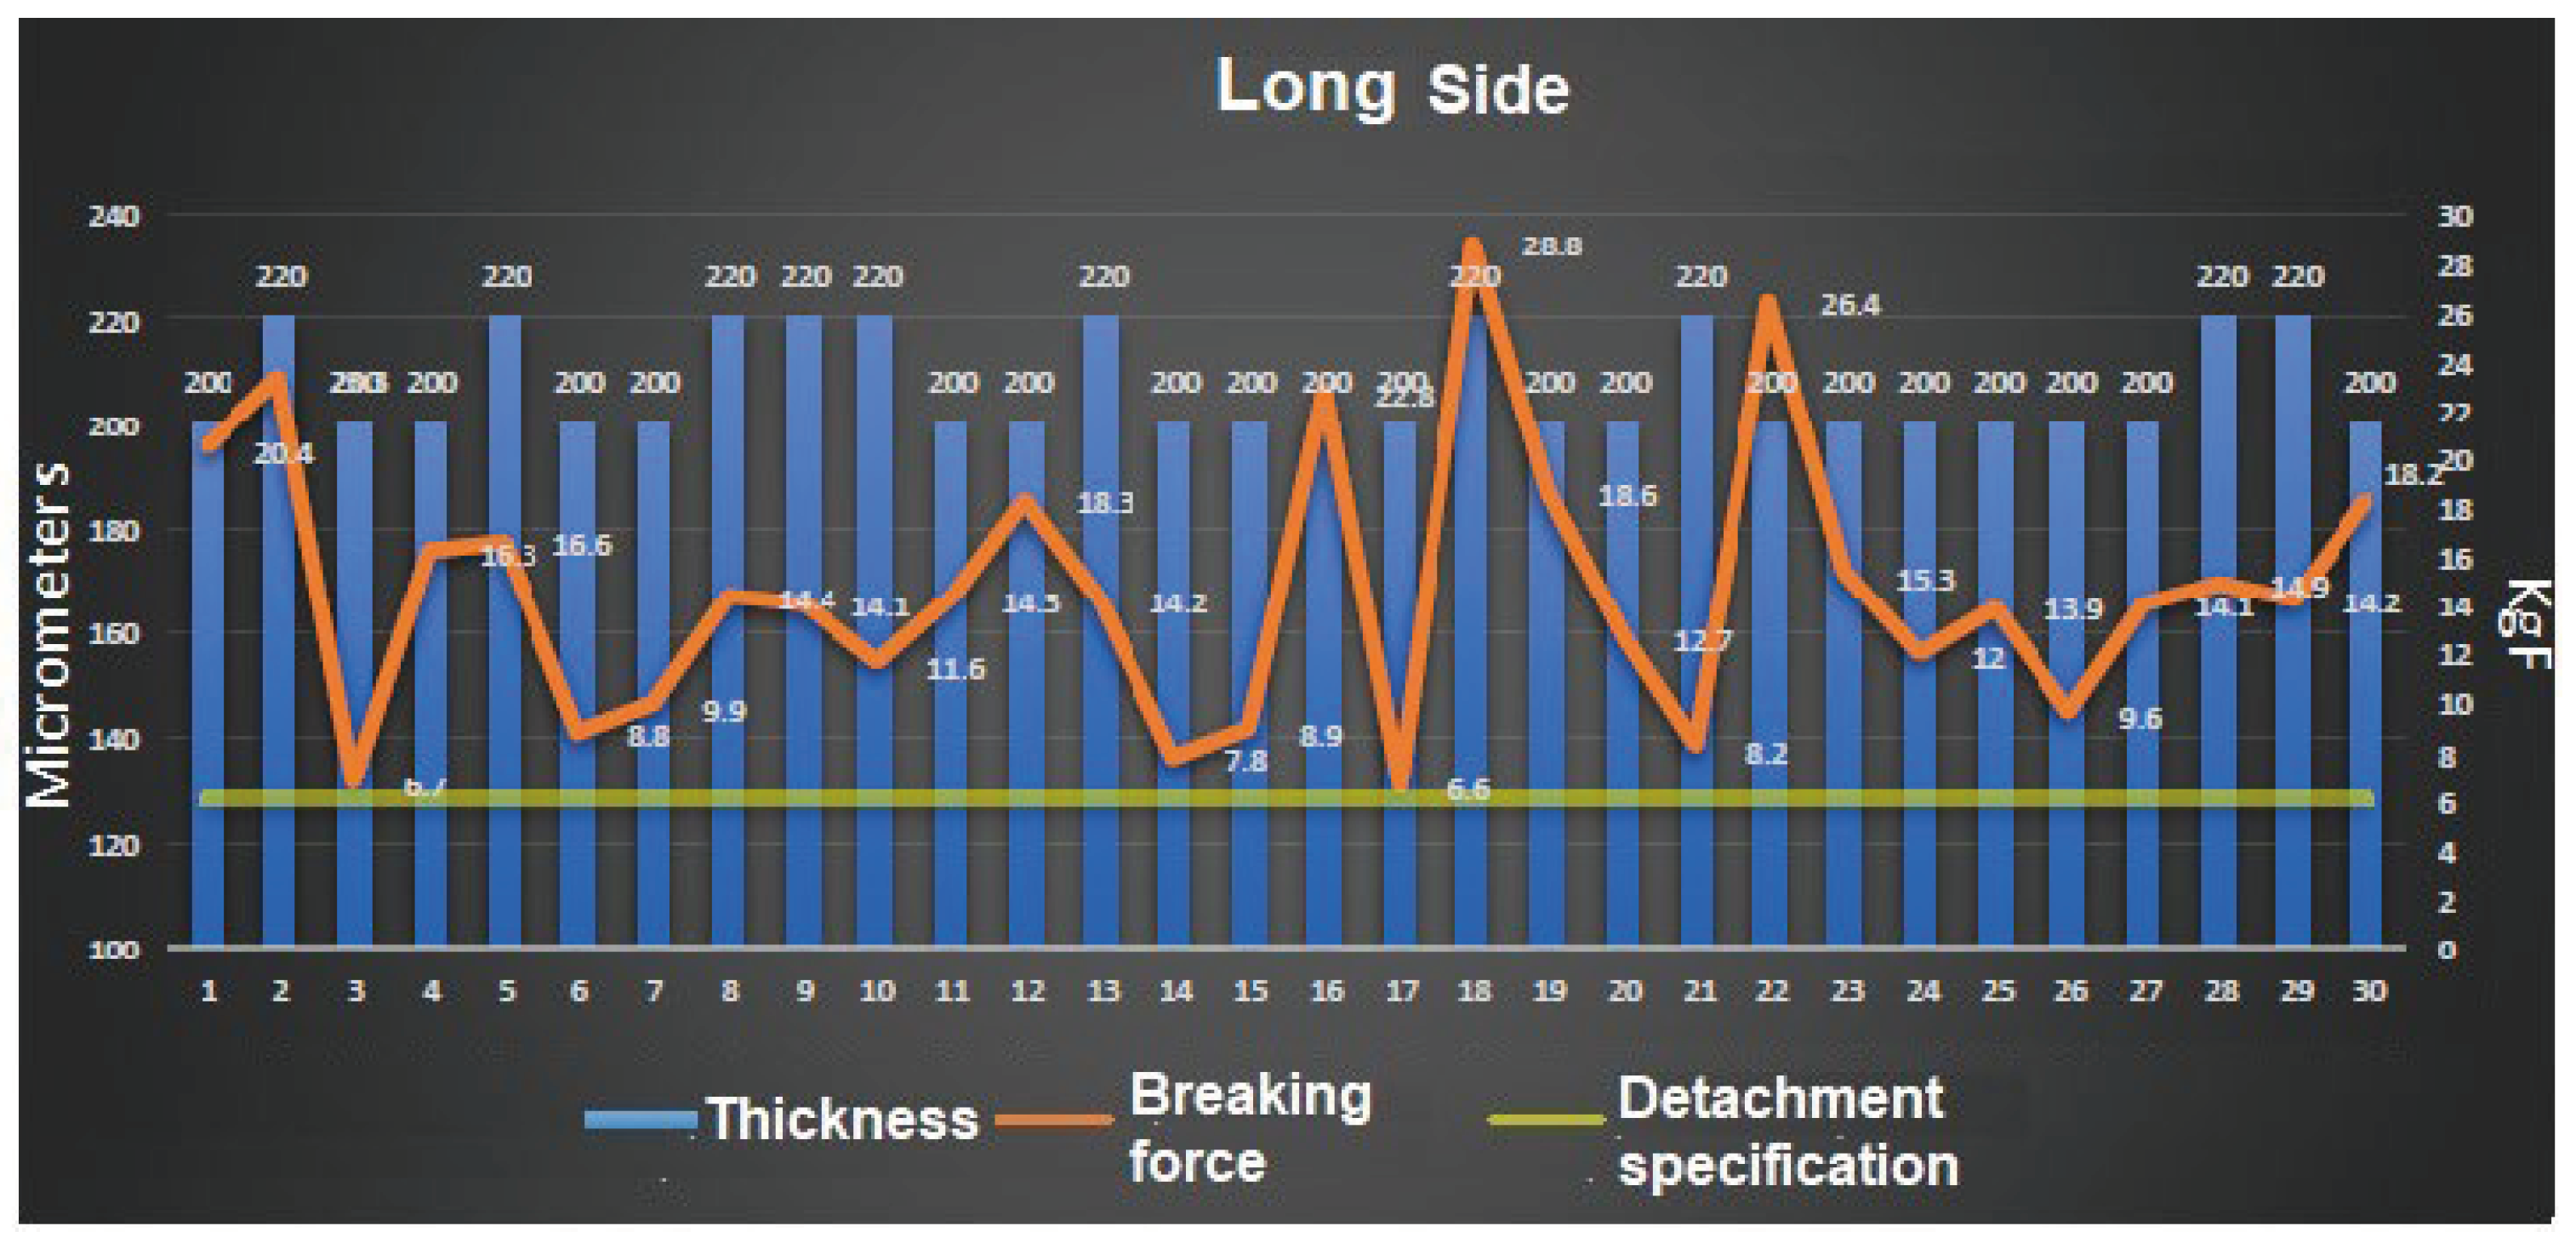
Figure 22.
Impact on breaking force of the short side armature due to increase the epoxy coating thickness.
Figure 22.
Impact on breaking force of the short side armature due to increase the epoxy coating thickness.
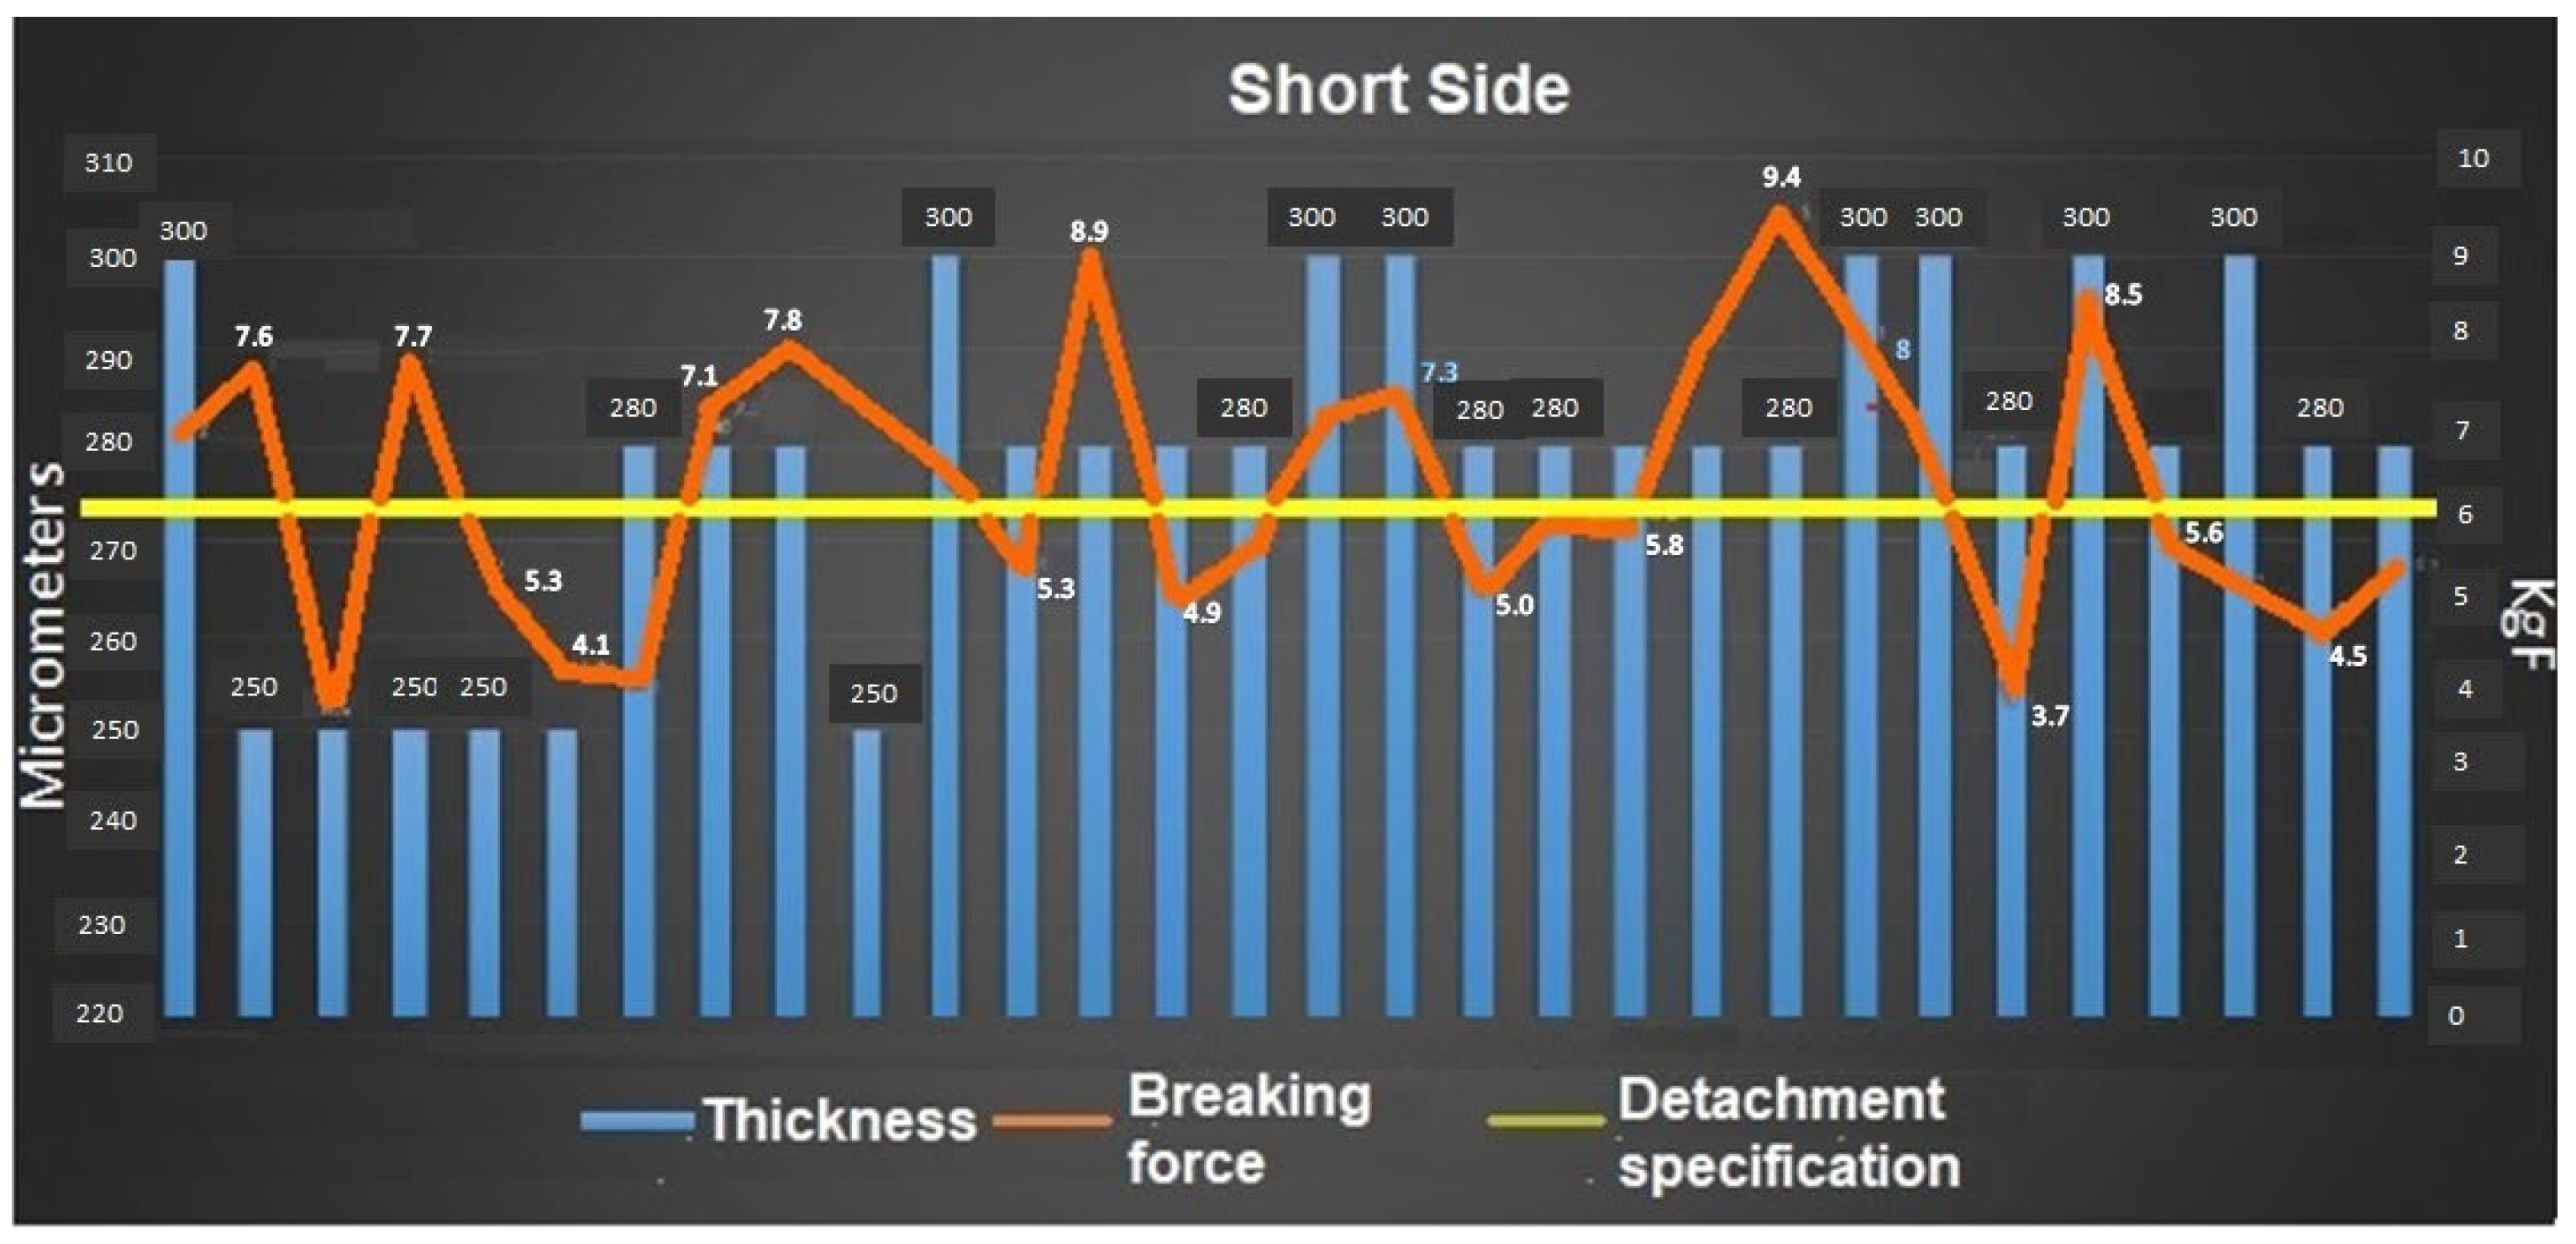
Figure 23.
Impact on breaking force of the long side armature due to increase the epoxy coating thickness.
Figure 23.
Impact on breaking force of the long side armature due to increase the epoxy coating thickness.
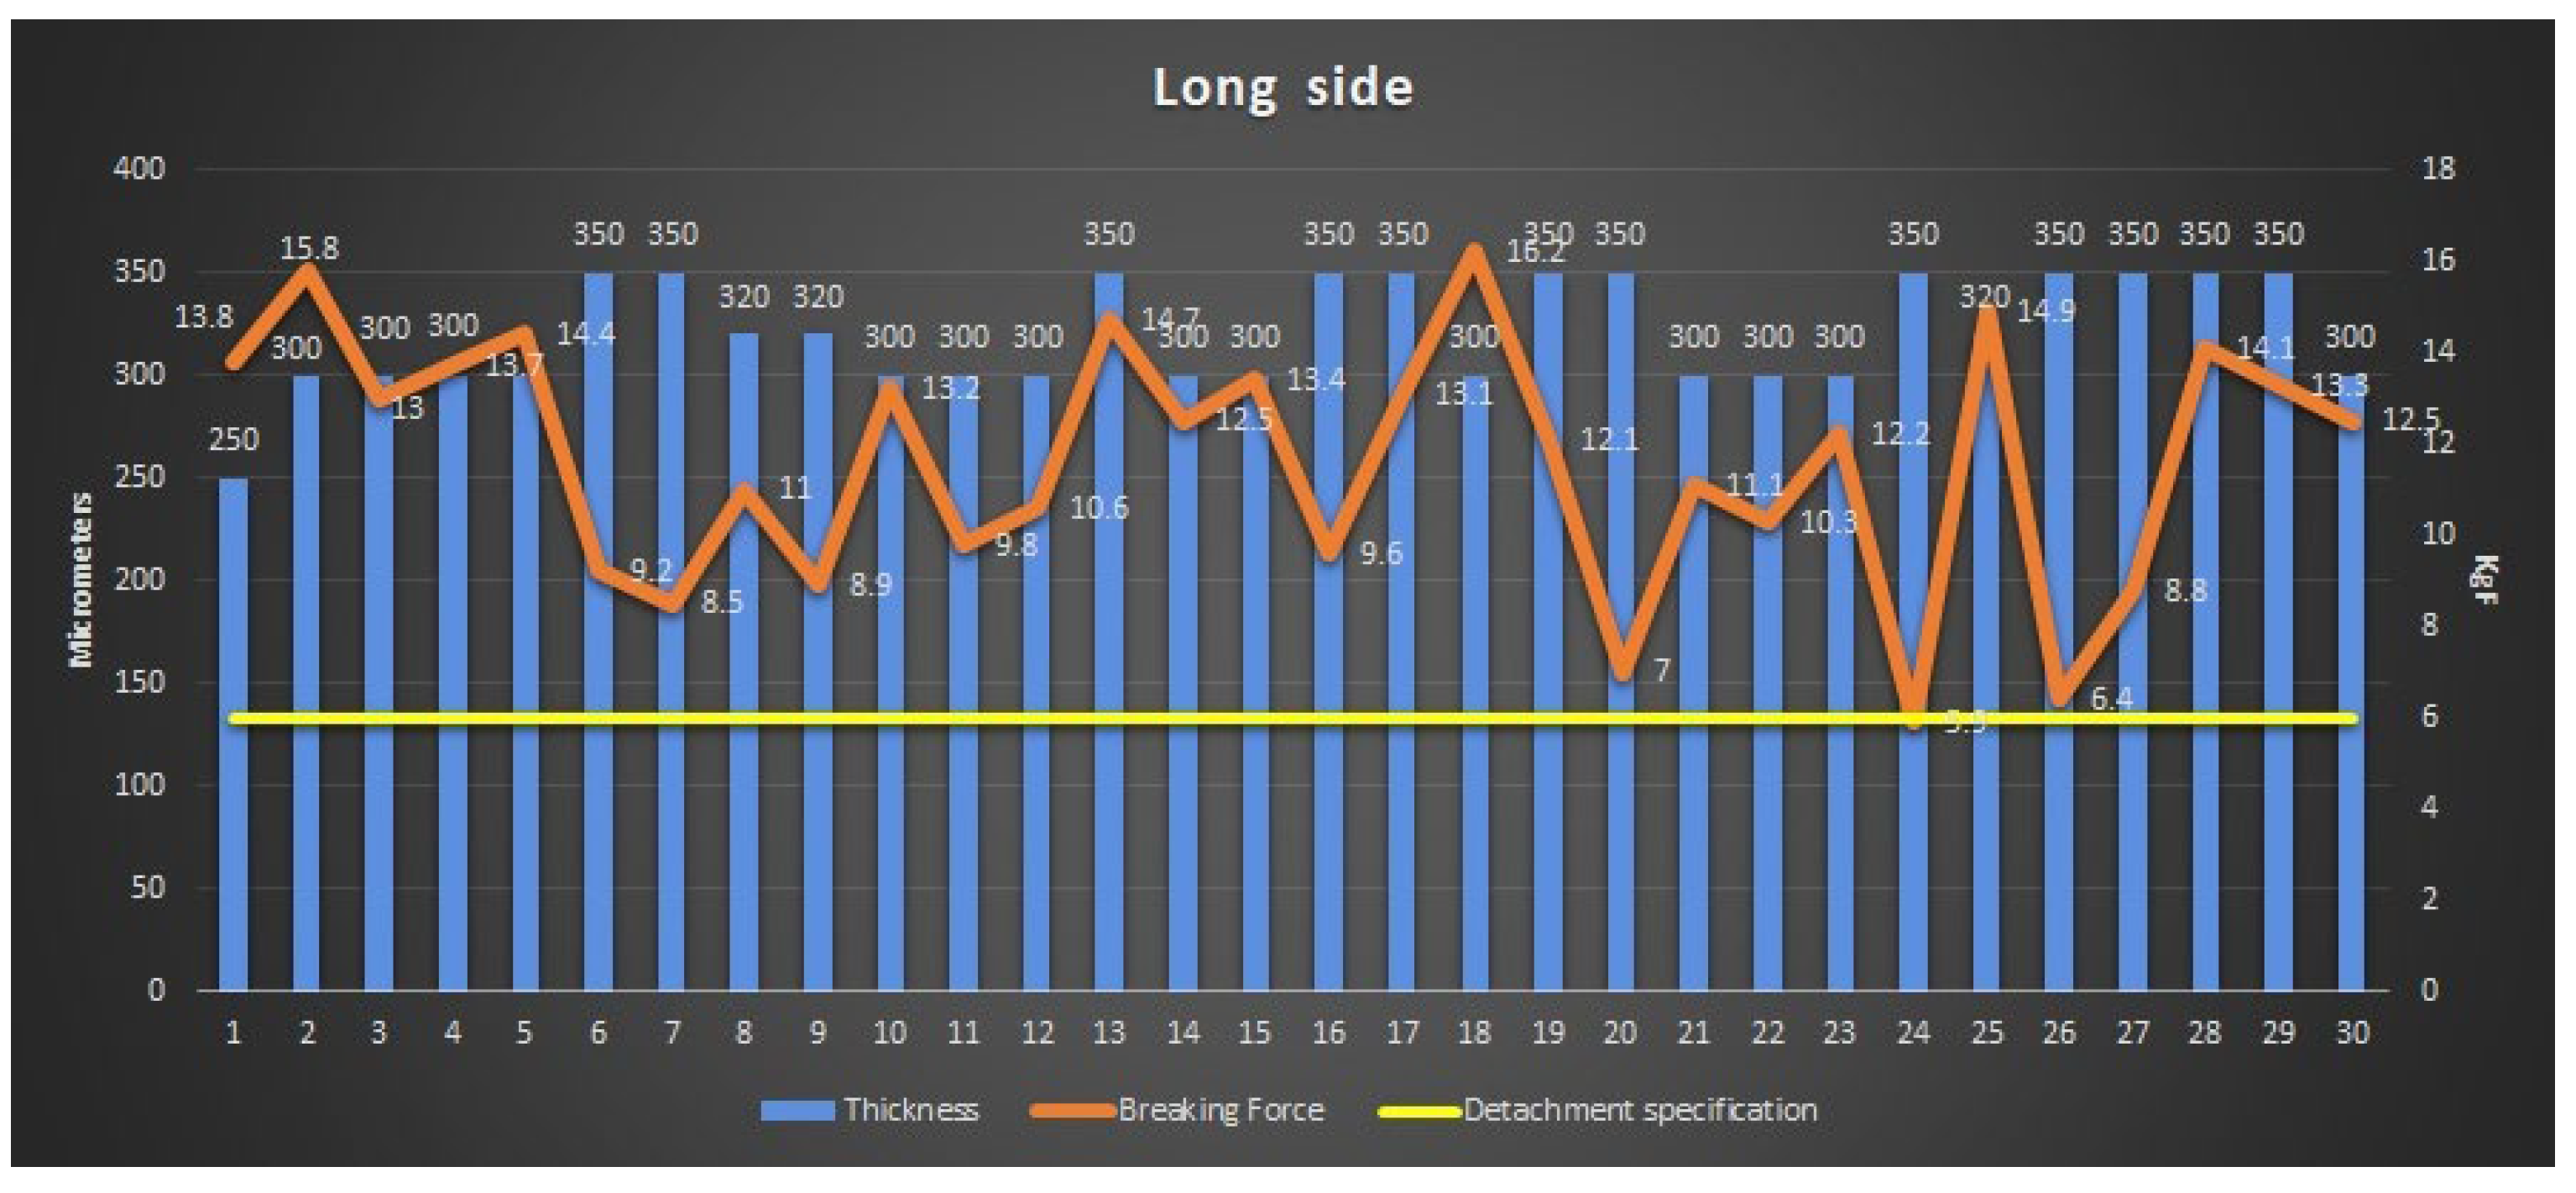
Figure 24.
Detachment force capability response to epoxy coating thickness increase, (a) Short side armature; (b) Long side armature.
Figure 24.
Detachment force capability response to epoxy coating thickness increase, (a) Short side armature; (b) Long side armature.
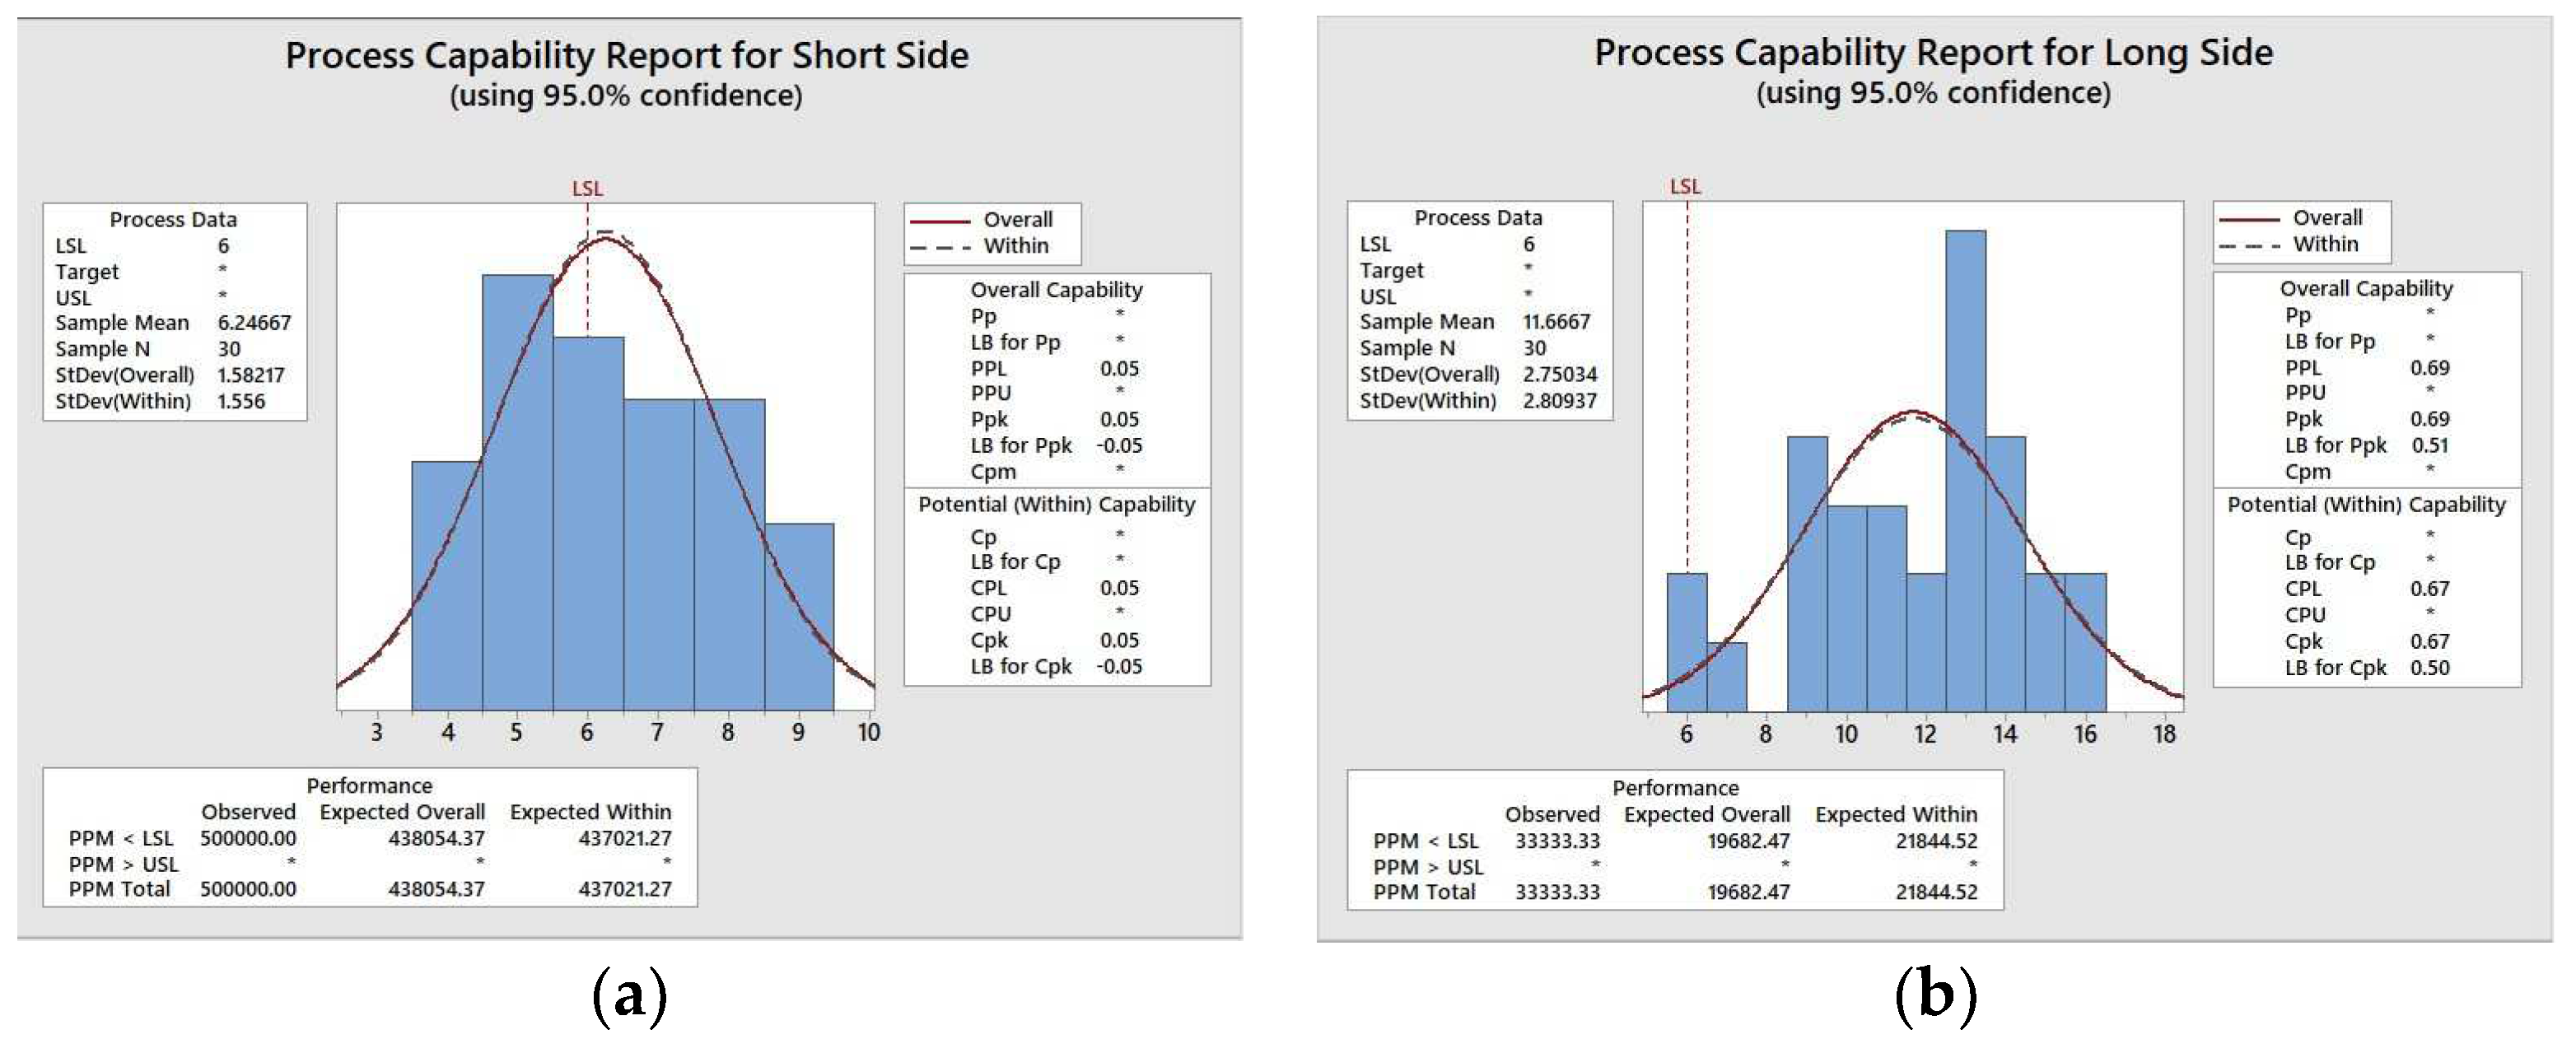
Figure 25.
Lamination face with burr.
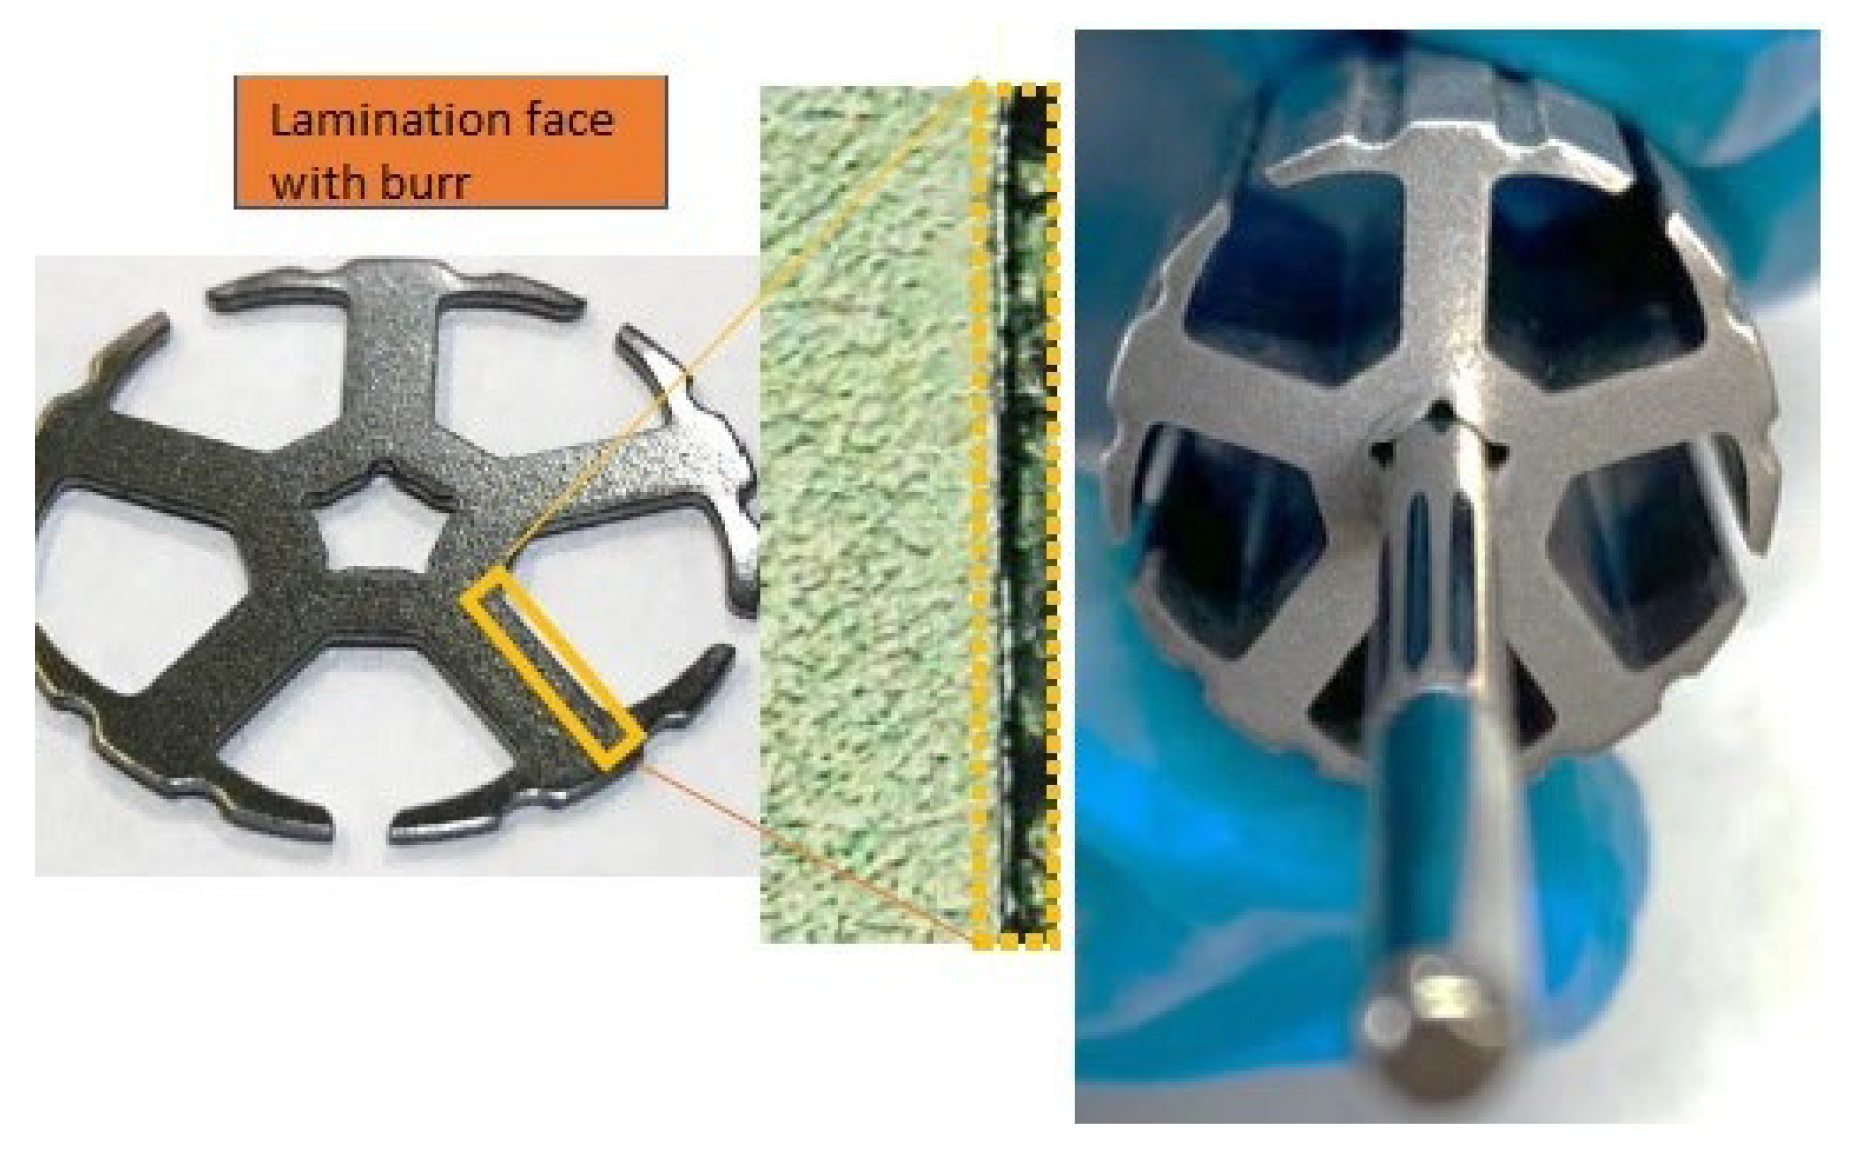
Figure 26.
Lamination face without burr.
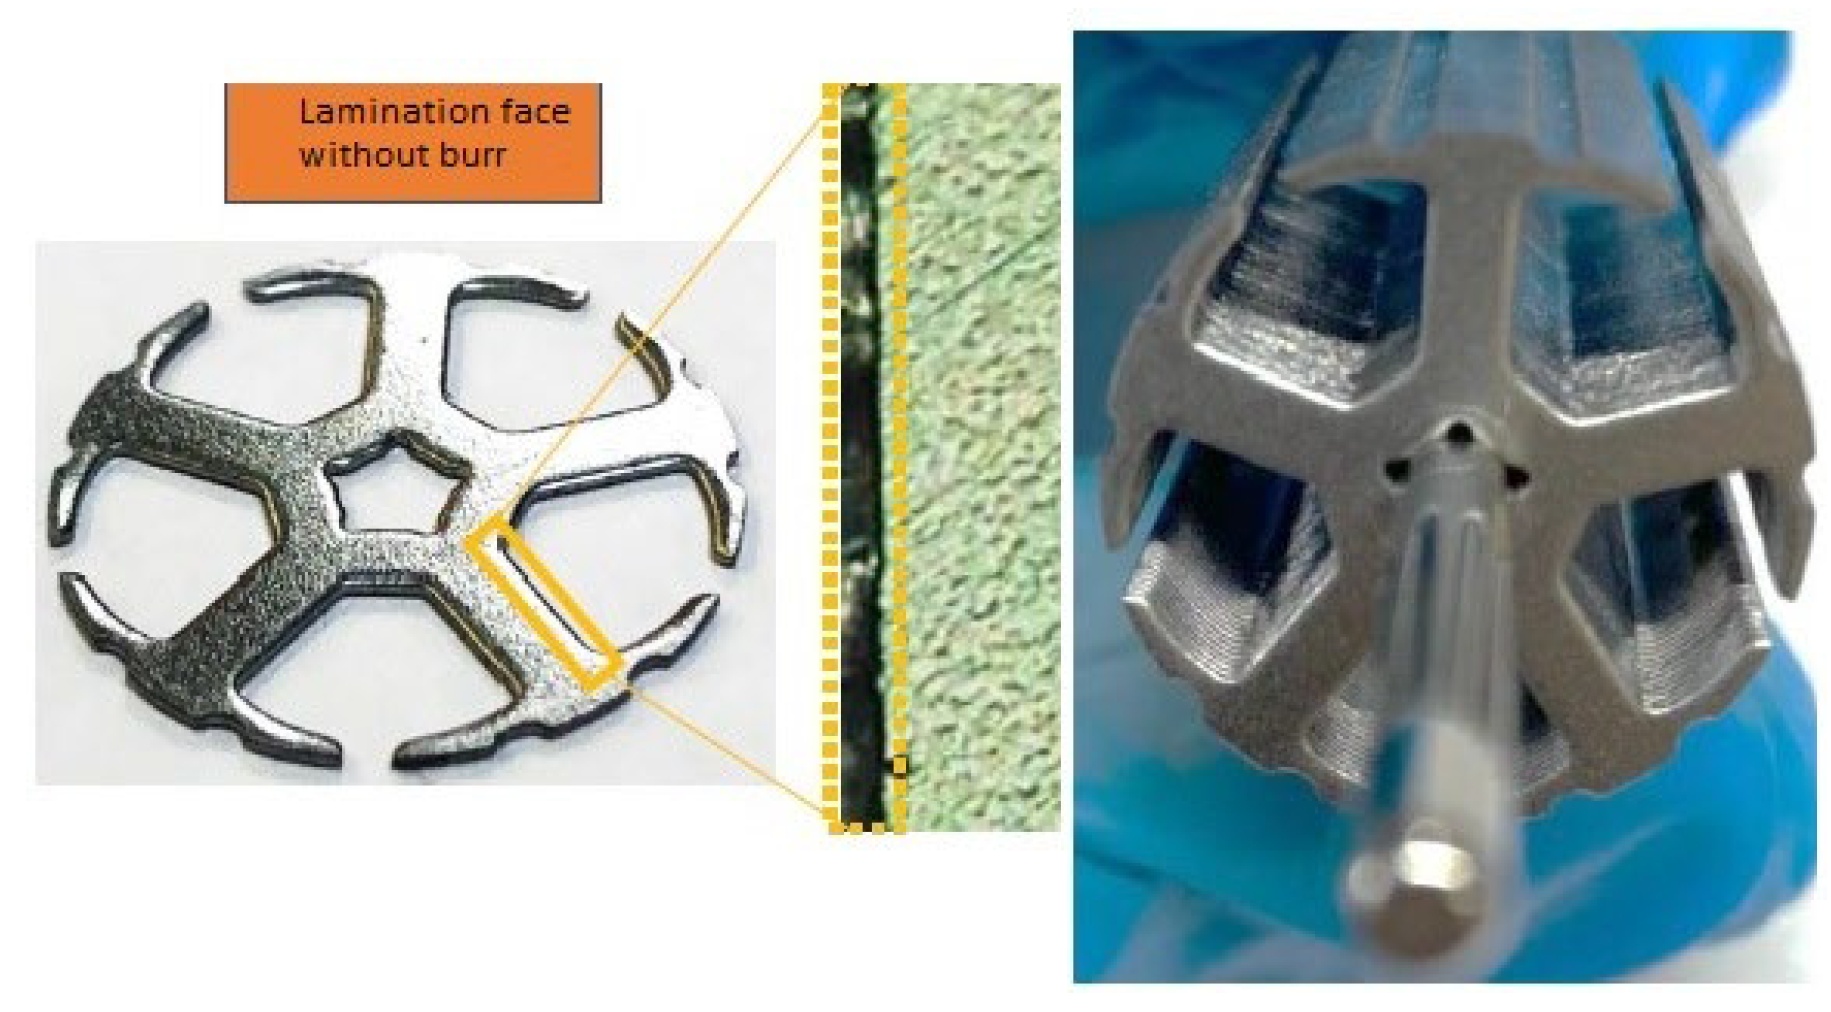
Figure 27.
Impact on breaking force of the short side armature due to inverting the lamination.
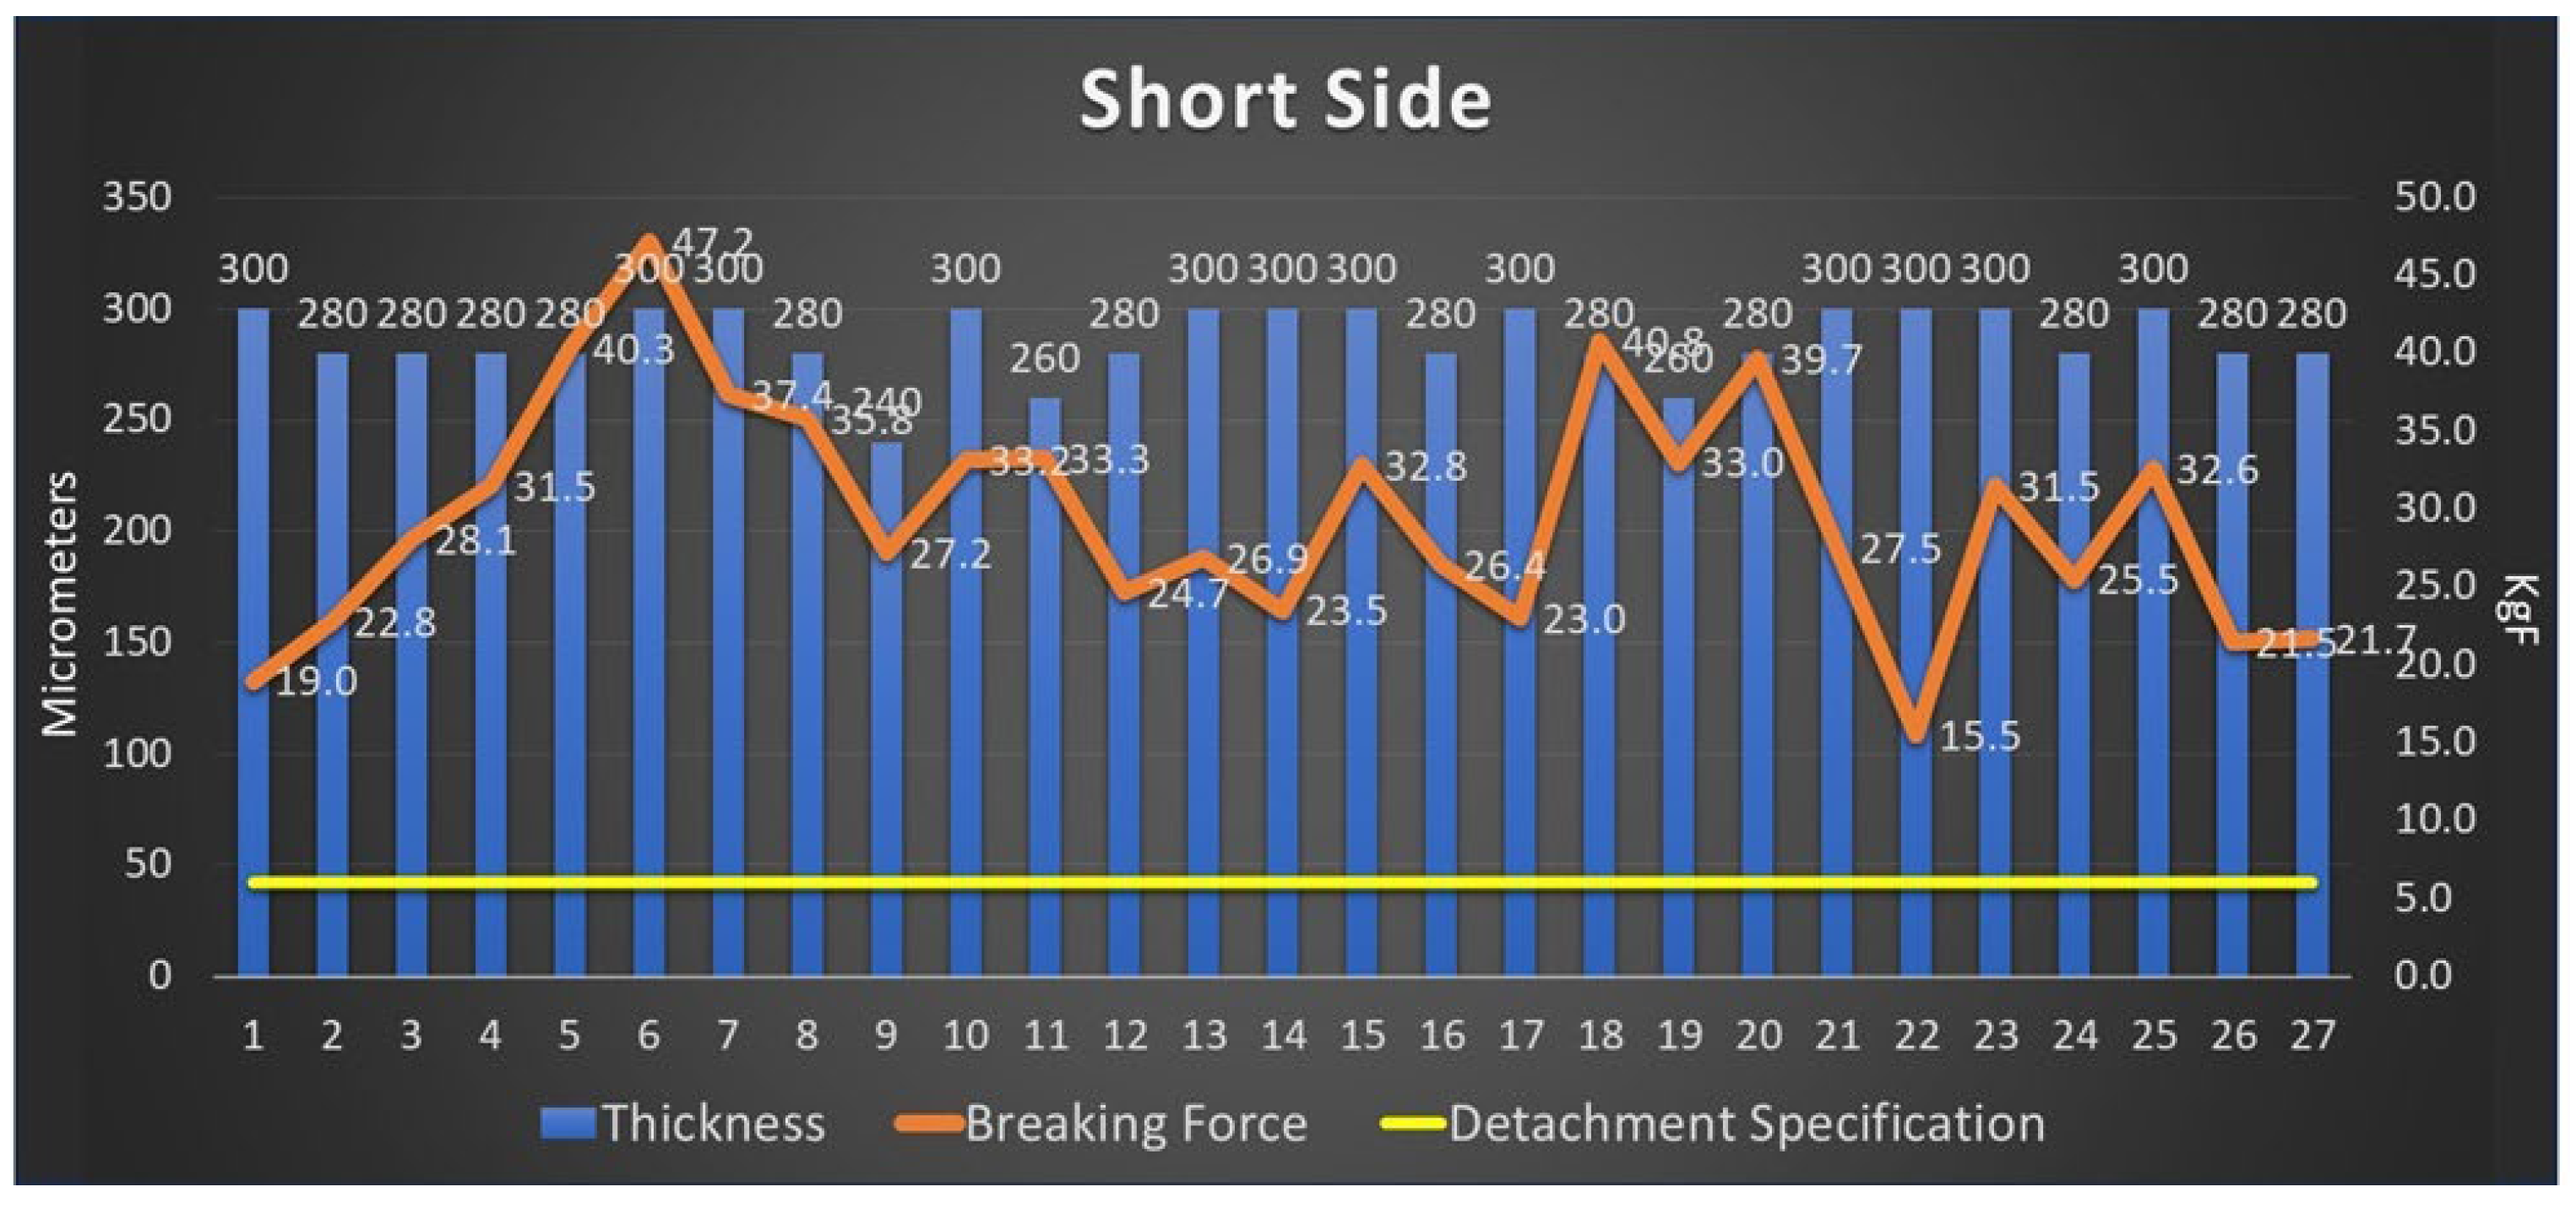
Figure 28.
Impact on breaking force of the long side armature due to inverting the lamination.
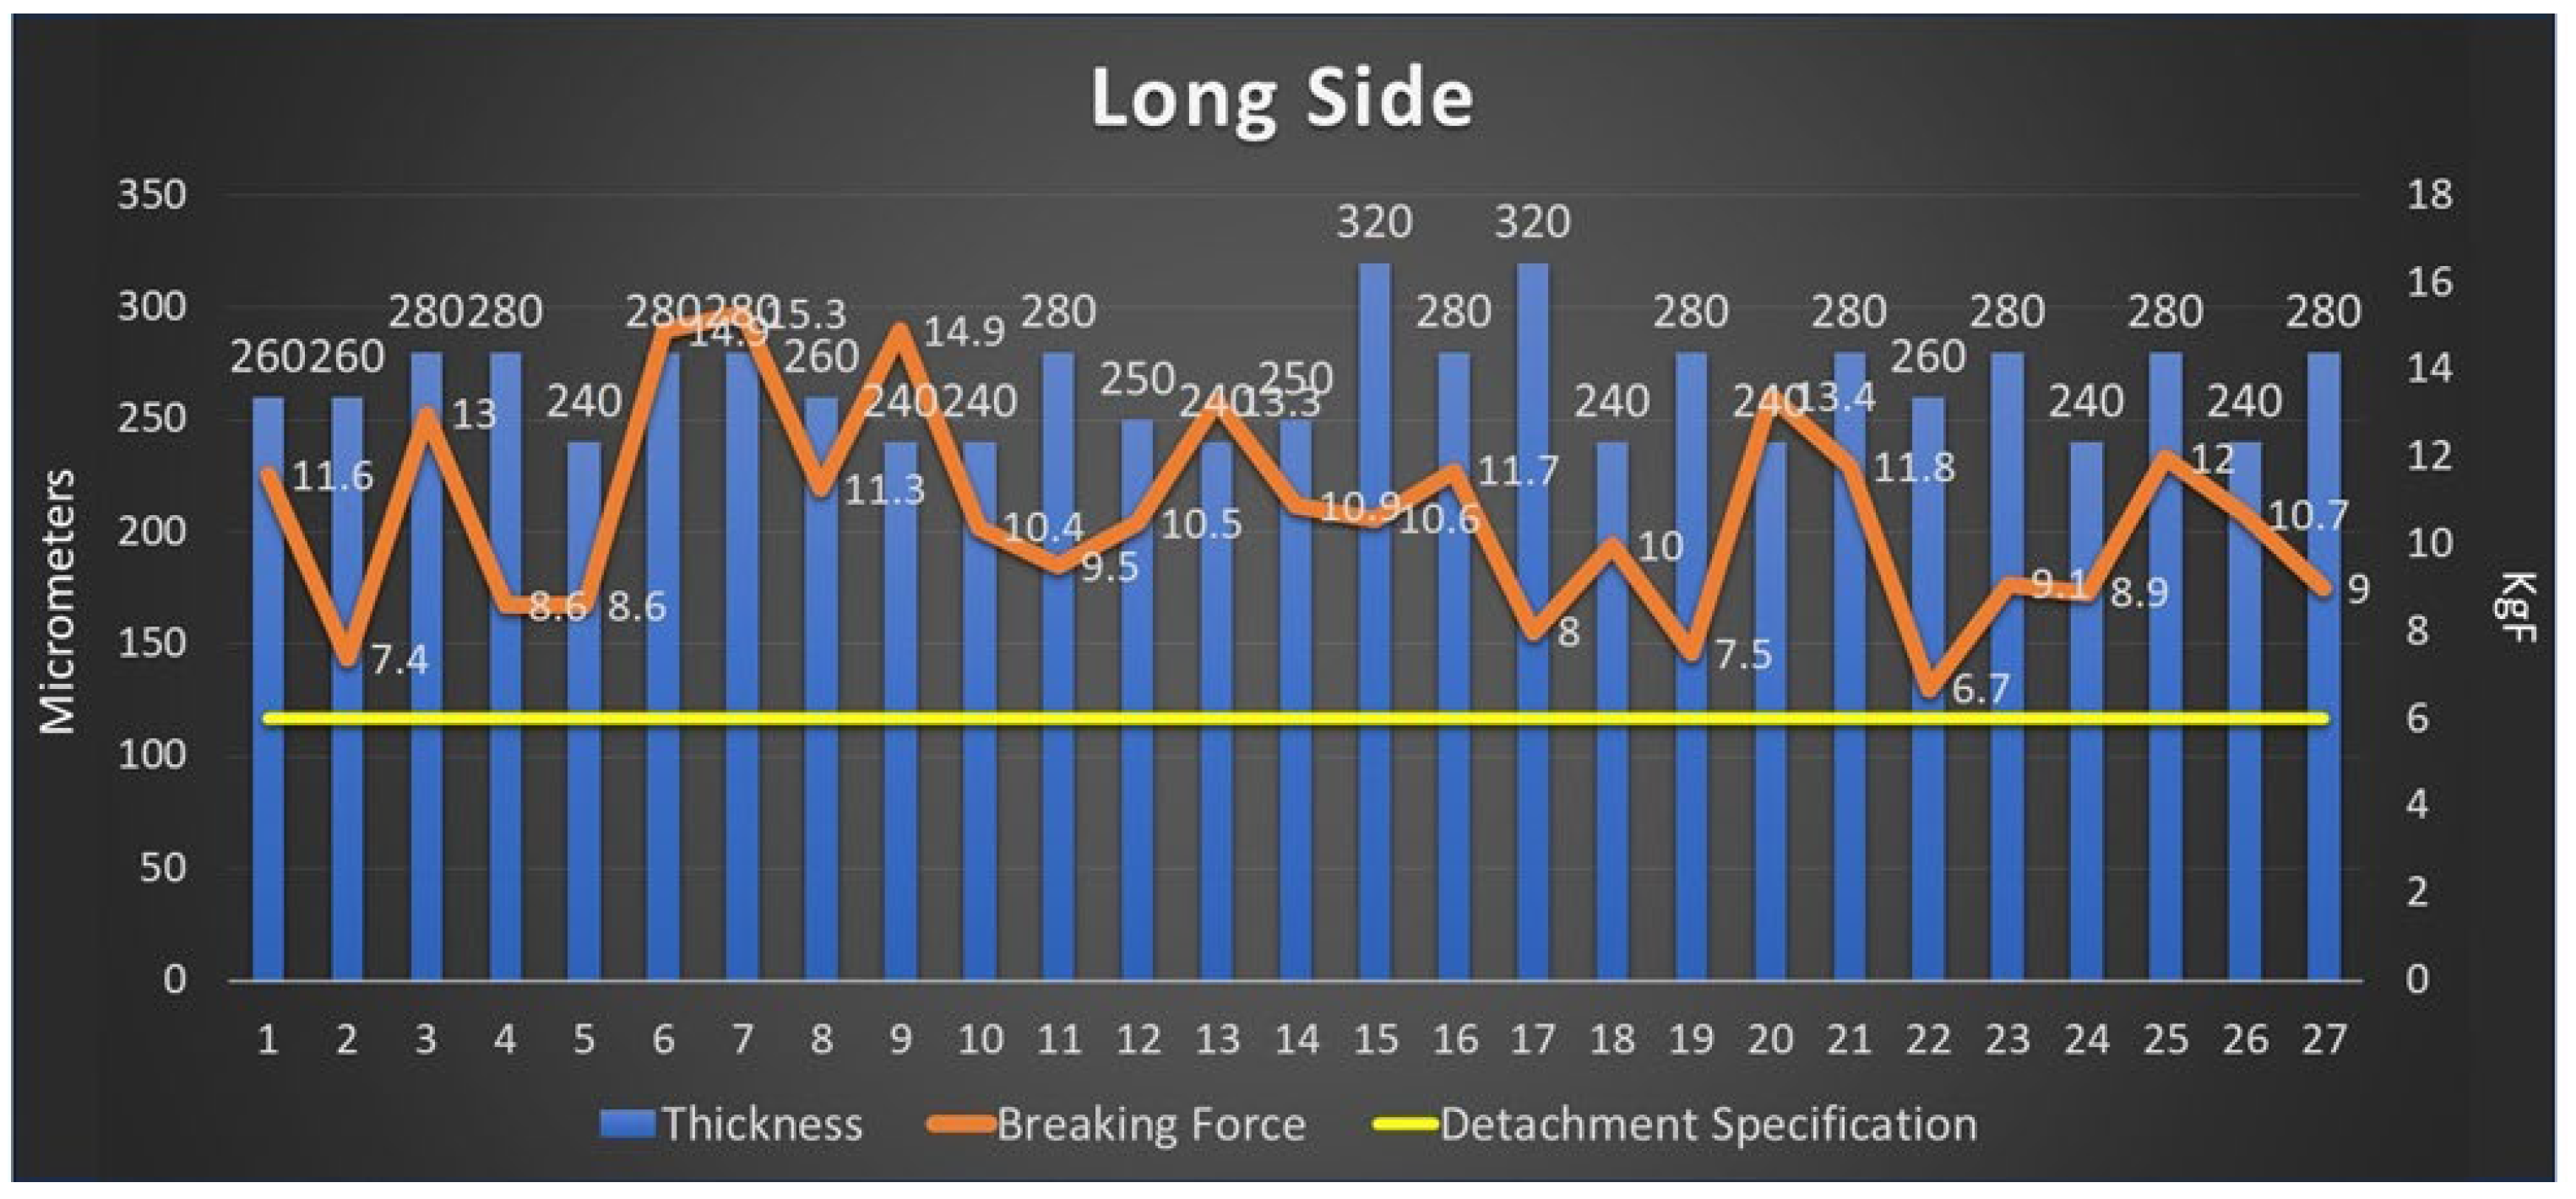
Figure 29.
Detachment force capability response to inverting the lamination, (a) Short side armature; (b) Long side armature.
Figure 29.
Detachment force capability response to inverting the lamination, (a) Short side armature; (b) Long side armature.
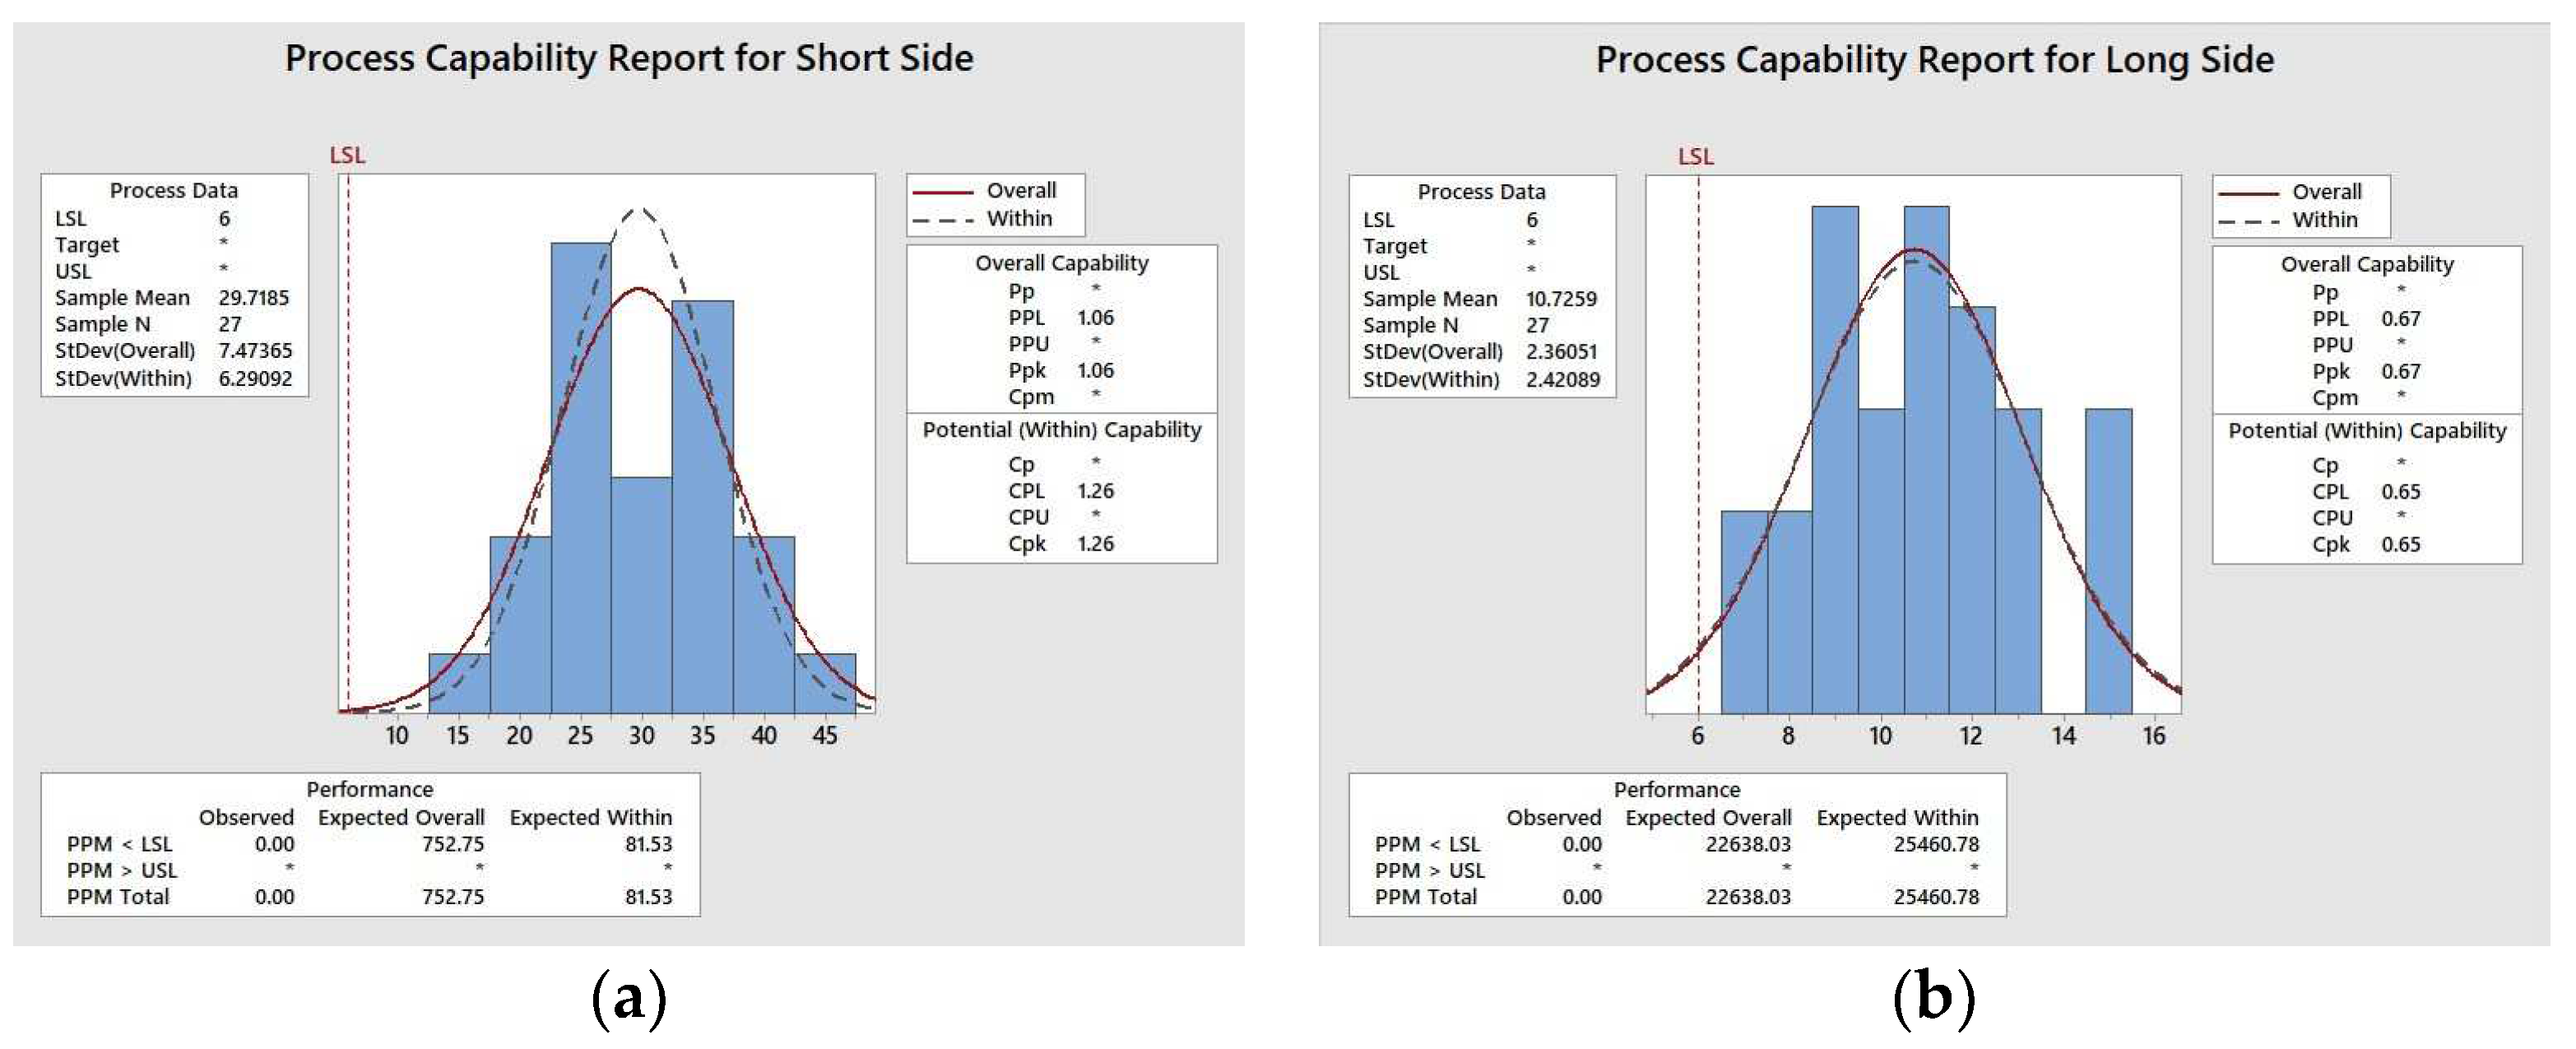
Figure 30.
DSC test on a virgin sample (without curing treatment).
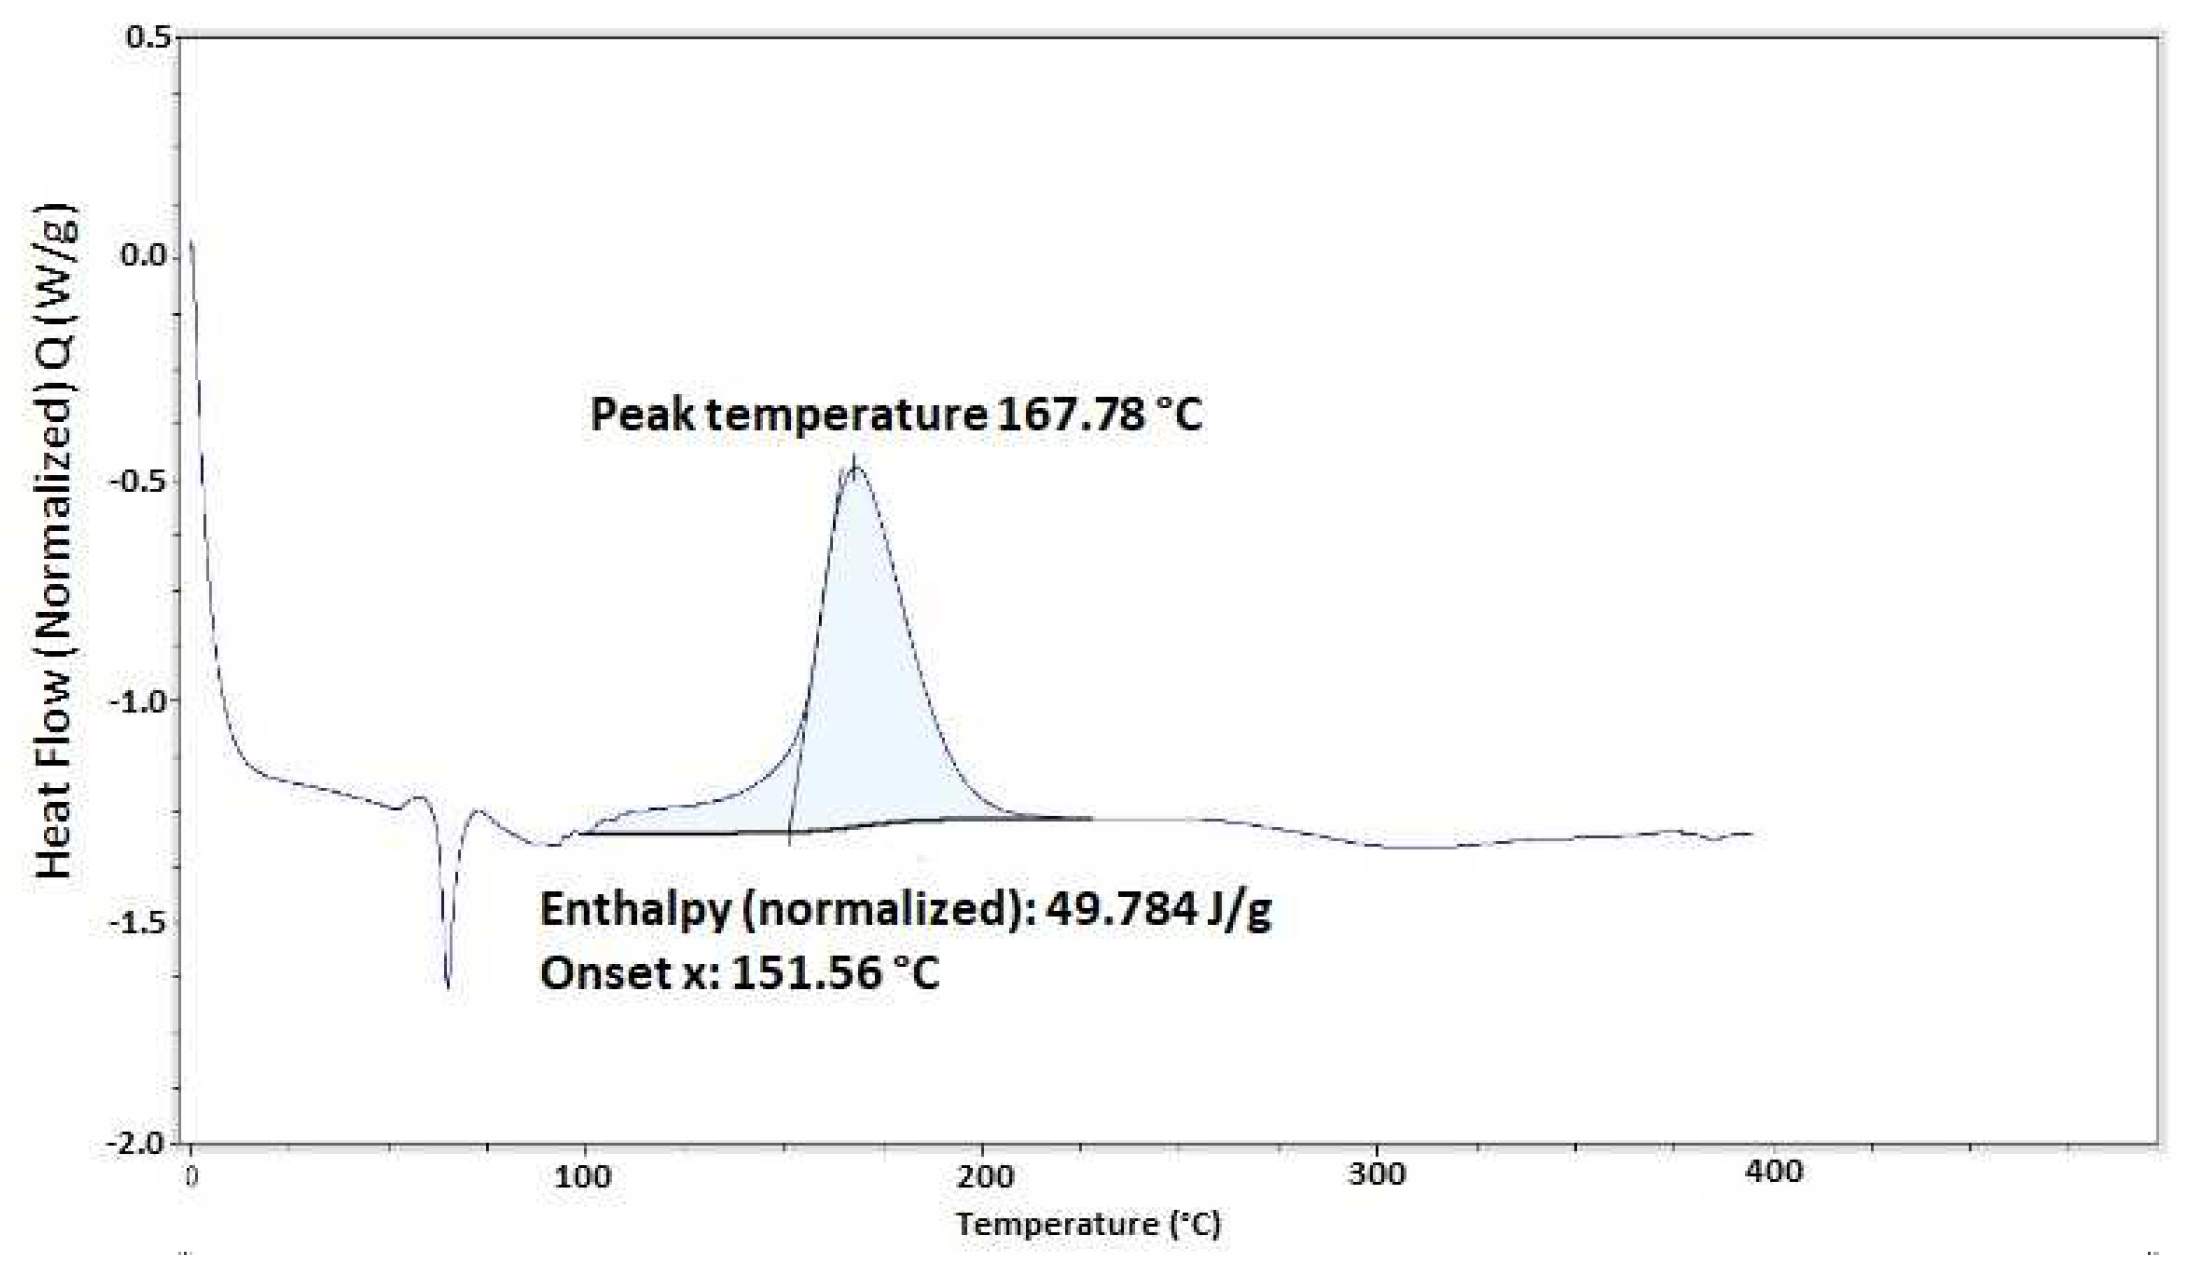
Figure 31.
DSC test on a cured sample.
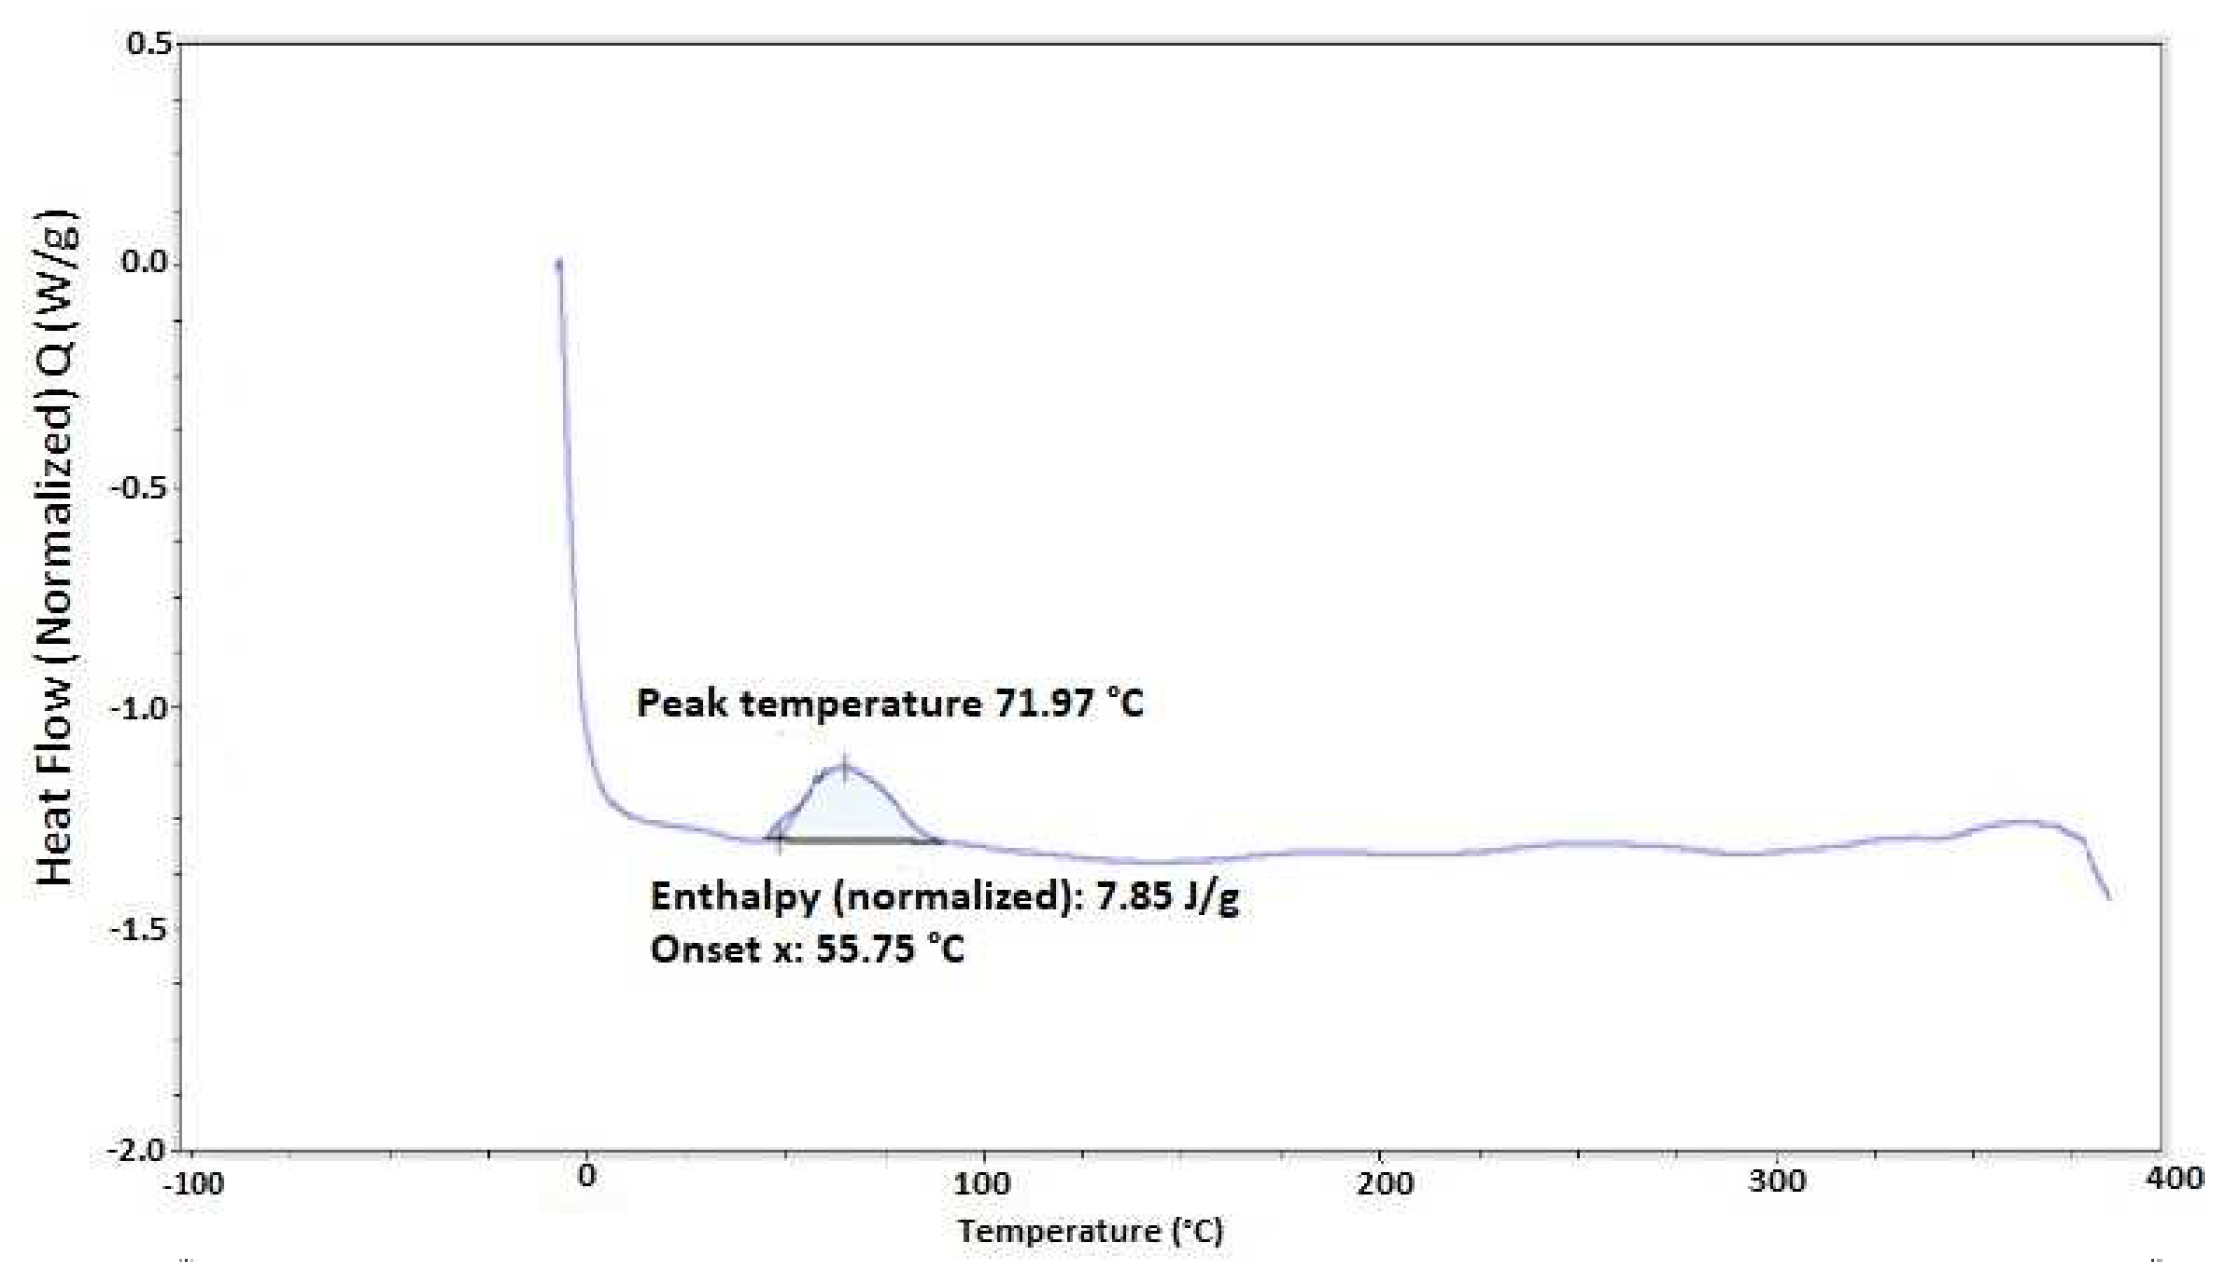
Figure 32.
Voltage vs. Curing Percentage, short side armature.
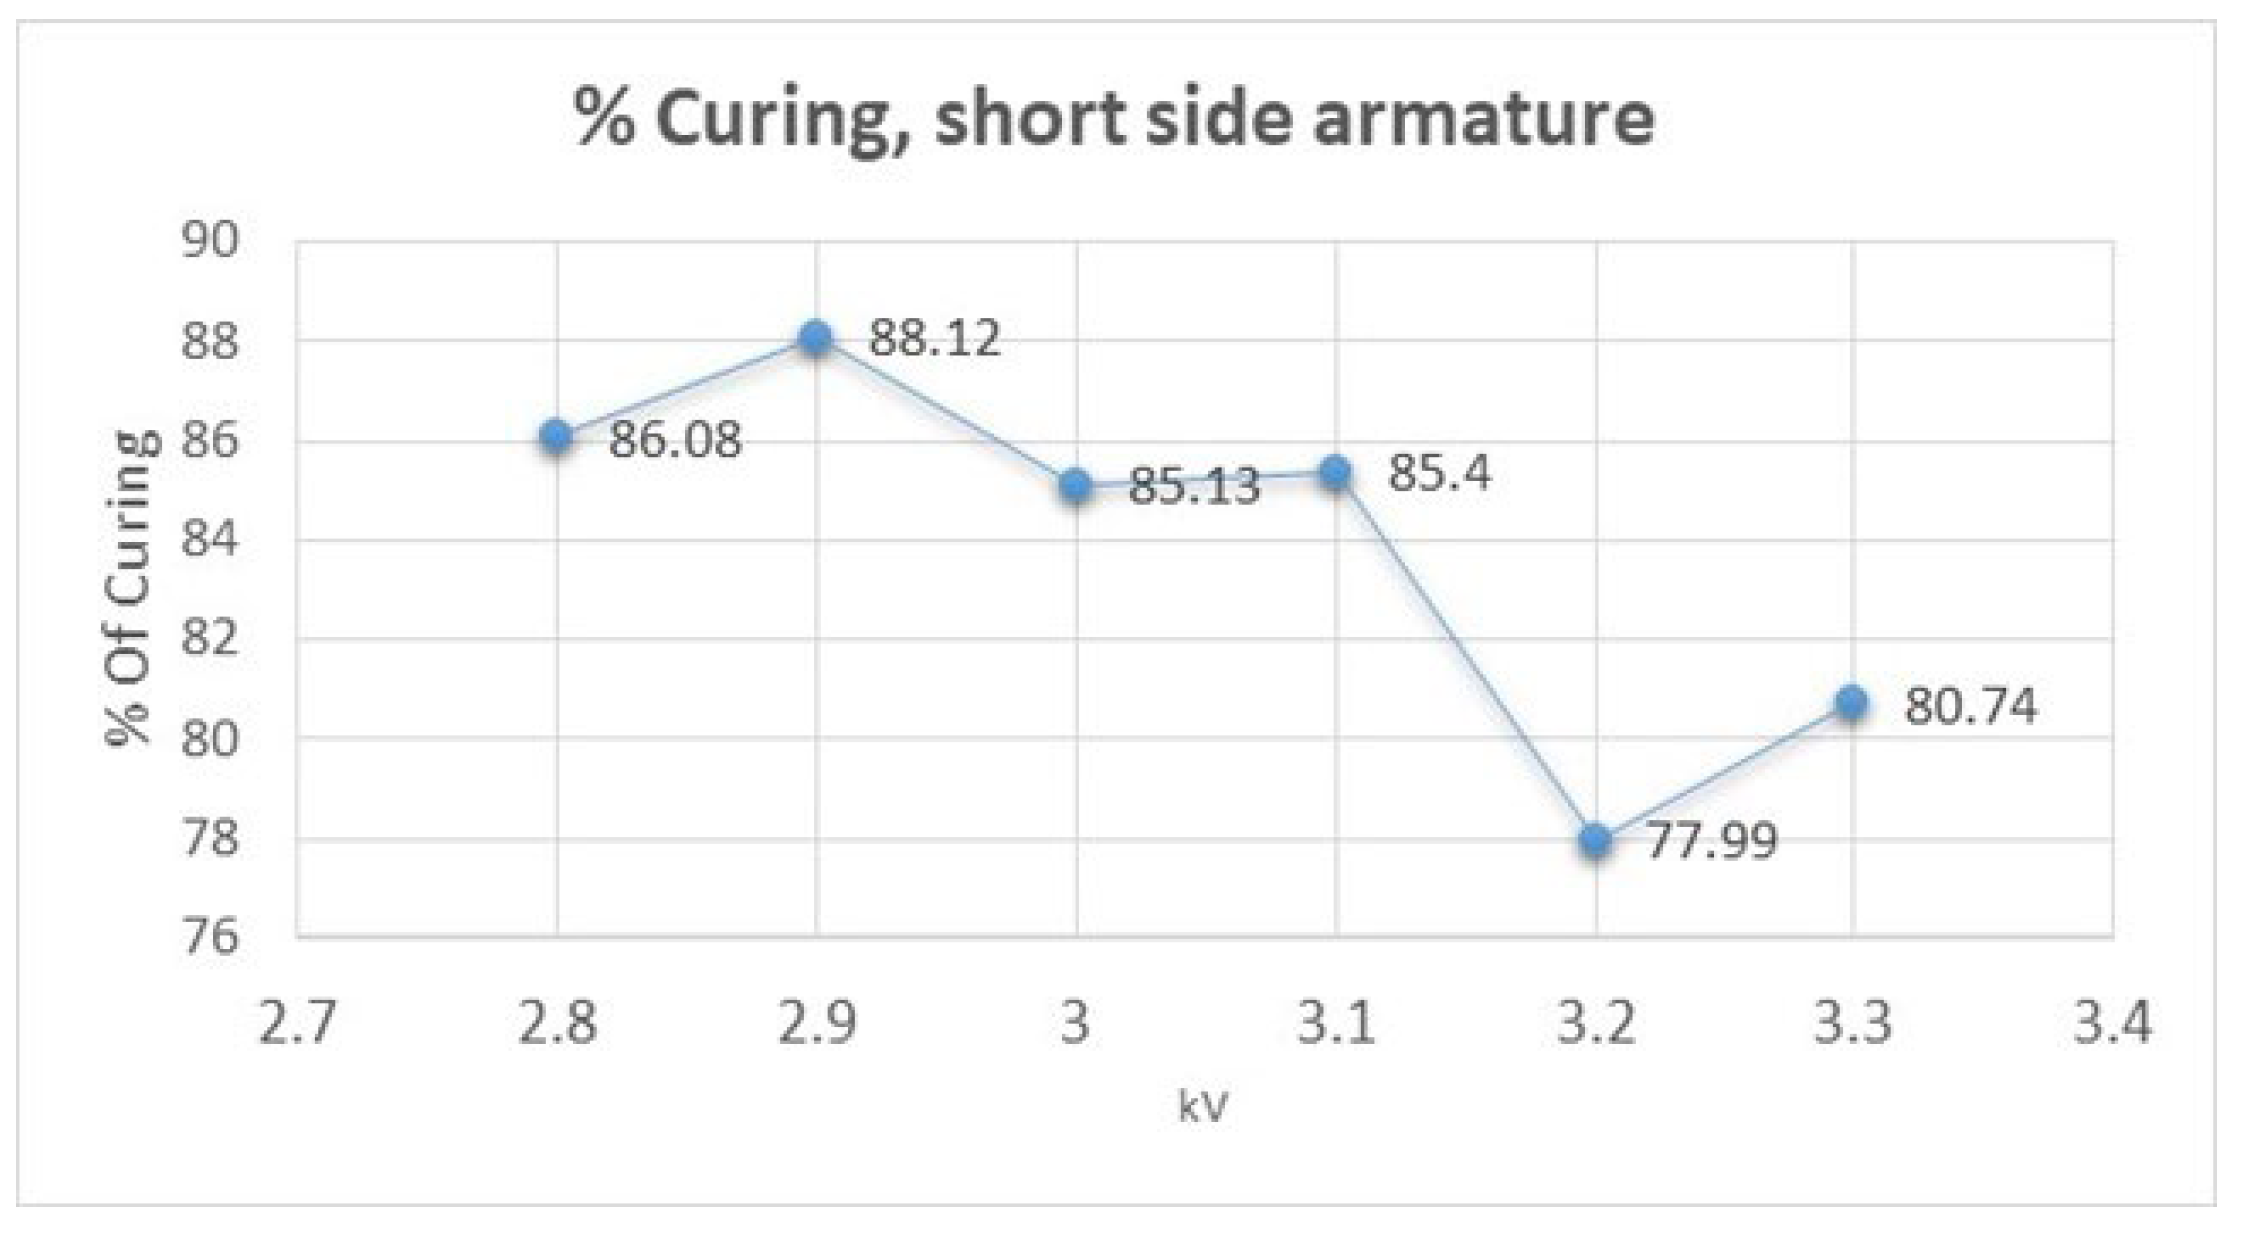
Figure 33.
Voltage vs. Curing Percentage, long side armature.
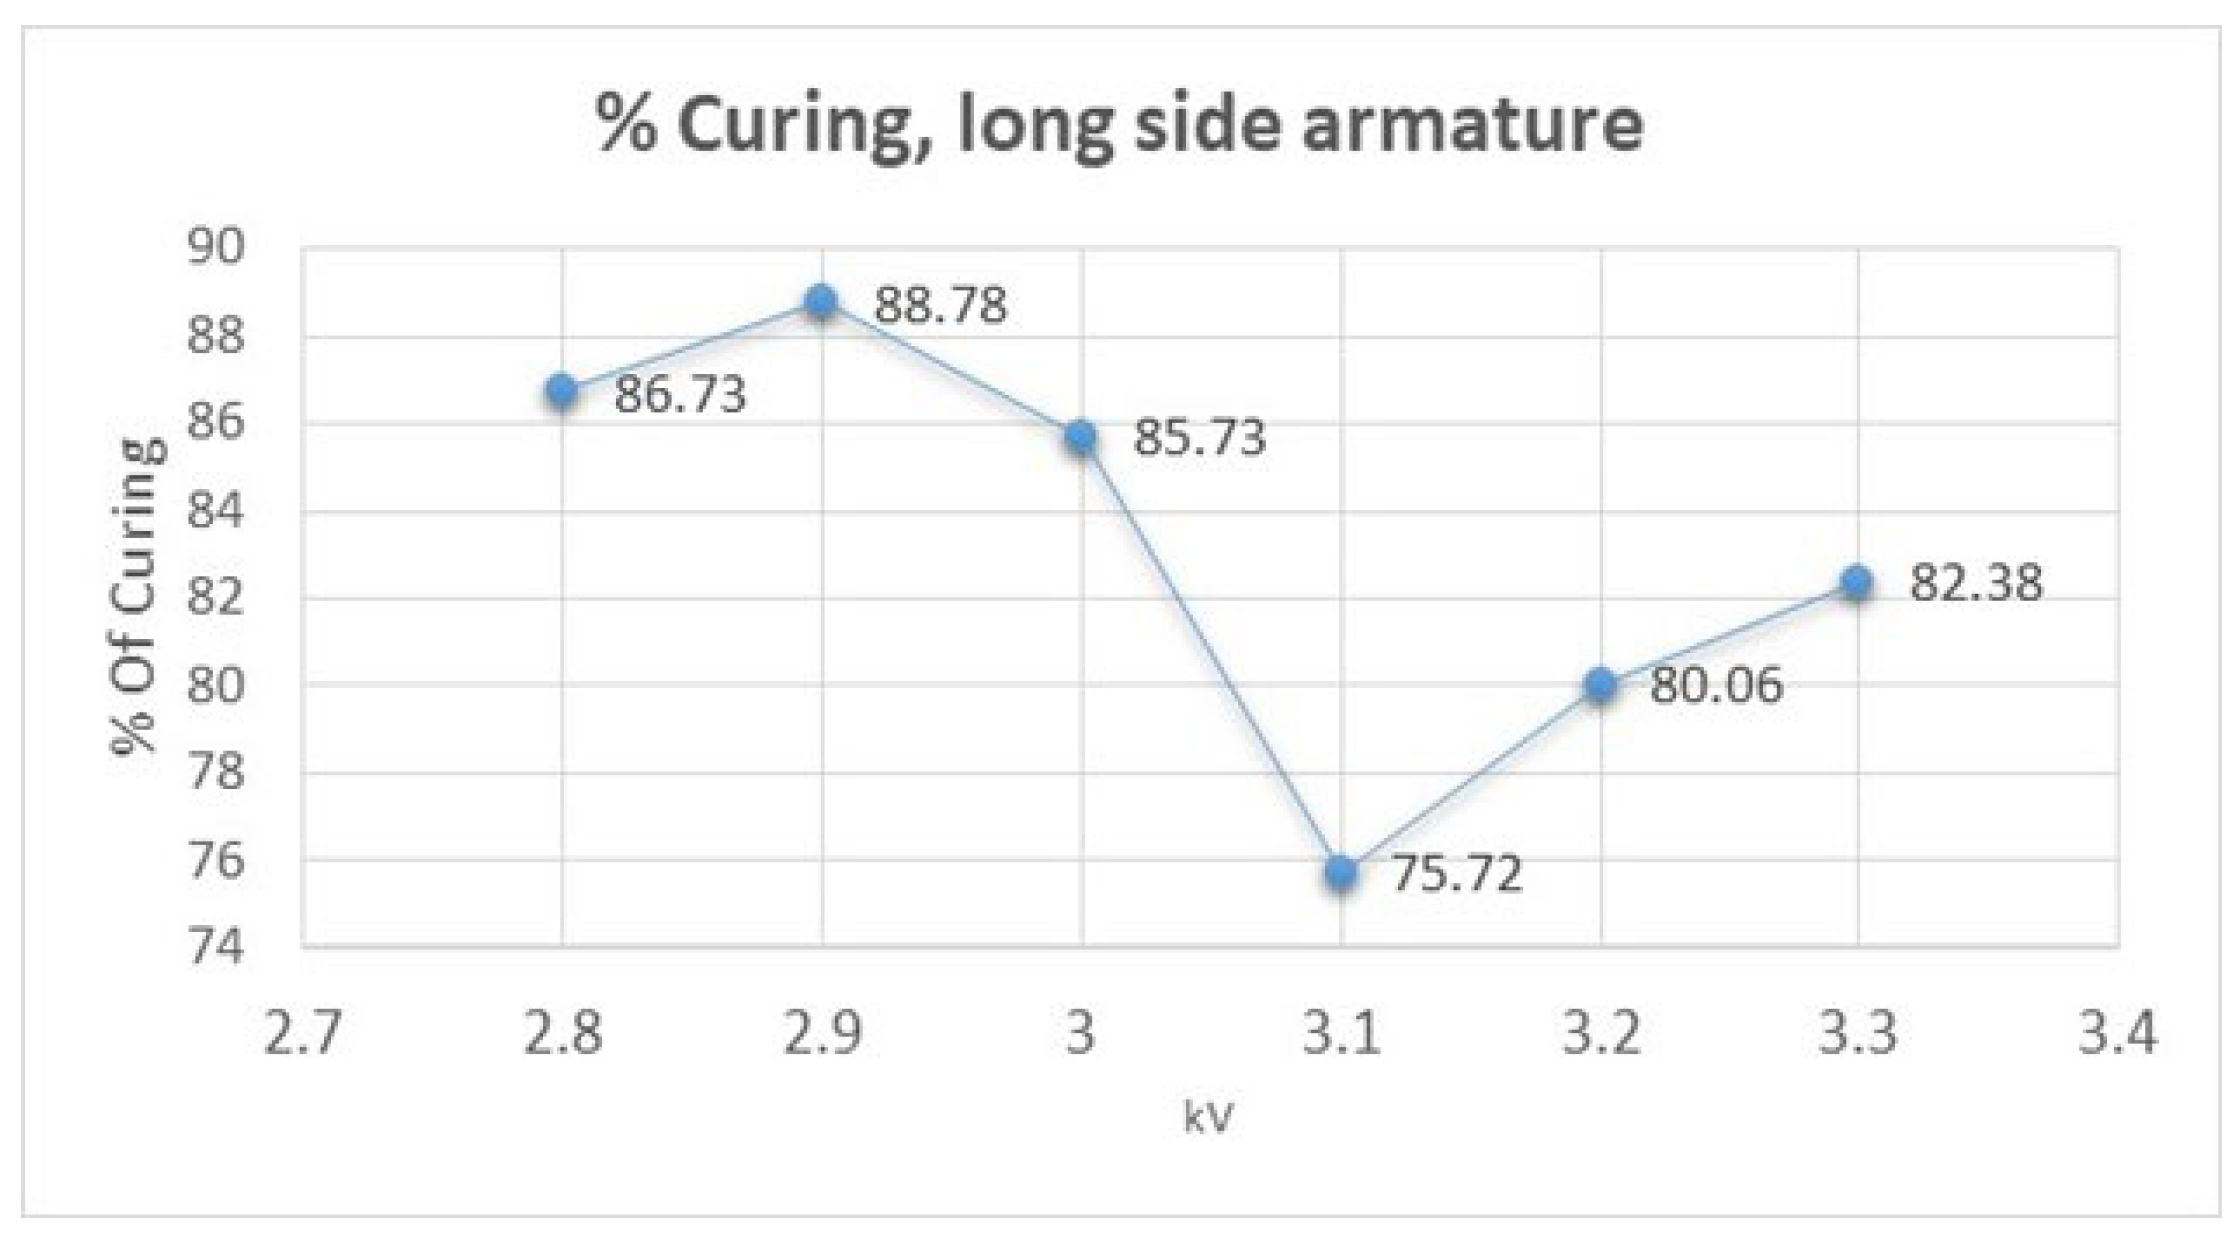
Figure 34.
Scrap per month, January-October 2022.
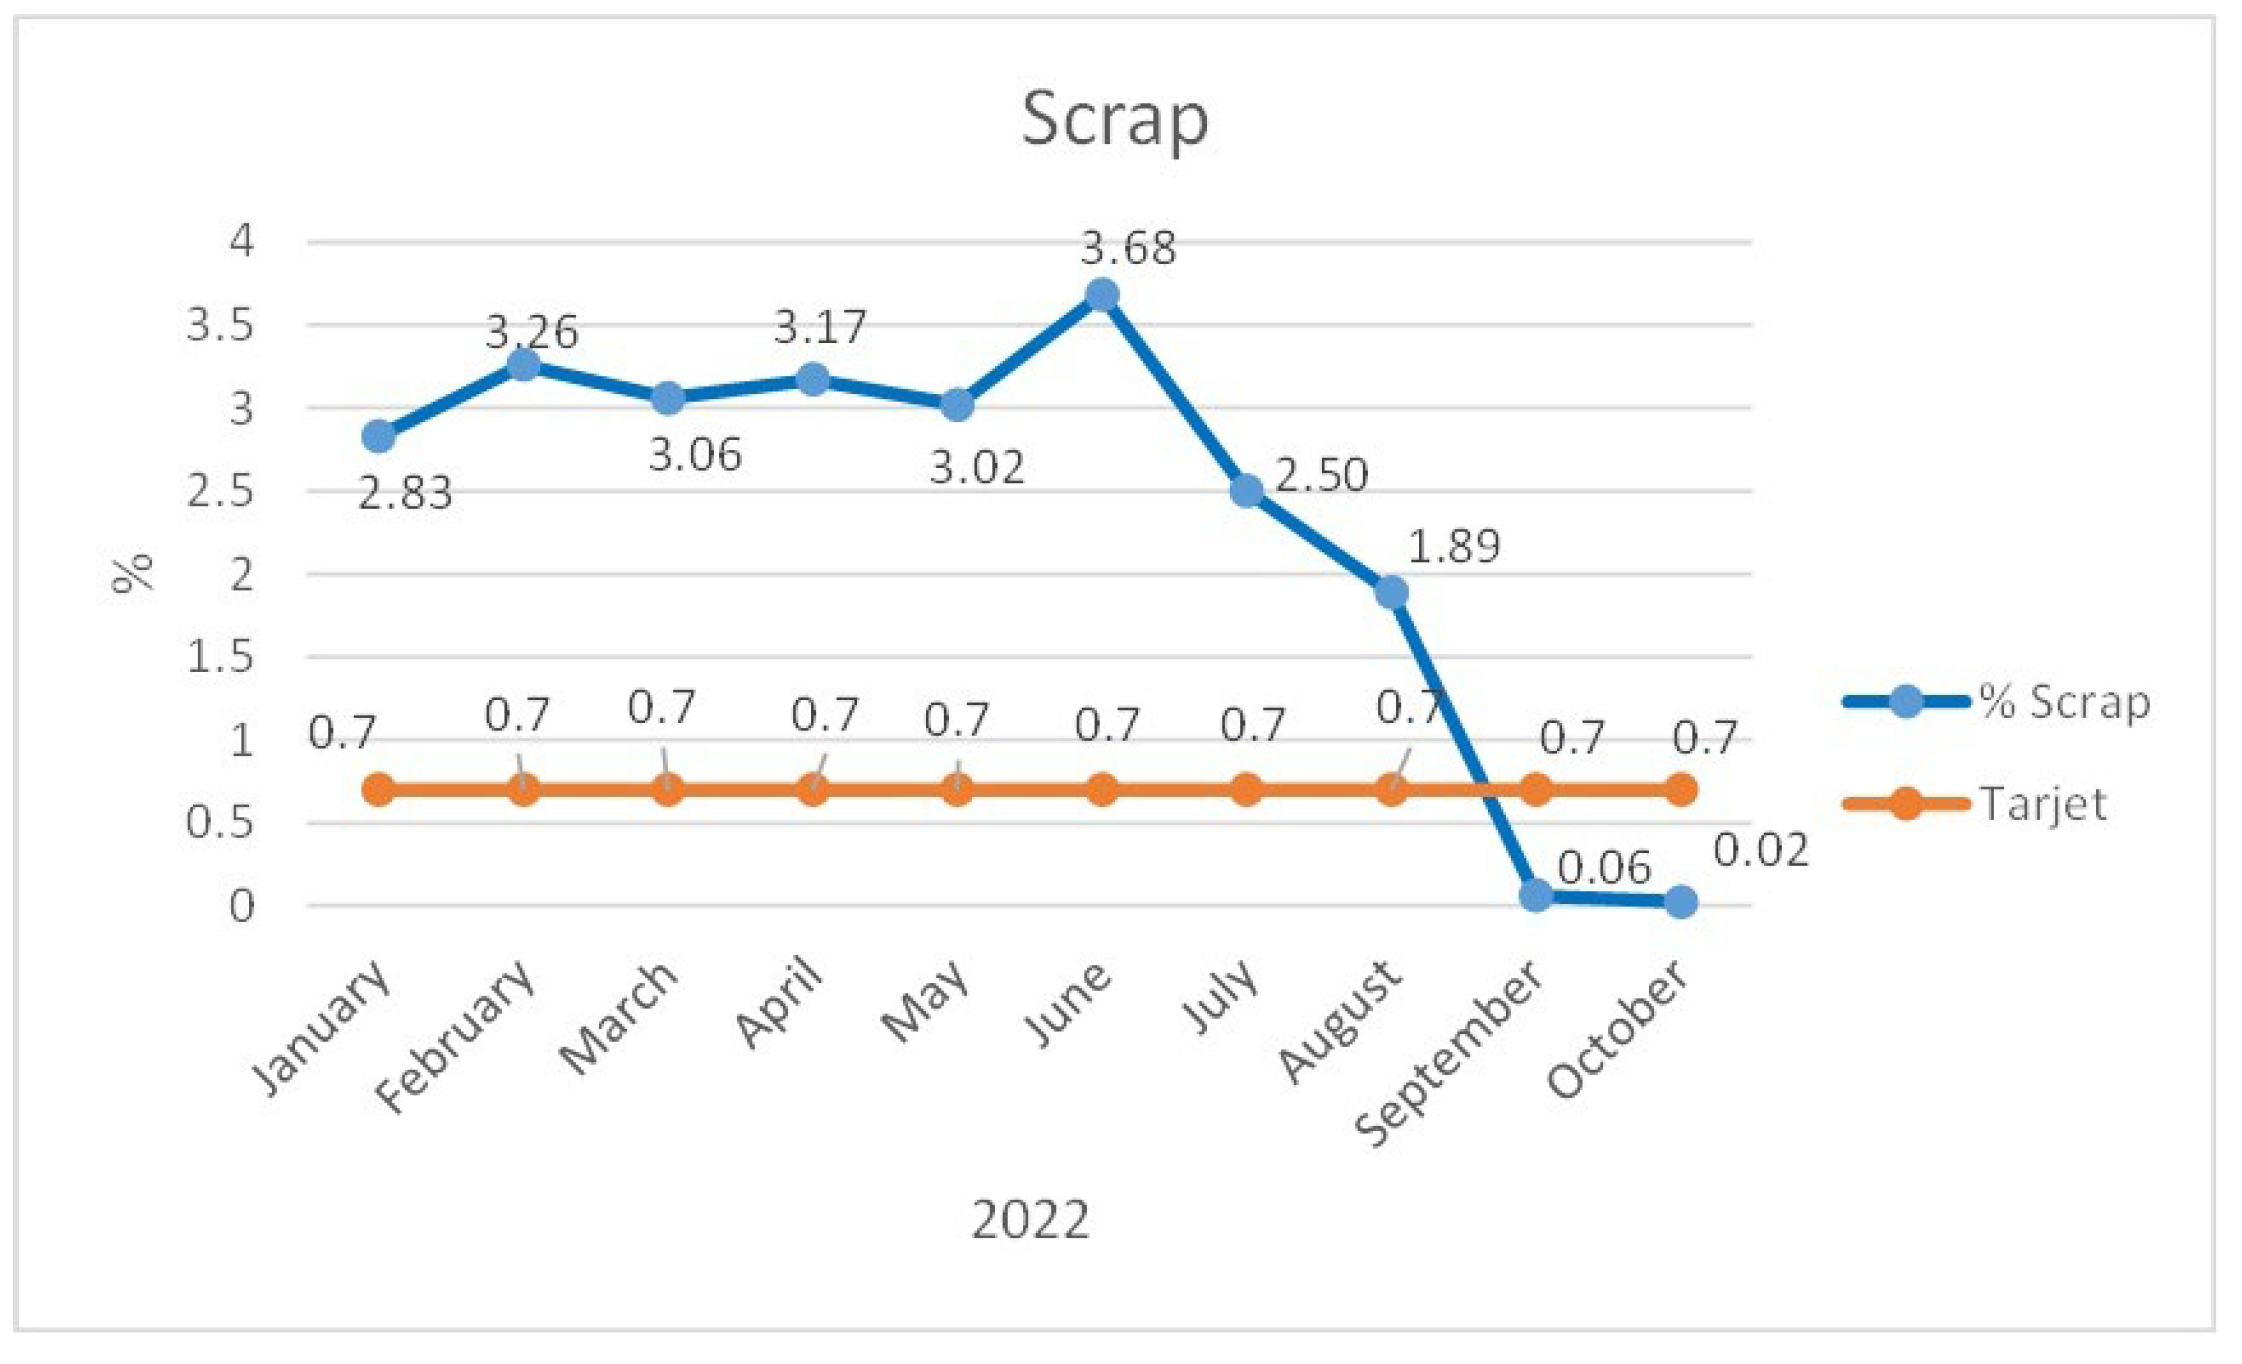

Table 1.
PDCA relationship with different six sigma tools.
| Six Sigma Tool | Description | PDCA Relationship |
|---|---|---|
| Fishbone Diagram | Identifies and visualizes potential causes of problems or defects | Plan phase (P): Analyze problem causes and minimize discrepancy probability [20]. |
| Business Process Mapping | Visualizes top-down business operations, offering reflection and clarity. | Do phase (D): Test hypotheses (proposed solutions) by mapping out identified processes. These maps, spanning from initial requests to high-volume manufacturing, enable effective testing [21]. |
| DMAIC | Structured methodology (Define, Measure, Analyze, Improve, Control) for process improvement and problem-solving. | Adaptation of PDCA: Brito et al. [22] propose that DMAIC adapts the PDCA cycle for Six Sigma projects. |
| DFSS (Design for Six Sigma) | A systematic approach to designing new products or processes with a focus on “problem prevention”. | DMADV (Define, Measure, Analyze, Design, Verify): This methodology, often considered the next stage of DMAIC, utilizes PDCA principles in design [23]. |
| Process Capability Analysis (PCA) | Statistical analysis assessing a process’s ability to meet customer requirements. | Check phase (C): Analyze process capability (e.g., using Cpk Index) and confirm stability using tools like XR charts. |
| 5W1H | Question-posing and problem-solving method for gaining deeper understanding through diverse perspectives. | Do phase (D): After identifying the dominant cause (why, what needs improvement), plan improvement steps (how, who, where, when). This targeted approach leads to more effective action [24]. |
| Logistic Analysis Regression | Estimates the probability of an event occurring based on independent variables. | Research example: Zhong et al. [25] use this to demonstrate significant influences of factors like sex and education on PDCA cognition in clinical department managers. |
Table 2.
Utilizing 5w + 2H to understand the company´s current situation.
| QUICK RESPONSE PDCA | |
|---|---|
| Problem description by customer / Location of the problem: During hi-pot testing, armatures fail due to cable contact with laminations when winding are introduced. This creates continuity between the cable and metal part. WHAT IS THE PROBLEM? > Use 5W + 2H to know what is the Current Situation (C/S) ? | |
| Customer view | |
| |
Defective part: Fails hi-pot test, alarm triggered, cable contacts laminations. | |
| |
Table 4.
Parameter matrix of production process phases.
| Transfer time | Laminating degreasing | ||||||||||||||
|---|---|---|---|---|---|---|---|---|---|---|---|---|---|---|---|
| Parameter | Worm gear velocity |
Voltage across heating resistor |
Resistor temperature (start) | Resistor temperature (middle) | Resistor temperature (end) | Air pressure | |||||||||
| Units | Seconds | Kilovolts | °C | °C | °C | Kpa | |||||||||
| Max | 4.1 | 2.7 | 33 | 129 | 202 | 0.55 | |||||||||
| Min | 4 | 2.7 | 30 | 112 | 166 | 0.55 | |||||||||
| Average | 4.08 | 2.7 | 32.14 | 123 | 187 | 0.55 | |||||||||
| Epoxy addition | |||||||||||||||
| Parameter | Coat 1 Pressure | Coat 2 Pressure | Feeder pressure | Vacuum pressure | Guide rail 1 distance | Guide rail 2 distance | Electrostatic box | ||||||||
| Units | kPa | kPa | kPa | °C | mm | mm | Kilovolts | ||||||||
| Max | 0.1 | 0.1 | 0.16 | 0.1 | 3.5 | 2 | 61 | ||||||||
| Min | 0.06 | 0.06 | 0.14 | 0.1 | 3.5 | 2 | 61 | ||||||||
| Average | 0.04 | 0.04 | 0.151 | 0.1 | 3.5 | 2 | 61 | ||||||||
| Epoxy addition | Epoxy curing | ||||||||||||||
| Parameter | Water Pressure |
Voltage across heating resistor |
Resistor temperature (start) | Resistor temperature (middle) | Resistor temperature (end) | ||||||||||
| Units | kPa | Kilovolts | °C | °C | °C | ||||||||||
| Max | 0.4 | 3 | 39 | 212 | 272 | ||||||||||
| Min | 0.4 | 3 | 37 | 163 | 264 | ||||||||||
| Average | 0.4 | 3 | 38.28 | 192.14 | 271.42 | ||||||||||
Table 3.
3 legged 5 why analysis.
| Issue description: | ||
|---|---|---|
| The armature subassembly production line reports came to a halt due to failing hi-pot tests | ||
| Details: During the specific process of checking armature resistance, varistor function, and performing a hi-pot test, the machine triggered an alarm for a defective part. This triggered further investigation: | ||
| The high-potential tester’s alarm blared, alerting operators to a part failing the crucial insulation test. | ||
| Why? | ||
| The high-potential test registered the presence of unintended leakage current, indicating a direct electrical path between the armature cable and the laminated core. | ||
| Why? | ||
| Event stress compromised the epoxy coating, allowing cable insulation breach and lamination contact. | ||
| Why? | ||
| Non-uniform coating distribution during the manufacturing process led to a significant decrease in epoxy thickness on the lamination walls. | ||
| ROOT CAUSE | ||
| Non-uniform coating distribution during the manufacturing process led to a significant decrease in epoxy thickness on the lamination walls. | ||
| Detection | ||
| Why? | ||
| The tester measured a detachment force (the resistance to peeling) falling within the acceptable range of minimum 6 Kgf. | ||
| Why? | ||
| For the adhesion test, the armature sample must be tilted 80° to 90° from the vertical to simulate the cable’s stress conditions during winding. | ||
| ROOT CAUSE | ||
| For the adhesion test, the armature sample must be tilted 80° to 90° from the vertical to simulate the cable’s stress conditions during winding. | ||
| Systemic | ||
| Why? | ||
| This failure mode wasn’t identified as a potential risk in the PFMEA or addressed in the Control Plan | ||
| ROOT CAUSE | ||
Disclaimer/Publisher’s Note: The statements, opinions and data contained in all publications are solely those of the individual author(s) and contributor(s) and not of MDPI and/or the editor(s). MDPI and/or the editor(s) disclaim responsibility for any injury to people or property resulting from any ideas, methods, instructions or products referred to in the content All authors have read and agreed to the published version of the manuscript.. |
© 2024 by the authors. Licensee MDPI, Basel, Switzerland. This article is an open access article distributed under the terms and conditions of the Creative Commons Attribution (CC BY) license (http://creativecommons.org/licenses/by/4.0/).
Copyright: This open access article is published under a Creative Commons CC BY 4.0 license, which permit the free download, distribution, and reuse, provided that the author and preprint are cited in any reuse.


