
Submitted:
08 February 2024
Posted:
09 February 2024
You are already at the latest version
Abstract
The TROPOMI XCH4 data product requires rigorous cloud filtering to achieve a product accuracy of <1%. To this end, the operational XCH4 data processing has been based on SUOMI-NPP VIIRS cloud observations. However, SUOMI-NPP is nearing at the end of its operational life and has encountered malfunctions in 2022 and 2023. In this study, we introduce a novel machine learning cloud clearing approach based on a random forest classifier (RFC). The RFC is trained on collocated TROPOMI and SUOMI-NPP VIIRS data to emulate VIIRS-like cloud clearing. After training, cloud masking requires only TROPOMI data, and so becomes operationally independent of SUOMI-NPP. We demonstrate the RFC approach by applying cloud clearing to operational TROPOMI XCH4 data for August 2022, a period in which VIIRS was not operational. For validation, we analyze the TROPOMI XCH4 data at 12 TCCON stations. Comparison of cloud clearing using the RFC and the original VIIRS method reveals excellent agreement with a similar station-to-station bias (-7.4 ppb versus -5.6 ppb), a similar standard deviation of the station-to-station bias (11.6 ppb versus 12 ppb), and the same Pearson correlation coefficient of 0.9. Remarkably, the RFC cloud clearing provides a slightly higher volume of data (2182 versus 2035 daily means) and appears to have fewer outliers. Since November 21, 2023, the RFC approach is part of ESA’s operational processing chain. For now the default practice is to utilize SNPP-VIIRS when accessible. Only in cases where VIIRS data is unavailable do we resort to the RFC cloud mask.
Keywords:
TROPOMI
; CH4
; SUOMI NPP
; VIIRS
; CLOUDS
; Machine Learning
; Random Forest Classifier
1. Introduction
Methane (CH4) is the second most important anthropogenic greenhouse gas after carbon dioxide (CO2), surpassing CO2 in its heat-trapping effectiveness [1]. Human activities, such as livestock digestion, rice cultivation, and the fossil fuel industry, are the primary sources of anthropogenic CH4 emissions [2]. Satellite-based CH4 measurements play an important role in identifying emission sources, quantifying sinks, and devising strategies to mitigate climate change [3,4].
The Tropospheric Monitoring Instrument (TROPOMI) on ESA’s Sentinel 5 Precursor satellite has global coverage within a day and provides the dry air mole fraction averaged methane columns XCH4 for clear-sky scenes with a spatial resolution of up to 5.5×7 km2. TROPOMI is a grating spectrometer with a wide spectral coverage including ultraviolet (UV), visible (VIS), near infrared (NIR) and short-wave infrared (SWIR) [5]. The TROPOMI XCH4 data product is retrieved from the instrument’s NIR and SWIR measurements by deploying the RemoTeC algorithm [6]. It’s worth noting that due to algorithmic limitations on the viewing zenith angle, the swath is narrower for TROPOMI XCH4, resulting in a lack of full daily global coverage.
During recent years, the TROPOMI XCH4 product was continuously improved; e.g., a new bias correction scheme was introduced to correct the dependence of XCH4 on the brightness of the scene [7]. The data set was extended to include observations over oceans under glint geometry [8] and the identified XCH4 anomalies over carbonated rock formations were solved by improving the spectral fit of the surface reflectivity [9]. The TROPOMI XCH4 dataset is widely used, for example, for the detection of anthropogenic CH4 emissions and atmospheric modeling [3,4,10].
The TROPOMI XCH4 data product meets the stringent mission requirements on precision (<1.5%) and accuracy (<1%). Extensive validation efforts using ground-based FTIR measurements from the Total Carbon Column Observing Network (TCCON), have confirmed that the errors of the TROPOMI XCH4 data are in line with these demands [11]. Achieving such precision necessitates rigorous cloud-clearing of the TROPOMI measurements, as clouds in the satellite’s observation path can introduce significant retrieval errors. Although the S5-P satellite itself lacks a dedicated cloud imager, it flies in loose formation with the SUOMI-NPP (SUOMI-National Polar-orbiting Partnership) satellite. This mission synergy allows us to use the VIIRS (Visible Infrared Imaging Radiometer Suite) cloud data for cloud clearing of TROPOMI measurements, since both instruments observe the same ground scene within < 3 minutes [12].
Here, the VIIRS data serve a dual role in ESA’s data processing workflow. Initially, they are employed for pre-filtering TROPOMI data, reducing the volume of data to be processed—a step representing weak data filtering. The more demanding second step involves cloud clearing, where VIIRS data contribute to a posteriori data filtering of the retrieved XCH4 data, ensuring the high quality of the data product. This study primarily focuses on the second step of cloud filtering because it is more demanding and interesting from the scientific point of view. However, we also applied our method on the pre-filtering step and it is implemented in ESA’s processing framework.
In the event of missing VIIRS data, a backup filter was established for the TROPOMI XCH4 retrieval, relying solely on TROPOMI measurements. This alternative filter incorporates information from both weak and strong CH4 absorption lines in the shortwave infrared, which are included in the output of the TROPOMI CO product [12]. A similar approach, for instance, was applied by [13] for the OCO-2 instrument. However, our investigation revealed that the performance of the backup filter is found to be insufficient. It is crucial to highlight that these filtered thresholds were defined preflight and have not undergone testing on real data.
SUOMI-NPP is approaching its end of life and will be succeeded by the NOAA-20 satellite [14]. Although NOAA-20 carries a cloud imager equivalent to VIIRS, the different orbit positions cause a time gap of more than 20 minutes with TROPOMI, which presents a challenge for critical cloud clearing of TROPOMI data. A malfunction of the VIIRS instrument of a full month 2022 (August) and 7 days in November 2023 clearly demonstrated the dependence of the TROPOMI XCH4 data quality on the VIIRS data product. The daily distribution of XCH4 values in regions such as North America, Siberia, and Australia showed a significant low bias, due to the inclusion of cloud-contaminated scenes. Apparently, in August, the global XCH4 distribution was skewed towards lower values, impacting both the mean by 3.9% and the standard deviation by 303% for the three regions while introducing numerous outliers. Hence, this clearly showed that the current backup filter is not sufficient and an alternative cloud-clearing of TROPOMI XCH4 data is needed that is complementary to the SUOMI-NPP measurements.
This study introduces an innovative machine learning approach for cloud-clearing of the TROPOMI XCH4 data product using a random forest classifier (RFC). Trained on five years of collocated measurements from both TROPOMI and SUOMI-NPP data (about 20000 orbits), the RFC can replace the VIIRS cloud-clearing process relying solely on TROPOMI data. Therefore, it represents an alternative cloud-clearing in the absence of VIIRS data and so can solve data processing issues due to the expected end-of-life of SUOMI-NPP. Moreover, the RFC approach is an essential step toward a near real-time TROPOMI XCH4 data product, as it eliminates the need to await the availability of VIIRS data. A near real-time XCH4 data product is requested for chemical forecasting of the atmosphere, as done by the Copernicus Atmosphere Monitoring Service (CAMS) and the Integrated Forecasting System (IFS) developed by European Centre for Medium-Range Weather Forecasts (ECMWF). It focuses on monitoring and forecasting atmospheric composition, including greenhouse gases, aerosols, and reactive gases and already assimilates TROPOMI CO in near-realtime [15].
Our study is structured as follows. In Section 2, we discuss the datasets utilized in our research and Section 3 explains our machine learning approach. In Section 4, we apply the RFC to address the one-month absence of VIIRS data in August 2022. Furthermore, a validation is presented for measurements at 12 TCCON stations. Finally, Section 5, summarizes our findings and draws conclusions based on our research.
2. Data
2.1. SUOMI-NPP VIIRS
The SUOMI-NPP VIIRS cloud data is our reference standard for cloud clearing. SUOMI-NPP is a collaborative satellite mission led by NASA (National Aeronautics and Space Administration) and NOAA (National Oceanic and Atmospheric Administration), and was successfully launched in 2011 [16]. Among its suite of instruments, the VIIRS (Visible Infrared Imaging Radiometer Suite) provides essential data, including cloud-related parameters. VIIRS cloud information is sampled on the TROPOMI footprints [17], providing valuable information on cloud coverage of TROPOMI observations with a minimal time delay of <3 minutes [12]. Resampling of VIIRS data on the SWIR footprints of TROPOMI introduces a processing delay of approximately 1.5 days. The study used the resampled VIIRS data product version 1.0.3. All threshold values for the VIIRS data filtering are sourced from [18].
2.2. TROPOMI CO
To train a RFC algorithm on the relationship between TROPOMI and resampled VIIRS data, we must select TROPOMI data with sufficient cloud sensitivity sampled on the SWIR pixel mesh. First, we use the CH4 column retrieved from both weak and strong CH4 absorption in the SWIR band using a non-scattering radiative transfer model [12]. The differences in columns indicate the presence of atmospheric scattering and were suggested by [13] for cloud filtering. Furthermore, we employ the TROPOMI CO product, which is also retrieved from TROPOMI SWIR observations. Here, the SICOR algorithm [19] infers the total column density together with effective cloud parameters. Here, prior knowledge of atmospheric CH4 concentration is used to derive cloud information. This improves CO coverage with data quality that is well within mission objectives [20,21,22]. The data product includes the column averaging kernel [23] that describes the vertical sensitivity of CO recovery and thus indicates the presence of clouds. Here, the ground value of the total column averaging kernel is particularly sensitive to cloud contamination. Under clear-sky conditions, its value approaches about 0.9, gradually decreasing to 0 in the presence of clouds. Note that the cloud sensitivity could be biased by the retrieval approach and errors in the a priori CH4 information. However, these biases can be corrected by the training of the RFC, and so do not necessarily hamper the accuracy of the trained model. Moreover, it is worth noting that from an implementation perspective, the TROPOMI CO product is well suited, as this retrieval precedes the TROPOMI processing of XCH4.
In summary, we use the following key TROPOMI parameters: (1) the CH4 column retrieved from a strong and weak CH4 absorption feature in the SWIR spectrum (2) the CO averaging kernel at the ground level, (3) the latitude of the observed ground scene, (4) the viewing zenith angle of the observation, (5) the retrieved surface albedo at 2334 nm and (6) ECMWF surface pressure. All data are within the The TROPOMI CO product with version number 2.4.0 and later.
To demonstrate the validity of our RFC cloud clearing approach, we use the operational TROPOMI XCH4 dataset derived from the NIR and SWIR measurements of the instrument. The operational algorithm is RemoTeC [12,24]. First, we consider the TROPOMI data for August 2022. During this period, the VIIRS instrument malfunctioned and, therefore, the data quality of the TROPOMI XCH4 product was significantly compromised. To illustrate the potential of the RFC approach, we apply the new cloud clearing method to filter the data using the operational TROPOMI XCH4 data from the latest data reprocessing and corresponding forward stream (version number 2.4.0).
Second, we validated the TROPOMI XCH4 product against TCCON measurements for the full mission period by comparing cloud clearing based on the resampled VIIRS data and the new RFC machine learning approach. To this end, we reprocessed the TROPOMI XCH4 data using the same configuration employed in the operational retrieval, with the exception of excluding any pre-filtering. This poses a significant processing challenge, but it is crucial to demonstrate the validity of our cloud clearing approach across all potential cloud contamination cases. Furthermore, this validation ensures the independence of our method from VIIRS data, which is also utilized in the pre-filtering stage. To streamline computational efforts, we limited the processing to a region of 300 km around the designated TCCON stations.
2.3. TCCON XCH4
We used XCH4 data from the Total Carbon Column Observing Network (TCCON) to show the impact of the RFC cloud clearing model on the validity of the TROPOMI XCH4 dataset. TCCON comprises a globally distributed network of ground-based stations designed to provide accurate and precise retrievals of the vertically integrated total column of various trace gases. These measurements have gained recognition as a standard for satellite validation and have been utilized to validate satellite data products such as TROPOMI XCH4 and CO (see, e.g., [11]). In this study, we used data from 12 TCCON stations, and their details are summarized in Table 1. Although a more recent TCCON dataset is available, namely GGG2020, we opt to use the version GGG2014 to maintain comparability with previous studies assessing the quality of the TROPOMI XCH4 dataset [7,8,25]. Our validation approach is the same as that used in the previously mentioned publications, encompassing the coordination of TCCON XCH4 measurements with TROPOMI XCH4 measurements within a radius of 300 km around each station, while allowing a time discrepancy of hours. The collocation process yields daily means from both the TROPOMI and TCCON data, and from the corresponding time series, we compute the mean bias b, defined as the difference between the daily XCH4 means (TROPOMI - TCCON), along with its corresponding standard deviation . Furthermore, we calculate the mean station-to-station bias , which is the average bias between all stations, and the standard deviation of the station-to-station bias .
3. Methods
3.1. Random Forest Classifier
The concept of random forest classifiers (RFC) is well established in the field of machine learning. It comprises a set of decision trees n, where each individual tree is trained on a randomly selected subset of training data. This subset includes m input vectors paired with their corresponding correct classifications , where assumes values of 0 or 1. For this study, consists of the parameters taken from the CO data product and y is the cloud-clearing deploying the SUOMI-NPP data as defined above. When classifying the input data, the Random Forest aggregates the predictions of all n trees and makes a decision based on the majority vote. RFC are known to be more robust against overfitting compared to other machine learning approaches, can handle outliers in the input data, and provide valuable insight into the feature importance. For this study we deployed the implementation of random forest classifiers provided by the sklearn python library version 1.2.2 [40].
We opted for a RandomForest configuration with specific parameters (n_estimators=150, max_depth=50, max_features=sqrt, min_samples_leaf=1, min_samples_split=2). In this configuration, the choice of 150 estimators determines the number of trees in the forest. A maximum depth of 50 is set for each tree, allowing for intricate pattern capturing. The use of max_features=sqrt introduces randomness by considering the square root of the total features for node splitting, fostering diversity among trees and potentially enhancing model generalization. A minimum leaf size of 1 ensures that each leaf in the tree contains at least one sample, and a minimum of 2 samples is required to split an internal node. These parameter choices were made based on the hyper parameter tuning that is implemented in the sklearn python library, aiming to achieve a well-balanced and effective RandomForest model.
For this study, we implemented an iterative training approach of the Random Forest Classifier (RFC) to optimize its performance. To ensure proper balance in the training set, we carefully matched the number of clear-sky and cloud-contaminated observations using the collocated VIIRS data. To this end, we first select all clear-sky retrievals and then randomly choose an equivalent number of cloudy data from the same orbit. Note that the large number of cloudy data allowed us to maintain this approach (e.g., typical orbit may yield approximately 20% clear-sky retrievals). Following the initial training, we evaluated the RFC’s performance on a test set comprising 1000 randomly selected orbits from a pool of approximately 20,000 available orbits. We identified the orbit with the highest number of false clear-sky predictions by the RFC, which we used subsequently to update the training set. Here, we ensure that the orbits in the training set are excluded in the test set. False clear-sky classifications are the most undesirable, as they diminish the accuracy of our data product. Here, accuracy is defined as the relative number of true clear-sky and false cloudy classification. On the contrary, false cloudy classifications primarily reduce data coverage, as true clear-sky measurements are omitted.
Our approach to selecting orbits with the most significant false clear-sky classifications aims to mitigate this specific error class. Figure 1 demonstrates the efficiency of this learning methodology. Initial training using only one orbit proved insufficient, yielding an accuracy below 60 percent. Moreover, the false cloudy classification rate exceeds 40 %, leading to a substantial reduction in data coverage compared to the original cloud filtering based on the resampled VIIRS data.
When the training set is expanded to include more orbits, there is a rapid increase in accuracy as the number of false cloudy classifications decreases. However, this improvement comes at the expense of a slight increase in false clear-sky measurements. The slow increase in false clear-sky classifications is primarily due to our selection criteria to update the learning set. A similar dependency is evident when examining the scatter of predictions in Figure 1. The scatter of accuracy is predominantly influenced by the high variability in false-cloudy classifications, a variability that diminishes with the inclusion of more orbits in the learning set.
Therefore, the final number of orbits for training is a crucial performance parameter. On the one hand, it should effectively mitigate the initially high number of false-cloudy classifications and their associated scatter. On the other hand, the objective is to minimize the occurrence of false clear-sky classifications. As illustrated in Figure 1, this optimal number of orbits tends to fall within the range of 100 to 150 orbits. Throughout this iterative process, we conducted a validation of the corresponding XCH4 data product with TCCON observations for various number of orbits (see Figure A1 in the Appendix A). The RFC classifier for 110 orbits emerged as our baseline for this study (accuracy=82%, false clear-sky=11%, false cloudy=7%) with its ability to exhibit the lowest bias with TCCON within the specified orbit range between 100 and 150 of -7ppb.
3.2. Destriping Approach
The new cloud clearing approach suggested in this study is based on parameters retrieved from the SWIR spectral range by deploying the TROPOMI CO retrieval as discussed in Section 2.2. The data retrieved from the SWIR measurements of TROPOMI show a significant artificial stripping pattern in the flight direction of the satellite. This pattern is e.g noticeable in the TROPOMI CO, H2O/HDO, and XCH4 products [41]. Although the exact cause of this artifact has yet to be determined, it is likely associated with calibration of the TROPOMI level 0 data.
Hence, all the parameters sourced from the TROPOMI CO retrieval, essential inputs for our cloud-clearing approach, are susceptible to stripe artifacts. This susceptibility necessitates a preliminary destriping step to ensure that these artifacts do not inadvertently influence the cloud mask for the TROPOMI XCH4 data. The destriping process is applied to several key parameters, including the XCH4 column retrieved from both strong and weak CH4 absorption features in the SWIR spectrum, the CO averaging kernel, and the retrieved surface albedo at 2334 nm. An illustrative example is depicted in Figure 2, showcasing stripes in the retrieved XCH4, a side parameter derived from the TROPOMI CO retrieval and indicative of strong methane absorption in the shortwave infrared (SWIR).
We apply the following approach, which is robust against outliers and computationally fast. Assume to be the parameter that is retrieved from the TROPOMI level 1 product. Figure 2 illustrates an example for the TROPOMI XCH4 product. Here, the index i represents the number of swaths (in flight direction), and j corresponds to the number of a ground pixel within that swath (across the flight direction). In the initial step, we estimate a smoothed background (see Figure 2B). This is achieved by applying a moving window median smoothing along the swatch direction. The width of the window is pixels. The residual component contains valuable information on the presence of stripes in the data (shown in Figure 2C). We proceed with a second moving window median smoothing of the residual , this time in the flight direction. The width of this second smoothing operation is defined as pixels. This second smoothing step limits the stripe sensitivity of our method along the track direction and results in the stripe pattern that we are going to remove. Finally, the destriped data product is obtained by calculating as shown in Figure 2 C. The destriping approach is very efficient, as it operates on subsets of an orbit, which distinguishes it from earlier approaches using entire orbit data (see, e.g., [21]).
This novel destriping method holds significance not only for enhancing the destriping of input parameters crucial to our new cloud-clearing method but also for its potential application directly on the TROPOMI XCH4 data in the future. To demonstrate this potential, we applied the destriping technique to a 5-year dataset of TROPOMI XCH4 data and validated it against the 12 TCCON stations featured in this study. The results revealed that while the bias between TROPOMI and TCCON remained unchanged, there was a slight reduction in the standard deviation of the bias by 0.2 ppb. This outcome is particularly promising, as the removal of stripe noise in the data is expected to primarily reduce scatter rather than bias. Future plans include the implementation of destriping for ESA’s TROPOMI XCH4 and CO products, as well as for our scientific water vapor isotope product [42].
4. Results
The RFC cloud-clearing for TROPOMI XCH4 as described in Section 3.1 depends on the TROPOMI CO data and its availability. This dependency does not mean any restriction, as the TROPOMI CO data product has significantly larger coverage than TROPOMI XCH4. CO retrieval is more resilient with respect to cloud contamination and level 1 data quality, so data that are rejected by the CO data processing are also not usable for XCH4 processing. To evaluate the performance of our new machine learning-based cloud clearing approach, we reprocessed the TROPOMI XCH4 data for August 2022 over North America [37.0°±17.0°N, 101.5°±34.5°W], Siberia [62.5°±6.5°N, 110.0°±14.0°E], and Australia [27.2°±16.5°S, 133.45°±20.12°E], a period when VIIRS data was unavailable. As a backup option when VIIRS data are not available, the operational TROPOMI XCH4 retrieval applied a simple threshold filter to remove cloud-contaminated measurements. This filtering was used as a backup cloud clearing in case VIIRS data were not available [12]. However, as depicted in Figure 3A, the threshold filtering introduces large errors to the data set and allowed many cloud-contaminated measurements to remain in all regions considered. This discrepancy becomes evident when comparing the data distribution for August with that for July and September, when VIIRS data were available.
For August, the global XCH4 distribution was skewed towards lower values, affecting both the mean value by 3.9% and the standard deviation by 303% for the three regions while introducing numerous outliers. This is mainly due to the shielding of air masses below the cloud. Thus, for this month, the data no longer align with the mission requirements and are flagged to be of low quality. Figure 3B shows the filtered data using our RFC learning approach. For July and September, this data set maintained the cloud screening based on the resampled VIIRS data. For August, the distribution of XCH4 for the three regions is in good agreement with the other months. The mean and standard deviations are no longer skewed towards lower values, and even the number of outliers, indicated by the red data points, is reduced when compared to July and September.
The RFC cloud clearing approach appears to be more restrictive compared to the VIIRS-based method. This is illustrated in Figure 4 for TROPOMI overpasses over the US. Here, the RFC cloud clearing identifies similar clear-sky regions as the VIIRS approach but filters out more lower XCH4 columns. As previously discussed, lower XCH4 values are indicative of cloud contamination, suggesting that the RFC method may perform even better than VIIRS in this case. A explanation for this difference might be that the RFC approach is less sensitive to challenges in the VIIRS data because it has learned a general correlation between the VIIRS and the TROPOMI CO data. The persistence of cloud-contaminated scenes in the VIIRS-filtered data might be attributed to the 2-3 minute time difference between TROPOMI and VIIRS. Depending on the meteorological situation, the time delay can introduce a wrong clear-sky classification of the TROPOMI data using VIIRS.
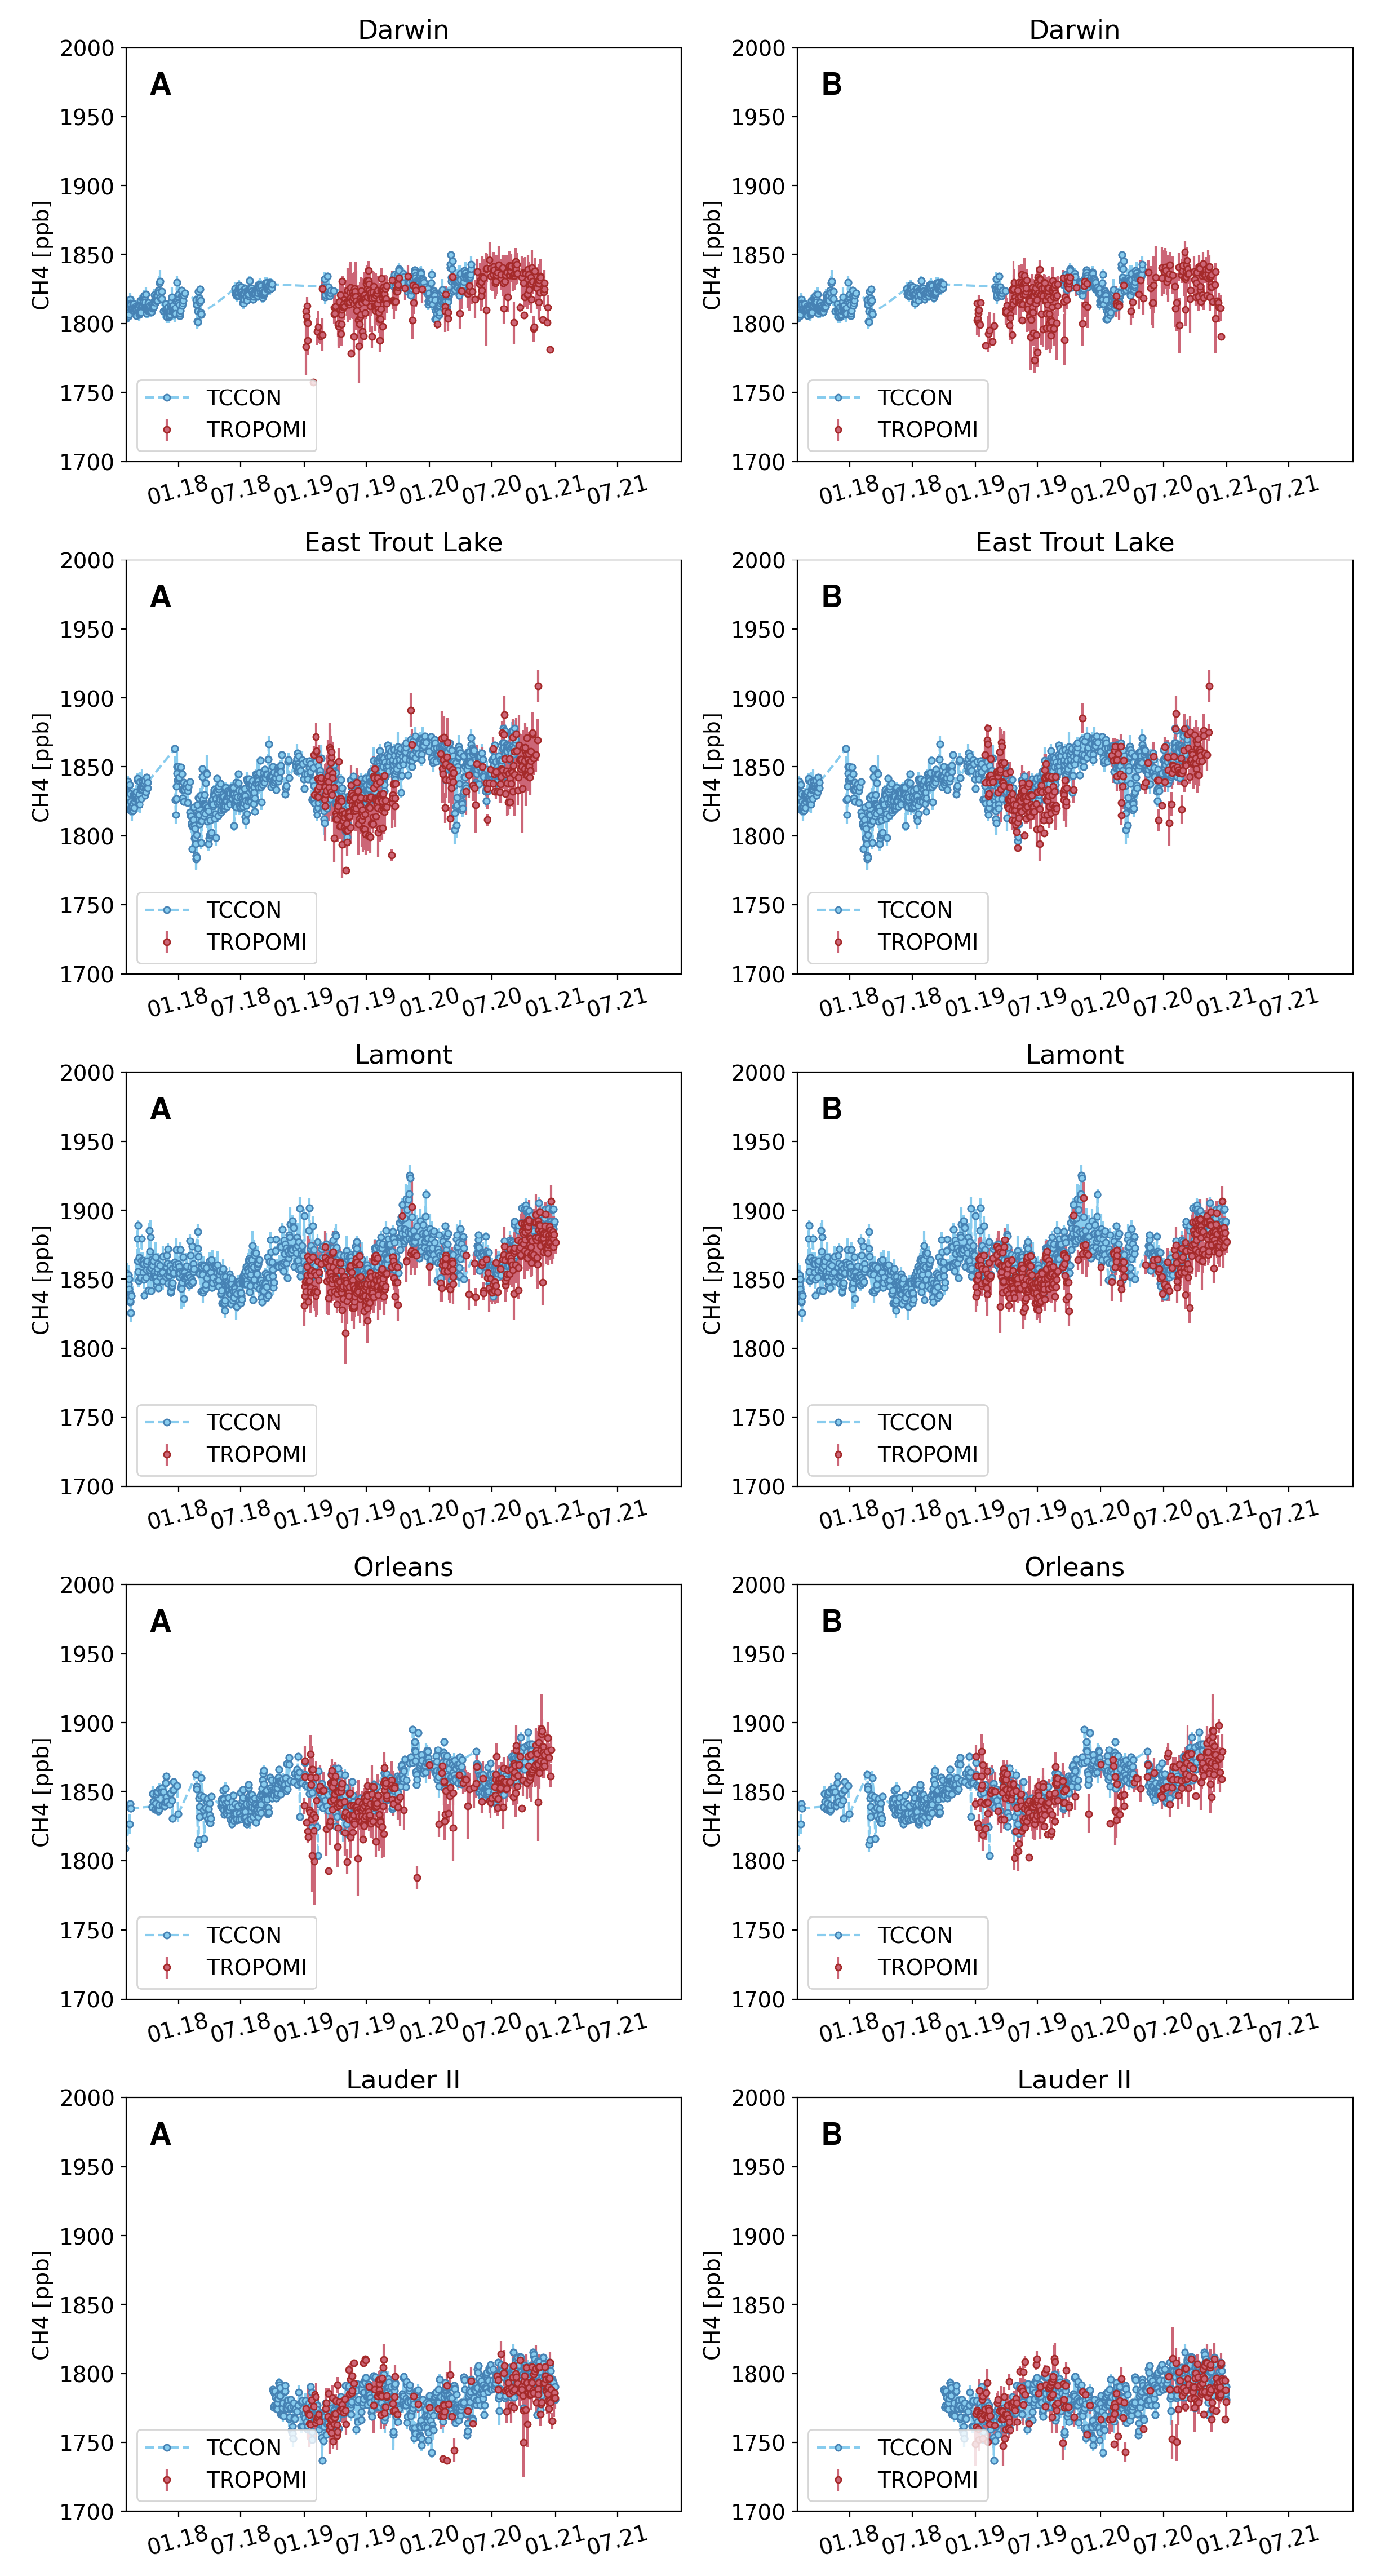
The quality of the operational TROPOMI XCH4 data is subjected to validation and continuous monitoring using XCH4 reference data from TCCON network. To assess the effectiveness of the RFC cloud clearing approach, we processed five years of TROPOMI data around 12 TCCON sites (within a radius of 300 km), where we intentionally refrained from applying any cloud screening. This approach allows us to make a direct comparison between the different cloud clearing techniques using collocated VIIRS data and the RFC approach. For each station, we derived XCH4 time series of daily means for both TCCON and TROPOMI. This is illustrated in Figure 5 showing data for Sodankyla, Finland, and Wollongong, Australia. The time series of all stations are shown in the Appendix A (Figure A2 and Figure A3). When comparing the TROPOMI XCH4 data filtered with the RFC approach (A, C) to the current VIIRS filtering, we observe highly comparable results. Both approaches exhibit a similar data density, but when applying the new approach, we notice slightly fewer outliers with lower XCH4 values. This agrees with the discussion above.
Figure 6 shows the validation statistics for all 12 stations. Overall, we see very good agreement in the bias (-7.4 ppb for RFC vs -5.6 ppb for VIIRS) and in the standard deviation of the bias (11.6 ppb for RFC vs 12 ppb for VIIRS). The amount of data is about 7 % higher for RFC compared to the VIIRS cloud clearing. In Figure 7, we present the correlation between the daily TCCON and TROPOMI XCH4 means for all stations. The error bars in the figure represent the error of the daily means. The TROPOMI-TCCON correlation is highly comparable using the two cloud clearing approaches. Overall, from the results presented in Figure 6 and Figure 7, we conclude that the data quality around the TCCON sites is very comparable using both cloud clearing approaches.
5. Discussions
The quality of the TROPOMI XCH4 data product depends on accurate cloud clearing of spectrometer data, a process facilitated by using the SUOMI-NPP VIIRS cloud product. During the last six years of mission operation, this approach proved to be very effective because both satellites operate in a formation, ensuring that they capture the same ground scene with a minimal delay of 2-3 minutes. However, the upcoming decommissioning of SUOMI-NPP necessitates the development of an alternative cloud-clearing method for the TROPOMI XCH4 data product. This need arises due to the significant time delay of about 20 min between TROPOMI and the NOAA-20 satellite, which is the successor of SUOMI-NPP, and the malfunctioning backup cloud filter of the current TROPOMI XCH4 processor. To maintain the accuracy and reliability of the TROPOMI XCH4 data, a new cloud clearing approach had to be established in response to this new situation.
In this study, we introduced a new machine learning approach based on the Random Forest Classifier technique, which replicates VIIRS cloud clearing using only TROPOMI data. The classifier is trained on a subset of 5 years of collocated TROPOMI and SUOMI-NPP VIIRS data (about 20000 orbits). To this end, we used parameters derived from the TROPOMI CO retrieval, which is inherently sensitive to the presence of clouds and is processed prior to the retrieval of TROPOMI XCH4 in the mission operational pipeline. This strategic choice simplifies the integration of our approach into the existing processing framework. In addition, we presented an efficient and robust method for despriping TROPOMI data, relying on median smoothing techniques. This approach was validated with ground-based TCCON measurements to show that it is not changing the bias, but slightly improves the standard deviation of the bias. This is a positive results since removing the stripe noise from the data should only improve the scatter and not introduce a bias change. The destriping will be suggested as an update for the operational TROPOMI XCH4 and CO retrieval in future.
We demonstrated the performance of the new cloud-clearing approach by filtering three months of TROPOMI data in summer 2022 over North America, Siberia, and Australia. During one of the months, SUOMI-NPP experienced a temporary outage, which resulted in the lack of availability of VIIRS data. Remarkably, our machine learning approach demonstrated comparable performance during this data gap. Additionally, we conducted a TCCON validation covering the entire 5-year duration of the TROPOMI mission for 12 stations. The results highlighted the effectiveness of our RFC cloud clearing approach, showcasing its ability to match the performance of VIIRS filtering with a very similar bias and about 7 % more data.
Currently, our cloud-clearing approach is tailored for land-only scenes and our future plans include expanding its application to glint geometries observed over the oceans. Moreover, we will also apply RFC for improved quality filtering of TROPOMI XCH4 data in future. When the dependence on SUOMI-NPP data is eliminated, faster processing becomes possible. This is in particular interesting for the scientific data application monitoring CH4 point sources or assimilating TROPOMI data in near-real-time as done by CAMS-IFS for TROPOMI CO.
Author Contributions
TB, MV, JL, MS, and MtL provided the TROPOMI XCH4 retrieval and data analysis. The TCCON partners provided the validation datasets. TB wrote the original draft with input from the authors. All authors discussed the results and reviewed and edited the paper.
Funding
Funding through the TROPOMI national program from the NSO and Methane+ is acknowledged. Darwin and Wollongong TCCON sites are funded by the Australian Research Council (DP140101552, DP160101598, LE0668470) and NASA (NAG5-12247, NNG05-GD07G). Nicholas M. Deutscher is supported by an ARC Future Fellowship (FT180100327). The Edwards (Armstrong) TCCON measurements are supported by NASA’s Earth Science Division.
Data Availability Statement
The TROPOMI XCH4 data set is available for download at https://dataspace.copernicus.eu/ (last access: 12 December 2023). TCCON data are available from the TCCON Data Archive: Total Carbon Column Observing Network (TCCON), available at https://tccondata.org/ (last access: 12 December 2023).
Acknowledgments
The presented material contains modified Copernicus data [2017,2023] The TROPOMI data processing was carried out on the Dutch national e-infrastructure with the support of the SURF Cooperative. We express gratitude to the TCCON network for providing the valuable validation data showcased in this study.
Conflicts of Interest
The authors declare that there is no conflict of interest regarding the publication of this article.
Appendix A
Figure A1.
Validation with TCCON as shown in Figure 6 but done for all orbit subsets shown in Figure 1 (x-axis). Figure (A) shows the bias with TCCON, Figure (B) the standard deviation of the bias, Figure (C) the number of collocations used, and (C) the pearson correlation coefficient.
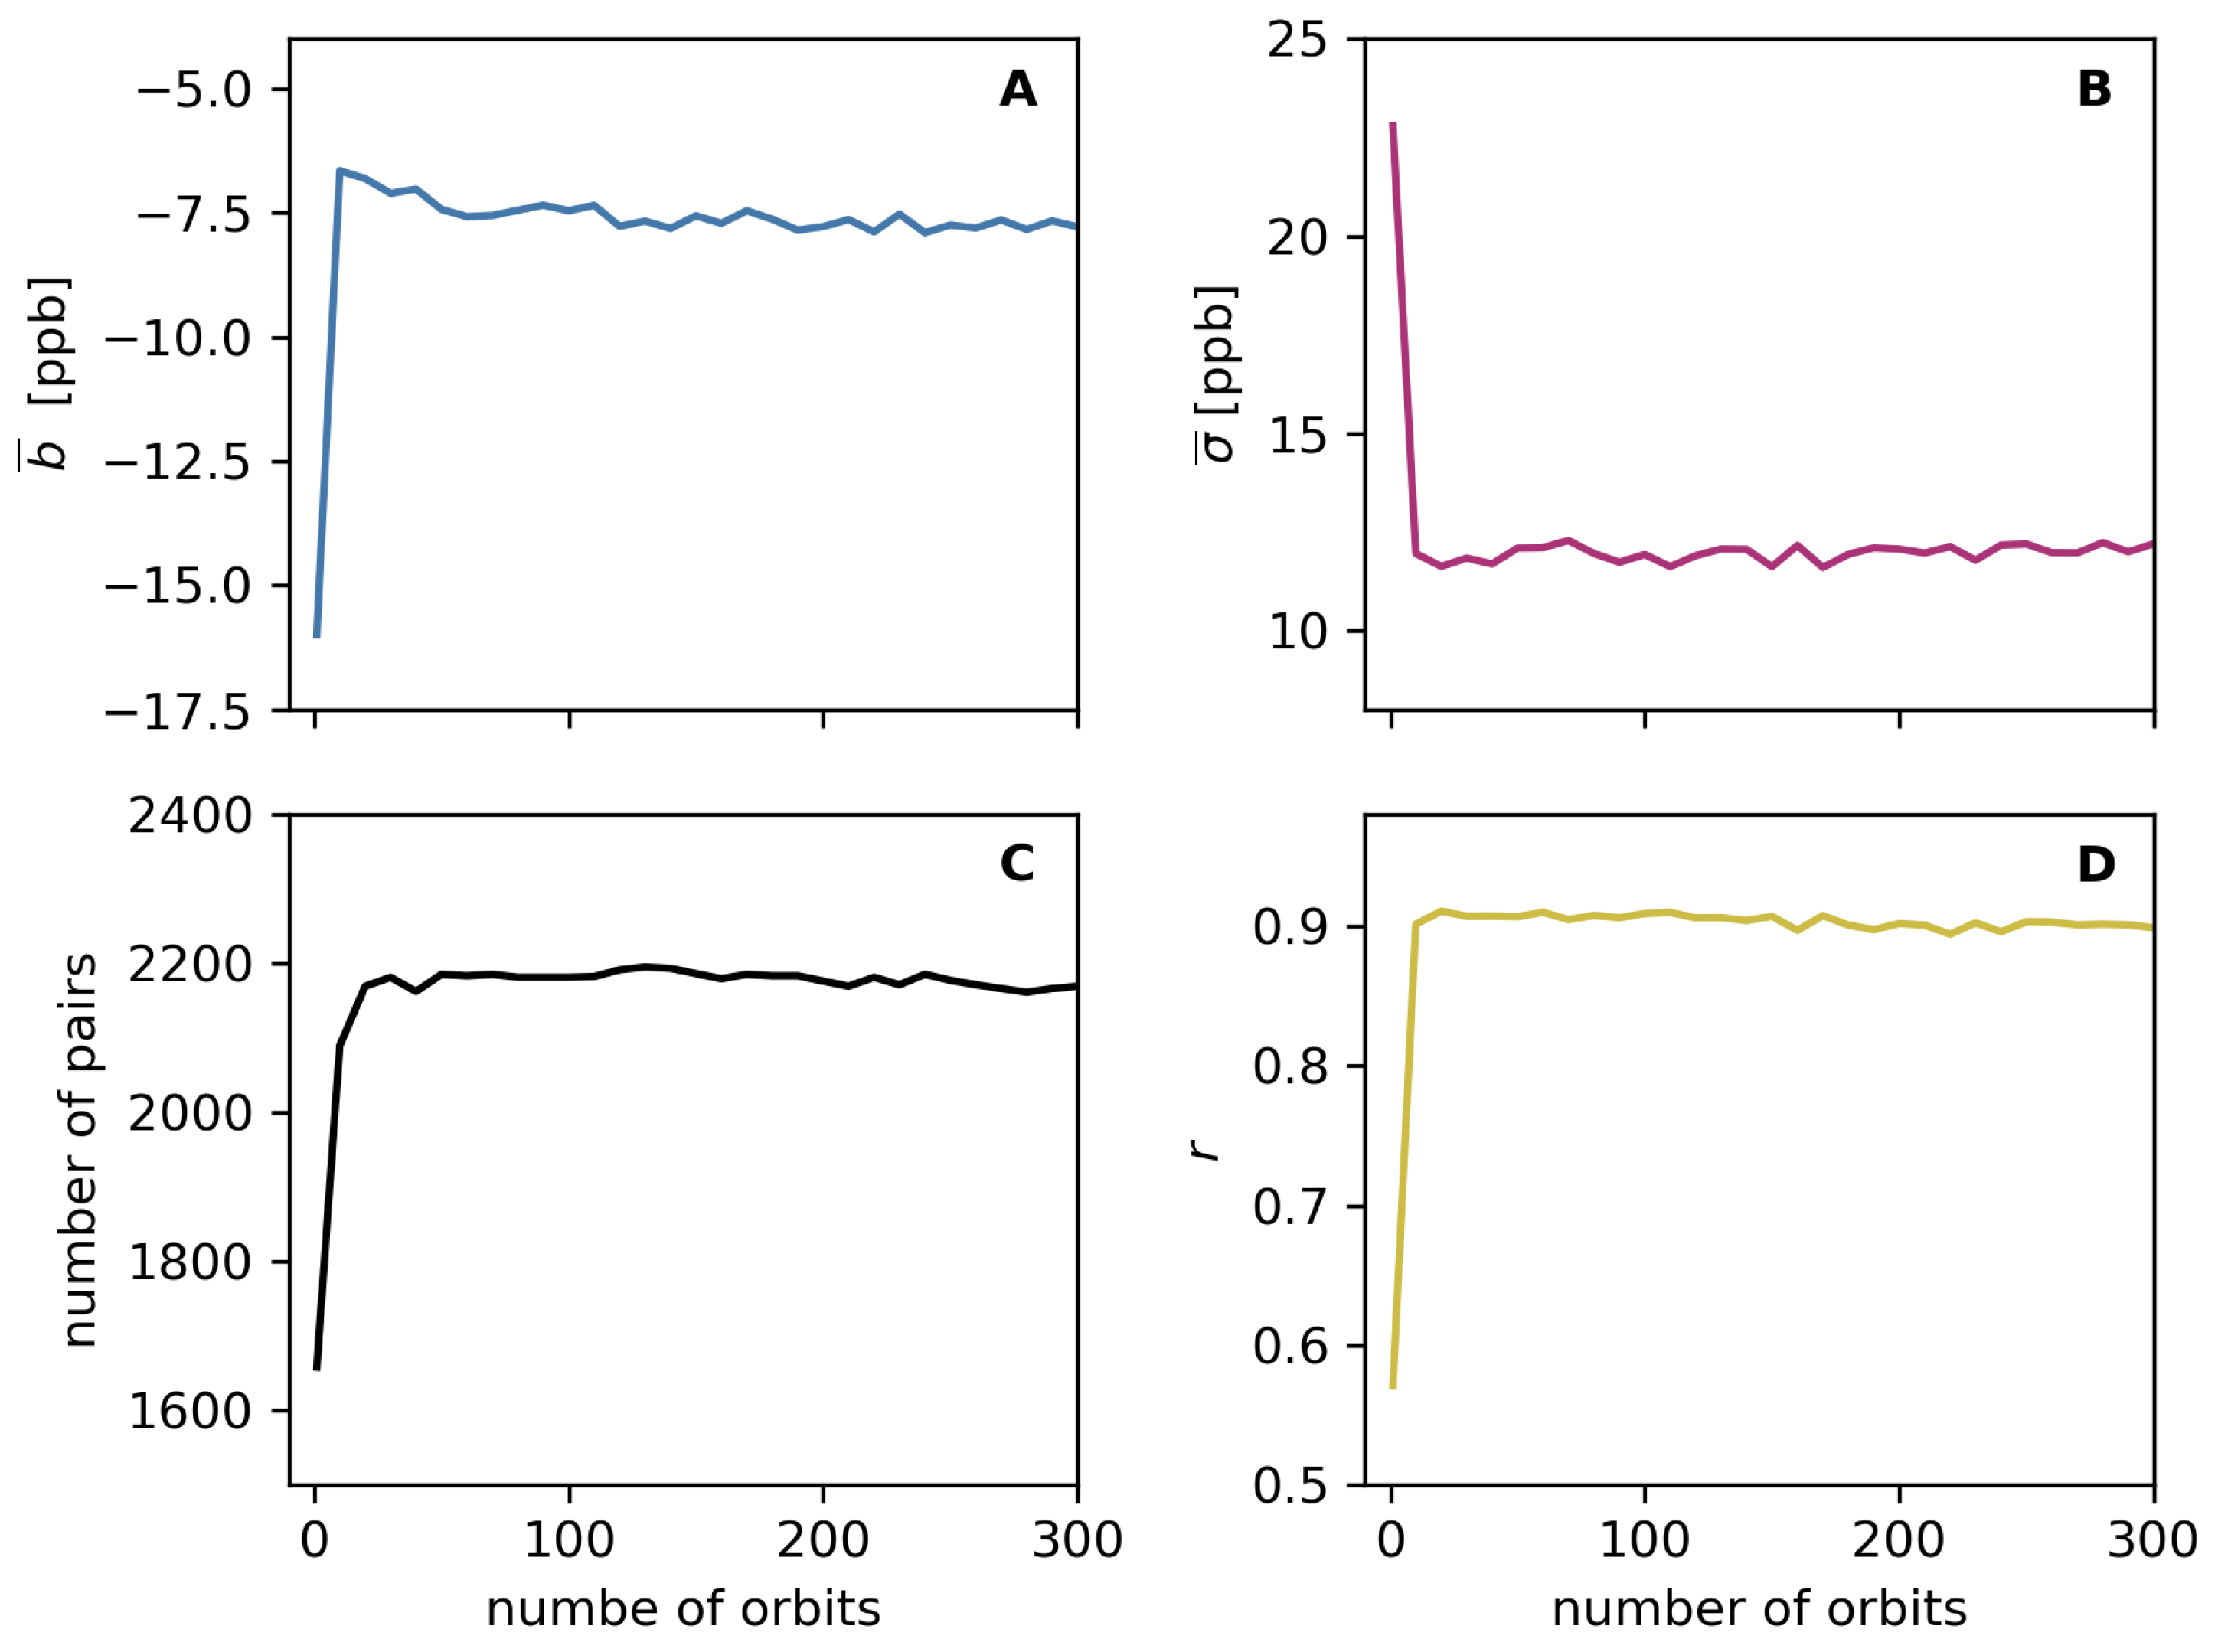
Figure A2.
As Figure 5 but for additional stations.
Figure A2.
As Figure 5 but for additional stations.
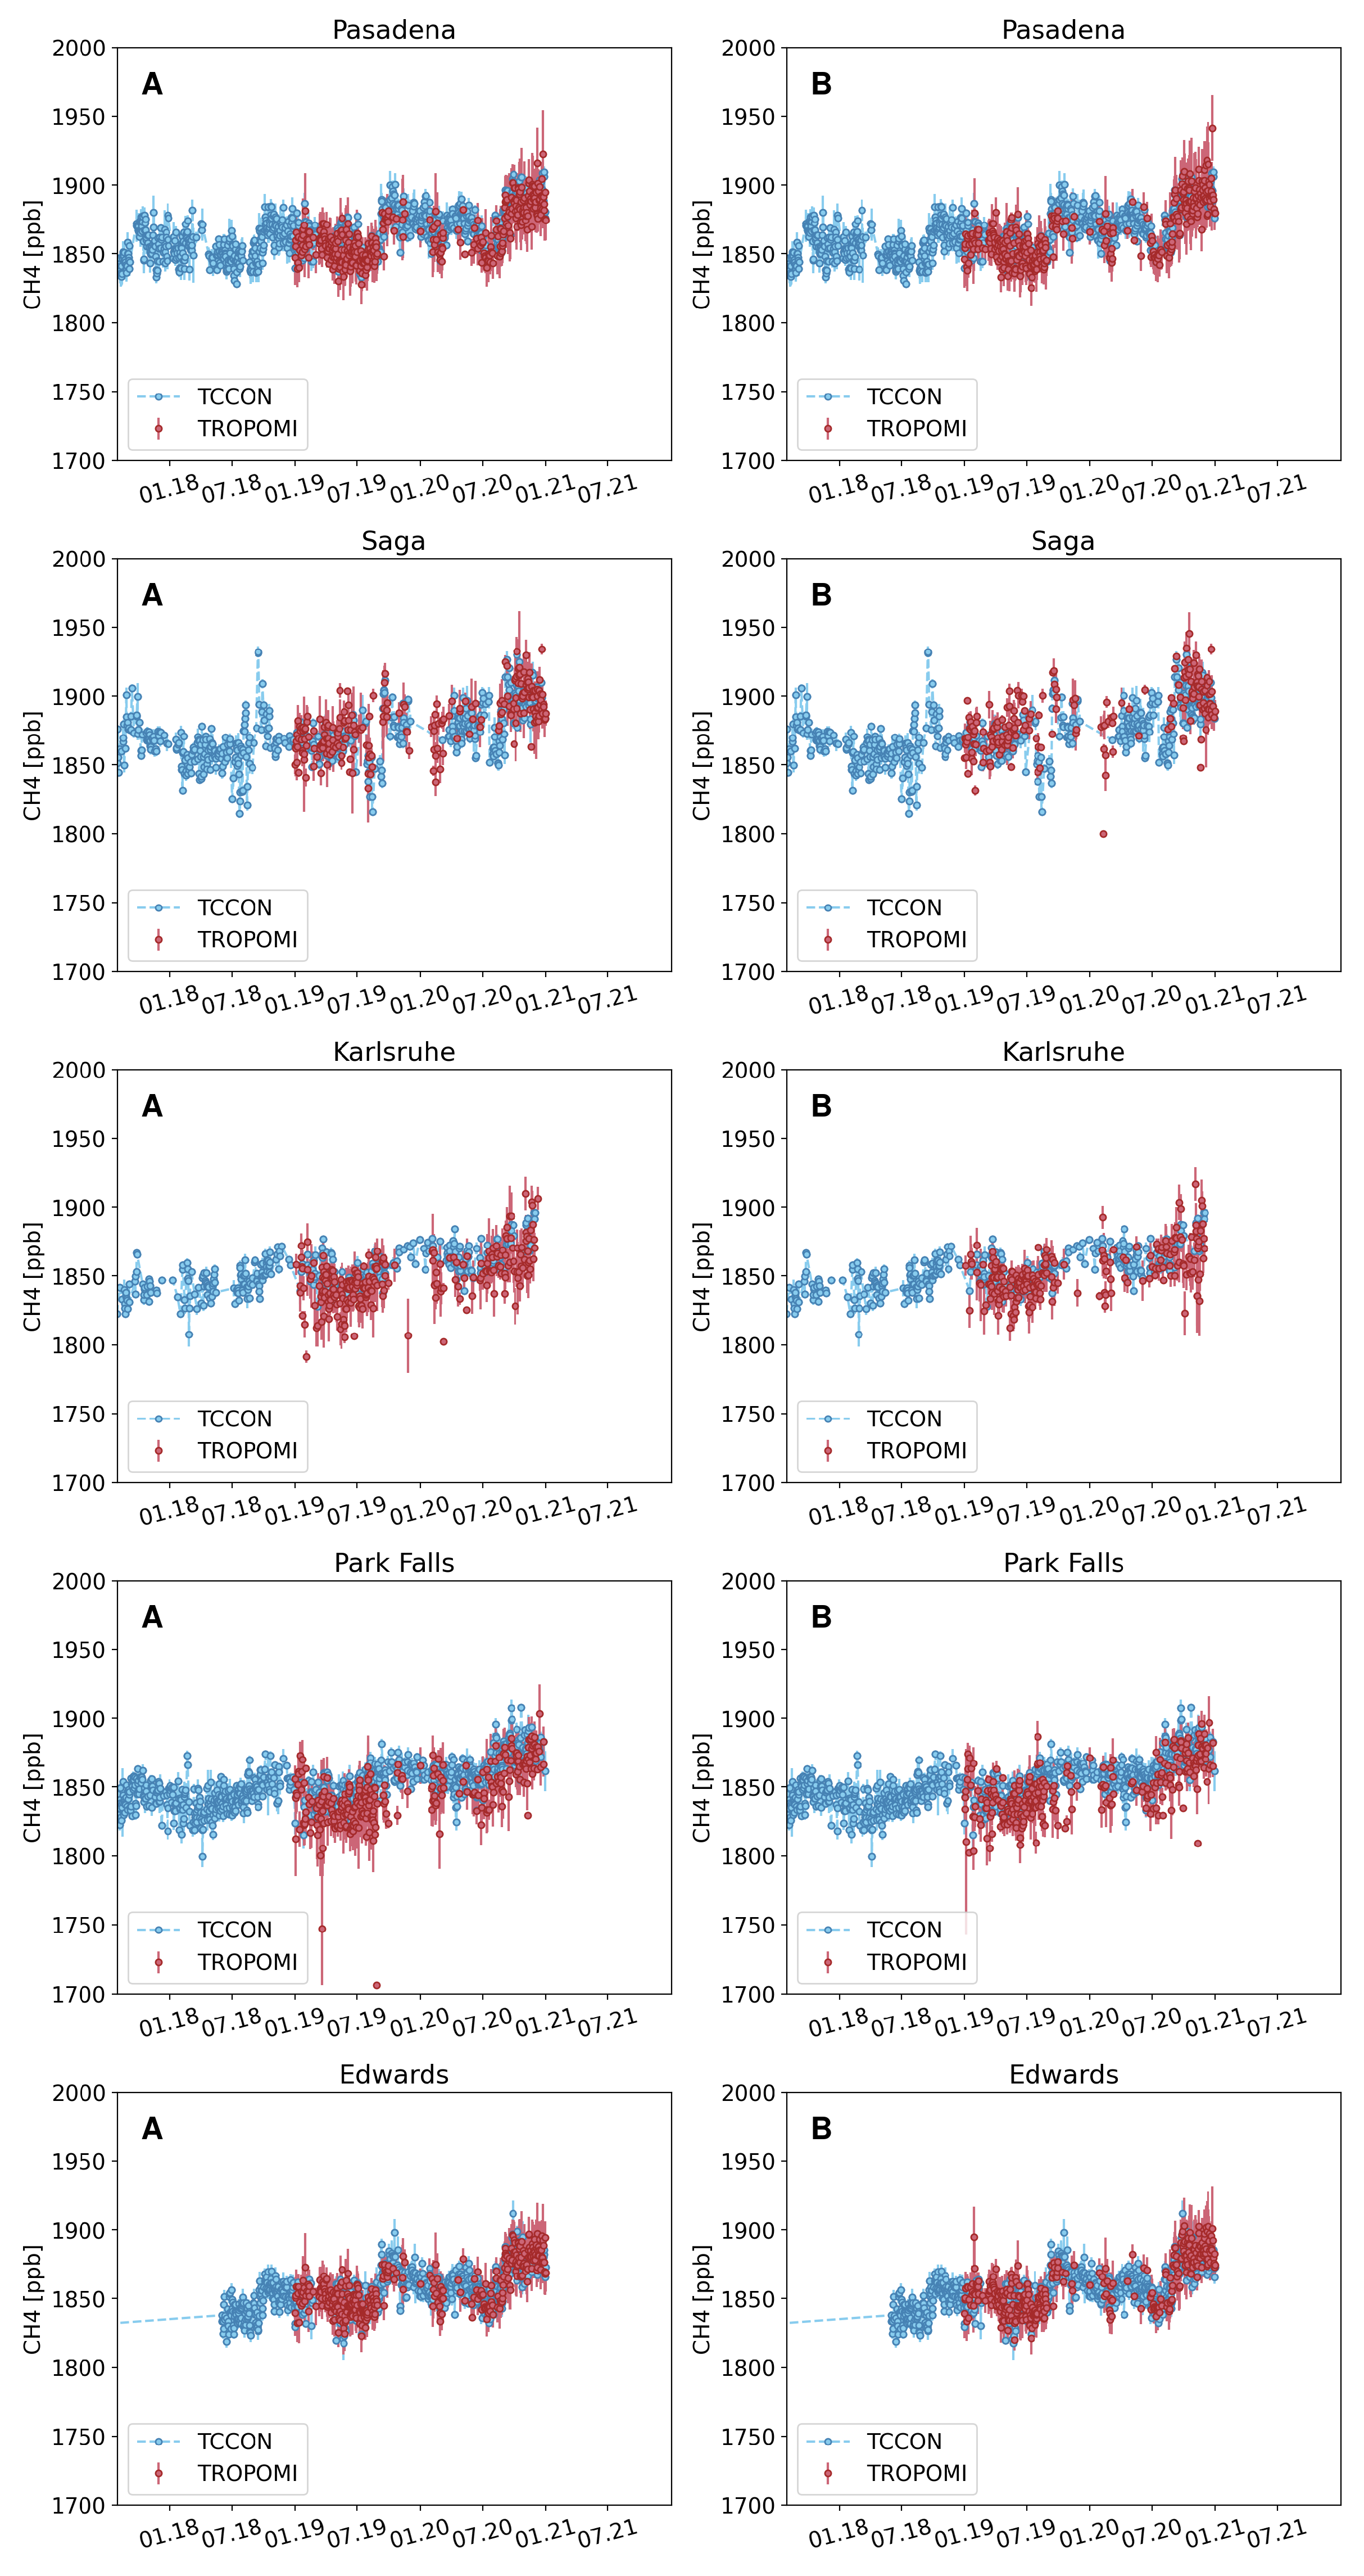
Figure A3.
As Figure 5 but for additional stations.
Figure A3.
As Figure 5 but for additional stations.
References
- Myhre, G.; Samset, B.H.; Schulz, M.; Balkanski, Y.; Bauer, S.; Berntsen, T.K.; Bian, H.; Bellouin, N.; Chin, M.; Diehl, T.; Easter, R.C.; Feichter, J.; Ghan, S.J.; Hauglustaine, D.; Iversen, T.; Kinne, S.; Kirkevåg, A.; Lamarque, J.F.; Lin, G.; Liu, X.; Lund, M.T.; Luo, G.; Ma, X.; van Noije, T.; Penner, J.E.; Rasch, P.J.; Ruiz, A.; Seland; Skeie, R.B.; Stier, P.; Takemura, T.; Tsigaridis, K.; Wang, P.; Wang, Z.; Xu, L.; Yu, H.; Yu, F.; Yoon, J.H.; Zhang, K.; Zhang, H.; Zhou, C. Radiative forcing of the direct aerosol effect from AeroCom Phase II simulations. Atmos. Chem. Phys. 2013, 13, 1853–1877. [Google Scholar] [CrossRef]
- Kirschke, S.; Bousquet, P.; Ciais, P.; Saunois, M.; Canadell, J.G.; Dlugokencky, E.J.; Bergamaschi, P.; Bergmann, D.; Blake, D.R.; Bruhwiler, L.; Cameron-Smith, P.; Castaldi, S.; Chevallier, F.; Feng, L.; Fraser, A.; Heimann, M.; Hodson, E.L.; Houweling, S.; Josse, B.; Fraser, P.J.; Krummel, P.B.; Lamarque, J.F.; Langenfelds, R.L.; Le Quéré, C.; Naik, V.; O’Doherty, S.; Palmer, P.I.; Pison, I.; Plummer, D.; Poulter, B.; Prinn, R.G.; Rigby, M.; Ringeval, B.; Santini, M.; Schmidt, M.; Shindell, D.T.; Simpson, I.J.; Spahni, R.; Steele, L.P.; Strode, S.A.; Sudo, K.; Szopa, S.; van der Werf, G.R.; Voulgarakis, A.; van Weele, M.; Weiss, R.F.; Williams, J.E.; Zeng, G. Three decades of global methane sources and sinks. Nature Geoscience 2013, 6, 813–823. [Google Scholar] [CrossRef]
- Lunt, M.F.; Palmer, P.I.; Feng, L.; Taylor, C.M.; Boesch, H.; Parker, R.J. An increase in methane emissions from tropical Africa between 2010 and 2016 inferred from satellite data. Atmospheric Chemistry and Physics 2019, 19, 14721–14740. [Google Scholar] [CrossRef]
- Maasakkers, J.D.; Varon, D.J.; Elfarsdóttir, A.; McKeever, J.; Jervis, D.; Mahapatra, G.; Pandey, S.; Lorente, A.; Borsdorff, T.; Foorthuis, L.R.; Schuit, B.J.; Tol, P.; van Kempen, T.A.; van Hees, R.; Aben, I. Using satellites to uncover large methane emissions from landfills. Science Advances 2022, 8, eabn9683. [Google Scholar] [CrossRef] [PubMed]
- Veefkind, J.; Aben, I.; McMullan, K.; Förster, H.; de Vries, J.; Otter, G.; Claas, J.; Eskes, H.; de Haan, J.; Kleipool, Q.; van Weele, M.; Hasekamp, O.; Hoogeveen, R.; Landgraf, J.; Snel, R.; Tol, P.; Ingmann, P.; Voors, R.; Kruizinga, B.; Vink, R.; Visser, H.; Levelt, P. TROPOMI on the ESA Sentinel-5 Precursor: A GMES mission for global observations of the atmospheric composition for climate, air quality and ozone layer applications. Remote Sensing of Environment 2012, 120, 70–83. [Google Scholar] [CrossRef]
- Haili, H.; Landgraf, J.; Detmers, R.; Borsdorff, T.; de Brugh, J.A.; Aben, I.; Butz, A.; Hasekamp, O. Toward Global Mapping of Methane With TROPOMI: First Results and Intersatellite Comparison to GOSAT. Geophysical Research Letters 2018, 45, 3682–3689. [Google Scholar] [CrossRef]
- Lorente, A.; Borsdorff, T.; Butz, A.; Hasekamp, O.; aan de Brugh, J.; Schneider, A.; Wu, L.; Hase, F.; Kivi, R.; Wunch, D.; Pollard, D.F.; Shiomi, K.; Deutscher, N.M.; Velazco, V.A.; Roehl, C.M.; Wennberg, P.O.; Warneke, T.; Landgraf, J. Methane retrieved from TROPOMI: improvement of the data product and validation of the first 2 years of measurements. Atmospheric Measurement Techniques 2021, 14, 665–684. [Google Scholar] [CrossRef]
- Lorente, A.; Borsdorff, T.; Martinez-Velarte, M.C.; Butz, A.; Hasekamp, O.P.; Wu, L.; Landgraf, J. Evaluation of the methane full-physics retrieval applied to TROPOMI ocean sun glint measurements. Atmospheric Measurement Techniques 2022, 15, 6585–6603. [Google Scholar] [CrossRef]
- Lorente, A.; Borsdorff, T.; Martinez-Velarte, M.C.; Landgraf, J. Accounting for surface reflectance spectral features in TROPOMI methane retrievals. Atmospheric Measurement Techniques 2023, 16, 1597–1608. [Google Scholar] [CrossRef]
- Pandey, S.; Gautam, R.; Houweling, S.; van der Gon, H.D.; Sadavarte, P.; Borsdorff, T.; Hasekamp, O.; Landgraf, J.; Tol, P.; van Kempen, T.; Hoogeveen, R.; van Hees, R.; Hamburg, S.P.; Maasakkers, J.D.; Aben, I. Satellite observations reveal extreme methane leakage from a natural gas well blowout. Proceedings of the National Academy of Sciences 2019, 116, 26376–26381. [Google Scholar] [CrossRef]
- Sha, M.K.; Langerock, B.; Blavier, J.F.L.; Blumenstock, T.; Borsdorff, T.; Buschmann, M.; Dehn, A.; De Mazière, M.; Deutscher, N.M.; Feist, D.G.; García, O.E.; Griffith, D.W.T.; Grutter, M.; Hannigan, J.W.; Hase, F.; Heikkinen, P.; Hermans, C.; Iraci, L.T.; Jeseck, P.; Jones, N.; Kivi, R.; Kumps, N.; Landgraf, J.; Lorente, A.; Mahieu, E.; Makarova, M.V.; Mellqvist, J.; Metzger, J.M.; Morino, I.; Nagahama, T.; Notholt, J.; Ohyama, H.; Ortega, I.; Palm, M.; Petri, C.; Pollard, D.F.; Rettinger, M.; Robinson, J.; Roche, S.; Roehl, C.M.; Röhling, A.N.; Rousogenous, C.; Schneider, M.; Shiomi, K.; Smale, D.; Stremme, W.; Strong, K.; Sussmann, R.; Té, Y.; Uchino, O.; Velazco, V.A.; Vigouroux, C.; Vrekoussis, M.; Wang, P.; Warneke, T.; Wizenberg, T.; Wunch, D.; Yamanouchi, S.; Yang, Y.; Zhou, M. Validation of methane and carbon monoxide from Sentinel-5 Precursor using TCCON and NDACC-IRWG stations. Atmospheric Measurement Techniques 2021, 14, 6249–6304. [Google Scholar] [CrossRef]
- Hu, H.; Hasekamp, O.; Butz, A.; Galli, A.; Landgraf, J.; Aan de Brugh, J.; Borsdorff, T.; Scheepmaker, R.; Aben, I. The operational methane retrieval algorithm for TROPOMI. Atmospheric Measurement Techniques 2016, 9, 5423–5440. [Google Scholar] [CrossRef]
- Taylor, T.E.; O’Dell, C.W.; Frankenberg, C.; Partain, P.T.; Cronk, H.Q.; Savtchenko, A.; Nelson, R.R.; Rosenthal, E.J.; Chang, A.Y.; Fisher, B.; Osterman, G.B.; Pollock, R.H.; Crisp, D.; Eldering, A.; Gunson, M.R. Orbiting Carbon Observatory-2 (OCO-2) cloud screening algorithms: validation against collocated MODIS and CALIOP data. Atmospheric Measurement Techniques 2016, 9, 973–989. [Google Scholar] [CrossRef]
- Cao, C.; Blonski, S.; Wang, W.; Uprety, S.; Shao, X.; Choi, J.; Lynch, E.; Kalluri, S. NOAA-20 VIIRS on-orbit performance, data quality, and operational Cal/Val support. 2018, p. 21. [CrossRef]
- Inness, A.; Aben, I.; Ades, M.; Borsdorff, T.; Flemming, J.; Landgraf, J.; Langerock, B.; Parrington, M.; Ribas, R. Monitoring and assimilation of S5P/TROPOMI carbon monoxide data with the global CAMS near-real time system. Atmospheric Chemistry and Physics Discussions 2022, 2022, 1–39. [Google Scholar] [CrossRef]
- Jackson, J.M.; Liu, H.; Laszlo, I.; Kondragunta, S.; Remer, L.A.; Huang, J.; Huang, H.C. Suomi-NPP VIIRS aerosol algorithms and data products. Journal of Geophysical Research: Atmospheres 2013, 118, 12,673–12,689. [Google Scholar] [CrossRef]
- Siddans, R. S5P-NPP Cloud Processor ATBD. Atbd, RAL, Harwell Campus, Didcot, Oxfordshire, OX11 0QX, UK, 2016.
- O., H.; A., L.; H., H.; A., B.; aan de Brugh J..; J., L. Algorithm Theoretical Baseline Document for Sentinel-5 Precursor Methane Retrieval. Atbd, SRON, Sorbonnelaan 2, 3584 CA Utrecht, The Netherlands, 2016.
- Landgraf, J.; aan de Brugh, J.; Borsdorff, T.; Houweling, S. ; O., H. Algorithm Theoretical Baseline Document for Sentinel-5 Precursor: Carbon Monoxide Total Column Retrieval. Atbd, SRON, Sorbonnelaan 2, 3584 CA Utrecht, The Netherlands, 2016.
- Borsdorff, T.; de Brugh, J.A.; Hu, H.; Aben, I.; Hasekamp, O.; Landgraf, J. Measuring Carbon Monoxide With TROPOMI: First Results and a Comparison With ECMWF-IFS Analysis Data. Geophysical Research Letters 2018, 45, 2826–2832. [Google Scholar] [CrossRef]
- Borsdorff, T.; aan de Brugh, J.; Hu, H.; Hasekamp, O.; Sussmann, R.; Rettinger, M.; Hase, F.; Gross, J.; Schneider, M.; Garcia, O.; Stremme, W.; Grutter, M.; Feist, D.G.; Arnold, S.G.; De Mazière, M.; Kumar Sha, M.; Pollard, D.F.; Kiel, M.; Roehl, C.; Wennberg, P.O.; Toon, G.C.; Landgraf, J. Mapping carbon monoxide pollution from space down to city scales with daily global coverage. Atmospheric Measurement Techniques Discussions 2018, 2018, 1–19. [Google Scholar] [CrossRef]
- Borsdorff, T.; García Reynoso, A.; Maldonado, G.; Mar-Morales, B.; Stremme, W.; Grutter, M.; Landgraf, J. Monitoring CO emissions of the metropolis Mexico City using TROPOMI CO observations. Atmospheric Chemistry and Physics 2020, 20, 15761–15774. [Google Scholar] [CrossRef]
- Borsdorff, T.; Hasekamp, O.P.; Wassmann, A.; Landgraf, J. Insights into Tikhonov regularization: application to trace gas column retrieval and the efficient calculation of total column averaging kernels. Atmospheric Measurement Techniques 2014, 7, 523–535. [Google Scholar] [CrossRef]
- Butz, A.; Guerlet, S.; Hasekamp, O.; Schepers, D.; Galli, A.; Aben, I.; Frankenberg, C.; Hartmann, J.M.; Tran, H.; Kuze, A.; Keppel-Aleks, G.; Toon, G.; Wunch, D.; Wennberg, P.; Deutscher, N.; Griffith, D.; Macatangay, R.; Messerschmidt, J.; Notholt, J.; Warneke, T. Toward accurate CO2 and CH4 observations from GOSAT. Geophysical Research Letters 2011, 38, n/a–n/a. [Google Scholar] [CrossRef]
- Lorente, A.; Boersma, K.F.; Eskes, H.J.; Veefkind, J.P.; van Geffen, J.H.G.M.; de Zeeuw, M.B.; Denier van der Gon, H.A.C.; Beirle, S.; Krol, M.C. Quantification of nitrogen oxides emissions from build-up of pollution over Paris with TROPOMI. Scientific Reports 2019, 9, 20033. [Google Scholar] [CrossRef]
- Kivi, R.; Heikkinen, P.; Kyrö, E. TCCON data from Sodankylä (FI), Release GGG2014.R0, 2014. Funding by Finnish Meteorological Institute GRID grid.8657.c. [CrossRef]
- Kivi, R.; Heikkinen, P. Fourier transform spectrometer measurements of column CO2 at Sodankylä, Finland. Geoscientific Instrumentation, Methods and Data Systems 2016, 5, 271–279. [Google Scholar] [CrossRef]
- Wunch, D.; Mendonca, J.; Colebatch, O.; Allen, N.T.; Blavier, J.F.; Roche, S.; Hedelius, J.; Neufeld, G.; Springett, S.; Worthy, D.; et al. . TCCON data from East Trout Lake, SK (CA), Release GGG2014.R1, 2018. Funding by Canada Foundation for Innovation GRID grid.439998.6. [CrossRef]
- Hase, F.; Blumenstock, T.; Dohe, S.; Groß, J.; Kiel, M. TCCON data from Karlsruhe (DE), Release GGG2014.R0, 2014. Funding by Helmholtz Association of German Research Centres GRID grid.211011.2. [CrossRef]
- Warneke, T.; Messerschmidt, J.; Notholt, J.; Weinzierl, C.; Deutscher, N.M.; Petri, C.; Grupe, P. TCCON data from Orléans (FR), Release GGG2014.R0, 2014. Funding by European Union GRID grid.453396.e. [CrossRef]
- Wennberg, P.O.; Roehl, C.M.; Wunch, D.; Toon, G.C.; Blavier, J.F.; Washenfelder, R.; Keppel-Aleks, G.; Allen, N.T.; Ayers, J. TCCON data from Park Falls (US), Release GGG2014.R1, 2017. Funding by National Aeronautics and Space Administration GRID grid.238252.c. [CrossRef]
- Wennberg, P.O.; Wunch, D.; Roehl, C.M.; Blavier, J.F.; Toon, G.C.; Allen, N.T. TCCON data from Lamont (US), Release GGG2014.R1, 2016. Funding by National Aeronautics and Space Administration GRID grid.238252.c. [CrossRef]
- Wennberg, P.O.; Wunch, D.; Roehl, C.M.; Blavier, J.F.; Toon, G.C.; Allen, N.T. TCCON data from Caltech (US), Release GGG2014.R0, 2016. Funding by National Aeronautics and Space Administration GRID grid.238252.c. [CrossRef]
- Iraci, L.T.; Podolske, J.R.; Hillyard, P.W.; Roehl, C.; Wennberg, P.O.; Blavier, J.F.; Landeros, J.; Allen, N.; Wunch, D.; Zavaleta, J.; et al. . TCCON data from Edwards (US), Release GGG2014.R1, 2016. Funding by National Aeronautics and Space Administration GRID grid.238252.c. [CrossRef]
- Kawakami, S.; Ohyama, H.; Arai, K.; Okumura, H.; Taura, C.; Fukamachi, T.; Sakashita, M. TCCON data from Saga (JP), Release GGG2014.R0, 2014. [CrossRef]
- Griffith, D.W.; Deutscher, N.M.; Velazco, V.A.; Wennberg, P.O.; Yavin, Y.; Keppel-Aleks, G.; Washenfelder, R.A.; Toon, G.C.; Blavier, J.F.; Paton-Walsh, C.; et al. . TCCON data from Darwin (AU), Release GGG2014.R0, 2014. Funding by National Aeronautics and Space Administration GRID grid.238252.c. [CrossRef]
- Griffith, D.W.; Velazco, V.A.; Deutscher, N.M.; Paton-Walsh, C.; Jones, N.B.; Wilson, S.R.; Macatangay, R.C.; Kettlewell, G.C.; Buchholz, R.R.; Riggenbach, M.O. TCCON data from Wollongong (AU), Release GGG2014.R0, 2014. Funding by National Aeronautics and Space Administration GRID grid.238252.c. [CrossRef]
- Pollard, D.F.; Robinson, J.; Shiona, H. TCCON data from Lauder (NZ), Release GGG2014.R0, 2019. Funding by National Institute of Water and Atmospheric Research GRID grid.419676.b. [CrossRef]
- Sherlock, V.; Connor, B.; Robinson, J.; Shiona, H.; Smale, D.; Pollard, D.F. TCCON data from Lauder (NZ), 125HR, Release GGG2014.R0, 2014. Funding by National Institute of Water and Atmospheric Research GRID grid.419676.b. [CrossRef]
- Pedregosa, F.; Varoquaux, G.; Gramfort, A.; Michel, V.; Thirion, B.; Grisel, O.; Blondel, M.; Prettenhofer, P.; Weiss, R.; Dubourg, V.; Vanderplas, J.; Passos, A.; Cournapeau, D.; Brucher, M.; Perrot, M.; Duchesnay, E. Scikit-learn: Machine Learning in Python. Journal of Machine Learning Research 2011, 12, 2825–2830. [Google Scholar]
- Borsdorff, T.; aan de Brugh, J.; Schneider, A.; Lorente, A.; Birk, M.; Wagner, G.; Kivi, R.; Hase, F.; Feist, D.G.; Sussmann, R.; Rettinger, M.; Wunch, D.; Warneke, T.; Landgraf, J. Improving the TROPOMI CO data product: update of the spectroscopic database and destriping of single orbits. Atmospheric Measurement Techniques 2019, 12, 5443–5455. [Google Scholar] [CrossRef]
- Schneider, A.; Borsdorff, T.; aan de Brugh, J.; Lorente, A.; Aemisegger, F.; Noone, D.; Henze, D.; Kivi, R.; Landgraf, J. Retrieving H2O/HDO columns over cloudy and clear-sky scenes from the Tropospheric Monitoring Instrument (TROPOMI). Atmospheric Measurement Techniques 2022, 15, 2251–2275. [Google Scholar] [CrossRef]
Figure 1.
Evaluation of the iterative training performance of the Random Forest Classifier (RFC). (Top panel) Relative number of true clear-sky and true-cloudy (red), false cloudy (yellow), and false clear-sky (blue) classifications as a function of the number of orbits used for training the RFC. These metrics are derived from the analysis of 1000 randomly selected orbits in each iteration. (Bottom panel) (B), Corresponding prediction scatter percentage is provided.
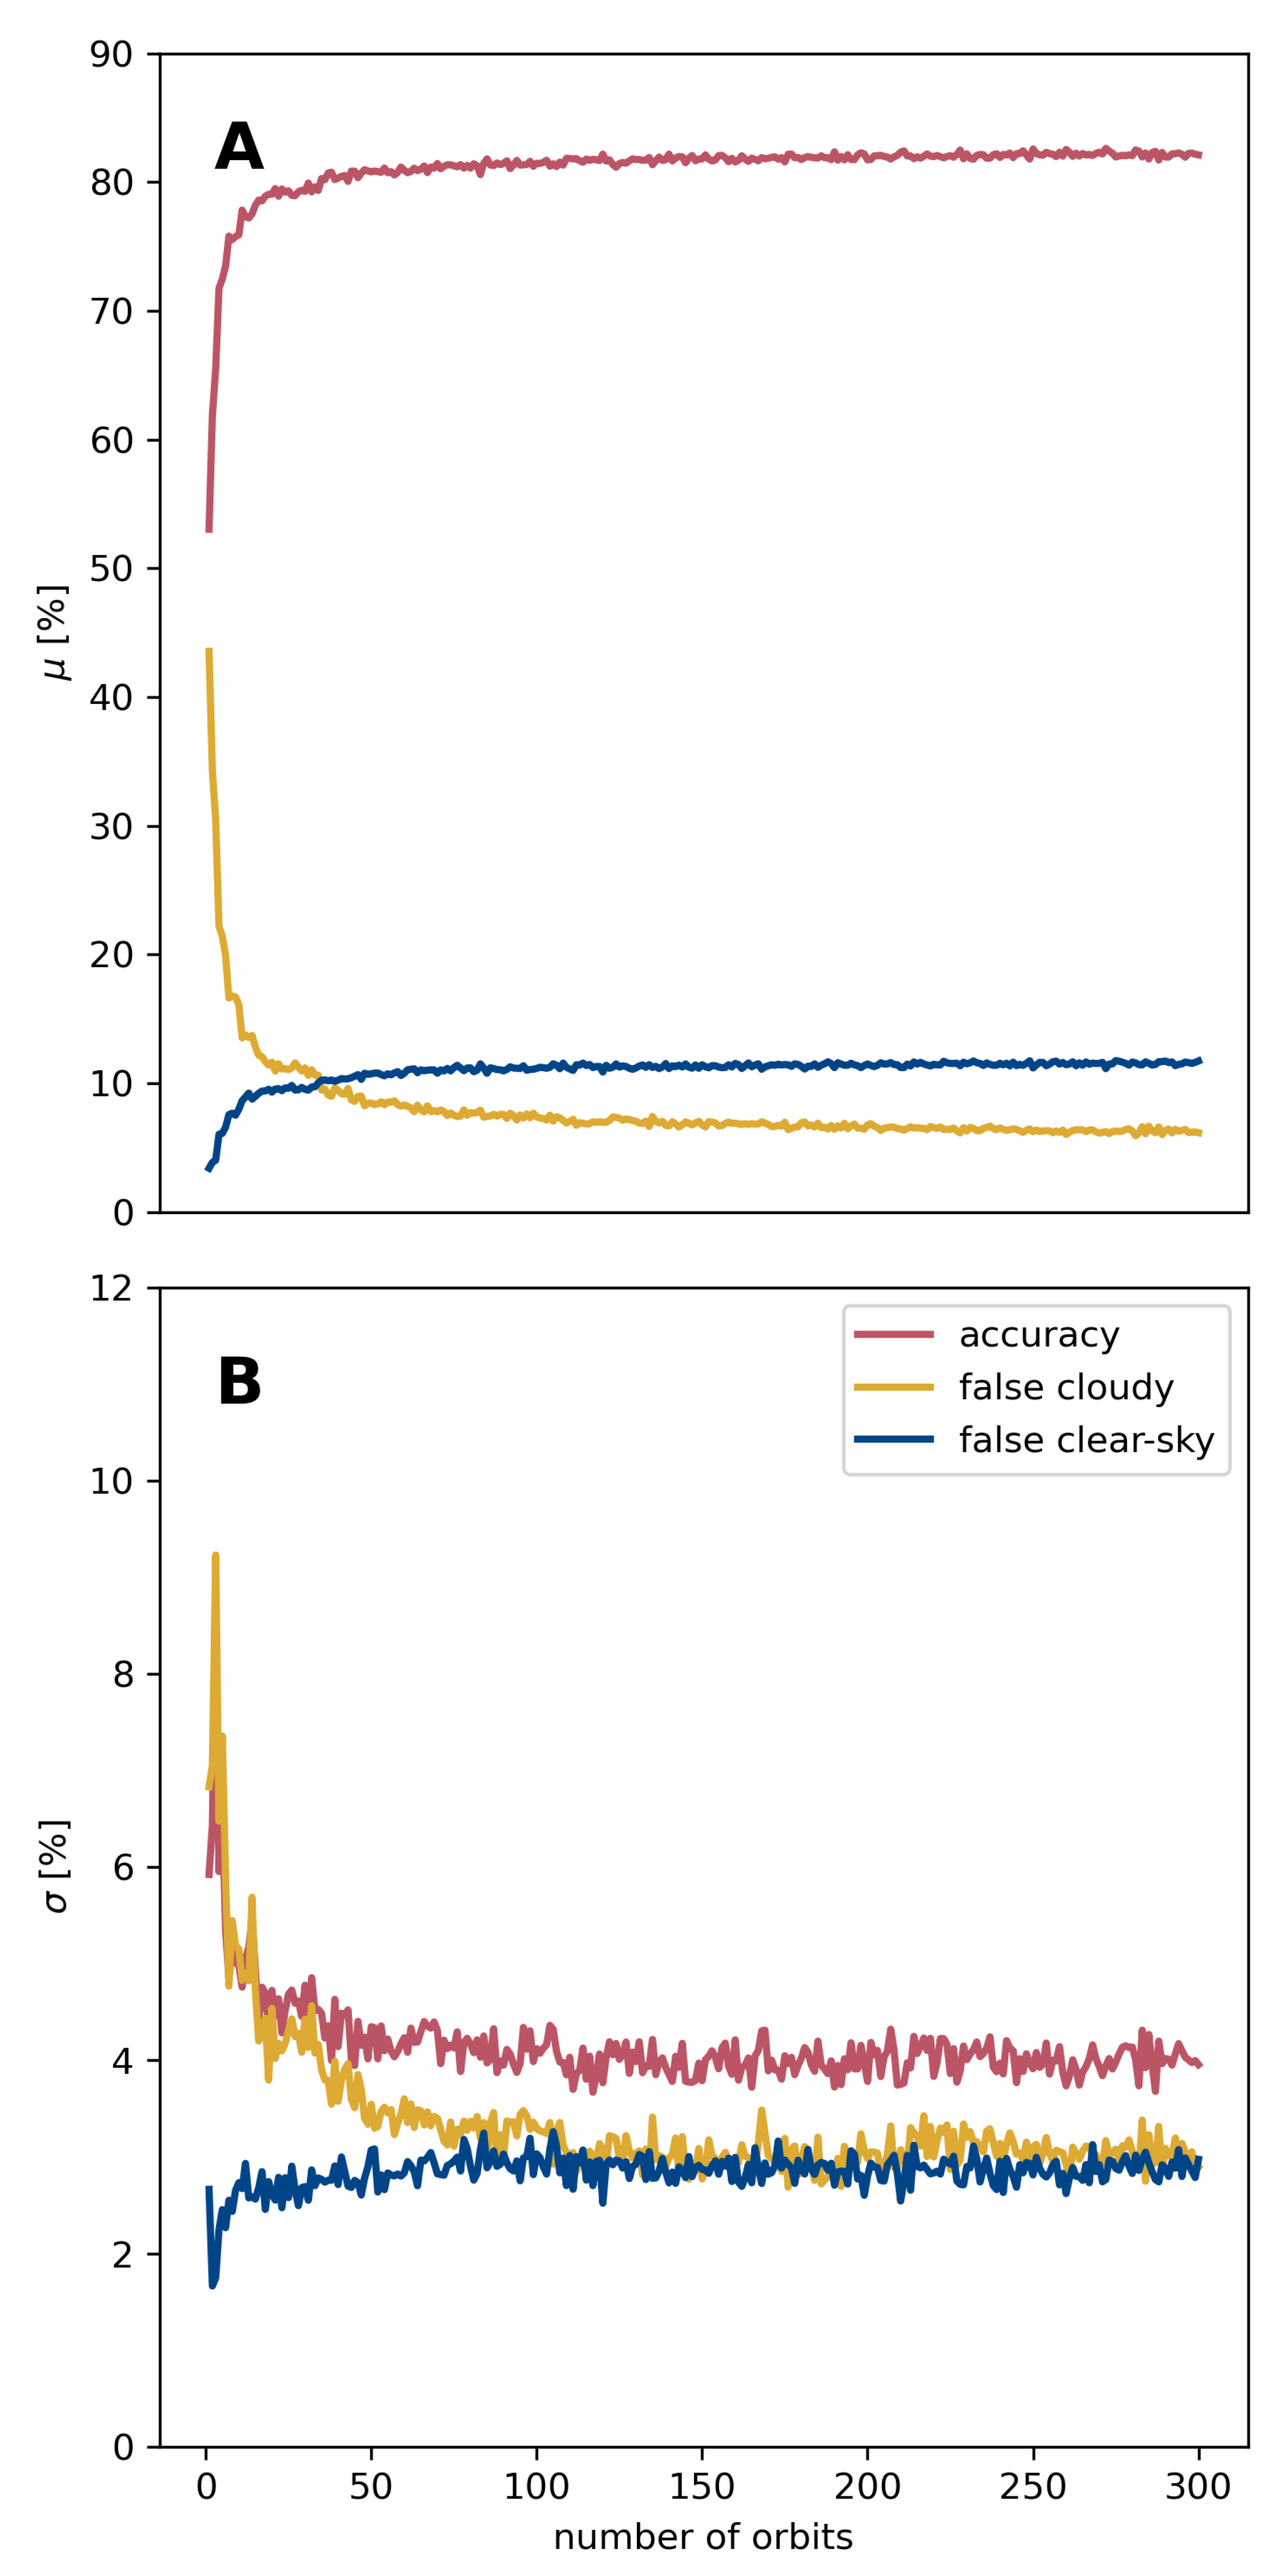
Figure 2.
Destriping method based on moving median smoothing. (A) Original TROPOMI XCH4 data retrieved from the strong methane absorption by the TROPOMI CO retrieval (lat 37.42, lon 61.45) with evident striping and a pollution plume in the center, likely due to a pipeline leak. (B) Background derived by smoothing (A) in the across-track direction. (C) Striping pattern obtained by smoothing the difference between A and B in the flight direction. (D) Final destriped TROPOMI XCH4 data with the pollution plume well preserved.
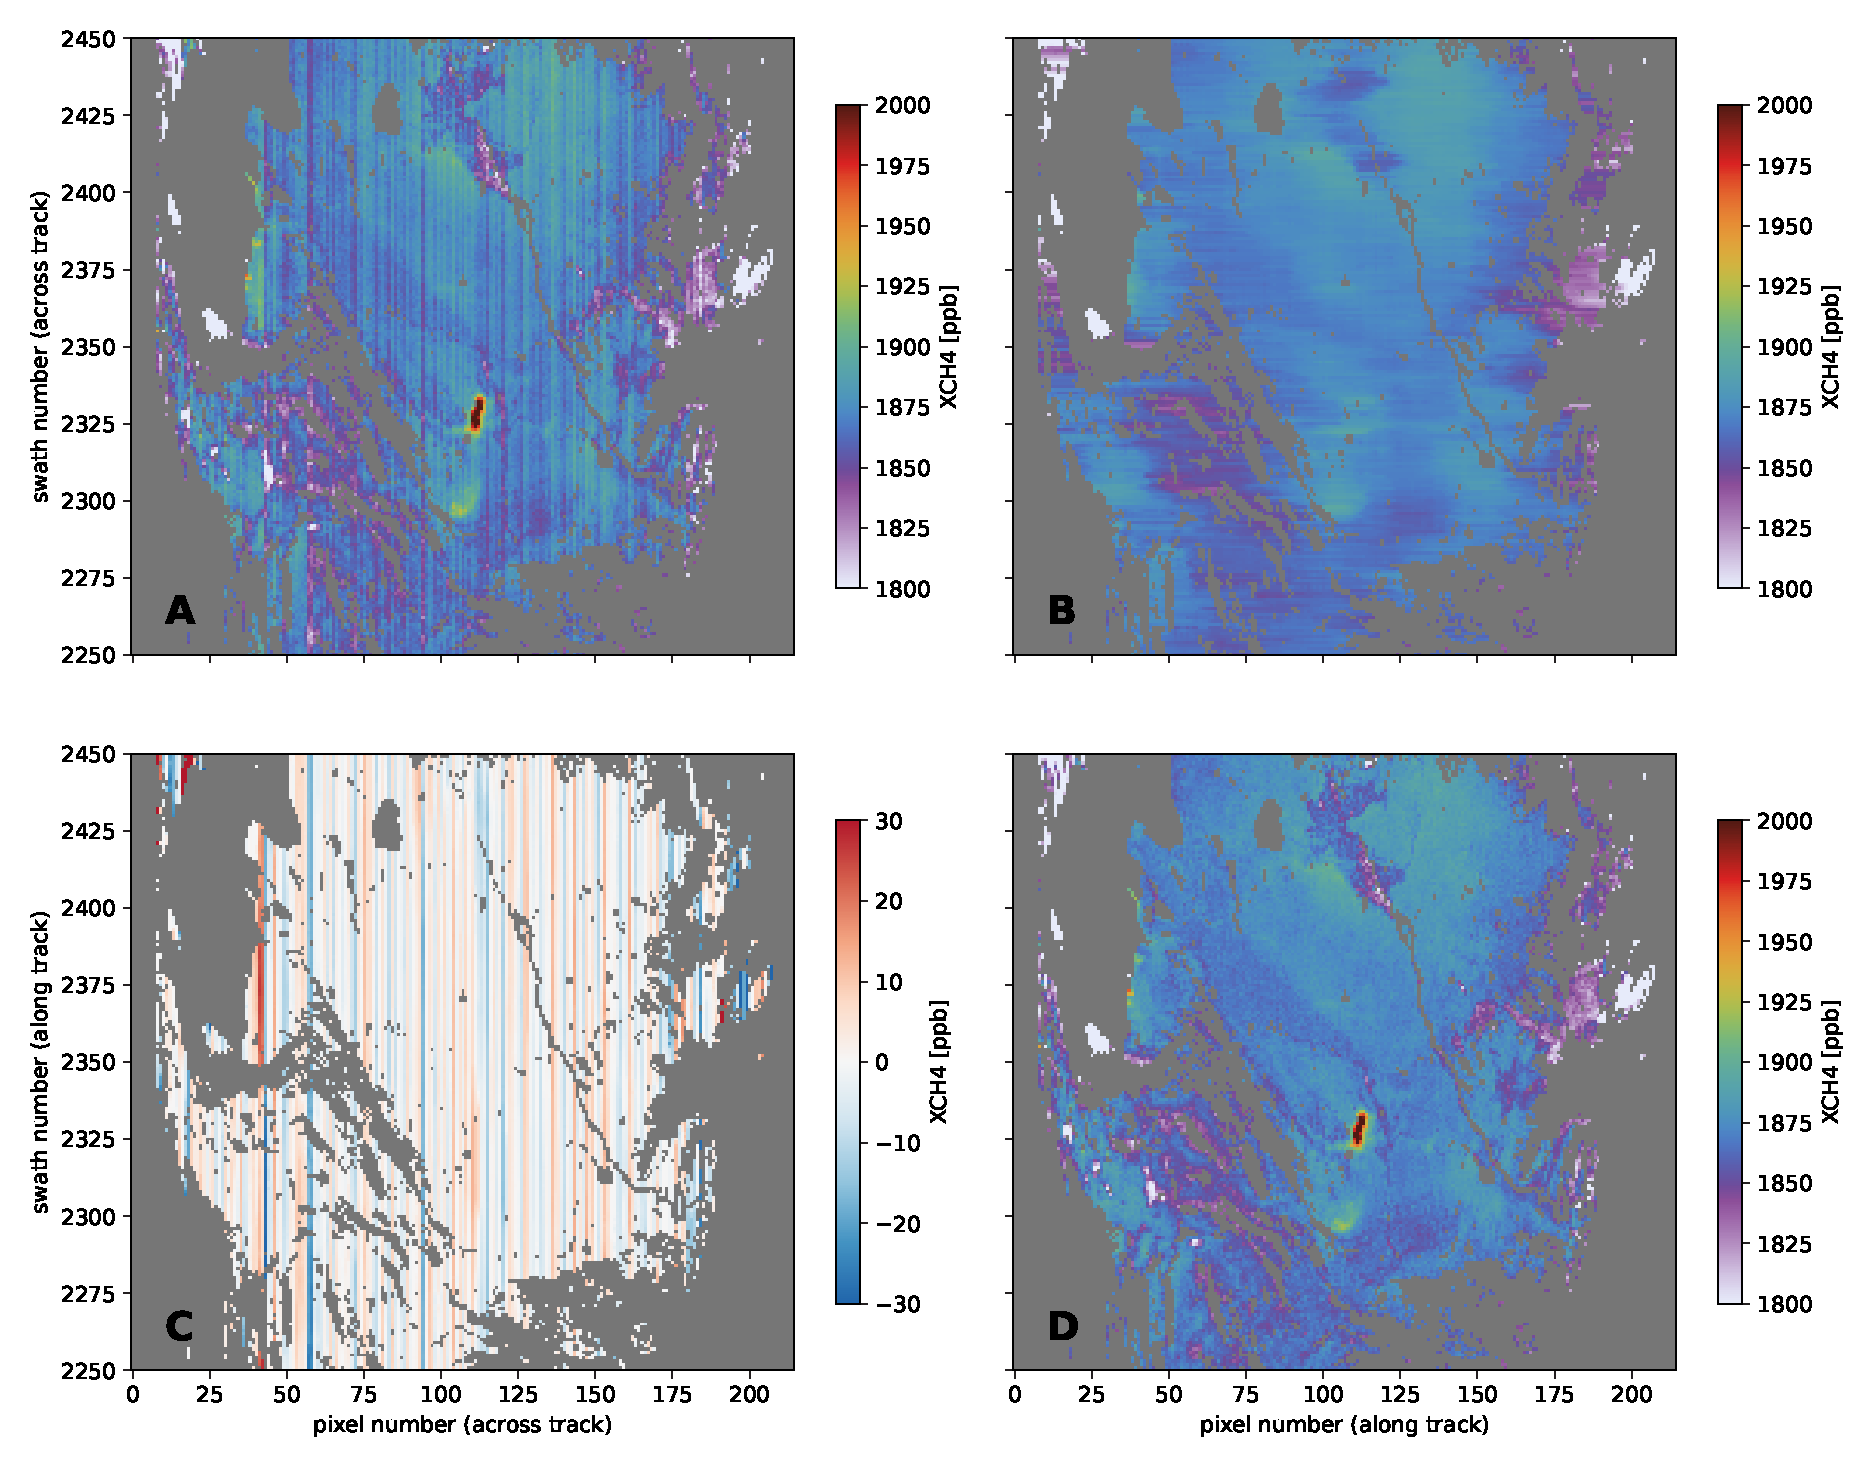
Figure 3.
Time Series of TROPOMI XCH4 for three month in 2022 over Siberia, North America, and Australia. Daily histograms are shown, with the mean as a black strip, standard deviation as a box, and whiskers depicting the 2.5st and 97.5th percentiles. Outliers are highlighted in red. (A) Data quality for TROPOMI XCH4 is degraded in August due to missing VIIRS cloud data used for cloud screening. (B) In August, a new machine learning approach, proposed in this study, is applied to filter and enhance the data quality.
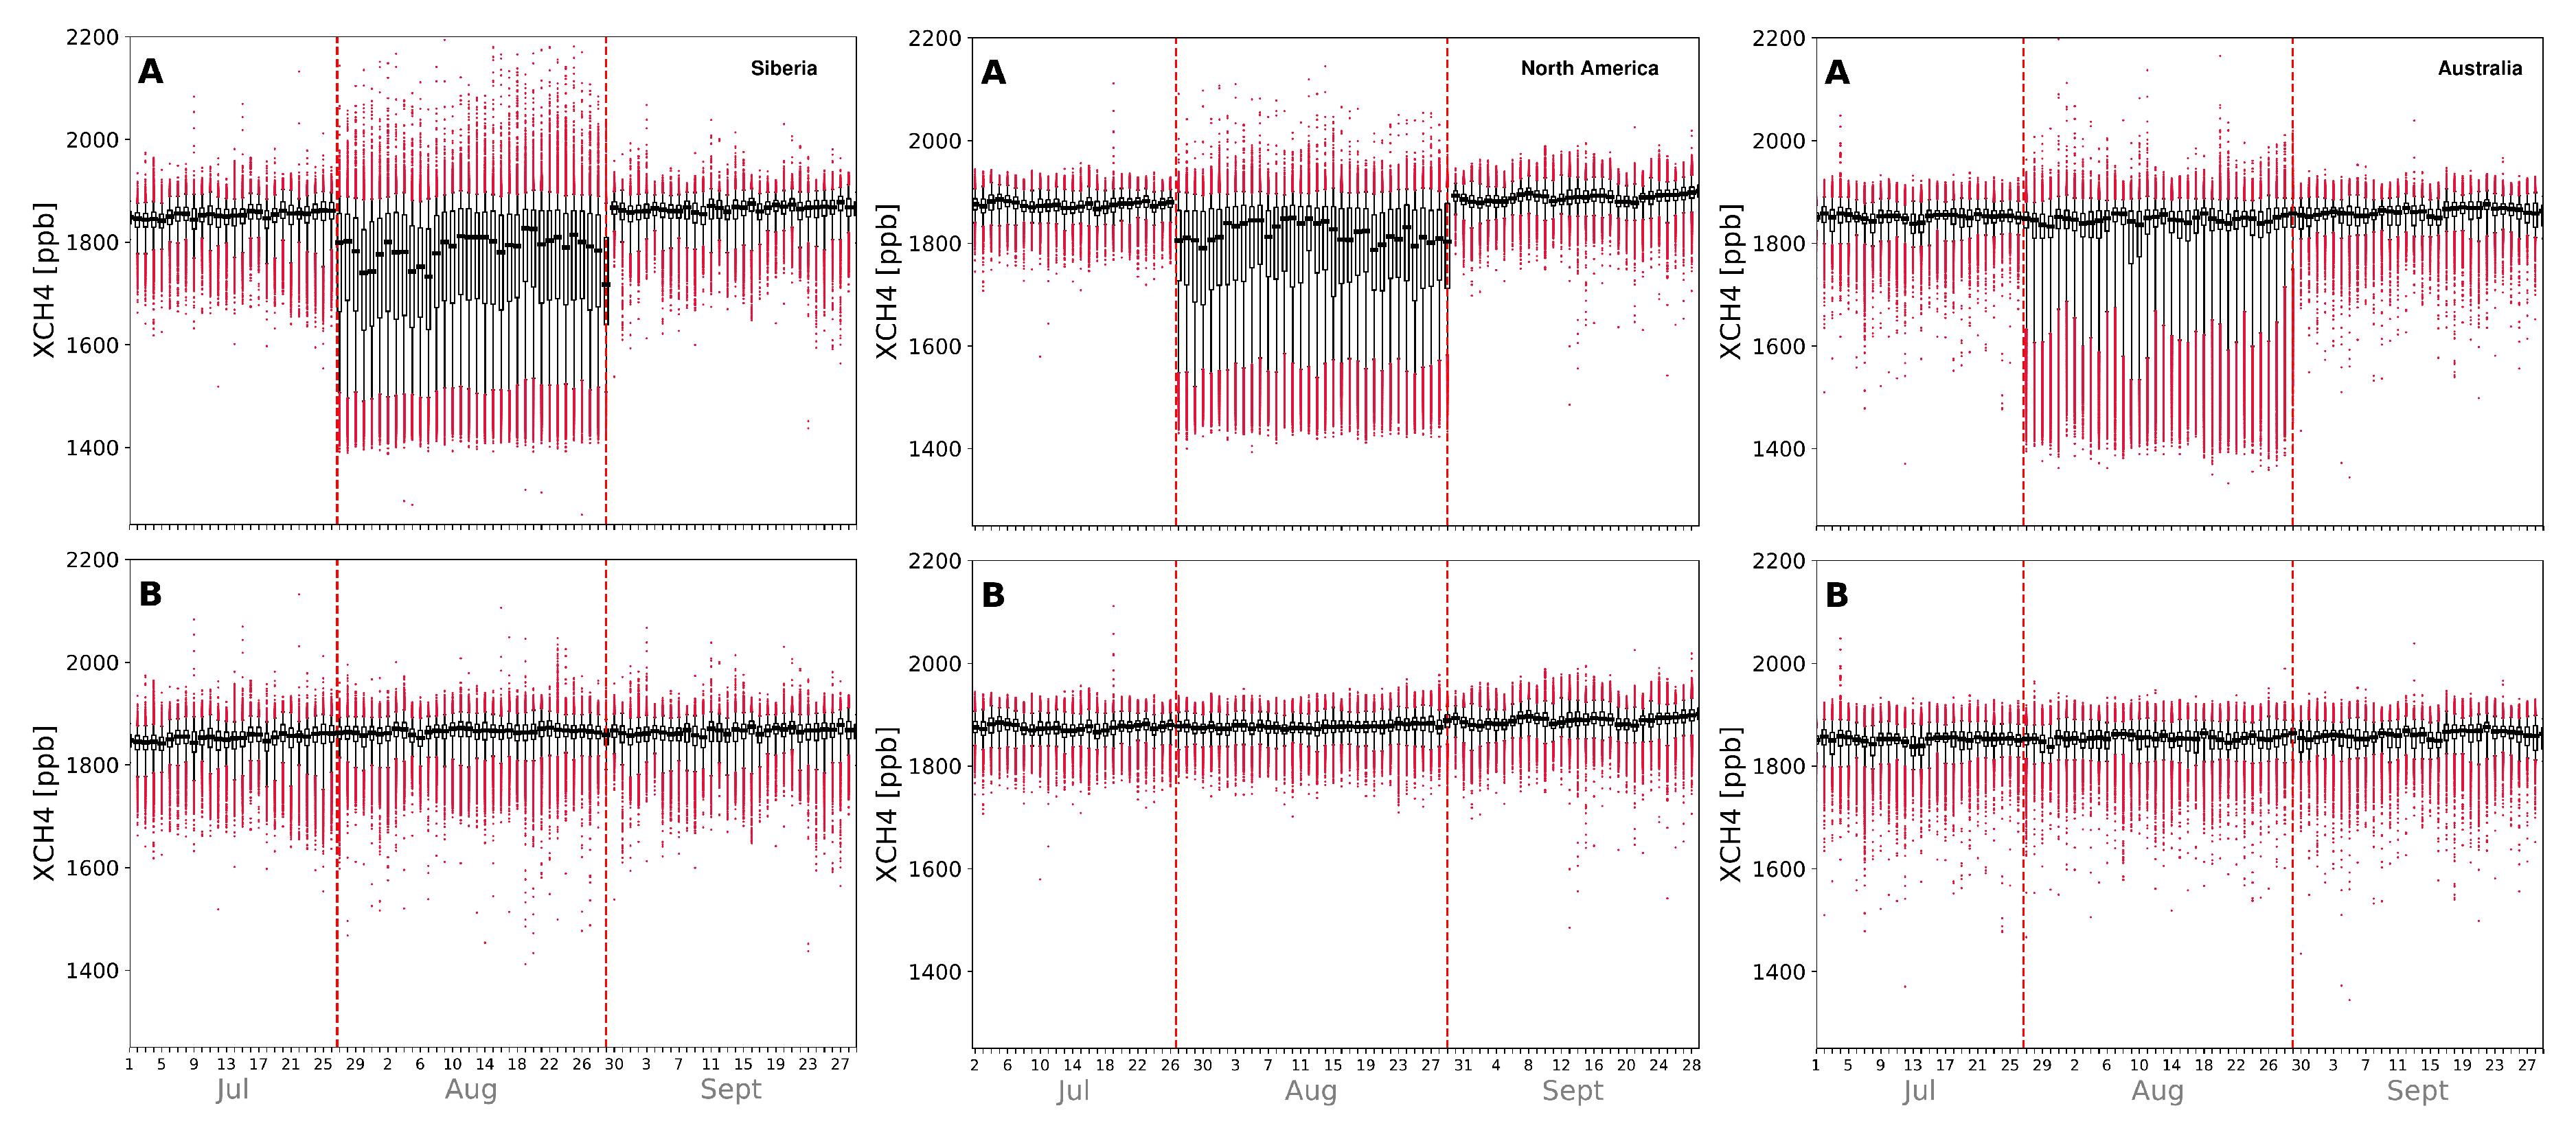
Figure 4.
TROPOMI XCH4 retrieval over North America for orbit 22706 on the 1st of March 2020. (A) Cloud clearing carried out using the new machine learning approach of this study. (B) Cloud clearing performed using the resampled VIIRS cloud product.
Figure 4.
TROPOMI XCH4 retrieval over North America for orbit 22706 on the 1st of March 2020. (A) Cloud clearing carried out using the new machine learning approach of this study. (B) Cloud clearing performed using the resampled VIIRS cloud product.
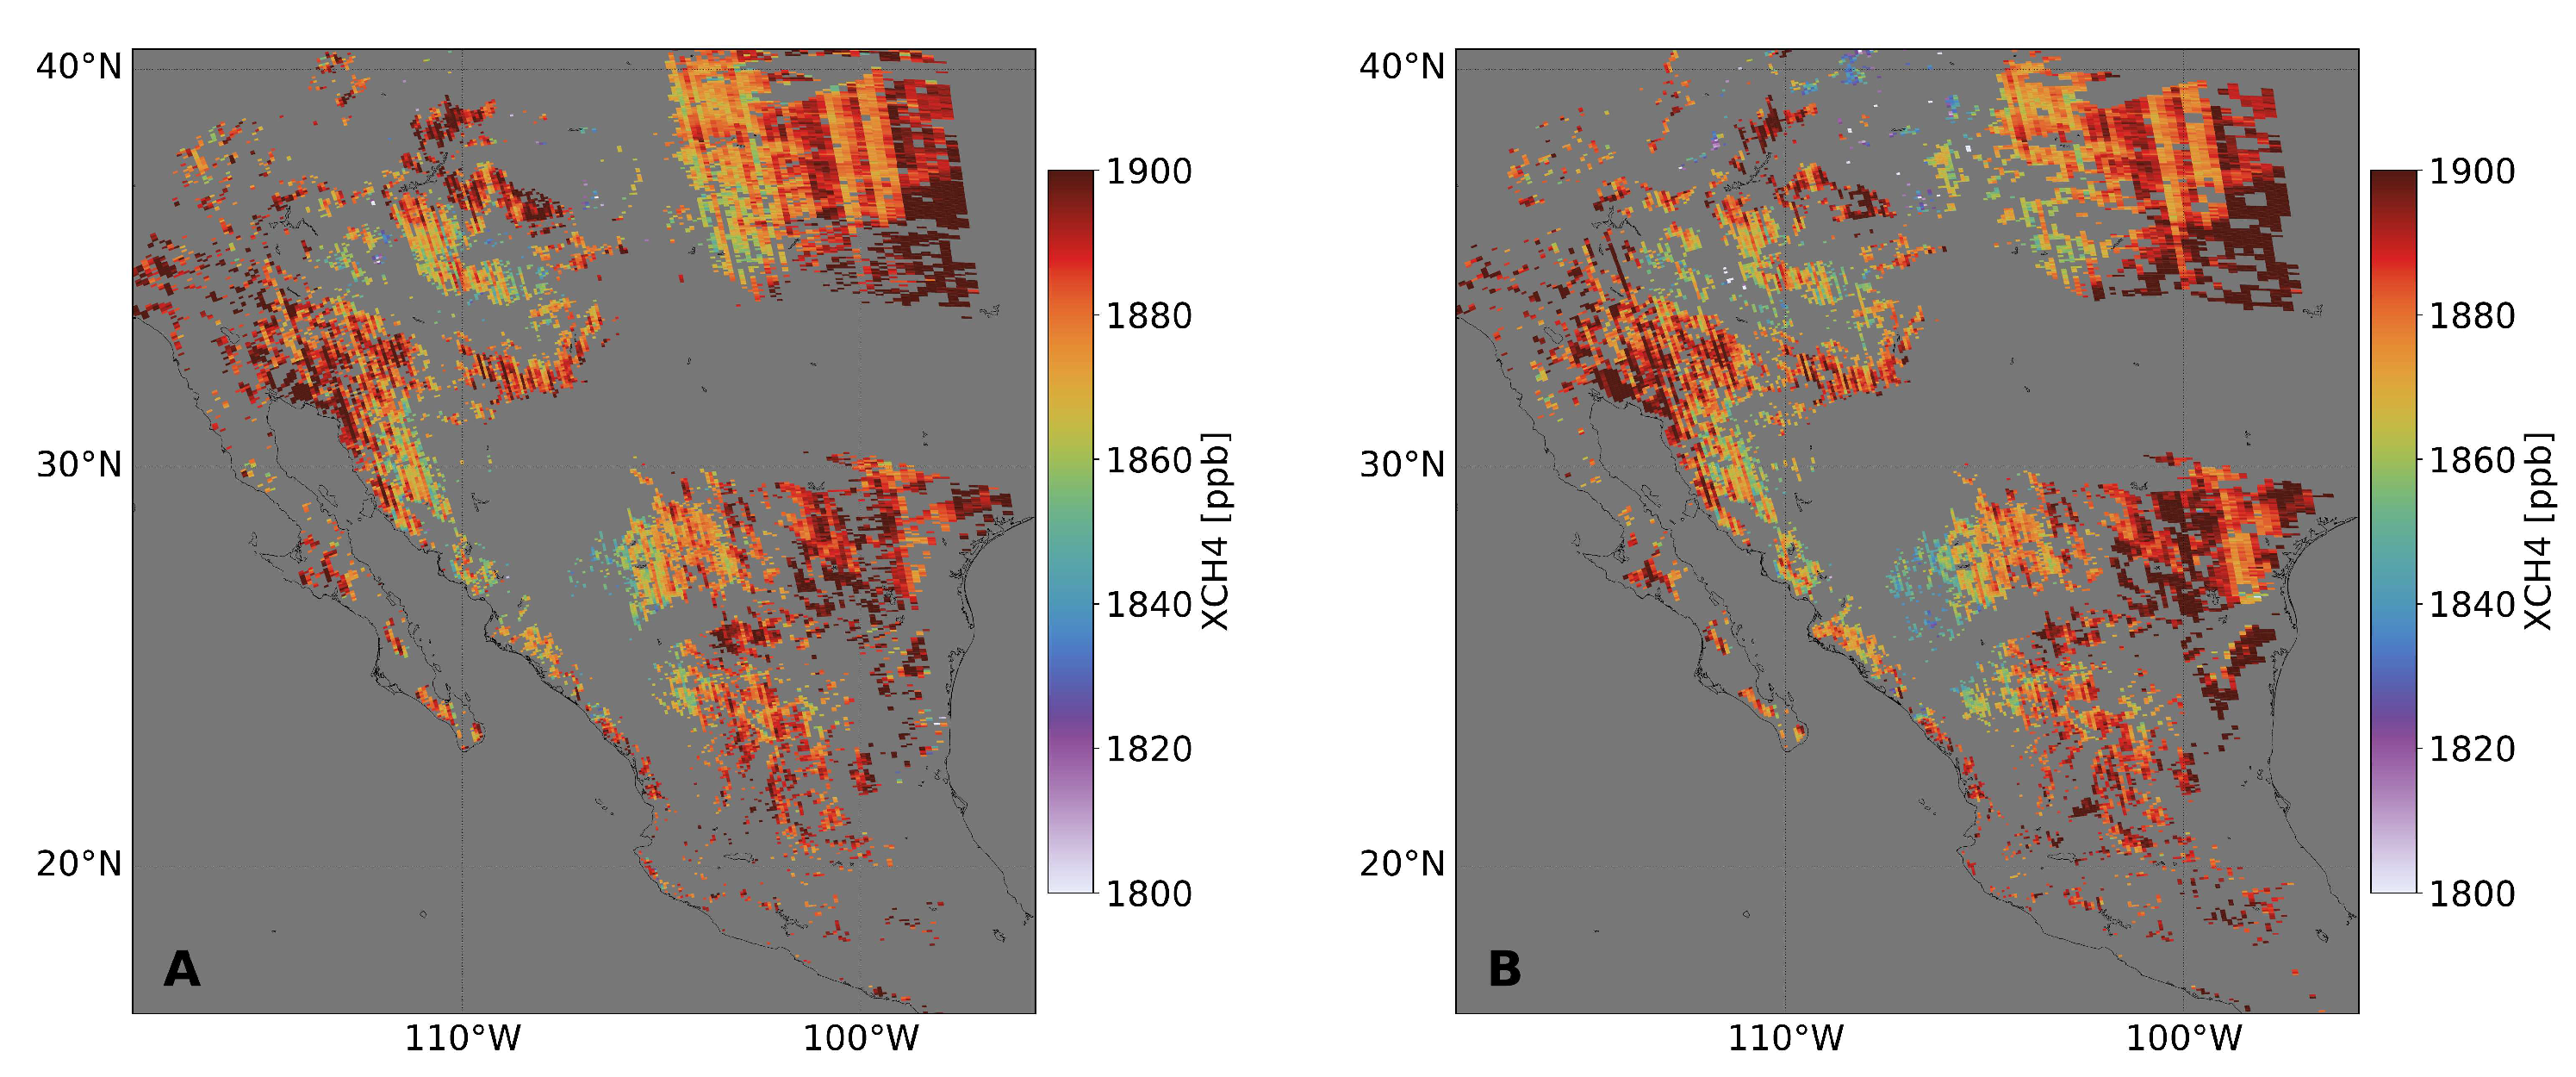
Figure 5.
Validation of TROPOMI XCH4 against ground-based TCCON measurements at Sodankyla, Finland and Wollongong, Australia. Daily means are displayed (blue for TCCON, red for TROPOMI), with whiskers indicating the daily measurement standard deviation. (A) shows TROPOMI XCH4 using the RFC cloud clearing approach for two TCCON stations. (B) same but using the collocated VIIRS data for cloud clearing.
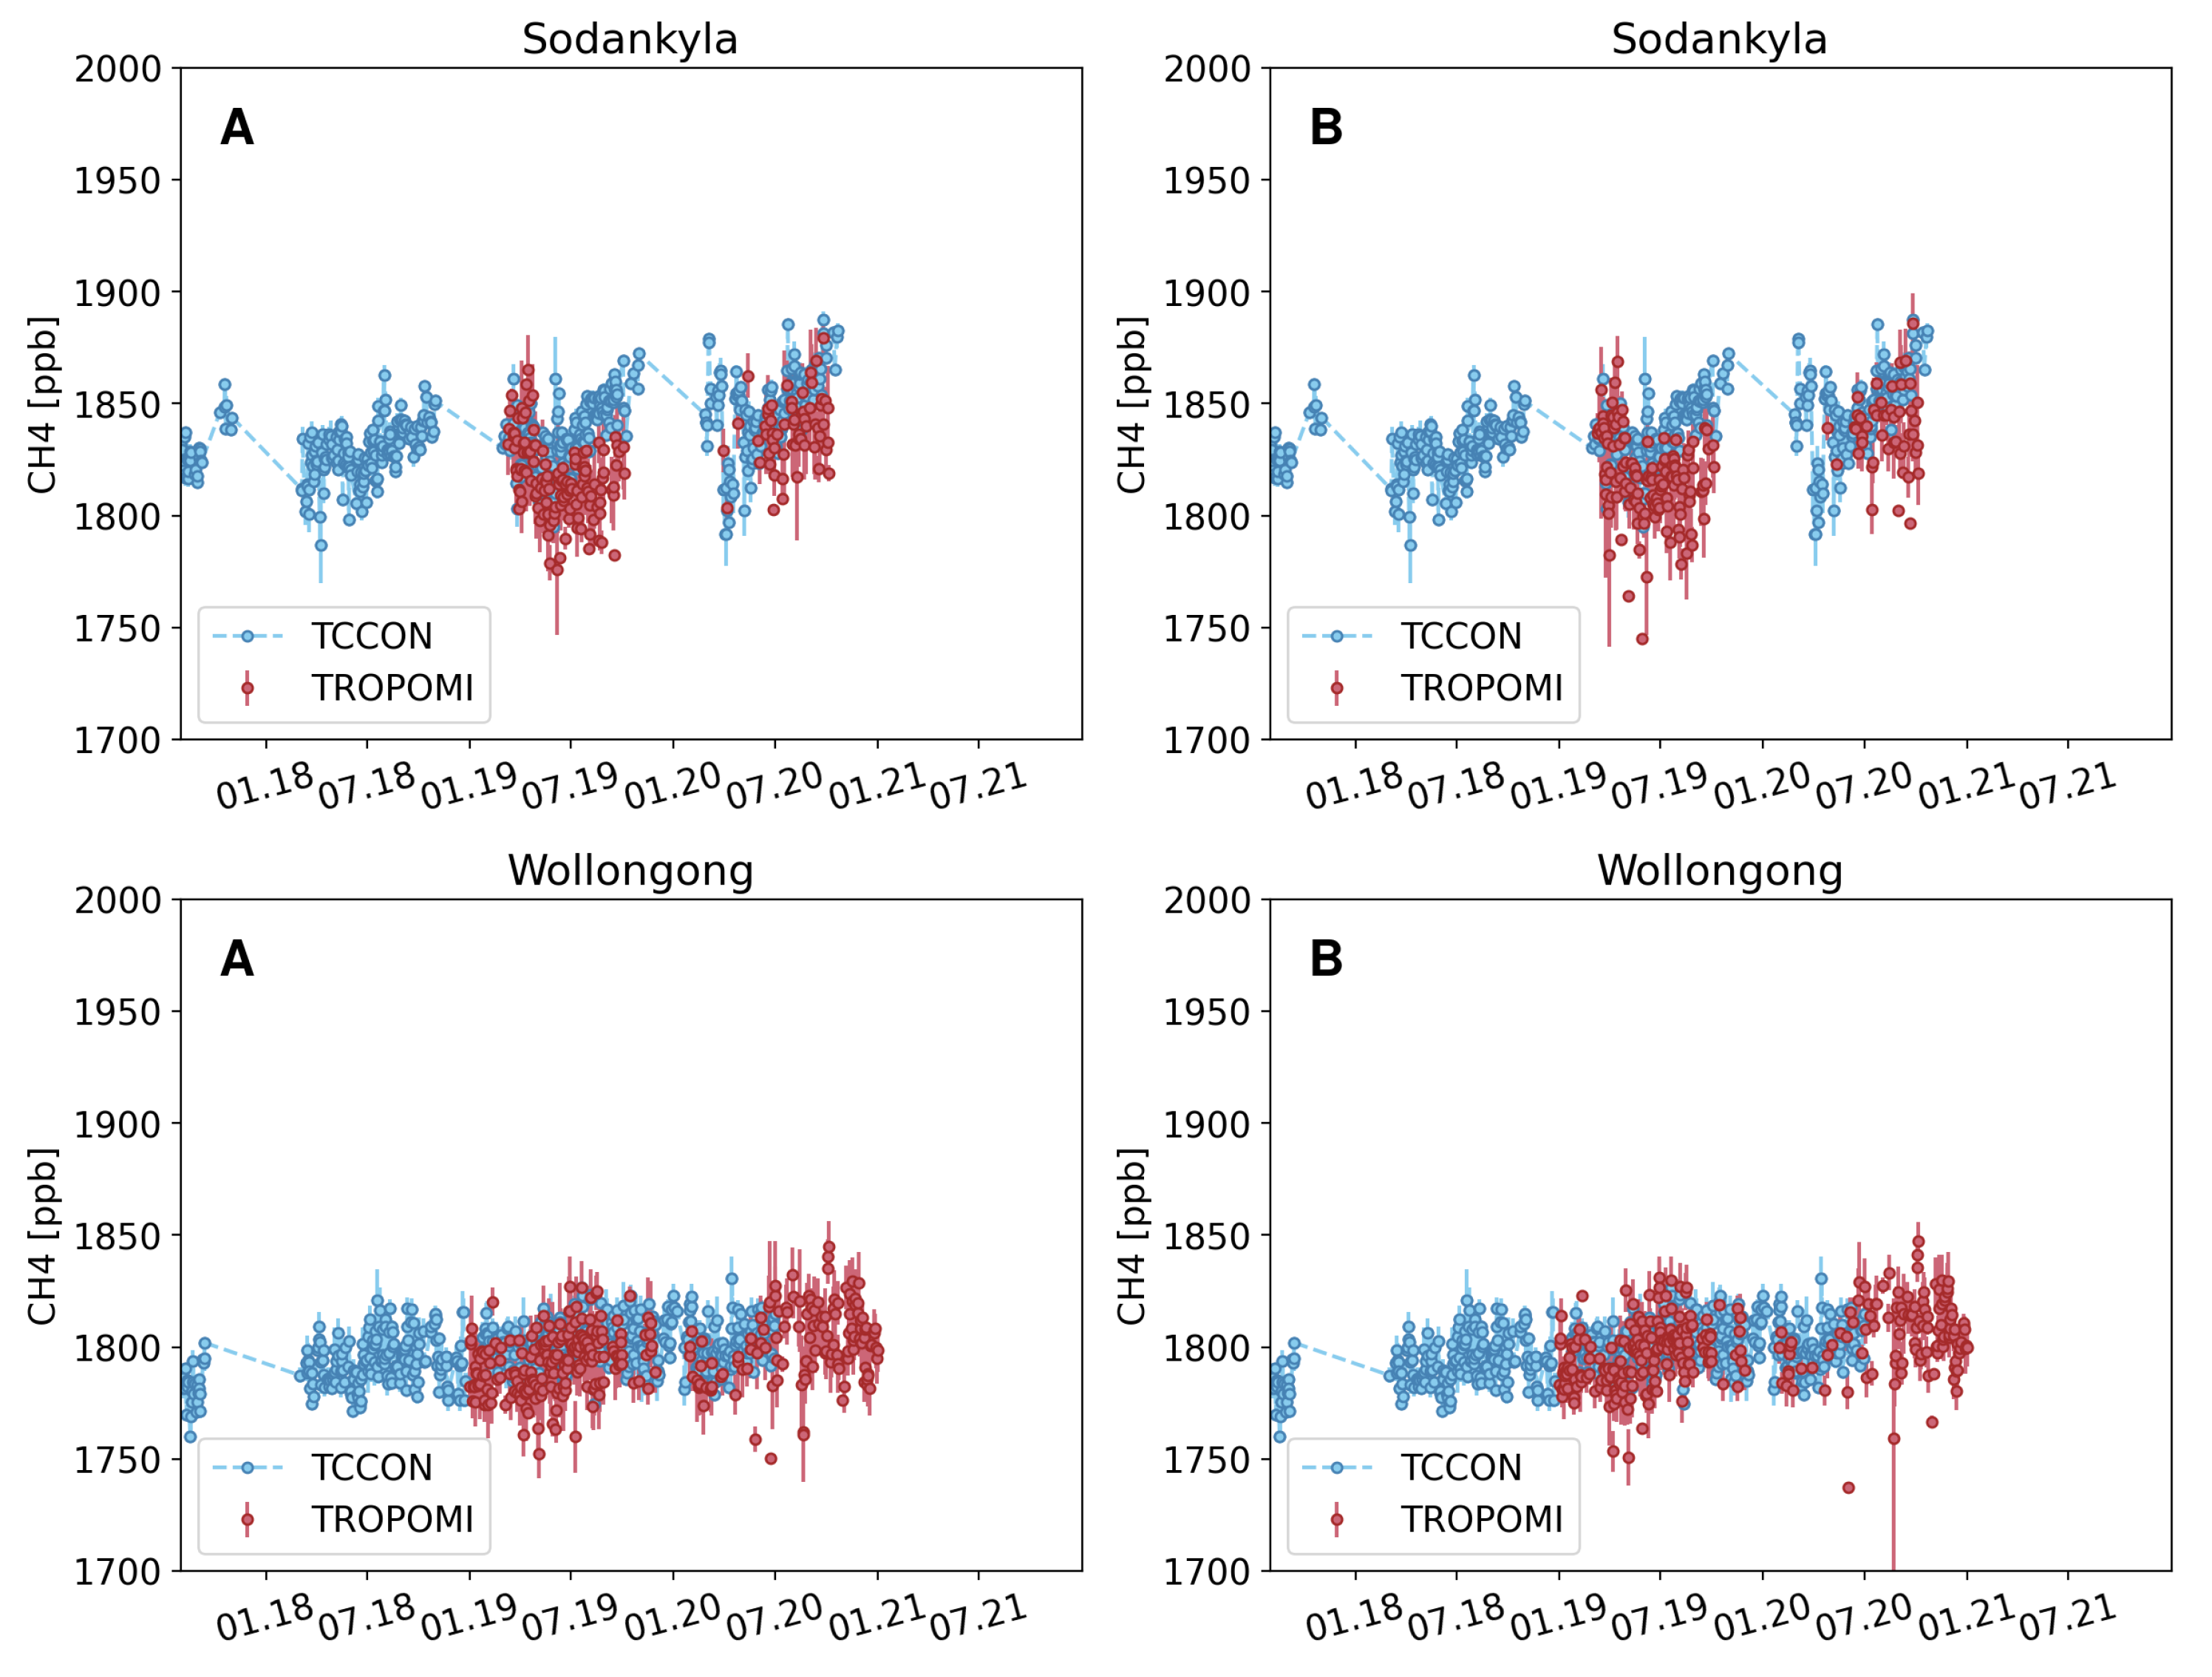
Figure 6.
Validation Statistics for TROPOMI XCH4 daily means at 12 TCCON Stations (2017 to 2022). (A) RFC cloud clearing method and (B) employing VIIRS data. The top panel shows the mean bias (TROPOMI-TCCON) for each TCCON station, calculated from the daily means (e.g., as shown in Figure 5) and the lower panel gives the standard deviation of the mean bias. represents the average bias across all stations, and is the corresponding standard deviation. denotes the average standard deviation across all station standard deviations, and is the standard deviation of the mean standard deviations.
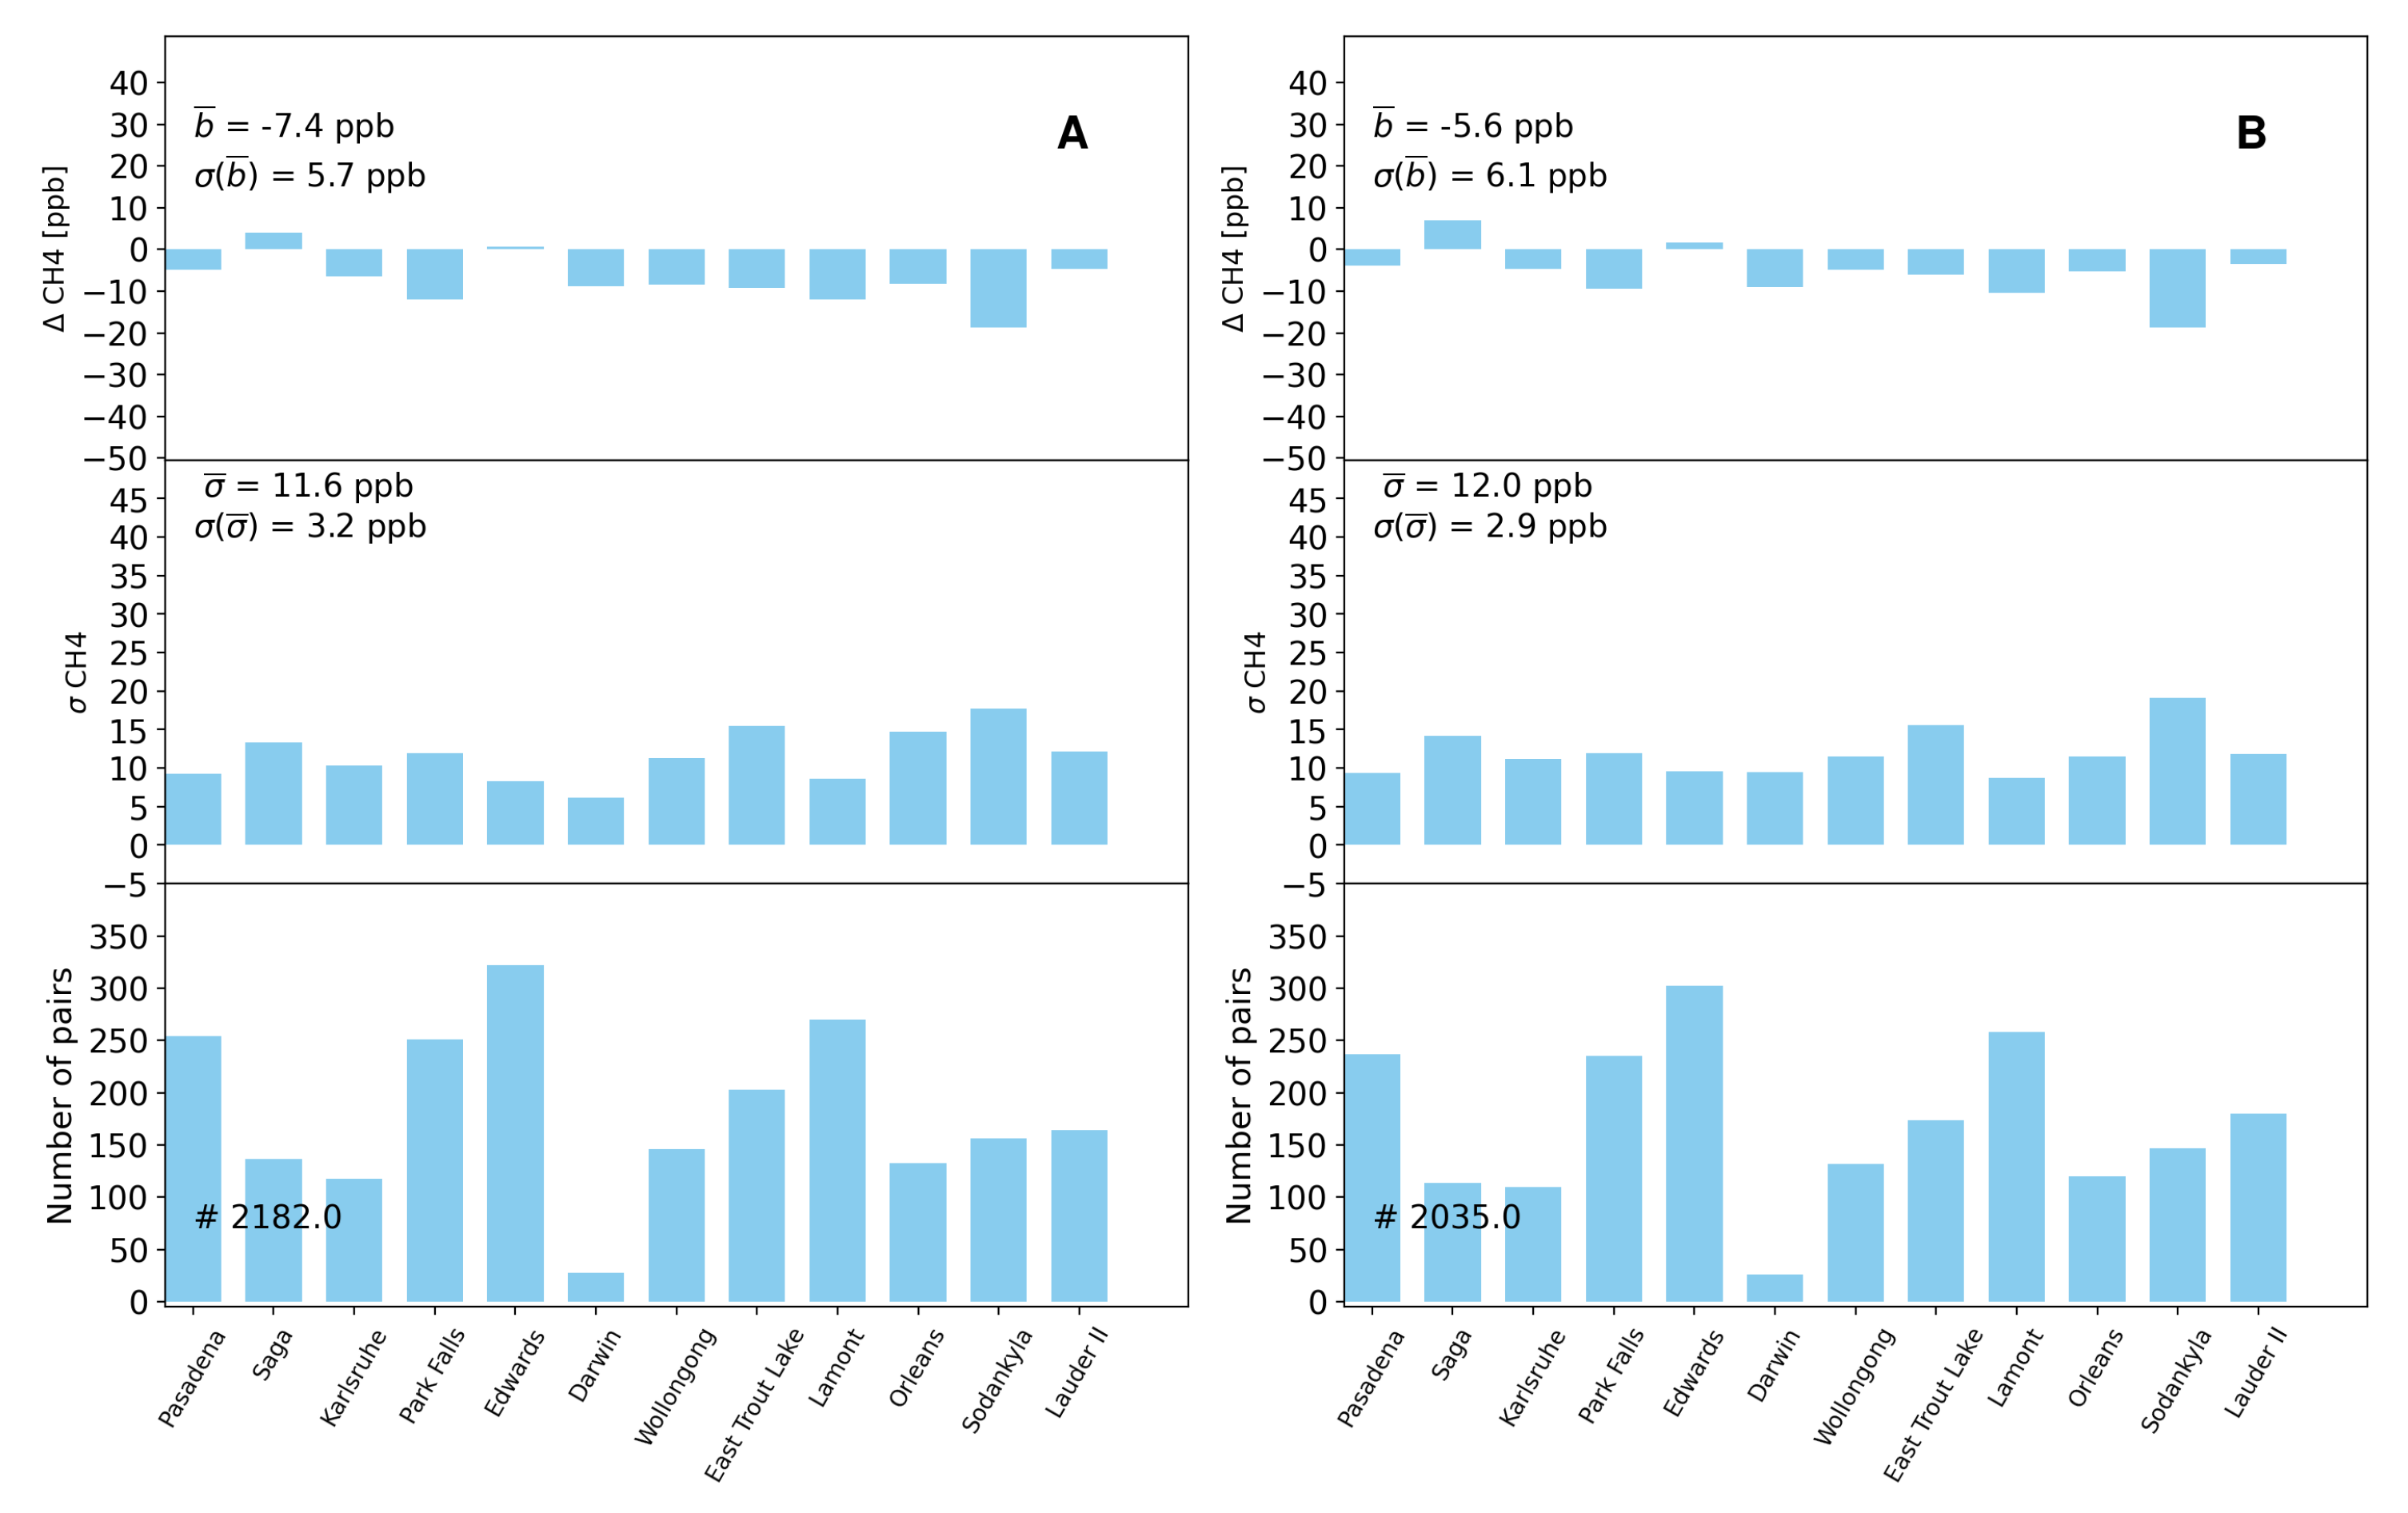
Figure 7.
Correlation between collocated TCCON and TROPOMI XCH4 daily means (2017-2022). (A) Cloud clearing based on the RFC approach of this study and (B) using VIIRS data. The error bars represent the standard deviation of individual measurements within a day. Data for the differnet TCCON stations are color-coded.
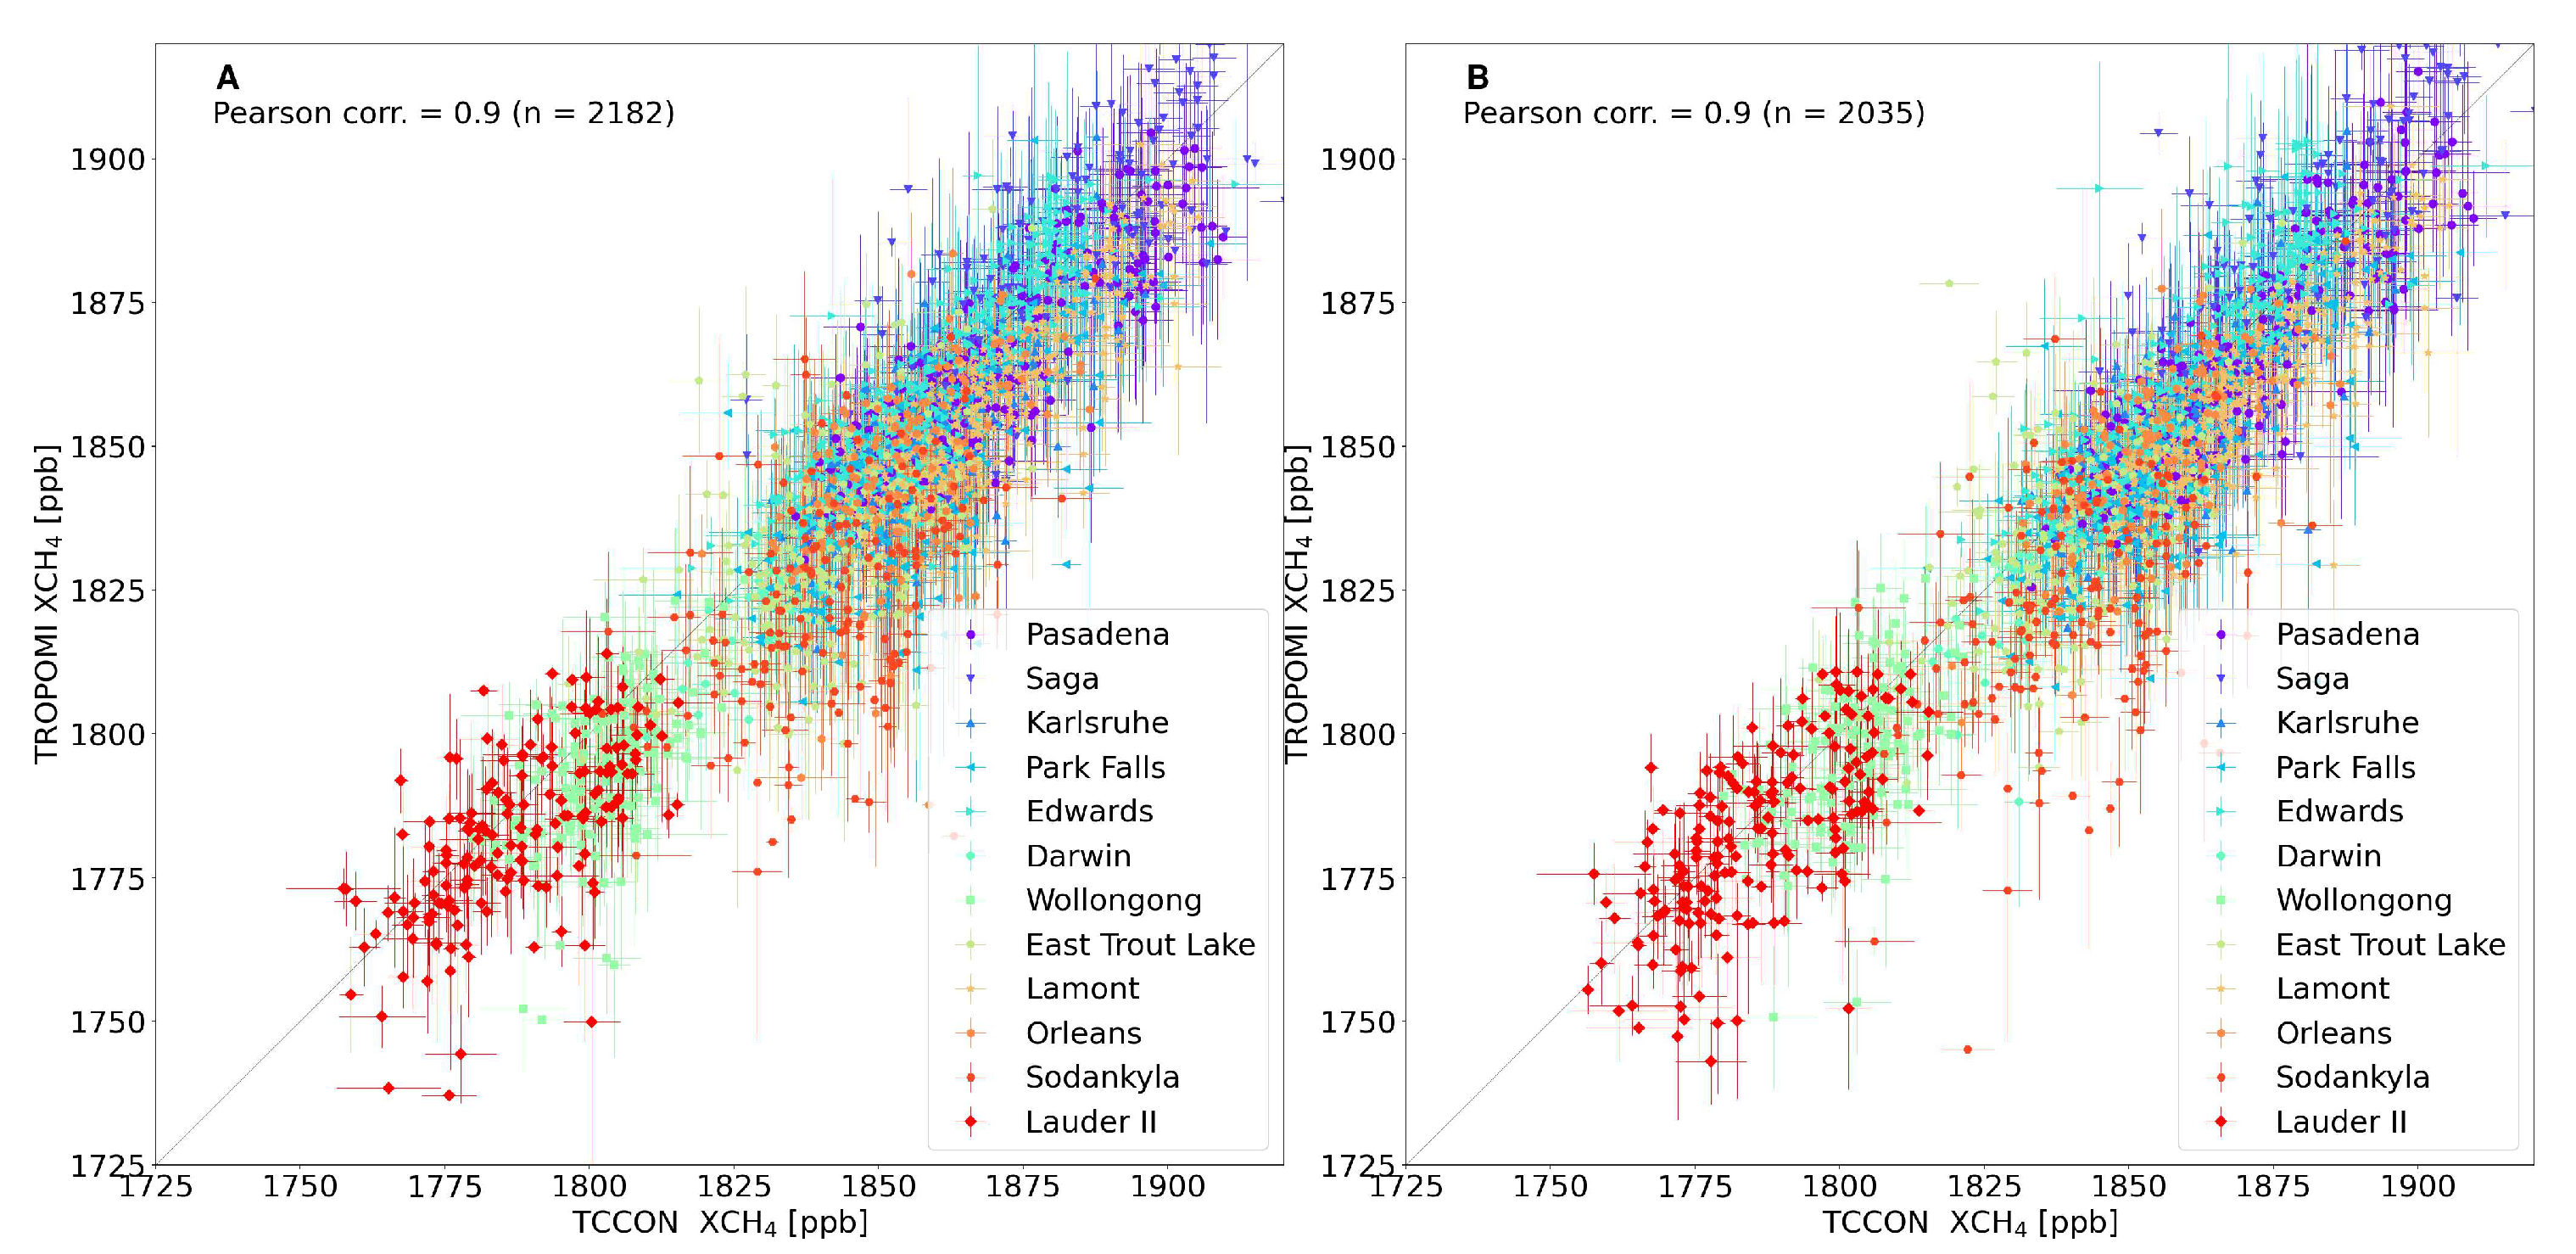

Table 1.
Details and references for the TCCON sites used in this study.
| Site (country) | Coordinates (lat.,lon.;°) | Altitude (m.a.s.l) | Reference |
| Sodankyla (Finland) | 67.37, 26.63 | 190 | [26,27] |
| East Trout Lake (Canada) | 54.36, | 500 | [28] |
| Karlsruhe (Germany) | 49.1, 8.44 | 110 | [29] |
| Orleans (France) | 47.97, 2.11 | 130 | [30] |
| Park Falls (USA) | 45.94, | 440 | [31] |
| Lamont (USA) | 36.6, | 320 | [32] |
| Pasadena (USA) | 34.14, | 240 | [33] |
| Edwards (USA) | 34.95, | 30 | [34] |
| Saga (Japan) | 33.24, 130.29 | 10 | [35] |
| Darwin (Australia) | , 130.93 | 30 | [36] |
| Wollongong (Australia) | , 150.88 | 30 | [37] |
| Lauder (New Zealand) | , 169.68 | 370 | [38,39] |
Disclaimer/Publisher’s Note: The statements, opinions and data contained in all publications are solely those of the individual author(s) and contributor(s) and not of MDPI and/or the editor(s). MDPI and/or the editor(s) disclaim responsibility for any injury to people or property resulting from any ideas, methods, instructions or products referred to in the content. |
© 2024 by the authors. Licensee MDPI, Basel, Switzerland. This article is an open access article distributed under the terms and conditions of the Creative Commons Attribution (CC BY) license (http://creativecommons.org/licenses/by/4.0/).
Copyright: This open access article is published under a Creative Commons CC BY 4.0 license, which permit the free download, distribution, and reuse, provided that the author and preprint are cited in any reuse.


