Submitted:
07 February 2024
Posted:
07 February 2024
You are already at the latest version
Abstract
Additive Friction Extrusion Deposition (AFED) is a recently developed additive manufacturing technique that promises high deposition rates at low forces. Due to the novelty of the process, the underlying phenomena and their interactions are not fully understood, and in particular the processing strategy and tool design are still in their infancy. This work contributes to the state of the art of AFED through a comprehensive analysis of its working principles and an experimental program including a representative sample component. The working principle and process mechanics of AFED are broken down into their individual components. Forces, their origins and effects on the process are described, and measures of process efficiency and theoretical minimum energy consumption are derived. Three geometrical features of the extrusion die are identified as most relevant to the active material flow, process forces and deposition quality: the topography of the inner and outer circular surfaces and the geometry of its extrusion channels. Based on this, the experimental program investigates seven different tool designs in terms of efficiency, force reduction and throughput. The experiments using AA 6061-T6 as feedstock show that AFED is capable of both high material throughput (close to 550 mm³/s) and reduced substrate forces: For example, the forces for a run at 100 mm³/s remained continuously below 500 N, and for a run at 400 mm³/s below 3500 N. Material flow and microstructure of the AFED are assessed from the macrosections. Significant differences are found between the advancing and retracting sides for both process effects and material flow. Banded structures show strong similarities to other solid state processes. The fabrication of the sample components demonstrates that AFED is already capable of producing industrial grade components. In mechanical testing, interlayer bonding defects result in a more brittle failure behavior in the direction of the structure, in the microstructure show strong similarities to other solid-state processes. The manufacturing of the sample components demonstrates that AFED is already capable of producing industrial grade components. In mechanical tests, interlayer bonding defects result in a more brittle failure behavior in the direction of the structure, while in the horizontal direction of the structure mechanical properties corresponding to a T4 temper have been achieved.
Keywords:
FSAM
; AFED
; Additive Manufacturing
; Aluminum
; Tool Design
; Process Optimization
1. Introduction
Solid-state additive manufacturing offers several advantages over other additive manufacturing (AM) technologies [1,2,3,4,5,6]. Of particular note are
- Very low energy input and consumption,
- Utilization of inexpensive, easily available feedstock,
- no melting of the materials involved,
- High material throughput,
- Excellent mechanical properties, and
- the possibility of joining different materials such as steel / aluminum.
Other increasingly important benefits in terms of environmental objectives include the direct recycling of material normally considered waste, such as machine chips [3], or the possibility of high-quality part repair [5,7]. The main disadvantage of friction-based solid state additive processes are the comparatively high process forces stemming from their solely mechanical working principles [8]. These forces must be supported by the substrate and subsequently by the structure of the build. This limits the manufacturing of thin or weak structures, since the process requires a certain degree of stability and stiffness, i. e. a minimum thickness of wall structures.
In this context, Additive Friction Extrusion Deposition (AFED) [6], a recently developed solid-state additive manufacturing process, offers several advantages in reducing the mechanical and thermal impact on both the substrate and built structure. This paper contributes to the knowledge and state of the art of AFED by offering
- A detailed description of the basic principles of the process,
- An identification and assessment of AFED’s process mechanics,
- An analysis of steady-state process conditions,
- Recommendations for process design and optimization, i. e. parameter selection and tool design,
- A characterization of material flow, resulting microstructure and correlating mechanical properties, and
- A review of the current technology readiness level (TRL) of the process.
After a full analysis of AFED’s working principles, the results of an experimental program are presented. Seven tool designs were investigated. Based on the results of this examination, a representative sample component was built and evaluated by metallography and tensile testing.
2. Process Fundamentals
Additive Friction Extrusion Deposition (AFED) involves the thermo-mechanical plastification of feedstock within a rotating spindle and its subsequent extrusion and deposition onto a substrate. The AFED process starts with the feedstock being contained inside a non-rotating guide tube which is located inside a rotating spindle, Figure 1. The upper end of the guide tube contains a push rod which can force the feedstock material downwards with a defined velocity or force. The lower end of the guide tube is covered by an extrusion die which is mounted to the spindle. As this die rotates with the spindle and the non-rotating feedstock is pressed against it, the lower end of the feedstock is plasticized through frictional heating, plastic work dissipation and shearing [9]. Subsequently, the material is forced (extruded) through the die. As the outer surface of the die is positioned at a suitable height above a substrate, the material being extruded is contained between the die and the substrate. Here, additional heating and mixing occurs, bonding the extruded material to the substrate. As the spindle is moved along a path in the x, y or z axes, a 3-D structure is created. Typical measures as known from other solid state processes may be applied to further influence the AFED process. For instance, both the spindle and the guide tube may be cooled (or heated) to influence the temperature of the deposited material or to reduce the binding of the feedstock to the guide tube.
2.1. Essential Forces of AFED and their Origin
An overview of the most relevant forces involved in the AFED process are given in Figure 2. These forces can be divided into two main categories, inner and outer forces. The inner forces are involved in initially plasticizing the feedstock (, ) and are reacted to within the tooling and do not reach the substrate. The outer forces (, ) are caused by the deposition process and act between the outer surface of the extrusion die and the substrate. When the AFED process starts, the feedstock has not yet been deformed and is at ambient temperature. In the start up phase the only forces acting are and . However, as the feedstock is plasticized and moved through the extrusion die, and start to rise as soon as material is constrained against the substrate. This provides additional heat input into the process, while at the same time conduction through the substrate provides a further heat sink. The relationship between the material flow volume (determined by feed velocity and die design), layer height and the traverse velocity determines the resulting layer width. Of course, this width of the extruded layer has a natural upper limit which is about the width of the outer structures of the die, see Figure 2.
2.2. Energy Balance and Efficiency
The measured spindle power does not directly correspond to the power going into the deposited material, as there are several power sources and sinks. The power sources include the spindle power, the rod feeder power, and the surface drag as the tooling moves along the tool path. The power sinks include the energy to heat the material, the work to actually deform the material, heat lost to the substrate, and heat lost to the tool cooling. These sinks can be characterized as the minimum energy for the process plus losses due to cooling. The overall energy flow can therefore be expressed as the following equation:
The spindle power can be split thus:
The power input from the rod feeder can be calculated from the rod force and velocity:
Finally, the energy input from the tool moving across the surface is calculated thusly:
The on the other side of Equation 1 are more difficult to calculate, which is also true for . However can be determined using material properties:
With this, there are two different measures of efficiency which could be reasonable be calculated for the AFED process: one being the efficiency of actually depositing material with respect to the minimum energy required, and the other being the absolute energy used to deposit a defined amount of material :
While would be a good indicator of the absolute efficiency of the process, it is difficult to determine and . The value of is greatly affected by the estimates used for these values, reducing its value as an indicator. Due to this, was chosen as the preferred criteria for process efficiency for later analysis, given its ease of calculation and the direct comparability with other deposition processes. The best is as small as possible, and relates to through the following equation:
3. Material
3.1. Feedstock and Substrate: Material and properties
The feedstock used for this study was square bar rod with dimensions of 12.7 mm x 12.7 mm x 305 mm. Plates of dimension 915 mm x 205 mm x 6.35 mm were used as substrates for the depositions. Aluminum alloy AA 6061 (AlMg1SiCu) in T6 temper was used as the material both for feedstock and substrate. The material’s temperature-dependent material properties are summarized in Figure 3.
3.2. Tooling: Die material, geometry and properties
All dies for this study were made out of H13 (1.2344 / X40CrMoV5-1 / SKD61) tool steel hardened to 48-52 HRC (≈ 490-550 HV). H13 was chosen since this material offers an excellent wear resistance, good thermal shock resistance and a high hot toughness [11], as required for AFED. From the material, blanks were machined which included the common basic features needed for mounting the die on the spindle and for capturing and draining any material overflow out to the sides, see number 8 in Figure 1.
4. Experimental Setup and Procedure
The deposition tooling was mounted to a MTI LS-1 machine, which had been fitted with an extended retractable-pin axis by Bond Technologies as shown in Figure 1. This axis is used in the early stage experimental setup to push the feedstock along and through the axis of the spindle. Additional tooling in the form of a guide tube, push rod, and tool-holder, was also required for the AFED process.
All samples were built on the base plate which was therefore fixed from the top and the sides, Figure 4. The base plate was used in the "as is" condition without any pre-conditioning, e. g. machining the surface or removing oxides. Different sample build geometries were used at the different stages of the development process. Initially, straight 150 mm-long lines were created which enabled parameter changes during traversing. Once initial parameters for a setup showed good extrusion results, a more representative three-dimensional build geometry was used. This was a 6-layer-high cylinder with an outer diameter of 60 mm and a 15-20 mm track width. This provided a long layer length and a substantial deposition time in a small area, creating real process conditions (temperature build up, etc.) and allowed development of the parameters for a layer change. Finally, a full size sample component was built for one selected tool as described in Section 5.3.
During each experimental run, some of the feedstock seeped between the inner surface of the die and the guide tube end. This material was removed with various hand tools to provide a clean die surface for the next deposition run. Testing was performed in consecutive, explorative stages to inform tool design, and to test hypotheses on the impact of tool design changes.
5. Results and Discussion
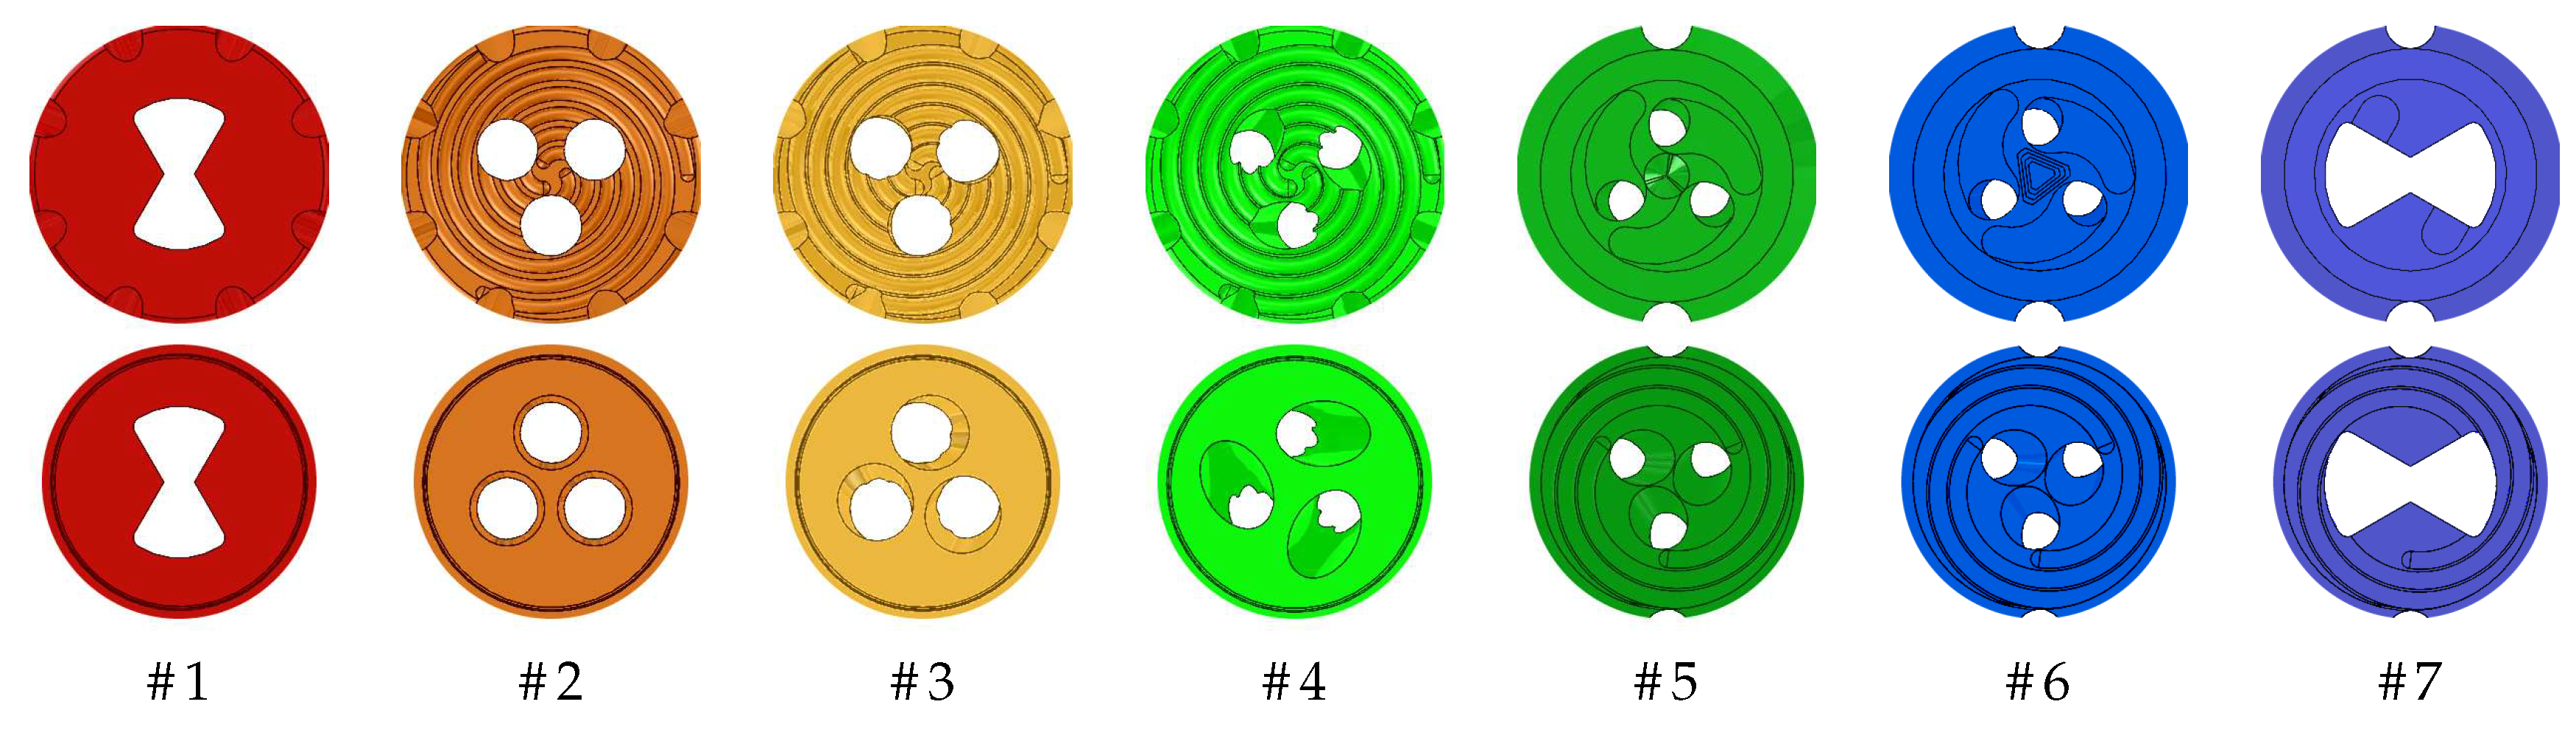
Three geometrical features of the die are most relevant for the active material flow and the process forces during plastification, extrusion and deposition, see Figure 2: the topography of the inner and outer circular faces of the die and the geometry of its extrusion channels. For investigating their respective effects, seven different tool design variants were assessed, based on two main extrusion hole shapes, a "bowtie" and a "tri-hole" design. One important aspect of extrusion hole design was the inclination of the holes with respect to the vertical axis of the die (0, 15 or 45 degrees). An illustrated summary of the basic designs (# 1 and # 2) and all their variants is presented in Figure 5, and Table 1 summarizes the die designs.
5.1. Evolution of Tool Design
The first stage tested the original die designs # 1 and # 2, and determined that only a thin layer of feedstock was plasticized against the inner surface of the die. The dies scraped this extrudate off the end of the feedstock as a continuous ribbon, as shown in Figure 6 on the left. In order to enhance this scraping effect, two new tri-hole die designs (# 3 & # 4) were created where the holes were machined at an angle to to the surface of the die to provide positive rake to the holes, see Figure 6 on the right.
Dies # 3 and # 4 showed a clearly improved material throughput, and an improved layer consolidation during deposition. This resulted directly in greater bead width and thickness capabilities. The increased deposition rate of these tools also allowed for deposition lengths of 750 mm although the feedstock would still eventually bind in the lower end of the guide tube. After die designs # 1, # 2, # 3 and # 4 had been tested, both the guide tube end and die shape were revised. The target was to reduce the amount of material overflow to the sides which occurred, especially during failed trials, which resulted in extensive cleaning of the equipment. To do so, the relief taper was changed from a square to a circular profile. Also, all subsequent die designs included more extensive geometrical features on the inside to capture and guide the material flow towards the extrusion holes. An illustrated description is provided in Figure 7.
Dies # 5 and # 6 were both based on the tri-hole design and added a feature to the center of the inner surface. This was done in an attempt to increase the thickness of the plasticized zone above the die and to guide the material directly to the three extrusion holes. This should have improved the deposition rate and reduced the force on the feedstock. For die # 5 the feature was a smooth cone 1.3 mm high, and for die # 6 the feature was a stepped pyramid 2 mm in height. The scrolls on the inner face were replaced by deeper scoops for improving the flow into the extrusion holes. Additionally, scrolls were added to the outer face of the die to encourage a more extensive consolidation of the bead and to improve heat generation while keeping forces on the substrate low. Die # 7, the final design of this study, was based on the bow-tie extrusion hole design. It also featured scoops on the inner and scrolls on the outer face of the die for the reasons stated above. Compared to the base design # 1 it also featured a larger extrusion hole, to align better with the size of the feedstock and the changes for guide tube end and die shape described in Figure 5.
5.2. Quantitative Results for Tool Designs
During each deposition run various parameters were logged, such as spindle torque, feed force, substrate force, tool temperature, etc. at about 50 Hz. Post-deposition analysis of these log files enables quantitative comparisons of elements of the die performance.
5.2.1. Process efficiency and Process window
An important quality characteristic of each die design is the specific energy required to deposit material as referenced earlier, see Equation 8. Dies that require less energy per amount of material deposited are more efficient, and are probably more effective at transporting material through the die. Figure 8 gives an overview of the specific process energy consumption and volumetric deposition rate for all die designs. In the figure, only deposition runs longer than 40 seconds were included, ensuring that die and process parameters were capable of maintaining the deposition process. The first 30 seconds and the last second of each log file were trimmed to ensure steady-state values.
Examining Figure 8, the specific process energy consumption is shown to be inversely correlated with the deposition rate in general. That is, as the deposition rate is increased, less energy is needed to deposit the same material volume. Reviewing Equation 8, and have to scale linearly with assuming the same processing conditions, however will largely scale with time and more or less independent of the deposition rate. Together, this leads to the curve shown, and the magnitude of the effect shows that becomes a significant fraction of the process energy, especially at lower deposition rates. Furthermore, it is clear that, with increasing volumetric deposition rate, the curve flattens out. This is because a minimum amount of energy is needed to establish AFED’s working principle, i. e. heat up, deform and deposit a specific amount of material.
From Figure 8 it is also clear that the efficiency of the various dies differs significantly. In particular, the initial designs # 1 and # 2 were not as capable of higher deposition rates and process efficiencies as the later designs # 3, # 4 or # 7. However, two of the later die designs # 5 and # 6 were found to be rather inefficient.
Two design factors can be identified and differentiated for this discussion: the ratio/area of the extrusion channel and the use of active material flow structures for extruding the feedstock.
As an example of the impact of active material flow structures, a direct comparison of dies # 2 and # 3 is useful. The only difference between the two is the active material flow structure implemented by an angle of the extrusion channels of 15 ° for die design # 3, see Table 1. As seen from Figure 8, the implementation directly enhances the process window and the efficiency compared to the original die design. This impact is confirmed when comparing the designs # 3 and # 4 with 15 ° and 45 ° respectively: they both show a very similar capability and efficiency, although die design # 4 has over 30 % more extrusion channel area.
To discuss the impact of larger extrusion channels, a comparison of designs dies # 5 and # 6 with die # 3 is instructive. While having extensive inner and outer structures, dies # 5 and # 6 do not perform as well as the less structured design of die # 3. This is clearly because, with # 5 and # 6 have only half the extrusion hole area (42 mm²) of die # 3 (85 mm²), leading to a bottleneck and high forces inside the tooling, as described in the next section. However, it should be noted that, due to the effect of active material flow structures, the performance of dies # 5 and # 6 is comparable to die design # 2 which has almost twice the extrusion channel area (but no angle). The most capable die design of this work with regard to deposition rate, die # 7, incorporates both: extensive inner and outer active material flow structures and a large area for the extrusion channel.
5.2.2. Feedstock forces
Another good way to evaluate different tool designs and their ability to provide an efficient AFED process is to compare the inner forces required to achieve a given deposition rate. As described earlier, one of the ultimate goals of AFED is to reduce the forces acting on the substrate to a minimum. While the plasticizing and heating forces should ideally be fully compensated within the tool, it is still beneficial to keep these forces as low as possible: High forces can cause excessive overflow, rod bending, and die clogging, and are a clear sign that the material is not being processed and extruded efficiently by the tool. In addition, the machine’s force capabilities are limited.
While the external deposition forces are heavily influenced by process parameters or conditions such as the chosen layer height, part geometry etc., the internal forces are more or less constrained by die geometry and the interaction of the die, guide tube and feedstock. Figure 9 gives an overview of the rod forces for the seven die designs and different deposition rates. In comparison to the specific process energy consumption, a more clearly differentiated picture between the individual dies is evident. The rod force values of the individual dies tend to be grouped together (with varying scatter), which supports the conclusion that there is a die-specific force level in the steady state for each die that is almost independent of the deposition rate.
It is also noteworthy that there is a clear tendency for dies with larger extrusion channels or more extensive geometric structures to have lower rod forces. For example, dies # 1 (95 mm² channel area), # 2 (85 mm²) and # 3 (88 mm²) show significantly lower forces, averaging around 15 kN, than dies # 5 and # 6 (both 42 mm²) which typically exceed 18 kN. This effect can be directly related to the reduction in the cross-sectional area of the flow channels, resulting in a higher pressure required to force the material through the die to achieve a comparable deposition rate.
It is also noteworthy that die # 4 has significantly lower rod forces than die # 7 (on average 12.5 kN to 16.5 kN) despite the fact that die # 7 has approximately 40 % more extrusion channel area (# 4: 88 mm², # 7: 124 mm²). This can be directly attributed to the material flow enhancing structures for vertical transport in the outer/substrate direction, which # 4 has but # 7 does not. The effect of these flow structures can be quantified using the design evolution of dies # 2, # 3, and # 4:
Die # 2 with three holes but no active material transport to the outside requires just over 15 kN on average. Die # 3 has a 15 ° angled flow enhancing structure which reduces the force by approximately 0.5 kN, and # 4 with a 45 ° structure has the force reduced by approximately by 2.5 kN.
5.2.3. Substrate forces
Ultimately, the most relevant criteria for AFED from a manufacturing perspective are the outer forces of the process acting on the substrate during deposition. With perfect compensation of all the forces required to heat and plasticize the feedstock within the tool, the only forces acting on the substrate would be from the material flow to the outside and onto the substrate. By adjusting parameters such as layer height, spindle speed, or channel geometry, these forces could be kept to the minimum required for bonding to the substrate.
Figure 10 gives an overview on the force on the substrate by die number and volumetric deposition rate. Examining the average substrate force over all dies (which have the same outer diameter), an almost linear relationship between deposition rates and forces can be identified. This relationship is in good accordance with other solid-state processing technologies such as Friction Stir Welding (FSW). At deposition rates below 100 mm3/s the force on the substrate is mostly kept below 2 kN, at 200 mm3/s mostly below 4 kN etc. Averaged over all tools, this gives a slope of just over 20 Ns/mm3, which can be interpreted as the impulse required to deposit one cubic millimeter of material on the substrate. This relationship can also be used to make statements about the process and local conditions: Since all dies have the same outer diameter and only successful depositions were considered, it can be concluded that this relationship follows the specific minimum thermo-mechanical process impact required for bonding to the substrate. As the local temperatures during the deposition runs were very homogeneous, this can be further reduced to the minimum mechanical process impact, i. e. the local contact pressure.
When comparing the substrate forces of the different die designs, it is striking that the two most efficient designs in terms of deposition rate, dies # 4 and # 7, are at similar levels despite their significantly different geometries. Die # 7 shows slight advantages in terms of throughput and die # 4 in substrate forces. The latter is particularly interesting as die # 4 had already shown lower internal (rod) forces than # 7. The additional advantage for external forces can be attributed to the small direct passage in the center of die # 7, which allows a portion of the rod force to act almost directly on the substrate. This is not the case with die # 4, where the 45 ° angle of the extrusion channel does not allow direct passage, but creates an additional vertical force component dependent on spindle speed. In this context, a direct comparison of dies # 3 and # 4 is again useful. As mentioned, the only difference between the two dies is the angle of their extrusion channels, 15° and 45°.
The greater ability of die # 4 to reduce internal forces compared to die # 3 has already been described in the previous section. In this case the reverse is true: At less than 4 kN, die # 3 shows significantly lower substrate forces than die # 4, even at high deposition rates above 400 mm3/s. In contrast, at over 8 kN, die # 4 is about 100 % higher. Due to the small geometric differences, this effect can clearly be attributed to the respective and differently induced vertical force components of the two dies. It also highlights the usefulness of the AFED operating principle in reducing the force on the substrate and the direct exchange of internal and external forces.
In direct relation to die designs # 3 and # 4, there is another interesting circumstance. Although die # 2 was not capable to achieve higher deposition rates, the geometry (which has neither a small direct passage like dies # 1 and # 7 nor an actively induced vertical material flow like dies # 3, # 4, # 5 and # 6) reflects the extensive possibility of force reduction by AFED: for example, for a deposition rate around 100 mm3/s runs with less than 500 N substrate force can be found.
5.3. Sample Component
Among the tool designs tested, die # 7, the larger bow-tie design with internal and external material flow features, gave the most consistent and reliable deposition and showed the least material overflow. This design was therefore selected to demonstrate the basic capability of AFED for industrial manufacturing by building a full-size sample component, a square ring 300 mm x 300 mm x 50 mm, see Figure 11. The base plate for the build was 305 mm x 305 mm x 9.5 mm and was fastened to the machine table with 4x M12 button head screws in a centered 200 mm x 200 mm pattern. To form a base, the first 3 layers of the build were run as single passes with variable heights ranging from 1.5 to 0.5 mm. Two 1 mm high layers were then deposited per deposition run (equal to a full rod of feedstock), with 25 runs producing the full 50 mm height. Between each run the die was removed, cleaned and a new rod inserted before the die was reinstalled. The first layer of each run was produced at 500 rpm, while the second layer was run at 400 rpm as less heat was required. The layer width was set at 20 mm and remained consistent throughout the height of the build.
5.4. Material Flow Analysis based on macros
Figure 12 provides an overview of structure and microstructure of the sample build, featuring the upper 14 layers. From the section shown, it is clear that layers are fairly uniform with a homogeneous thickness and a similar microstructure. The individual layers can be clearly distinguished from each other and are macroscopically well consolidated. With similarities to Friction Stir Welding (FSW) [12], the side where the traverse and rotational velocities are in the same direction (advancing side, left) demonstrate a more extensive material flow than the retreating side (right), where velocities are opposing. Consequently, and in line with FSW, the advancing side is much more sharply defined than the retreating side, which has a much rougher outer surface. This rougher outer surface is also associated with the presence of voids on the retreating side. These voids are embedded between banded, wavy and periodic flow structures. These banded material flow structures are well known from the material flow characteristics of the FSW process [13].
Examining any layer in isolation, it is evident from the microstructure that the lower half of each deposited layer is not as strongly intermixed as the upper half. Some "cold shuts" and voids are visible in some of the layers’ lower half at the transition to the preceding layer, again, mostly on the retreating side. Figure 13 provides a detail highlighting this. This can be attributed to the fact that this upper half is in direct contact with the spinning die during deposition and thus experiences higher levels of post-extrusion mechanical mixing, shearing and thermal impact.
The longitudinal sections confirm the analysis of the transverse cross-sections: here it can be seen that the flaws and inhomogeneities occur mainly in layers which were created at the lower spindle speed level of 400 rpm, i. e. in every second layer of the build, Figure 14 (right). In those layers banded structures of the periodic material flow are clearly recognizable especially in their respective lower half. In the layers in between, carried out at 500 rpm, the material flow is far better consolidated. Here, the individual banded structures can often not be distinguished and the overall process impact seems to be higher and more suitable for joining to the preceding layer.
Another characteristic of the AFED process can be recognized from the longitudinal sections. Analogous to friction stir welding, a periodicity of the material flow can be identified in the layers, as shown in Figure 14. Banded structures as found in the layers in Figure 14 created with a spindle speed level of 400 rpm show a medium spacing d of about 1.42 mm. This corresponds well to what is to be expected from the 2-fold symmetry of the tool’s extrusion channels (bow tie), a 1092 mm/min traverse speed and the spindle speed:
It can be assumed, on the basis of the similarity to the FSW process that the variance in the spacing of the banded structures (ranging from 1.354 to 1.467 mm) can be attributed to the tooling run-out or the asymmetry of the tool geometry, e. g. the orientation of the extrusion channels relative to the substrate when depositing.
5.5. Mechanical Testing and Properties
Tensile tests for this study were performed according to ISO 6892-2:2018. Round tensile specimens measuring 5 x 25 x 51 were used (DIN 50125, Form B). All specimens were taken from the center of the layer and from the locations as sketched in Figure 11. The aim was to test both for the strength within the layers as well as for the bonding between them, i. e. in the horizontal and vertical (build) direction. The tests were carried out 6 months after the build to avoid any significant influence from the precipitation kinetics of the alloy [14].
Figure 15 shows the tensile test curves for the specimens. It can be seen that, within the elastic region and up to a plastic strain of some percent, specimens of both directions show a very comparable behavior: Specimens in the vertical direction, Y2 and Y3, both reach a yield stress of 138 MPa, and horizontal specimens X1 and X3 reach slightly higher values with 147 and 140 MPa. In the plastic region, the behavior begins to differ: Specimens in build direction (vertical) fail in a brittle manner at plastic strains of only around 5 % with ultimate tensile stresses of 189 and 185 MPa. Specimens along the layers (horizontal) show a significantly higher ductility of more than 20 %, reaching 213 and 212 MPa. The behavior of the material in horizontal direction corresponds closely to a T4 temper of the AA 6061 alloy, what is typical for extensive friction (stir) processing of age-hardenable alloys in T6 temper [12,15].
From the microstructural results presented earlier, the reason why the vertically oriented specimens experience brittle failure at lower stresses can be directly related to the flaws and inhomogeneities between the layers. With the onset of plastic deformation, the influence of internal notches becomes more relevant, acting as internal stress concentrators which leads to crack initiation. Due to the focus of this work on industrialization, process and tool design, and the fact that extensive fractographic investigations have already been carried out for AFED in a recent study [6], a detailed fractographic investigation has been omitted at this point.
6. Summary
The target of this work was to contribute to the knowledge and state of the art of Additive Friction Extrusion Deposition (AFED) through a comprehensive analysis of its working principles and an extensive experimental validation program.
In a first step, the working principle and AFED’s process mechanics were broken down into their individual components. Inner and outer forces, their origins and impact on the process were described. Based on this, the energy equations of the process and different measures for process efficiency were derived and the theoretical minimum energy consumption of the process was described. Together, these analytical results form the basis for all further process optimizations as the experimental program of this work.
Three geometrical features of the extrusion dies were identified as most relevant for the active material flow and the process forces and deposition quality: the topography of the inner and outer circular faces and the geometry of its extrusion channels. For investigating their respective effects, seven different tool design variants were assessed. The experimental program demonstrated the importance of inner structures both for heating up and plasticizing as well as guiding and transporting the plasticized material to the extrusion channels. Dies designed accordingly showed extended process envelopes, higher throughputs and less tendency for material overflow. The experiments proved that it is possible to exchange outer (substrate) forces for inner forces and therefore validated AFED’s central idea of reducing substrate forces by separation of forces needed for plasticizing and deposition. The experiments showed that AFED is capable both of high material throughput (near 550 mm³/s) and also of reducing the substrate forces: For example, the forces for a run at 100 mm³/s remained continuously below 500 N, and for a run at 400 mm³/s below 3500 N.
Based on the macros of the sample component, the microstructure was assessed and the material flow in AFED was characterized. It was shown that advancing and retreating side of the process differ significantly in material flow and resulting microstructure. As in FSW, the advancing side was found to have a higher process impact than the retreating side. The advancing side was therefore much more sharply defined than the retreating side, which in addition showed a much rougher outer surface. Banded material flow structures were found in the macros, a phenomenon known from other solid-state processing techniques. These structures are indicative of a periodic material flow that is additionally influenced by the external structures of the die as extrusion channels. Macros underlined as well that a minimum thermal and especially mechanical process impact is needed to ensure an effective layer-to-layer bonding. In mechanical testing bonding flaws between layers resulted in a more brittle failure behavior in build direction, while in horizontal direction of the build mechanical properties corresponding to a T4 temper were achieved.
The manufacturing of the sample components demonstrated that AFED is already capable of producing industrial grade components. However, the study revealed several further areas of possible improvements both for process efficiency and build quality. The greatest potential for optimization lies in the processing strategy and thus in the area of die design. For some dies, especially # 3, a good balance between inner and outer forces and also heating of the material was achieved. But still a design strategy has to be formalized which balances inner and outer heating better. The material has to be heated up within the die just enough for being softened, plasticized and able to flow through it. Extrusion channels and also outer structures should take care of the remaining thermo-mechanical impact needed for consolidation and bonding to the preceding layers. Heating the material up too much within the die will cause its overheating during the extrusion and deposition process. In addition, overheating the material will cause significant heat to flow back into the feedstock, making the process inefficient and favoring material overflow and feedstock binding.
The other important area of improvement is layer-to-layer bonding. As shown by the experiments, a minimum local pressure is needed for a good bonding. To keep the forces low during deposition improved designs and processing strategies are needed that reduce the contact area or implement higher pressures only very locally close to the trailing edge of the tool. Techniques from technologies such as FSW provide promising approaches, e. g. additional spirals on the outer surface or tilting the spindle.
Funding
This subaward #G009 is in support of ALMMII’s award from Office of Naval Research, Award #N00014-21-1-2458. This work was supported by the Ministry of Science, Research and Arts of the Federal State of Baden-Württemberg within the InnovationsCampus Future Mobility. Mechanical testing, metallography and publication were financially supported by fsw.expert gmbh, Germany.
Institutional Review Board Statement
Not applicable.
Informed Consent Statement
Not applicable.
Data Availability Statement
Macro-sections, machine logs and videos are available from the authors upon request.
Acknowledgments
The authors want to thank Liane Hoster from the University of Stuttgart for skillfully preparing all macros. With his wise comments on content and language, John Powell greatly improved the readability and stringency of the paper. Max Hossfeld would like to thank the Ministry of Science, Research and Arts of the Federal State of Baden-Württemberg for the financial support within the InnovationsCampus Future Mobility.
Conflicts of Interest
The authors declare no conflicts of interest.
References
- Rivera, O.G.; Allison, P.G.; Jordon, J.B.; Rodriguez, O.L.; Brewer, L.N.; McClelland, Z.; Whittington, W.R.; Francis, D.; Su, J.; Martens, R.L.; Hardwick, N. Microstructures and mechanical behavior of Inconel 625 fabricated by solid-state additive manufacturing. Materials Science and Engineering: A 2017, 694, 1–9. [CrossRef]
- Griffiths, R.J.; Perry, M.E.J.; Sietins, J.M.; Zhu, Y.; Hardwick, N.; Cox, C.D.; Rauch, H.A.; Yu, H.Z. A Perspective on Solid-State Additive Manufacturing of Aluminum Matrix Composites Using MELD. Journal of Materials Engineering and Performance 2019, 28, 648–656. [CrossRef]
- Jordon, J.B.; Allison, P.G.; Phillips, B.J.; Avery, D.Z.; Kinser, R.P.; Brewer, L.N.; Cox, C.; Doherty, K. Direct recycling of machine chips through a novel solid-state additive manufacturing process. Materials & Design 2020, 193, 108850. [CrossRef]
- Tuncer, N.; Bose, A. Solid-State Metal Additive Manufacturing: A Review. JOM 2020, 72, 3090–3111. [CrossRef]
- Martin, L.P.; Luccitti, A.; Walluk, M. Evaluation of additive friction stir deposition of AISI 316L for repairing surface material loss in AISI 4340. The International Journal of Advanced Manufacturing Technology 2022, 121, 2365–2381. [CrossRef]
- Liu, F.; Dong, P.; Khan, A.S.; Zhang, Y.; Cheng, R.; Taub, A.; Ma, Z. 3D printing of fine-grained aluminum alloys through extrusion-based additive manufacturing: Microstructure and property characterization. Journal of Materials Science & Technology 2023, 139, 126–136. [CrossRef]
- Griffiths, R.J.; Petersen, D.T.; Garcia, D.; Yu, H.Z. Additive Friction Stir-Enabled Solid-State Additive Manufacturing for the Repair of 7075 Aluminum Alloy. Applied Sciences 2019, 9, 3486. [CrossRef]
- Hossfeld, M. Shoulderless Friction Stir Welding: a low-force solid state keyhole joining technique for deep welding of labile structures. Production Engineering 2021. [CrossRef]
- Hossfeld, M. On Friction, Heat Input, and Material Flow Initiation during Friction Stir Welding: Tool and Process Optimization. Journal of Manufacturing and Materials Processing 2023, 7, 34. [CrossRef]
- Hossfeld, M. Modeling Friction Stir Welding: On Prediction and Numerical Tool Development. Metals 2022, 12, 1432. [CrossRef]
- Tekmen, C.; Toparli, M.; Ozdemir, I.; Kusoglu, I.M.; Onel, K. High temperature behaviour of H13 steel. Zeitschrift für Metallkunde 2005, 96, 1431–1433. [CrossRef]
- Hoßfeld, M. Experimental, analytical and numerical investigations of the friction stir welding process; Universität Stuttgart, 2016. [CrossRef]
- Gratecap, F.; Girard, M.; Marya, S.; Racineux, G. Exploring material flow in friction stir welding: Tool eccentricity and formation of banded structures. International Journal of Material Forming 2012, 5, 99–107. [CrossRef]
- Hossfeld, M. Time-dependency of mechanical properties and component behavior after friction stir welding, 102(5-8), 2297-2305. The International Journal of Advanced Manufacturing Technology 2019. [CrossRef]
- von Strombeck, A.; Dos Santos, J.F.; Torster, F.; Laureano, P.; Kocak, M. Fracture toughness behaviour of FSW joints aluminium alloys. Proceedings of the First International Symposium on Friction Stir Welding, Thousand Oaks, CA, USA 1999.
Figure 1.
Cross-sections of AFED Tooling: 1) coolant supply and return 2) coolant passages 3) thermo-couple 4) die holder 5) guide tube with lower end (pink) 6) feedstock 7) extrusion die 8) outlet passages for material overflow to the sides 9) extrusion channels. Note: All parts besides 5) and 6) are rotating during the process (separation indicated by yellow line).
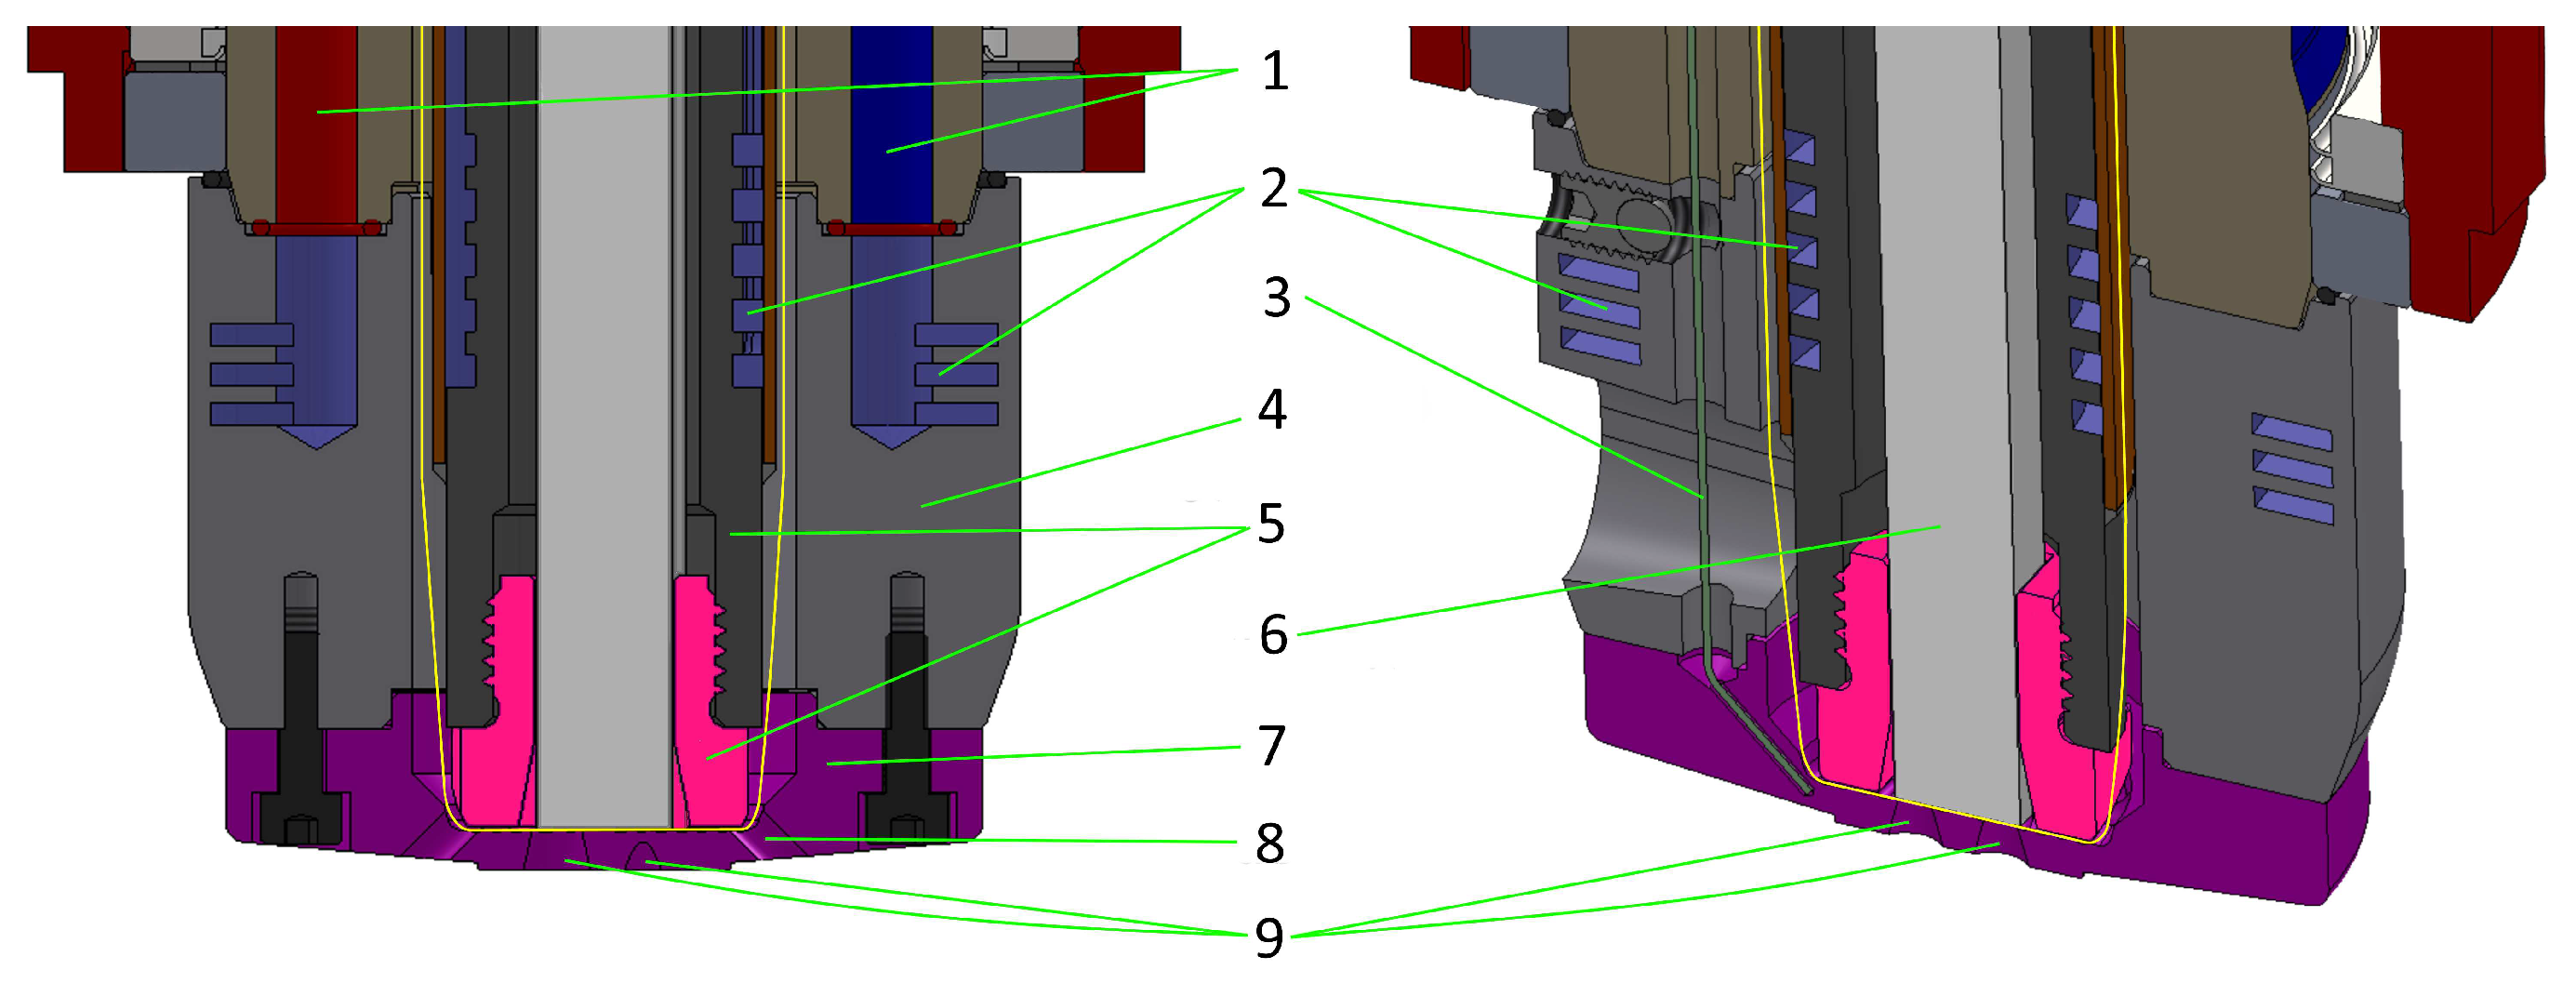
Figure 2.
Overview of the most relevant forces of the Process and Illustration of material flow, heat generation of the AFED process (red) and dissipation into build and periphery (blue).
Figure 2.
Overview of the most relevant forces of the Process and Illustration of material flow, heat generation of the AFED process (red) and dissipation into build and periphery (blue).
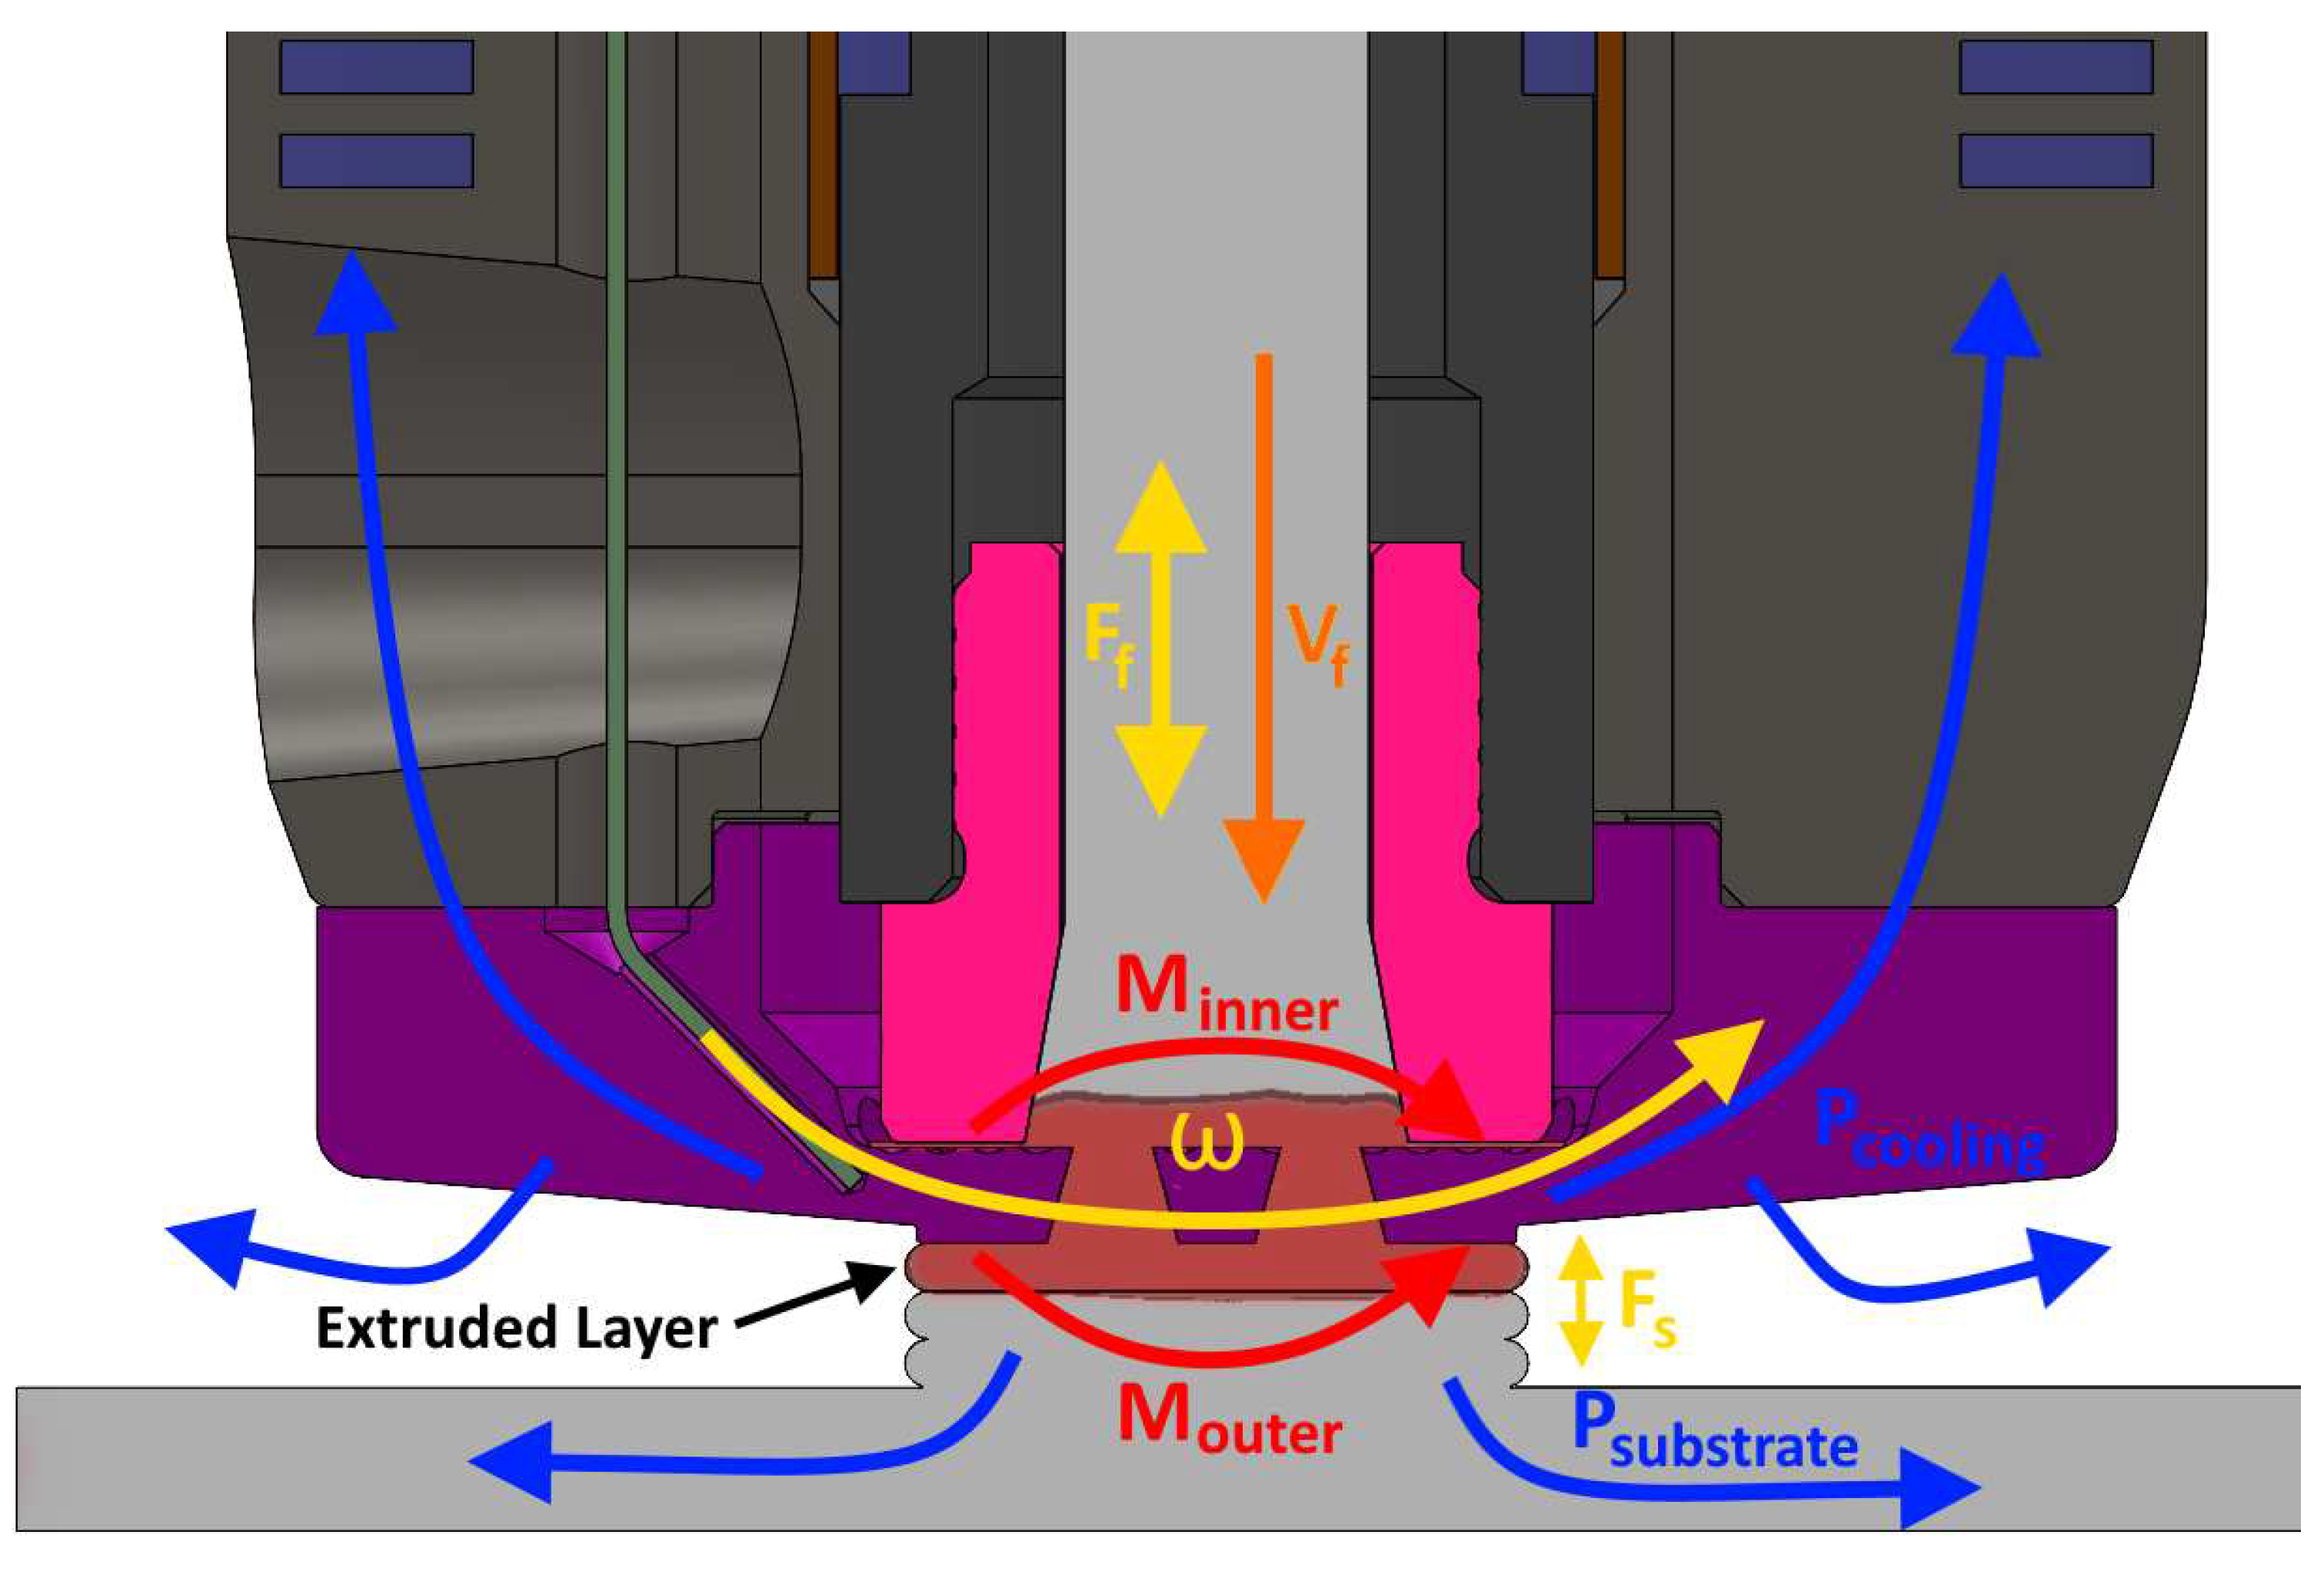
Figure 3.
Temperature-dependent thermal and mechanical properties of AA 6061-T6, from [10].
Figure 3.
Temperature-dependent thermal and mechanical properties of AA 6061-T6, from [10].
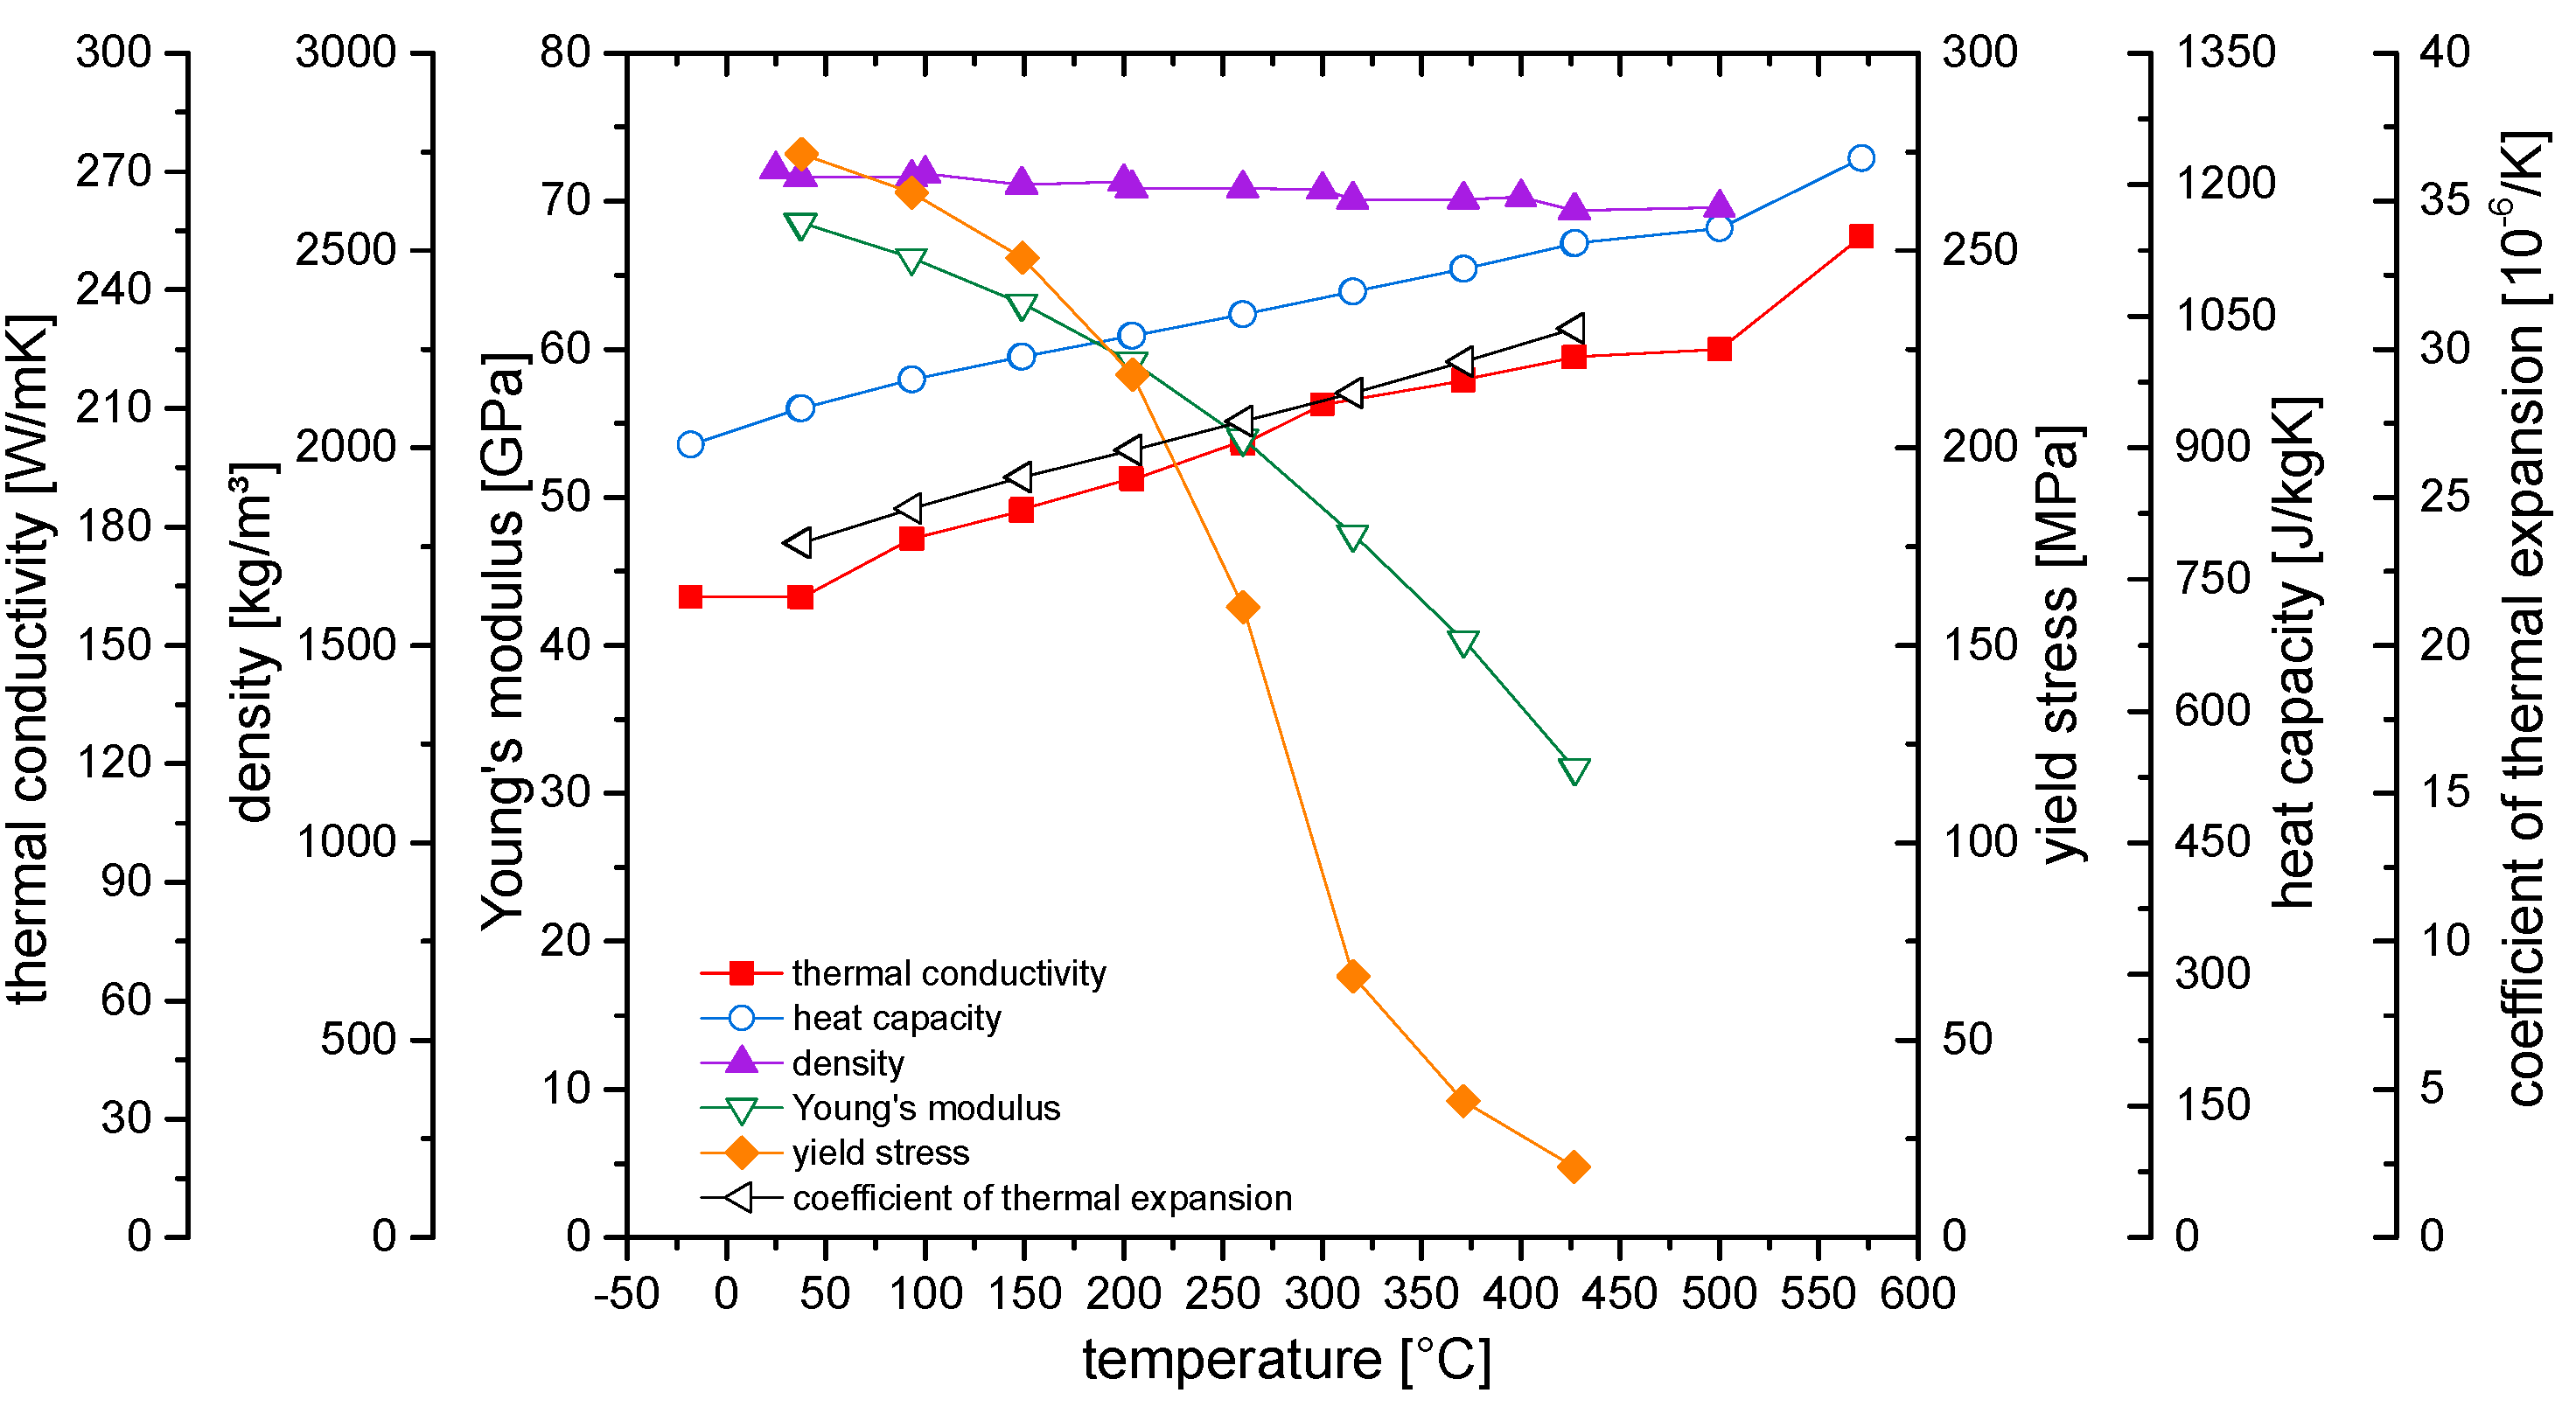
Figure 4.
Tool-holder with cooling collar (red), mounted die (silver) and fixturing. Background: linear and doughnut shaped test extrusions.
Figure 4.
Tool-holder with cooling collar (red), mounted die (silver) and fixturing. Background: linear and doughnut shaped test extrusions.
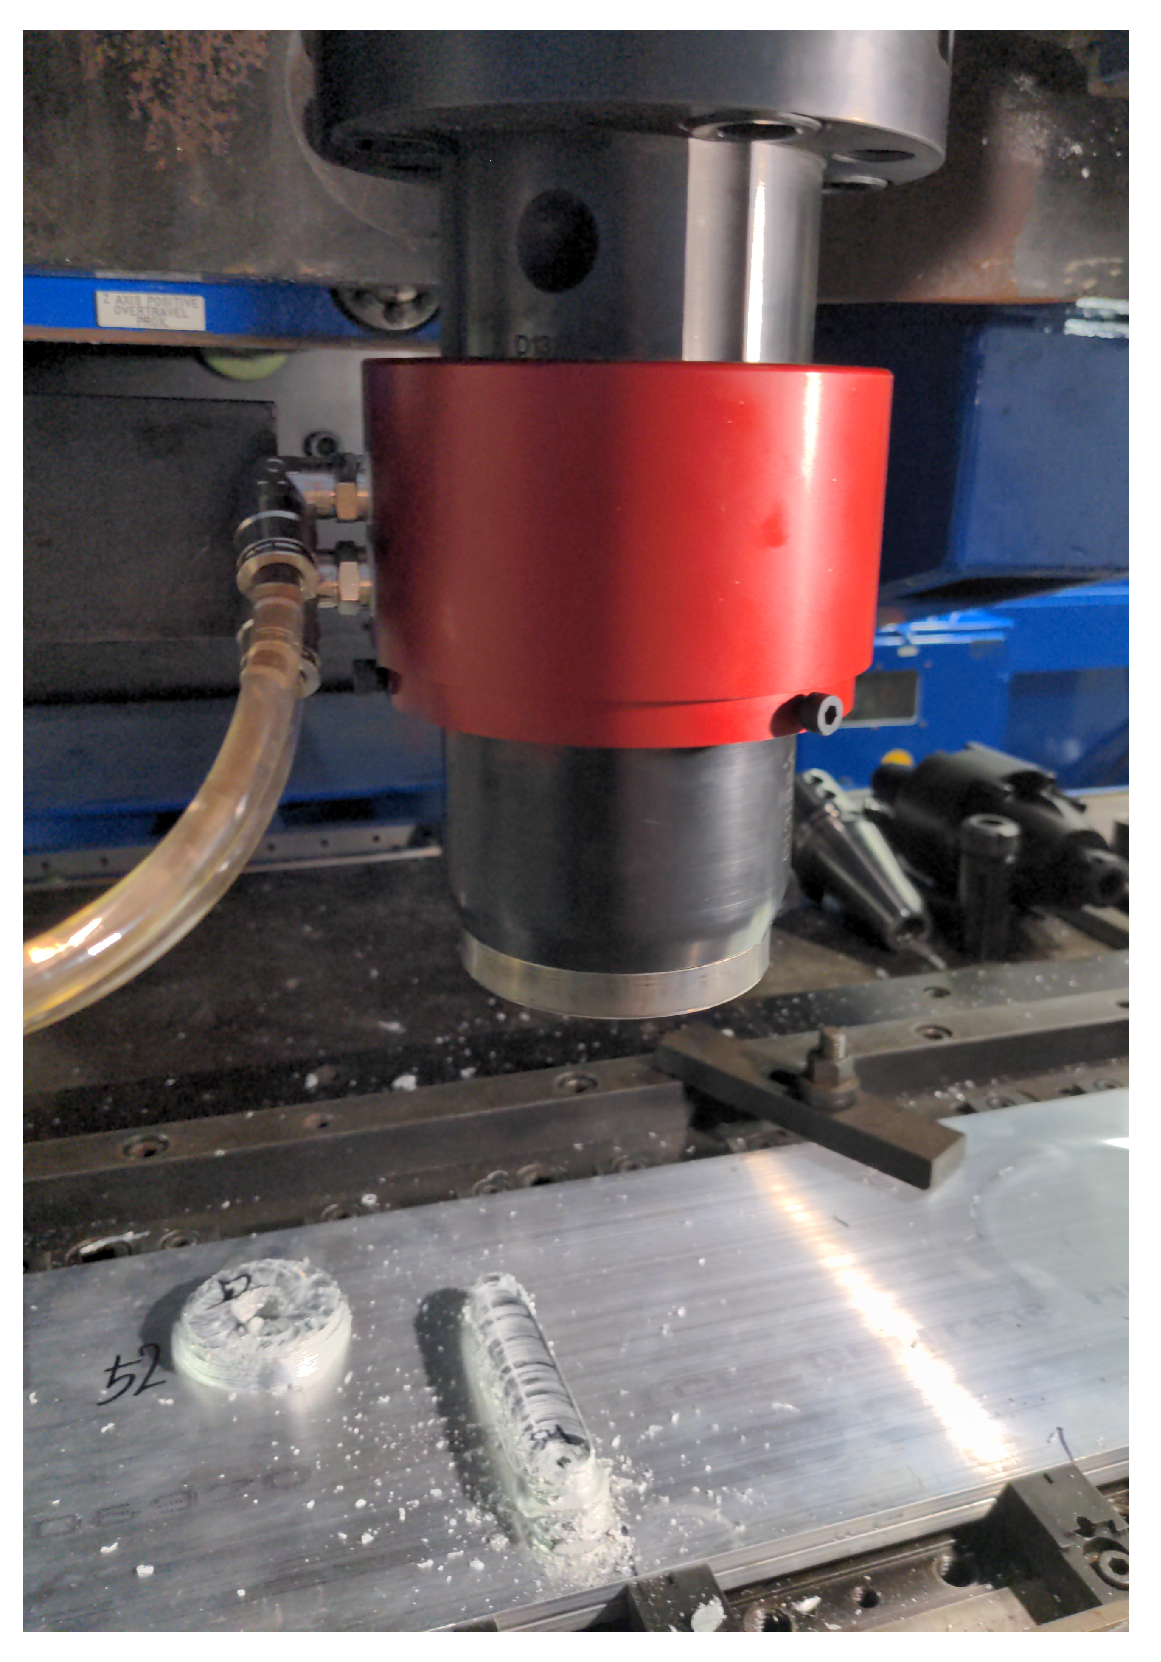
Figure 5.
Designs of inner (top) and outer (bottom) working surfaces of the seven different die designs tested showing material flow and extrusion features.
Figure 5.
Designs of inner (top) and outer (bottom) working surfaces of the seven different die designs tested showing material flow and extrusion features.
| # 1 | # 2 | # 3 | # 4 | # 5 | # 6 | # 7 |
Figure 6.
Ribbon formation (extrudate) as generated by two different die designs: bow-tie # 1 (left, end of rod with visible bulging) and 45° tri-hole # 4 (right, still within die).
Figure 6.
Ribbon formation (extrudate) as generated by two different die designs: bow-tie # 1 (left, end of rod with visible bulging) and 45° tri-hole # 4 (right, still within die).
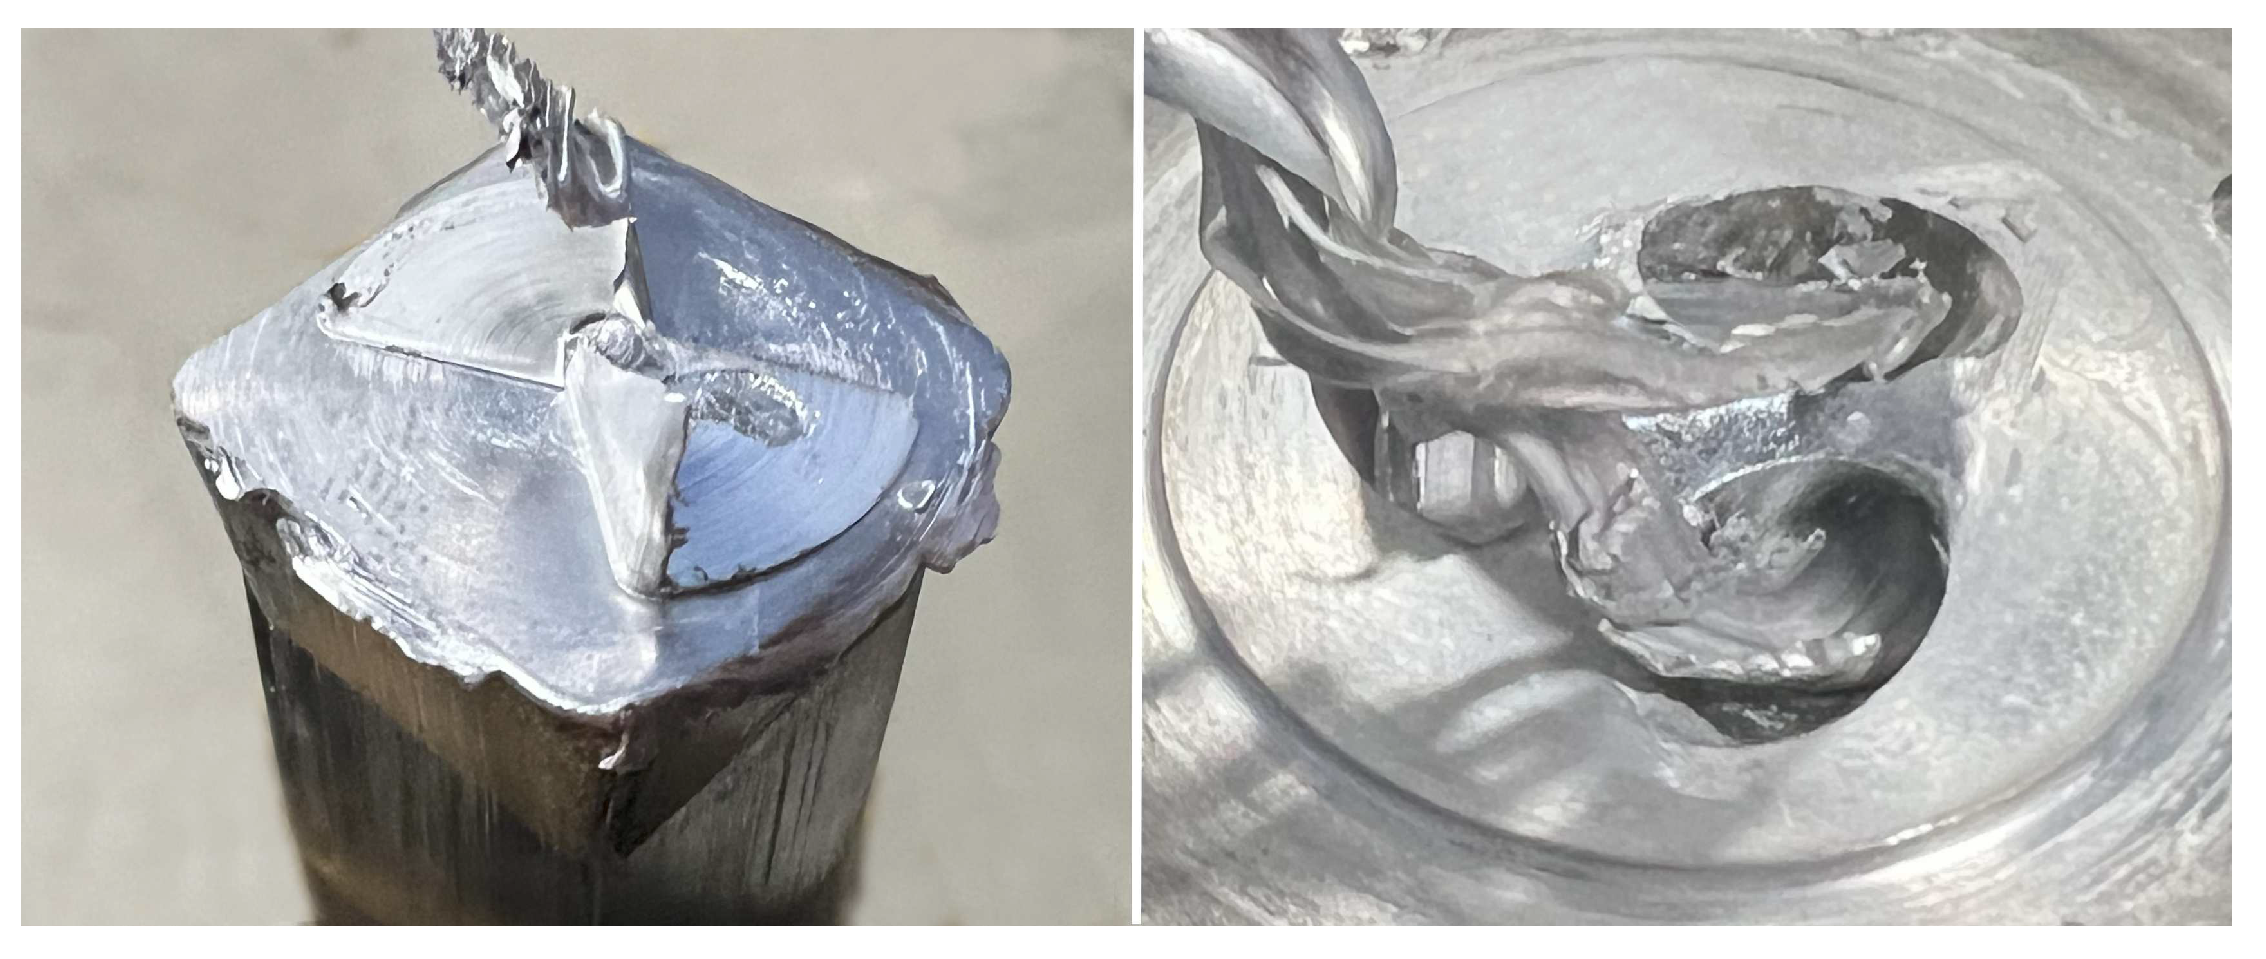
Figure 7.
Initial (left) and revised (right) guide tube end / die interface shown with rod (orange) from above. The initial design with square taper, which allowed feedstock material to easily be forced between the die and guide tube end. The revised design has a clear radial demarcation. Both contours of taper (square and round) highlighted in red.
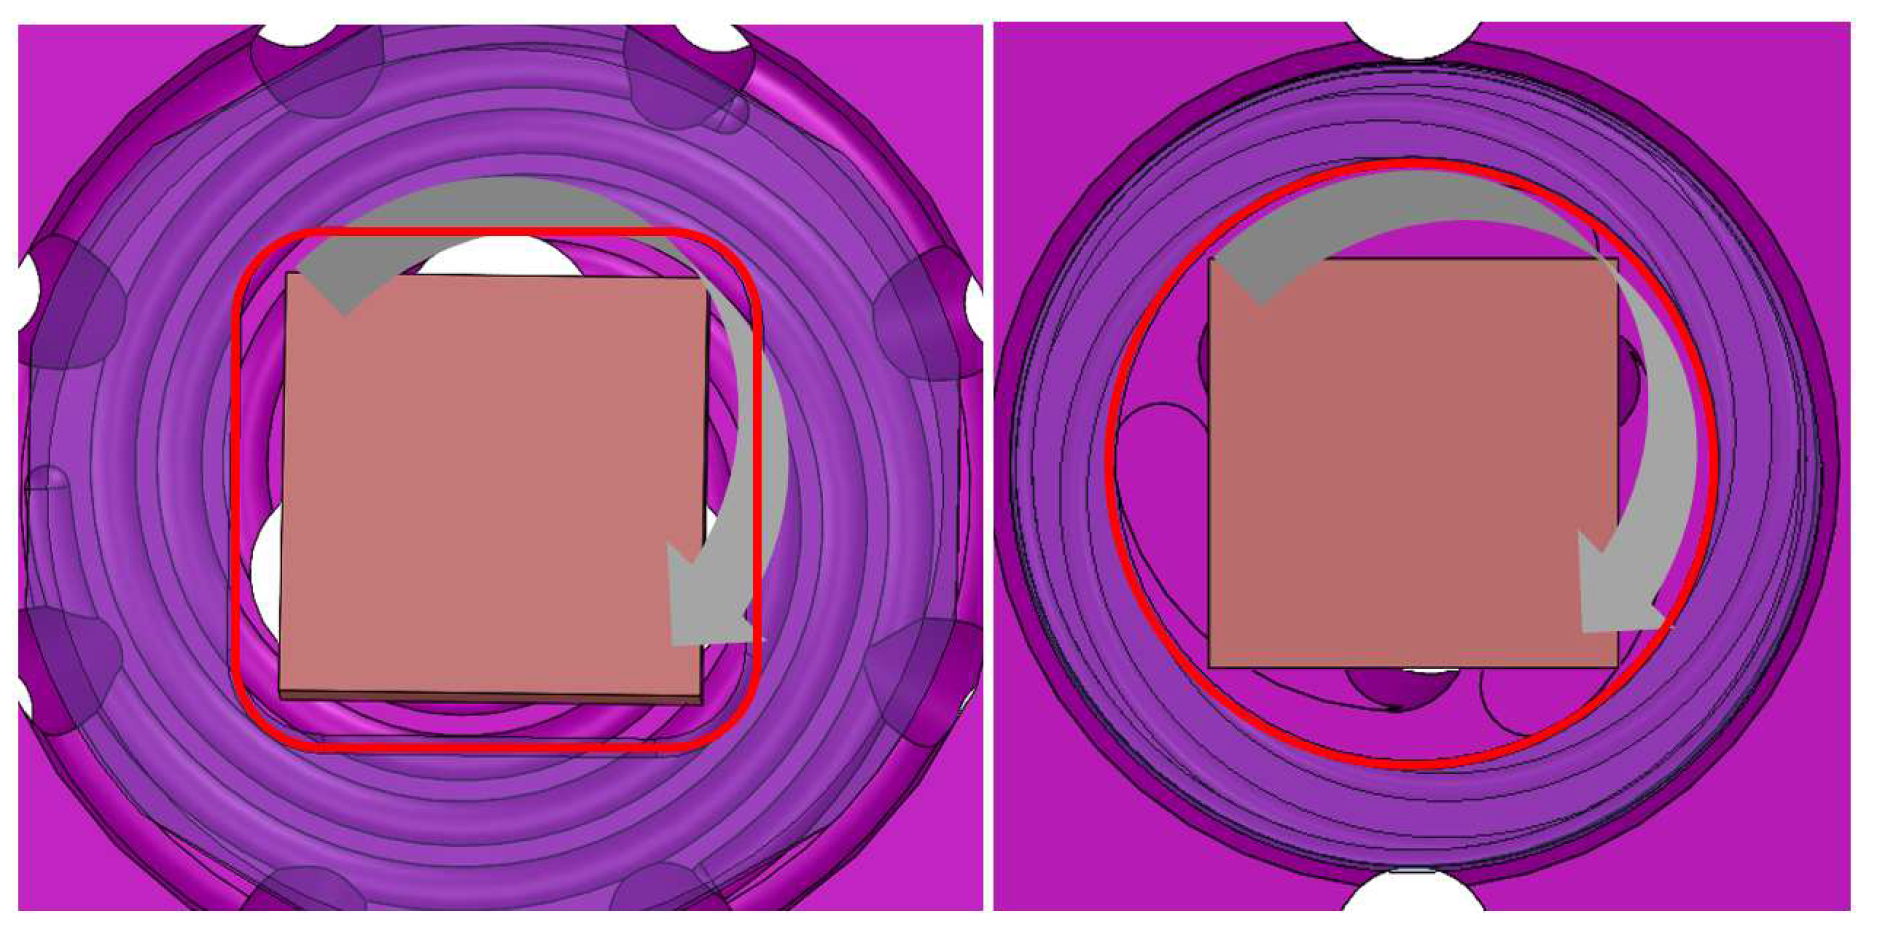
Figure 8.
Specific process energy consumption (Equation 8) by die number (see Figure 5) and volumetric deposition rate. Values are the averaged per deposition run during steady-state conditions.
Figure 8.
Specific process energy consumption (Equation 8) by die number (see Figure 5) and volumetric deposition rate. Values are the averaged per deposition run during steady-state conditions.
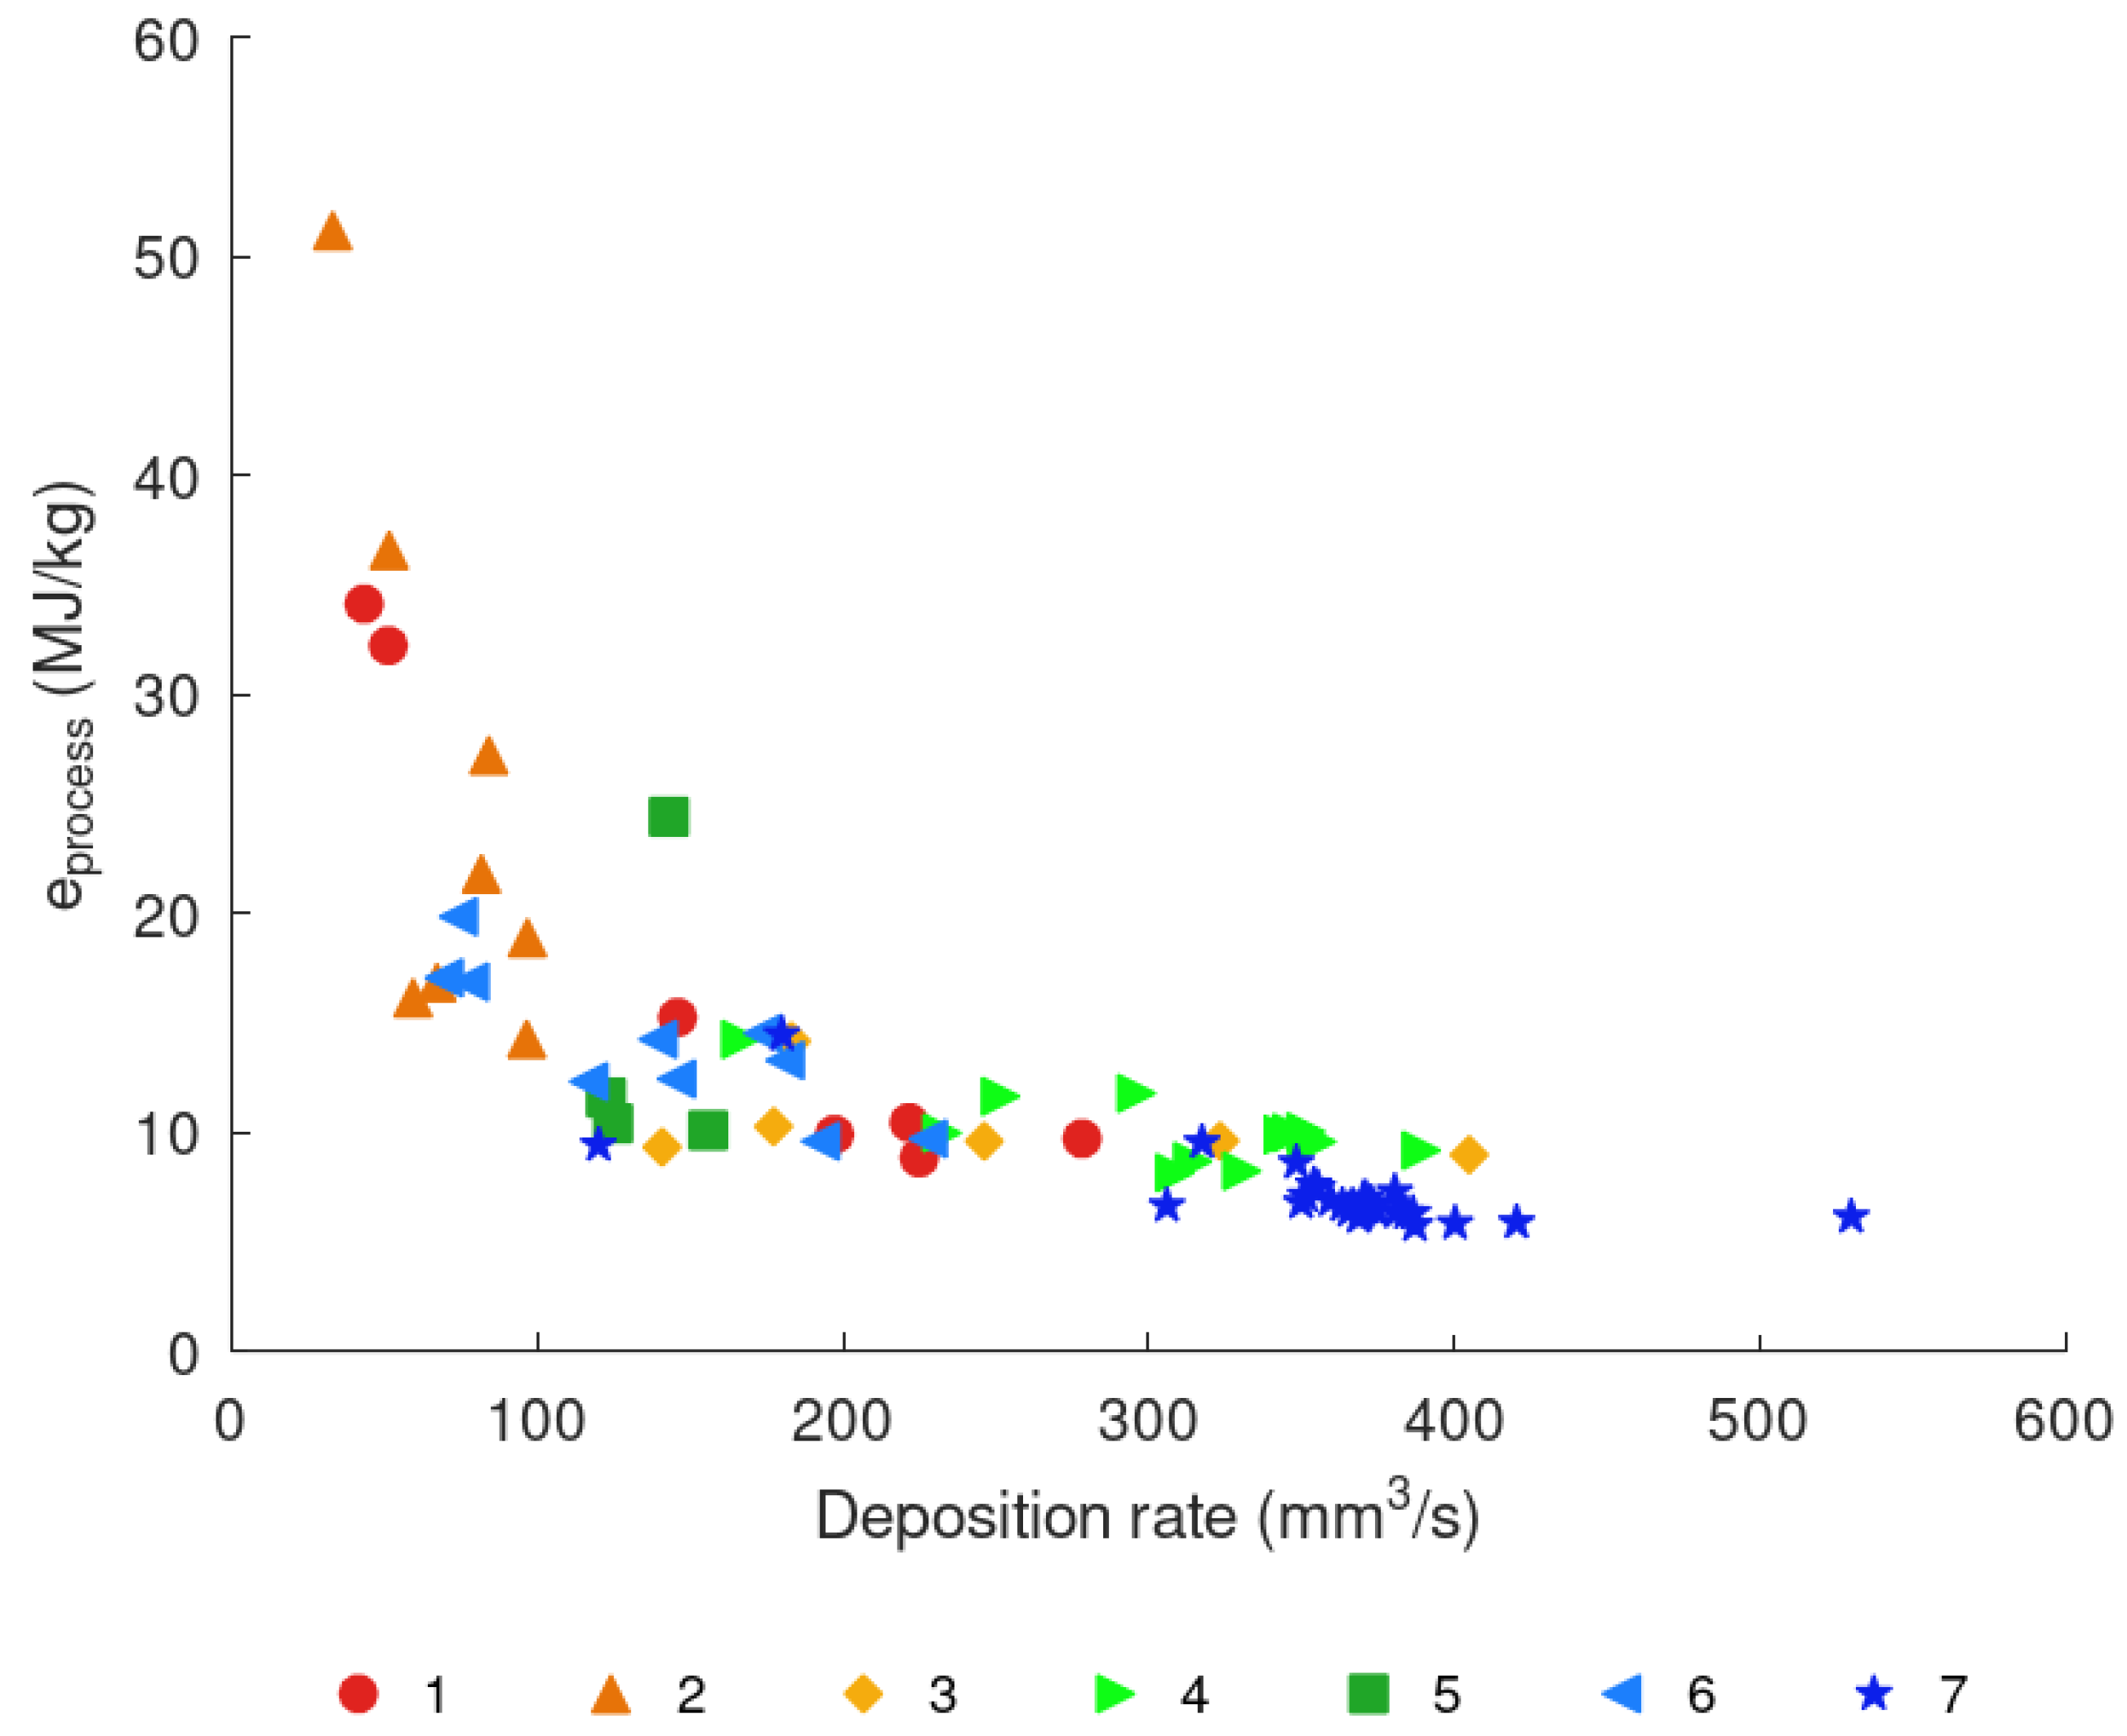
Figure 9.
Feedstock forces by die number and volumetric deposition rate. Values are the averaged per deposition run during steady-state conditions.
Figure 9.
Feedstock forces by die number and volumetric deposition rate. Values are the averaged per deposition run during steady-state conditions.
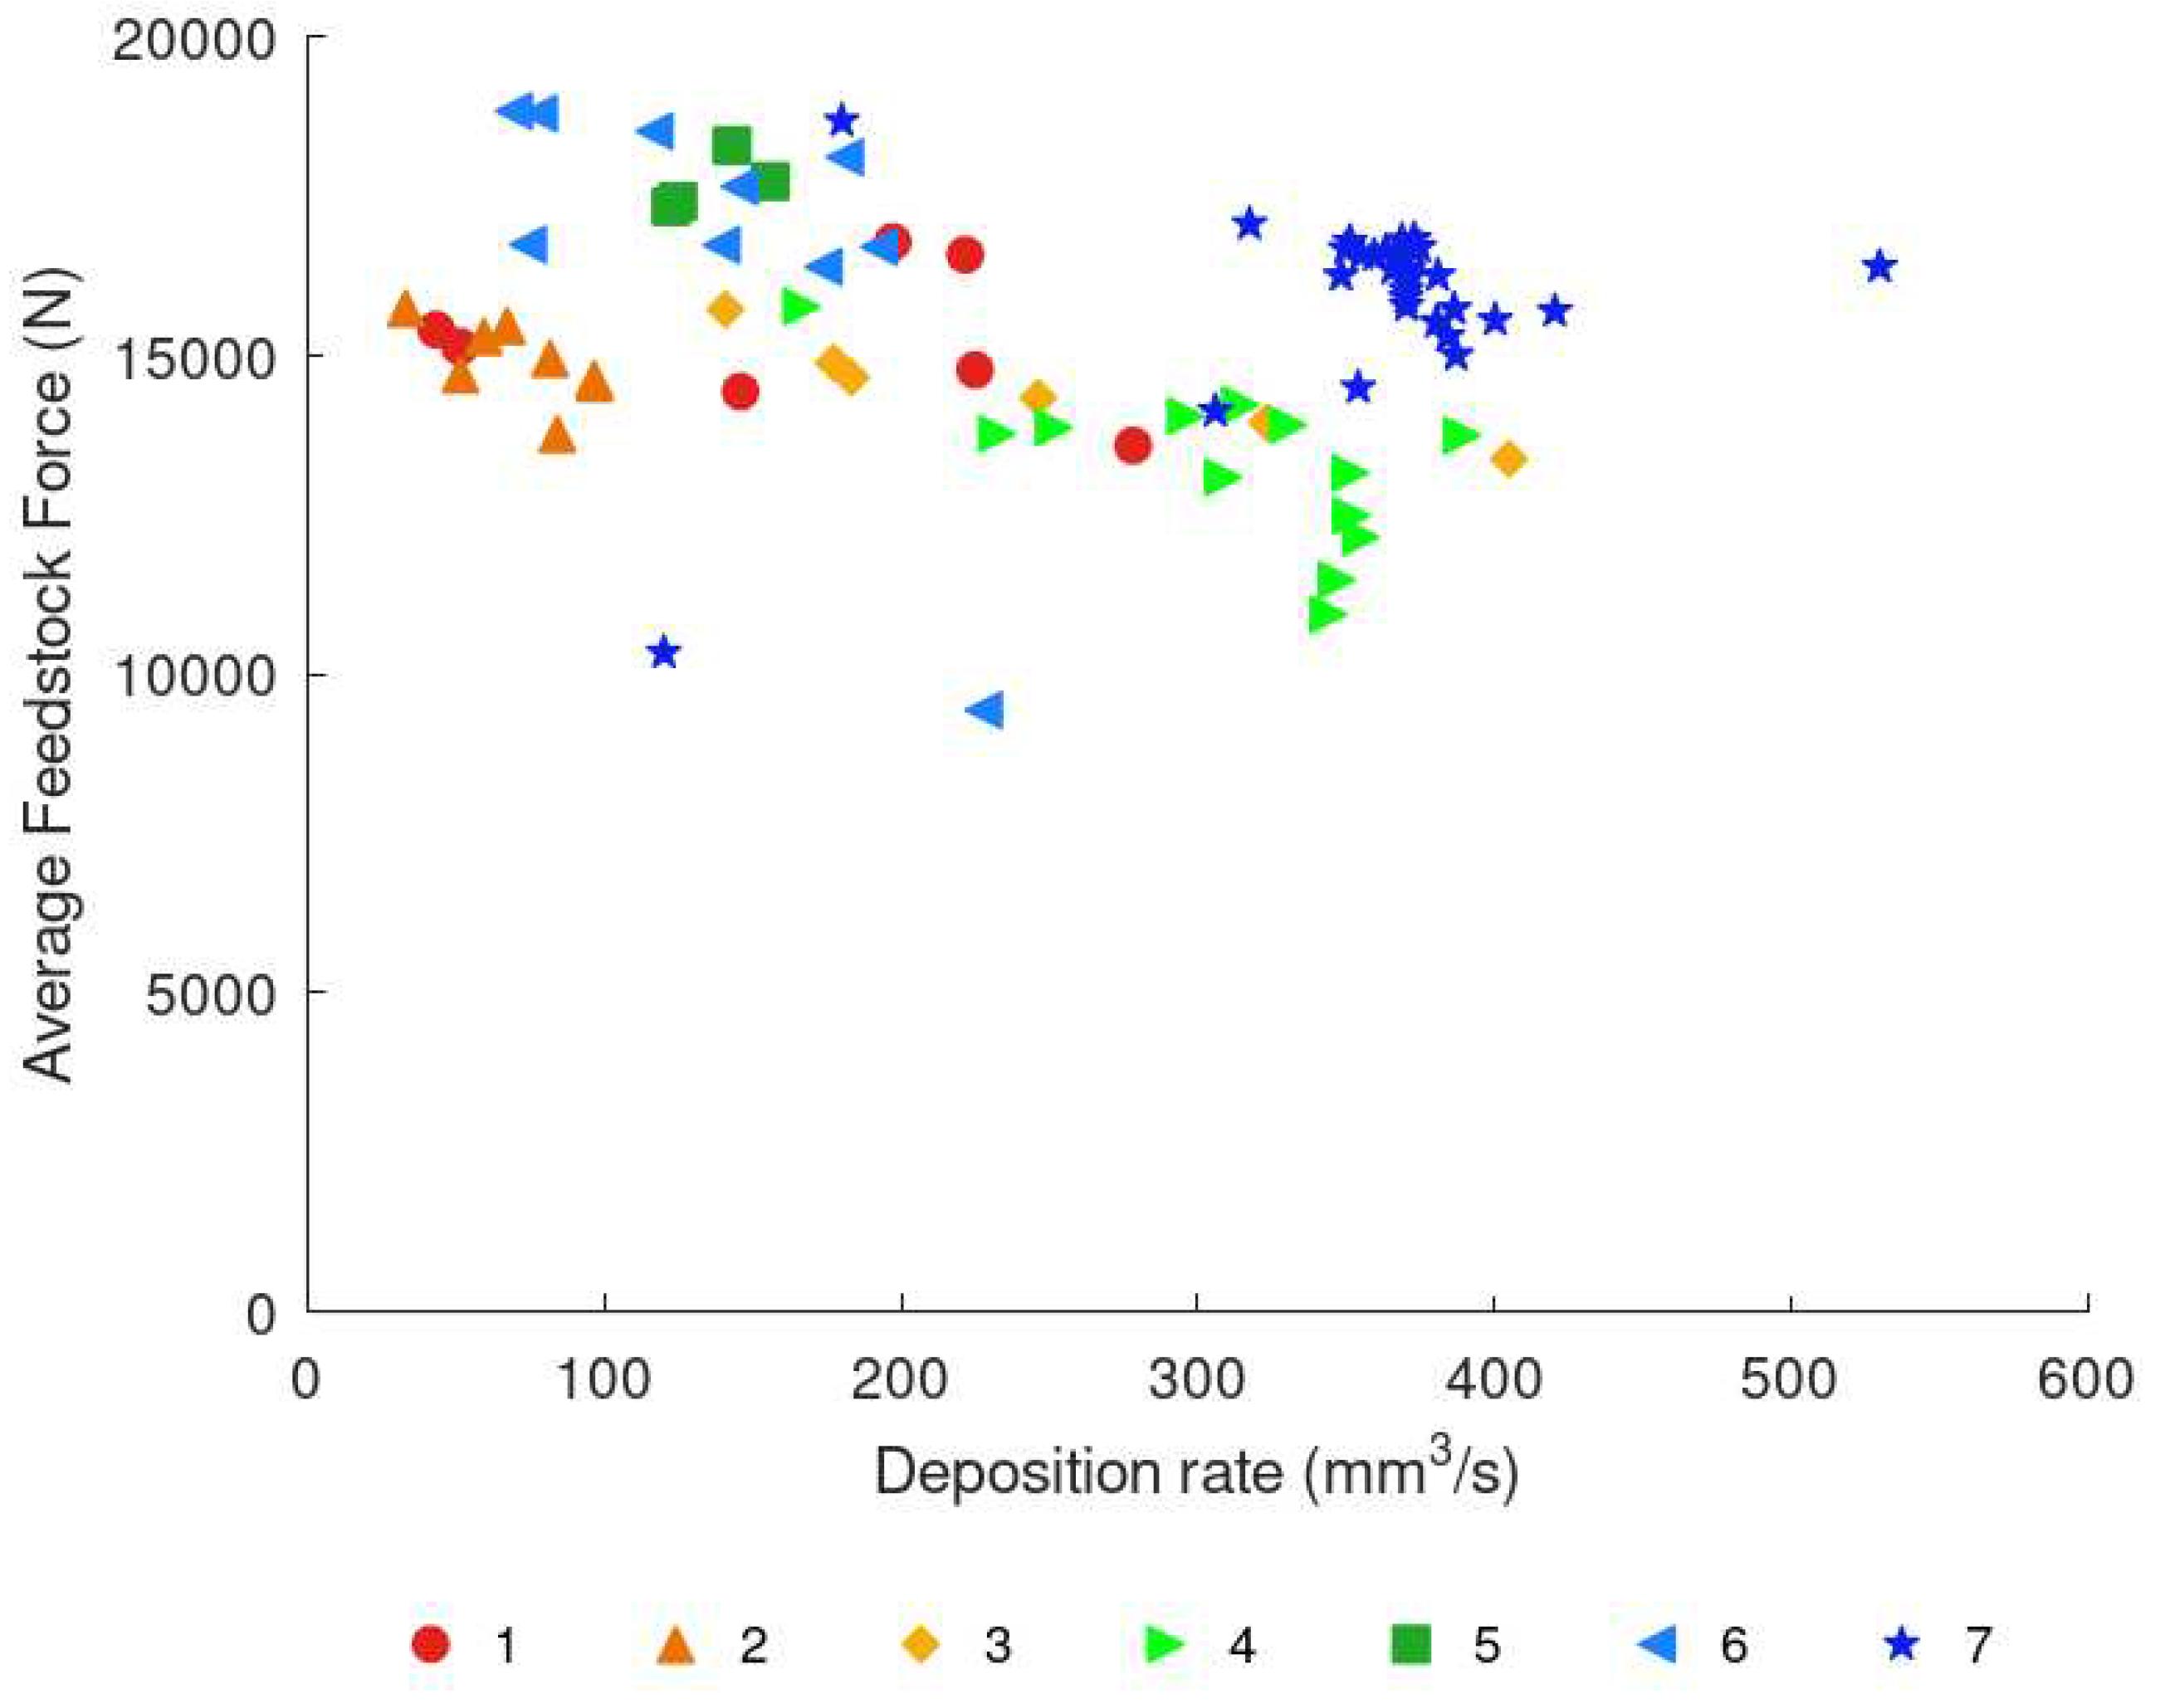
Figure 10.
Force on the substrate by die number and volumetric deposition rate. Values are averaged per deposition run during steady-state conditions.
Figure 10.
Force on the substrate by die number and volumetric deposition rate. Values are averaged per deposition run during steady-state conditions.
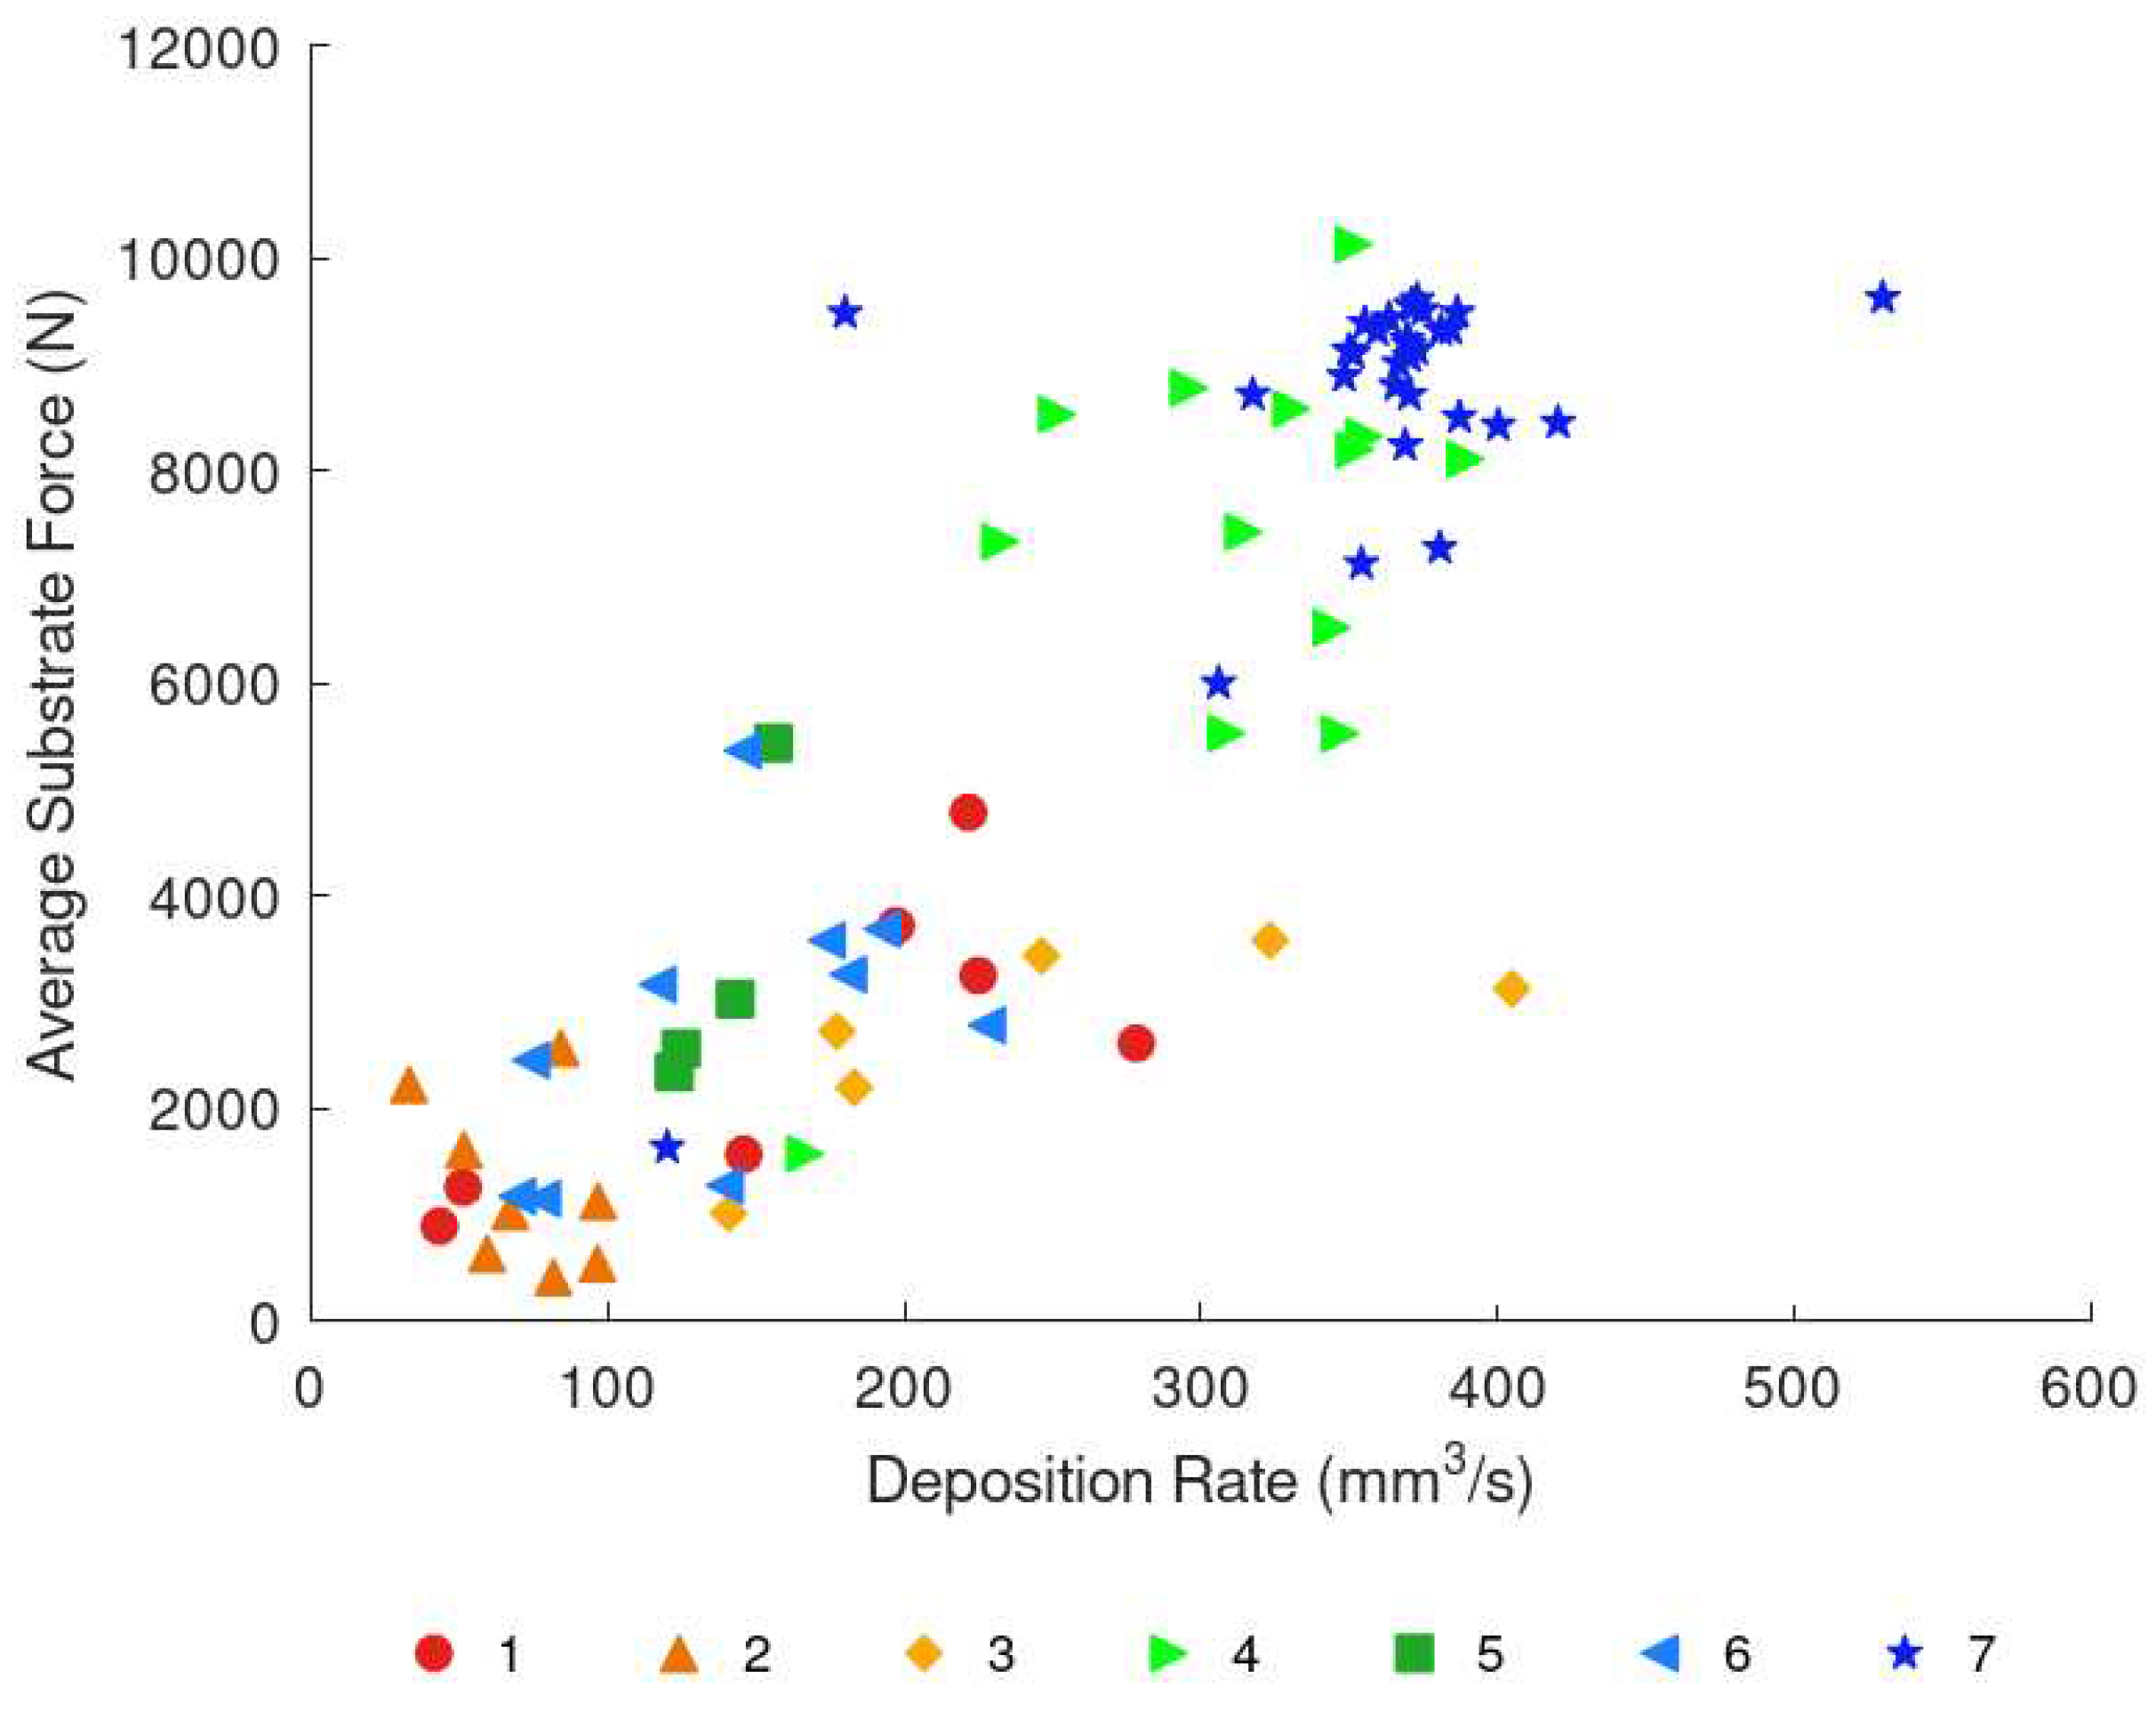
Figure 11.
Completed sample component with base plate after the deposition process. Tensile specimens were extracted from the positions indicated in red.
Figure 11.
Completed sample component with base plate after the deposition process. Tensile specimens were extracted from the positions indicated in red.
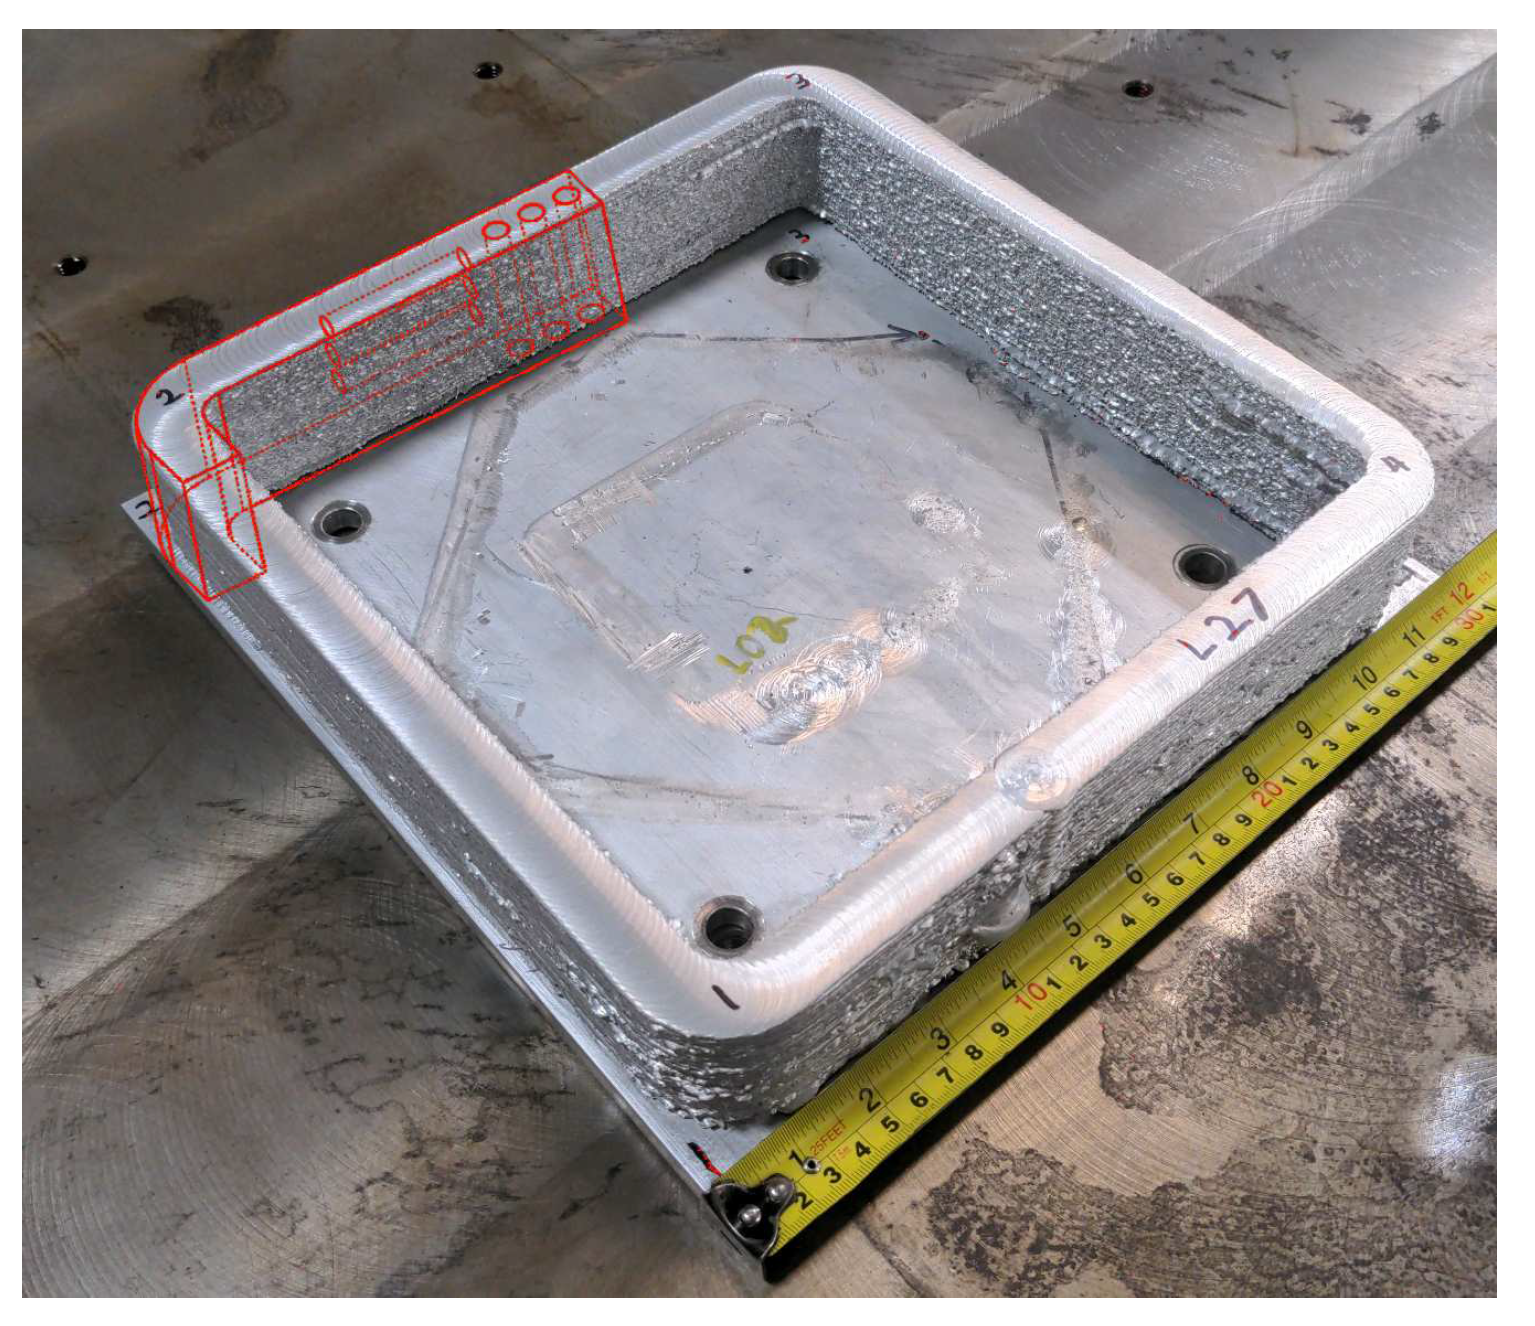
Figure 12.
Cross-section in traverse direction showing the upper 14 deposited layers of the sample build. Advancing side on the left, retreating side on the right.
Figure 12.
Cross-section in traverse direction showing the upper 14 deposited layers of the sample build. Advancing side on the left, retreating side on the right.
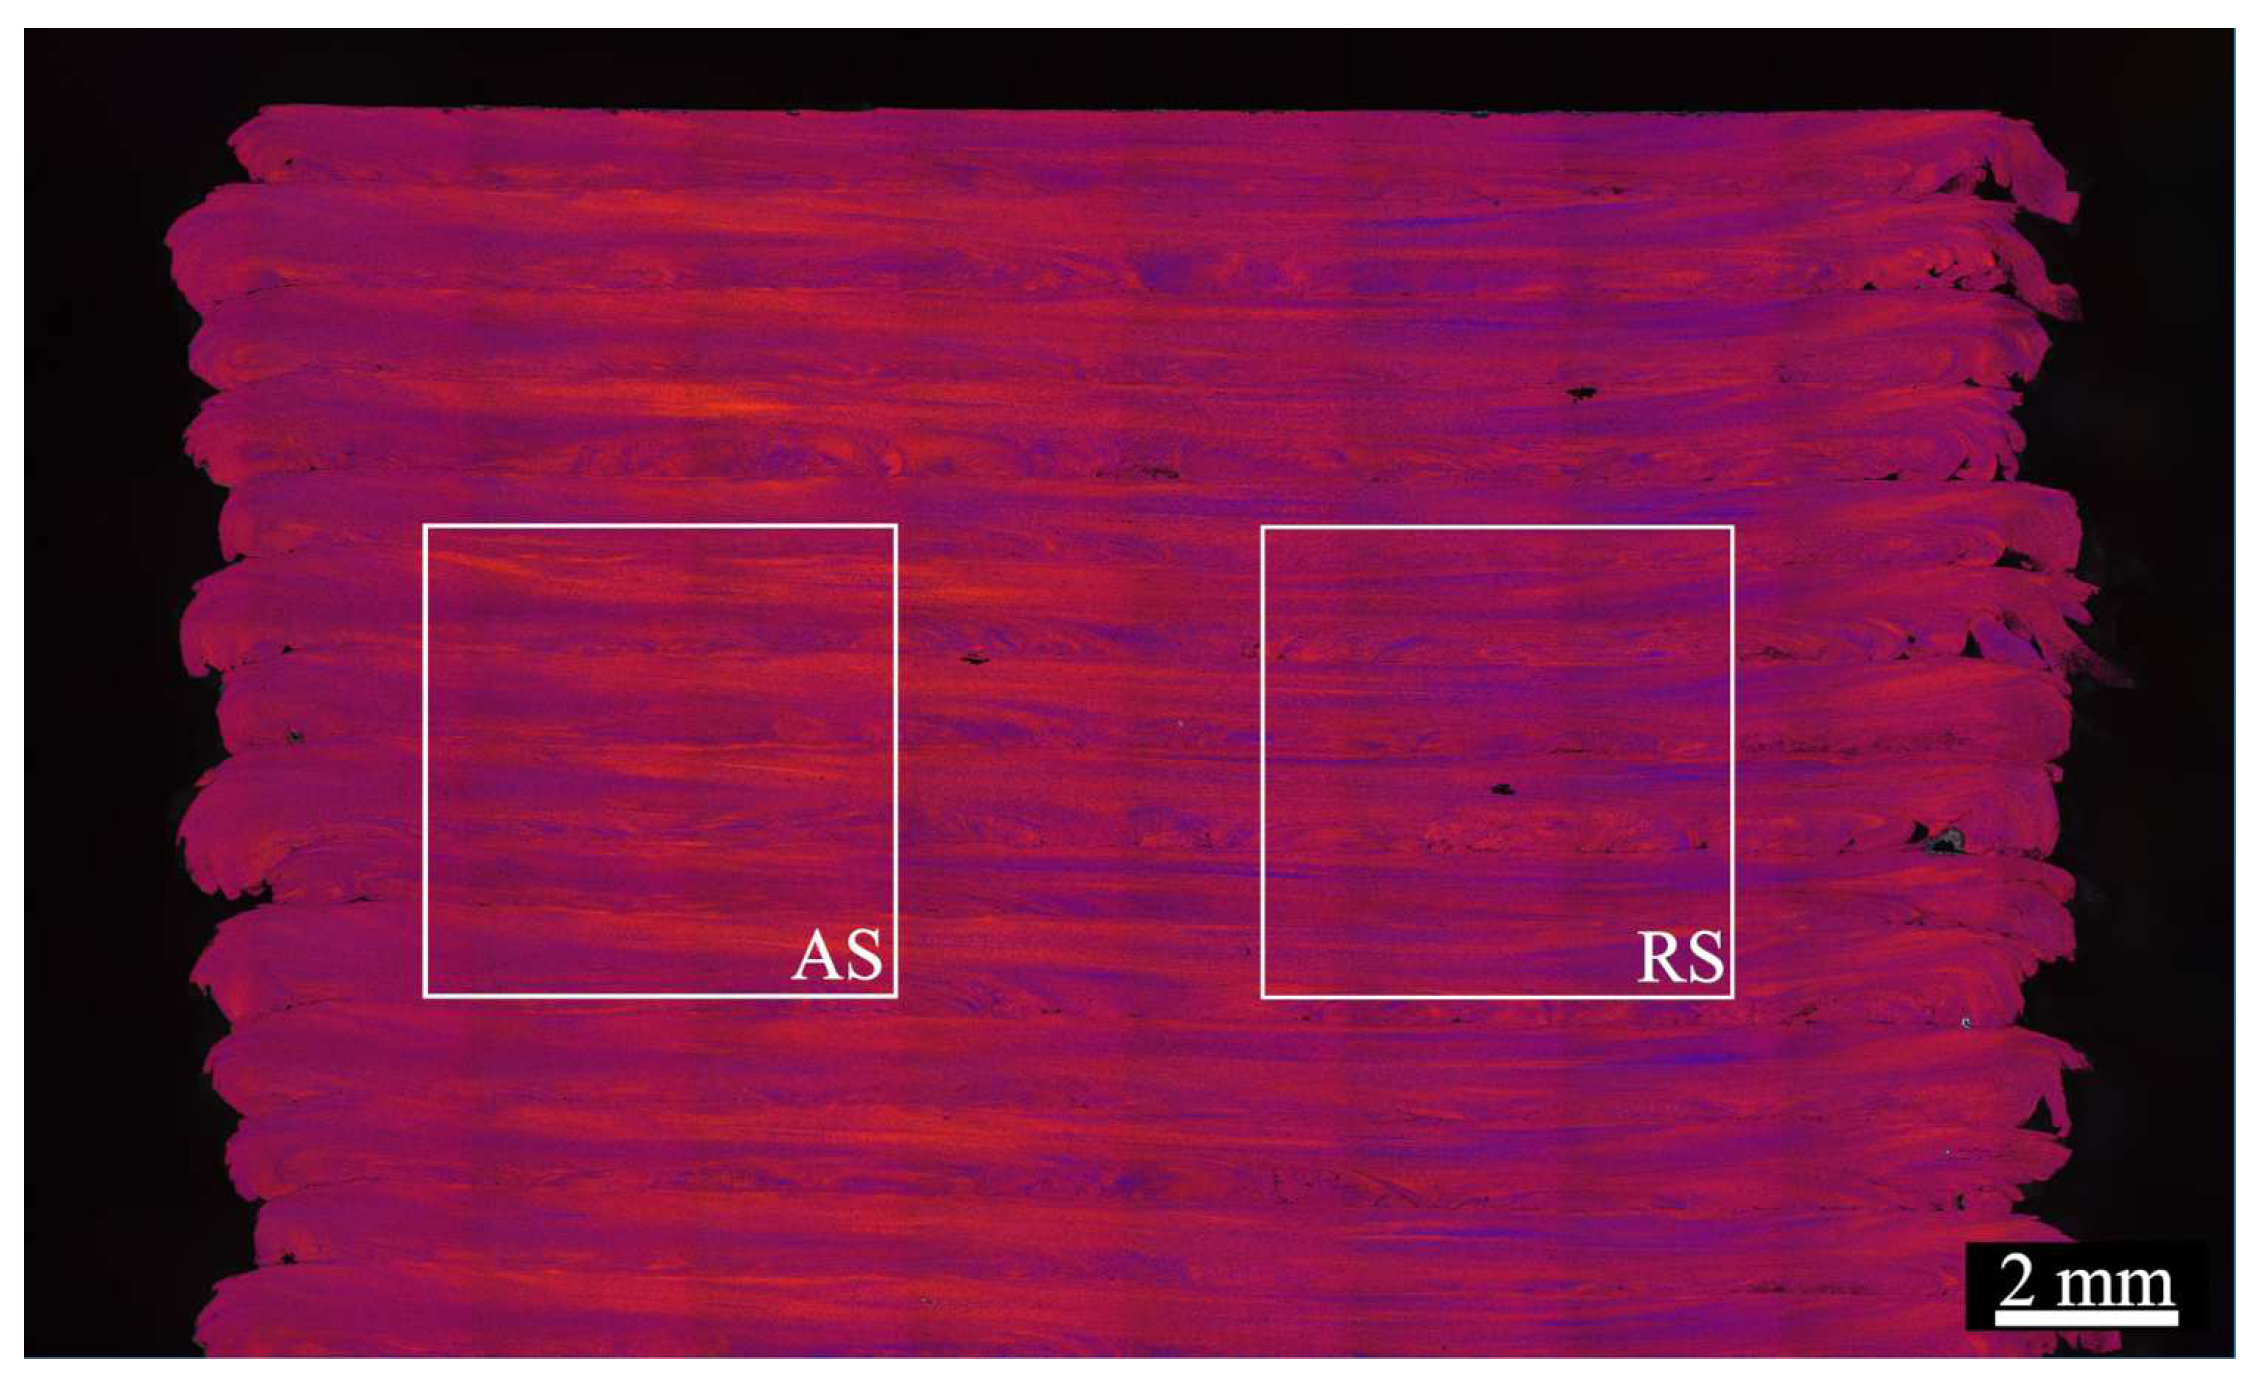
Figure 13.
Macros of advancing (left) and retreating side (right). Locations as marked in Figure 12.
Figure 13.
Macros of advancing (left) and retreating side (right). Locations as marked in Figure 12.
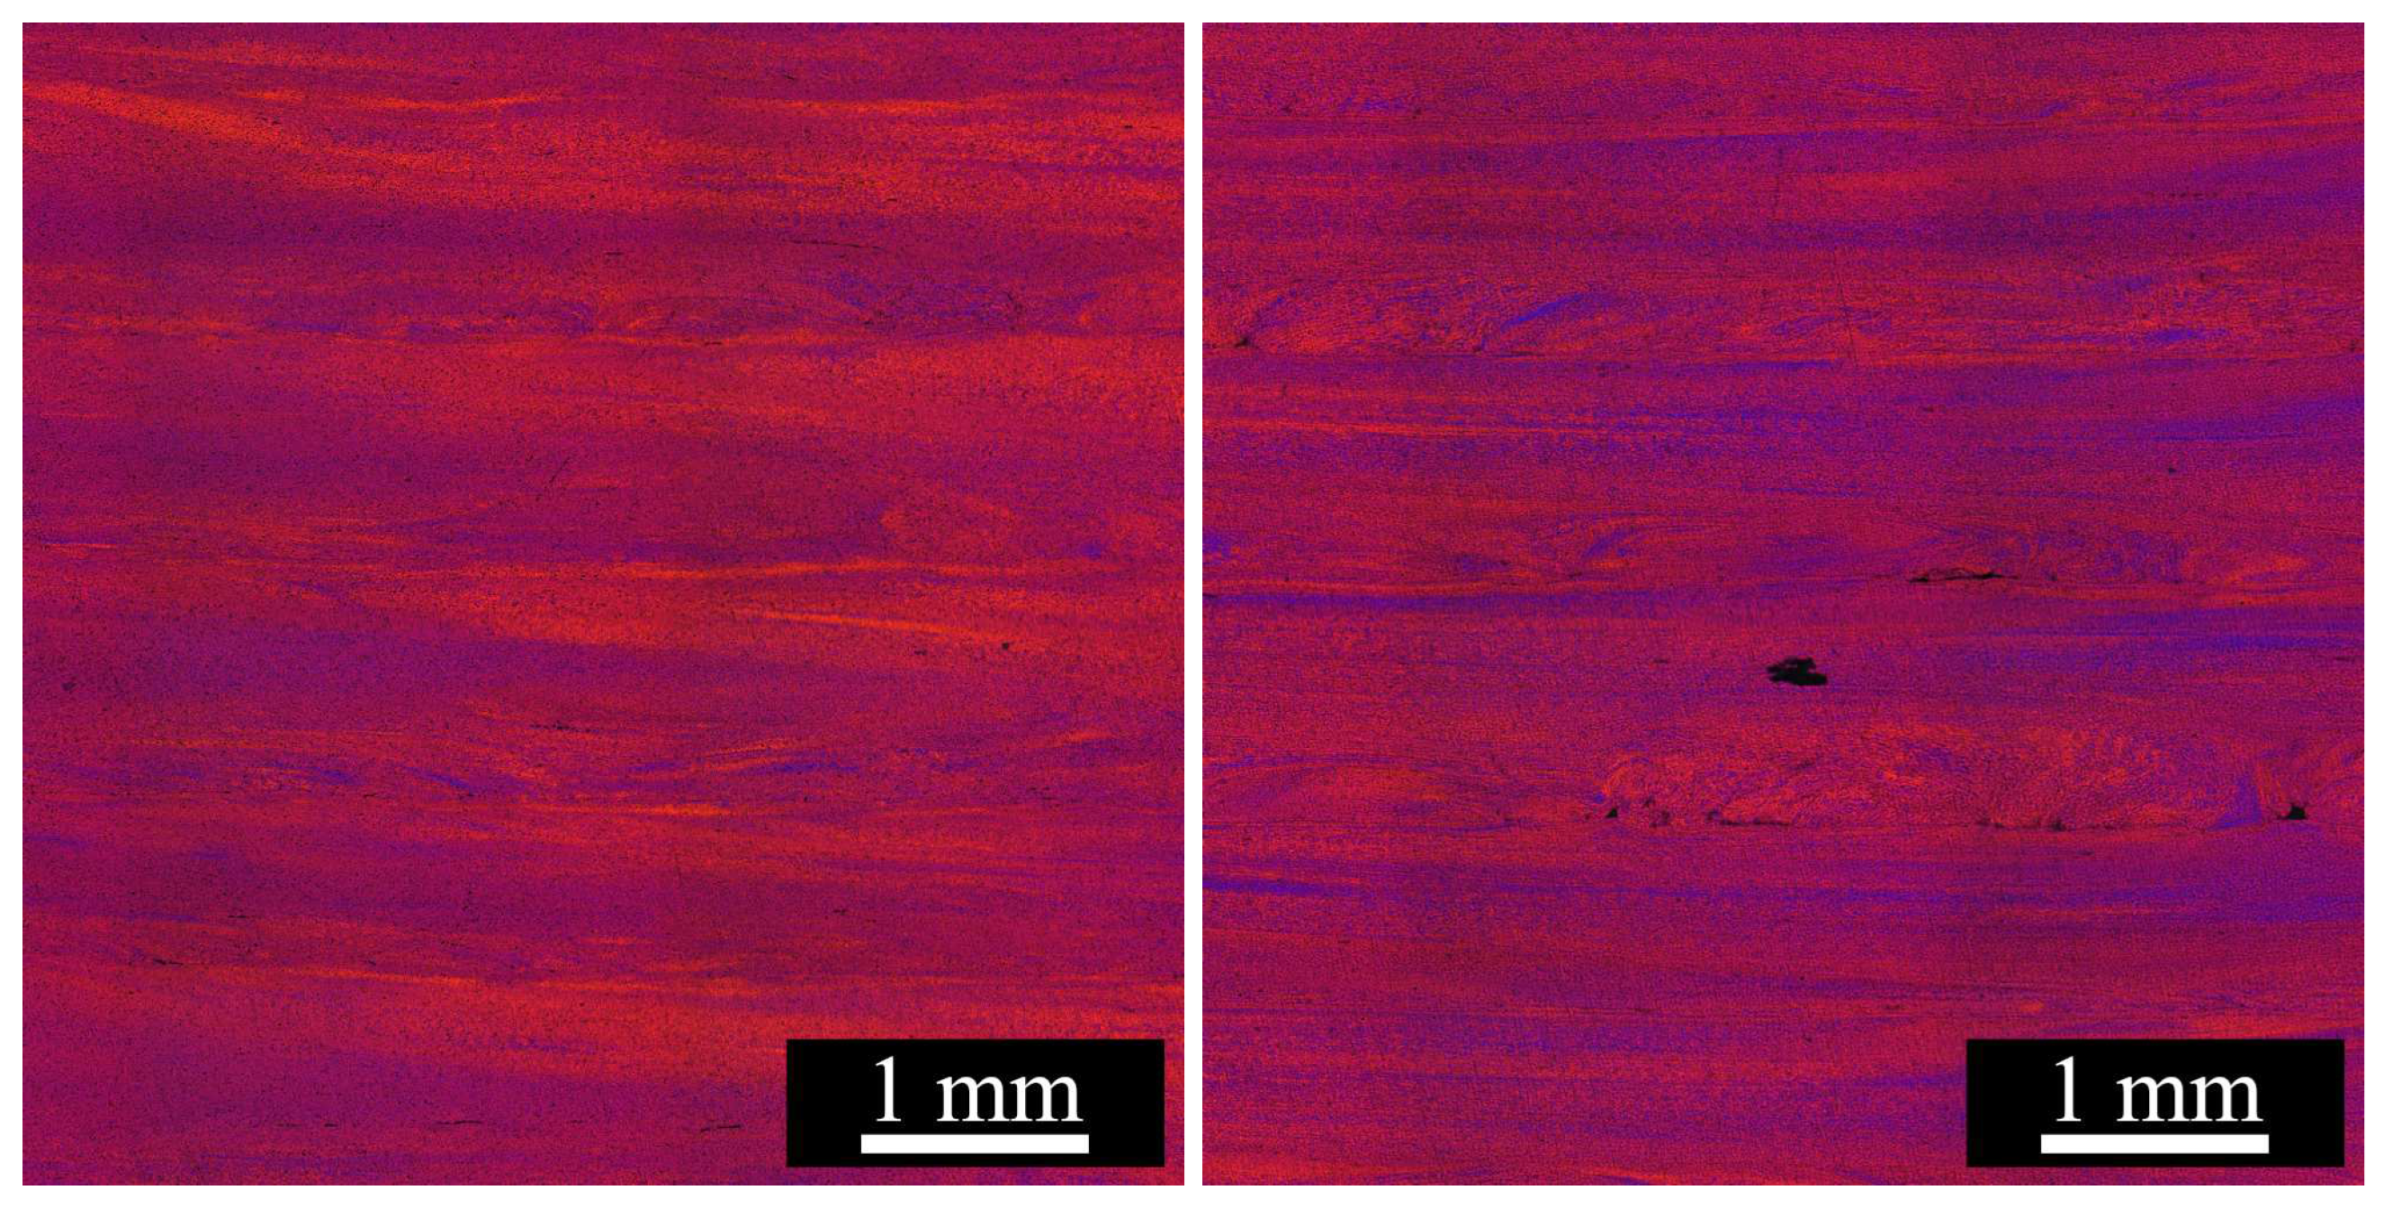
Figure 14.
Left: Longitudinal overview along the traverse direction of the tool showing several deposited layers, coherence and banded structures. Right: Longitudinal detail of layers on the retreating side with magnification of spacing and flaws. Tool travel direction is to the left.
Figure 14.
Left: Longitudinal overview along the traverse direction of the tool showing several deposited layers, coherence and banded structures. Right: Longitudinal detail of layers on the retreating side with magnification of spacing and flaws. Tool travel direction is to the left.
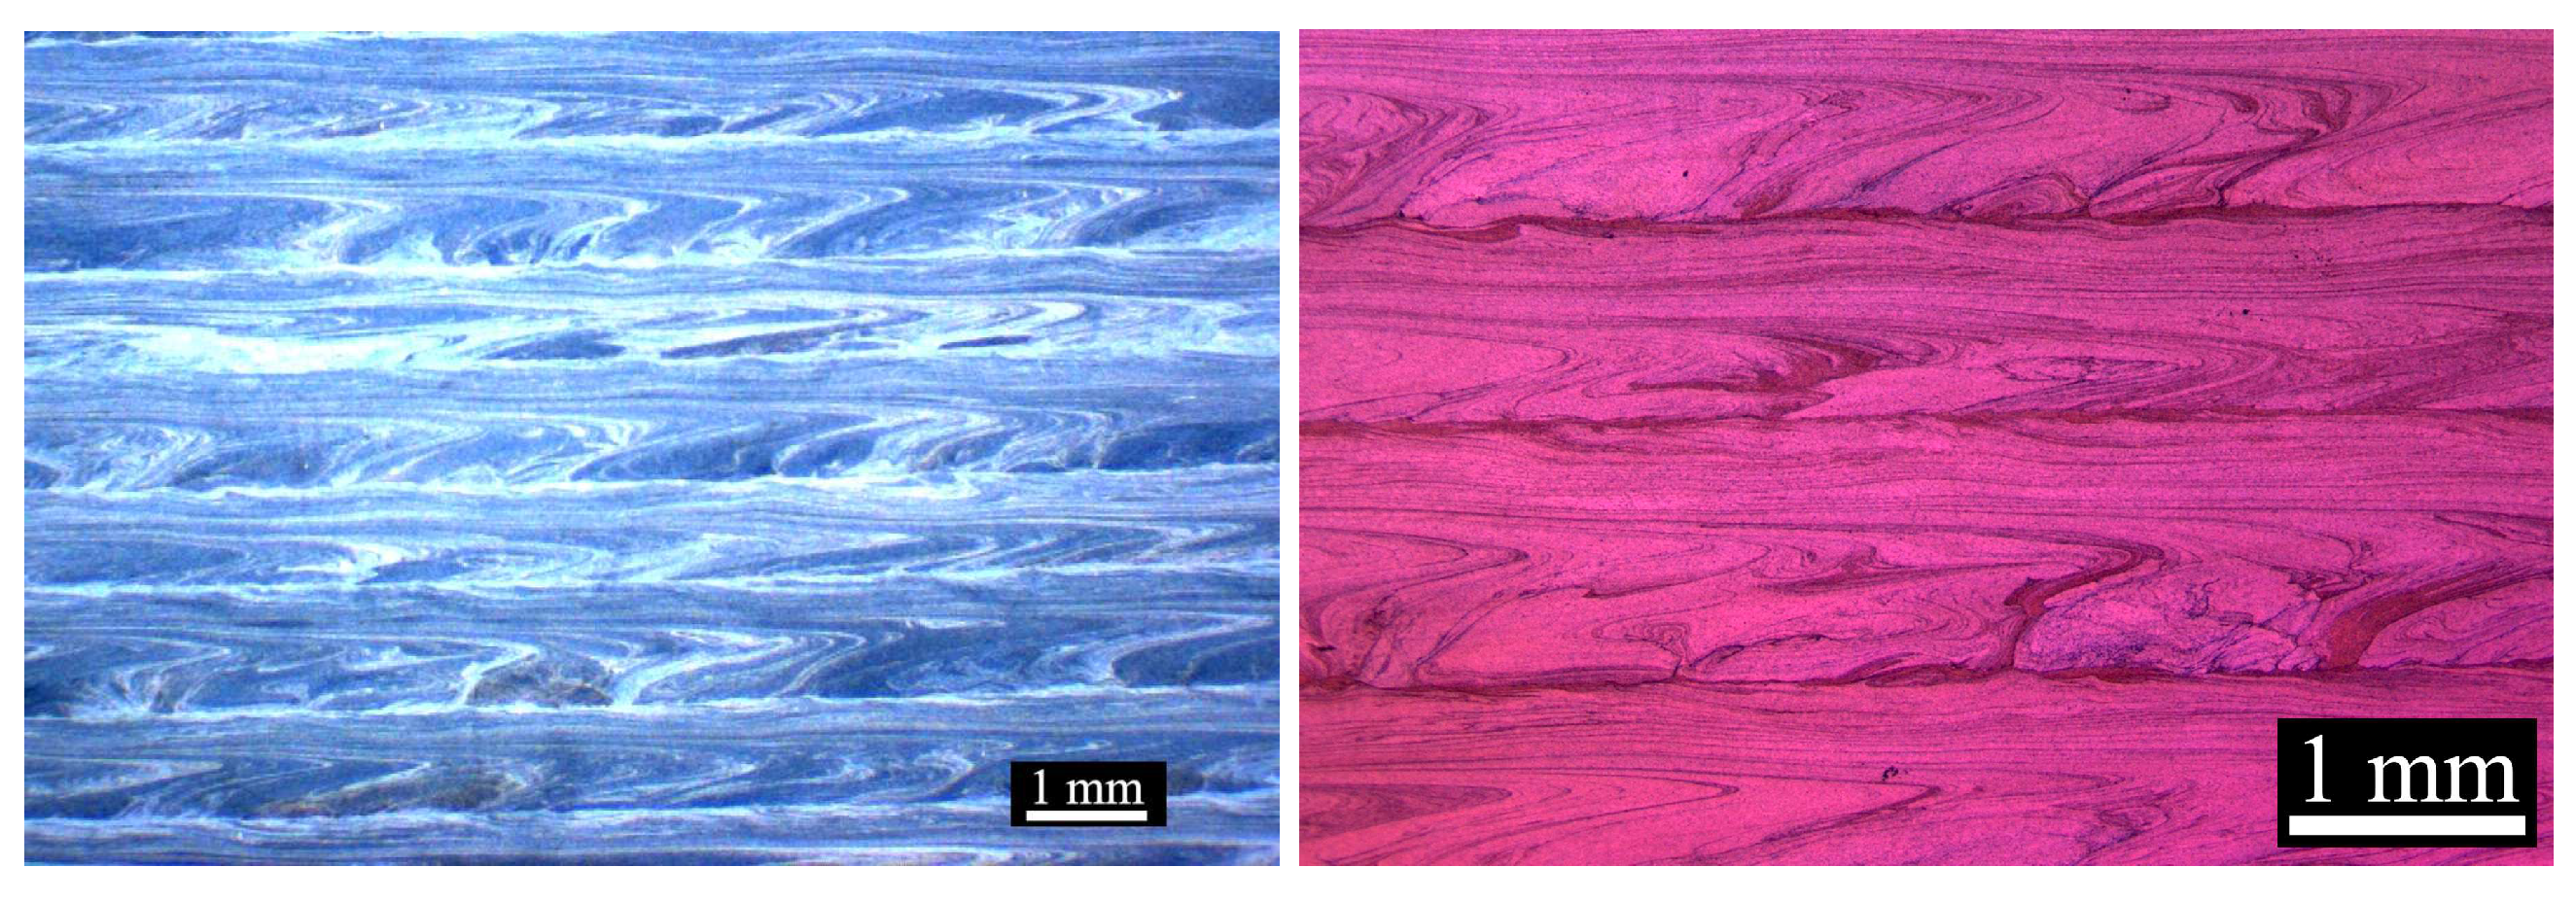
Figure 15.
Stress / strain curves for tensile testing on the specimens and sketch with their respective extraction locations. (Specimens X2 and Y1 were damaged in sample preparation)
Figure 15.
Stress / strain curves for tensile testing on the specimens and sketch with their respective extraction locations. (Specimens X2 and Y1 were damaged in sample preparation)
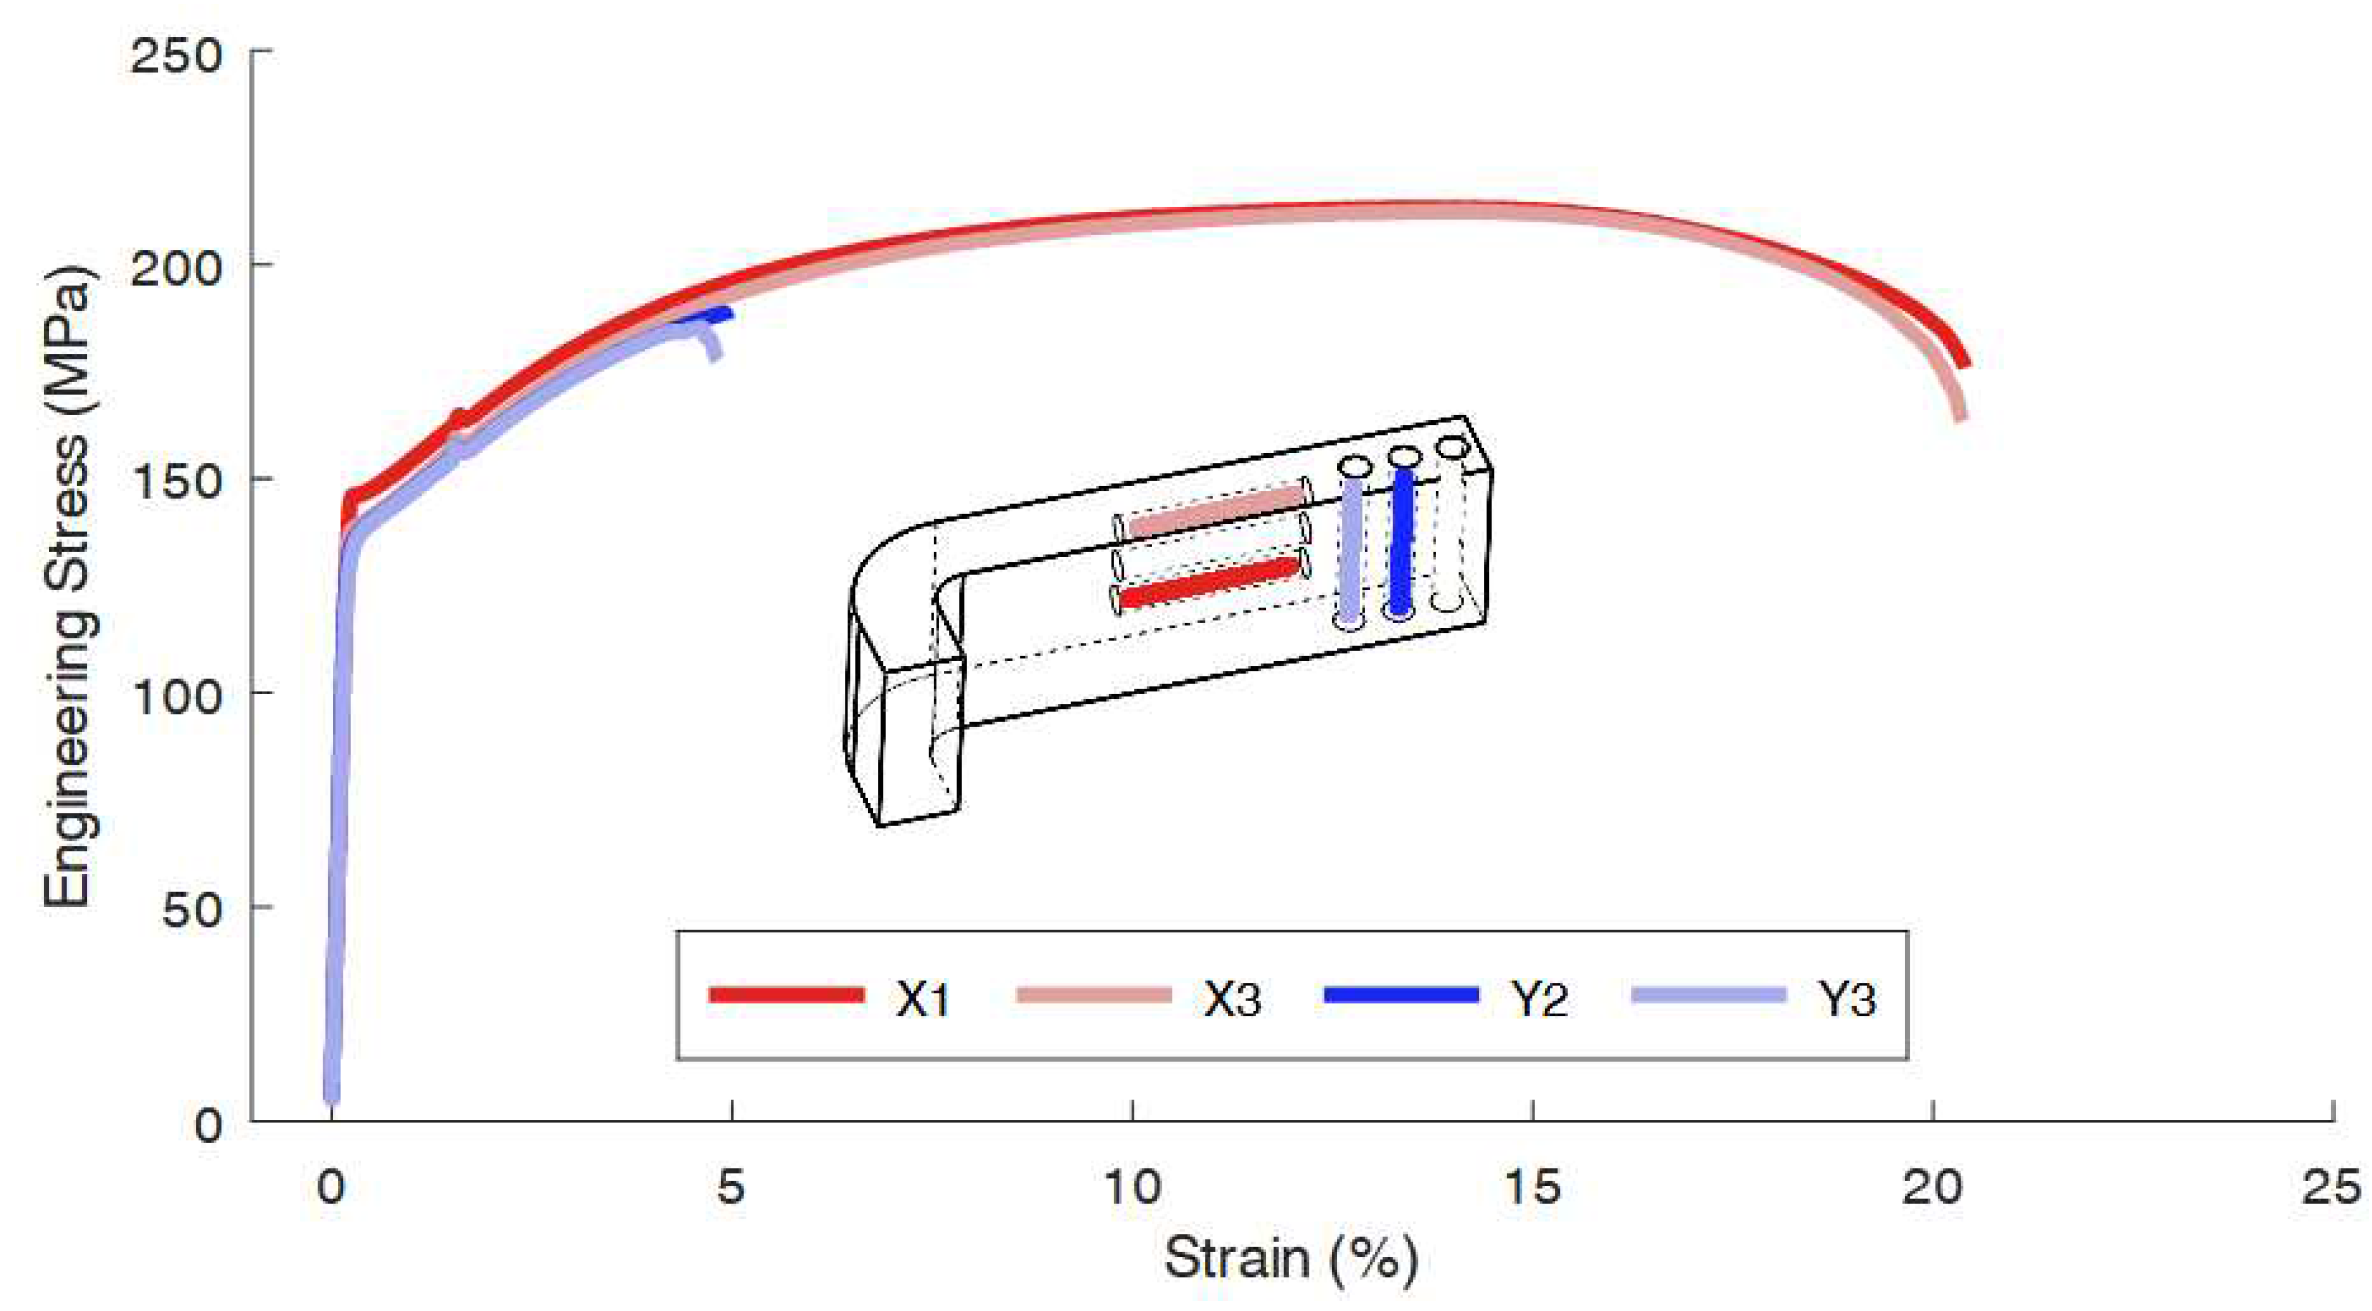

Table 1.
Differences between die designs based on their geometrical features. For images of die working surfaces see Figure 5.
Table 1.
Differences between die designs based on their geometrical features. For images of die working surfaces see Figure 5.
| Die #: | 1 | 2 | 3 | 4 | 5 | 6 | 7 |
|---|---|---|---|---|---|---|---|
| Extrusion passage |
Bowtie | 3 x | 3 x @ 15° | 3 x @ 45° | 3 x/cone | 3 x/pyramid | Bowtie |
| Inner surface |
flat | scroll | scroll | scroll | scoop | scoop | flat |
| Outer surface |
flat | flat | flat | flat | scroll | scroll | scroll |
| Overflow ejection |
8 x | 8 x | 8 x | 8 x | 2 x | 2 x | 2 x |
| Hole Area |
95 | 85 | 88 | 68 | 42 | 42 | 124 |
| Hole Perimeter mm |
46 | 57 | 58 | 52 | 40 | 40 | 53 |
Disclaimer/Publisher’s Note: The statements, opinions and data contained in all publications are solely those of the individual author(s) and contributor(s) and not of MDPI and/or the editor(s). MDPI and/or the editor(s) disclaim responsibility for any injury to people or property resulting from any ideas, methods, instructions or products referred to in the content. |
© 2024 by the authors. Licensee MDPI, Basel, Switzerland. This article is an open access article distributed under the terms and conditions of the Creative Commons Attribution (CC BY) license (http://creativecommons.org/licenses/by/4.0/).
Copyright: This open access article is published under a Creative Commons CC BY 4.0 license, which permit the free download, distribution, and reuse, provided that the author and preprint are cited in any reuse.


