
Submitted:
04 February 2024
Posted:
05 February 2024
You are already at the latest version
Abstract
Cavitation bubbles are commonly existing in shipbuilding engineering, ocean engineering, mechanical engineering, chemical industry, and aerospace. Asymmetric deformation of bubble occurs near the boundary, and the non-spherical cavitation bubbles have strong destructive effects, inducing high amplitude loading at the nearby boundary. The purpose of this paper is to investigate the laser-induced of cavitation bubble, non-spherical collapse behavior near the boundary. In this study, experimental data such as bubble pulsation process and bubble surface velocity distribution were obtained by high-speed camera technique and full-field velocity calculation. The results show that the bubble appeared non-spherical collapse shapes, near different boundaries, with near-hemispherical, near-ellipsoidal, near-cone and near-pea shapes, and the bubble surface velocity distribution is not uniform. When bubble near the free surface or rigid boundary, the smaller the stand-off r is, the more obvious the repulsive effect of the free surface and the attractive effect of the rigid boundary are. As the stand-off r decreases, the larger the Bjerknes force and the bubble surface velocity difference, the more pronounced the non-spherical shape.
Keywords:
cavitation bubble
; free surface
; rigid boundary
; elastic boundary
; non-spherical deformation
1. Introduction
Cavitation is a physical phenomenon that occurs when the local pressure in a flow field is lower than the corresponding critical pressure. Its presence not only influences the continuity of the fluid, but also the violent collapse behavior will eventually form a high temperature and high-pressure flow field around the cavitation bubble. At this time, the cavitation bubble is also able to drive in the microscopic scale up to hundreds of meters per second, one of the driving sources of liquid flow, and this high-speed liquid flow that is known as the liquid micro-jet, when its impact to the boundary will produce up to hundreds of MPa and enough to destroy the majority of the material surface of the water hammer pressure. In addition, during the develop phase, bubbles appear to deform asymmetrically and are attracted to the boundary, resulting in a decrease in the distance at the moment of collapse, which increases the destructive capacity of the micro-jet or other possible destructive factors.[1,2,3] More importantly, the generation of micro-jet is mainly associated with the non-spherical collapse of cavitation bubble, so it is crucial to study the non-spherical deformation of cavitation bubble. The boundary, external force, pressure gradient and other factors can make the shape of the cavitation bubble become an asymmetric structure [4]. In general, non-spherical cavitation bubbles are highly destructive, and the cavitation bubbles cause high amplitude loading at nearby boundaries.[5]
Asymmetric collapse of cavitation bubbles often occurs near the boundary and under certain conditions micro-jets are formed. The physical properties of the boundary are crucial for the collapse of the bubble, especially the asymmetric deformation.[6] For the study of bubble near a single boundary, there are mainly near free surface, elastic boundary and rigid boundary. When bubble grows at a certain distance from the free surface, the free surface is pushed upward as the bubble expands, and a substantial water dome is formed on the free surface, which then evolves into a spike after the bubble shrinks. A high velocity liquid jet is formed during the collapse phase of the bubble, which penetrates the lower surface of the bubble and starts to expand after reaching a minimum volume, forming a water skirt on the free surface. [7,8] Supponen et al [9] observed the special dynamics inside the bubble during the violent deformation near the free surface by a high-speed camera. The micro-jet takes on an interesting mushroom cap shape as it advances into the interior of the bubble in a direction away from the free surface, and the effects of bubble interface instability and non-spherical deformation on it were discussed. Blake, Lauterborn and Philipp et al [1,10,11,12] have earlier conducted extensive studies on bubble dynamics near rigid boundary. Sagar et al [13] found that when a bubble grows near a horizontal rigid wall, the maximum radial pressure occurs at the top center of the bubble. And the final pressure break through the bubble interface and form a micro-jet. Accordingly, the upper surface of the bubble is curved before the first collapse, which grows toward the bottom surface and ends at the first collapse. The jet strikes the bottom surface in a tangential direction and forms a radial outward flow along the ground surface with a maximum velocity impacting the wall without deceleration, producing a high intensity impact on the bottom surface. Bubble dynamics near elastic boundary were studied earlier by Gibson, Blake and Brujan et al [14,15,16,17]. Ma et al [18] experimentally found that the deformation of the boundary when the bubble grows near an elastic boundary is pronounced and is strong enough to produce an annular flow in the upper part of the bubble, altering the spherical motion of the bubble. For complex boundaries, the combination of rigid boundary with other types of boundaries leads to more complex bubble behavior. [5,19,20,21] Bubbles show non-spherical collapse characteristics near the boundaries, non-spherical collapse has a strong destructive effect, the bubbles surface velocity distribution can characterize the degree of non-sphericality of cavitation bubbles, so it is crucial to study the bubble surface velocity distribution near the boundaries.
In the following, the experimental setup and methods are given in Section II. Section III analyzes the process of near-spherical growth of bubble, non-spherical growth of bubble near a single boundary and composite interface and discusses the deformation and deformation velocity of the bubble interface. Section IV summarizes our main conclusions.
2. Experimental Program
2.1. Experimental Setup
The experiment is shown in Figure 1, in which we used laser-induced single cavitation bubble to study the dynamic behavior of the bubble. The phenomenon of non-spherical deformation of the bubble was observed using high-speed photography. The Dawa series we used to be a miniaturized lamp-pumped Nd: YAG nanosecond laser, which belongs to the small and medium energy class, with a fundamental frequency energy output ranging from 100mJ to 300mJ and optional SHG, THG, and FHG multiple harmonics. The laser features adjustable energy attenuators and red-light indicators. We used the Phantom VEO series of high-speed cameras, which incorporate the latest imaging technology in a compact, reliable, and easy-to-use camera system. The highest frame rate in the VEO series captures images at 13G pixels per second at full resolution. Pixel Fusion Mode increases the speed by another 25% at 640x480 pixels or less. Excellent light sensitivity Native ISO up to 25,000 (B&W), more than twice that of other VEO series cameras, giving greater freedom in lighting and optics when shooting some challenging subjects. Imaging metrics Customized 12-bit depth CMOS sensor element, 18um pixel size with global shutter with double correlation sampling. With the high-speed camera synchronized with the use of a pulsed light source, which can achieve 157lm / W of ultra-high luminous efficiency, color rendering index of up to 80 (color rendering index of 90 optional), with the new high-efficiency spotlight system, can be in the irradiation of the object on the surface of the extremely high and uniform illuminance, advanced constant-current drive power supply and active heat dissipation system can bring good working stability. Sub-microsecond synchronization/delay time can be perfectly synchronized with high-speed camera, equivalent to a sub-microsecond shutter; movement as flying also does not drag the tail. The water tank material used for the experiment is transparent acrylic plate with the size of 100×100×100 mm3, which has a larger size space compared to the cavitation bubble to ignore the sidewall effect. Dawa laser, high-speed camera, and light source control through the synchronizer to achieve test synchronization. Detailed information about the relative position of the bubble near the vertical boundary and the free surface, in space, is shown in Figure 1. And we controlled the distance of the cavitation bubble from each boundary by a three-dimensional moving platform with an accuracy of 0.01 mm. Table 1 shows experimental parameter settings, the maximum equivalent radius of the bubble: Rm = 1.20 mm.
2.2. Full-Field Velocity Calculation
Our velocity processing software is capable of recording velocity distribution information at many spatial points in the same transient. The calculation principle is as follows: in the vicinity of a point where both velocities and velocity gradients are known, the local velocity field can be approximated by a Taylor expansion:
or in a single matrix expression:
which is an affine transform where velocities (u0,v0,w0) and all gradients are evaluated in the reference point (x0,y0,z0) and (△x,△y,△z)=(x-x0,y-y0,z-z0).
If we multiply with △t, the time between the two images, velocities become displacements, which can be measured in pixels and if (x,y,z) positions are also measured in pixels all the gradients become dimensionless.
In 2D this simplifies to (omitting higher order terms):
where all (u,v) and their gradients now describe displacements in pixel and (△x,△y) describe distances in pixel from the center of the interrogation area, where displacements and gradients apply. Since both (u,v) displacements and (x,y) positions are in pixel the spatial gradients become pixel/pixel, dimensionless.
The validation is used to prevent outliers from disturbing the iterations and thus the velocity measurements. The validation is done by first applying peak validation on the image cross-correlation and secondly by comparing each vector to its neighbors using the Universal Outlier Detection algorithm. To invalidate vectors based on the image correlation peaks, three peak validation schemes: if the Peak Height validation is enabled, then only the correlation peaks above the specified value will be retained as valid, if the Peak Height validation is enabled, then the ratio between the two highest correlation peaks is calculated. This ratio must be higher than the specified value to validate the calculated displacement. Typical value for Peak Height ratio is 1.2, and if S/N ratio is enabled, first the noise level in the correlation plane is evaluated by the Root Mean Square of the negative correlation values. If the ratio between the correlation Peak Height and the noise level is above the specified value, then the calculated displacement is considered valid. We used Peak Height and S/N-Ratio validation criterion.
3. Results
3.1. Near-Spherical Collapse of Cavitation Bubble
When p≤pv+pg-2σ/R, the bubble in the role of the pressure difference between the inside and outside of the bubble to expand outward, and to promote its surrounding liquid flow outward in the radial direction. Where p is the liquid pressure on the bubble surface, pv is the saturated vapor pressure inside the bubble, pg is the gas partial pressure inside the bubble, R is the radius of the bubble, and σ is the surface tension coefficient of the liquid. Currently, the bubble pressure with the bubble expansion continues to decline until it reaches the static equilibrium pressure, after the bubble due to the inertia of the surrounding fluid and continue to expand outward to the maximum bubble radius. After the bubble pressure is lower than the equilibrium pressure of the surrounding medium, p≥pv+pg-2σ/R, the bubble began its contraction process, the liquid around the bubble to the center of the bubble to do polymerization flow and make the volume of the bubble continues to shrink, then the bubble pressure also gradually increase until it reaches the static equilibrium conditions, and then the bubble due to the flow of liquid and the excessive contraction. When the bubble shrinks to the minimum radius, the bubble completes a complete expansion and contraction process. As shown in Figure 2, the laser induced single bubble, under the action of the pressure difference between inside and outside the bubble, the radius of the bubble increased, and the pressure inside the bubble gradually converged to the pressure outside the bubble, and the radius of the bubble reached the maximum at 100 us, at which time the pressure inside and outside the bubble is basically the same. In the time of 0-100 us, the expansion velocity of the bubble gradually decreased, and the bubble surface velocity was minimized between 100 us and 120 us. In the time of 120-220 us, the radius of the bubble decreased, the pressure inside the bubble increased again, and the bubble collapsed near 220 us. In addition, it can be seen from Figure 2 that the bubble basically ensured a better spherical shape during expansion and contraction, the force of the bubble was uniform. At this time, the bubble of free field was only subjected to buoyancy, which can be basically disregarded for the smaller bubble.
3.2. Non-Spherical Collapse Velocity of Cavitation Bubble Near Single Boundary
3.2.1. Near Free Surface
As shown in Figure 3, when the bubble collapsed near the free surface, a distinct non-spherical shape can be observed after 195.84 us. The bubble expanded during the time 0-110.16 us, during which the bubble maintained a better spherical shape. The radius of the bubble reached its maximum at 110.16 us. The bubble contracted in 122.40-220.32 us, and the non-spherical shape of the bubble became more and more obvious in the process, and at 220.32 us, a nearly hemispherical shape of the bubble could be observed. The bubble surface velocities were analyzed and calculated, and the results are shown in Figure 4. At 61.20 us, the expansion velocity of the upper surface of the bubble was larger than that of the lower surface, at 110.16 us near the maximum radius, the expansion velocity of the lower surface was larger than that of the upper surface, and at 171.36 us, the contraction velocity of the upper surface was significantly larger than that of the lower surface. In addition, a special velocity distribution occurred at 110.16 us, when the bubble expansion velocity was the minimum and at the time junction of expansion and contraction. For the two moments of 61.20 us and 171.36 us, the former was the expansion phase, and the latter was the contraction phase, although both showed that the upper surface velocity was larger than the lower surface velocity, but the latter velocity difference was a little larger. The final was that the bubble was attracted by the free surface in the expansion phase and repelled in the contraction phase. The cause of the above phenomenon is due to the inhomogeneous distribution of the acting fluid pressure gradient at the free surface. The asymmetric force on the bubble makes the inward extrusion on the side of the bubble adjacent to the high pressure, and the surface of the bubble shrinks at different velocities, respectively, with one side going inward faster than the other.
The bubble surface velocity is decomposed along the horizontal and vertical directions, where u is the velocity corresponding to its component in the horizontal direction and v is the velocity corresponding to its component in the vertical direction. As shown in Figure 5(a), w1.30=5.6m/s at 171.36 us due to the uneven force on the bubble. As shown in Figure 5(b), the horizontal coordinate represents the stand-off r, which is the ratio of the distance of the bubble from the free surface B to the maximum radius of the bubble Rm. And the vertical coordinate represents the difference between the bubble surface velocities in the vertical direction and are dimensionless. The maximum radius of the bubble of the set of data is in the vicinity of 1.20 mm, and now of 171.36 us. From the figure, the bubble surface velocity difference in the vertical direction decreased as the stand-off r increased. The inhomogeneity of the bubble surface velocity in the vertical direction is due to the action of the free surface on the Bjerknes force on the bubble, which tends to decrease with increasing stand-off r. That is, the closer the bubble is to the free surface, the more pronounced the non-spherical shape of the bubble is, and the larger the bubble velocity difference is in the vertical direction.
3.2.2. Near Rigid Boundary
During the growth phase, the bubble is approximately spherical, however during contraction phase the irregularities in the velocity and pressure field together with the presence of the boundary will be clearly evident in the bubble shape.[10] As shown in Figure 6, the non-spherical shape of the bubble became more and more obvious in the 122.40-220.32 us contraction phase, when the bubble grew near the rigid boundary. The bubble surface velocity distribution is shown in Figure 7. At 61.20 us, the bubble velocity on the left side was significantly smaller than that on the right side, and there was a low-velocity region near the rigid boundary. At 110.16 us, the bubble was still in the expansion stage, but at this time, the expansion velocity of the left side was larger than that of the right side, which is the same as that near the free surface, and this time was at the junction of the expansion and contraction processes. Due to the delay in the flow of fluid between the bubble surface and the boundary, during the collapse phase, the bubble center moves towards the boundary as the pressure in this region is lower than that of the opposite bubble wall, and this translational motion accelerates during the following collapse phase.[1] At 171.36 us, the left side was clearly in the low velocity region, where the contraction velocity was significantly smaller than that of the right side. In the expansion phase, the rigid boundary repelled the bubble, and in the contraction phase, attracted the bubble. As shown in Figure 8, the horizontal coordinate is the dimensionless distance, and the vertical coordinate is the velocity difference of the bubble deformation in the horizontal direction. The bubble surface velocity difference in the dimensionless horizontal direction decreased as the stand-off r increased, the less the non-spherical shape was obvious. Theoretically, as the stand-off r decreased, the bubble was subjected to the Bjerknes force of the rigid boundary gradually increased. According to the Kelvin impulse model and the mirror theory, the equation of the Bjerknes force that suffered by the bubble near the rigid boundary were gained.
3.2.2. Near Elastic Boundary
As shown in Figure 9, no obvious non-spherical shape was observed, rb = 1.30, when the bubble collapsed near the elastic boundary. When rb = 1.15, clear non-spherical shapes were observed near 195.84 us, and the bubble had conical shapes, which is very different from near the free surface and near the rigid boundary, as shown in Figure 10. In the case of the growth and collapse of cavitation bubbles near elastic boundary, clearly cases will arise where parts of the bubble may respond as if it is near a rigid boundary whereas in other parts of the bubble the response may tend towards that of a free surface. The reason for this difference is that during the growth of the bubble, the elastic boundary was deformed convexly and concavely, and this deformation disturbed and altered the flow field between the bubble and the boundary to a certain extent, which in turn affected the bubble shape, and formed the special shape. The non-spherical shape became more and more obvious in 122.40-220.32 us. For these two conditions, the bubble surface velocity distribution is shown in Figure 11. At 85.68 us, the velocity of the right surface was larger than that of the left surface for both. The contraction velocity of the bubble surface closely to the elastic boundary was smaller, which is suppressed by the elastic boundary. And the closer the stand-off r was, the more obvious the suppression was, which was basically consistent with that of the bubble in the vicinity of the rigid boundary. In the contraction stage, at rb = 1.30, the contraction velocity of the left bubble surface was larger than that of the right one, which is different from that near the rigid boundary. This occurred as the elastic boundary was attracted to appeared convex, during the contraction phase of the bubble, which pushed the nearby flow field and increased the contraction velocity of the bubble surface nearby the elastic boundary. At rb = 1.15, the velocity of the bubble surface nearby the elastic boundary was suppressed, due to the closer elastic boundary, but the maximum bubble surface contraction velocity occurred at the upper and lower sides nearby the elastic boundary. Due to the characteristic of the elastic boundary, the bubble surface contraction velocity appeared different.
3.3. Non-Spherical Collapse Velocity of Cavitation Bubble Near Composite Boundaries
When only the free surface existed, its repulsive action caused the bubble tip to concave downward and appeared non-spherical. When only the vertical rigid boundary existed, its attraction caused the bubble surface toward the boundary to be concave and appeared non-spherical. Under both the rigid boundary and the free surface, the combined effect of the two will make the bubble shape distorted, and the bubble morphology occurs and its irregular changes. As shown in Figure 12, when the bubble grew near the rigid boundary and the free surface, a clear non-spherical shape was observed at 208.08 us, and the spherical shape of the cavitation bubble was severely destabilized, with the tip of the bubble sinking diagonally downward, resulting in the formation of a bubble like the shape of a pea. Due to the combined effect of the vertical boundary and the free surface, the location of the maximum bubble surface velocity was non-axisymmetric, deviating from the vertical direction and deflecting towards the vertical wall, as shown in Figure 13. At 61.20 us and 85.68 us, the bubble was in the expansion stage and the position of the maximum bubble surface velocity was at an angle to the vertical direction. At 171.36 us, the bubble was in the contraction stage, and the maximum bubble surface velocity position was deflected along a certain angle, and the bubble surface velocity difference was larger at this angle than in the expansion stage. Under this condition, the cavitation bubble was not only subjected to the Bjerknes force in the vertical direction of the free surface, but also subjected to the Bjerknes force in the horizontal direction of the rigid boundary, and thus it was subjected to the combined force deviating from the vertical direction.
4. Conclusions
In this study, the non-spherical deformation behavior of a bubble under multiple types of boundaries was investigated, by high-speed camera technique and full-field velocity calculation, and the velocity distribution of the bubble surface was analyzed. The main conclusions are as follows:
(1) The bubble collapsed near spherical when it was in the free field, but when the bubble was near the boundary, the non-spherical collapsed occurred due to the asymmetric force on the bubble. The bubble collapsed near-hemispherical shape near the free surface, the bubble collapsed near-ellipsoidal shape near the rigid boundary, the bubble collapsed near-cone shape near the elastic boundary, and the bubble collapsed near-pea shape near the free surface and the rigid boundary.
(2) The bubble was influenced by the boundary and the deformation velocity of the bubble surface was not uniform. Bubble contraction stage, near the free surface, the maximum bubble surface velocity nearby the free surface; near the rigid boundary, the minimum bubble surface velocity nearby the rigid boundary; near the elastic boundary, due to its characterizations were between the free surface and the rigid boundary, the minimum bubble surface velocity nearby the elastic boundary, the maximum bubble surface velocity nearby the elastic boundary on both sides of the bubble; near the free surface and the rigid boundary, the position of the maximum bubble surface velocity appeared shift.
(3) When bubble near the free surface or rigid boundary, the smaller the stand-off r is, the more obvious the repulsive effect of the free surface and the attractive effect of the rigid boundary are. As the stand-off r decreases, the larger the Bjerknes force and the bubble surface velocity difference, the more pronounced the non-spherical shape.
Author Contributions
Conceptualization, Qingmiao Ding and Yanyu Cui; methodology, Xiaoman Li; software, Junda Lv; validation, Yunlong Shan and Yongqiang Liu; data curation, Qingmiao Ding; writing—original draft preparation, Xiaoman Li; writing—review and editing, Qingmiao Ding and Yanyu Cui; supervision, Yanyu Cui; funding acquisition, Qingmiao Ding. All authors have read and agreed to the published version of the manuscript.
Funding
This document is the results of the research project funded by the Ministry of Education Chunhui Project (HZKY20220606-202201390) and Civil Aviation University of China Postgraduate Scientific Research Innovation Project-Aviation Special Project (2022YJS069).
Data Availability Statement
Where no new data were created.
Conflicts of Interest
The authors declare no conflict of interest.
References
- Philipp A, Lauterborn W. Cavitation erosion by single laser-produced bubbles [J]. J. Fluid Mech. 2000, 361, 75–116. [Google Scholar]
- Reuter Fabian, Deiter Carsten, Ohl Claus-Dieter. Cavitation erosion by shockwave self-focusing of a single bubble [J]. Ultrasonics Sonochemistry 2022, 90, 106131–106131.
- Brujan EA, Keen GS, Vogel A, Blake JR. The final stage of the collapse of a cavitation bubble close to a rigid boundary [J]. Phys. Fluids 2002, 14, 85–92. [Google Scholar] [CrossRef]
- Han S, Li Y, Zhu H. The similarities and differences between the bubble collapse near a solid wall and in free water[J]. European Journal of Mechanics - B/Fluids 2020, 84.
- Kan X Y, Yan J L, Li S, et al. Rupture of a rubber sheet by a cavitation bubble: an experimental study [J]. Acta Mech. Sin. 2021.
- Zhang M A, Cui P, Wang Y. Experiments on bubble dynamics between a free surface and a rigid wall [J]. Exp. Fluids: Exp. Methods Their Appl. Fluid Flow 2013, 54, 1–18. [Google Scholar]
- Huang G, Zhang M, Ma X,et al. Dynamic behavior of a single bubble between the free surface and rigid wall [J]. Ultrasonics Sonochemistry 2020, 67, 105147.
- Wang S P, Zhang A M, Liu Y L ,et al. Bubble dynamics and its applications [J]. J. Hydrodyn. 2018.
- Supponen O, Kobel P, Farhat M. Video: The inner world of a collapsing bubble [C]//67th Annual Meeting of the APS Division of Fluid Dynamics. 2014.
- Blake J R, Taib B B, Doherty G. Transient cavities near boundaries. Part 1. Rigid boundary [J]. Journal of Fluid Mechanics 1986, 170, 642–50.
- Blake J R, Gibson D C. Cavitation bubbles near boundaries [J]. Annu. Rev. Fluid Mech. 1987, 19, 99–123. [Google Scholar] [CrossRef]
- Werner Lauterborn and Claus-dieter Ohl. The Peculiar Dynamics of Cavitation Bubbles [J]. Appl. Sci. Res. 1998, 58, 63–76. [Google Scholar]
- Sagar J H, Moctar E O. Dynamics of a cavitation bubble near a solid surface and the induced damage [J]. J. Fluids Struct. 2019, 92, 102799–102799. [Google Scholar]
- Gibson D C, Blake J R. The growth and collapse of bubbles near deformable surfaces [J]. Appl. Sci. Res. 1982, 38, 215–224. [Google Scholar] [CrossRef]
- Blake J R, Cerone P. A note on the impulse due to a vapor bubble near a boundary [J]. Anziam J. 1982, 23, 383–393. [Google Scholar]
- Brujan E A, Nahen K, Schmidt P, et al. Dynamics of laser-induced cavitation bubbles near an elastic boundary used as a tissue phantom [J]. Am. Inst. Phys. 2000.
- Brujan E A, Nahen K, Schmidt P, et al. Dynamics of laser-induced cavitation bubbles near elastic boundaries: influence of the elastic modulus [J]. J. Fluid Mech. 2001, 433, 283–314. [Google Scholar] [CrossRef]
- Ma X, Huang B, Zhao X, et al. Comparisons of spark-charge bubble dynamics near the elastic and rigid boundaries [J]. Ultrason. Sonochemistry 2018, 43, 80–90. [Google Scholar] [CrossRef] [PubMed]
- Yoshiyuki T, R. I P. Bubble collapse and jet formation in corner geometries [J]. Phys. Rev. Fluids 2018, 3. [Google Scholar]
- Shi-min L, Pu C, Shuai Z, et al. Experimental and Numerical Study on the Bubble Dynamics near Two-Connected Walls with An Obtuse Angle [J]. China Ocean Eng. 2020, 34, 828–839. [Google Scholar] [CrossRef]
- Van-Tu N, Thanh-Hoang P, Trong-Nguyen D, et al. Modeling of the bubble collapse with water jets and pressure loads using a geometrical volume of fluid-based simulation method [J]. Int. J. Multiph. Flow 2022, 152.
Figure 1.
The schematic description for experimental setup, (a) the whole system and (b) the detail information about the relative position between the bubble and boundary in space.
Figure 1.
The schematic description for experimental setup, (a) the whole system and (b) the detail information about the relative position between the bubble and boundary in space.
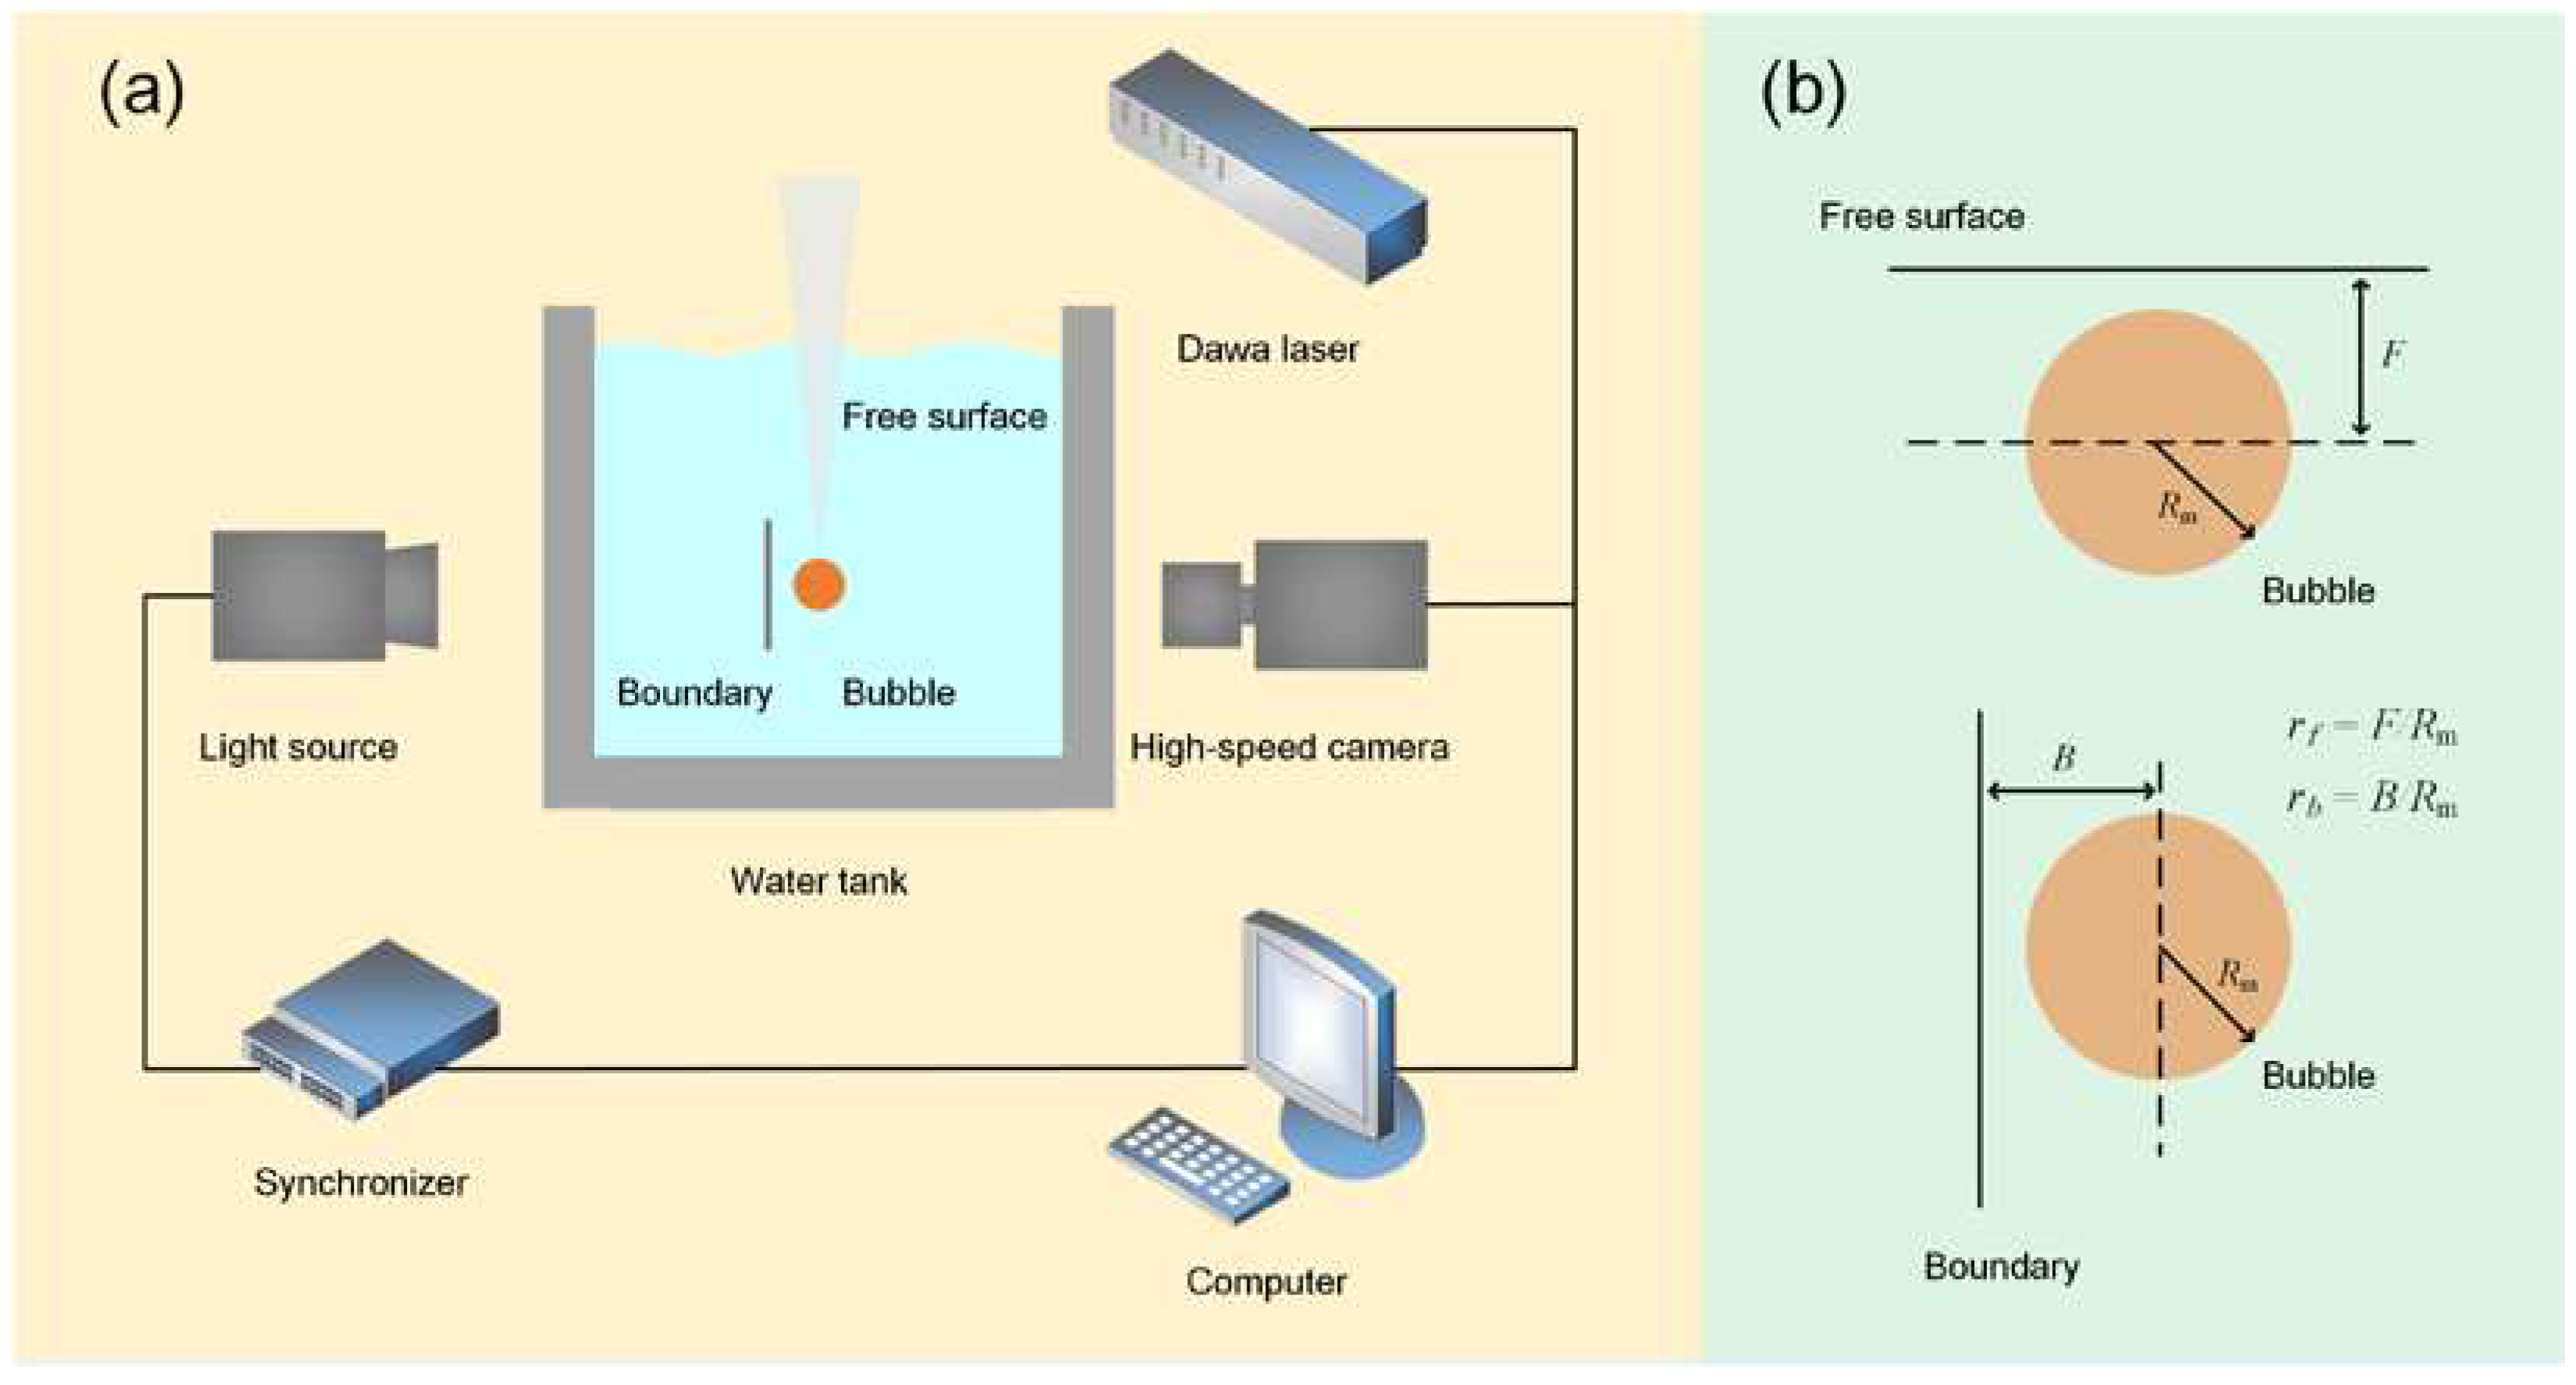
Figure 2.
Cavitation bubble dynamics of free field. Time: 0-100 us, the expanding cavitation bubble. Time: 120-220 us, the contracting cavitation bubble, Rm = 1.20 mm.
Figure 2.
Cavitation bubble dynamics of free field. Time: 0-100 us, the expanding cavitation bubble. Time: 120-220 us, the contracting cavitation bubble, Rm = 1.20 mm.
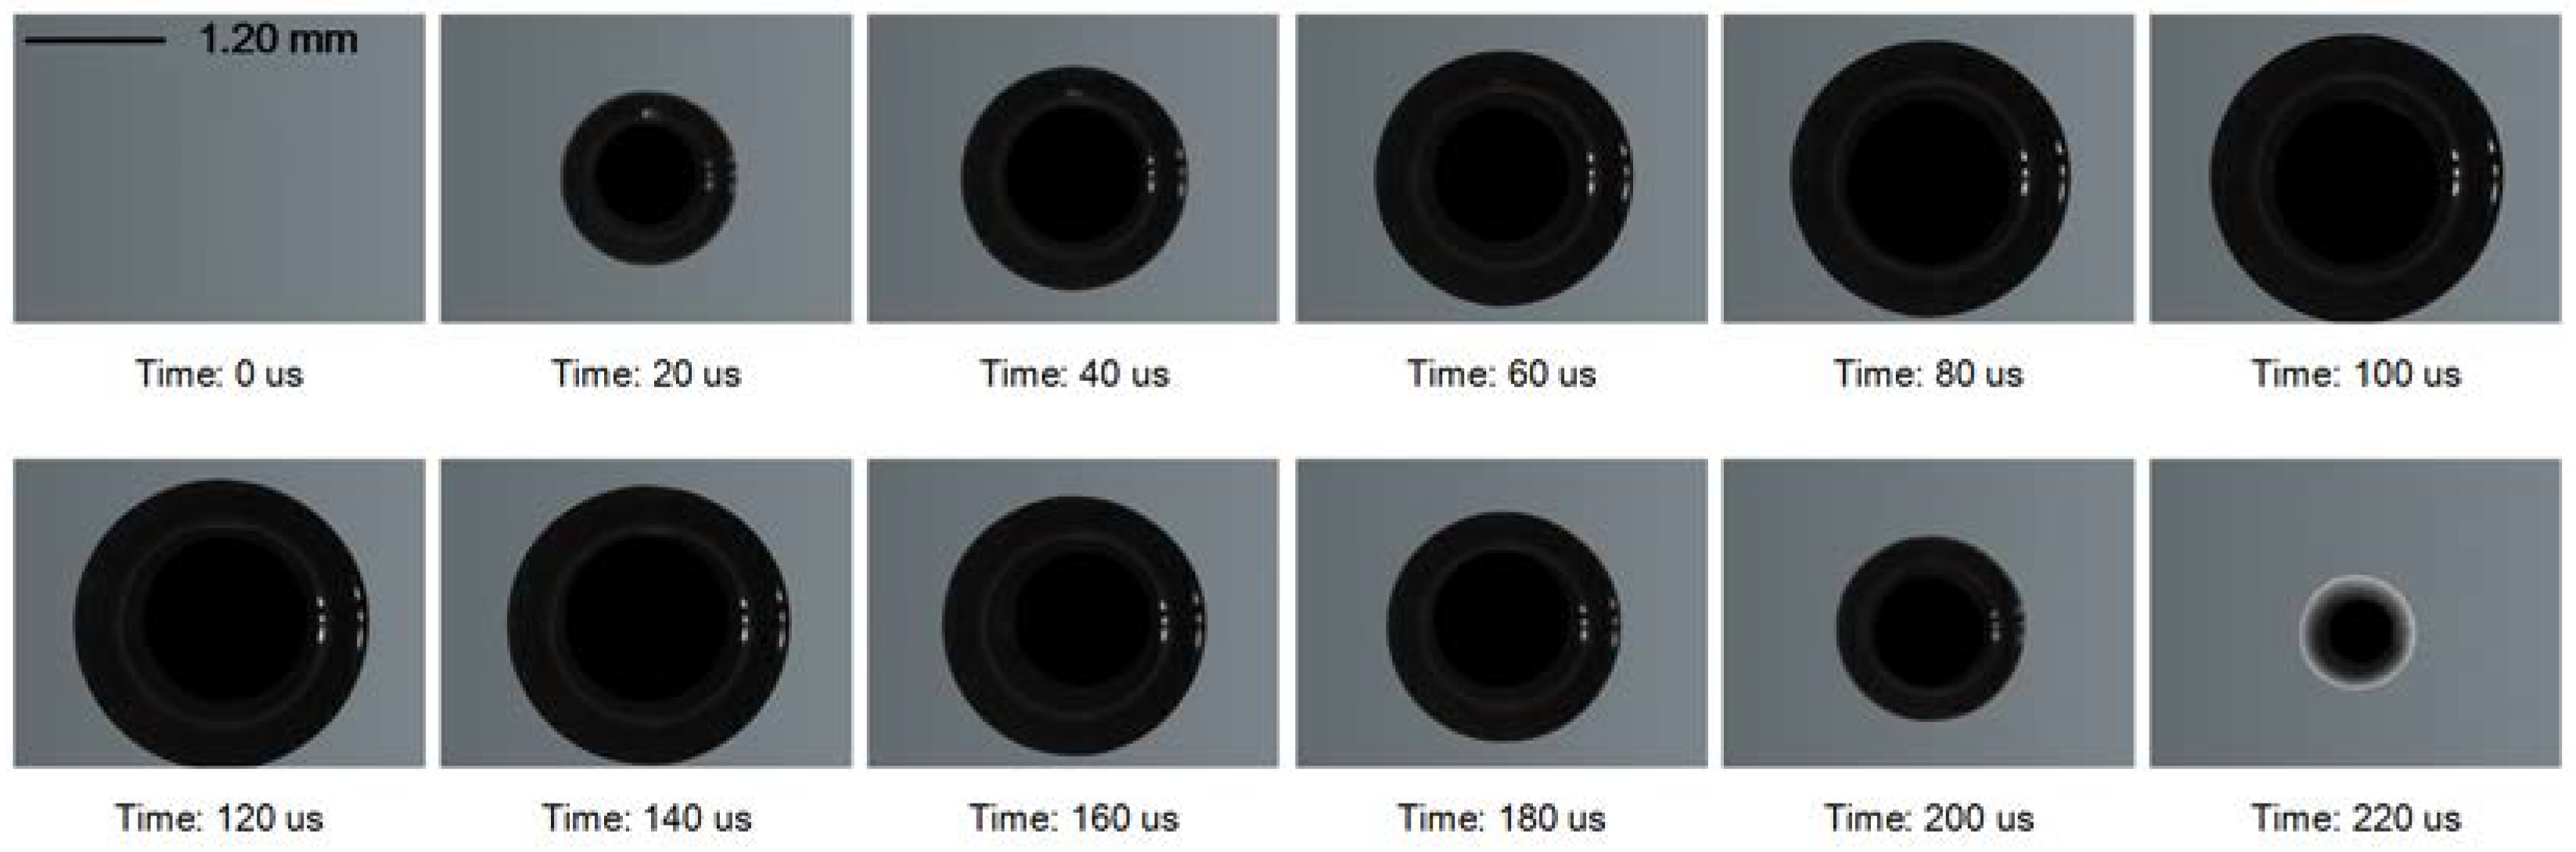
Figure 3.
Cavitation bubble dynamics near free surface. Time: 0-110.16 us, the expanding cavitation bubble. Time: 122.40-220.32 us, the contracting cavitation bubble, apparent non-spherical deformation, rf = 1.30, Rm = 1.20 mm.
Figure 3.
Cavitation bubble dynamics near free surface. Time: 0-110.16 us, the expanding cavitation bubble. Time: 122.40-220.32 us, the contracting cavitation bubble, apparent non-spherical deformation, rf = 1.30, Rm = 1.20 mm.
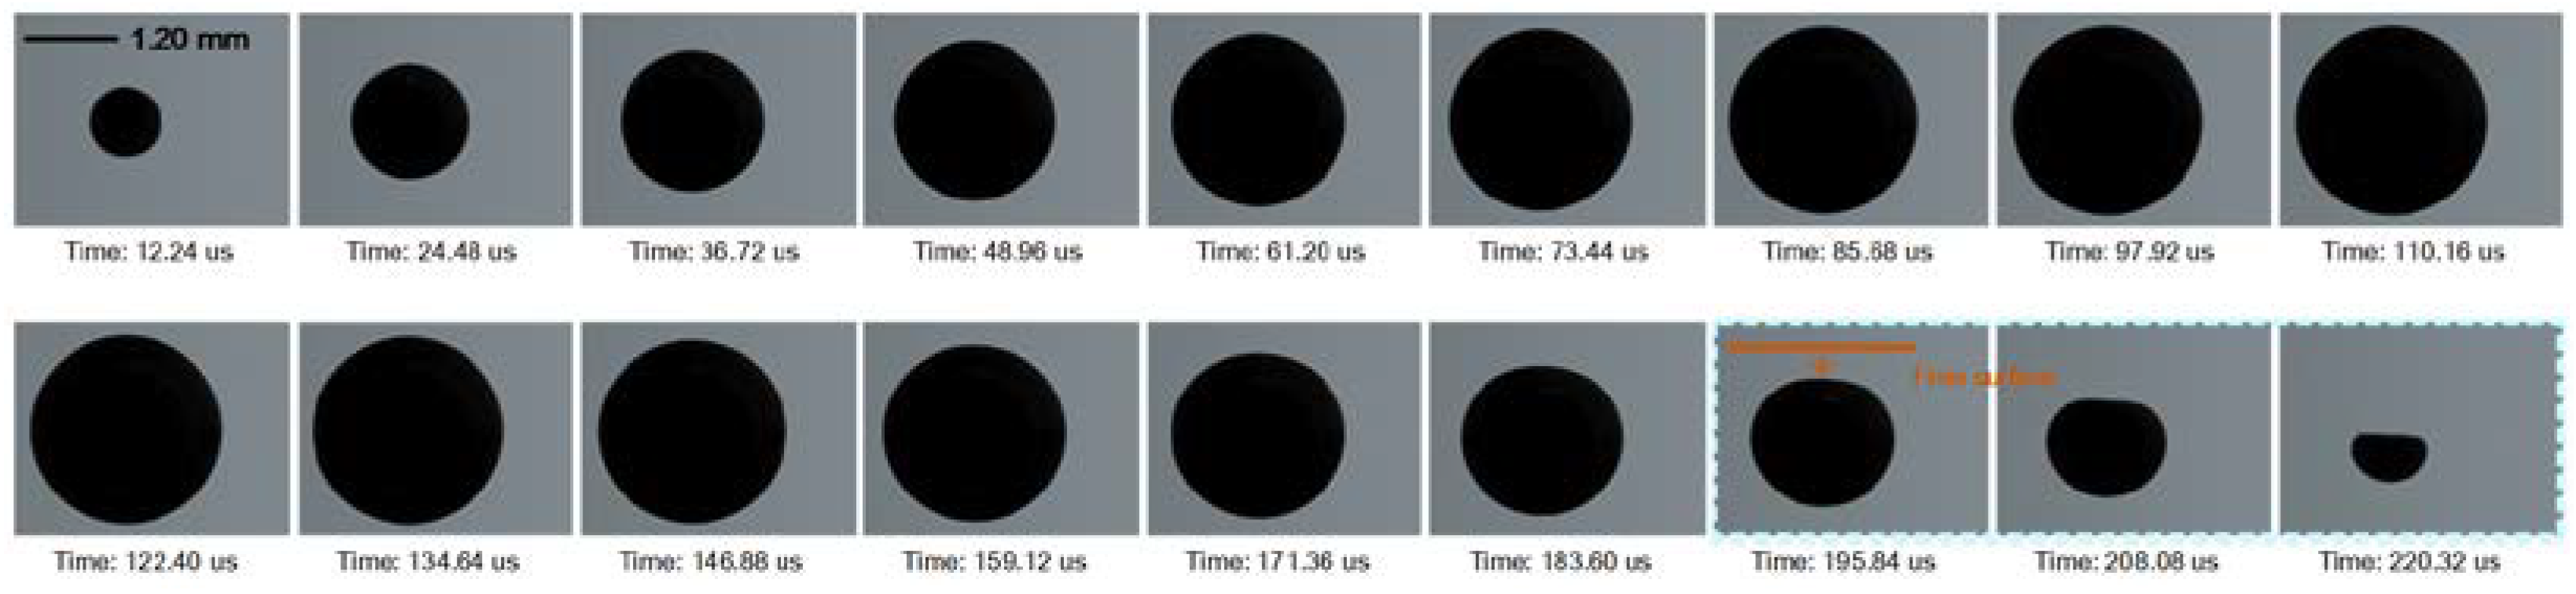
Figure 4.
Non-spherical bubble shape due to in-homogeneous bubble surface velocity, near free surface.
Figure 4.
Non-spherical bubble shape due to in-homogeneous bubble surface velocity, near free surface.
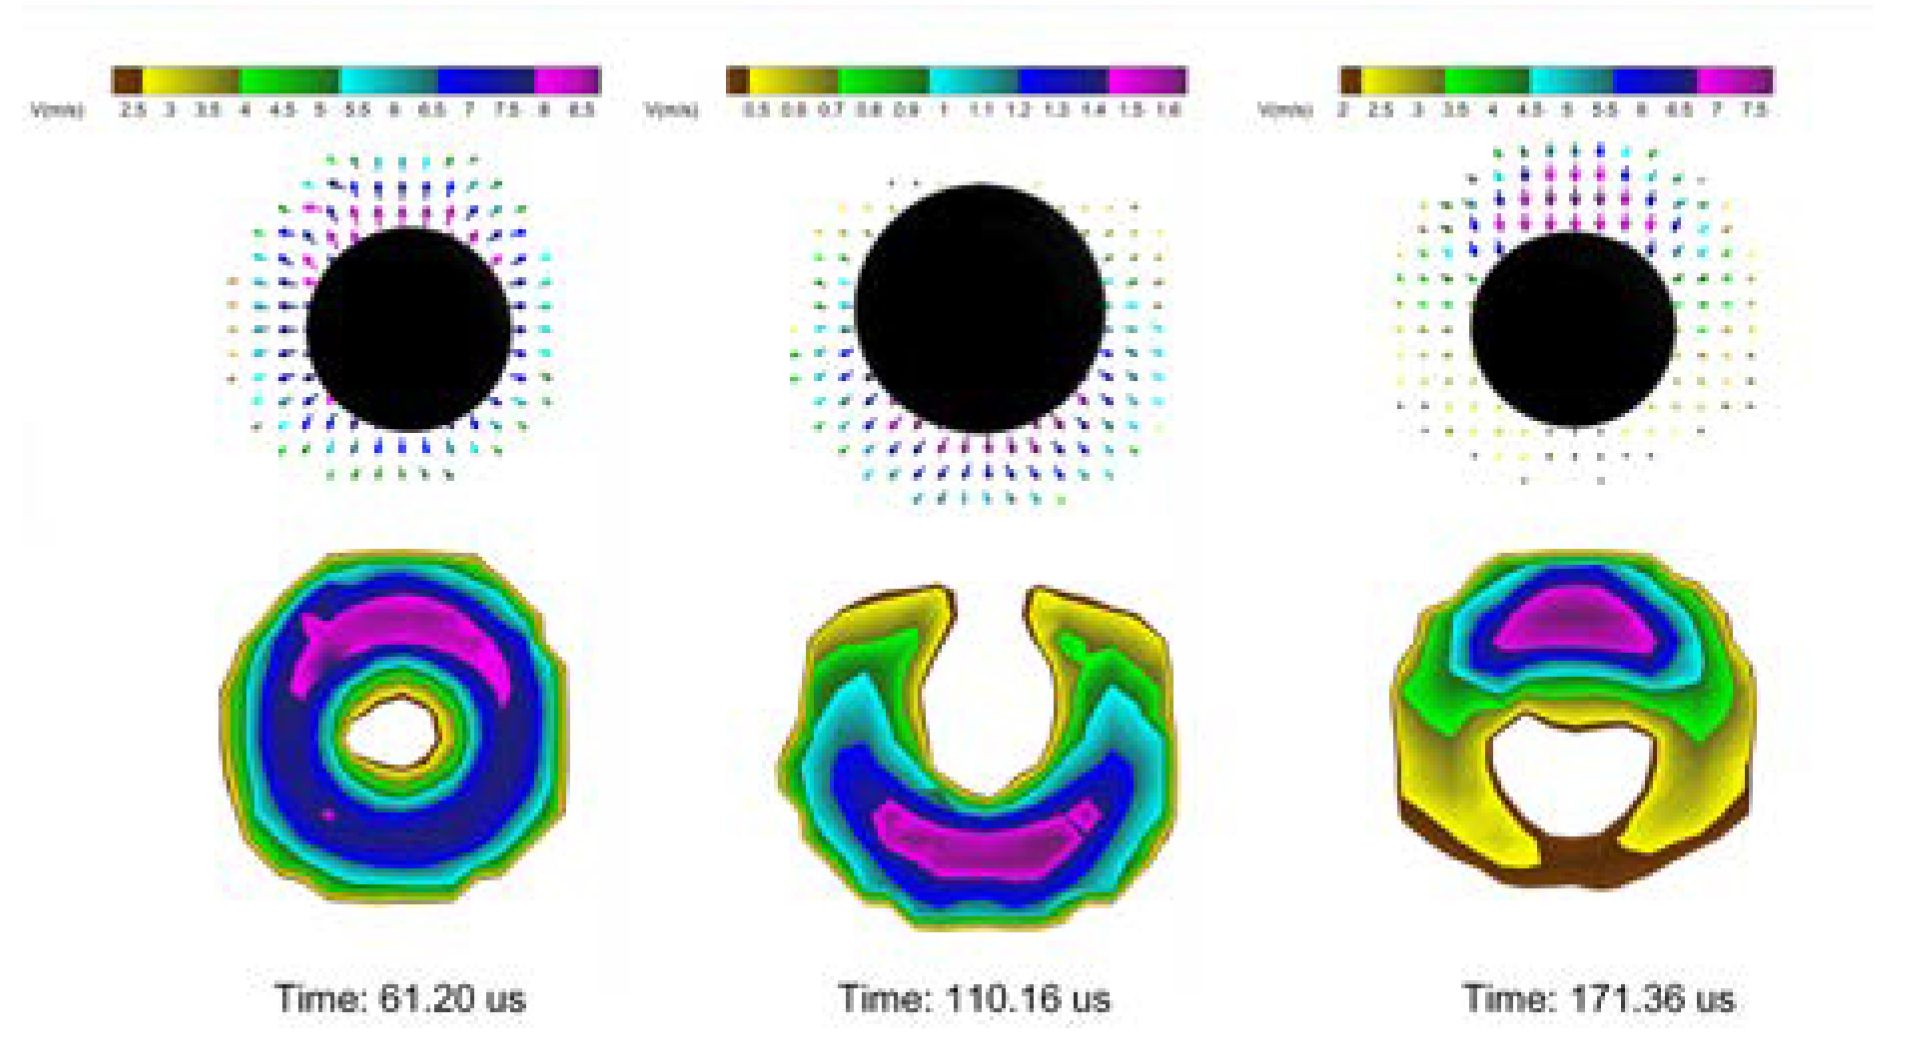
Figure 5.
(a) Time: 171.36 us, distribution of decomposition velocity v (b) v velocity difference of bubble surface at different stand-off r.
Figure 5.
(a) Time: 171.36 us, distribution of decomposition velocity v (b) v velocity difference of bubble surface at different stand-off r.
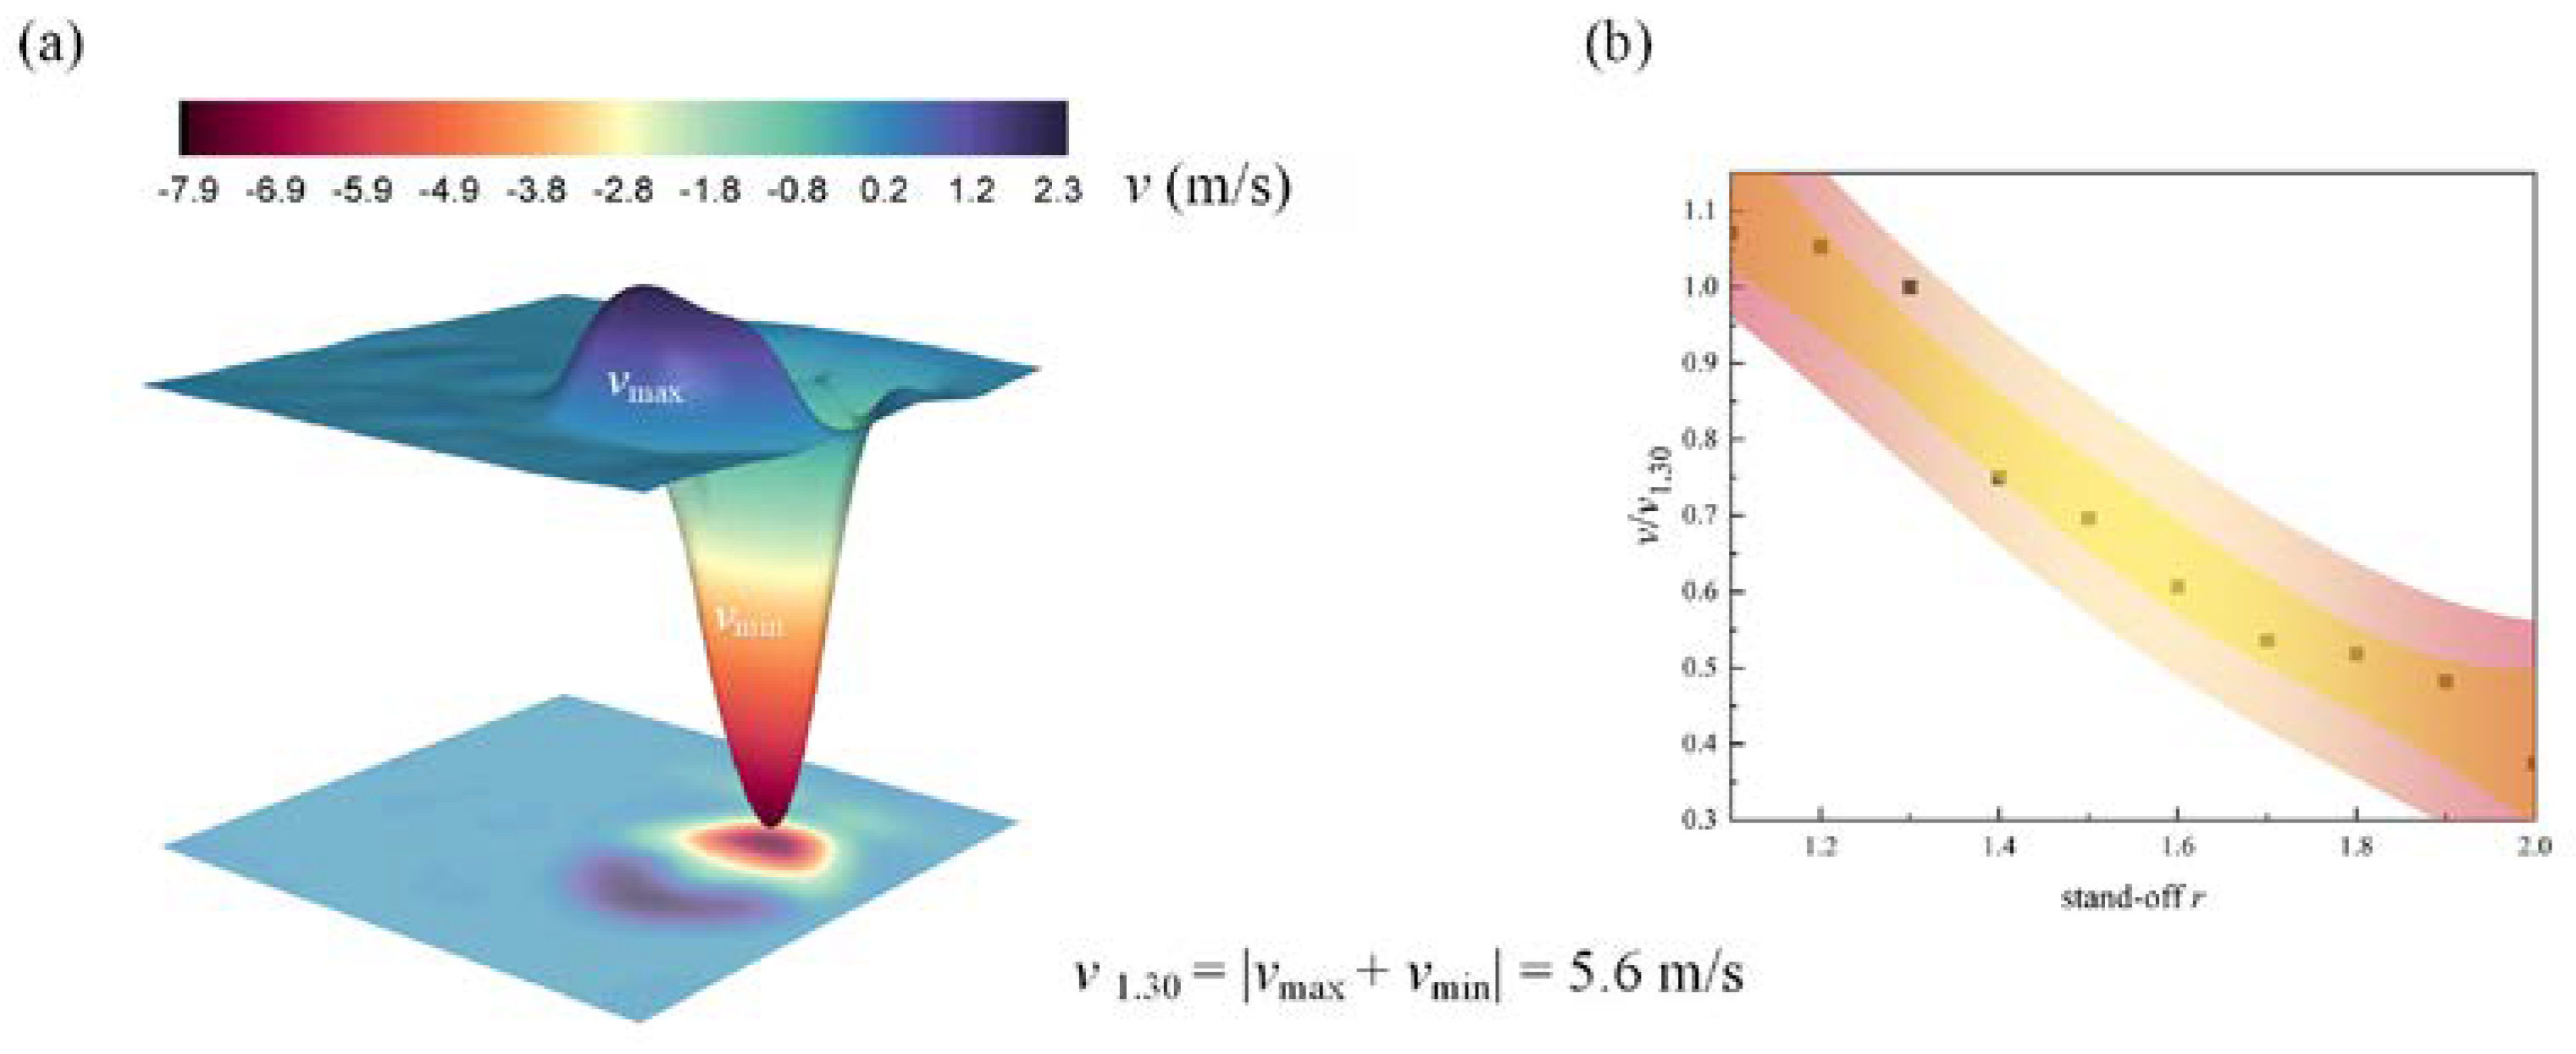
Figure 6.
Cavitation bubble dynamics near rigid boundary. Time: 0-110.16 us, the expanding cavitation bubble. Time: 122.40-220.32 us, the contracting cavitation bubble, apparent non-spherical deformation, rb = 1.30, Rm = 1.20 mm.
Figure 6.
Cavitation bubble dynamics near rigid boundary. Time: 0-110.16 us, the expanding cavitation bubble. Time: 122.40-220.32 us, the contracting cavitation bubble, apparent non-spherical deformation, rb = 1.30, Rm = 1.20 mm.
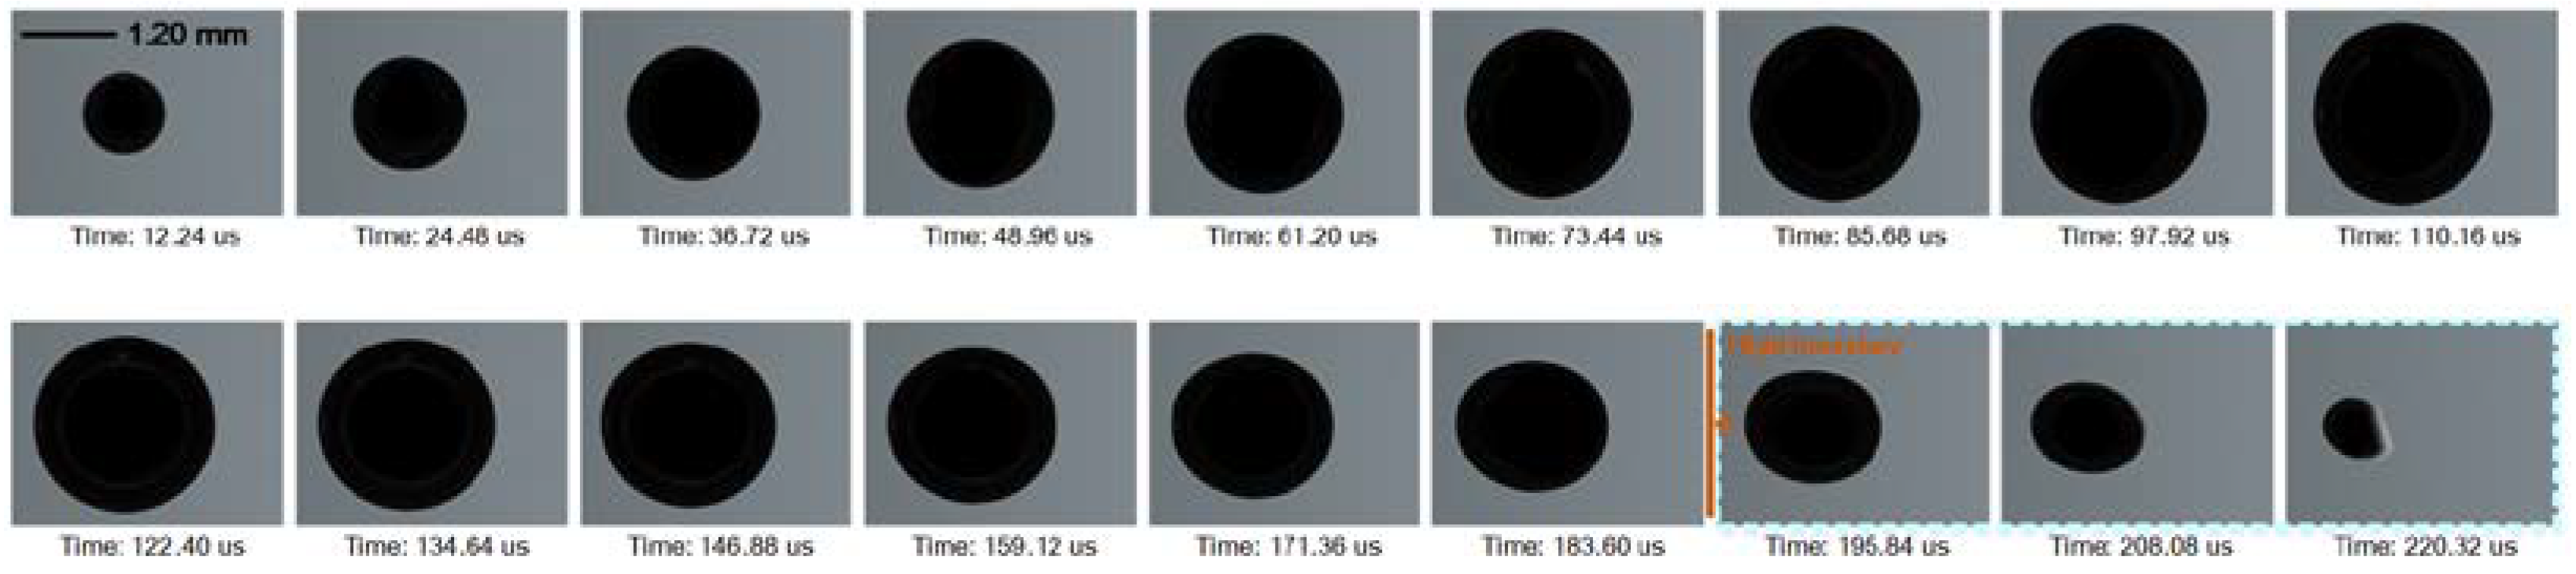
Figure 7.
Non-spherical bubble shape due to in-homogeneous bubble surface velocity, near rigid boundary.
Figure 7.
Non-spherical bubble shape due to in-homogeneous bubble surface velocity, near rigid boundary.
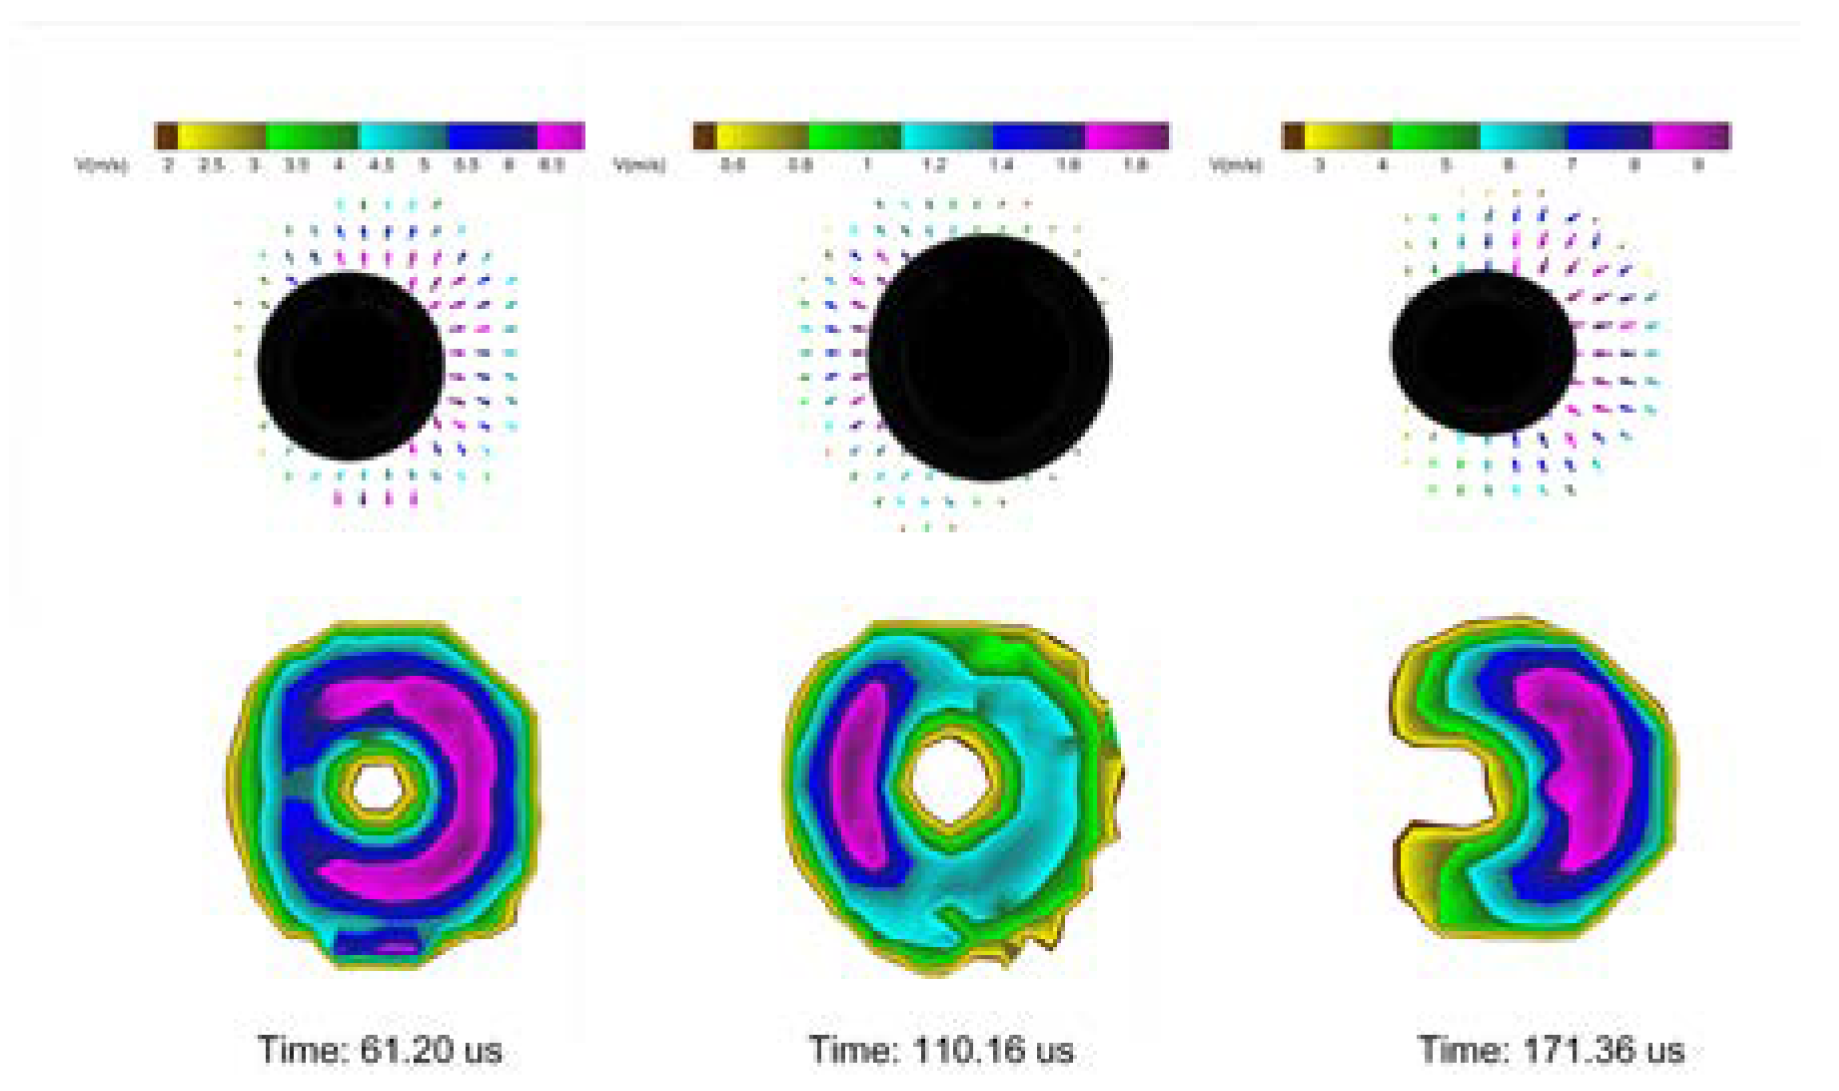
Figure 8.
u velocity difference of bubble surface at different stand-off r.
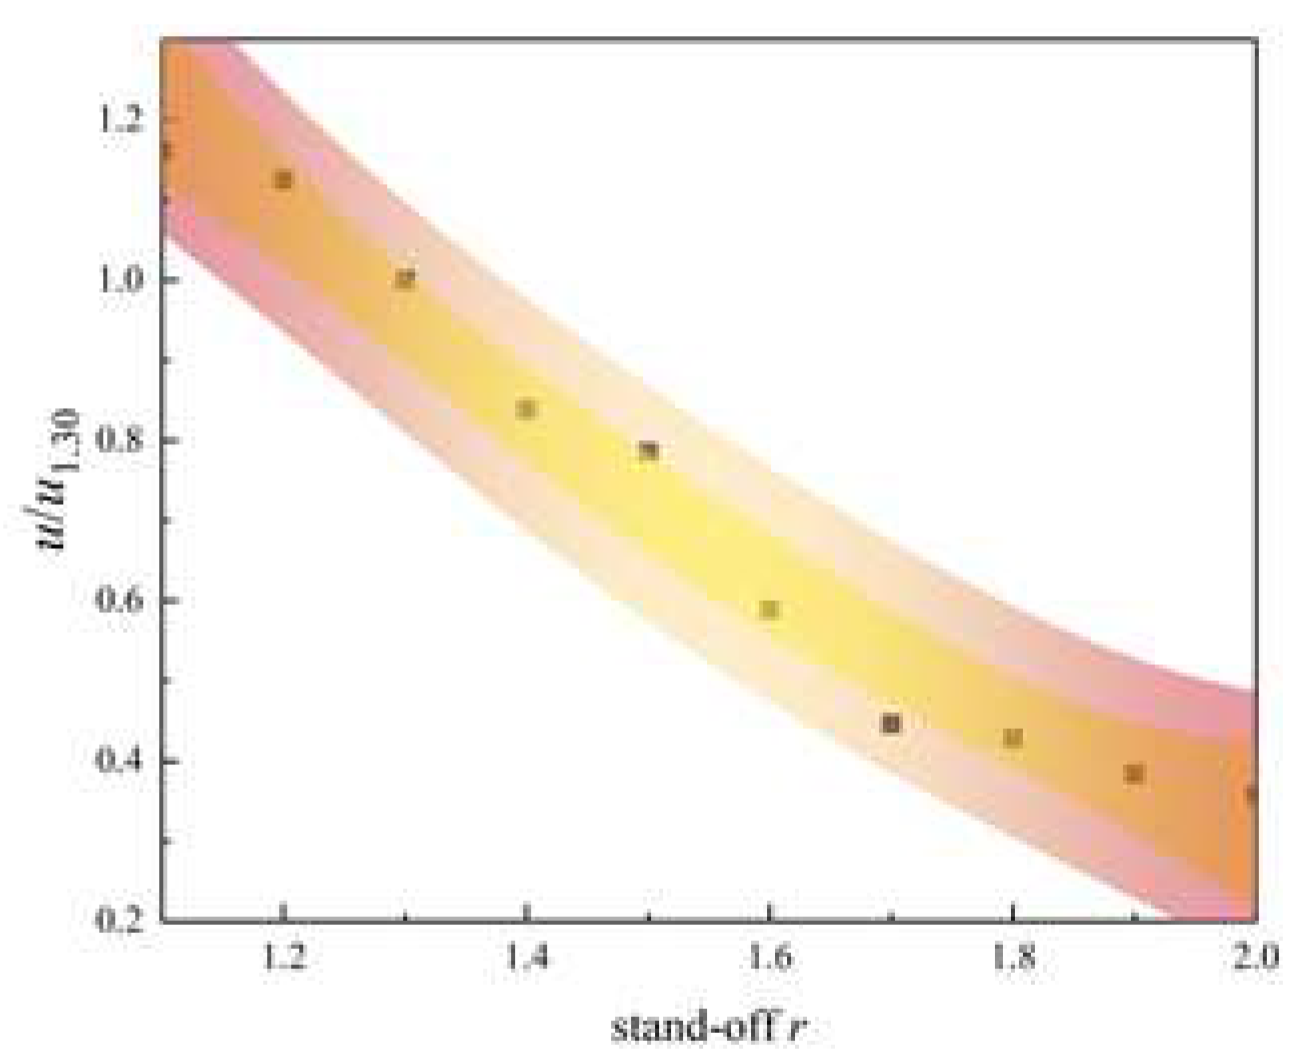
Figure 9.
Cavitation bubble dynamics near elastic boundary. Time: 0-110.16 us, the expanding cavitation bubble. Time: 122.40-220.32 us, the contracting cavitation bubble, rb = 1.30, Rm = 1.20 mm.
Figure 9.
Cavitation bubble dynamics near elastic boundary. Time: 0-110.16 us, the expanding cavitation bubble. Time: 122.40-220.32 us, the contracting cavitation bubble, rb = 1.30, Rm = 1.20 mm.
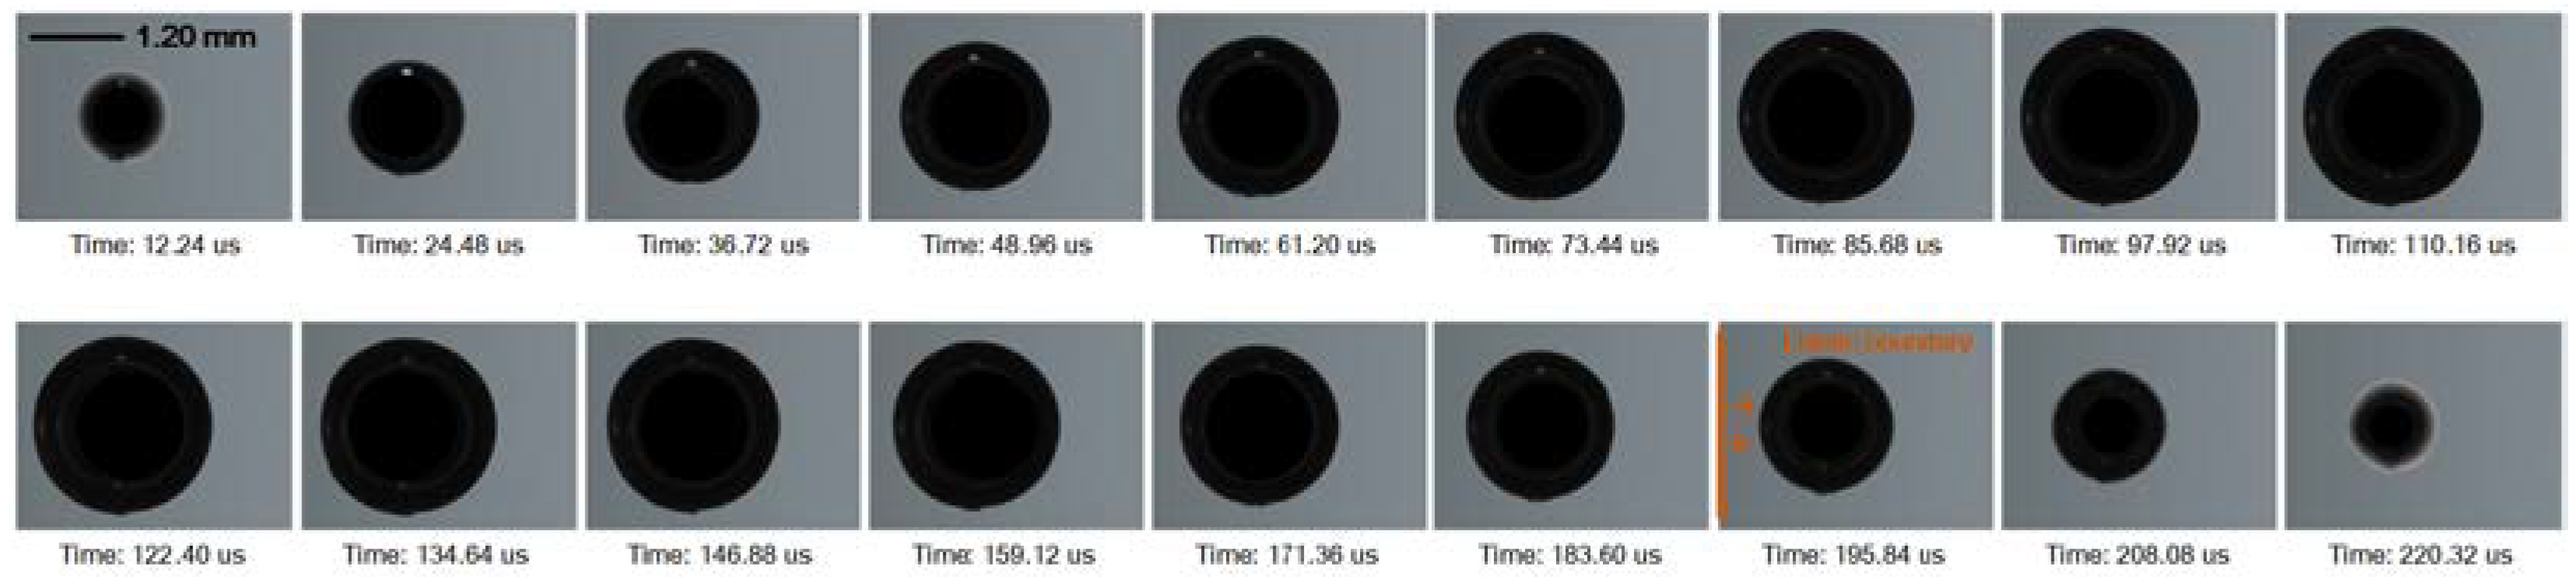
Figure 10.
Cavitation bubble dynamics near elastic boundary. Time: 0-110.16 us, the expanding cavitation bubble. Time: 122.40-220.32 us, the contracting cavitation bubble, apparent non-spherical deformation, rb = 1.15, Rm = 1.20 mm.
Figure 10.
Cavitation bubble dynamics near elastic boundary. Time: 0-110.16 us, the expanding cavitation bubble. Time: 122.40-220.32 us, the contracting cavitation bubble, apparent non-spherical deformation, rb = 1.15, Rm = 1.20 mm.
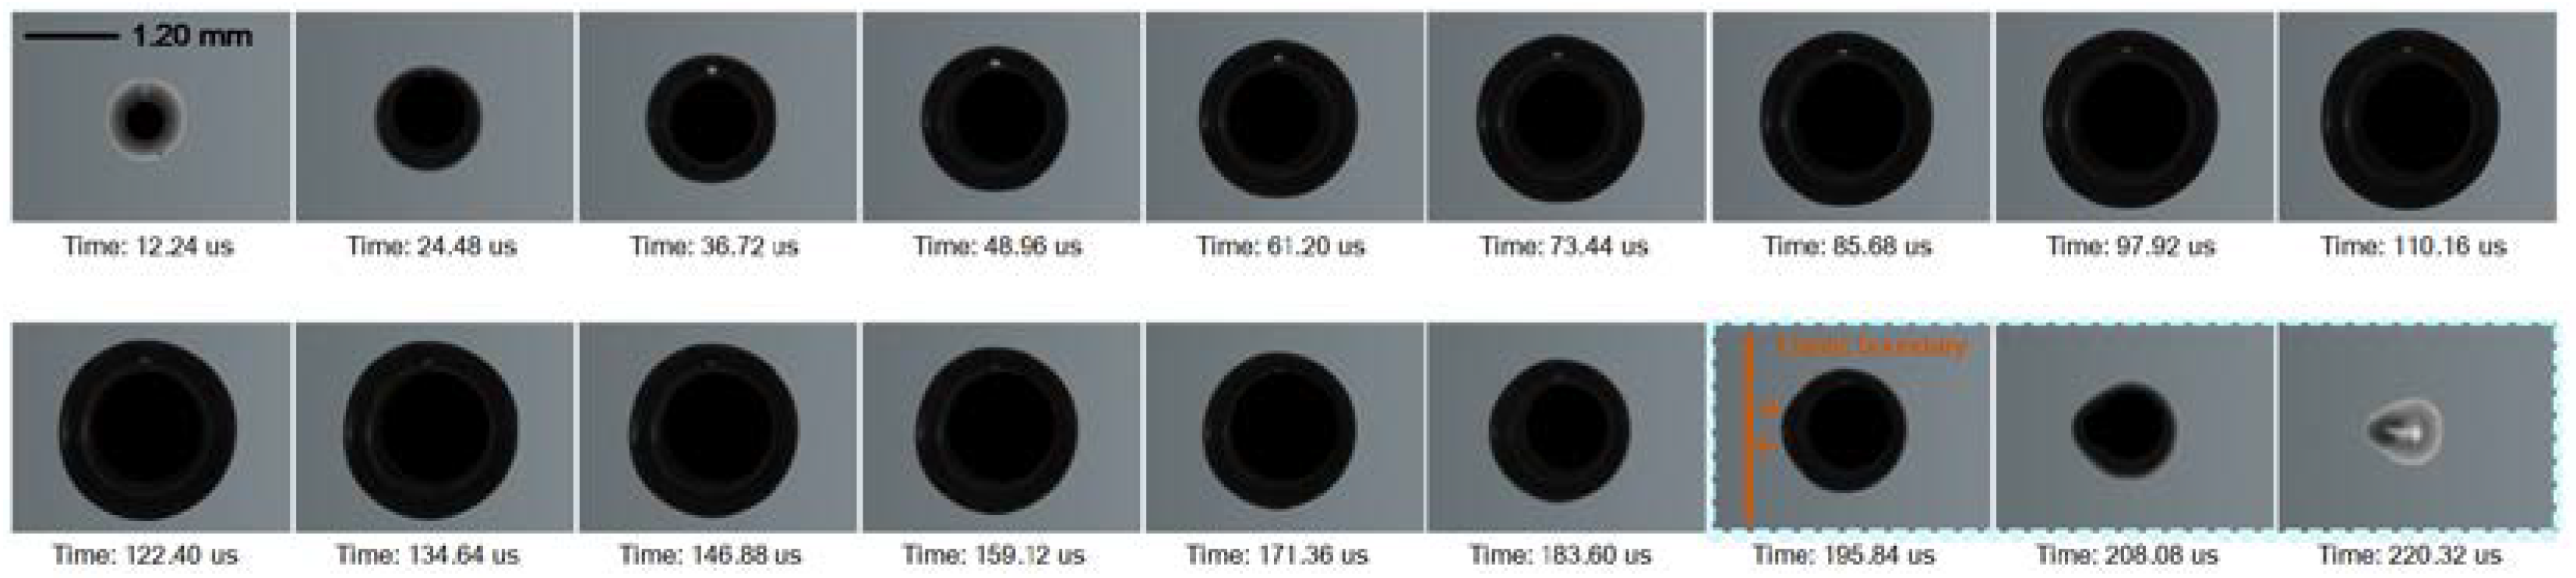
Figure 11.
Non-spherical bubble shape due to inhomogeneous bubble surface velocity, near elastic boundary, (a) rb = 1.30 (b) rb = 1.15.
Figure 11.
Non-spherical bubble shape due to inhomogeneous bubble surface velocity, near elastic boundary, (a) rb = 1.30 (b) rb = 1.15.
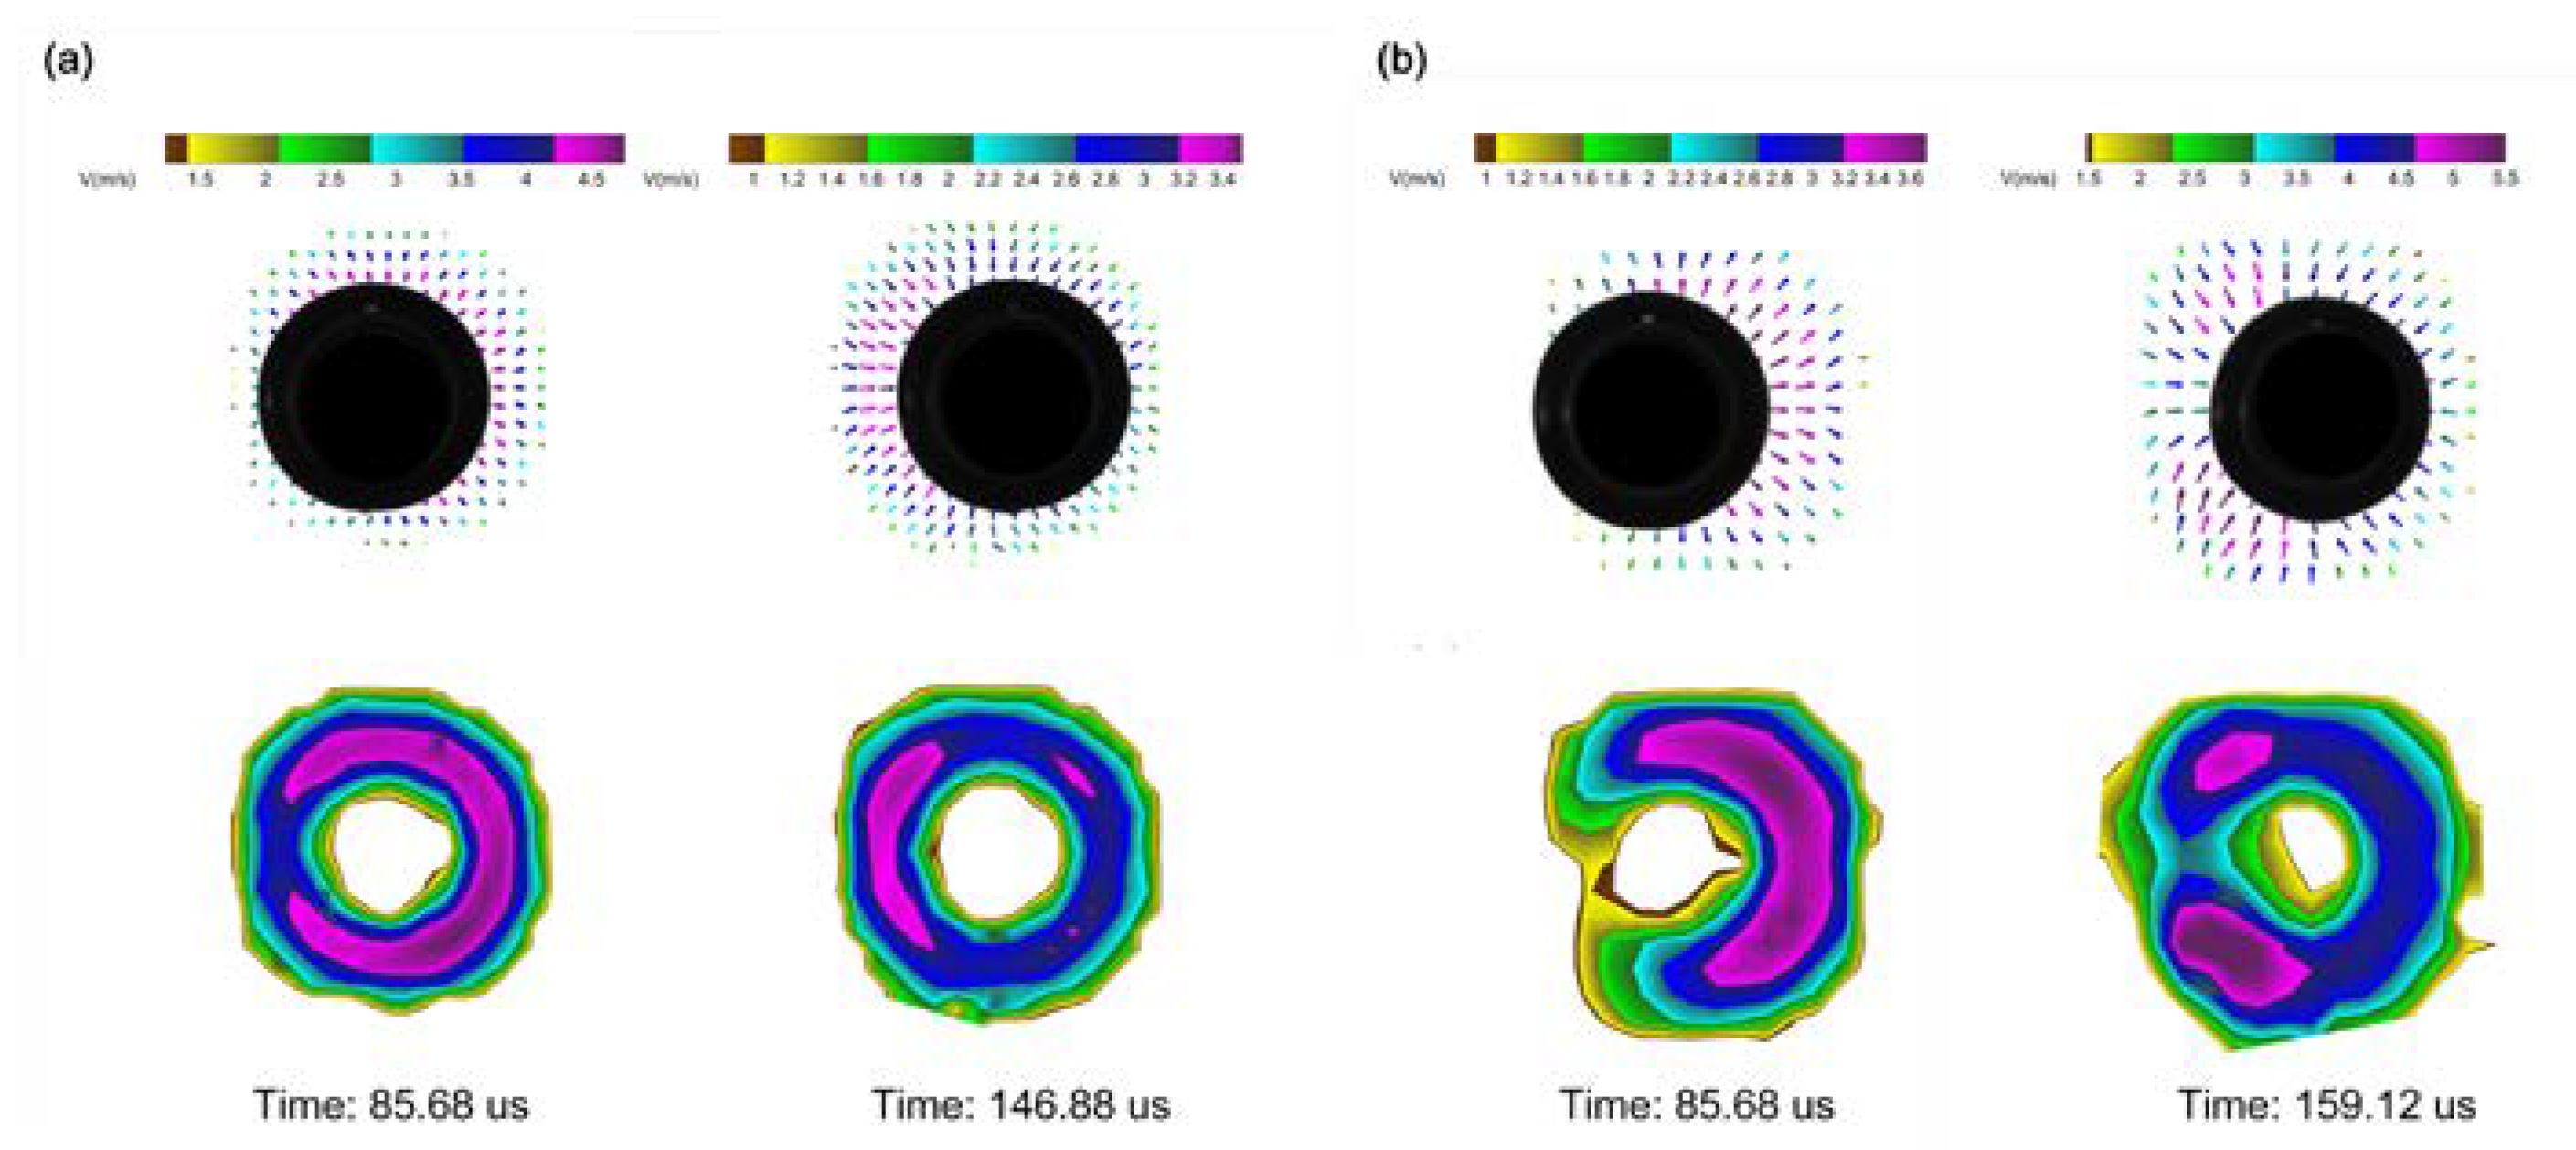
Figure 12.
Cavitation bubble dynamics near free surface and rigid boundary. Time: 0-110.16 us, the expanding cavitation bubble. Time: 122.40-220.32 us, the contracting cavitation bubble, apparent non-spherical deformation, rb = rf = 1.30, Rm = 1.20 mm.
Figure 12.
Cavitation bubble dynamics near free surface and rigid boundary. Time: 0-110.16 us, the expanding cavitation bubble. Time: 122.40-220.32 us, the contracting cavitation bubble, apparent non-spherical deformation, rb = rf = 1.30, Rm = 1.20 mm.
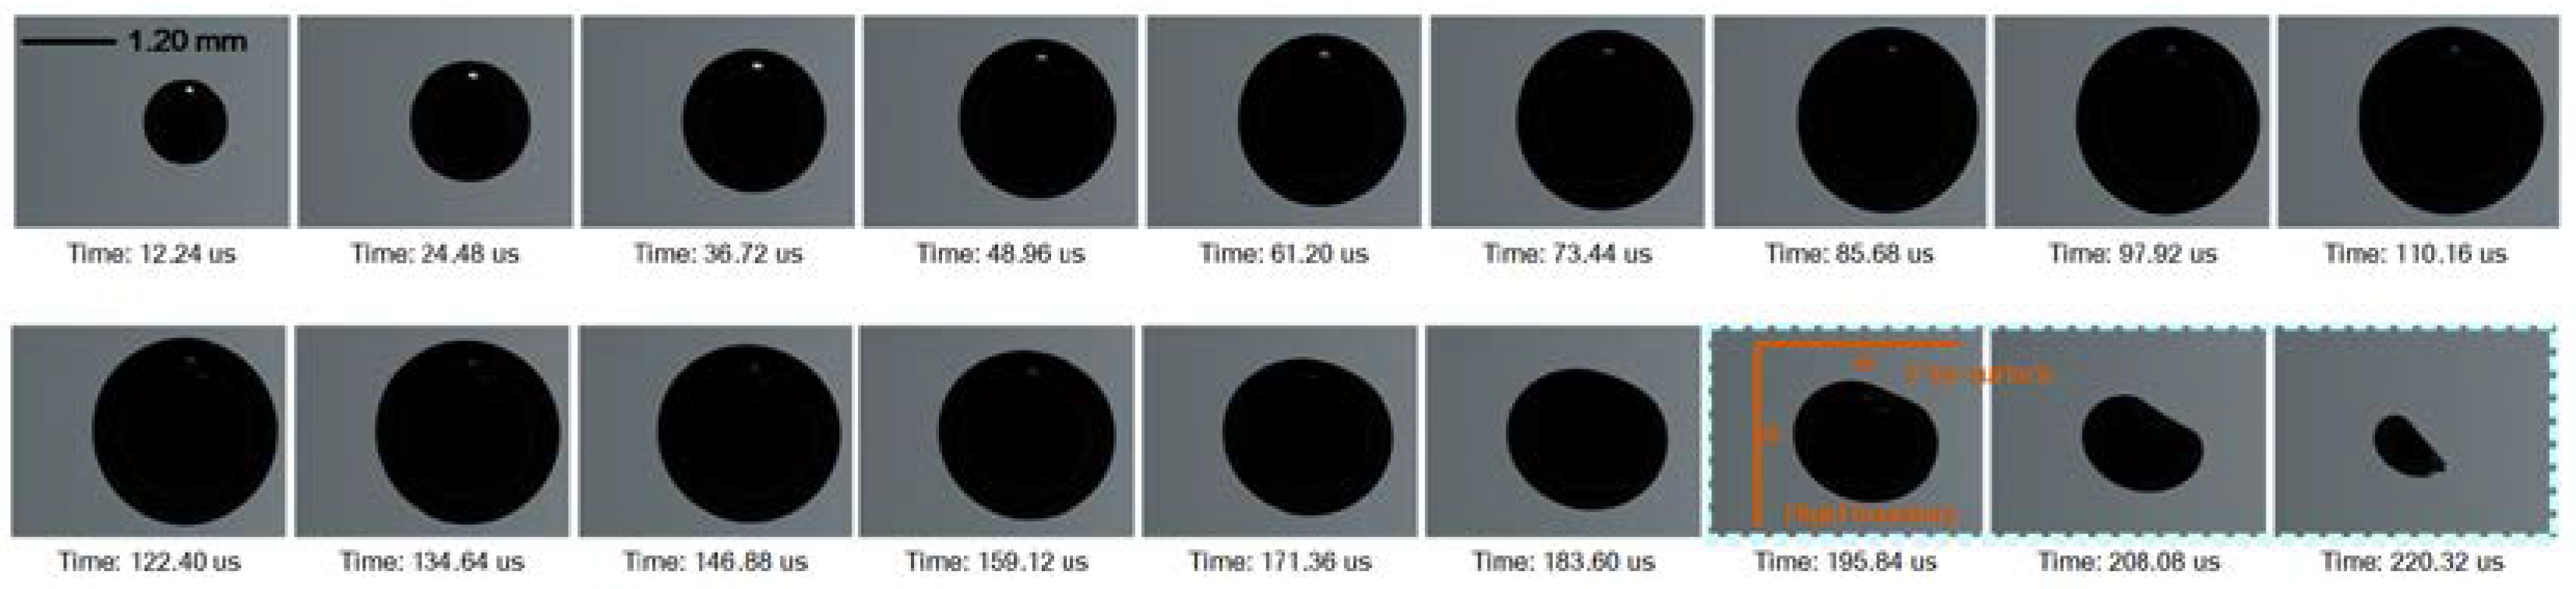
Figure 13.
Non-spherical bubble shape due to in-homogeneous bubble surface velocity, near free surface and rigid boundary.
Figure 13.
Non-spherical bubble shape due to in-homogeneous bubble surface velocity, near free surface and rigid boundary.
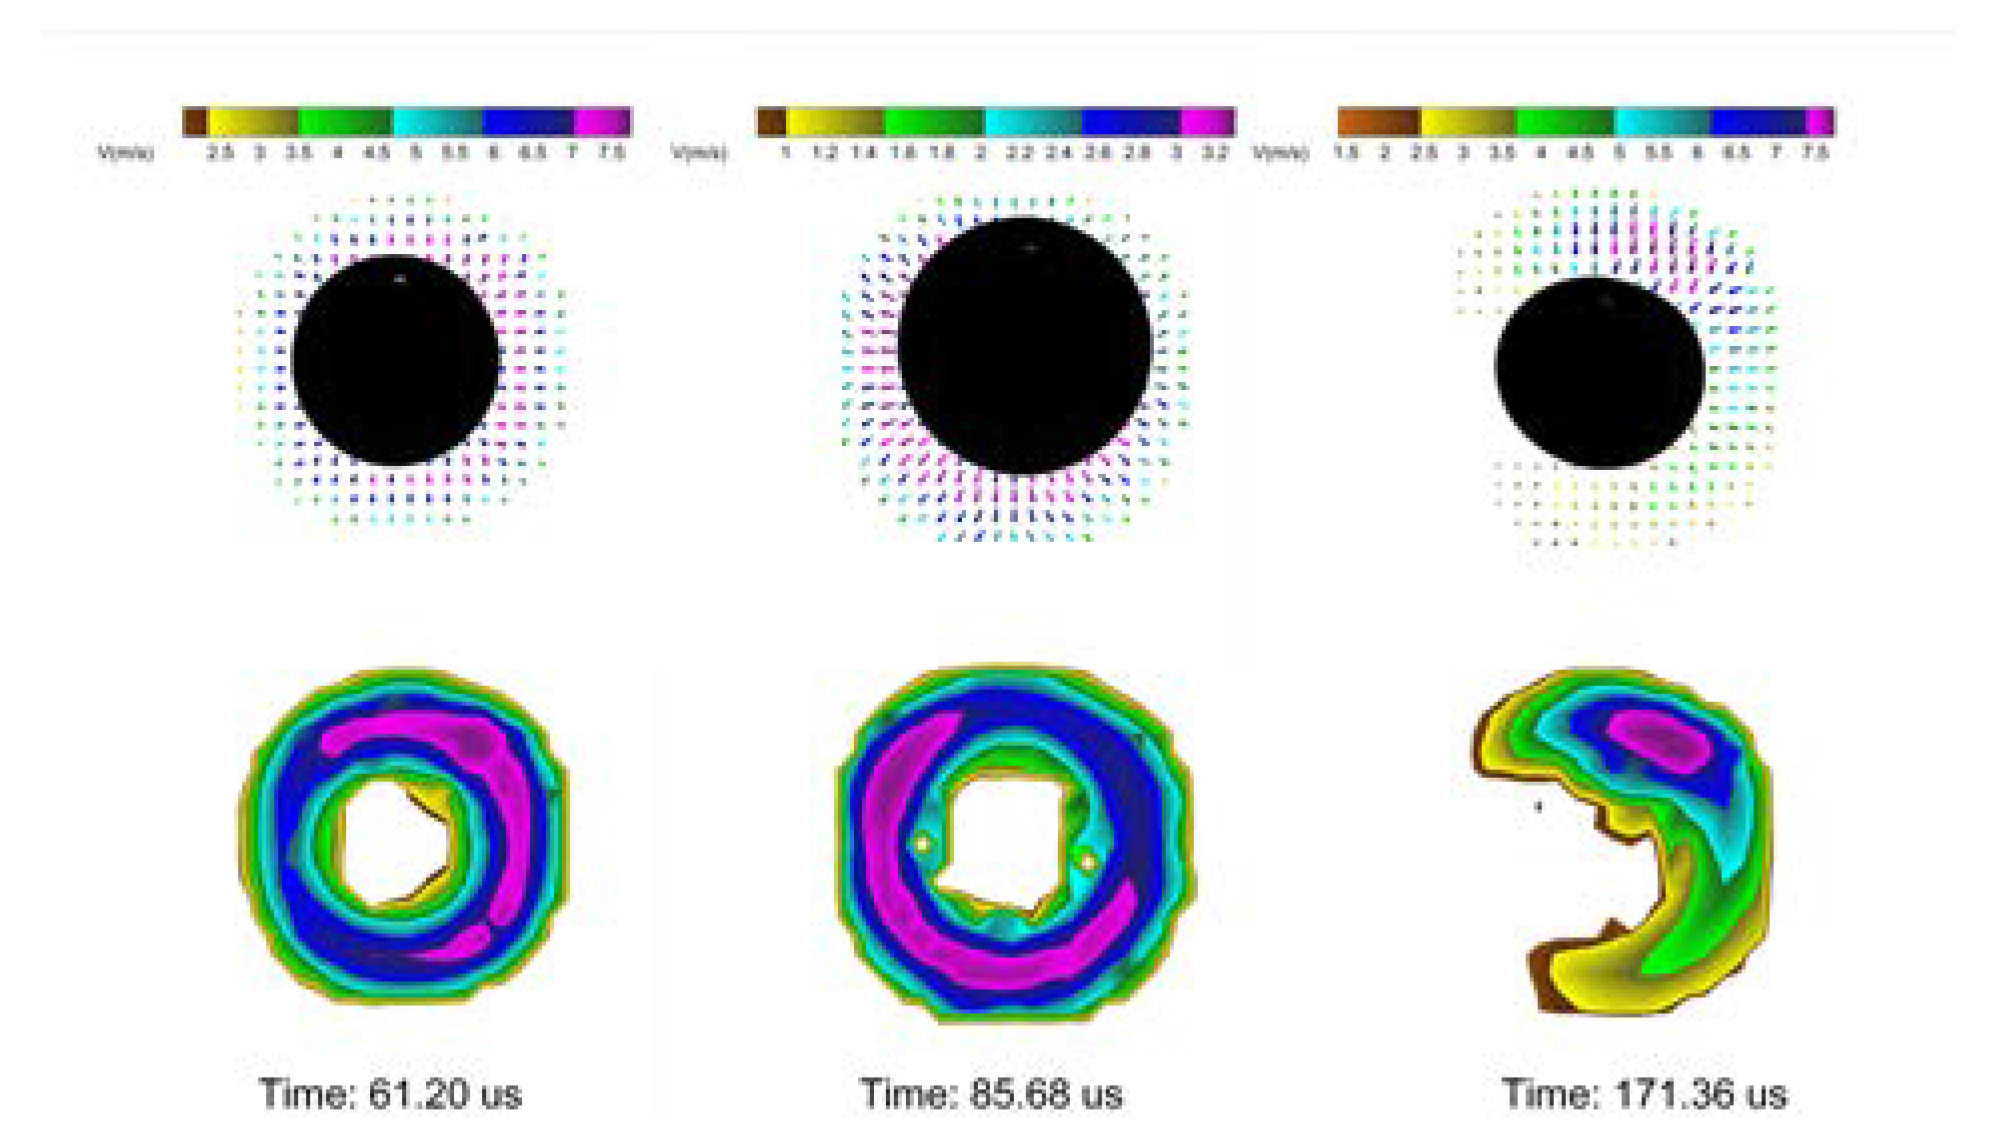

Table 1.
Experimental parameter settings. The maximum equivalent radius of the bubble: Rm = 1.20 mm.
Table 1.
Experimental parameter settings. The maximum equivalent radius of the bubble: Rm = 1.20 mm.
| Boundary Types | The Distance | Shape of the Collapsing Bubble |
|---|---|---|
| none | spherical | |
| free surface | rf = 1.30 | hemispherical |
| rigid boundary | rb = 1.30 | ellipsoidal |
| elastic boundary | rb = 1.30, rb = 1.15 | cone-shaped |
| free surface and rigid boundary | rb =rf = 1.30 | pea-shaped |
Disclaimer/Publisher’s Note: The statements, opinions and data contained in all publications are solely those of the individual author(s) and contributor(s) and not of MDPI and/or the editor(s). MDPI and/or the editor(s) disclaim responsibility for any injury to people or property resulting from any ideas, methods, instructions, or products referred to in the content. |
© 2024 by the authors. Licensee MDPI, Basel, Switzerland. This article is an open access article distributed under the terms and conditions of the Creative Commons Attribution (CC BY) license (http://creativecommons.org/licenses/by/4.0/).
Copyright: This open access article is published under a Creative Commons CC BY 4.0 license, which permit the free download, distribution, and reuse, provided that the author and preprint are cited in any reuse.


