1. Introduction
Primordial gravitational waves refer to gravitational waves generated during the early stages of cosmic formation due to the superluminal expansion of the universe[
1,
2]. The aim is to detect primordial gravitational waves and explore fundamental cosmic properties in order to understand the structure and evolutionary processes of the early universe, as well as the theory of cosmic inflation [
3].
The method for detecting the primordial gravitational waves is to measure the B mode polarization of the cosmic microwave background radiation (CMB) [
3,
4,
5,
6,
7]. By analyzing the polarization patterns of the CMB, one can indirectly deduce the existence of primordial gravitational waves and their intensity. Currently, the construction of the Ali CMB Polarization Telescope (AliCPT-1) project is underway in China [
8]. We aims to build a two-refractive lens cosmic microwave background radiation polarization telescope, AliCPT-1, at an elevation of 5250 meters in the Ali of Tibet, China Its scientific motivation is to do precise measurements of primordial gravitational waves, thereby unraveling the origins of the universe.[
4,
5,
7].
To model the temperature to polarization leakage and the E-to-B leakage due to the beam mismatch, the far-field beams of telescope need to be calibrated. To measure the far-filed beam of each detector, the calibration source must be placed at a far field distance. The calibration source is installed ~1500m away from the AliCPT-1 and ~7° above the horizon. Since the elevation angle of the telescope is limited from 45° to zenith angle, a far-field flat mirror should be used to reflect the radiation from the calibration microwave source to the AliCPT-1. The support structure of the flat mirror should not obstruct the radiation from the calibration source during far-field beam calibration for accuracy measurement of the beam.
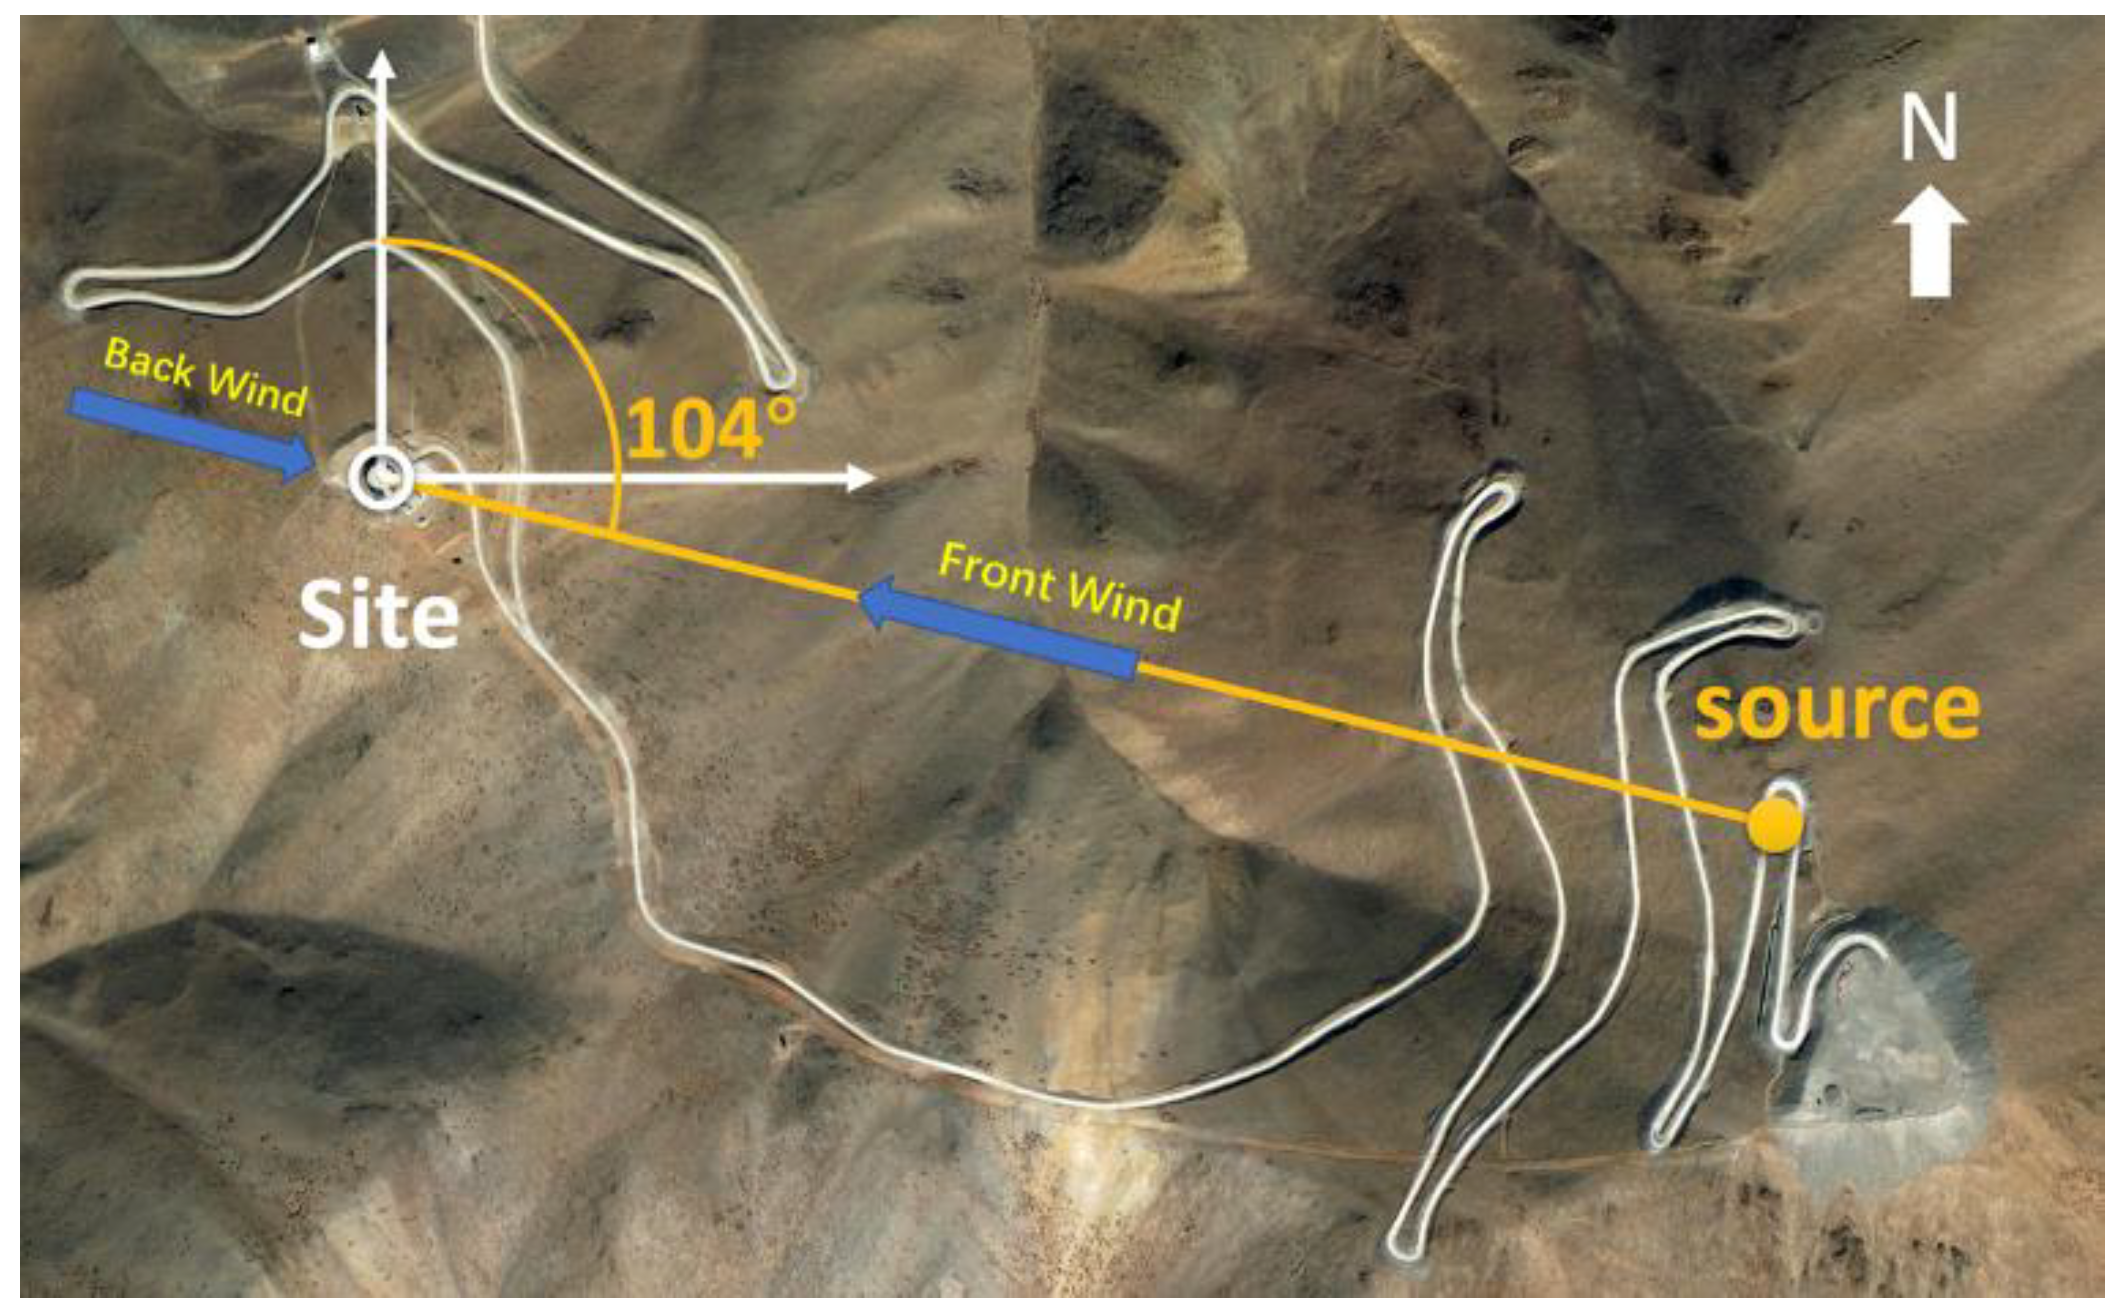
The FFF mirror is oriented directly towards the microwave source. When the wind blows from the source towards the FFF mirror, it is referred to as the ‘front wind’. Conversely, when the wind blows from the side of the reflector toward the source, it is termed the ‘back wind’. Therefore, when calculating wind loads, both scenarios should be taken into consideration as they represent the two extreme conditions for the FFF mirror. This analysis allows us to gain insights into the structural response of the FFF mirror when subjected to extreme wind loads. The Far-field distance for the calibration source to the reflector is calculated using the formula:
Where λ represents the electromagnetic wave’s wavelength, and D signifies the aperture of the telescope [
9]. Upon substituting D = 0.72 m and λ = 2 × 10
-3 m, the calculated L results in 490 m. Considering these distance requirements, a pragmatic approach was taken to select a suitable installation location on the mountain for the source. This decision determined the orientation of the FFF, which is positioned at a bearing of 104° east of north. The chosen orientation, along with the prevailing wind direction, will affect the wind loading magnitude on the FFF. Consequently, the distance between the source and the reflective mirror is ~1500m. The actual situation is shown in
Figure 1.
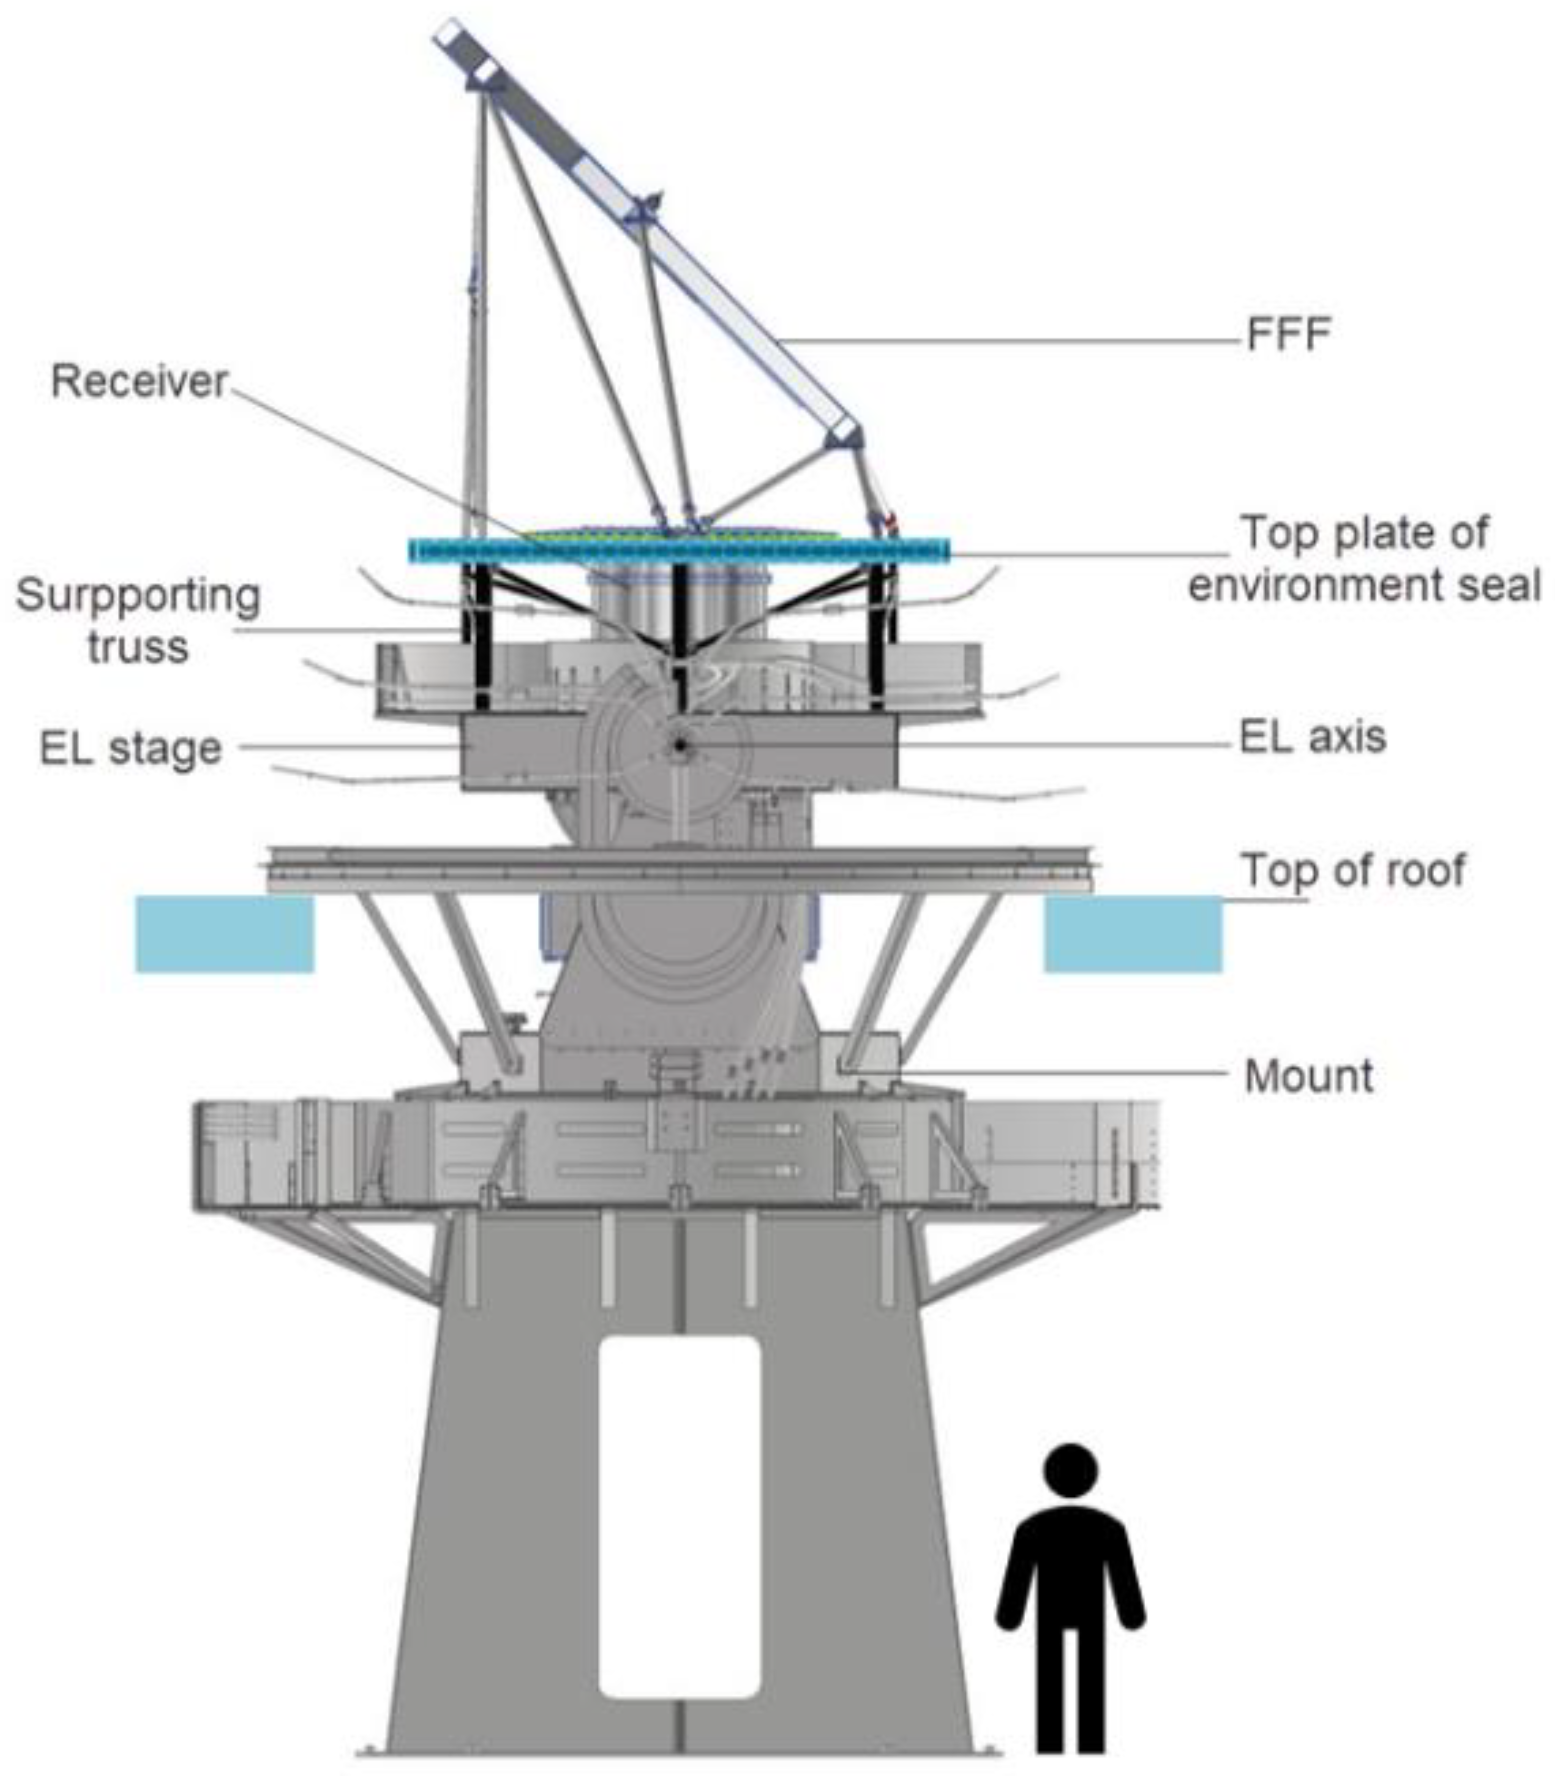
FFF mirror will be installed on the top plate of the environment seal (baseplate for FFF), supported by the mount elevation (EL) stage, exposed on the roof of the observation station, as depicted in
Figure 2.
According to calibration requirement, 2m by 3m mirror reflector was needed, meanwhile its flatness should be better than λ/20, so the FFF mirror system was designed to ensure RMS (Root Mean Square) value of flatness less than 0.1mm under gravity and strong wind pressure.
2. Structure of the Far-Field Flat Mirror
The FFF mirror, composed of highly reflective mirror, reinforcing frame, supporting bracket, is designed to ensure efficient high reflection and radiation transmission.
Various solutions were researched and tested. Experimental results revealed that achieving a planarity of 0.1mm for a 1m × 1m honeycomb panel was extremely complex, and quite difficult for FFF mirror with 2m width by 3m height. Glass mirrors with metallic coating are not suitable due to both the complex manufacturing process and high costs. Considering process, performance, and cost, we chose ultra-flat aluminum panels with the reinforcing frame glued in back as the solution. The panels are supported by 12 rods connected to 7 fixing points, as shown in
Figure 3.
The flatness requirement of the FFF mirror within the context of optical components should be better than 0.1mm(λ/20). This stringent requirement is necessary, because rough reflective mirror may result in diffuse reflection instead of proper reflection, thereby rendering it ineffective for beam calibration. The signal being calibrated is at a frequency of 150 GHz, with an approximate wavelength of 2 millimeters. Therefore, in order to ensure its functionality, the flatness requirement for the FFF mirror should be less than 0.1 millimeters. There are several factors that can affect the flatness of the FFF mirror, including machining precision, weight, installation errors, and wind loading.
Achieving high flatness of the FFF mirror was challenging due to its large size. The ultra-flatness aluminum panel of the FFF mirror is 0.08 mm. The panel(mirror) is bonded to a welded and reinforcing frame which surface flatness within 0.05 mm. Besides 10 of 12 support robs are adjustable, we designed adjustment points on the back crossbeam to control the central depression. Laser tracker was employed to measure the mirror, and accordingly adjust the mirror flatness mainly through loosing or tightening the stud of the back crossbeam. Flatness RMS value of 0.05 mm was achieved in factory by comprehensive design, process and assembly process measures.
3. Fluid Field Calculation
3.1. Theoretical Analysis
The fluid domain in which the FFF Mirror is located is characterized as an incompressible viscous fluid flow governed by mass conservation, energy conservation, and momentum conservation [
10,
11,
12]. The initial step involves determining the fluid state and considering the concept of Reynolds number (Re), which serves as an indicator to distinguish between laminar and turbulent flow regimes by evaluating the relative magnitudes of inertial and viscous forces. The formula for calculating the Reynolds number is as follows:
Re signifies the Reynolds number, where ρ denotes the fluid density, V represents fluid velocity, L stands for the characteristic length, and μ represents the fluid dynamic viscosity [
13,
14,
15]. When the Reynolds number is below a critical threshold (typically around 500,000), the flow is laminar, with viscous forces dominating and leading to a smooth and ordered flow. However, when the Reynolds number exceeds this threshold, turbulence occurs due to the dominance of inertial forces, resulting in irregular and chaotic flow patterns.
Turbulent flow analysis primarily employs the k-ε and k-ω turbulence models. This study utilizes the Realizable k-ε turbulence model [
16,
17]. The turbulence model and its dissipation equations are presented as follows:
Standard model turbulence kinetic energy transport equation:
Standard model turbulence dissipation rate transport equation:
G
k represents the turbulence kinetic energy generated by mean velocity gradients, G
b accounts for the turbulence kinetic energy generated by buoyancy, Y
M signifies the influence of fluctuation expansion on turbulence dissipation rate, and σ
k and σ
ϵ denote the turbulent Prandtl numbers for turbulence kinetic energy and turbulence dissipation rate(5), respectively[
18,
19].
The one-way fluid-structure coupling approach is selected because the mirror structure has rigidity structure and almost no influence on the fluid field. Initial fluid field calculations are executed using the Fluent module within Workbench, yielding wind pressure distribution over the mirror. Subsequently, these results are incorporated as boundary conditions for calculating mirror deformation and stress.
3.2. Fluid Computational Domain
FFF mirror was protected from mountain wind by the wind shield at the southwest of the AliCPT-1 observatory, shown in
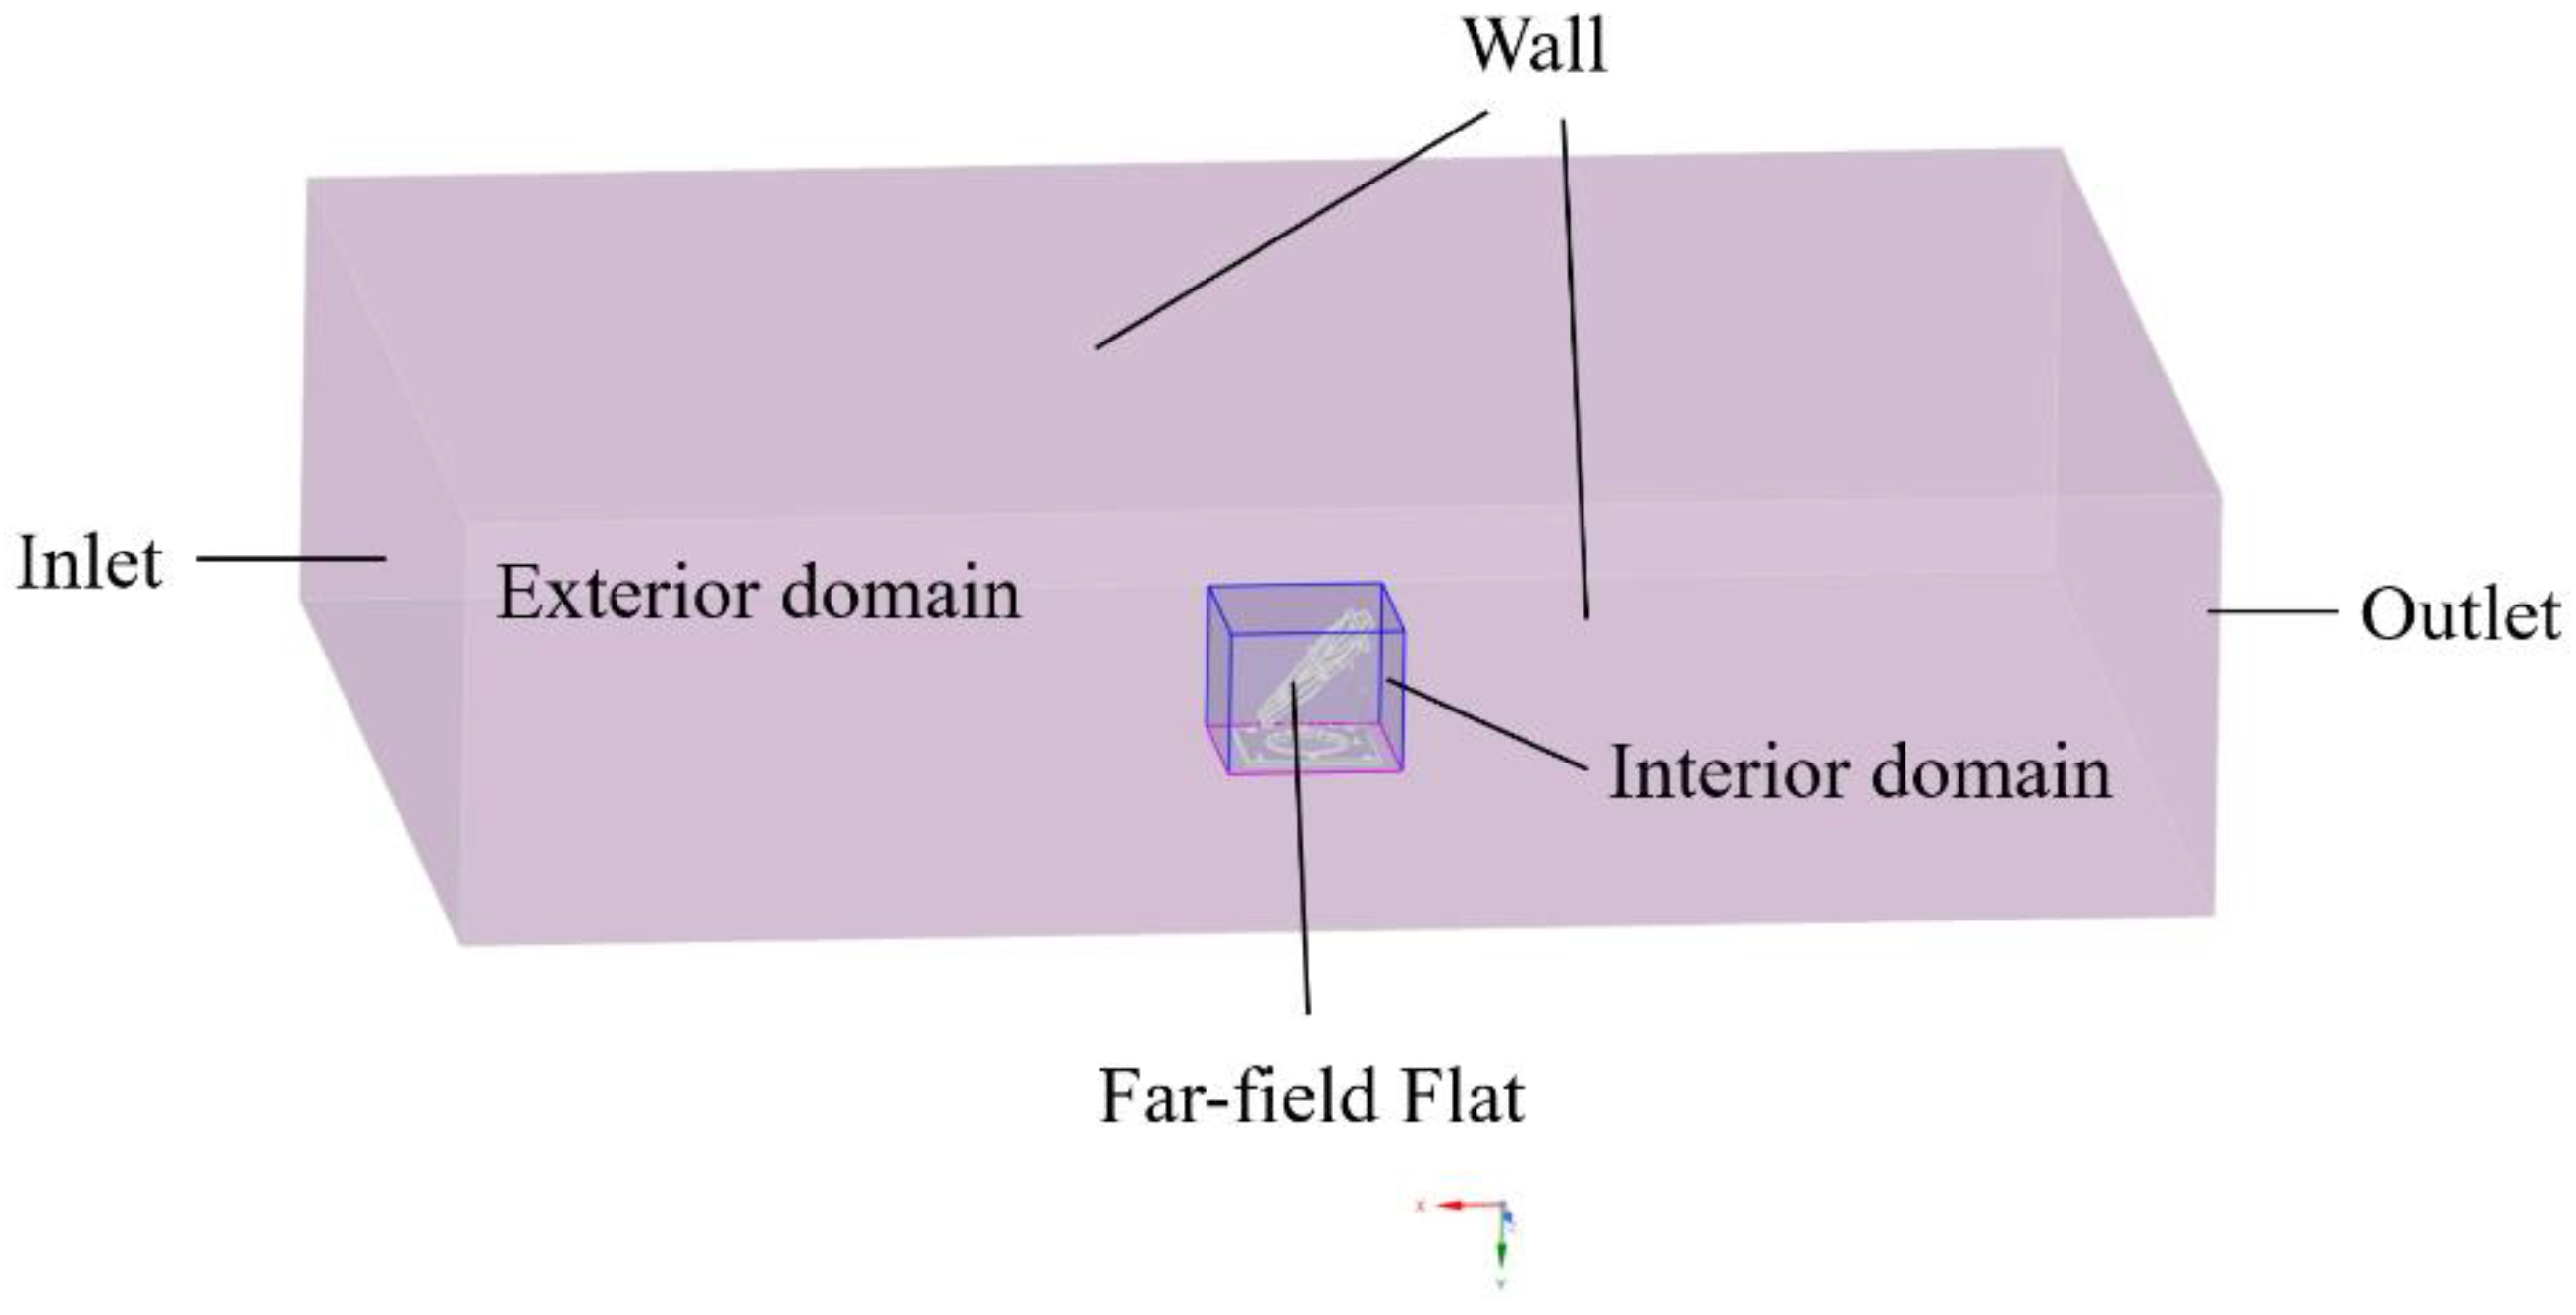
Figure 4. In order to be closer to the actual working conditions, the size of the flow field model needs to be within the range of wind shield, and the calculation domain is finally selected as 30m × 40m × 10m.
Employed a regional block subdivision approach to partition the computational domain for grid discretization, so Interior domain was set as 4m × 4m × 3.2m while the reflection mirror settled as the central point, as depicted in
Figure 5. This method can adapt to the flow field conditions near FFF by subdividing only the grid of the interior domain, thus reducing computational resources.
3.3. Grid Independence Verification
In computational fluid dynamics (CFD) simulations, the quantity and quality of grids in the fluid model have a crucial impact on the calculation accuracy. Thus, obtaining a well-structured grid is a prerequisite for accurate simulations[
20,
21,
22]. Structured grids with increased density were applied to the Interior domain, while unstructured grids were used in Interior domain. Grid refinement was also applied to the grid interface for fluid-structure coupling to ensure consistency in node quantity and position between the fluid and solid interfaces.
To strike a balance between computational accuracy and time efficiency, grid independence verification was performed using the structure of the FFF reflector shown in
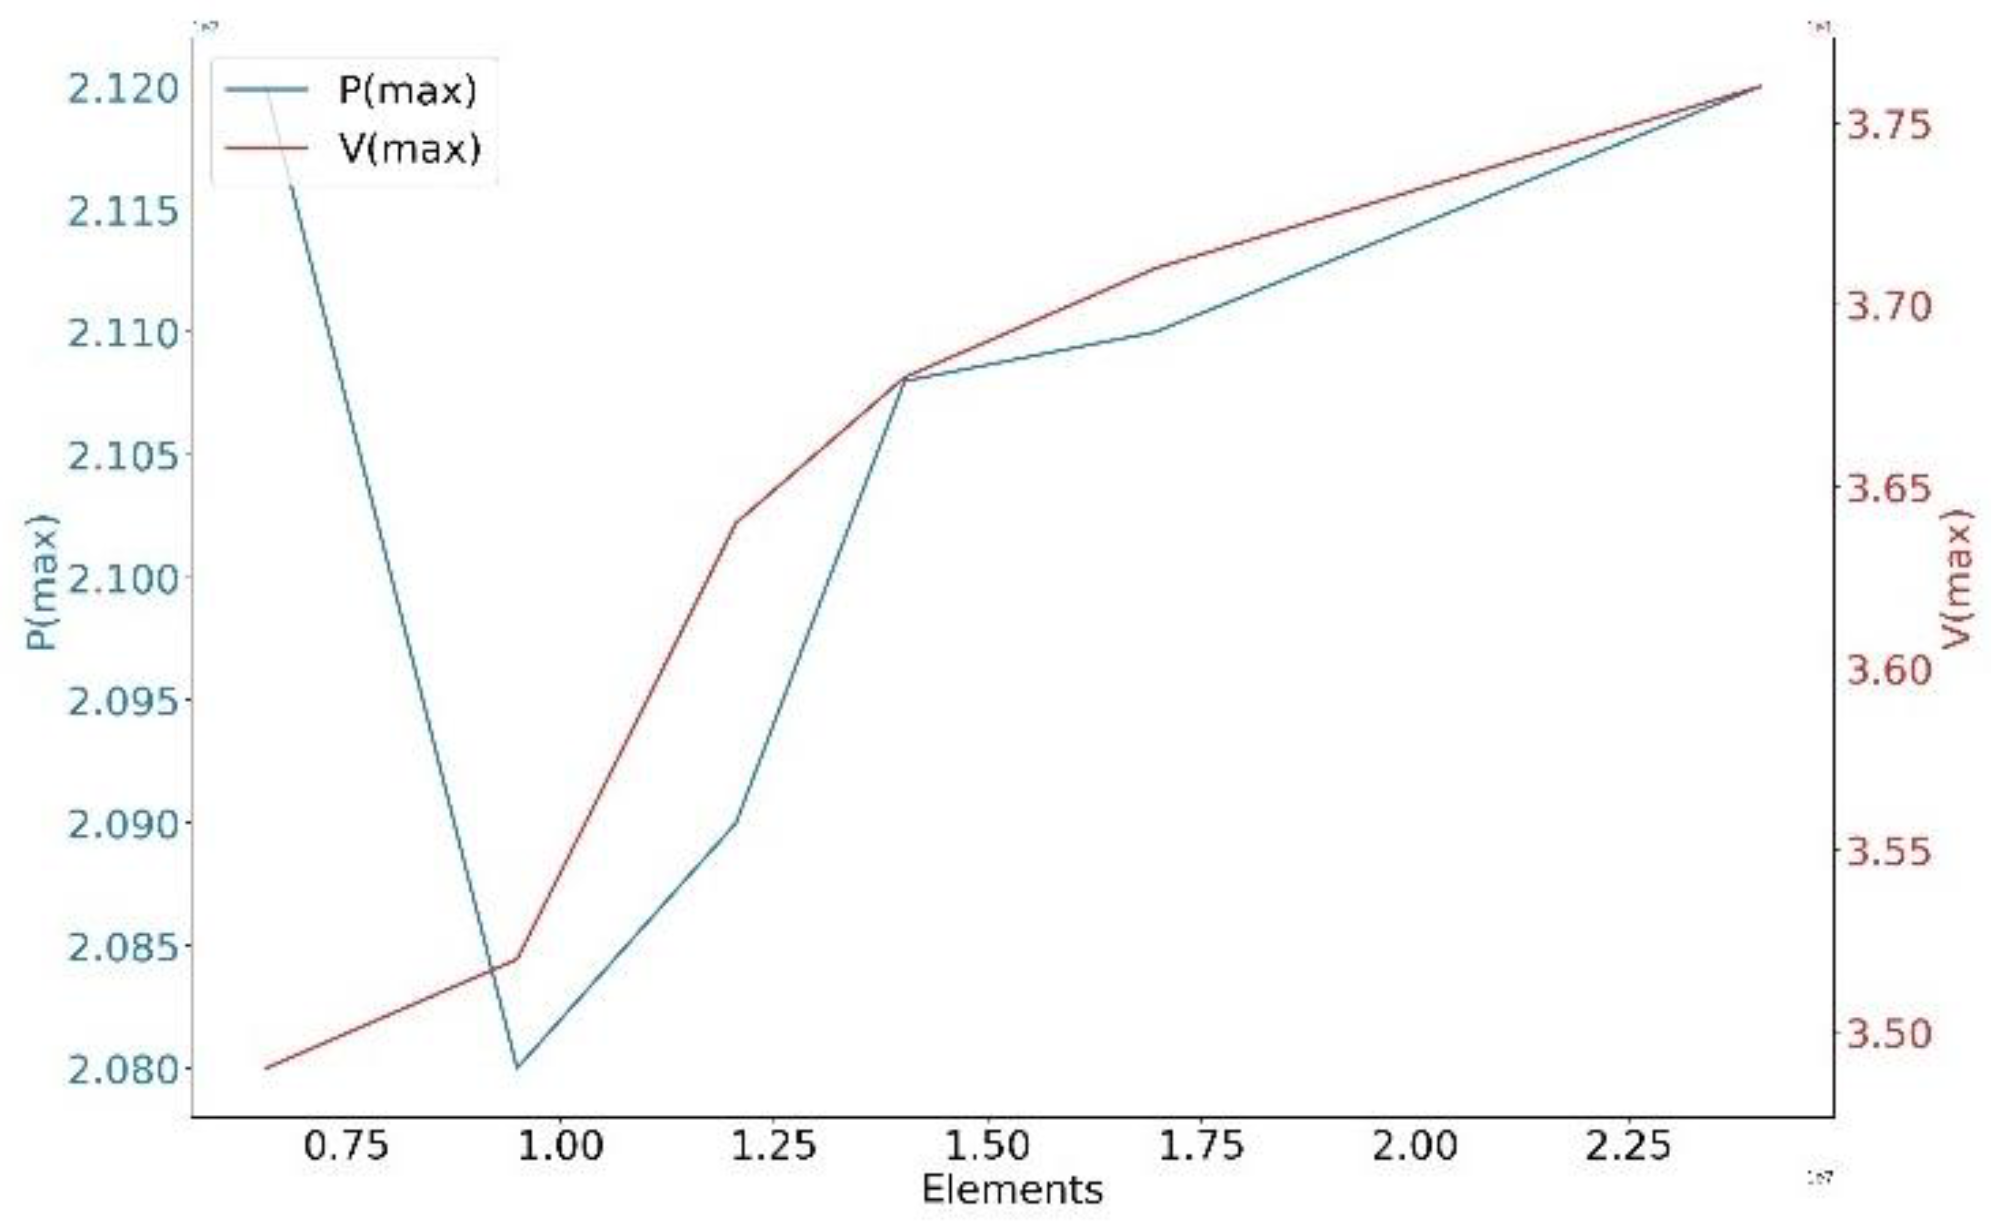
Figure 5. Initially, six different grid configurations were generated, each with a mesh quality above 0.85. Simulations were conducted with the same boundary conditions to investigate the impact of grid quantity on the maximum pressure (Pmax) and maximum velocity (Vmax), as illustrated in
Figure 6. The results indicate that increasing the grid quantity beyond a certain point (16958409) leads to changes in Pmax and Vmax of less than 4.7%, which suggests that make further efforts to increase the number of grids is not related to the simulation results
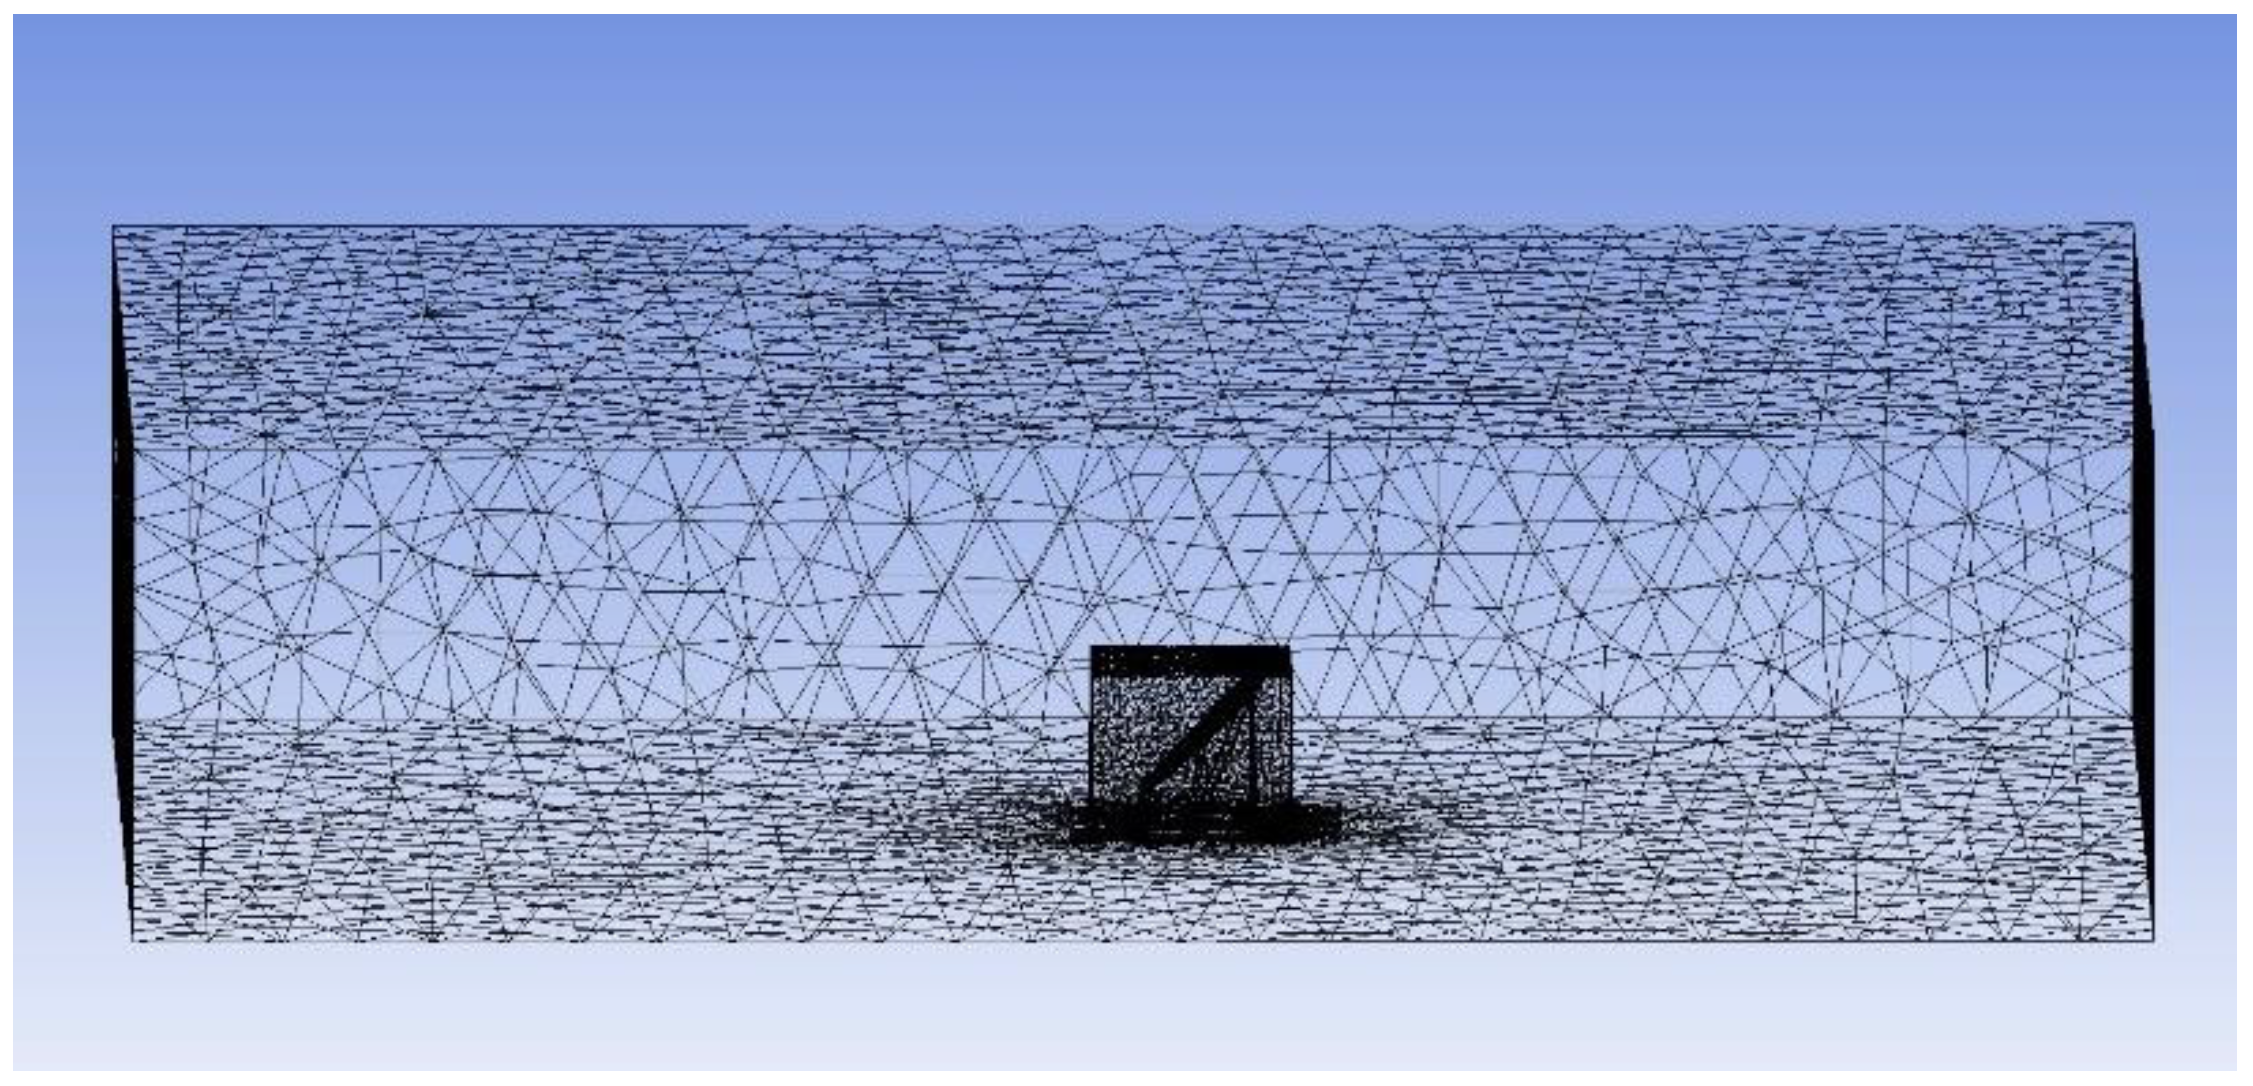
Therefore, considering a balance between computational time and accuracy, the optimal grid quantity was determined to be 24031137, with a base size of 5mm. As depicted in
Figure 7.
3.4. Boundary Conditions
Ali is an area characterized by harsh natural conditions in Tibet, falling under a high-altitude frigid monsoon climate. The AliCPT-1 observatory site experiences frequent strong winds, with approximately 115 windy days per year. The extreme wind speed is 53 m/s from the southwest, so the installation of a windshields reduces the wind speed to less than 10 m/s in the 220° to 315° direction.
An on-site meteorological station is installed on the rooftop of the observatory building to monitor weather conditions. This station is positioned near the installation site of the FFF mirror. After the installation of the windbreak, the flow field was analysed. When the wind blows towards the wind shield, the wind speed at the meteorological station is 12.1m/s, while at the location of the FFF mirror, it is 12.8m/s. Therefore, it can be concluded that the wind speeds at the two locations are similar, and that the wind speeds at the meteorological station can be used.
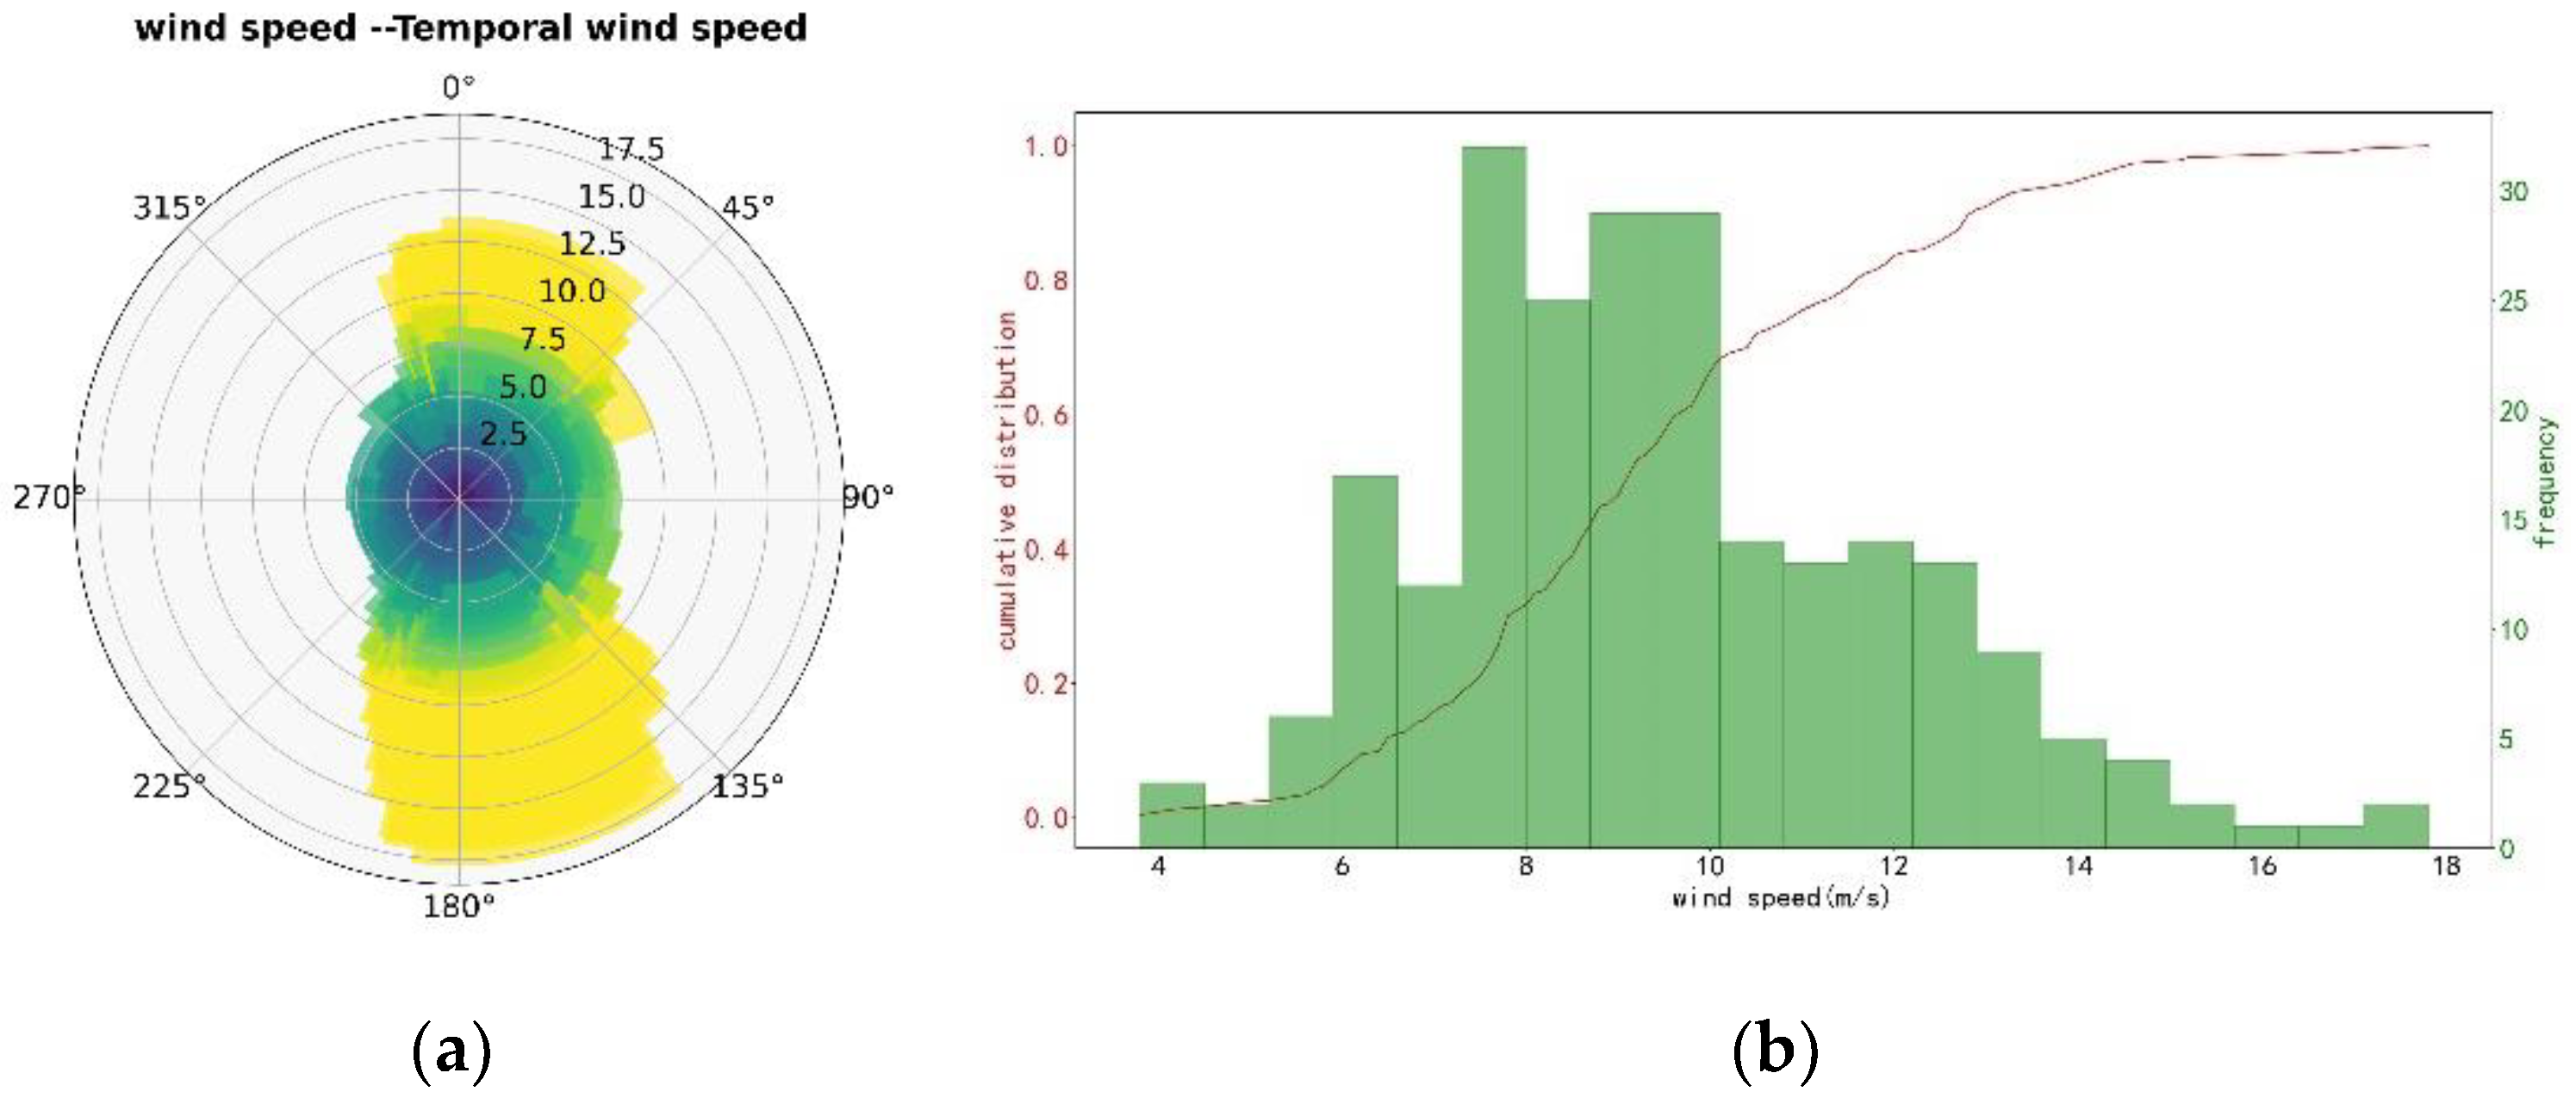
Observational data was collected from November 2019 to July 2020, with a specific focus on daily instantaneous wind speeds and wind directions, as shown in
Figure 8. From this data, it was determined that the max wind speed reached 17.5 m/s, with a prevailing wind direction from the northwest. The FFF mirror experienced wind from the forward direction at a bearing of 104°with a maximum wind speed of 13 m/s. In contrast, wind from the back direction occurs at a bearing of 290°with a maximum wind speed of 8 m/s. A cumulative histogram shown in
Figure 8 demonstrated that wind speeds most frequently fell within the range of 6 to 14 m/s, accounting for approximately 90% of the total occurrences.
We take a maximum wind speed of 17.5 m/s as extreme wind load to analyze the wind pressure on the reflector. Regarding boundary conditions within the computational domain, the fluid inlet velocity was set to 17.5 m/s, the fluid outlet pressure to 0 Pa, and specified the no-slip boundary conditions on the surrounding walls.
A realizable k-ε turbulence model was employed for turbulent simulation, with model constants set to C2ϵ=1.9, σk=1, and σϵ=1.2. The Coupled algorithm was utilized for pressure-velocity coupling, treating pressure and velocity as two unknowns and imposing simultaneous constraints on their relationship to derive analytical solutions. Concurrently, a coupled analysis was conducted on fluid parameters such as velocity, pressure, density, and temperature to depict fluid behavior accurately. A mixed initialization approach was adopted to solve the Laplace equation, using distinct interpolation methods for different boundary conditions to initialize the pressure and velocity fields of the computational domain.
3.5. Convergence Assessment
The evaluation of convergence plays a pivotal role in ensuring the accuracy and reliability of computational results. It serves as the evaluation for validating the correctness of various factors, including mesh quality, the selection of physical models, and the configuration of boundary conditions. Typically, determining whether a Fluent simulation has converged is done by monitoring the results of the calculations, either by looking at the trend of the residuals or by customizing one of the physical parameters.
Fluent’s default convergence criteria state that convergence is achieved when all variable residuals fall below 1e-3, except for energy residuals.[
23]. There are even more stringent requirements for energy residuals, demanding that they be less than 1e-6. Here, residuals refer to the sum of fluxes on each face of each element, predominantly monitoring physical quantities like mass, energy, velocity, turbulence, and more.
In theory, once convergence is reached, the sum of all physical quantities within each element should equate to zero. However, due to limitations in numerical precision, residuals cannot reach absolute zero. For single-precision calculations, it is generally recommended to maintain residuals below the default initial value of 1e-3. Furthermore, it is imperative to consider the convergence status of other physical quantities. In the current computational process, when the number of iterations reaches 56, the mass residual is below 1e-3, thus meeting the convergence criteria.
3.6. Results Analysis
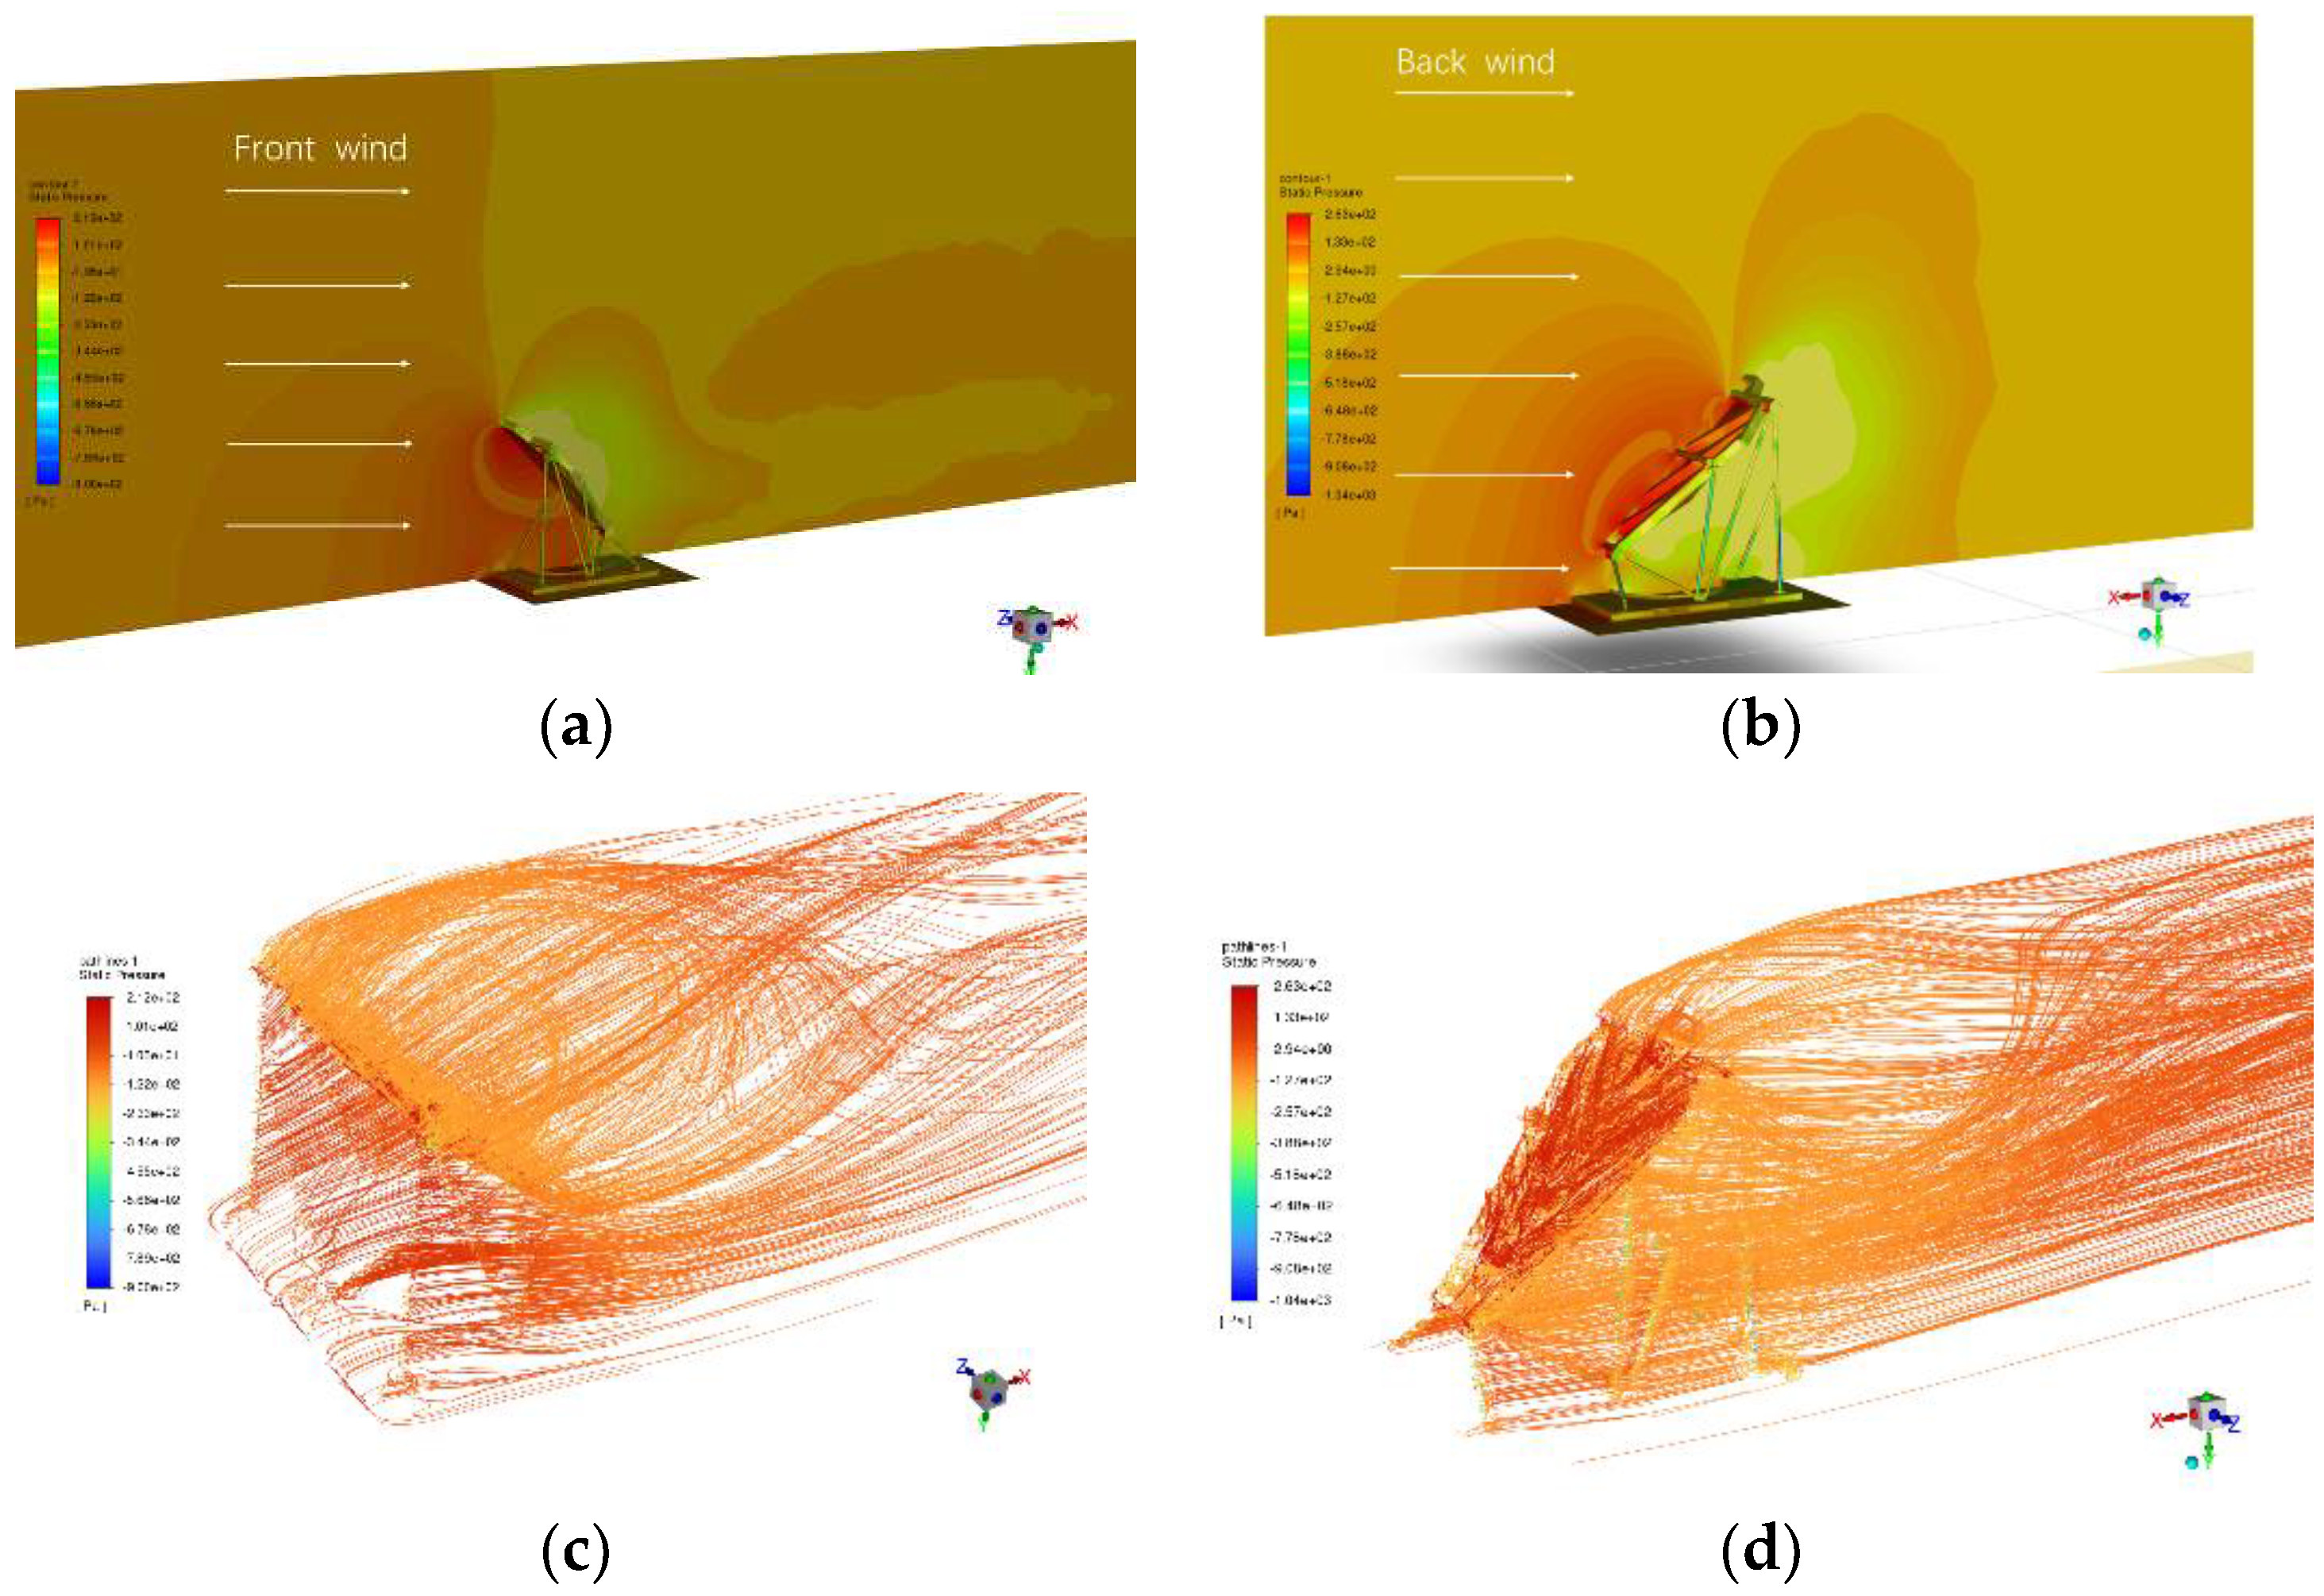
After achieving computational convergence, the relevant parameters related to the reflector are obtained. A symmetrical plane perpendicular to the ground and passing through the mirror was established, and pressure contour plots and streamline plots were examined on this plane, as shown in
Figure 9.
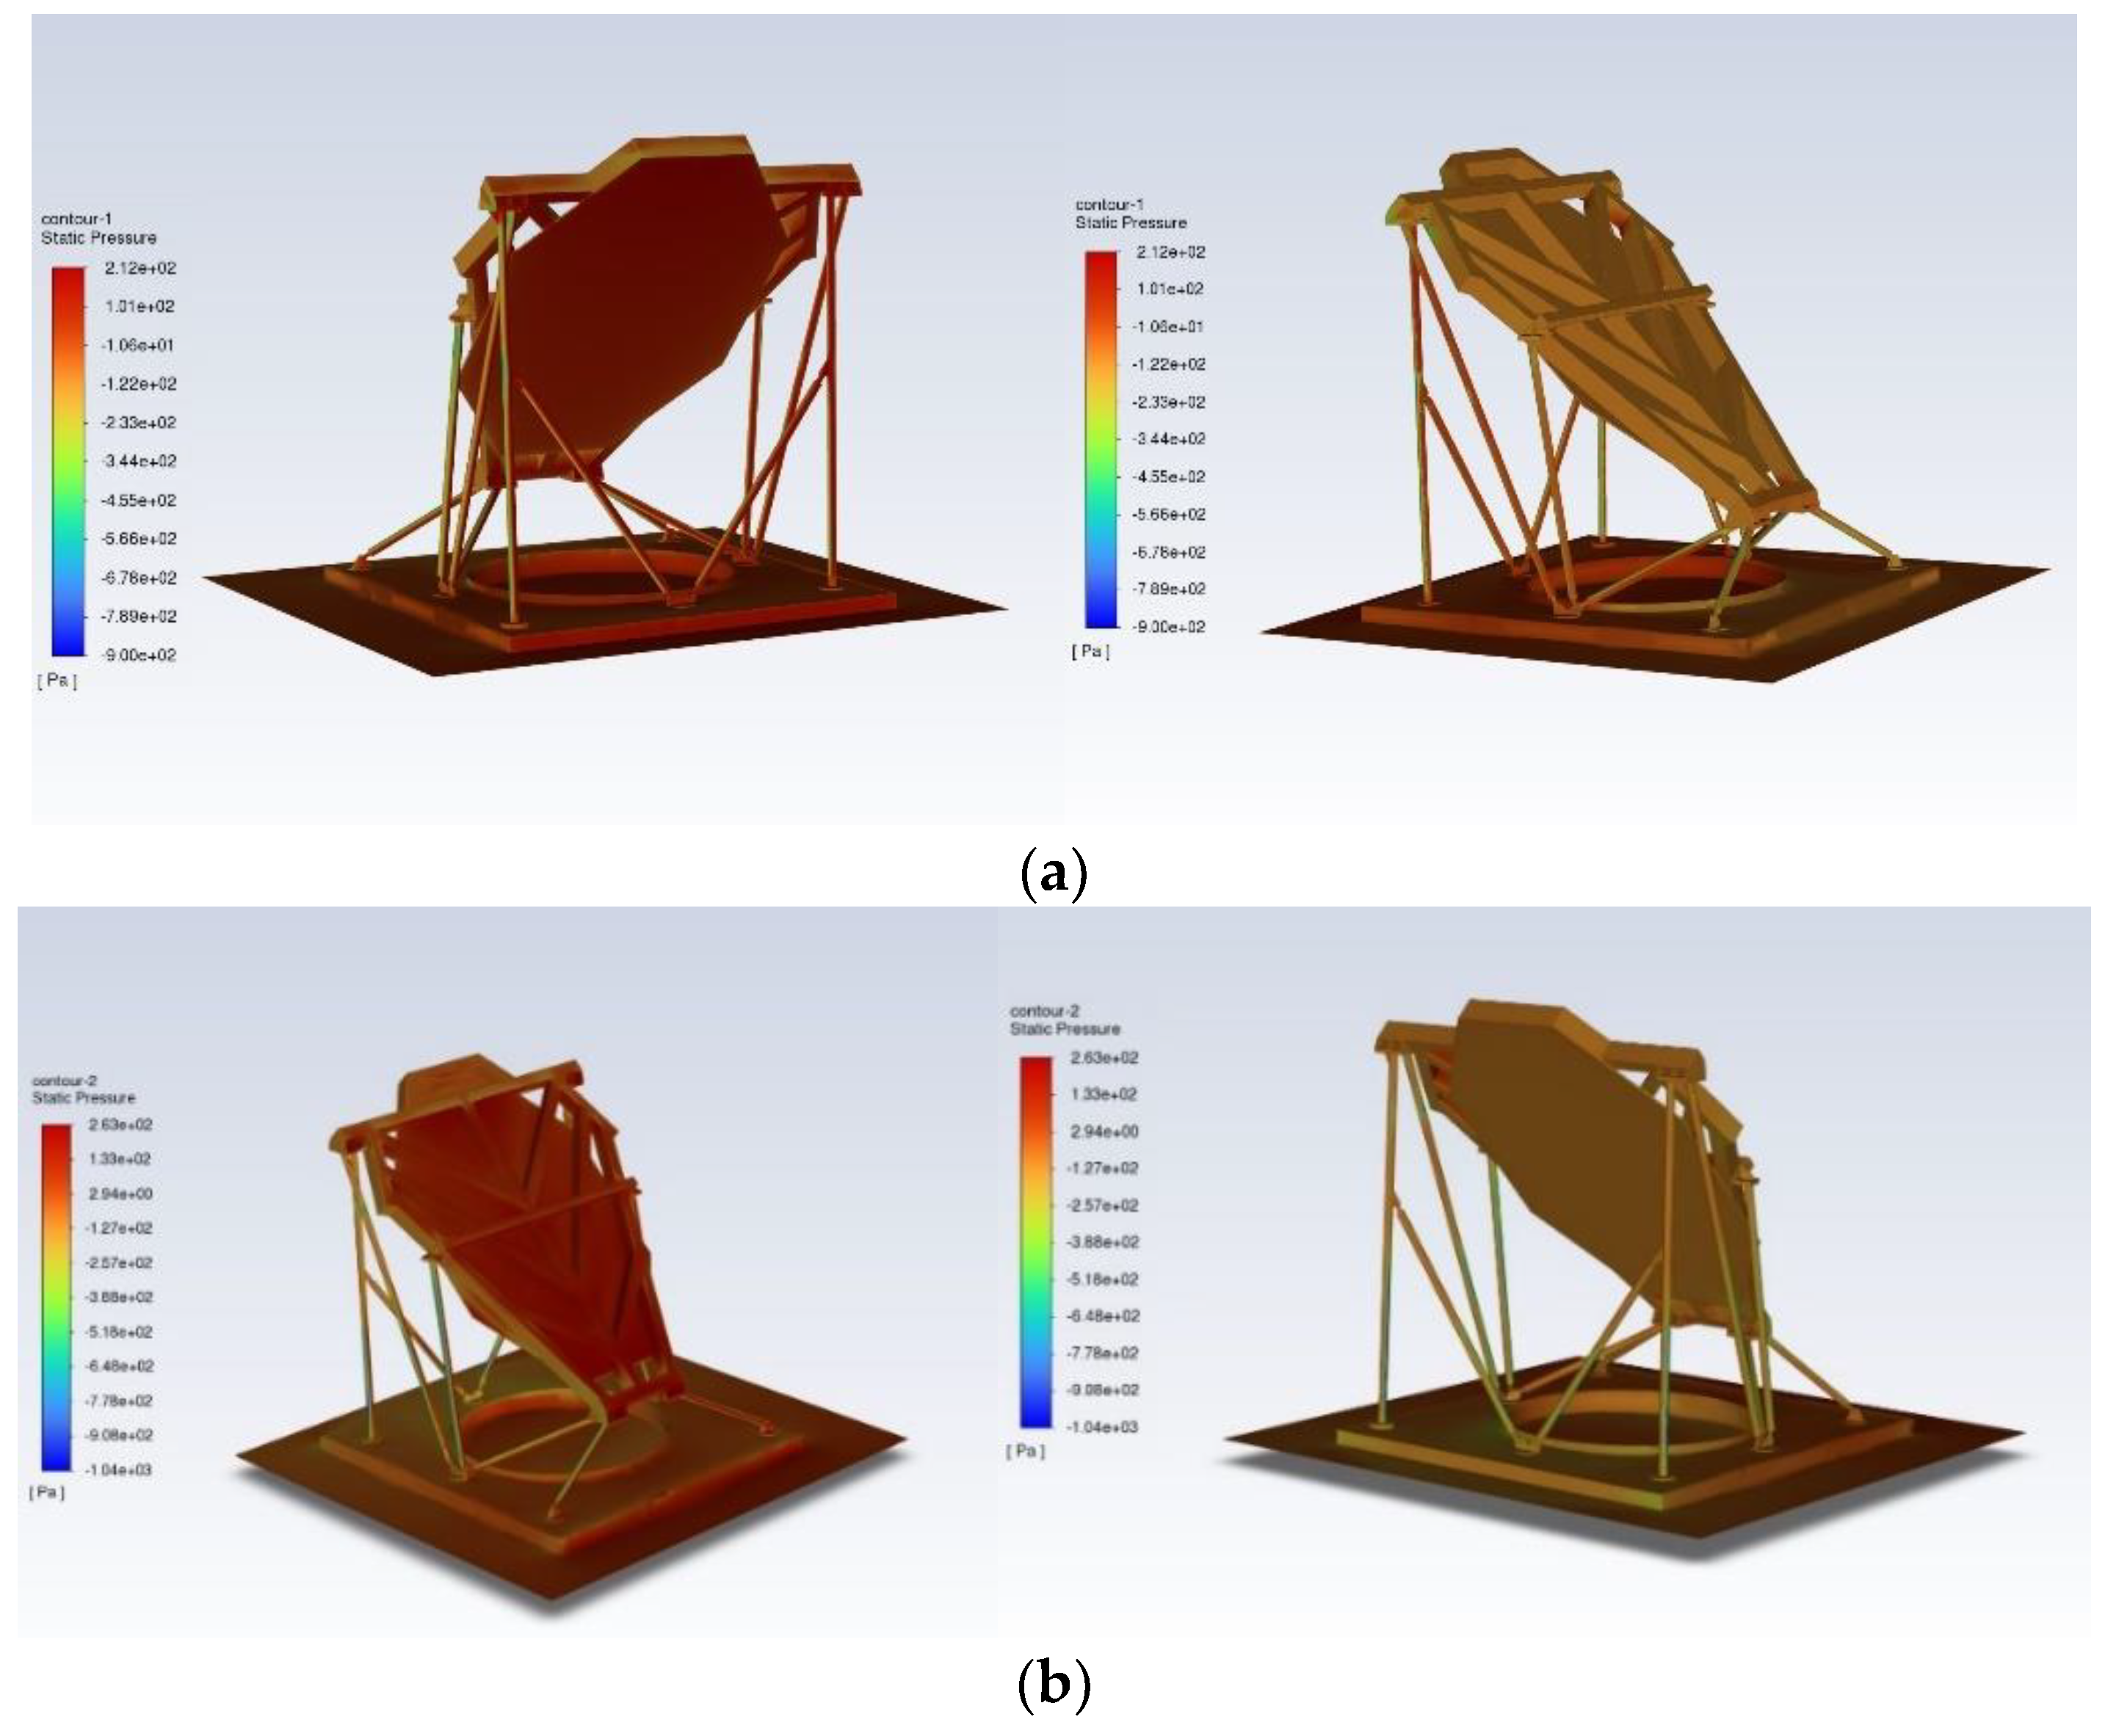
When mirror withstand the fornt wind, the pressure distribution map reveals that the front side of the reflector experiences the maximum pressure at 212 MPa. Conversely, the mirror’s backside exhibits lower pressure, which is easily attributed to the formation of small vortices on the windward side. The pressure distribution on the reflector surface, as depicted in
Figure 10, emphasizes the substantial pressure on the front side of the reflector and the windward face of the support structure during forward wind loading.
In contrast, when the wind is loaded in the back direction, the distribution map reveals that the maximum pressure on the backside of the reflector reaches 263 MPa. Additionally, the low-pressure region during backloading is more significant compared to forward loading, which should be attribute to a deflection effect of the upward tile angle.
Figure 10 illustrates that the pressure primarily concentrates on the reflector’s back side and the support structure’s windward face. Since the support structure has a smaller surface area, it is less conducive to vortex formation, resulting in the lowest pressure on the back side.
The FFF is fixed on a 3-axis rotating mount. The mount will stand straightly (without elevation tilt) when the telescope is calibrated. The elevation (EL) axis was locked up by two motors. The torque caused by wind pressure on the mirror should not be larger than the maximum load torque of the motors.
With maximum pressure of 263 MPa applied to a mirror with an area of 8.33 m², multiplied by the distance 2.925 m between center of gravity and the EL axis, and considering FFF mirror inclined at an angle of 45 degrees, maximum torque caused by wind pressure was calculated as 4,531 N· m. The EL motor reducer output torque is up to 18,945 N· m, in addition, the motor even more robust in locked state than rotating, so the mount can support the FFF in the maximum wind speed loading condition.
4. Structural Analysis
4.1. FEA Model
The finite element method was chose for FFF structural analysis. [
24]. In finite element analysis, the matrix expression for the control equations by:
Where {K} is the stiffness coefficient matrix, {x} is the displacement vector, and {F} is the force vector. In static structural analysis, assuming {F} to be a constant matrix and continuous, materials should adhere to elastic, small deformation theory. Nonlinear boundary conditions may be applied, and {F} represents the static loads applied to the model, which is independent of time variation and inertial forces [
25].
Employed a static strength analysis in ANSYS Workbench to analyze the deformation of the reflection mirror under maximum wind pressure, simultaneously evaluate the stability of the support rod structure.
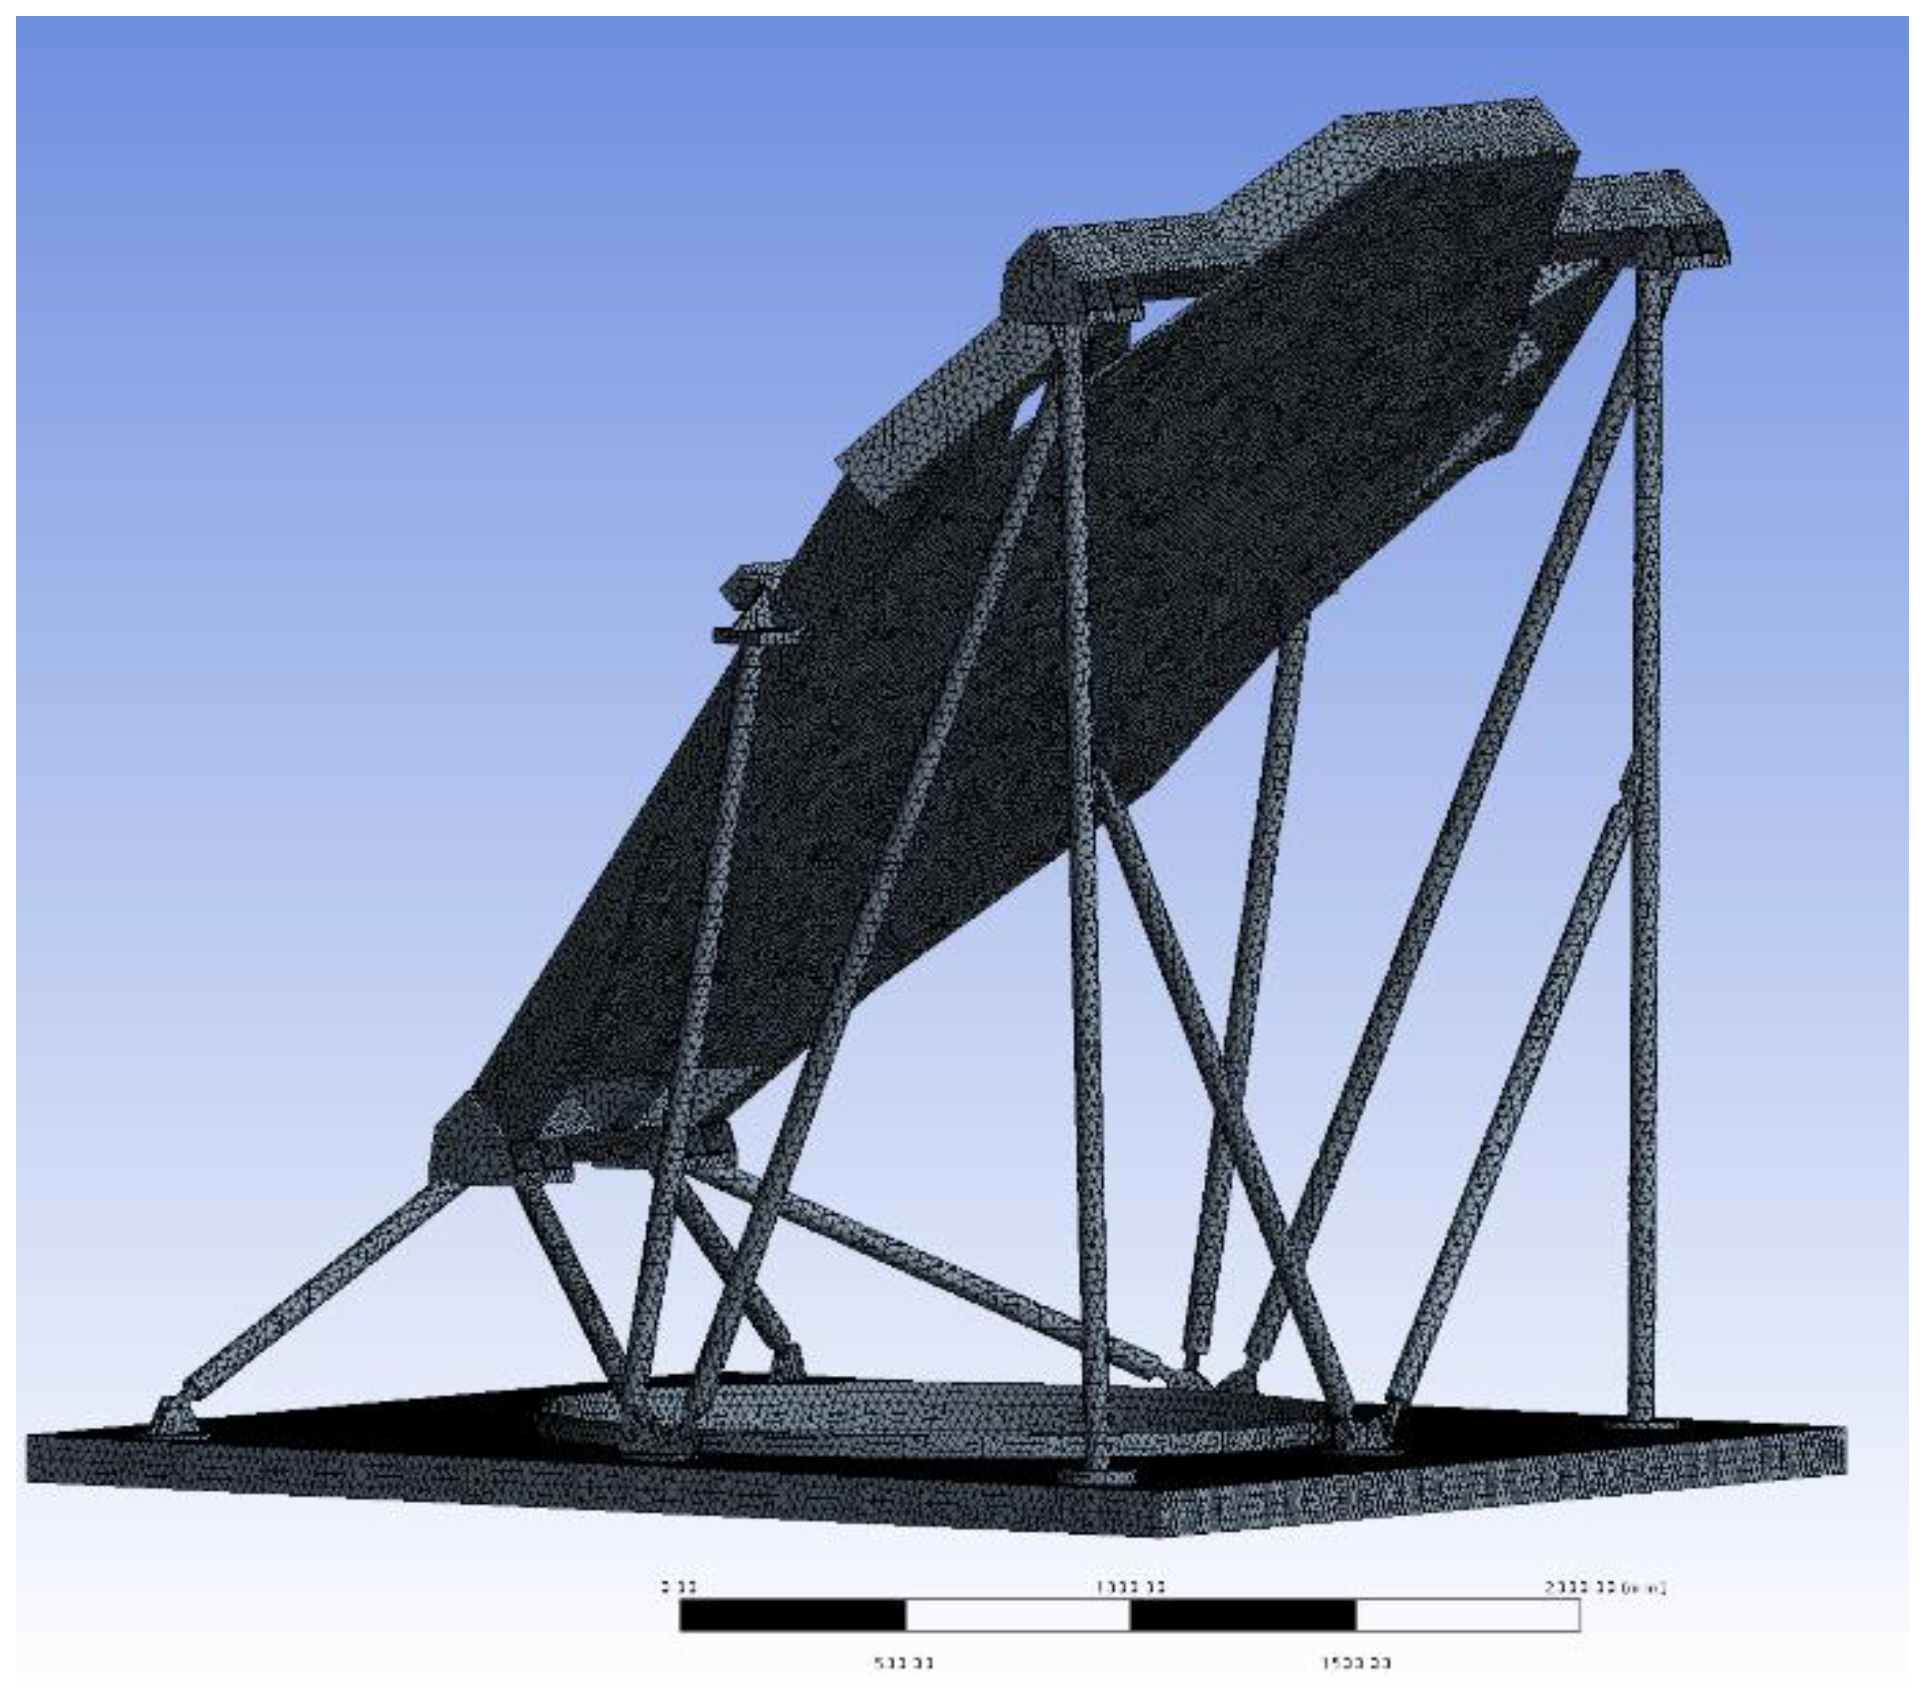
Firstly, simplify the model. Reduce the number of mesh subdivisions by removing bolts, small holes, and threads from the model to minimize the amount of numerical calculations and save time. The structural outline was effectively captured through mesh refinement in finite element analysis, and additional nodes are available for displacement and stress calculation. localized refinement to connection between the support structure of the FFF mirror and the base plate to ensure the accuracy of critical structures and to mitigate potential stress concentration points. For optimal computational performance and practical conditions, tetrahedral elements with a size of 10 mm were chosen, with denser meshing at complex connection points. The final model encompasses approximately 9 million elements and 12 million nodes, as depicted in
Figure 11.
Almost all structures within FFF are composed of aluminum alloy 6061(6061 for short), which exhibits fine corrosion resistance, mechanical properties, formability, weldability, and machinability, additionally, the superior specific strength is the most crucial factor for the lightweight design of FFF. The key parameter of which is detailed in
Table 1.
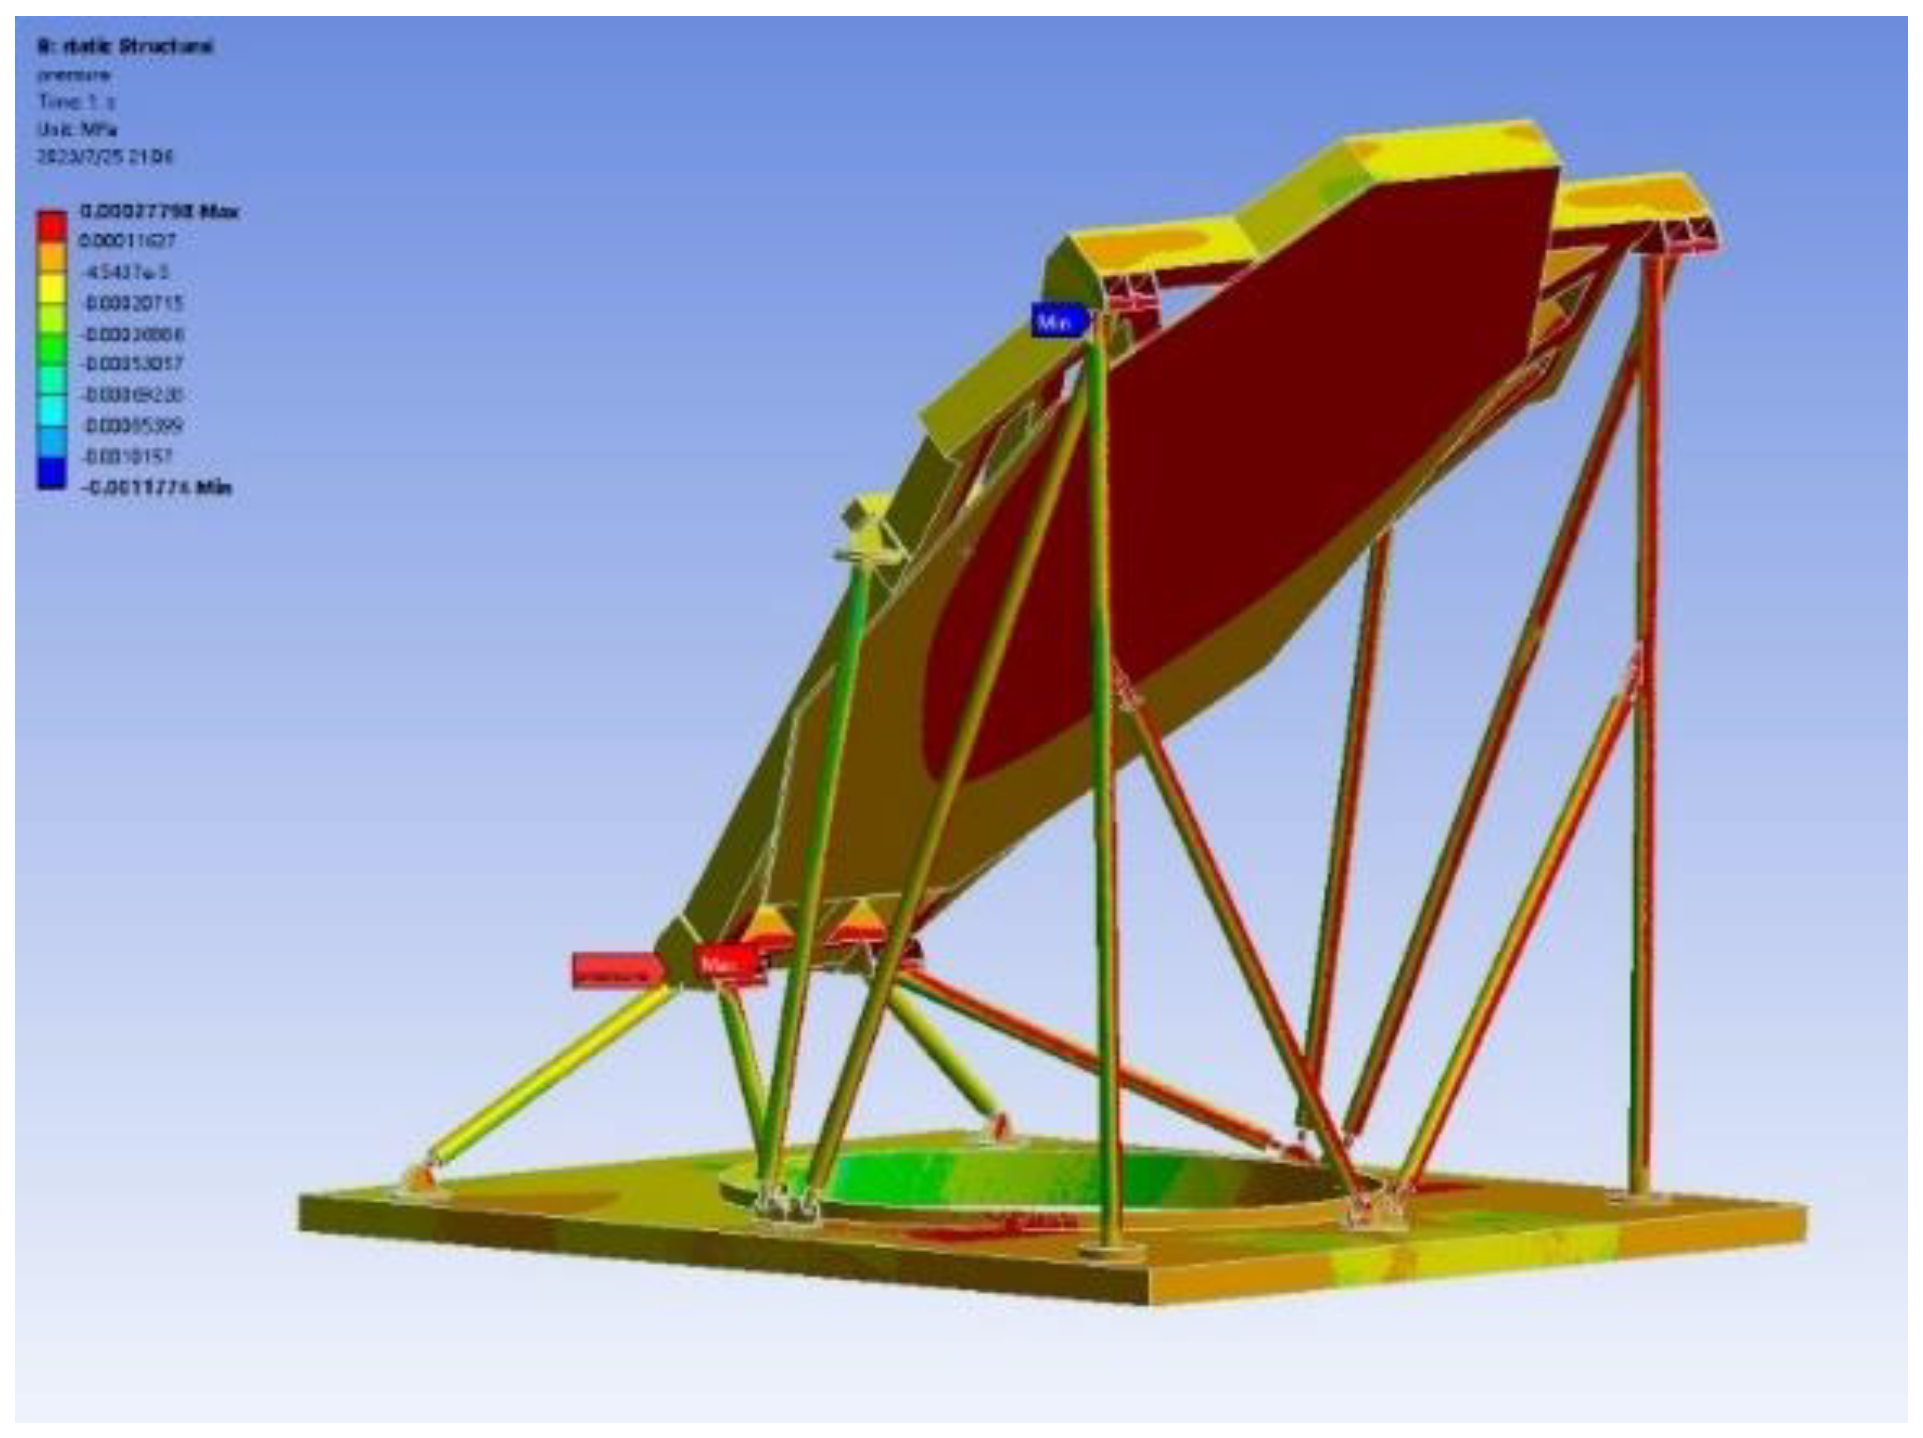
Analyse the FFF deformation and stress with forward and backward wind load with assuming the baseplate fixed, as depicted in
Figure 12. The figure shows that the surface of the FFF mirror experiences the highest pressure with the supporting bracket. This uneven pressure distribution can cause a decrease in the accuracy of the mirror’s shape. Additionally, stress concentration may occur in the Supporting bracket.
4.2. Results Analysis
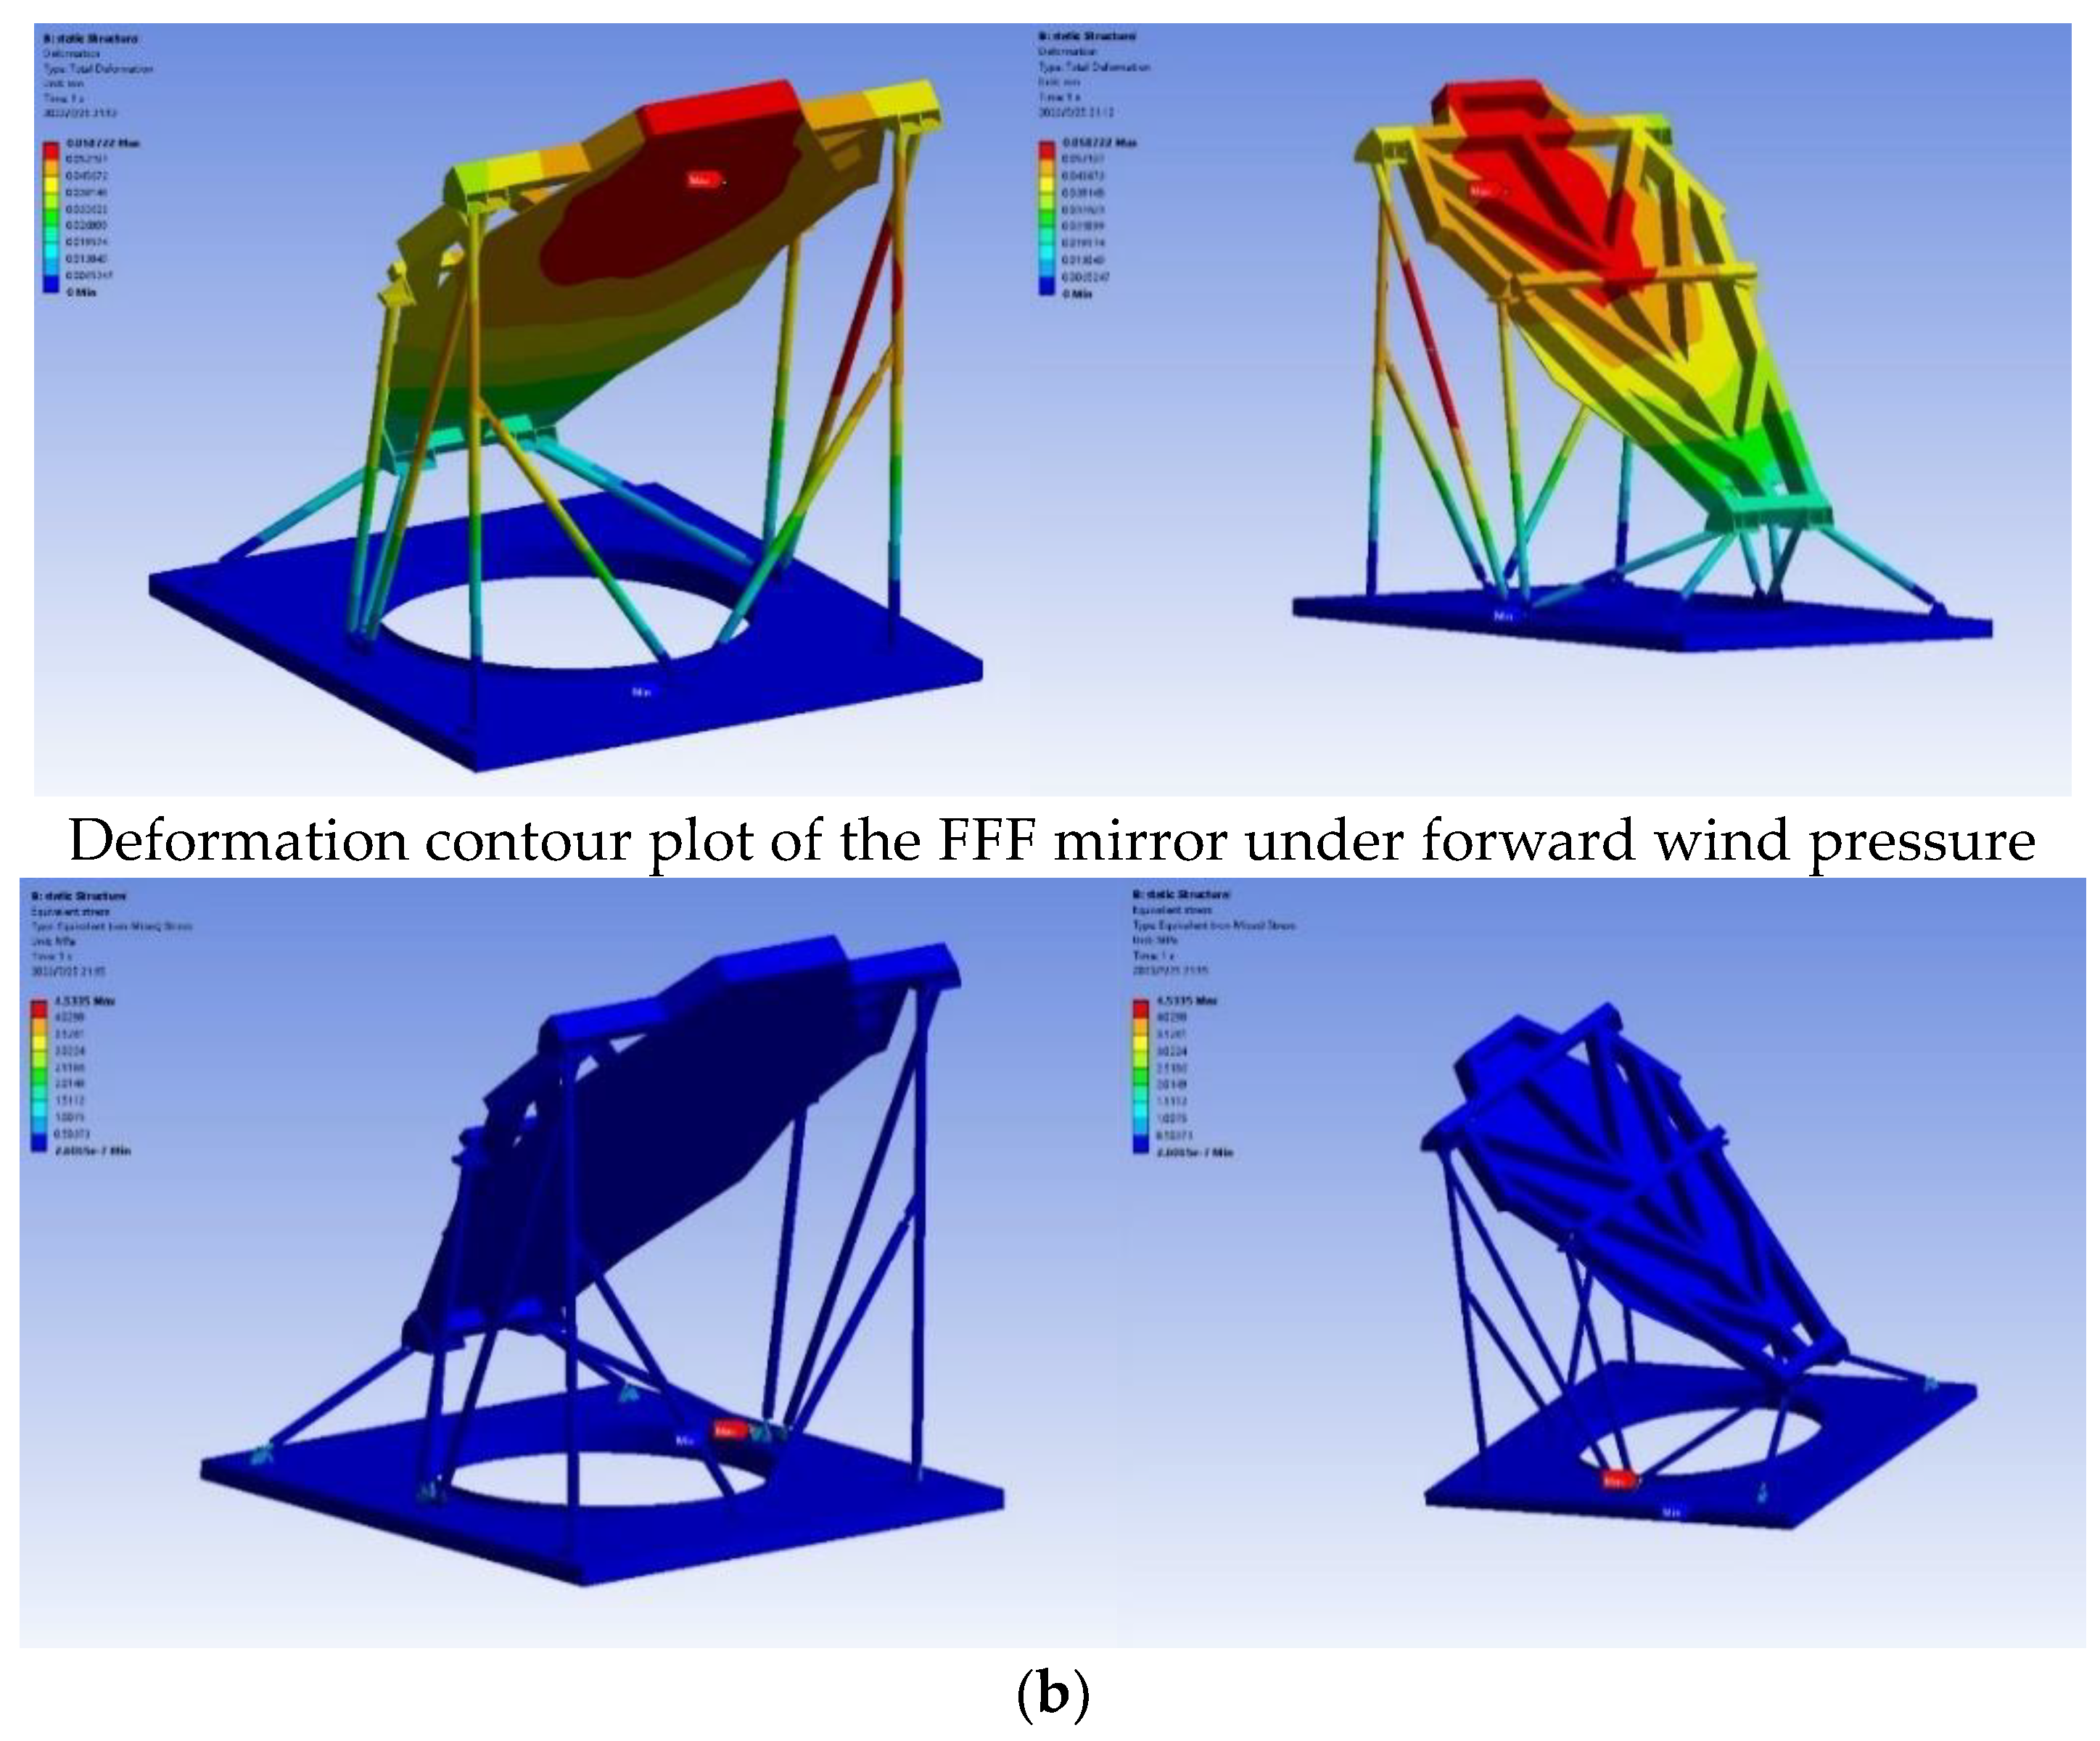
The analytical results show that the maximum FFF deformation of 0.0587mm occurs in the mirror surface under 17.5m/s wind speed applied in the font wind direction. The maximum stress on the mirror is 4.53 MPa, which appears at the connection between the support rod and the base plate, as illustrated in
Figure 13 and
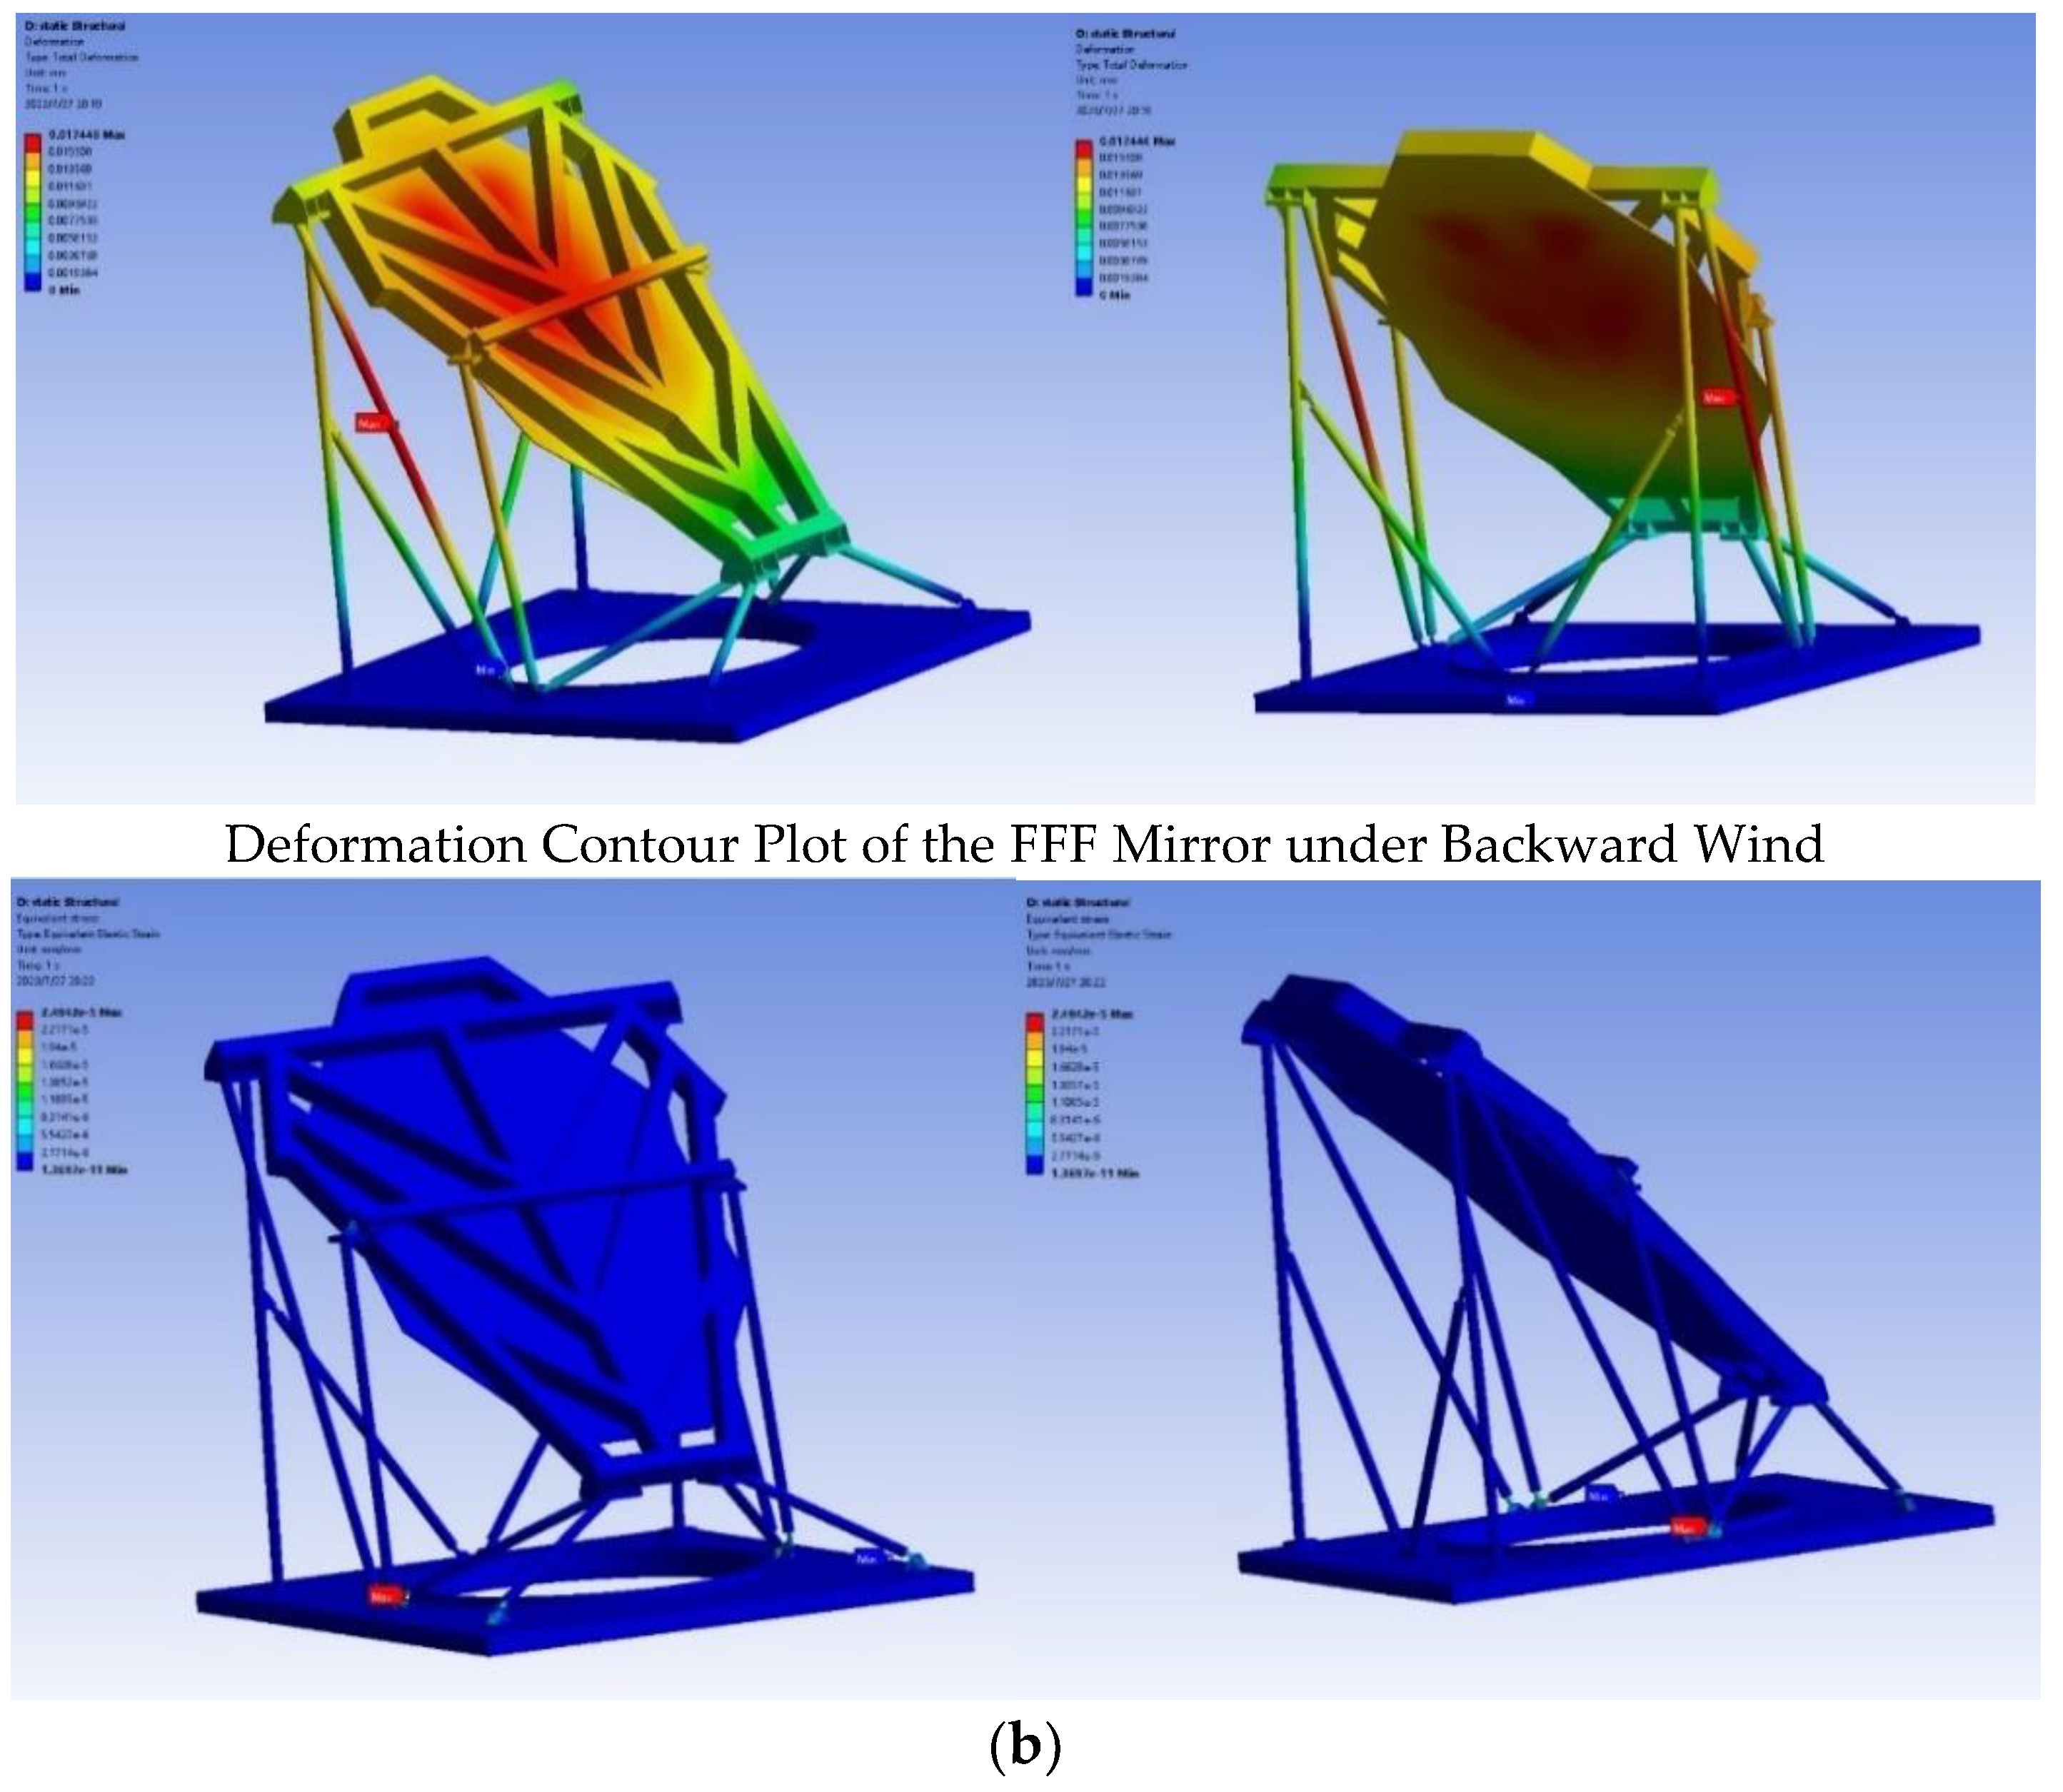
Figure 14.
The surface of the FFF mirror, measured with a three-coordinate measuring machine, indicates deformations of 0.05mm resulting from processing and self-weight. The final Root Mean Square (RMS) flatness is obtained by combining the 0.05mm with 0.0587 mm, that is 0.077 mm. This value is less than the required flatness of 0.1mm. As shown in the figure, the maximum stress of 4.53MPa is at the connection between the support bar and the mount. The material at this location is AL6061 and its yield strength is 280MPa, which shows that the FFF can be used normally without damage in this extreme working condition. Maximum deformation and stress in back word wind pressure have even lesser influence on the FFF. The result showed that the telescope can be calibrated in this extreme operating condition.
This study employed a boundary condition of an instantaneous wind speed of 17.5 m/s, which occurred only at specific times in last three years: 5:53 a.m. on January 13, 2020, and 2:19 a.m. on January 14, 2020, normally be chosen weather with relatively low winds for calibration work even for personal safety. Furthermore, the maximum wind speeds are from wind directions of 40 degrees southeast, not in the vertical direction of the FFF mirror, which will have a lesser influence on the mirror. So, actually, the deformation of the FFF mirror is smaller compared to the analyzed conditions.
5. Structural Analysis of the Connection
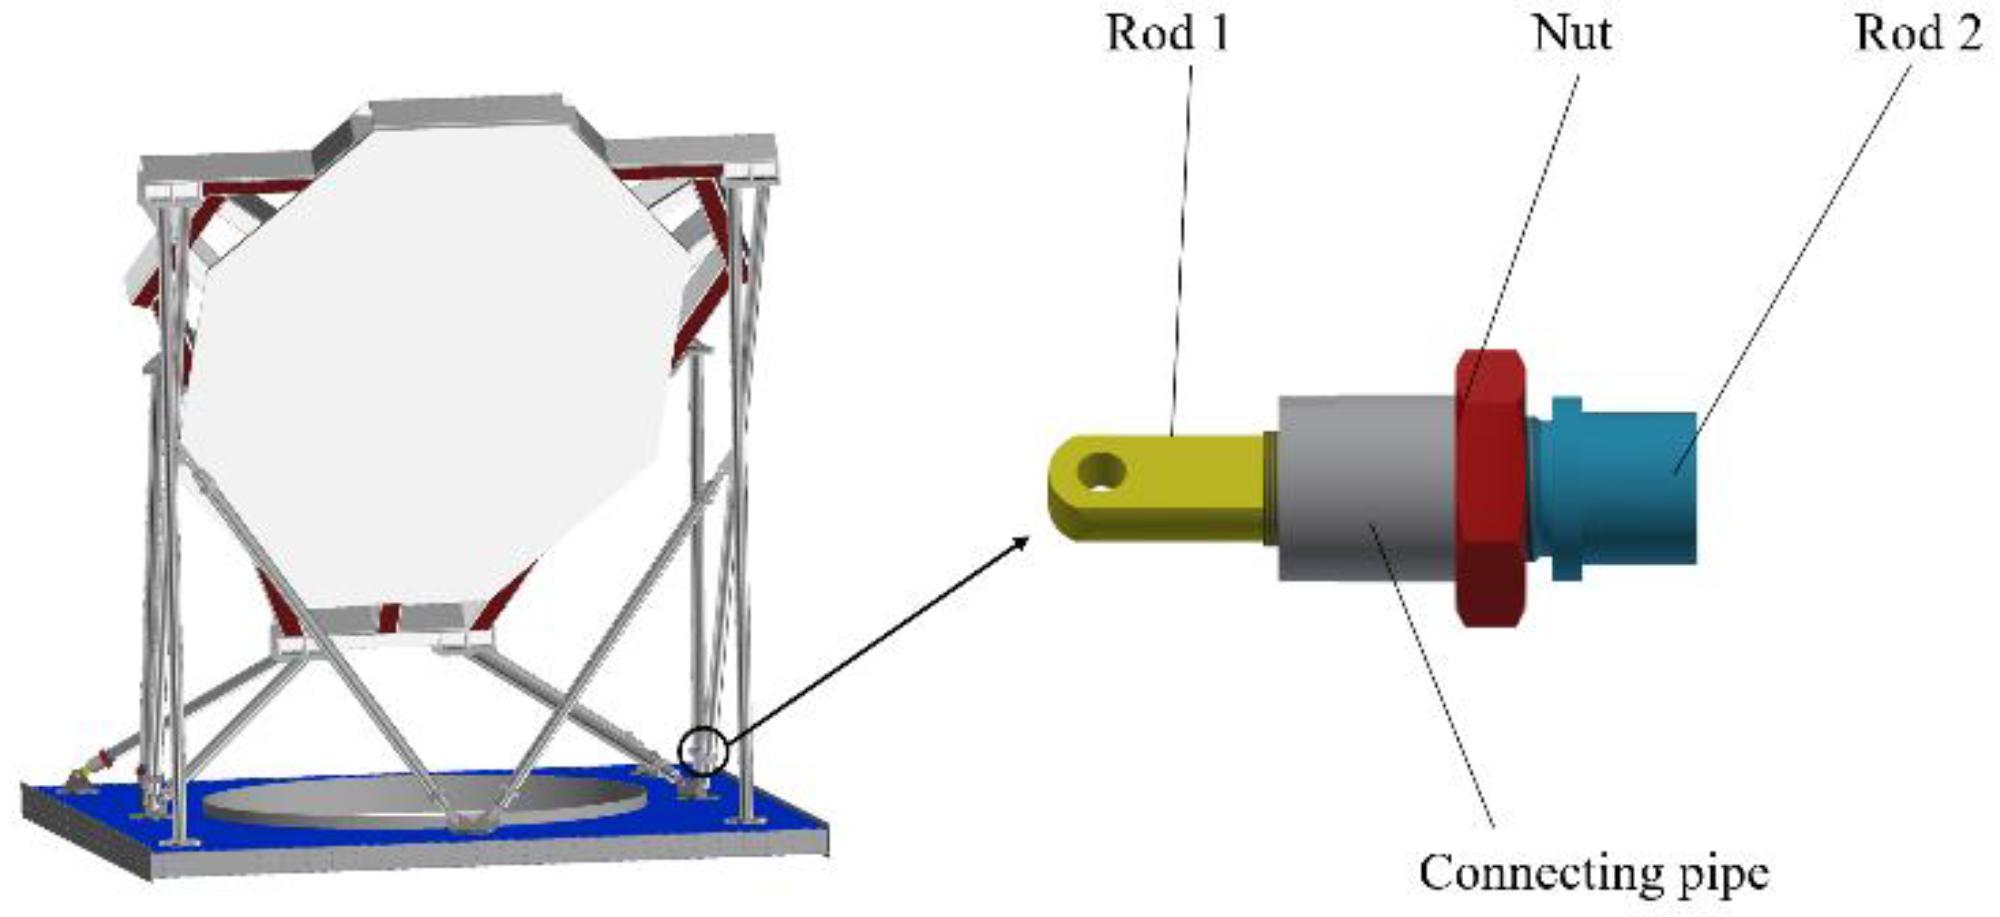
In the overall analysis, the connection structure of the FFF mirror has been simplified. This structure has a connecting pipe threaded to rod 1 and rod 2, as showed in
Figure 15. the tilt angle of the FFF mirror is controlled by adjusting the coordination between the connecting pipe and the two rods. A detailed analysis and calculation of the connection structure are required.
The nut act to lock the thread, so it’s simplified in the calculation of the connection structure. Instead, the threads on each rod were simplified by using contact types. The material chosen for the connection structure is 6061.
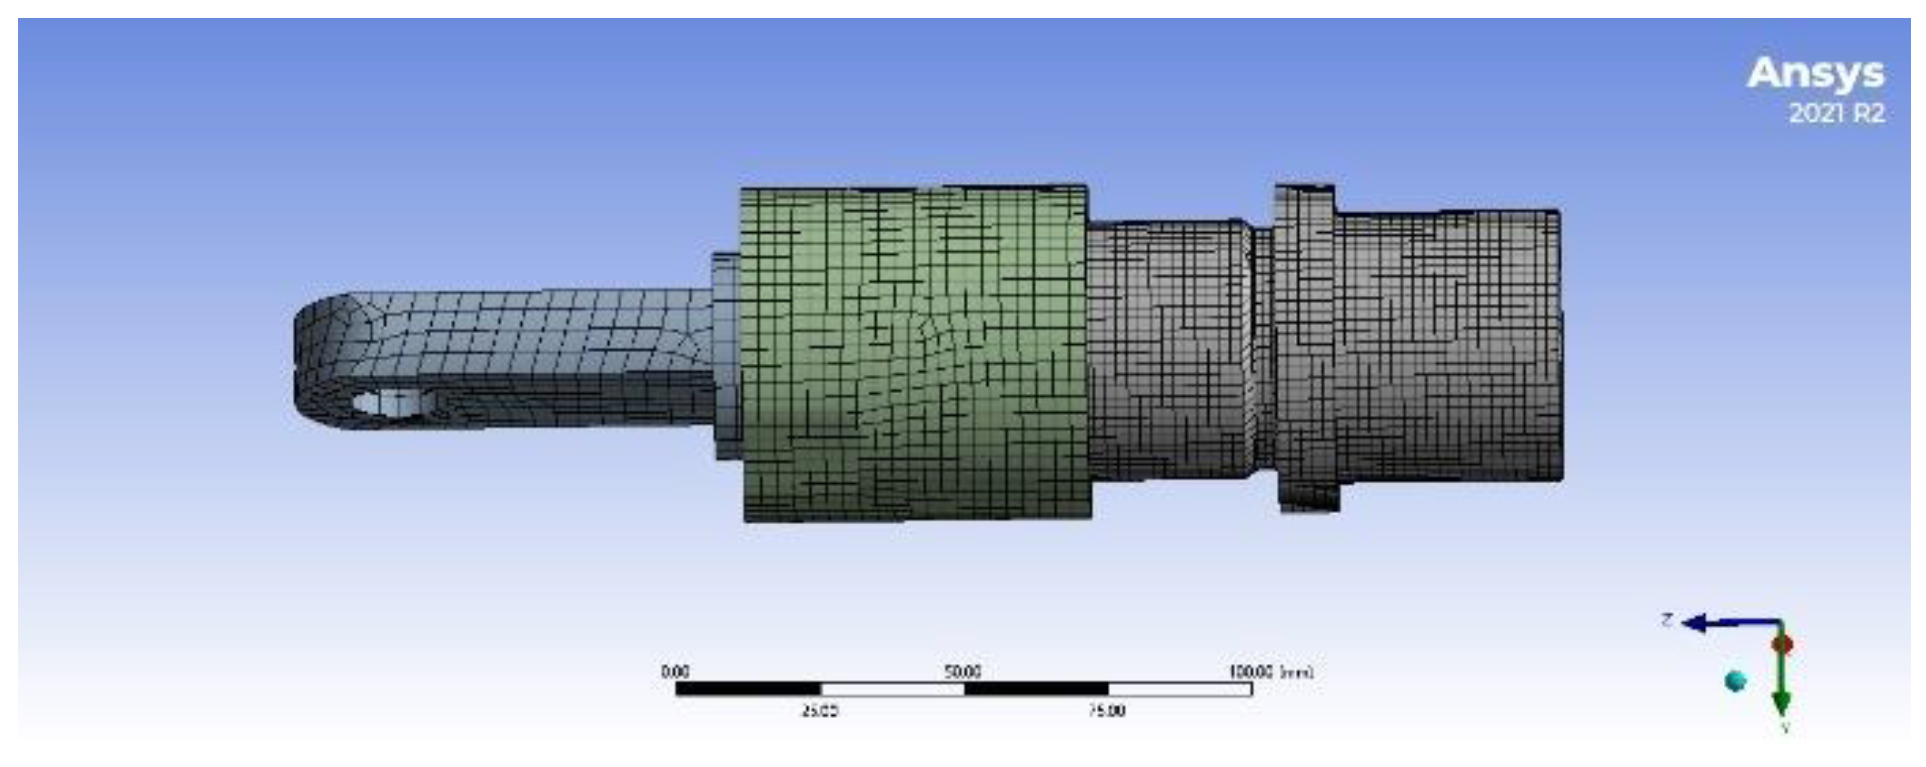
Mesh the model primarily using hexahedral grid elements with size of 3mm. 27,471 mesh elements and 112,932 nodes were yielded, and the mesh quality exceeding 0.85, as illustrated in
Figure 16.
Concerning boundary conditions, it was chosen to fix the inner wall of the hole on Rod 1, subjecting it fully constrained.
To investigate the structural strength of the connecting structure under wind load, as previously studied, the maximum displacement of the support rod under wind load is 0.05 mm, set as displacement load in Y-direction on rod2.
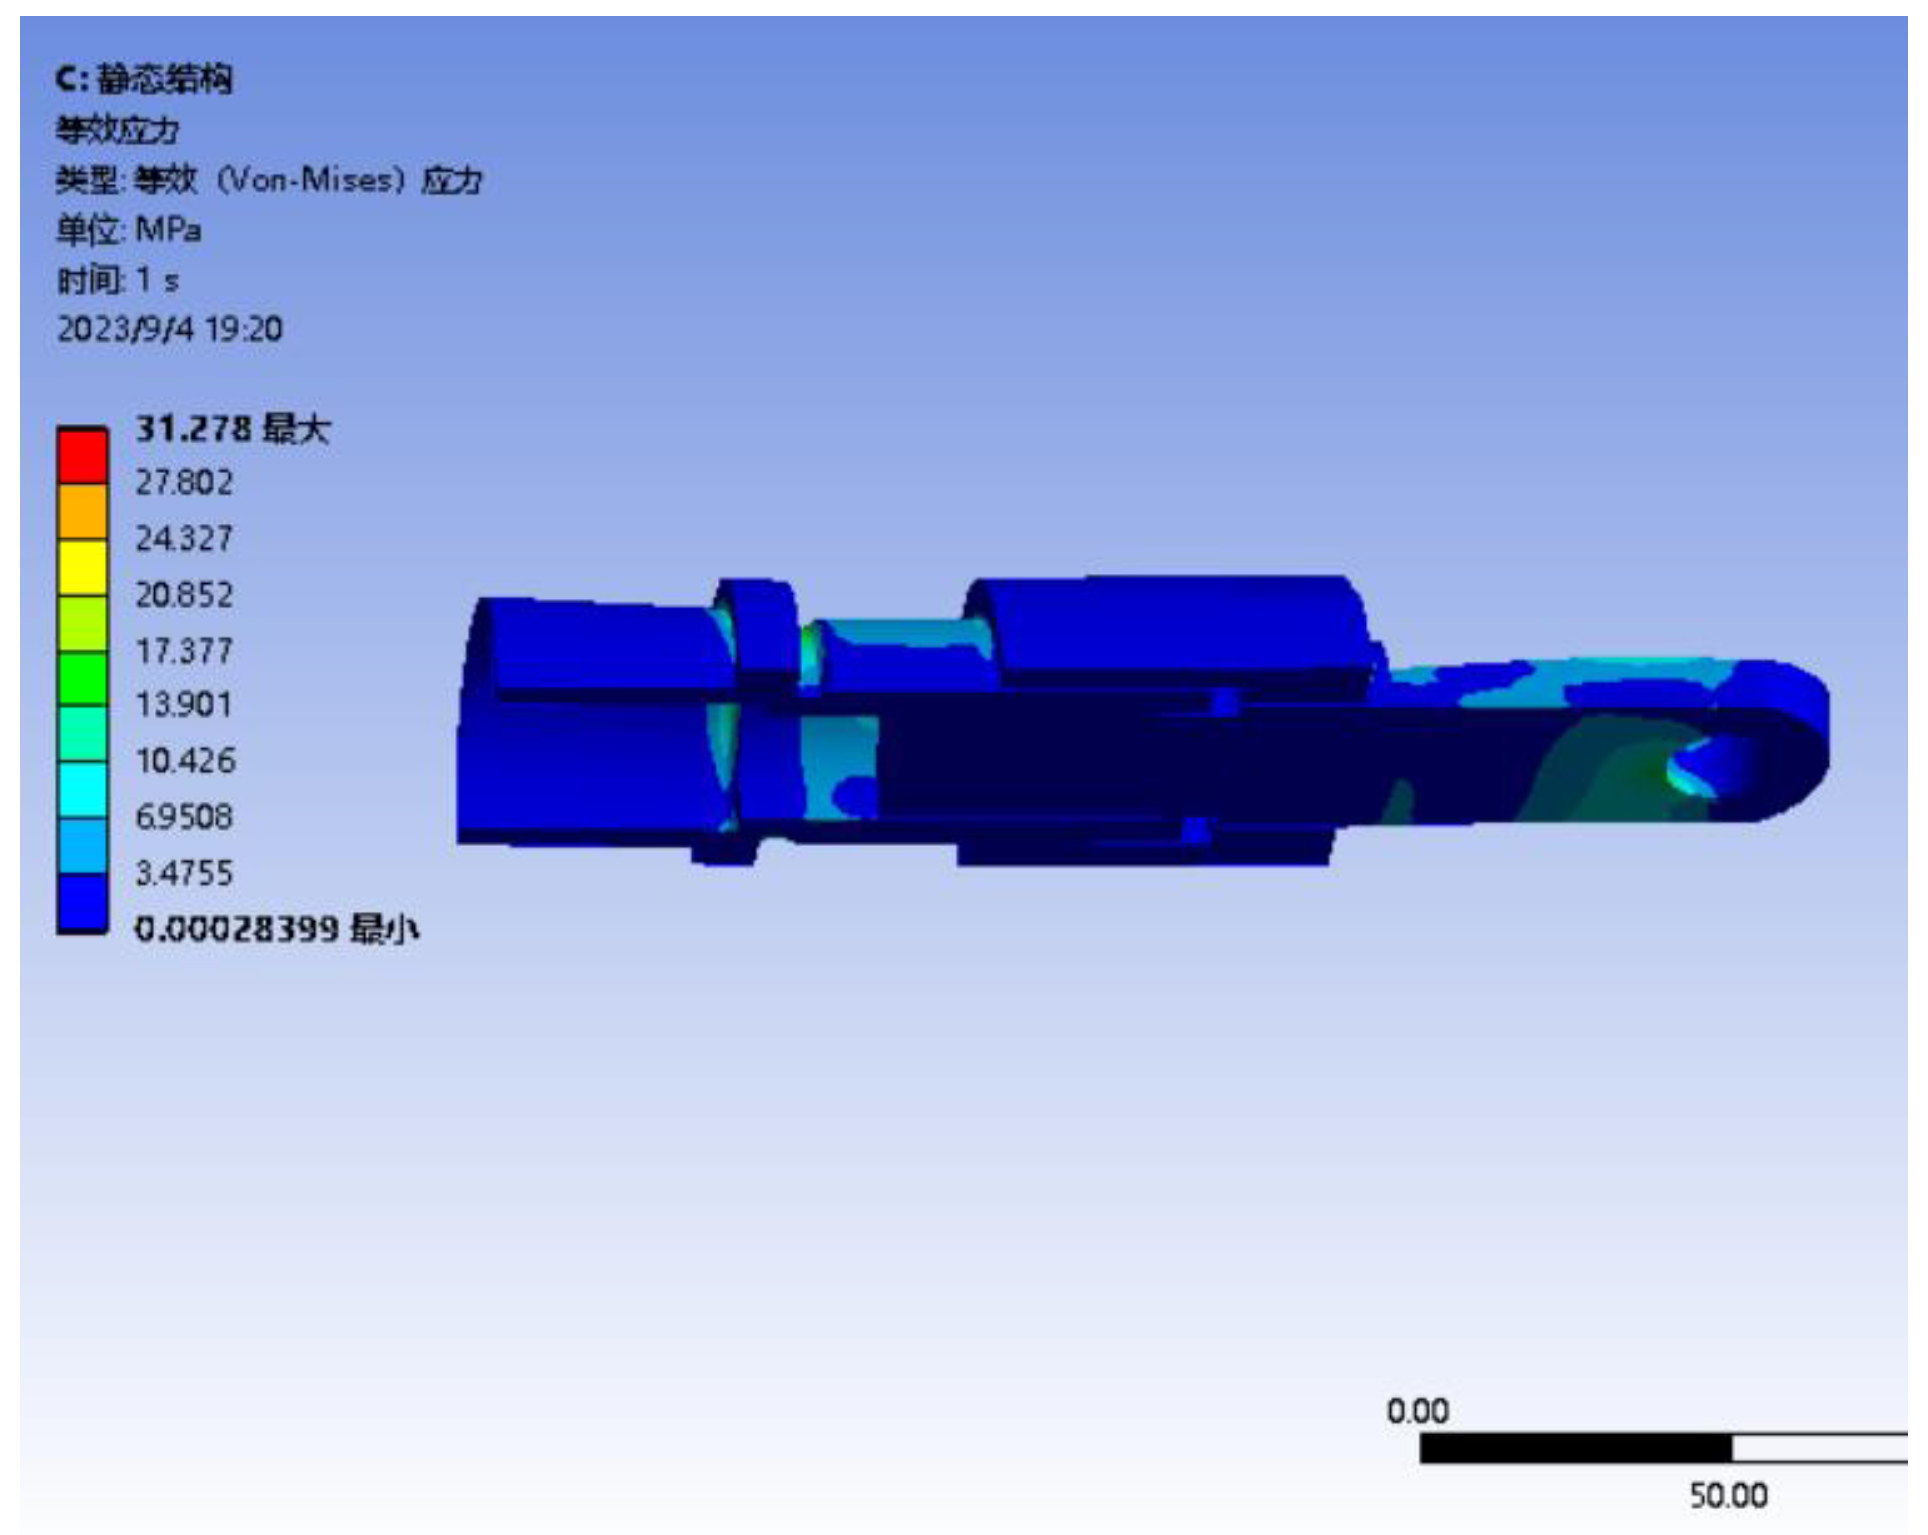
The analysis results shown in
Figure 17. The maximum stress within the connecting structure is 31.27MPa, located in the relief notch of Rod 1, and presented as concentration of stresses in root corner. Yield strength of 6061(280MPa) is eight times to the maximum stress, so it can conclude that this connecting structure remains safe under actual working conditions according to the principles of the Fourth Strength Theory.
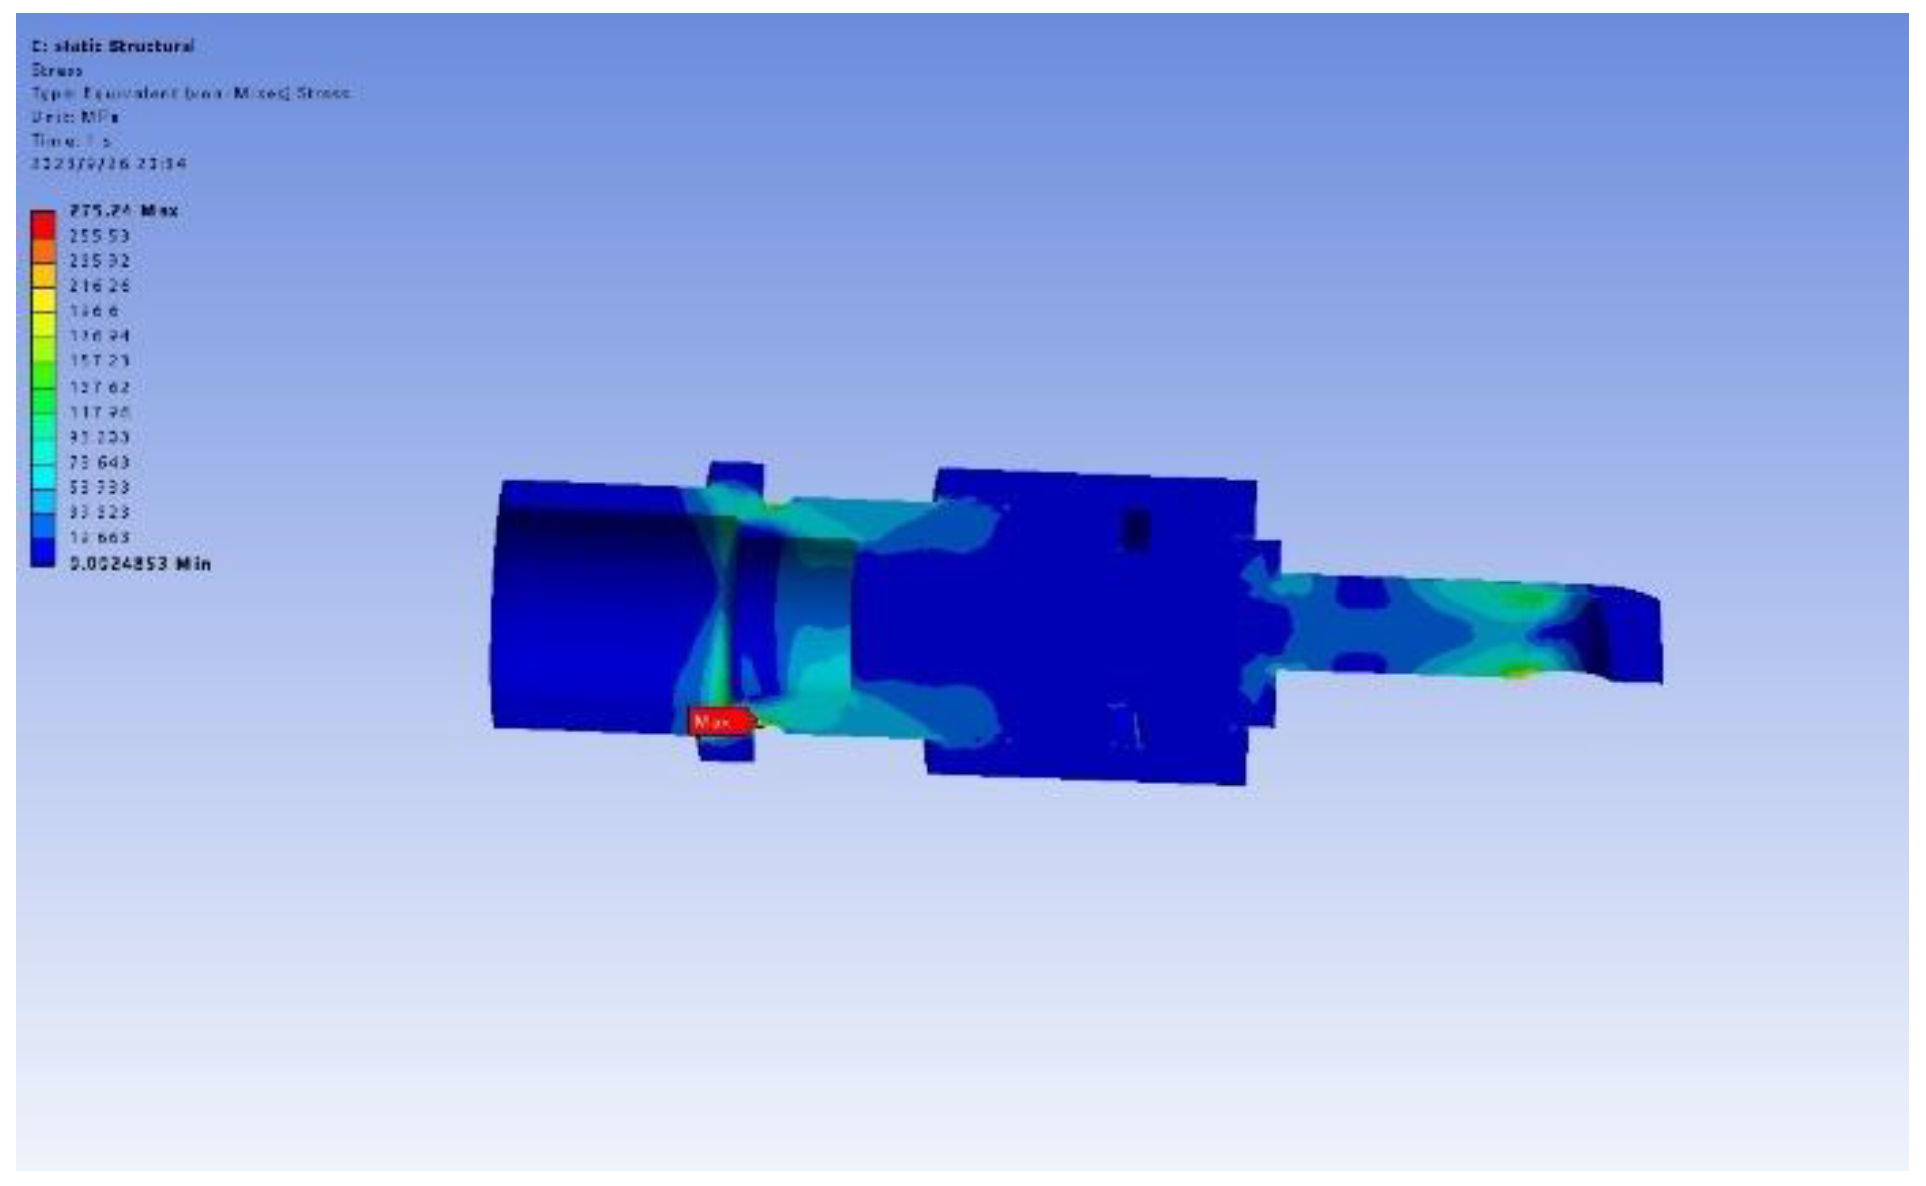
Conducted a failure analysis to investigate the ultimate strength of the connection structure by increased displacement load. When the displacement reached 0.45 mm, the stress exceeded the material’s ultimate strength(281.5MPa), that means the structure deformation cannot be restored.
Figure 18 illustrates the stress distribution contour plot at a displacement of 0.44mm. The maximum stress still appears at the relief notch, and the region of elevated stress in rod 1 extends from the relief notch to the threaded area. Therefore, the thickness of the pipe should be increased if it is to be used in these extreme conditions.
6. Conclusion
Analysed the far field flat in simulated environment of AliCPT-1 observatory using fluid-structure coupling FEA. The following conclusions can be drawn:
(1). The FFF structure was designed and ensured safety, stability with low cost. Furthermore, the installation and precise-adjusting plan is straightforward and convenient. When in a static state, the mirror demonstrates a high level of flatness. Even under extreme wind loads, the mirror’s deformation is small. The overall impact on flatness is below λ/20 that satisfy the requirement of a flatness.
(2). Under the maximum wind load, the safety factors of the mirror, mirror support frame structure, and support rods exceed 8. The torque impact on the mount EL axis caused by the wind load remains within motor reducers’ capacity. The analysis results demonstrate the safety and reliability of the FFF system under the influence of both gravity and wind pressure loads.
(3). The connecting structure between rods and the baseplate was analyzed, and optimization advises to the local structure are proposed.
(4). A comprehensive analysis of wind speed and wind direction at the observation station has been conducted. This analysis provides important reference value for on-site observation and calibration.
Author Contributions
Conceptualization,J.C.; methodology,J.C; ; Software,J.C; writing-original draftpreparation,J.C; supervision.A.Z; project administration,A.Z; All authors have read and agreed to the published version of the manuscript.
Funding
This work was funded by National Key R&D Program of China (Grant No. 2020YFC2201604).
Data Availability Statement
Not applicable
Acknowledgments
The authors would like to thank the National Science Foundation of China for the financial support, as the works were performed under contract.
Conflicts of Interest
The authors declare no conflict of interest in this work. We advise that we do not have any commercial or associative interest that represents a conflict of interest in connection with the work submitted.
References
- Penzias, A. A.; Wilson, R. W. A Measurement of Excess Antenna Temperature at 4080 Mc/s. Astrophysical Journal 1965, 142, 419-421. [CrossRef]
- Bernardis, P. D.; Masi, S. The cosmic microwave background: Observing directly the early universe. Proceedings of SPIE - The International Society for Optical Engineering 2012, 8442.
- Li, H.; Li, S.-Y.; Liu, Y., et al. Probing primordial gravitational waves: Ali CMB Polarization Telescope. National Science Review 2019, 6, 145-154. [CrossRef]
- Ghosh, S.; Liu, Y.; Zhang, L., et al. Performance forecasts for the primordial gravitational wave detection pipelines for AliCPT-1. Journal of Cosmology and Astroparticle Physics 2022. [CrossRef]
- Han, J.; Hu, B.; Ghosh, S., et al. Forecasts of CMB lensing reconstruction of AliCPT-1 from the foreground cleaned polarization data. Journal of Cosmology and Astroparticle Physics 2023. [CrossRef]
- Wang, Z.; Yao, J.; Liu, X., et al. Forecast of cross-correlation of Chinese Survey Space Telescope cosmic shear tomography with Ali CMB Polarization Telescope cosmic microwave background lensing. Monthly Notices of the Royal Astronomical Society 2023, 523, 3001-3017. [CrossRef]
- Salatino, M.; Austermann, J. E.; Thompson, K. L., et al. The design of the Ali CMB Polarization Telescope receiver. Conference on Millimeter, Submillimeter, and Far-Infrared Detectors and Instrumentation for Astronomy X 2020, 11453.
- Liu, J.; Sun, Z.; Han, J., et al. Forecasts on CMB lensing observations with AliCPT-1. Science China-Physics Mechanics & Astronomy 2022, 65. [CrossRef]
- Banerjee, P. P.; Poon, T. C., Principles of applied optics. Principles of applied optics: 2015.
- Helmy, K. A. MHD unsteady free convection flow past a vertical porous plate. Zeitschrift Fur Angewandte Mathematik Und Mechanik 1998, 78, 255-270.
- Javed, T.; Abbas, Z.; Hayat, T., et al. Homotopy Analysis for Stagnation Slip Flow and Heat Transfer on a Moving Plate. Journal of Heat Transfer-Transactions of the Asme 2009, 131. [CrossRef]
- Wansophark, N.; Dechaumphai, P. Combined adaptive meshing technique and segregated finite element algorithm for analysis of free and forced convection heat transfer. Finite Elements in Analysis and Design 2004, 40, 645-663. [CrossRef]
- Kleinstreuer, C. Modern fluid mechanics. Basic theory and selected applications in macro- and micro-fluidics. Fluid Mechanics & Its Applications 2010, 87.
- Kleinstreuer, C. Modern Fluid Dynamics. Fluid Mechanics & Its Applications 2012, 87.
- Fletcher; Clive, A. J., Computational Techniques for Fluid Dynamics : Specific Techniques for Different Flow Categories : 1. Computational Techniques for Fluid Dynamics : Specific Techniques for Different Flow Categories : 1: 1991.
- Biswas, N.; Mukherjee, S.; Roy, D. K. S. Fluid-structure interaction analysis on the response of open-top, squat, circular tank due to wind-driven rain. Materials Today: Proceedings 2023. [CrossRef]
- Echi, S.; Bouabidi, A.; Driss, Z., et al. CFD simulation and optimization of industrial boiler. Energy 2019, 169, 105-114. [CrossRef]
- Bairagi, A. K.; Dalui, S. K. Wind environment around the setback building models. Building Simulation 2021, 14, 1525-1541. [CrossRef]
- Khalilzadeh, A.; Ge, H.; Ng, H. D. Effect of turbulence modeling schemes on wind-driven rain deposition on a mid-rise building: CFD modeling and validation. Journal of Wind Engineering and Industrial Aerodynamics 2019, 184, 362-377. [CrossRef]
- Xie, Q.; Guo, X.; Xie, J., et al. Numerical Simulation of Free Jet Based on Gas Kinetic Scheme. Journal of Engineering Thermophysics 2019, 40, 1498-1502.
- Uddin, M. H.; Coronella, C. J. Effects of grid size on predictions of bed expansion in bubbling fluidized beds of Geldart B particles: A generalized rule for a grid-independent solution of TFM simulations. Particuology 2017, 34, 61-69. [CrossRef]
- Zhu, S.; Li, G.; Li, Z., et al. Study on the wake characteristics of horizontal axis tidal current turbine. Renesable Energy Resources 2022, 40, 278-284.
- Villalpando, F.; Reggio, M.; Ilinca, A. Assessment of Turbulence Models for Flow Simulation around a Wind Turbine Airfoil. Modelling and Simulation in Engineering 2011, 2011, 1-8. [CrossRef]
- Boresi, A. P.; Chong, K. P.; Lee, J. D., Elasticity in engineering mechanics (boresi/elasticity in engineering mechanics 3e) || theory of deformation. Elasticity in engineering mechanics (boresi/elasticity in engineering mechanics 3e) || theory of deformation: 1987.
- Abid, M.; Maqsood, S.; Wajid, H. A. Comparative Modal Analysis of Gasketed and Nongasketed Bolted Flanged Pipe Joints: FEA Approach. Advances in Mechanical Engineering 2012, 2012, 1945-1948. [CrossRef]
Figure 1.
Relative position of the calibration source and the Ali site.
Figure 1.
Relative position of the calibration source and the Ali site.
Figure 2.
The FFF is installed on the mount structure.
Figure 2.
The FFF is installed on the mount structure.
Figure 3.
Far-field flat mirror structure.
Figure 3.
Far-field flat mirror structure.
Figure 4.
Geometric model of the Ali site and the telescope.
Figure 4.
Geometric model of the Ali site and the telescope.
Figure 5.
Computational domain representation.
Figure 5.
Computational domain representation.
Figure 6.
Computational domain representation.
Figure 6.
Computational domain representation.
Figure 7.
Optimized mesh of the simulation model.
Figure 7.
Optimized mesh of the simulation model.
Figure 8.
The wind speed data statistics. (a) Wind rose chart depicting wind speed magnitude and direction, (b) Cumulative histogram illustrating the occurrence of wind speed magnitudes.
Figure 8.
The wind speed data statistics. (a) Wind rose chart depicting wind speed magnitude and direction, (b) Cumulative histogram illustrating the occurrence of wind speed magnitudes.
Figure 9.
Pressure distribution maps of the FFF mirror Under wind loading: (a) Pressure contour plot under wind from the front, (b) Pressure contour plot for wind from the back, (c) Streamline plot for wind from the front, (d) Streamline plot for wind from the back.
Figure 9.
Pressure distribution maps of the FFF mirror Under wind loading: (a) Pressure contour plot under wind from the front, (b) Pressure contour plot for wind from the back, (c) Streamline plot for wind from the front, (d) Streamline plot for wind from the back.
Figure 10.
Pressure distribution maps on the reflective mirror surface after applying pressure: (a) Pressure contour plot for wind from the front, (b) Pressure contour plot for wind from the back.
Figure 10.
Pressure distribution maps on the reflective mirror surface after applying pressure: (a) Pressure contour plot for wind from the front, (b) Pressure contour plot for wind from the back.
Figure 12.
Distribution of pressure loads.
Figure 12.
Distribution of pressure loads.
Figure 13.
Stress contour plot of the FFF mirror under forward wind pressure.
Figure 13.
Stress contour plot of the FFF mirror under forward wind pressure.
Figure 14.
Stress Contour Plot of the FFF Mirror under Backward Wind.
Figure 14.
Stress Contour Plot of the FFF Mirror under Backward Wind.
Figure 15.
Connecting structure.
Figure 15.
Connecting structure.
Figure 16.
Connecting structure of the support rod.
Figure 16.
Connecting structure of the support rod.
Figure 17.
Stress contour plot in displacement load of 0.05mm.
Figure 17.
Stress contour plot in displacement load of 0.05mm.
Figure 18.
Stress contour plot in displacement load of 0.44mm.
Figure 18.
Stress contour plot in displacement load of 0.44mm.
Table 1.
AL6061 Material Properties.
Table 1.
AL6061 Material Properties.
| Parameters |
Title 1 |
| Density (t/mm3) |
2.77x10⁻⁹
|
| Young’s Modulus (MPa) |
71000 |
| Poisson’s ratio |
0.33 |
| Tensile Yield Strength (MPa) |
280 |
| Tensile Ultimate Strength |
310 |
|
Disclaimer/Publisher’s Note: The statements, opinions and data contained in all publications are solely those of the individual author(s) and contributor(s) and not of MDPI and/or the editor(s). MDPI and/or the editor(s) disclaim responsibility for any injury to people or property resulting from any ideas, methods, instructions or products referred to in the content. |
© 2024 by the authors. Licensee MDPI, Basel, Switzerland. This article is an open access article distributed under the terms and conditions of the Creative Commons Attribution (CC BY) license (http://creativecommons.org/licenses/by/4.0/).
