
Submitted:
29 January 2024
Posted:
31 January 2024
Read the latest preprint version here
Abstract
Machine Learning classifiers are used to classify a very wide dataset containing gene ex-pression microarray data of patients with five types of cancer (breast cancer, kidney cancer, Colon cancer, lung cancer and prostate cancer). Since the dataset was very wide with a large number of columns, the code yielded stack overflow errors, and we resorted to Principal Components Analysis (PCA) for dimensionality reduction, and principal component scores of the raw data for classification. PCA was run using a fast algorithm which is able to compute PC scores for very large datasets. High classification accuracies are obtained using just the first two principal component scores. Machine Learning (ML) classifiers Linear Discriminant Analysis (LDA) & Random Forest (RF) methods were utilized where the latter provided with higher accuracy than the former. The results of this article should be helpful to researchers who are dealing with large number of genes in microarray data.
Keywords:
Linear Discriminant Analysis
; Random Forest
; Precision
; Recall
; F1
; AUC
; macro-averaged AUC
; micro-averaged AUC
1. Introduction
Cancer is a disease which can start almost anywhere in the human body, in which some of the body’s trillion cells grow uncontrollably and spread to other parts of the body. There are over 200 types of cancer such as colon, liver, ovarian and breast, and so on [1,2]. In 2023, 1,958,310 new cancer cases and 609,820 cancer deaths were projected in the United States. [3]. This prompts a clear understanding of the underlying mechanism and characteristics of this potentially fatal disease alongside identifying the most significant genes responsible for it.
Microarray data analysis has been a popular approach for diagnosing cancer, and DNA microarray is a technology used to monitor large numbers of various gene expressions at the same time [4,5]. Gene expression analysis can assure medical experts whether a patient suffers from cancer within a relatively shorter time than traditional methods. Analysis of gene expression requires the identification of informative genes [6] and whereas [7] demonstrates that gene expression classification or cancer classification is the process of identifying informative genes that can be used to predict new sample classes.
Gene selection, however, is generally regarded as much more problematic in multi-class situations (where there are three or more classes to be differentiated) [8,9]. The microarray genes expression data constitutes many highly correlated genes for just a small sample size and have high levels of noise in them. The small number of cancer samples compared with the number of features can degrade the performance of the classifier and increase the risk of over-fitting. Machine Learning (ML) techniques are used as an aim to model the progression rate and treatment of cancer patients. Moreover, ML-based classifiers are widely used in classification of cancer sub-types Various supervised and unsupervised ML techniques which have been adopted to identify the most significant genes [10,11]. Studies [10,11,12,13] show that these techniques suffer from overfitting and multi-collinearity problems due to noise, large number of genes, and small sample size. The unsupervised learning algorithms such as the hierarchical clustering [14], [15], K-means clustering [16] etc., have been used to identify genes which are responsible for cancer. These techniques did not identify the most significant genes resulting in low classification accuracies. Hence it may be beneficial to use feature selection methods which can address the challenges arising from high data dimensionality and small sample size.
Over the years, several studies have been carried out based on feature selection. Principal Components Analysis (PCA) is an exploratory multivariate statistical technique for simplifying complex data sets [17,18,19]. It has been used in a wide range of biomedical problems, including the analysis of microarray data in search of outlier genes [20] as well as the analysis of other types of expression data [21,22].
Degroeve, De Baets, Van de Peer and Rouz´e (2002) created a balanced training data set by randomly selecting 1000 positive instances and 1000 negative, and also created a test data with 281 positive and 7505 negative instances and another test data set with 281 positive and 7643 negative instances; they used SVM classifier, a naive Bayes classifier and a traditional method for feature selection for predicting splice site and obtained improved performance. Precision obtained for these datasets ranged in 93-98% range, but the recall and F1-measures ranged in 25-49% range [23]. Peng, Li and Liu (2006) compared various methods of gene selection over four microarray gene expression datasets and showed that the hybrid method works well on the four datasets [24].
Sharma and Paliwal (2008) used Gradient LDA method for three small microarray gene expression datasets: acute leukemia, small round blue-cell tumor (SRBCT) and lung adenocarcinoma and have obtained higher accuracies than some competing methods [25]. Bar-Joseph, Gitter and Simon (2012) provided a discussion of how time-series gene expression data is used for identification of activated genes in biological processes, and also describe how basic patterns lead to gene expression programs [26]. Dwivedi (2018) used the method of Artificial Neural Network (ANN) for classification of acute cases of lymphoblastic leukemia and myeloid leukemia and reported over 98% overall classification accuracy [27]. Sun et al. (2019) used the genome deep learning method to analyze 6083 samples from the Whole Exon Sequencing mutations with 12 types of cancer and 1991 non-cancerous samples from the 1000 Genome Project and obtained overall classification accuracies ranging in 70% - 97% [28]. A survey of feature selection literature for gene expression microarray data analysis based on a total of 132 research articles [29] was conducted by Alhenawi, Al-Sayyed, Hudaib and Mirjalili (2022). Khatun et al. (2023) developed an ensemble rank-based feature selection method (EFSM) and a weighted average voting scheme to overcome the problems posed by high dimensionality of microarray gene expression data [30]. They obtained overall classification accuracies of 100% (leukemia), 95% (colon cancer), and 94.3% for the 11-tumor dataset. Osama, Shaban and Ali (2023) have provided a review of ML methods for cancer classification of microarray gene expression data; data pre-processing and feature selection methods including filter, wrapper, embedded, ensemble, and hybrid algorithms [31].
Kabir et al. (2023) compared two different dimension reduction techniques—PCA, and autoencoders for the selection of features in a prostate cancer classification analysis. Two machine learning methods—neural networks and SVM—were further used for classification. The study showed that the classifiers performed better on the reduced dataset [32]. Another study Adiwijaya et al. (2018) utilized Principal Component Analysis (PCA) dimension reduction method that includes the calculation of variance proportion for eigenvector selection followed by the classification methods, a Support Vector Machine (SVM) and Levenberg-Marquardt Backpropagation (LMBP) algorithm. Based on the tests performed, the classification method using LMBP was more stable than SVM [7].
Based on previous research, the general scheme in the process of classification of microarray data for the detection of proposed cancer can be conducted via preprocessing the data and dimensionality reduction followed by gene classification. In this study, the step for dimensionality reduction was performed using a Principal Component Analysis (PCA) followed by ML classification technique RF and LDA.
2. Materials and Methods
In this article, we have used the Linear Discriminant Analysis (LDA) classifier [33] and the random forest (RF) classifier [34] on an 801 rows x 20531 columns (genes) dataset of patients with five cancer types: BRCA, KIRC, COAD, LUAD and PRAD; the dataset has no missing values. Variables in this dataset are RNA-Seq gene expression levels measured by illumina HiSeq platform. The variables are dummy named gene XX. This dataset (gene expression cancer RNA-Seq) was downloaded from the UCI Machine Learning Repository [35]. The statistical software package R (2023) was used for all data analyses and visualizations [36].
The LDA and RF methods were first attempted on the raw 801x20531 dataset, but the R code produced stack overflow error due to very large number of columns. We then computed Principal Component (PC) scores [37] of the data and performed the 5-level classification on an increasing number of PC's and obtained excellent classification results using just the first two components PC1 and PC2.
BRCA (Breast Cancer gene) genes produce proteins that help repair damaged DNA and are referred to as tumor suppressor genes since certain changes in these genes can cause cancer [38]. People born with a certain variant of BRCA tend to develop cancer at early ages. Chang, Dalpatadu, Phanord and Singh [39] fitted a Bayesian Logistic Regression model for prediction of breast cancer using the Wisconsin Diagnosis Breast Cancer (WDBC) data set which was downloaded from the UCI Machine Learning Repository; precision, recall and F1-measures of 0.93, 0.89, and 0.91 were reported for the training data, and 0.87, 0.91, 0.89 for the test data, respectively.HER2 protein accelerates breast cancer cell growth and HER2 positive patients when treated with medicines which attack the HER2 protein. Gene expression patterns of HER2 are quite complex and pose a challenge to pathologists. Cordova et al. (2023) developed a new interpretable ML method in immunohistochemistry for accurate HER2 classification and obtained high precision (0.97) and high accuracy (0.89) using immunohistochemistry (IHC) and fluorescence in situ hybridization (FISH) data [40].
Kidney renal cell carcinoma (KIRC) is the most prevalent type of kidney cancer, with survival rate of less than 5 years and 338,000 estimated number of new cases each year [41]. ICD profile of KIRC. Wang et al. (2023) correlated the immunogenic cell death (ICD) of KIRK with the heterogeneity and therapeutic complexity which is useful for developing optimal immunotherapy strategy for KIRC patients [42].
A common cancerous tumor in the digestive track is Colon adenocarcinoma (COAD) and is commonly associated with fatty acids [43]; diagnosis of COAD is difficult as there are hardly any early symptoms. Li et al. (2017) used a genetic algorithm and the k-nearest neighbors clustering method to determine genes which can accurately classify samples as well as class subtypes for a TCGA RNA-seq dataset of 9066 cancer patients and 602 normal samples [44].
Lung adenocarcinoma (LUAD) is a common form of lung cancer which also gets detected in the middle/late stages and therefore is hard to treat [45]. Yang et al. (2022) used a dataset of gene expression profiles from 515 tumor samples and 59 normal tissues and split the dataset into two significantly different clusters; they further showed that using age, gender, pathological stages, and risk score as predictors of LUAD increased the prediction accuracy measures [46]. Liu, Lei, Zhang, and Wang (2022) used cluster analysis on enrichment scores of 12 stemness signatures to identify three LUAD subtypes, St-H, St-M and St-L for six different datasets [47].
Prostate adenocarcinoma (PRAD) is common in elderly men, and patients suffering from PRAD typically have good prognosis [48]. Khosravi et al. (2021) used Deep Learning ML models on an MRI dataset from 400 subjects with suspected prostate cancer combined with histological data and reported high accuracies [49].
We will next provide brief descriptions of the methods of data analysis and the common measures of accuracy used in multi-level classification.
2.1. Principal Components Analysis (PCA)
PCA is a dimension-reduction technique which creates new and uncorrelated linear combinations of original variables (principal components); the values of the principal components are called PC-Scores and can be used in place of the original variables for further analyses such as Multiple Linear Regression (MLR) or Discrimination and Classification. Using PC-Scores instead of original variables as predictors eliminates the problem of multicollinearity.
2.2. Linear Discriminant Analysis (LDA)
LDA is itself a dimension-reduction technique which is used for separating a dataset into 2 or more subgroups, and also for classification of new data into these subgroups. LDA is typically one of the methods used for multi-level classification problems. The LDA method involves computing separating hyperplanes for classification purposes [33]. The R-code for LDA produced stack overflow errors, and we therefore used the function prcompfast of the R-package Morpho to perform PCA of the gene expression microarray dataset at hand.
2.3. Random Forest (RF)
The RF method is a decision-tree based method that can be used for classification (categorical response) or regression (continuous response) problems. It randomly selects a subset of rows (samples) and a subset of columns (features) at a time and fits decision trees a very large number of times to predict Y and then uses a voting mechanism to predict Y values.. Random forest is known to be highly accurate [50].
2.4. Training and Test Datasets
In ML literature, it is common practice to randomly split the available dataset into Training and Test datasets and report the accuracy measures of prediction for both of these datasets. Typically higher accuracy measures are obtained for the training set than the test set. The entire raw dataset was used to compute PC-Scores by using the fast-PCA method of the R-package Morpho. A dataset of 801 rows and 25 PC-scores was created, and then this dataset of PC-scores was randomly split into an 80% training set and 20% test set. The LDA and RF methods were used on the training set of PC-Scores and the accuracy measures given below were computed for both training and test sets.
2.5. Accuracy Measures for Multi-Level Classification
All of these measures are computed from the confusion matrix which is a cross-tabulation of observed Y and predicted Y values.
The commonly used accuracy measures for multi-level classifiers computed from the full confusion matrix (CM) are:
Overall Accuracy (OA) = sum of diagonal elements of CM/sum of all elements of CM
Precision, Recall and F1 are calculated for each level j (j = 1, 2, …, 5)
Precision_j = j-th diagonal element of CM/sum of j-th column of CM
Recall_j = j-th diagonal element of CM/sum of j-th row of CM
F1_j = harmonic mean of Precision_j and Recall_j
The following accuracy measures are computed for each level by calculating the one vs all binary confusion matrices:
Area Under the Curve (AUC)
Macro- and micro-averages of AUC
Explanations of the accuracy measures and computational details are provided in [51].
3. Results
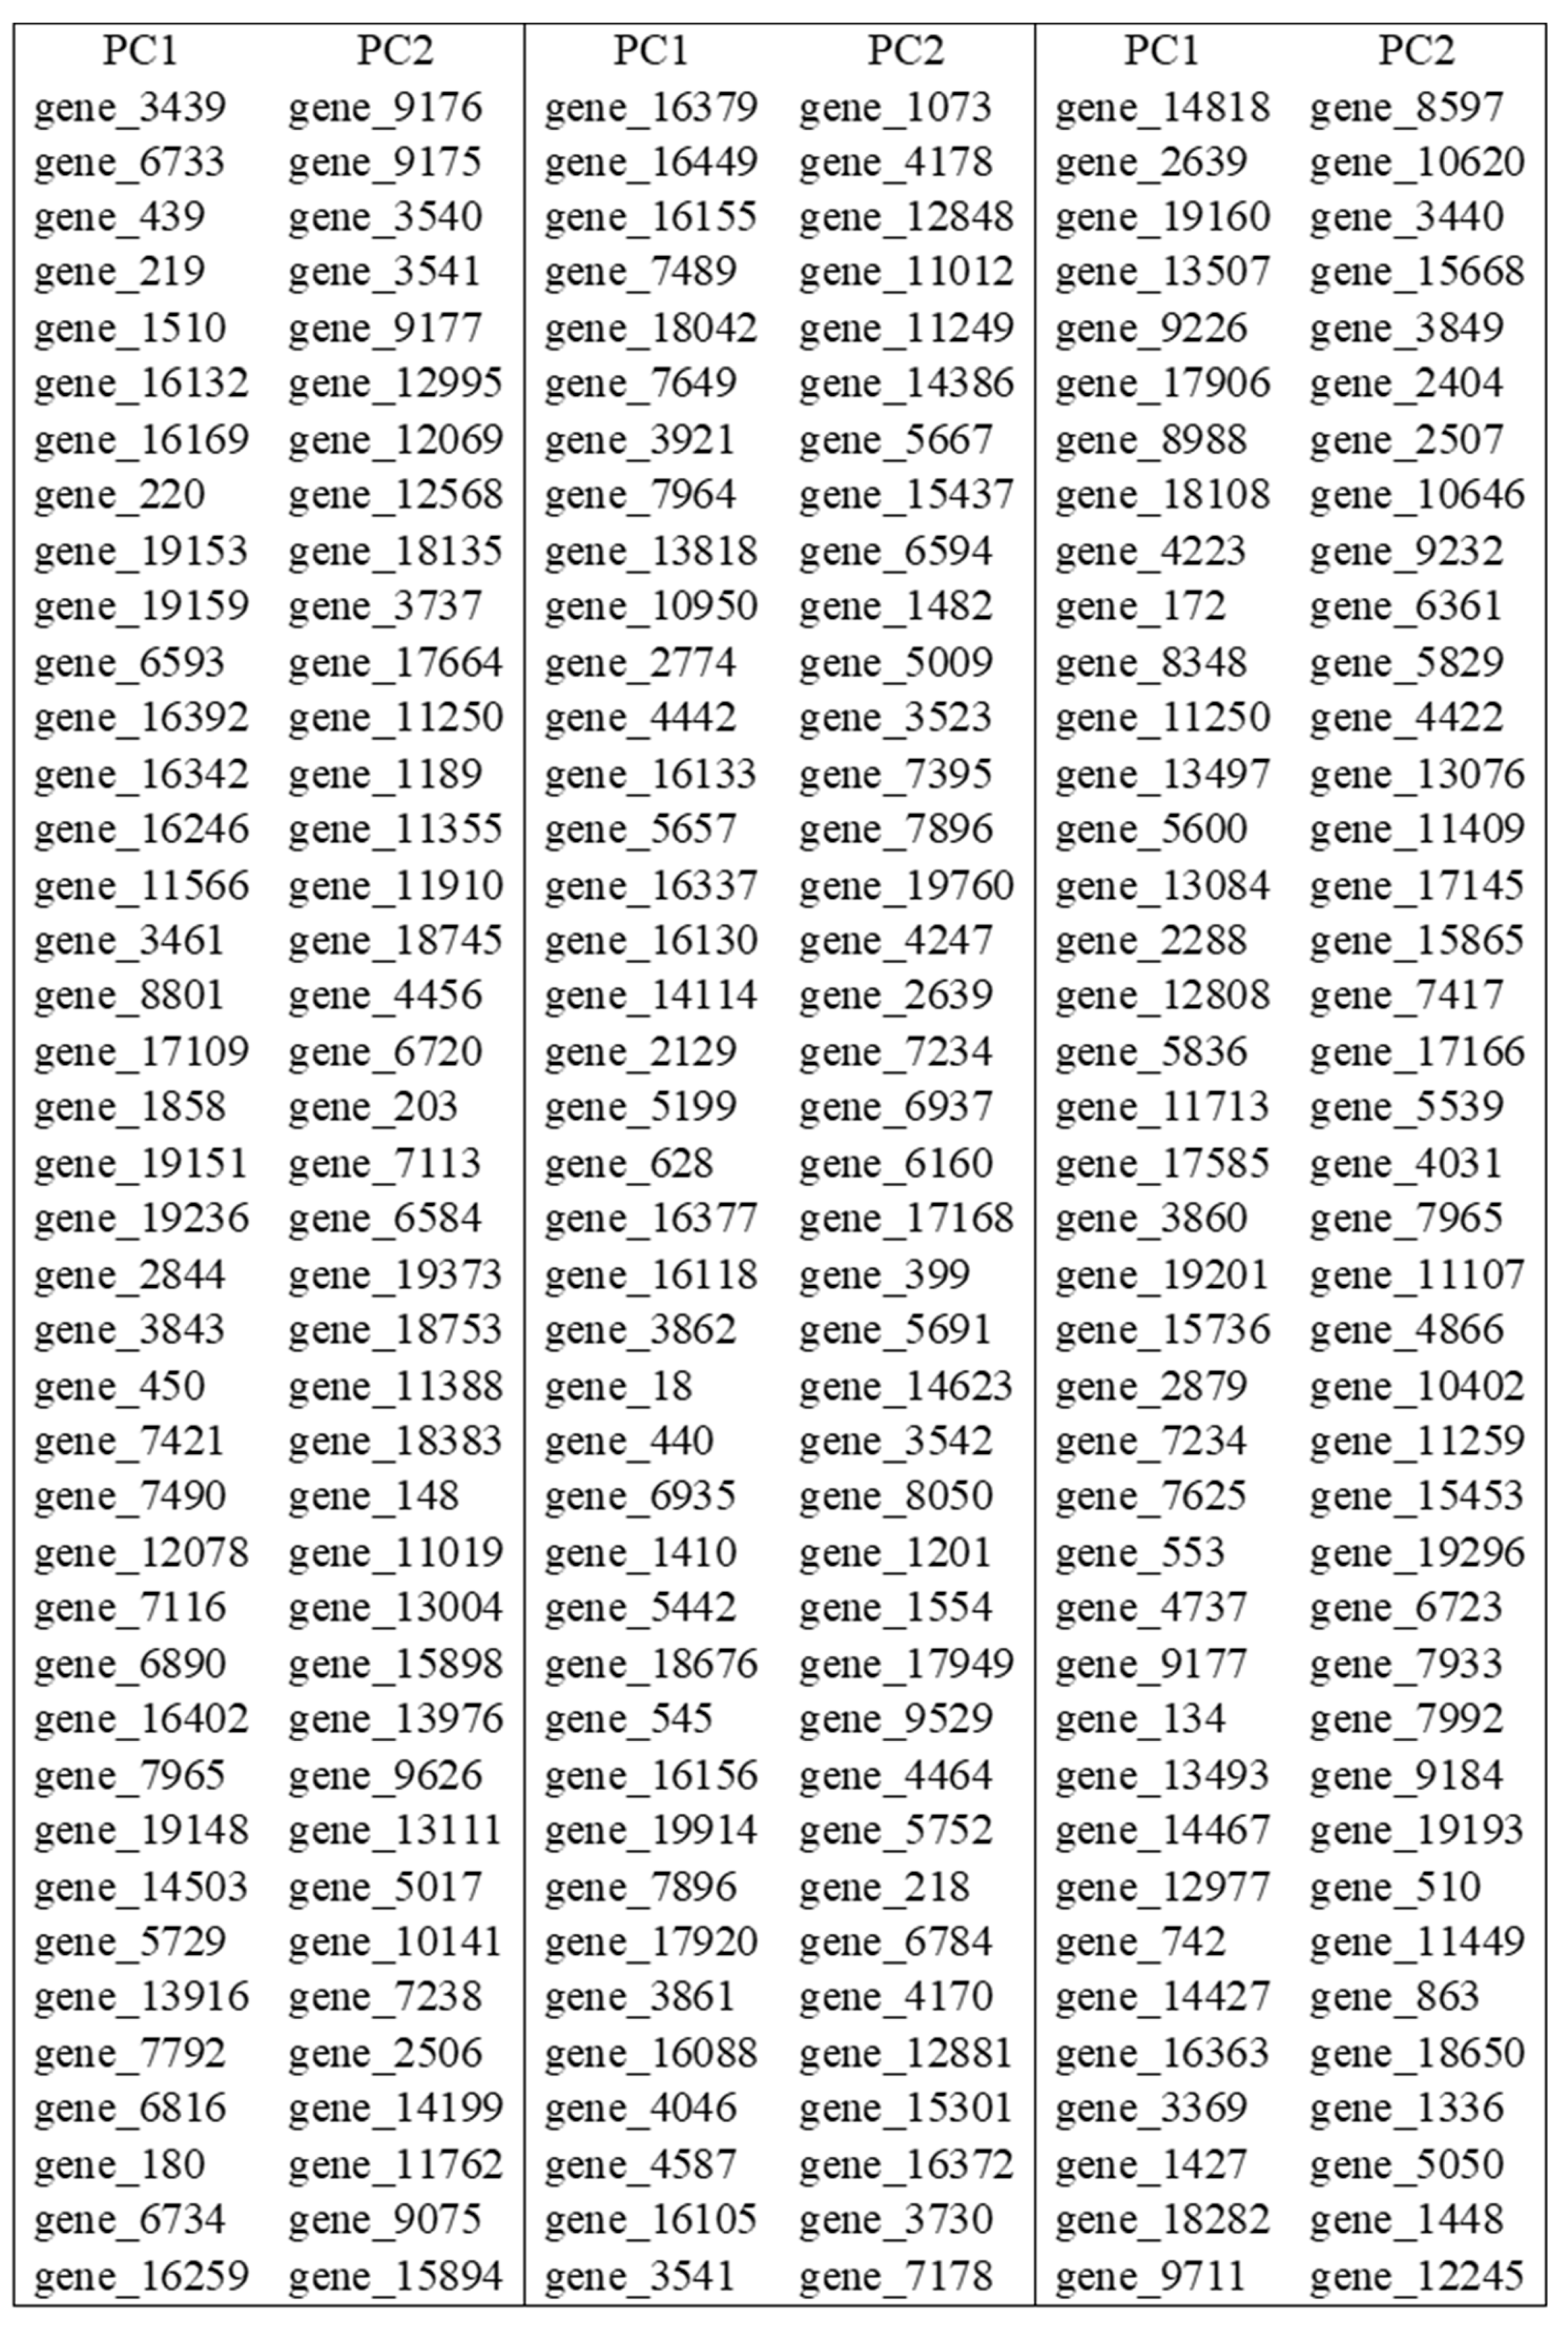
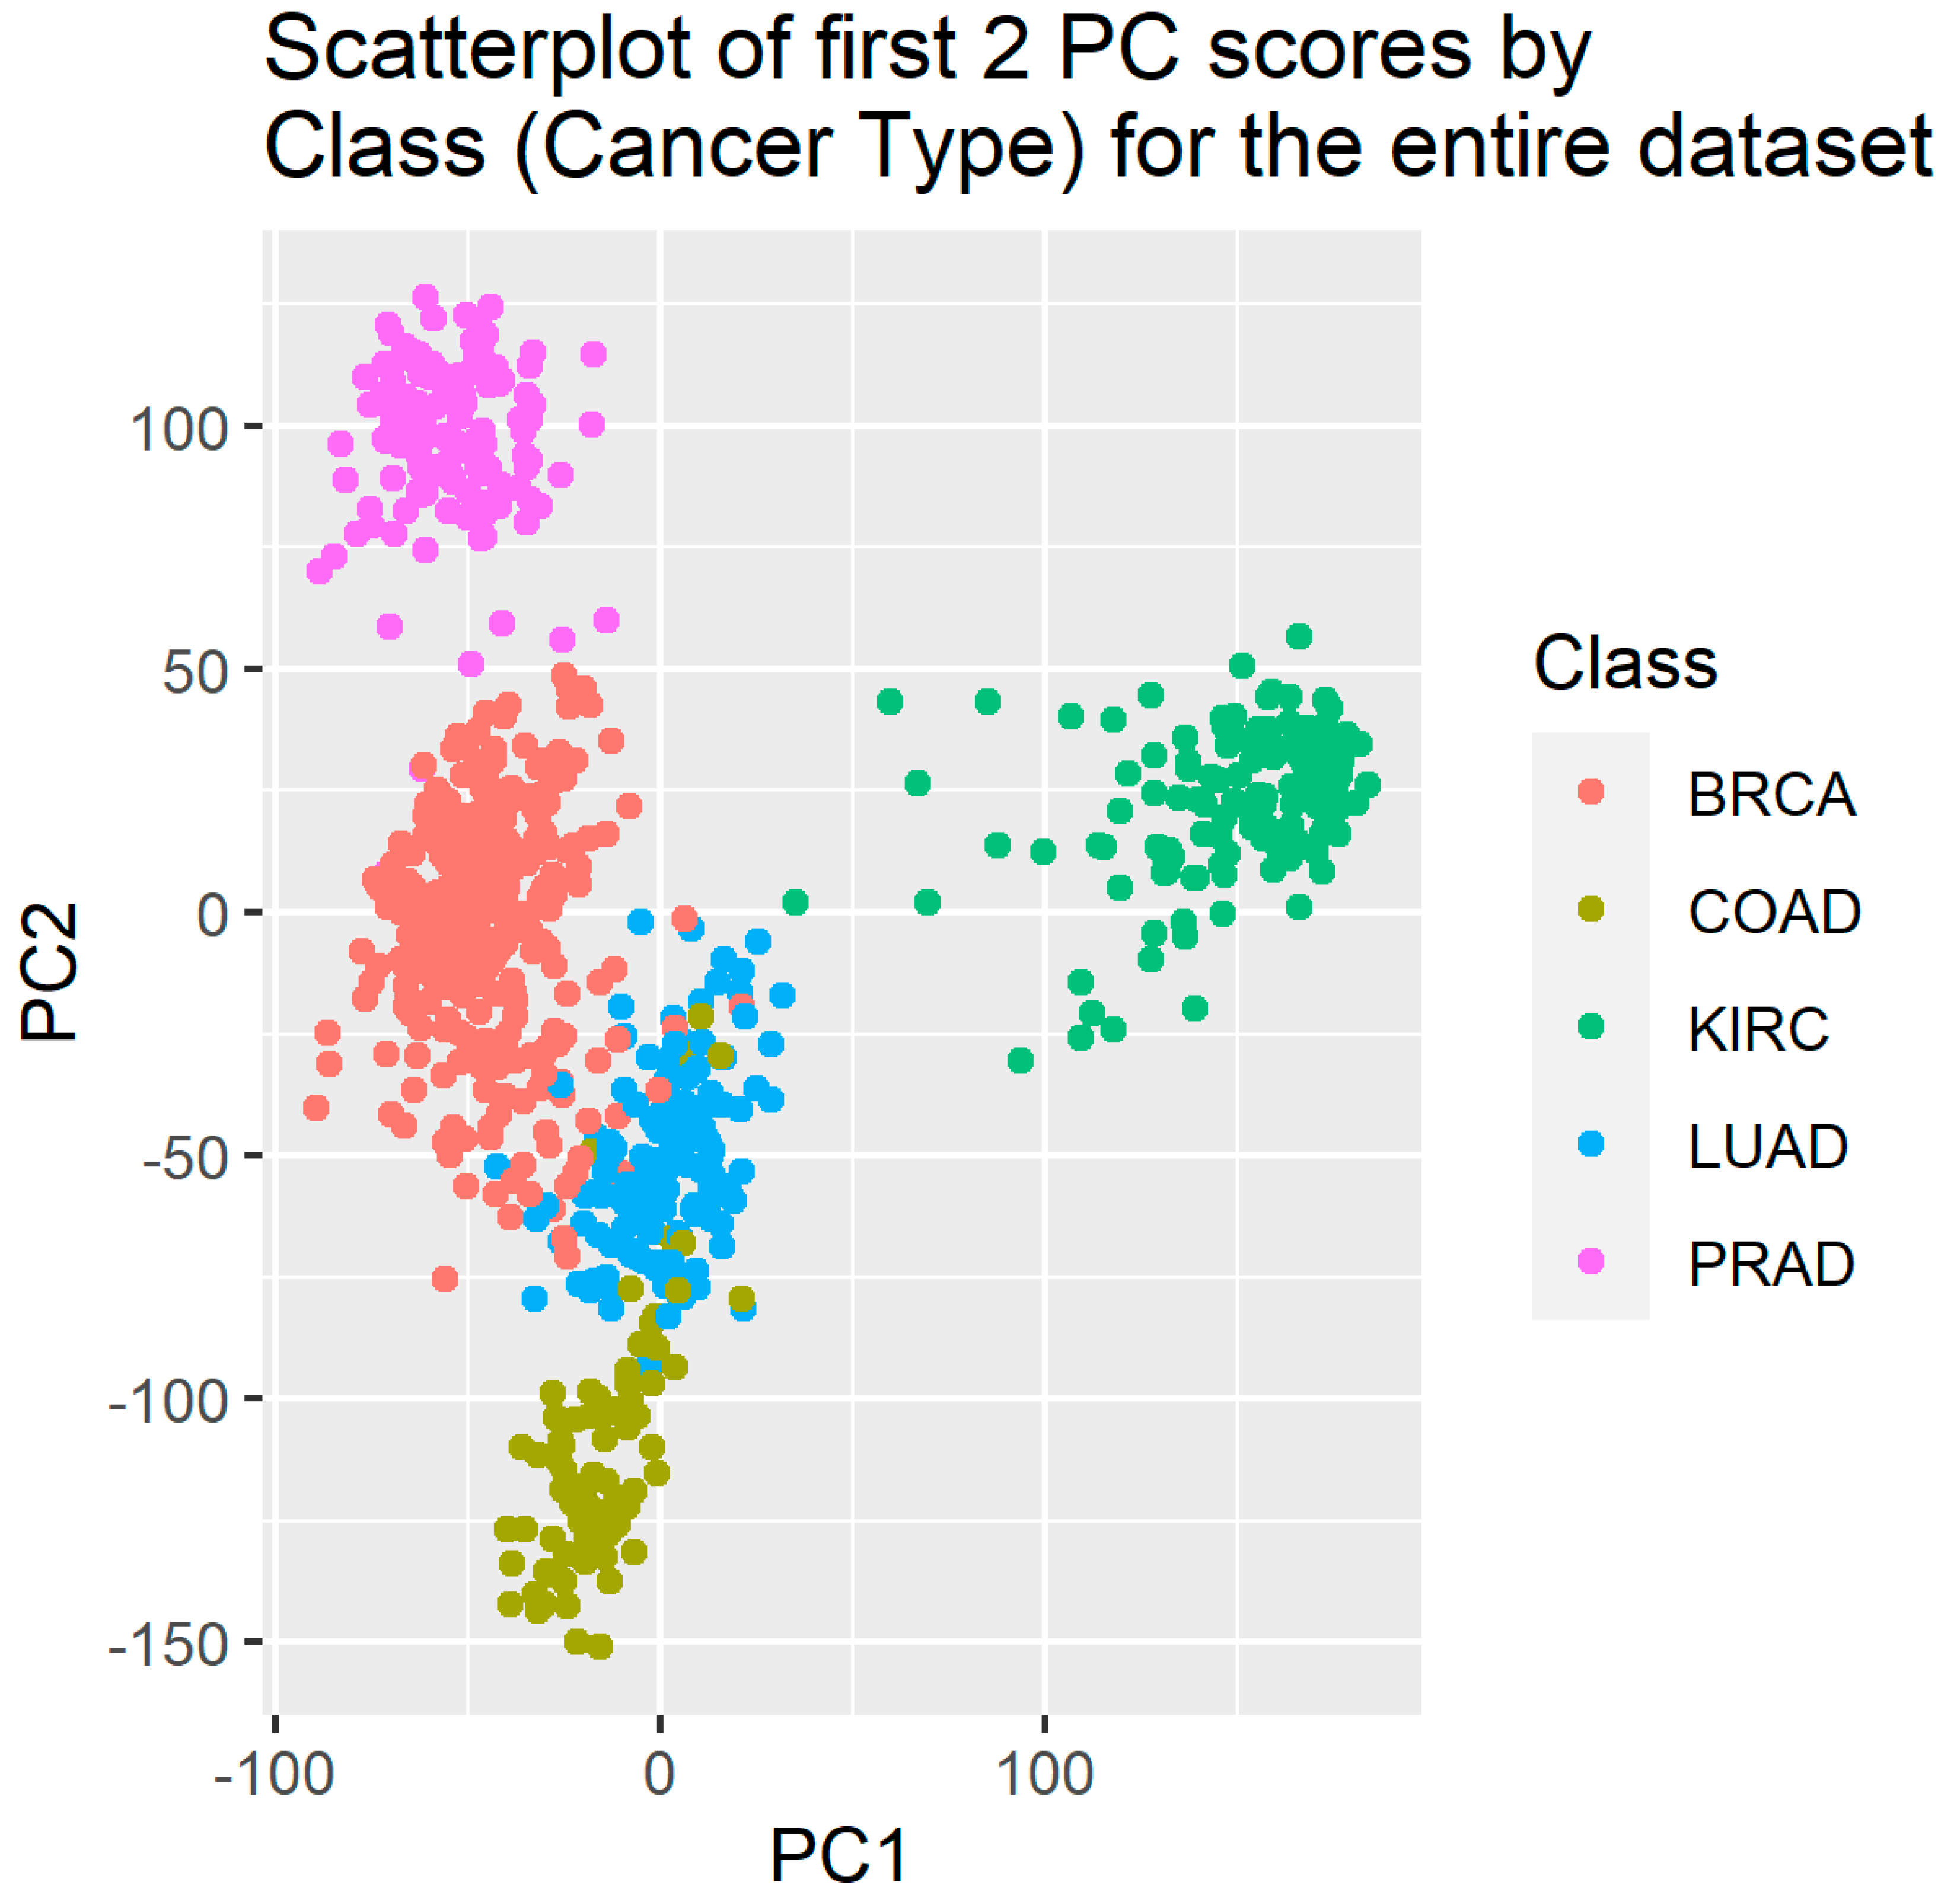
PCA was run on the entire 801 rows x 20531 genes data set, and trial-and-error showed that just the first two principal components were sufficient for classification purposes. The genes with highest absolute loadings are shown in Table 9. The PC1 and PC2 scores were saved in a data file. A scatterplot of first two PC-scores for the entire dataset is shown in Figure 1. A clear separation between BRCA and KIRC cancer sub-types with some overlap between COAD, LUAD and PRAD is seen in Figure 1.
Figure 2, Figure 3, Figure 4 and Figure 5 show plots of the confusion matrices for the LDA and RF classifiers for training and test sets, respectively. Table 1, Table 2, Table 3, Table 4, Table 5, Table 6, Table 7 and Table 8 show that all measures of multi-level accuracy are high for both training and test datasets and both LDA and RF methods.
Accuracy Measures for the LDA Classifier for Training Data
Figure 2.
Confusion Matrix Plot for the LDA Classifier – Training Data.

Table 1.
Precision, Recall, F1 and AUC Measures for the LDA Classifier – Training Data.
Table 2.
Macro- and Micro-Averaged AUC Measures for the LDA Classifier – Training Data.
Accuracy Measures for the LDA Classifier for Test Data
Figure 3.
Confusion Matrix Plot for the LDA Classifier – Test Data.
Table 3.
Confusion Matrix Plot and Accuracy Measures for the LDA Classifier – Test Data.
Table 4.
Macro and Micro averaged AUC for the LDA Classifier – Test Data.
Accuracy Measures for the RF Classifier for Training Data
Figure 4.
Confusion Matrix Plot for the RF Classifier – Training Data.
Table 5.
Precision, Recall, F1 and AUC Measures for the RF Classifier – Training Data.
Table 6.
Macro and Micro averaged AUC for the RF Classifier – Training Data.
Accuracy Measures for the RF Classifier for Test Data
Table 7.
Precision, Recall, F1 and AUC Measures for the RF Classifier – Test Data.
Table 8.
Macro and Micro averaged AUC for the RF Classifier – Test Data.
In Table 9 we provide the variables (genes) with high absolute loadings on the first two PC-scores; such a table can be very useful for selection of features (genes).
Table 9.
genes wit highest absolute loadings on the first two PC-scores.
4. Discussion
PCA results showed that the first 50 components (PC) cumulatively explained 71% of all variability present in the 801 × 20532 gene expression data, with the first two PC’s explaining only 26% of total variability. The first two PC’s, however, were sufficient for classification of cancer sub-types with high accuracy. This can be seen from the plot of the first two components by of cancer sub-type. LDA was able to classify each of the five cancer-subtype with high accuracies with the exception of LUAD which had a precision of 77% for the training set. The RF method was able to classify each sub-type with very high accuracy. The PCA loadings on 20532 genes were sorted in order of magnitude and genes (features) important for classification were identified. Our results are not generalizable, but the proposed classification method should be very helpful to researchers and clinicians working with gene expression microarray data of high dimensionality.
Author Contributions
Conceptualization, DM. and AKS; methodology, DM. and AKS.; validation, DM, DP, RD, LG, AS.; formal analysis, DM, AK, RD.; investigation, DM.; DM, AK, DP, LG; .; data curation, DM.; writing—original draft preparation, DM.; writing—review and editing, DM.; DM, AK, DP, LG.; visualization, DM.; supervision, AKS and DP.; project administration, AKS and DP... All authors have read and agreed to the published version of the manuscript.
Funding
This research received no external funding.
Institutional Review Board Statement
“Not applicable” since secondary data is used.
Data Availability Statement
The microarray gene expression data is available at https://archive.ics.uci.edu/dataset/401/gene+expression+cancer+rna+seqmicroarray-202.
Conflicts of Interest
All authors declare no conflicts of interest.
References
- S.M. Alladi, P. Shinde Santosh, V. Ravi, U.S. Murthy. Colon cancer prediction with genetic profiles using intelligent techniques Bioinformation, 3 (3) (2008), pp. 130-133. [CrossRef]
- U. Alon, N. Barkai, D.A. Notterman, K. Gish, S. Ybarra, D. Mack, A.J. Levine. Broad patterns of gene expression revealed by clustering analysis of tumor and normal colon tissues probed by oligonucleotide arrays, Proc. Natl. Acad. Sci., 96 (12) (1999), pp. 6745-6750. [CrossRef]
- Siegel RL, Miller KD, Wagle NS, Jemal A. Cancer statistics, 2023. CA Cancer J Clin. 2023; 73(1): 17-48. [CrossRef]
- Harrington, Christina A., Carsten Rosenow, and Jacques Retief. "Monitoring gene expression using DNA microarrays." Current opinion in Microbiology 3, no. 3 (2000): 285-291. [CrossRef]
- Schena, Mark, Dari Shalon, Ronald W. Davis, and Patrick O. Brown. "Quantitative monitoring of gene expression patterns with a complementary DNA microarray." Science 270, no. 5235 (1995): 467-470. [CrossRef]
- Siang, T.C., T.W. Soon, S. Kasim, M.S. Mohamad and C.W. Howe et al., 2015. A review of cancer classification software for gene expression data. Int. J. Bio. Sci. Bio. Technol., 7: 89-108. [CrossRef]
- Adiwijaya, W. U., Lisnawati, E., Aditsania, A., & Kusumo, D. S. (2018). Dimensionality reduction using principal component analysis for cancer detection based on microarray data classification. Journal of Computer Science, 14(11), 1521-1530. [CrossRef]
- Yeung, Ka Yee, Roger E. Bumgarner, and Adrian E. Raftery. "Bayesian model averaging: development of an improved multi-class, gene selection and classification tool for microarray data." Bioinformatics 21, no. 10 (2005): 2394-2402. [CrossRef]
- Yeung, Ka Yee, Roger E. Bumgarner, and Adrian E. Raftery. "Bayesian model averaging: development of an improved multi-class, gene selection and classification tool for microarray data." Bioinformatics 21, no. 10 (2005): 2394-2402. [CrossRef]
- Brahim-Belhouari, Sofiane, and Amine Bermak. "Gaussian process for nonstationary time series prediction." Computational Statistics & Data Analysis 47, no. 4 (2004): 705-712. [CrossRef]
- Bray, Freddie, Jacques Ferlay, Isabelle Soerjomataram, Rebecca L. Siegel, Lindsey A. Torre, and Ahmedin Jemal. "Global cancer statistics 2018: GLOBOCAN estimates of incidence and mortality worldwide for 36 cancers in 185 countries." CA: a cancer journal for clinicians 68, no. 6 (2018): 394-424. [CrossRef]
- L. Breiman. Bagging predictors Mach. Learn., 24 (2) (1996), pp. 123-140. [CrossRef]
- L. Breiman. Random forests Mach. Learn., 45 (1) (2001), pp. 5-32. [CrossRef]
- M.W. Butler, N.R. Hackett, J. Salit, Y. Strulovici-Barel, L. Omberg, J. Mezey, R.G Crystal. Glutathione S-transferase copy number variation alters lung gene expression Eur. Respir. J., 38 (1) (2011), pp. 15-28. [CrossRef]
- D. Chen, Z. Liu, X. Ma, D. Hua. Selecting genes by test statistics. Biomed. Res. Int., 2005 (2) (2005), pp. 132-138. [CrossRef]
- T. Dahiru. P-value, a true test of statistical significance? A cautionary note. Ann. Ibadan Postgraduate Med., 6 (1) (2008), pp. 21-26. [CrossRef]
- Principal Components Analysis (PCA) is an exploratory multivariate statistical technique for simplifying complex data sets (Basilevsky 1994, Everitt & Dunn 1992, Pearson 1901).
- Everitt BS, Dunn G. Applied Multivariate Data Analysis. Oxford University Press; New York, NY: 1992.
- Pearson K. On Lines and Planes of Closest Fit to Systems of Points in Space. Phil Mag. 1901;2:559–572. [CrossRef]
- Hilsenbeck SG, Friedrichs WE, Schiff R, O’Connell P, Hansen RK, Osborne CK, Fuqua SAW. Statistical Analysis of Array Expression Data as Applied to the Problem of Tamoxifen Resistance. J Natl Cancer Institute. 1999;91:453–459. [CrossRef]
- Vohradsky J, Li XM, Thompson CJ. Identification of procaryotic developmental stages by statistical analyses of two-dimensional gel patterns. Electrophoresis. 1997;18(8):1418–28. [CrossRef]
- Craig JC, Eberwine JH, Calvin JA, Wlodarczyk B, Bennett GD, Finnell RH. Developmental expression of morphoregulatory genes in the mouse embryo: an analytical approach using a novel technology. Biochem Mol Med. 1997;60(2):81–91. [CrossRef]
- Sven Degroeve, Bernard De Baets, Yves Van de Peer and Pierre Rouz´e. Feature subset selection for splice site prediction BIOINFORMATICS Vol. 18 Suppl. 2 2002, pp. S75–S83.
- Peng Y, Li W, Liu Y. A Hybrid Approach for Biomarker Discovery from Microarray Gene Expression Data for Cancer Classification. Cancer Informatics. 2006;2. [CrossRef]
- Sharma, A., Paliwal, K.K. (2008). Cancer classification by gradient LDA technique using microarray gene expression data. Data & Knowledge Engineering 66 (2008), pp. 338–347. [CrossRef]
- Bar-Joseph, Z., Gitter, A. & Simon, I. Studying and modelling dynamic biological processes using time-series gene expression data. Nat Rev Genet 13, 552–564 (2012). [CrossRef]
- Dwivedi, A.K. (2018). Artificial neural network model for effective cancer classification using microarray gene expression data. Neural Comput & Applic (2018) 29:1545–1554. [CrossRef]
- Sun Y, Zhu S, Ma K, Liu W, Yue Y, Hu G, Lu H, Chen W. Identification of 12 cancer types through genome deep learning. Sci Rep. 2019 Nov 21;9(1):17256. PMID: 31754222; PMCID: PMC6872744. [CrossRef]
- Esra'a Alhenawi, Rizik Al-Sayyed, Amjad Hudaib, Seyedali Mirjalili (2022). Feature selection methods on gene expression microarray data for cancer classification: A systematic review, Computers in Biology and Medicine, Volume 140, 105051, ISSN 0010-4825, https://www.sciencedirect.com/science/article/pii/S0010482521008453. [CrossRef]
- Khatun, R.; Akter, M.; Islam, M.M.; Uddin, M.A.; Talukder, M.A.; Kamruzzaman, J.; Azad, A.; Paul, B.K.; Almoyad, M.A.A.; Aryal, S.; et al. Cancer Classification Utilizing Voting Classifier with Ensemble Feature Selection Method and Transcriptomic Data. Genes 2023, 14, 1802. [CrossRef]
- Sarah Osama, Hassan Shaban, Abdelmgeid A. Ali Gene reduction and machine learning algorithms for cancer classification based on microarray gene expression data: A comprehensive review, Expert Systems with Applications, Volume 213, Part A, 2023, 118946, ISSN 0957-4174. [CrossRef]
- Kabir, M.F.; Chen, T.; Ludwig, S.A. A performance analysis of dimensionality reduction algorithms in machine learning models for cancer prediction. Healthc. Anal. 2023, 3, 100125. [CrossRef]
- Richard A. Johnson , Dean W. Wichern. Applied Multivariate Statistical Analysis (2007, 6th Edition). Pearson, International Edition.
- Genuer, R., Poggi, J. (2020). Random Forests with R. Germany: Springer International Publishing.
- UCI Machine Learning Repository https://archive.ics.uci.edu/dataset/401/gene+expression+cancer+rna+seqmicroarray-202.
- R Core Team (2023). _R: A Language and Environment for Statistical Computing_. R Foundation for Statistical Computing, Vienna, Austria.https://www.R-project.org/.
- Jolliffe, I. (2013). Principal Component Analysis. United States: Springer New York.
- Mersch J, Jackson MA, Park M, Nebgen D, Peterson SK, Singletary C, Arun BK, Litton JK. Cancers associated with BRCA1 and BRCA2 mutations other than breast and ovarian. Cancer. 2015 Jan 15;121(2):269-75. Epub 2014 Sep 15. Erratum in: Cancer. 2015 Jul 15;121(14):2474-5. PMID: 25224030; PMCID: PMC4293332. [CrossRef]
- Michael Chang, Rohan J. Dalpatadu, Dieudonne Phanord, Ashok K. Singh. (2018). Breast Cancer Prediction Using Bayesian Logistic Regression. Open Acc Biostat Bioinform. 2(3). OABB.000537. 2018.
- Cordova, C., Muñoz, R., Olivares, R, Minonzio, J-G., Lozano, C., Gonzalezp., Marchant, I., González-Arriagada, W. And Olivero, P. (2023). HER2 classification in breast cancer cells: A new explainable machine learning application for immunohistochemistry. ONCOLOGY LETTERS 25: 44, 2023, pp. 1-9. [CrossRef]
- Hu F, Zeng W, Liu X. A Gene Signature of Survival Prediction for Kidney Renal Cell Carcinoma by Multi-Omic Data Analysis. Int J Mol Sci. 2019 Nov 14;20(22):5720. PMID: 31739630; PMCID: PMC6888680. [CrossRef]
- Wang, L, Zhu, Y., Ren, Z, Sun, W, Wang, Z, Zi, T, Li, H, Zhao,Y, Qin, X, Gao, D, Zhang L., He, Z., Le, W., Wu, Q. and Wu, G.(2023). An immunogenic cell death-related classification predicts prognosis and response to immunotherapy in kidney renal clear cell carcinoma. Front.Oncol.13:1147805. [CrossRef]
- Yue, F., Wei, Z., Yan, R., Guo, Q., Liu, B., Zhang, J., & Li, Z. (2020). SMYD3 promotes colon adenocarcinoma (COAD) progression by mediating cell proliferation and apoptosis. Experimental and Therapeutic Medicine, 20, 11. [CrossRef]
- Li, Yuanyuan, Kai Kang, Juno M. Krahn, Nicole Croutwater, Kevin Lee, David M. Umbach, and Leping Li. "A comprehensive genomic pan-cancer classification using The Cancer Genome Atlas gene expression data." BMC genomics 18 (2017): 1-13. [CrossRef]
- Liu Y, Liang L, Ji L, Zhang F, Chen D, Duan S, Shen H, Liang Y, Chen Y. Potentiated lung adenocarcinoma (LUAD) cell growth, migration and invasion by lncRNA DARS-AS1 via miR-188-5p/ KLF12 axis. Aging (Albany NY). 2021 Oct 13;13(19):23376-23392. Epub 2021 Oct 13. PMID: 34644678; PMCID: PMC8544313. [CrossRef]
- Yang J, Chen Z, Gong Z, Li Q, Ding H, Cui Y, Tang L, Li S, Wan L, Li Y, Ju S, Ding C and Zhao J (2022) Immune Landscape and Classification in Lung Adenocarcinoma Based on a Novel Cell Cycle Checkpoints Related Signature for Predicting Prognosis and Therapeutic Response. Front. Genet. 13:908104. [CrossRef]
- Liu, Q., Lei, J., Zhang, X., and Wang, X. (2022). Classification of lung adenocarcinoma based on stemness scores in bulk and single cell transcriptomes, Computational and Structural Biotechnology Journal, Volume 20, 2022, Pages 1691-1701, ISSN 2001-0370. [CrossRef]
- Zhao X, Hu D, Li J, Zhao G, Tang W, Cheng H. Database Mining of Genes of Prognostic Value for the Prostate Adenocarcinoma Microenvironment Using the Cancer Gene Atlas. Biomed Res Int. 2020 May 18;2020:5019793. PMID: 32509861; PMCID: PMC7251429. [CrossRef]
- Khosravi, P., Lysandrou, M., Eljalby, M., Li, Q., Kazemi, E., Zisimopoulos, P., Sigaras, A., Brendel, M., Barnes, J., Ricketts, C., Meleshko, D., Yat, A., McClure, T.D., Robinson, B.D., Sboner, A., Elemento, O., Chughtai, B. and Hajirasouliha, I. (2021), A Deep Learning Approach to Diagnostic Classification of Prostate Cancer Using Pathology–Radiology Fusion. J Magn Reson Imaging, 54: 462-471. [CrossRef]
- Hastie, T., Tibshirani, R., & Friedman, J. (2009). Springer series in statistics, The elements of statistical learning: Data mining, inference, and prediction (2nd ed.). (pp. 587–590).
- Molin, Nicole, Molin, Clifford, Dalpatadu, R.J., Singh, A. K. (2021). Prediction of Obstructive Sleep Apnea Using FFT of Overnight Breath Recordings (2021). Machine Learning with Applications, Volume 4, 15 June 2021, 100022 https://www.sciencedirect.com/science/article/pii/S2666827021000037.
Figure 1.
Scatterplot of PC2 vs PC1 for the Entire Data.
Disclaimer/Publisher’s Note: The statements, opinions and data contained in all publications are solely those of the individual author(s) and contributor(s) and not of MDPI and/or the editor(s). MDPI and/or the editor(s) disclaim responsibility for any injury to people or property resulting from any ideas, methods, instructions or products referred to in the content. |
© 2024 by the authors. Licensee MDPI, Basel, Switzerland. This article is an open access article distributed under the terms and conditions of the Creative Commons Attribution (CC BY) license (http://creativecommons.org/licenses/by/4.0/).
Copyright: This open access article is published under a Creative Commons CC BY 4.0 license, which permit the free download, distribution, and reuse, provided that the author and preprint are cited in any reuse.


