
Submitted:
26 January 2024
Posted:
29 January 2024
You are already at the latest version
Abstract
Introduction:
Within primary ARDS, SARS-CoV-2-associated ARDS (C-ARDS) emerged in late 2019, reaching its peak during the subsequent two years. Recent efforts in ARDS research have concentrated on phenotyping this heterogeneous syndrome to enhance comprehension of its pathophysiology.
Methods and Results:
A retrospective study was conducted on C-ARDS patients from April 2020 to February 2021, encompassing 110 participants with a mean age of 63.2±11.92 (26-83 years). Of these, 61.2% (68) were male, and 25% (17) experienced severe ARDS, resulting in a mortality rate of 47.3% (52). Ventilation settings, arterial blood gases, and chest X-ray (CXR) were evaluated on the first day of invasive mechanical ventilation and between days two and three. CXR images were scrutinized using a convolutional neural network (CNN). A binary logistic regression model for predicting C-ARDS mortality was developed based on the most influential variables: age, PaO2/FiO2 ratio (P/F) on days one and three, CNN-extracted CXR features, and age. Initial performance assessment on test data (23 patients out of the 110) revealed an area under the receiver operating characteristic (ROC) curve of 0.862 CI (0.654-0.969).
Conclusion:
Integrating data available in all intensive care units enables the prediction of C-ARDS mortality by utilizing evolving P/F ratios and CXR. This approach can assist in tailoring treatment plans and initiating early discussions to escalate care and extracorporeal life support. Machine learning algorithms for imaging classification can uncover otherwise inaccessible patterns, potentially evolving into another form of ARDS phenotyping. The combined features of these algorithms and clinical variables demonstrate superior performance compared to either element alone.
Keywords:
ARDS
; imaging
1. Background and Objectives
Acute Respiratory Distress Syndrome (ARDS) is a critical medical condition characterized by severe respiratory failure posing a substantial threat with high mortality rates. It can manifest in response to diverse underlying causes, including pneumonia, sepsis, trauma, or inhalation injuries [1]. ARDS is a significant concern in critical care medicine due to its potential for rapid progression and severe respiratory compromise. The Berlin criteria define ARDS by acute lung insult, bilateral chest infiltrates, and hypoxemia not fully explained by other factors [1,2].
While widely accepted, the Berlin criteria need to capture ARDS's multifaceted nature fully. This syndrome encompasses a spectrum of clinical disorders, diverse physiological abnormalities, varied radiographic presentations, multiple potential microbiological causes, and dynamic evolution over time [3,4]. ARDS exhibits a continuum from the early development of acute lung injury to meeting specific diagnostic criteria [4].
Diagnostic Criteria and Radiological Evidence:
The Berlin criteria assume the use of arterial blood gases, specifically the PaO2/FiO2 ratio, and require radiological evidence, often obtained through chest X-ray (CXR) or chest CT scans. Recently published ESICM definitions have sparked debate and alternative approaches in the medical community, challenging the reliance on chest radiography [5,6].
A prior randomised controlled trial (RCT) revealed no improvement in chest X-ray interpretation following standardised training specific to ARDS. Alternative approaches have been debated, such as Accepting Unilateral Opacities Mandating Computed Tomography (CT) Scans and Incorporating Lung Ultrasound in ARDS [6]
Despite being a prevalent cause of acute respiratory failure with high morbidity and mortality, ARDS lacks proven therapeutic options beyond lung protective ventilation [7].
The underlying heterogeneity has prompted research into ARDS sub-phenotypes that may respond to specific treatments [8,9,10].
Recent latent class analysis (LCA) has identified sub-phenotypes with distinct clinical and biological features, emphasising the importance of precision medicine in addressing ARDS heterogeneity [10]
The lack of a definitive diagnostic test contributes to the broad definition of ARDS, exemplified by histopathological findings in only 45% of autopsied lungs from ARDS patients [11,12].
The debate on steroids in ARDS underscores the need for phenotyping, as specific subtypes, like COVID-19-associated ARDS (C-ARDS), may benefit from steroids [13] whereas plenty of RCTs have not been able to demonstrate clear benefit on steroids in ARDS [14,15].
Prediction of ARDS remains challenging, and the heterogeneity of aetiology often hampers clinical trials. Machine learning, especially in radiology, is gaining prominence and has been employed in ARDS diagnosis [16,17,18,19] as well as studying recruitability and response to PEEP [17,20]
Our study aims to analyse evolving ventilation settings, PaO2/FiO2, and chest radiography in patients with C-ARDS. The hypothesis is that the combination of chest X-rays with ventilation settings and arterial blood gases can effectively predict ARDS mortality, contributing to a more comprehensive understanding of this complex syndrome.
2. Material and methods
2.1. Study Design
A retrospective cohort study was conducted on mechanically ventilated C-ARDS patients admitted to the intensive care units of Hospital São José and Hospital Curry Cabral between April 2020 and January 2021.
2.2. Inclusion and Exclusion Criteria
Patients on extracorporeal membrane oxygenation (ECMO) were excluded due to potential differences in ventilation data arising from lung rest ventilation strategies. The analysis focused on the first 72 hours of ICU admission when SARSCOV was the sole infectious isolate. Patients diagnosed with ARDS according to the Berlin definition, requiring invasive mechanical ventilation for at least 48 hours, were included. Exclusion criteria encompassed age below 18, pregnancy, other contributing causes for ARDS, synchronous respiratory infection with other agents, death within the initial 48 hours of ICU admission, and lack of data on ventilation settings or poor-quality chest radiographs.
2.3. Primary Outcome
The primary outcome was defined as all-cause mortality.
2.4. Data Acquisition
Patient data included age, gender, arterial blood gases, and ventilation settings during the first day (PS d1) and between 48 and 72 hours (PS d3) of invasive mechanical ventilation. Portable chest radiographs (CXR) at day one (CXR d1) and day three (CXR d3) were processed using Gaussian blur filtering and contrast-limited adaptive histogram equalization. These techniques aimed at noise reduction and image contrast optimization in the regions of interest improve accuracy in image classification tasks using neural networks [21].
The lung area was segmented, and properly resized and normalized CXR d1 and CXR d3 were concatenated. A pre-trained DenseNet121 convolutional neural network (CheXNet) was employed for transfer learning, providing reliable analysis and detection of 14 thoracic-related pathologies. Deep learning features (DLF) were extracted and coupled with clinical variables (CV) to construct two machine learning models: logistic regression (LogReg) and a multilayer perceptron (MLP). Age, PaO2/FiO2 ratio on the 3rd day (P/F d3) of invasive mechanical ventilation, and deep learning features (DLF) were used in the final models.
2.5. Sample Split and Imputation
Sample data was randomly split into training (85 patients) and test (23 patients) groups. Missing data were imputed by the median after splitting.
2.6. Statistical Analysis
Models were developed using logistic regression (LogReg), multilayer perceptron (MLP), support vector machine (SVM), and random forest (RndForest) algorithms for comparison. Sequential feature selection, employing logistic regression with five-fold cross-validation in the training group, was performed to avoid model overfitting. For comparison purposes, a model was created using only clinical data with age and P/F d3 (Model B).
3. Results
A total of 110 patients were enrolled in the study, with a mean age of 63.2±11.92 (26-83 years). The gender distribution revealed an expected predominance of males, constituting 61.2% (n=68) of the cohort. Severe ARDS was present in 25% (17) of patients. The overall mortality rate was 47.3% (52). Further epidemiological characteristics are displayed in Figure 1 and Table 1.
Figure 1 shows the majority of patients had moderate ARDS based on P/F ratio with severe ARDS more common in the 60-80 age group and more common in males.
Table 1 shows 61.2% of patients were male and overall mortality was 47.3%. The average age was 63.2% (min 26; max 83 ) and average P/F ratio on admission was 148.5 (min 51 max 297). Average P/F ratio increases at day 3 (163.73). Average PEEP at day 1 is 12.76 and 11.61 at day 3.
Table 2 shows how DLF increase sensitivity from 0.643 (model B) to 0.714 (model A; specificity from 0.711 to 0.778; positive predictive value (PPV) from 0.675 to 0.75 and AUC from 0.701 to 0.77. Regarding the Bayesian t-test results the probability of model A being better than model B was 0.739
3.1. Logistic Regression Analysis:
Utilising logistic regression analysis, the most influential variables were identified as age, PaO2/FiO2 at day one (P/F d1), PaO2/FiO2 at day three (P/F d3), and deep learning image features (DLF). Cross-validation using P/F d3, age, and DLF demonstrated optimal performance metrics.
3.2. Model Performance
The models incorporating DLF exhibited a 89% probability of superior accuracy for logistic regression (LogReg) and 82% for multilayer perceptron (MLP) compared to the clinical variables-only model (Model B). Within the internal test group (23 patients), the LogReg model emerged as the most robust, yielding an area under the ROC curve (AUC) of 0.862 with a 95% confidence interval [0.654, 0.969], an accuracy of 0.783 (95% CI [0.563, 0.926]), and an F1 score of 0.783 (95% CI [0.563, 0.926]). Detailed results in Table 4.
3.3. Comparative Analysis:
The same analysis was repeated using only clinical variables and P/F d3, revealing an AUC of 0.77. Notably, enhanced classification performance was observed when incorporating CNN-extracted image features.
3.4. Cross-Validation Significance:
Cross-validation, crucial for reducing bias and accounting for outliers within the same population, was employed. This approach is particularly significant in small population studies, ensuring robustness in the analysis and interpretation of the results. Figure 2 and Table 3.
Figure 2 shows cross validation sensitivity and specificity of both models by logistic regression and MLP, with model A, which includes DLF, performing better than model B.
Table 3 uses cross validation, which is important when using small populations. Again the contribution of DLF is sustained. With AUC improving from 0.701 (CI 0.593-0.794) to 0.77 (CI 0.667-0.853). Improvement was greater in PPV 0.75 (CI 0.558-0.839) from 0.675 (CI 0.509-0.814); than NPV which improved from 0.714 (CI 0.554-0.843) to 0.744 (CI 0.596-0.861).
Figure 3 show the individual contribution of the three selected features on the final model using logistic regression.
Figure 3 shows the contribution of the three selected features on the model using logistic regression. So increasing age and decreasing P/F being associated with mortality (the positive outcome). DLF result from the concatenated images of CXR at day1 and day 3.
4. Discussion
In the evolving landscape of Acute Respiratory Distress Syndrome (ARDS) research, the utilization of machine learning techniques, particularly in conjunction with chest radiography, holds promise for providing valuable insights into the prediction of mortality and severity in patients with COVID-19-associated ARDS (C-ARDS). This study explored the association between image features extracted from chest radiographs and patient outcomes, emphasising the evolving nature of chest imaging in the first 72 hours of invasive mechanical ventilation. Our main message is that we proved that integrating deep learning image features in the logistic regression model exhibited superior predictive accuracy, providing valuable insights into mortality prediction in C-ARDS patients. The robust performance metrics, especially within the internal test group, underscore the potential clinical utility of the proposed model.
In the dynamic and continually advancing field of ARDS research, integrating machine learning techniques, particularly in tandem with chest radiography, presents a transformative avenue with substantial promise. This synergistic approach has the potential to yield profound insights into predicting not only the mortality outcomes but also the severity of ARDS in afflicted patients. The confluence of machine learning and chest radiography stands as a cutting-edge paradigm, poised to enhance our understanding of ARDS's intricate dynamics and nuanced manifestations, ultimately contributing to more effective and personalized approaches in patient management.
The evolving landscape of ARDS research reflects a growing recognition of the complexities inherent in this critical medical condition. Traditional methodologies have encountered challenges in addressing the heterogeneity of ARDS, emphasizing the need for innovative and sophisticated techniques to unravel its multifaceted nature. In this context, the amalgamation of machine learning and chest radiography emerges as a revolutionary strategy, offering a comprehensive and nuanced perspective on the predictive factors influencing both mortality and severity in ARDS patients.
Machine learning, with its capacity to discern patterns and relationships within vast datasets, complements the intricacies of ARDS by providing a data-driven framework for analysis. Integrating these advanced computational methods with chest radiography, a widely accessible imaging modality, establishes a powerful synergy. This combined approach capitalizes on the detailed information embedded in radiographic images, enabling the identification of subtle yet clinically significant features that may elude conventional diagnostic and prognostic assessments.
The promise lies not only in the ability to predict mortality outcomes but also in gauging the severity of ARDS, a crucial aspect that influences the trajectory of patient care. By harnessing the potential of machine learning algorithms to analyse intricate radiographic details, the predictive model becomes more adept at discerning the nuances of disease progression, thereby contributing to a more nuanced understanding of ARDS severity.
This integrated approach is not merely confined to a technological juxtaposition but represents a fundamental shift in the paradigm of ARDS research. It transcends the conventional boundaries of diagnostic and prognostic methodologies, offering a holistic and data-driven framework that aligns with the evolving complexities of ARDS pathophysiology. As a result, this innovative synthesis of machine learning and chest radiography stands poised to redefine the landscape of ARDS research, ushering in a new era of precision medicine and personalized patient care.
The challenges in ARDS treatment have been underscored by its inherent heterogeneity. The RECOVERY trial [13]demonstrated a mortality benefit of steroids in mechanically ventilated patients fulfilling the Berlin criteria, particularly in those with COVID-19-associated ARDS (C-ARDS), suggesting a potential subgroup homogeneity. However, the applicability of steroids across all ARDS cases remains uncertain, as evidenced by varying outcomes in ARDS secondary to influenza [22,23].
Our study delves into the predictive capacity of deep learning features extracted from chest radiographs, surpassing the predictive capability of the P/F ratio in terms of mortality. This finding aligns with the evolving trend in ARDS research, which emphasizes the importance of integrating lung morphology assessments in patient management. Studies have traditionally focused on radiographic assessment of lung edema (RALE), which was validated using patients in the ARDS Network Fluid and Catheter Treatment Trial[24]. Studies have found the RALE score to be correlated with ARDS severity [25,26]and survival [27] but this score requires specific training to reduce in observer variability.
Recent studies using imaging patterns to tailor ventilation strategies, have had mixed outcomes. The LIVE trial, for instance, indicated that personalization based on CT-based image classification did not decrease mortality, potentially due to misclassification and subsequent mismatch in ventilator strategies [28].
Our study sheds light on the evolving nature of chest imaging within the first 72 hours of invasive mechanical ventilation, revealing a strong correlation with mortality. Unlike baseline images, [29,30], this temporal relationship aligns with recent studies highlighting the prognostic value of changes in imaging parameters over time [29].
Lung ultrasound has also emerged as promising in distinguishing between focal and non focal ARDS [31,32] and trials are ongoing regarding lung ultrasound patterns and personalized mechanical ventilation. However, lung ultrasound is operator dependent and more time consuming.
Integrating multi-source data becomes imperative as ARDS research transitions towards a phenotyping strategy. This study, leveraging data readily available in the ICU, demonstrates the potential for achieving a robust predictive model. Nevertheless, the study's limitations, including its retrospective nature and relatively small population size, warrant prospective validation to enhance its clinical utility.
Given the high volume of images and cost-effectiveness, chest radiography emerges as an appealing modality for machine learning applications. Unlike chest tomography, bedside chest radiographs offer the advantage of being readily accessible and conducive to repeated examinations, facilitating the assessment of disease progression. However, limitations in available data necessitated the selection of clinical variables. Notably, comprehensive data on ventilation parameters, including driving pressure and plateau pressure, were not uniformly obtainable within the specified time frame. Consequently, the PaO2/FiO2 ratio (P/F ratio) was chosen, despite its susceptibility to influence from positive end-expiratory pressure (PEEP).
5. Conclusions:
In conclusion, our findings underscore the significance of integrating chest radiography and machine learning in early mortality prediction in C-ARDS. The evolving aspect of chest imaging, particularly within the first 72 hours of invasive mechanical ventilation, emerges as a critical determinant of patient outcomes. As ARDS research advances towards a phenotyping strategy, we anticipate future studies will build upon our findings, combining multi-source data to refine treatment strategies for specific patient subgroups. Prospective validation is essential for establishing the clinical applicability of our predictive model, ultimately enabling early discussions and strategic planning for patients at higher risk of mortality in the critical care setting.
References
- The ARDS Definition Task Force*., ‘JAMA. 2012;307(23):2526-2533. [CrossRef]
- M. A. Matthay et al., ‘Acute respiratory distress syndrome’, Nat Rev Dis Primers, vol. 5, no. 1, 2018. [CrossRef]
- L. Orraine, B. W. Are, and A. M. Atthay, ‘The New Eng land Jour nal of Medicine T HE A CUTE R ESPIRATORY D ISTRESS S YNDROME’, 2000.
- N. J. Meyer, L. Gattinoni, and C. S. Calfee, ‘Acute respiratory distress syndrome’, The Lancet, vol. 398, no. 10300. Elsevier B.V., pp. 622–637, Aug. 14, 2021. [CrossRef]
- G. Grasselli et al., ‘ESICM guidelines on acute respiratory distress syndrome: definition, phenotyping and respiratory support strategies’, Intensive Care Med, vol. 49, no. 7, pp. 727–759, Jul. 2023. [CrossRef]
- M. A. Matthay et al., ‘A New Global Definition of Acute Respiratory Distress Syndrome’, Am J Respir Crit Care Med, Jul. 2023. [CrossRef]
- S. Yndrome and N. Etwork, ‘The New England Journal of Medicine VENTILATION WITH LOWER TIDAL VOLUMES AS COMPARED WITH TRADITIONAL TIDAL VOLUMES FOR ACUTE LUNG INJURY AND THE ACUTE RESPIRATORY DISTRESS SYNDROME A BSTRACT Background Traditional approaches to mechanical’, 2000. [Online]. Available: www.ardsnet.org.
- L. D. J. Bos and L. B. Ware, ‘Acute respiratory distress syndrome: causes, pathophysiology, and phenotypes’, The Lancet, vol. 400, no. 10358. Elsevier B.V., pp. 1145–1156, Oct. 01, 2022. [CrossRef]
- K. Wildi, S. Livingstone, C. Palmieri, G. LiBassi, J. Suen, and J. Fraser, ‘The discovery of biological subphenotypes in ARDS: a novel approach to targeted medicine?’, Journal of Intensive Care, vol. 9, no. 1. BioMed Central Ltd, Dec. 01, 2021. [CrossRef]
- M. V. Maddali et al., ‘Validation and utility of ARDS subphenotypes identified by machine-learning models using clinical data: an observational, multicohort, retrospective analysis’, Lancet Respir Med, vol. 10, no. 4, pp. 367–377, Apr. 2022. [CrossRef]
- A. W. Thille et al., ‘Comparison of the Berlin Definition for Acute Respiratory Distress Syndrome with Autopsy’, Am J Respir Crit Care Med, vol. 187, no. 7, pp. 761–767, Apr. 2013. [CrossRef]
- J. Reilly, C. Calfee, and J. Christie, ‘Acute Respiratory Distress Syndrome Phenotypes’, Semin Respir Crit Care Med, vol. 40, no. 01, pp. 019–030, Feb. 2019. [CrossRef]
- ‘Dexamethasone in Hospitalized Patients with Covid-19’, New England Journal of Medicine, vol. 384, no. 8, pp. 693–704, Feb. 2021. [CrossRef]
- S. R. Lewis, M. W. Pritchard, C. M. Thomas, and A. F. Smith, ‘Pharmacological agents for adults with acute respiratory distress syndrome’, Cochrane Database of Systematic Reviews, vol. 2019, no. 7, Jul. 2019. [CrossRef]
- J. Villar et al., ‘Dexamethasone treatment for the acute respiratory distress syndrome: a multicentre, randomised controlled trial’, Lancet Respir Med, vol. 8, no. 3, pp. 267–276, Mar. 2020. [CrossRef]
- S. Le et al., ‘Supervised machine learning for the early prediction of acute respiratory distress syndrome (ARDS)’, J Crit Care, vol. 60, pp. 96–102, Dec. 2020. [CrossRef]
- L. Bitker, D. Talmor, and J. C. Richard, ‘Imaging the acute respiratory distress syndrome: past, present and future’, Intensive Care Med, vol. 48, no. 8, pp. 995–1008, Aug. 2022. [CrossRef]
- N. Reamaroon, M. W. Sjoding, J. Gryak, B. D. Athey, K. Najarian, and H. Derksen, ‘Automated detection of acute respiratory distress syndrome from chest X-Rays using Directionality Measure and deep learning features’, Comput Biol Med, vol. 134, Jul. 2021. [CrossRef]
- M. W. Sjoding et al., ‘Deep learning to detect acute respiratory distress syndrome on chest radiographs: a retrospective study with external validation’, Lancet Digit Health, vol. 3, no. 6, pp. e340–e348, Jun. 2021. [CrossRef]
- D. F. L. Filippini et al., ‘Latent class analysis of imaging and clinical respiratory parameters from patients with COVID-19-related ARDS identifies recruitment subphenotypes’, Crit Care, vol. 26, no. 1, p. 363, Nov. 2022. [CrossRef]
- A. Giełczyk, A. Marciniak, M. Tarczewska, and Z. Lutowski, ‘Pre-processing methods in chest X-ray image classification’, PLoS One, vol. 17, no. 4 April, Apr. 2022. [CrossRef]
- G. Moreno et al., ‘Corticosteroid treatment in critically ill patients with severe influenza pneumonia: a propensity score matching study’, Intensive Care Med, vol. 44, no. 9, pp. 1470–1482, Sep. 2018. [CrossRef]
- M. J. Tsai et al., ‘Impact of corticosteroid treatment on clinical outcomes of influenza-associated ARDS: a nationwide multicenter study’, Ann Intensive Care, vol. 10, no. 1, Dec. 2020. [CrossRef]
- ‘Comparison of Two Fluid-Management Strategies in Acute Lung Injury’, New England Journal of Medicine, vol. 354, no. 24, pp. 2564–2575, Jun. 2006. [CrossRef]
- M. A. Warren et al., ‘Severity scoring of lung oedema on the chest radiograph is associated with clinical outcomes in ARDS’, Thorax, vol. 73, no. 9, pp. 840–846, Sep. 2018. [CrossRef]
- Y. R. Sedhai et al., ‘Validating Measures of Disease Severity in Acute Respiratory Distress Syndrome’, Ann Am Thorac Soc, vol. 18, no. 7, pp. 1211–1218, Jul. 2021. [CrossRef]
- M. Jabaudon et al., ‘Early Changes Over Time in the Radiographic Assessment of Lung Edema Score Are Associated With Survival in ARDS’, Chest, vol. 158, no. 6, pp. 2394–2403, Dec. 2020. [CrossRef]
- J.-M. Constantin et al., ‘Personalised mechanical ventilation tailored to lung morphology versus low positive end-expiratory pressure for patients with acute respiratory distress syndrome in France (the LIVE study): a multicentre, single-blind, randomised controlled trial’, Lancet Respir Med, vol. 7, no. 10, pp. 870–880, Oct. 2019. [CrossRef]
- C. M. A. Valk et al., ‘The Prognostic Capacity of the Radiographic Assessment for Lung Edema Score in Patients With COVID-19 Acute Respiratory Distress Syndrome—An International Multicenter Observational Study’, Front Med (Lausanne), vol. 8, Jan. 2022. [CrossRef]
- J. Herrmann et al., ‘COVID-19 Induced Acute Respiratory Distress Syndrome—A Multicenter Observational Study’, Front Med (Lausanne), vol. 7, Dec. 2020. [CrossRef]
- S. Mongodi, E. Santangelo, B. Bouhemad, R. Vaschetto, and F. Mojoli, ‘Personalised mechanical ventilation in acute respiratory distress syndrome: the right idea with the wrong tools?’, Lancet Respir Med, vol. 7, no. 12, p. e38, Dec. 2019. [CrossRef]
- C. Pierrakos et al., ‘Lung Ultrasound Assessment of Focal and Non-focal Lung Morphology in Patients With Acute Respiratory Distress Syndrome’, Front Physiol, vol. 12, Sep. 2021. [CrossRef]
Figure 1.
Distribution of ARDS severity at day 1 of IMV based on pf_d1 a) Distribution of ARDS severity by age b) Distribution of ARDS severity by gender.
Figure 1.
Distribution of ARDS severity at day 1 of IMV based on pf_d1 a) Distribution of ARDS severity by age b) Distribution of ARDS severity by gender.
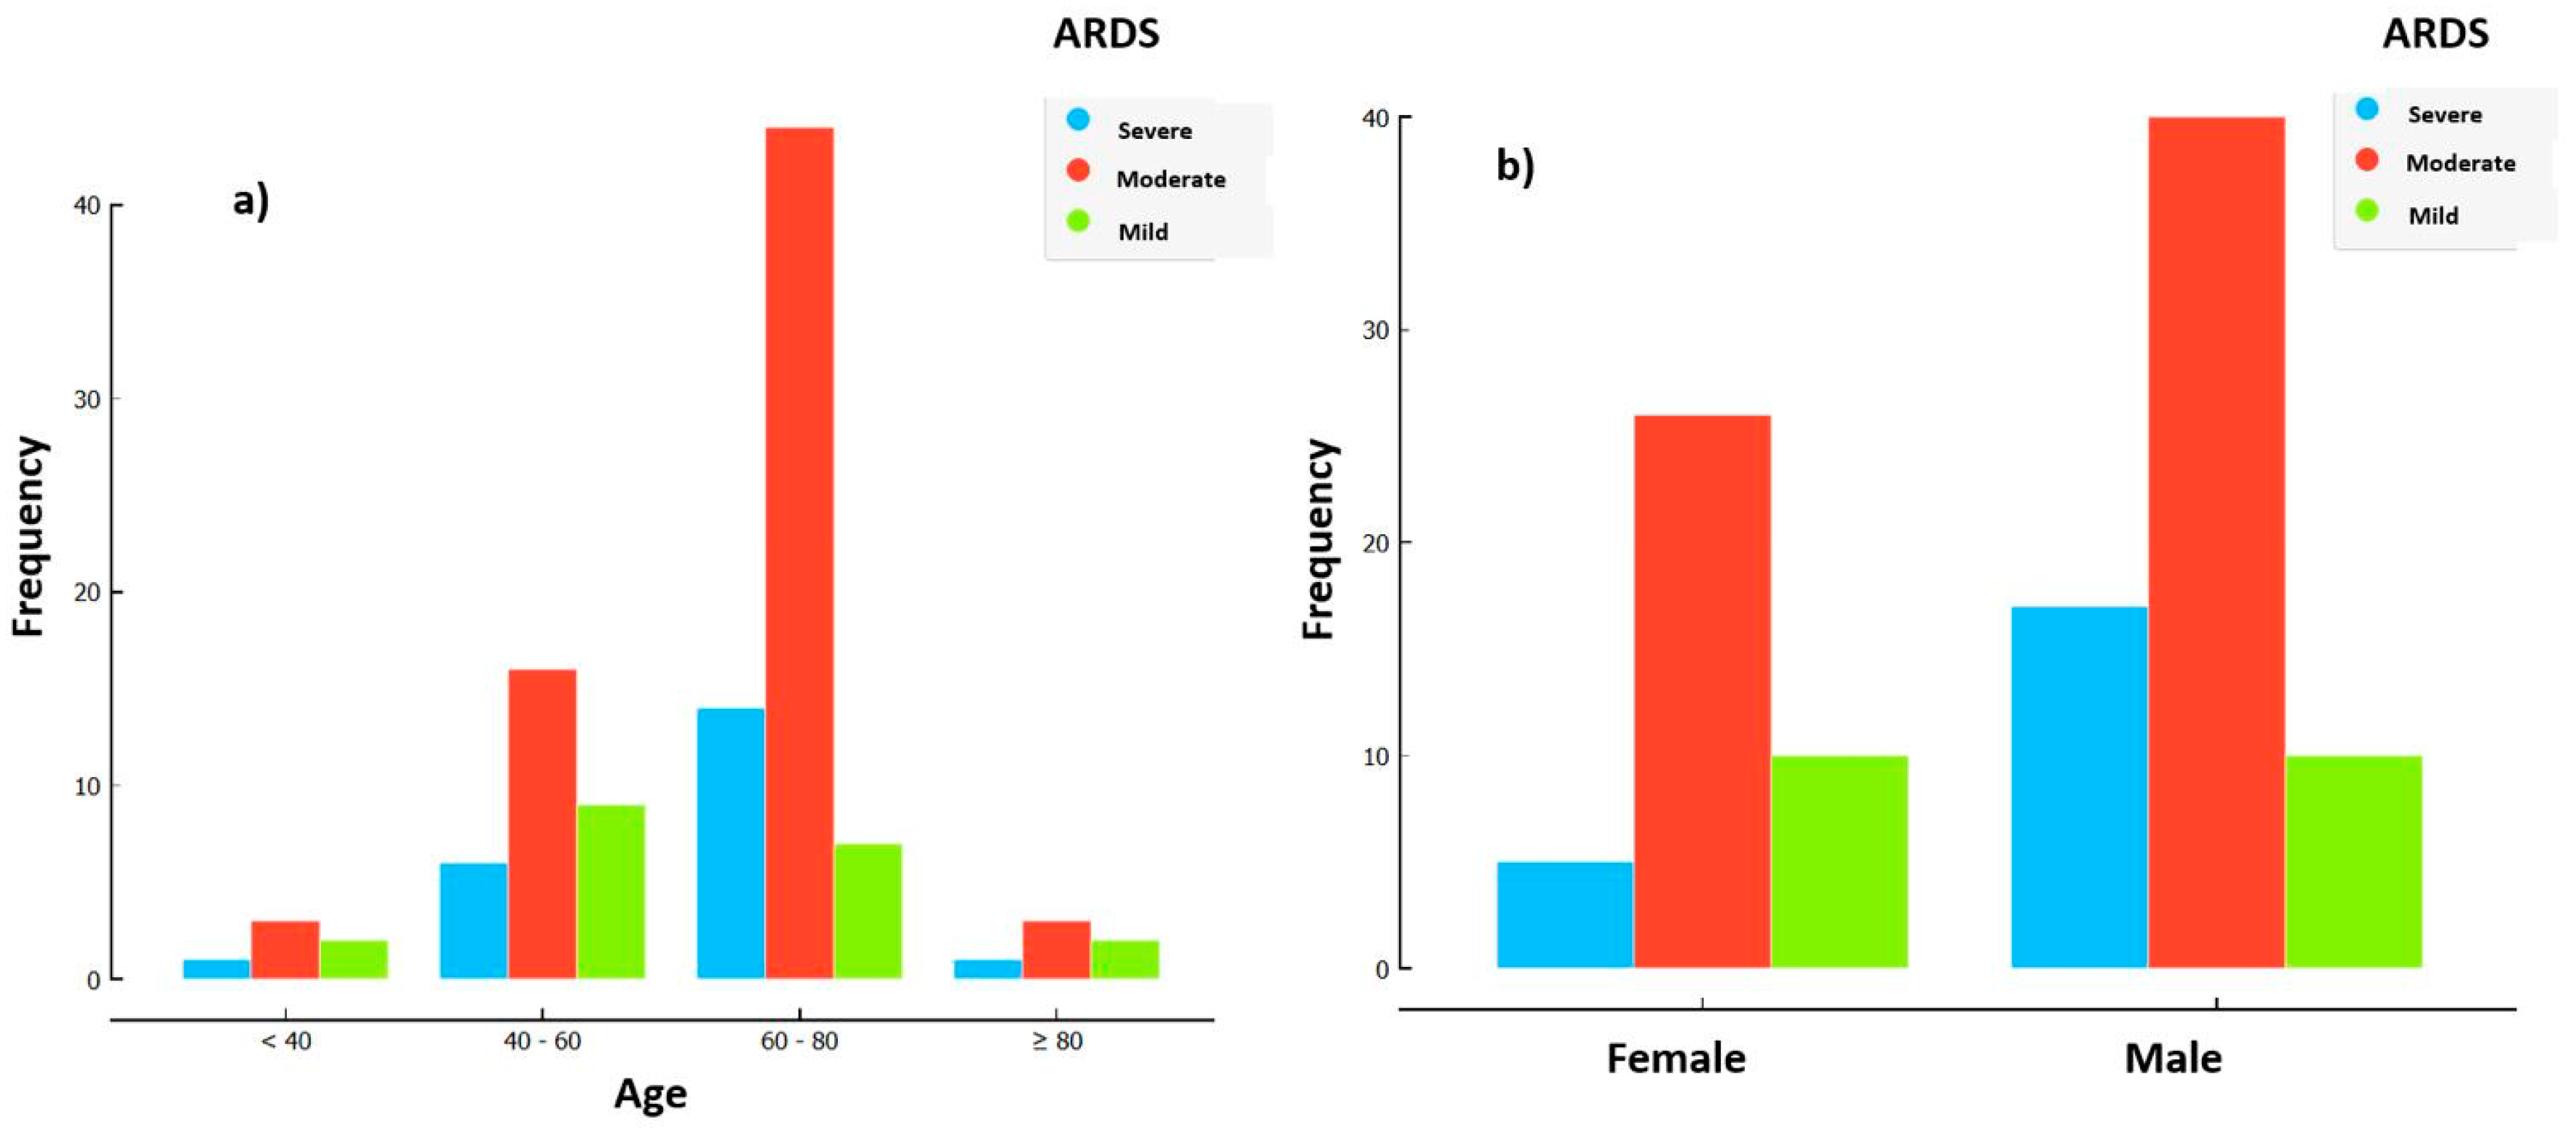
Figure 2.
Cross-validation sensitivity and specificity of model A and model B by logistic regression and MLP.
Figure 2.
Cross-validation sensitivity and specificity of model A and model B by logistic regression and MLP.
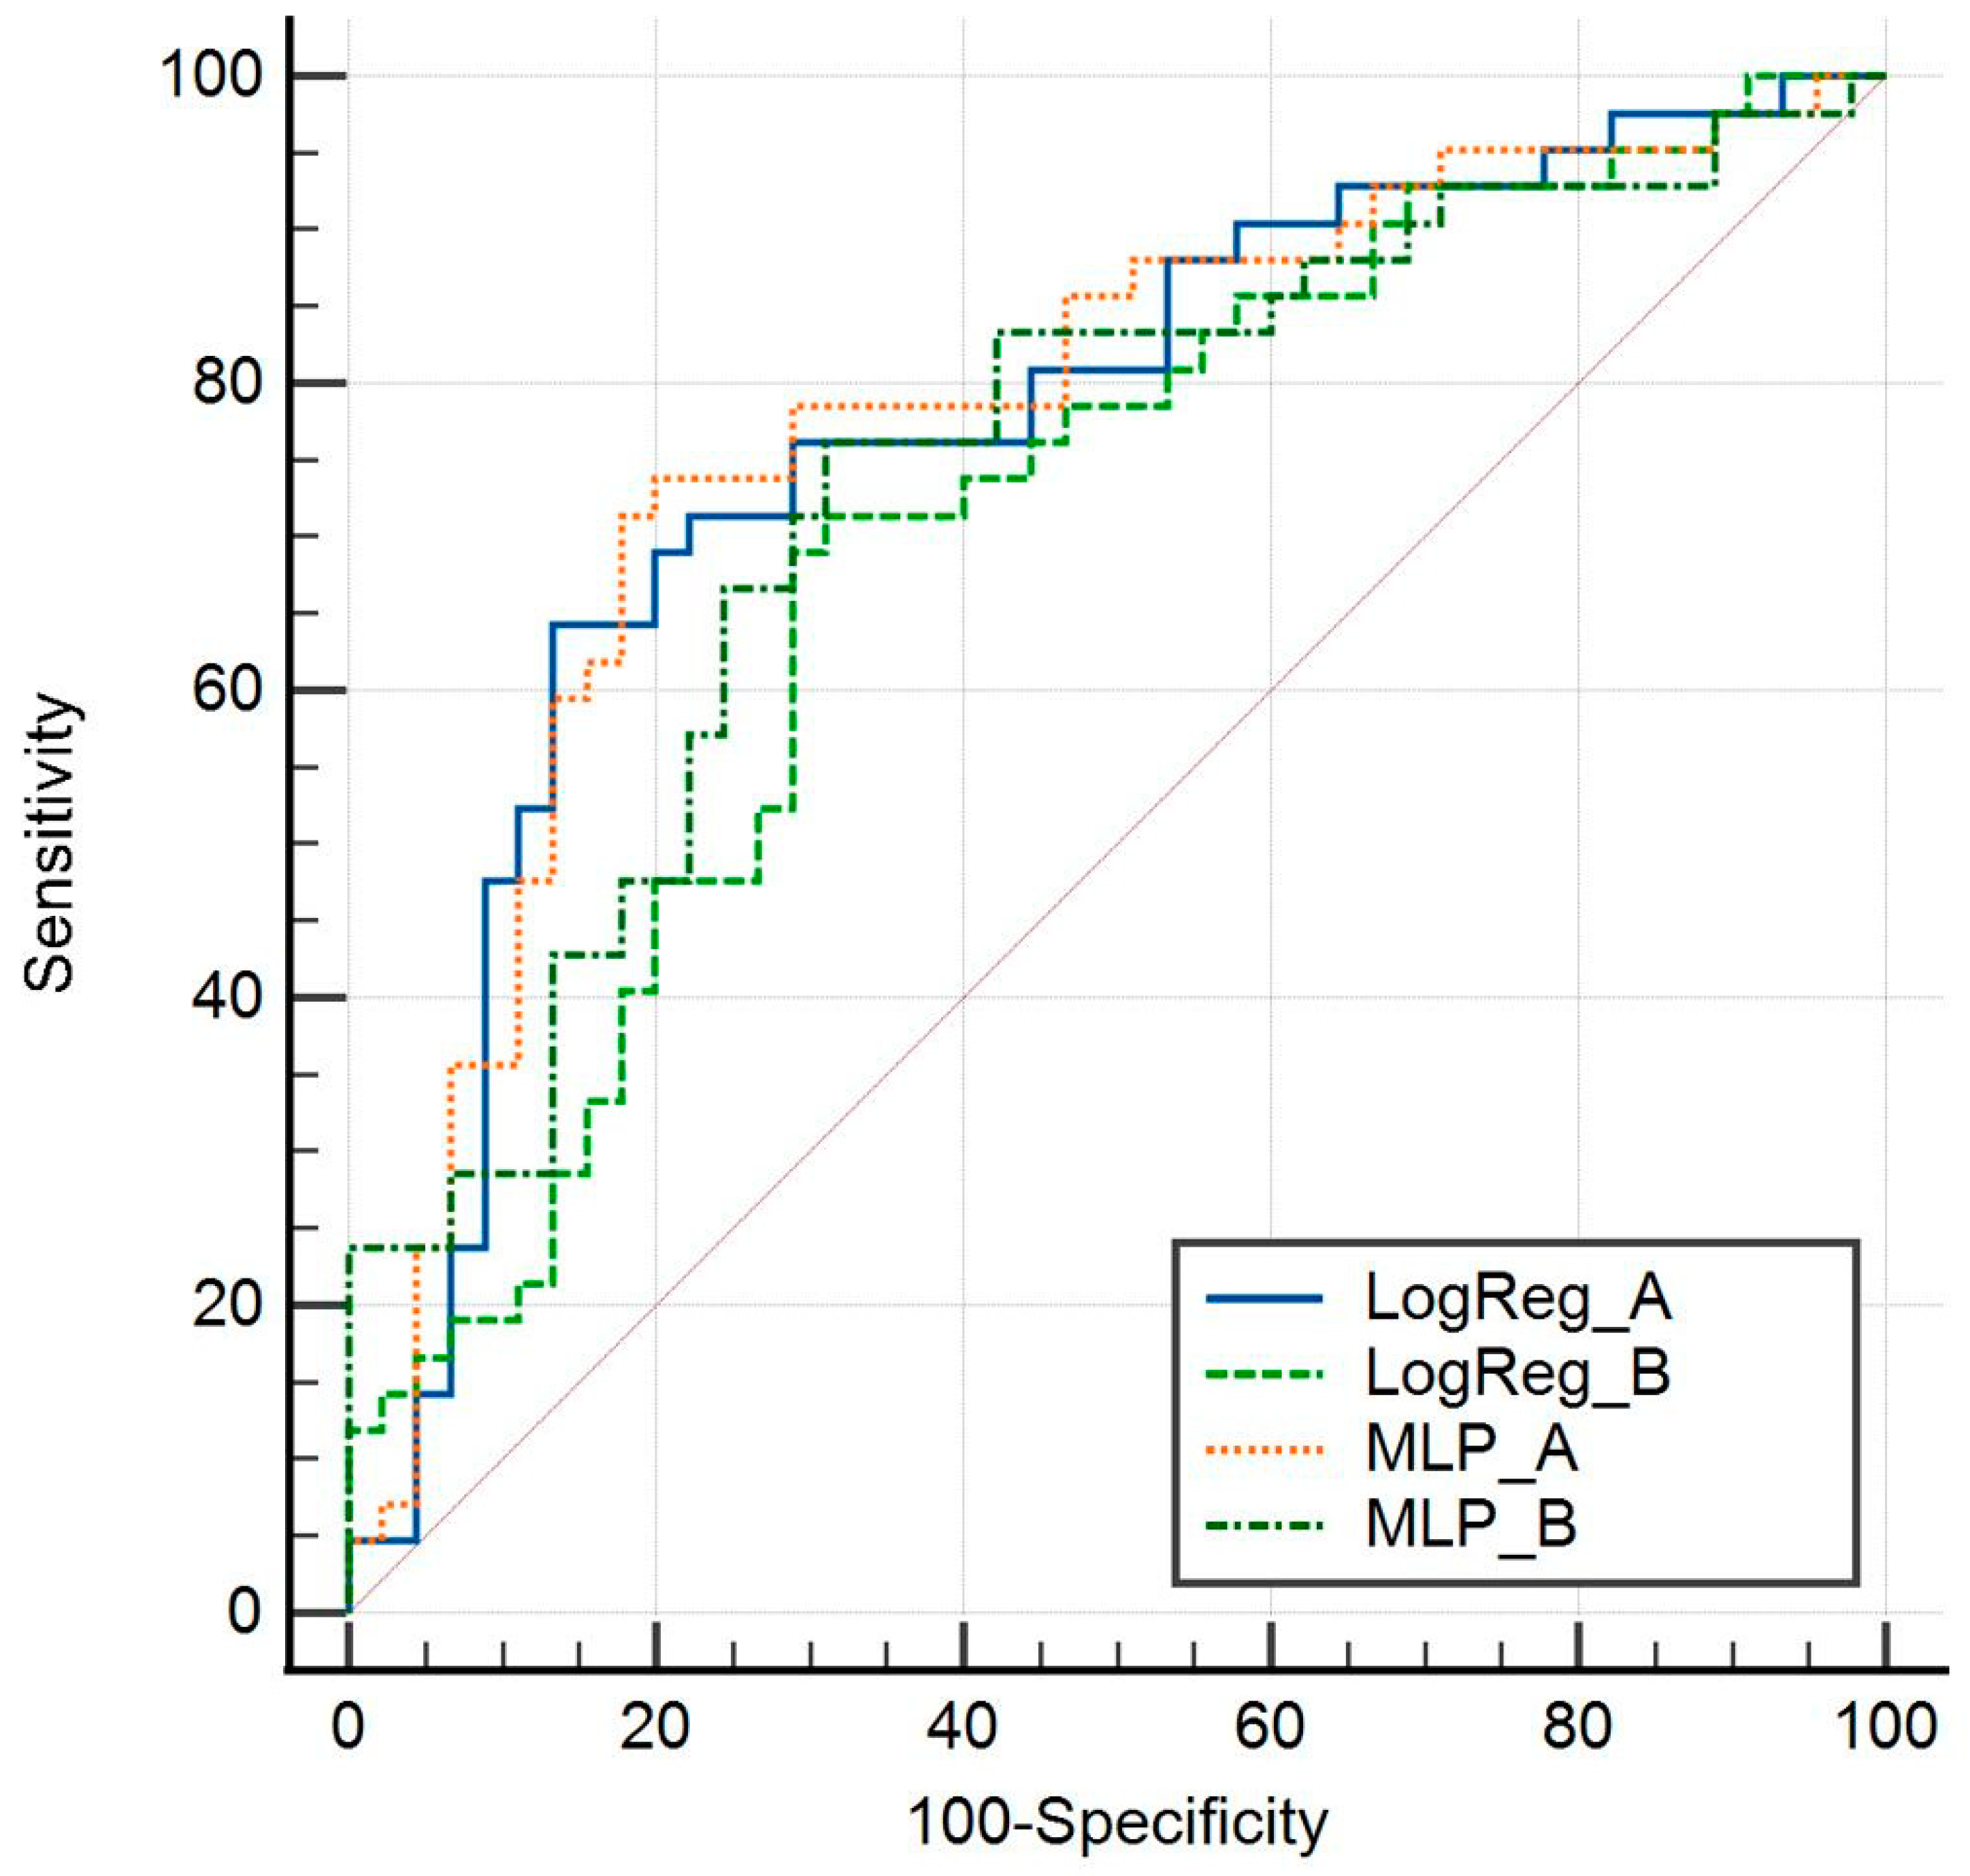
Figure 3.
SHAP values (contribution in training prediction).
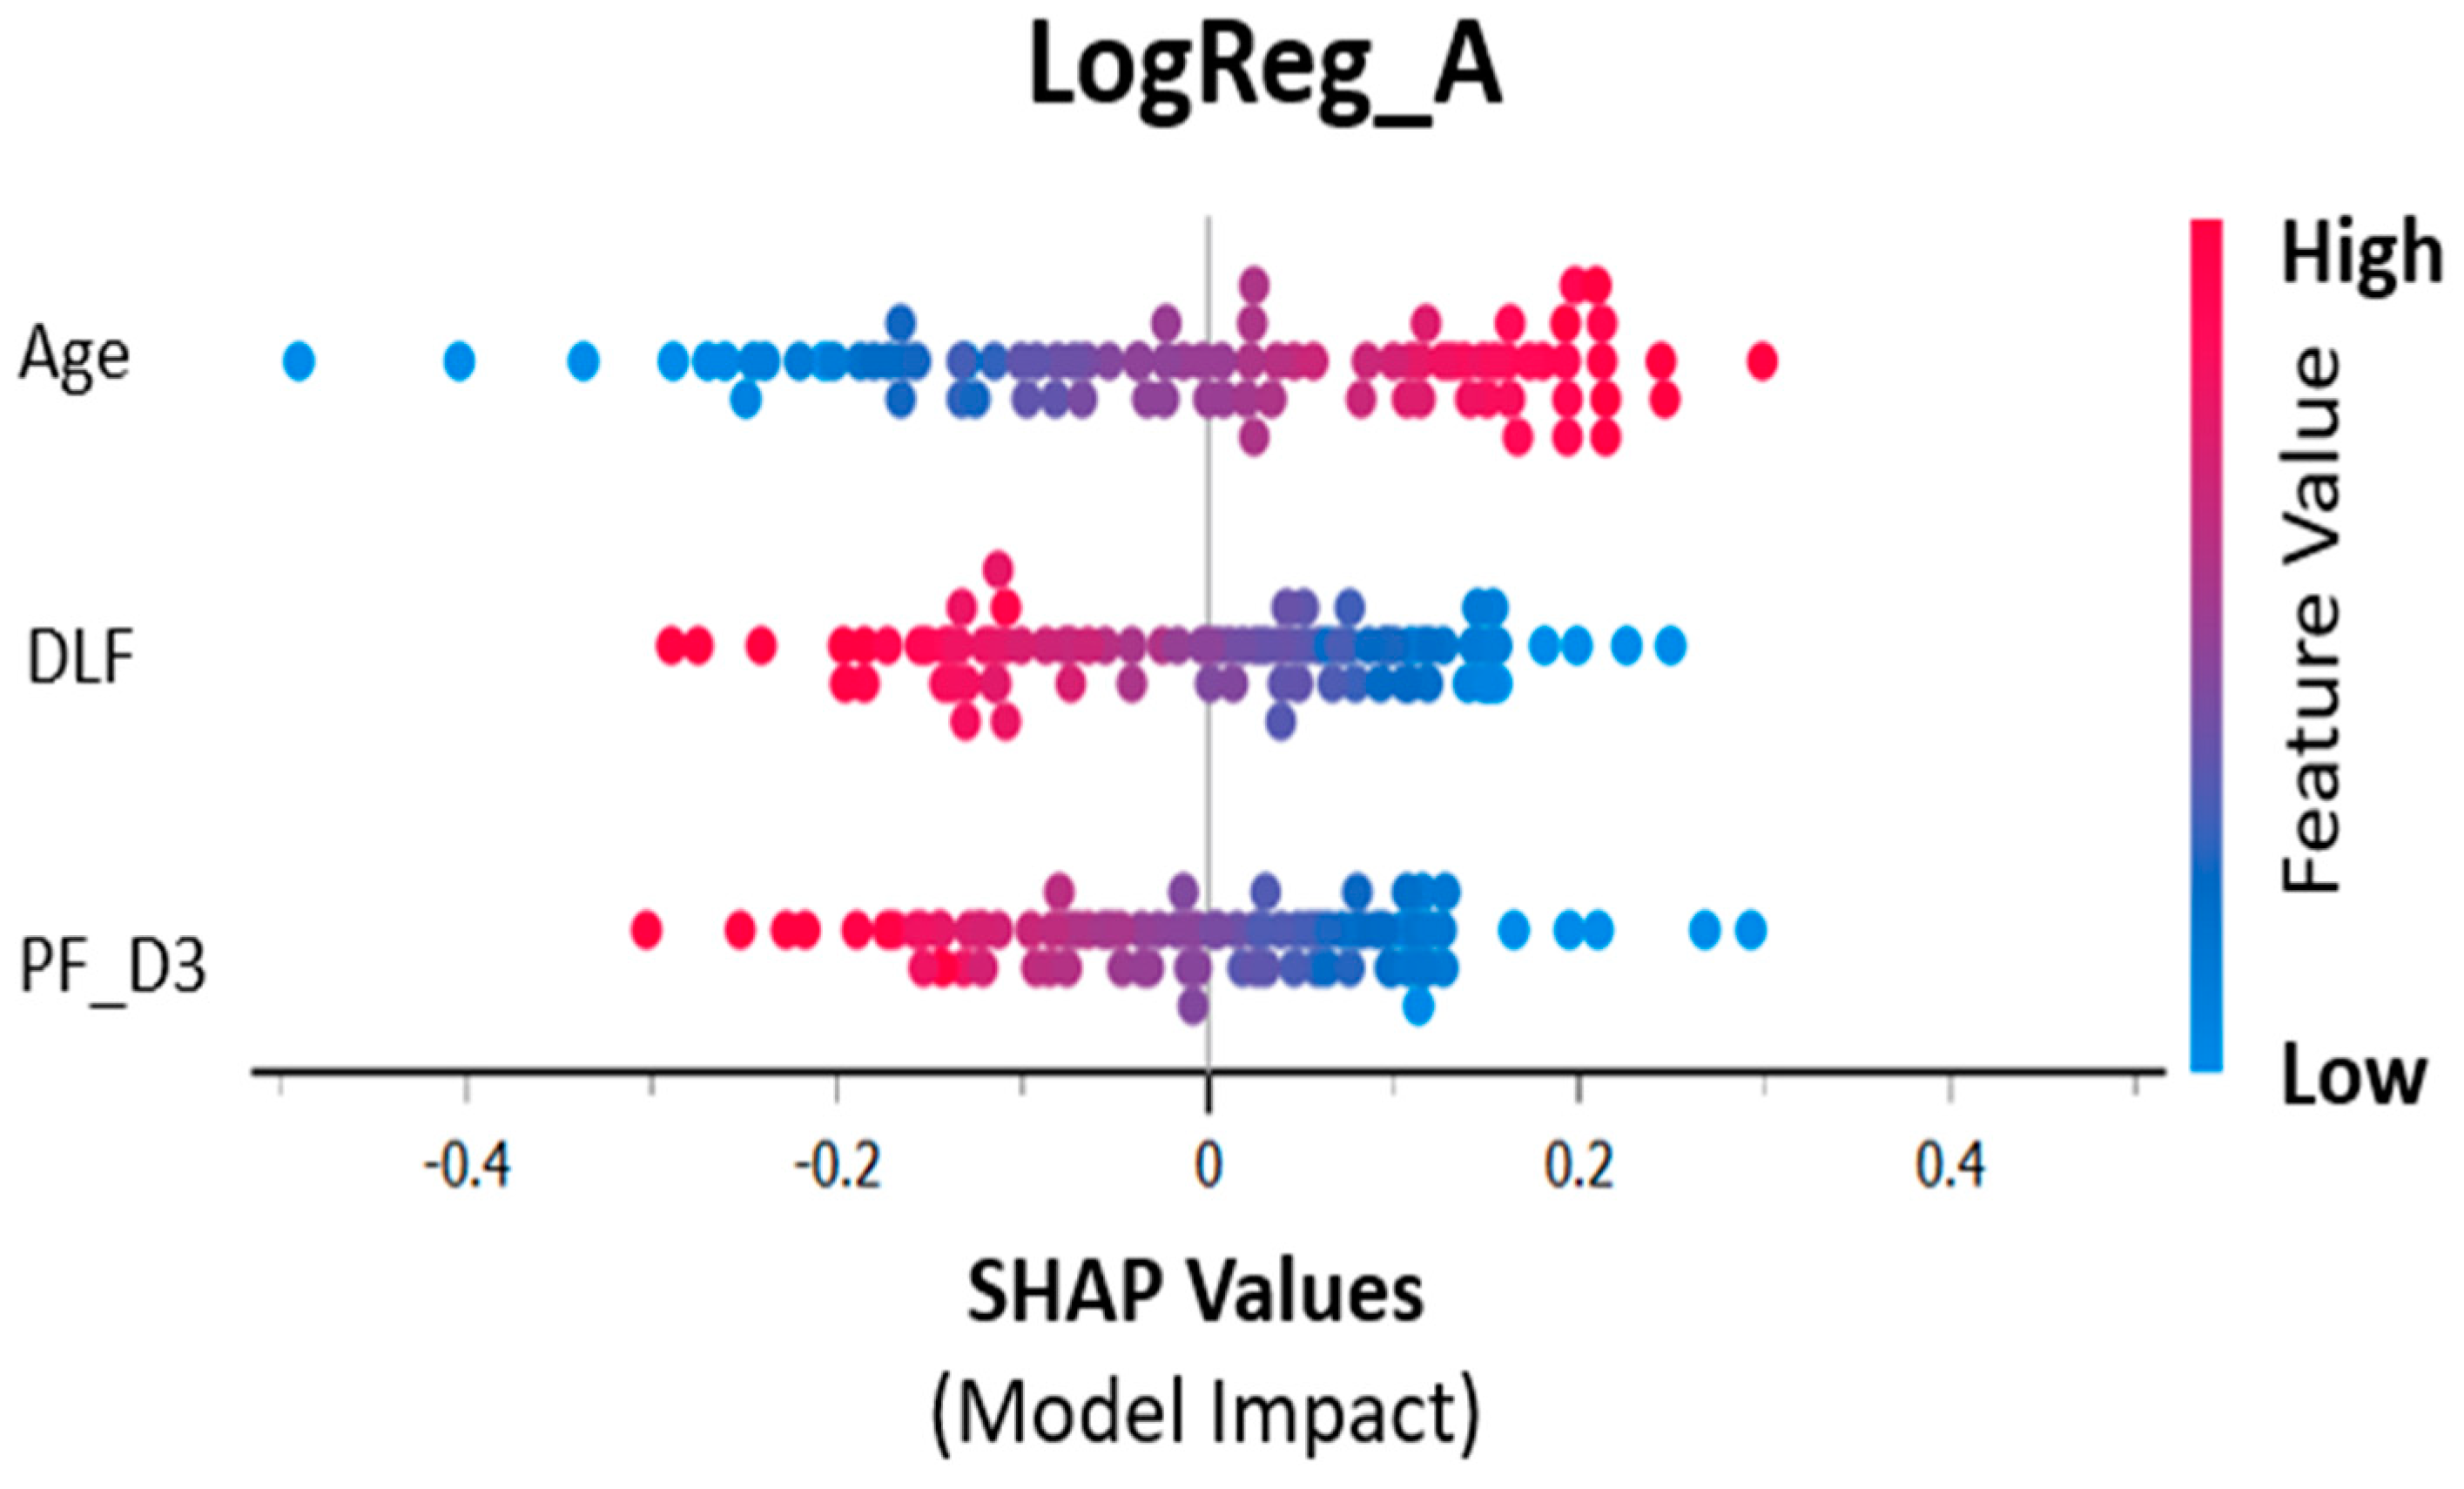

Table 1.
Descriptive statistics of the total database.
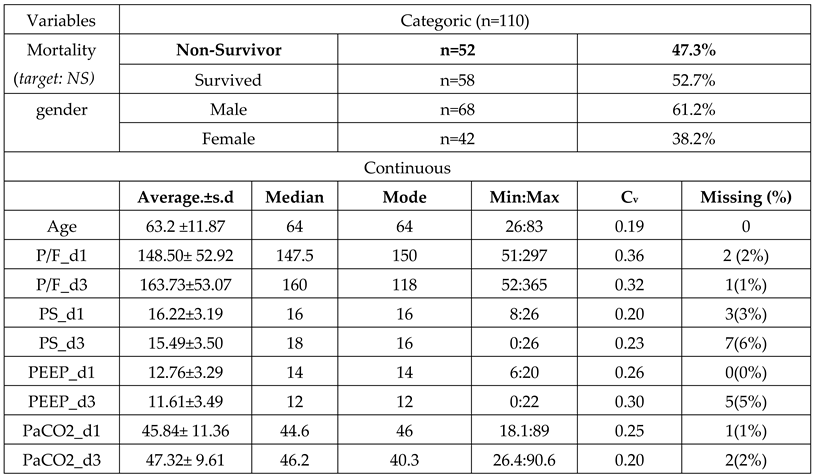 |
Figure legend: n=number of samples; NS=Non-Survivor; mean.±d.p = mean ± standard deviation; Min:Max = Minimum and maximum values of the variable; Cv=coefficient of variation; Missing(%) = Percentage of missing samples. In bold is the target class.
Table 2.
Average of the performance metrics of the LogReg_A and LogReg_B models with their Bayesian t-test results.
Table 2.
Average of the performance metrics of the LogReg_A and LogReg_B models with their Bayesian t-test results.
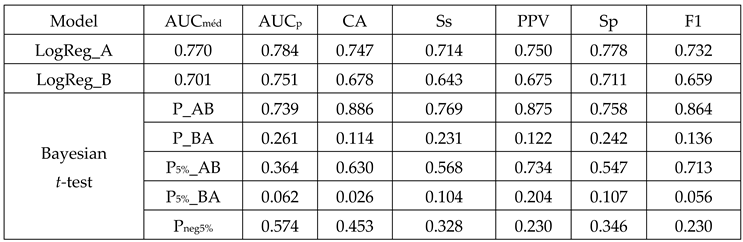 |
Figure legend:P_AB = Probability of model A being better than B; P_BA = Probability of model B being better than model A; P5%_AB = Probability of model A being better than model B considering a negligible 5% performance difference; P5%_BA = Probability of model B being better than A. considering a negligible 5% performance difference; Pneg5% = Probability of the models being identical considering a negligible performance difference of 5%. Higher Bold Odds. CA classification accuracy; Ss= sensitivity, Sp= specificity; PPV=positive predictive value F1=harmonic mean of PPV and sensitivity.
Table 4.
Performance metrics of the final model LogReg_A in the training group (LogReg_train), in cross validation (LogReg_CV) and test group (LogReg_Test). ΔCV_Train = Diference between metrics from training group ad cross validation. ΔTest Train = Difference between metrics of training group and test group.
| Metrics | LogReg_Train95%CI | LogReg_CV95%CI | LogReg_Test95%CI | ΔCV_Train | ΔTest Train |
|---|---|---|---|---|---|
| AUCmed | 0.820 [0.723-0.894] |
0.770 [0.667-0.853] |
0.862 [0.654-0.969] |
-0.092 | 0.042 |
| AUCp | 0.820 | 0.784 | 0.862 | -0.036 | 0.042 |
| CA | 0.782 [0.681-0.863] |
0.747 [0.643-0.834] |
0.783 [0.563-0.926] |
-0.035 | -0.0 |
| F1 | 0.776 [0.672-0.859] |
0.732 [0.623-0.824] |
0.783 [0.563-0.926] |
-0.044 | 0.007 |
| PPV | 0.767 [0.623-0889] |
0.750 [0.588-0.873] |
0.692 [0.385-0.909] |
-0.026 | 0.084 |
| NPV | 0.795 [0.647- 0.902] |
0.744 [0.596- 0.861] |
0.900 [0.555-0.997] |
-0.051 | 0.105 |
| Ss | 0.787 [0.633-0.898] |
0.714 [0.554-0.843] |
0.900 [0.555-0.997] |
-0.073 | 0.113 |
| Sp | 0.778 [0.629-0.888] |
0.778 [0.629-0.888] |
0.692 [0.385-0.909] |
0.000 | -0.086 |
Figure legend: Positive Predictive value (PPV), Negative Predictive value (NPV), Sensitivity (Ss), Specificity (Sp), F1=harmonic mean of PPV and sensitivity, classification accuracy (CA).
Table 3.
Cross-validation analysis by logistic regression.
| Metric | LogReg_A | LogReg_B | ΔA-B |
|---|---|---|---|
|
AUCmed |
0.770 95%CI [0.667-0.853] |
0.701 95%CI [0.593-0.794] |
0.069 |
|
CA |
0.747 95%CI [0.643- 0.834] |
0.678 95%CI [0.569-0.774] |
0.069 |
|
PPV |
0.750 95%CI [0.588- 0.873] |
0.675 95%CI [0.509-0.814] |
0.075 |
|
Sensitivity |
0.714 95%CI [0.554- 0.843] |
0.643 95%CI [0.480-0.784] |
0.071 |
|
NPV |
0.744 95%CI [0.596- 0.861] |
0.714 95%CI [0.554- 0.843] |
0.081 |
|
Specificity |
0.778 95%CI [0.629- 0.888] |
0.711 95%CI [0.560-0.834] |
0.067 |
|
F1 |
0.732 95%CI [0.623-0.824] |
0.659 95%CI [0.546-0.760] |
0.073 |
Figure legend: Positive Predictive value (PPV), Negative predicted value (NPV) , Sensitivity (Ss),Specificity (Sp); classification accuracy (CA), F1=harmonic mean of PPV and sensitivity.
Disclaimer/Publisher’s Note: The statements, opinions and data contained in all publications are solely those of the individual author(s) and contributor(s) and not of MDPI and/or the editor(s). MDPI and/or the editor(s) disclaim responsibility for any injury to people or property resulting from any ideas, methods, instructions or products referred to in the content. |
© 2024 by the authors. Licensee MDPI, Basel, Switzerland. This article is an open access article distributed under the terms and conditions of the Creative Commons Attribution (CC BY) license (http://creativecommons.org/licenses/by/4.0/).
Copyright: This open access article is published under a Creative Commons CC BY 4.0 license, which permit the free download, distribution, and reuse, provided that the author and preprint are cited in any reuse.


