
Submitted:
28 January 2024
Posted:
29 January 2024
You are already at the latest version
Abstract
This research delves into the intricate challenges confronting the agricultural sector, with a specialized focus on mitigating infections in tomato crops, particularly powdery mildew induced by the Leveillula Taurica pathogen. Tomatoes, renowned for their nutritional richness, are vital to global food security. However, conventional methodologies for disease detection exhibit both laborious processes and limited accuracy. In response to these challenges, this study advocates for an innovative fusion of hyperspectral imaging and deep learning methodologies to detect crop disease and its severity. The systematic workflow commenced with the curation of a dataset, involving the acquisition of live images through OpenCV, followed by conversion to RGB format and subsequent feature extraction utilizing a pre-trained visual geometry group (VGG-16) model for enhanced analysis. Sequentially, RGB images were transformed into simulated hyperspectral images (SHSI) leveraging a Neural Network generator model, offering a distinctive viewpoint on spectral information. This novel approach transcends conventional constraints by delivering a three-dimensional perspective, seamlessly integrating spatial and spectral dimensions for holistic data acquisition. The SHSI is further transmuted into a 3D visualization cube comprehensive grasp of spatial and spectral aspects encompassing spectral, spatial, and Haralick features. The research concludes with severity detection, categorized as low, moderate, or high, employing a Gaussian Mixture Model (GMM) and K-means for visualization.
Keywords:
convolutional neural network (CNN)
; generative adversarial networks (GANs)
; gaussian mixture model (GMM)
; grapevine vein-clearing virus (GVCV)
; hyperspectral imaging (HSI)
; normalized difference vegetation index (NDVI)
; normalized difference water index (NDWI)
; principal component analysis (PCA)
; region of interest (ROI)
; simulated hyperspectral images (SHSI)
; visual geometry group (VGG-16)
1. Introduction
Tomatoes, renowned for their nutritional richness in minerals, vitamins, fiber, and amino acids, play a vital role in the global food supply. Researchers have also unveiled their potential in reducing cancer risks, elevating their significance in a balanced diet. However, the agricultural sector encounters formidable challenges, notably the persistent issue of tomato infections that impede sustained development. Among these challenges, powdery mildew, attributed to the Leveillula Taurica pathogen, emerges as a prevalent fungal ailment exacerbated by unpredictable weather patterns. The conventional methods of disease detection involve laborious processes, often relying on expert inspection through naked eye examination. This not only proves time-consuming but is also limited in its accuracy and location-specific nature [1].
Beyond the prevalent powdery mildew caused by the Leveillula Taurica pathogen, other fungal pathogens contribute to substantial crop losses. Plant diseases come in various forms, primarily categorized into microorganisms, viral, and fungal pathogens. Bacterial infections, caused by microorganisms, often result in symptoms like wilting, leaf spots, and cankers, profoundly impacting overall plant health. Fungal diseases represent a broad category of plant pathogens, with diverse impacts on agriculture. Oomycetes, often confused with fungi, cause diseases like late blight in crops such as potatoes and tomatoes. Additionally, various fungal species, including rusts, smuts, and damping-off agents, infect different plant parts, leading to symptoms ranging from leaf discoloration to seedling death. Moreover, the Figure 1 can elucidate the classification of plant diseases into three distinct types, clearly delineating which specific diseases fall under the categories of microorganism, viral, and fungal pathogens. This visual representation would serve to enhance the understanding of the diverse nature of plant diseases and their respective classifications within the broader spectrum of agricultural challenges. The intricate nature of fungal diseases underscores the importance of developing robust strategies for their identification and management in order to safeguard global crop production and food security.
In response to these agricultural impediments, this research proposes an innovative solution by integrating hyperspectral imaging and deep learning techniques to detect crop disease and its severity. Powdery mildew severity in tomato plants is to be assessed through the conversion of normal images into hyperspectral-like representations. This approach presents a shift towards more efficient disease detection and management. The use of hyperspectral imaging brings a three-dimensional perspective, amalgamating spatial and spectral dimensions. This comprehensive data collection surpasses the capabilities of traditional RGB and multispectral imaging, capturing rich spectral information across hundreds or even thousands of spectral bands.
Despite the promising prospects of hyperspectral imaging, challenges such as expensive and specialized hardware, and limitations in spatial and temporal resolutions persist. Researchers, however, are exploring computational methods for reconstructing hyperspectral data from RGB measurements. This opens up potential applications, ranging from data augmentation for deep neural network training to computational scene imaging. With improvements in spectroscopy and imaging technologies in recent decades, hyperspectral imaging (HSI) technology has evolved as a highly efficient non-destructive measuring approach. Originally developed for remote sensing, this technology is now widely utilised in resource management, agriculture, mineral exploration, and environmental monitoring. Certain features of the tomato leaf allow HSI to be used to check its water condition. Tomato leaves lose more than 90% of the water they take through transpiration, making them more vulnerable to water stress than other organs such as the fruit. In the pursuit of elucidating the intricacies of leaf morphological characteristics, a judiciously chosen region of interest (ROI) plays a pivotal role. The imaging protocol involved the deliberate application of a lone wavelength, precisely calibrated at 1390 nm. This specific wavelength is purposefully employed due to its capacity to capture minute features relevant to leaf morphology with heightened precision. The culmination of this meticulous approach is the generation of a two-dimensional image a sample of which is shown in Figure 2, portraying a detailed and refined representation of the leaf's morphological intricacies under the influence of the specified 1390 nm wavelength [3].
K. Lin et al. [4] introduces a novel deep learning scheme for powdery mildew infection representation, utilizing masked regions from a segmentation model for precise severity assessment. Distinguished by its simplicity and lack of reliance on expensive specialized imaging equipment, the proposed method outperforms traditional segmentation approaches, providing both area and shape information for disease regions. Comparative analysis with K-means, Random Forest, and Gradient Boosting Decision Tree methods highlights the superior representation ability of the deep learning-based approach. Nevertheless, it is essential to acknowledge certain limitations inherent in this methodology. Implementation of the proposed method necessitates the acquisition of images under controlled conditions, precluding its direct application in field settings. Furthermore, the restricted size and diversity of annotated datasets pose challenges, as their dataset lacks symptoms attributed to other disorders, potentially impacting the performance of deep learning methods, as highlighted by Barbedo [5]. Consequently, it becomes imperative to minimize the presence of other types of leaf damage to mitigate potential confounding factors. In the realm of plant disease detection, Lin et al. employ a novel deep learning approach using masked regions for powdery mildew severity assessment. While demonstrating superior performance, it is limited to controlled conditions. Nguyen et al. [6] published in Sensors, focuses on early plant viral disease detection through a synergistic combination of hyperspectral imaging and deep learning. This paper explores the use of hyperspectral imaging for early detection of Grapevine Vein-Clearing Virus (GVCV) in Chardonel grapevines. It investigates spectral differences, identifies important vegetation indices, and develops classification methods for early disease detection. The research introduces novel methodologies, including statistical tests to differentiate reflectance spectra between healthy and infected plants, as well as an exploratory analysis to identify crucial disease-centric vegetation indices. The predominant factor contributing to limitations in image-wise classification was the constrained sample size, consisting of only 40 images. In contrast, while both Vegetation Index (VI)-based and pixel-based methods primarily focused on spectral features, the image-based approach concurrently extracted joint spatial–spectral features. However, the inclusion of spatial features introduced potential noise, particularly evident in the highly fragmented portions of grapevines extracted instead of capturing the entirety of individual plants in each image. Nguyen et al. [6] explored hyperspectral imaging for early plant viral disease detection, facing challenges with a constrained sample size. Pushparaj et al. [7] makes a substantial contribution by conducting a comparative analysis of several Convolutional Neural Network (CNN)-based methods employed in hyperspectral image reconstruction. The evaluation utilizes the NTIRE 2020 challenge dataset and specifically examines the performance of distinct models, encompassing a 5-layer basic CNN, Enhanced-ResNet with 10 layers, and Dense-HSCNN. Through a meticulous exploration of these models, the study seeks to provide nuanced insights into their respective efficiencies. The ultimate goal is to identify the most effective model, thereby enhancing our understanding of hyperspectral imaging techniques and contributing to advancements in the field. The research is positioned as a valuable resource for practitioners seeking optimal strategies for hyperspectral image reconstruction. Pushparaj et al. [7] conduct a comparative analysis of CNN-based methods in hyperspectral image reconstruction, contributing valuable insights. L. Yan et al. [8] presents a pioneering CNN based framework designed for the recovery of hyperspectral information from RGB images. The innovation lies in the incorporation of prior category information, specifically pertaining to object material and coordinate data. By integrating this additional information, the proposed framework aims to enhance the stability and robustness of hyperspectral image reconstructions. A key contribution of the paper is the introduction of a comprehensive hyperspectral dataset, boasting 128 channels and accompanied by labeled prior information. This dataset not only serves as a benchmark for evaluating the efficacy of the introduced framework but also stands as a valuable resource for researchers engaged in the exploration and analysis of spectral imaging. Yan et al. present a CNN-based framework for hyperspectral information recovery, introducing a comprehensive dataset. Building upon these works, our proposed model integrates RGB to SHSI conversion, leveraging pretrained VGG-16, and incorporates Gaussian Mixture Models for precise severity determination. This innovative framework aims to address limitations in existing methods, offering a nuanced approach to enhance plant disease severity detection in agricultural settings.
Hence, the primary objectives of this project are as follows:
- Develop a deep learning model for converting standard RGB images into simulated hyperspectral images.
- Investigate the utility of simulated hyperspectral images for powdery mildew spot severity assessment in plants.
- Implement a feature extraction process for analyzing hyperspectral-like data to quantify disease severity.
- Evaluate the performance of the proposed system and its potential for practical application in agriculture.
2. Materials and Methods
The proposed research model unfolds through a meticulously designed series of steps, each contributing to an innovative and comprehensive framework for the assessment of plant disease severity. Figure 3 illustrates a comprehensive process for hyperspectral image-based severity detection, encompassing dataset preparation, RGB image conversion, feature extraction using pretrained VGG-16 and a neural network generator, transformation to SHSI, 3D cube visualization, and severity determination via Gaussian Mixture Model analysis of extracted features.
Commencing with the dataset preparation phase, the research leverages the flexibility of “OpenCV” for capturing live images or the utilization of pre-existing datasets, setting the foundation for subsequent analyses. This initial step is critical, ensuring a diverse and representative set of images for training and evaluation.
Following dataset preparation, the RGB conversion step utilizes the “cv2.cvtColor” function to transform images into the standard red, green, and blue color space. This step not only prepares the images for subsequent processing but also establishes a standardized format for consistent feature extraction. The choice of a pre-trained VGG-16 model for feature extraction from RGB images adds a layer of sophistication, harnessing the deep learning capabilities of this model to capture intricate visual patterns and hierarchical representations within the images.
A pivotal aspect of the proposed model lies in the conversion of RGB images to SHSI using a Neural Network generator model. This step introduces a novel perspective by simulating spectral information, providing a richer context for subsequent analyses. The resulting 3D HSI cube is a unique representation that extends beyond the limitations of traditional RGB imagery, offering a more nuanced view of the spectral characteristics associated with plant health and disease. The subsequent feature extraction phase further enriches the analytical depth by extending beyond the conventional RGB images to the 3D HSI cube. Spectral features, capturing the nuances of light reflectance across different bands, spatial features delineating structural aspects, and Haralick features characterizing texture patterns are extracted. This multi-faceted feature extraction enhances the model's capability to discern subtle variations associated with different disease states and plant conditions.
In the final step of our model, K-means clustering plays a crucial role in segmenting similar normalized difference vegetation index (NDVI) values from simulated hyperspectral images, contributing to disease severity determination. This segmentation, which identifies distinct plant health characteristics, facilitates subsequent analysis. Unlike GMM, K-means provides superior results for our dataset. By seamlessly transitioning into GMM for visualization and categorization of disease severity, we enhance interpretability. This integrated approach, combining image processing, deep learning, and statistical modeling, contributes to precise and accurate plant disease severity detection, advancing agricultural diagnostics and decision-making. The synergy of K-means, deep learning, and statistical modeling establishes a robust framework, demonstrating the potential for innovative and effective agricultural practices.
2.1. Preparing the Dataset
Embarking on the dataset preparation phase, our research strategically utilizes the flexibility offered by OpenCV to capture a dynamic array of live images. These images serve as the foundational elements for our investigation into plant disease severity, particularly focusing on the prevalent issue of powdery mildew. The dataset, meticulously compiled for this research project, is characterized by its diversity and comprehensiveness. We intentionally included instances depicting various stages of powdery mildew infection, ensuring a broad spectrum of conditions for a thorough exploration of the proposed methodologies. This curated collection spans the gamut of infection severity, from incipient stages to advanced manifestations, enhancing the robustness and representativeness of our dataset.
Two benchmark datasets were central to our investigations, serving as invaluable references for comparison and evaluation. These benchmark datasets were thoughtfully chosen to provide a standardized basis for assessing the performance and efficacy of our proposed methodologies. The inclusion of these benchmarks enhances the reliability and generalizability of our findings, fostering a more rigorous examination of our models against established standards in the field. In summary, the compilation of our diverse dataset and the incorporation of benchmark datasets form the foundation of this research endeavor, ensuring a thorough and principled evaluation of our proposed approaches in the context of plant disease assessment [8].
2.1.1. Dataset 1:
This data was collected from "https://www.kaggle.com/datasets/kaus-tubhb999/tomatoleaf: Access Date: 2023-10-25." This dataset includes diseases for tomato leaves such as "Septoria leaf spot, tomato healthy, Spider mites Two-spotted spider mite, Early blight, Leaf Mold, Late blight, Tomato Yellow Leaf Curl Virus, Bacterial spot, Target Spot, and Tomato mosaic virus." This collection has 984 photos in total.
2.1.2. Dataset 2:
Dataset-2 is also a publicly available one which can be downloaded and utilized from the drive link provided. "https://drive.google.com/file/d/1DVy0LyUUfJciyo7BUFm1sHKSRdTVJgjF/view: Access Date: 2023-10-25." This dataset is divided into seven classes: yellow curving, tomato mosaic, septoria, Leaf Spot, leaf Mould manual, late blight, healthy and bacterial Spot." It has 6345 photos [9].
2.2. Converting Normal Images to RGB Images
The image processing procedures were implemented using the OpenCV library, denoted as cv2. The script, designed for the conversion of normal images to RGB format, focused on the efficient handling and processing of the dataset. Leveraging the capabilities of cv2, the script employed the cv2.imread function for image reading and the crucial cv2.cvtColor function for color conversion. This conversion is particularly significant for maintaining a consistent RGB format across the entire dataset. The script intelligently identified grayscale images using img.ndim == 2 and applied the necessary conversion to ensure uniformity, a crucial step for downstream processes such as deep learning models that often expect a standardized number of color channels. Furthermore, the code incorporated directory management aspects by creating a designated directory for RGB images (dir_rgb) and saving the converted images in this location. Additionally, the code handled cases where images were already in RGB format, streamlining the process by directly copying them to the RGB images directory. This meticulous utilization of OpenCV proved essential in standardizing colour formats, ensuring compatibility, and enhancing the dataset's suitability for subsequent image processing and computer vision tasks. In Figure 4, the visual representation provides a clear comparison between a "normal" image and its corresponding version after undergoing the RGB conversion process. The transformation involves utilizing the OpenCV library, specifically the cv2.imread and cv2.cvtColor functions, to ensure consistent color representation across the entire dataset.
2.3. Feature Extraction from RGB Image
In the second phase of our project, Feature Extraction from RGB images is a critical step, and we employed the renowned VGG-16 model for this purpose. VGG-16 stands out as a powerful Convolutional Neural Network architecture, particularly recognized for its effectiveness in image classification tasks, notably with the ImageNet dataset. The name VGG is derived from Visual Geometry Group, the research group contributing to its construction, and the number 16 signifies the total number of neural network layers. This architecture has become a cornerstone in the deep learning domain due to its exceptional performance. In our project, VGG-16 is utilized as a pre-trained feature extractor. The code incorporates the definition of a feature extractor model using VGG-16, extracting features from RGB images that are then used to generate simulated hyperspectral images. Figure 5 illustrates VGG16’s architecture with 13 convolutional layers, 5 Max Pooling layers, and 3 Dense layers, totaling 21 layers. Remarkably, it employs 16 weight layers by repeating 3x3 convolution filters, 2x2 max pool layers, and consistent padding throughout, distinguishing itself with a focus on simplicity and effectiveness.
2.4. Conversion of RGB Image to Simulated HSI
In the subsequent phase, the Conversion of RGB images to Simulated Hyperspectral Images involves the utilization of a Neural Network generator model. This model is designed based on the principles of Generative Adversarial Networks (GANs), a concept inspired by two-person zero-sum games in game theory. In our scenario, the generator’s role is to understand and encapsulate the potential distribution in real RGB data samples, ultimately generating new samples that simulate the characteristics of hyperspectral imagery. The GAN architecture involves two primary players, the generator, and the discriminator. The generator aims to create data samples that closely resemble real-world examples, while the discriminator, acting as a binary classifier, distinguishes between genuine and generated data. This dynamic interplay between the generator and discriminator leads to an optimal learning scenario, akin to a minimax game. In Figure 6 we can see the simulated HSI images generated from the RGB images using the generator model.
Figure 7 illustrates the structure of GANs and their computational techniques. In our project, the generator model is specifically crafted to take features extracted from RGB images, obtained through a pre-trained VGG-16 model, and transform them into simulated hyperspectral images. The generator employs convolutional layers, batch normalization, and up sampling to produce realistic hyperspectral-like representations. This innovative approach provides valuable insights into the spectral characteristics of powdery mildew-infected tomato plants, contributing to a comprehensive understanding of disease severity.
2.5. Producing a 3D Visualization Cube from SHSI Image
The next step involves the Production of a 3D visualization cube from the simulated hyperspectral images. This process is crucial for gaining insights into the spatial and spectral dimensions of the hyperspectral cube. The generated hyperspectral cube is a 3D representation of the simulated data, where each axis corresponds to width, height, and spectral band, respectively. The cube is constructed by stacking the individual spectral bands along a new axis, resulting in a multi-dimensional dataset. The code employs matplotlib and mpl_toolkits to create a 3D plot of the hyperspectral cube. The cube’s dimensions, including depth, height, number of bands, and width, are extracted and utilized to plot each band as a separate surface in the 3D space. This visualization offers a comprehensive view of the spectral variations across different bands, contributing to a deeper understanding of the hyperspectral data and aiding in subsequent feature extraction processes. Furthermore, processing the results obtained to transform into the HSI cube given in Figure 8.
2.6. Feature Extraction from 3D SHSI Cube and Determining the Severity
2.6.1. Gaussian Mixture Model (GMM):
This Python code is designed for feature extraction from a 3D hyperspectral cube and subsequent determination of powdery mildew severity using GMM. The code utilizes various image processing and analysis techniques to extract a range of features from the hyperspectral cube, which is a 3D representation of a scene with information captured across multiple spectral bands.
Firstly, the code defines functions for normalizing data, computing spectral indices, extracting Haralick texture features, calculating statistical measures, determining spatial features, and visualizing various extracted features. The visualization includes spectral indices, Haralick features, statistical measures, spatial features, reflectance spectra, NDVI, chlorophyll index, Principal Component Analysis (PCA) result, vegetation indices, water absorption bands, fluorescence indicators, additional spatial metrics, Normalized Difference Water Index (NDWI).
The hyperspectral cube is loaded from simulated images, normalized, and reshaped. A 3D plot is generated to visualize the hyperspectral cube. Features are then computed using the defined functions, and the severity of powdery mildew is determined based on the mean value of specific spectral indices. However, in this modified version, the code has been adjusted to use a GMM for clustering spectral indices, with severity levels assigned based on the cluster means.
In the severity determination function (determine_powdery_mildew_severity), the code calculates the mean of the spectral indices and assigns severity levels ("Highly affected," "Moderately affected," or "Healthy") based on predefined thresholds. The GMM is an improvement over the K-Means clustering used in the original code, providing more flexibility in handling complex data distributions.
This comprehensive feature extraction and severity determination pipeline is essential for hyperspectral image analysis, particularly in applications related to agriculture, where identifying and quantifying plant diseases, such as powdery mildew, is crucial for effective crop management.
2.6.2. K-Means
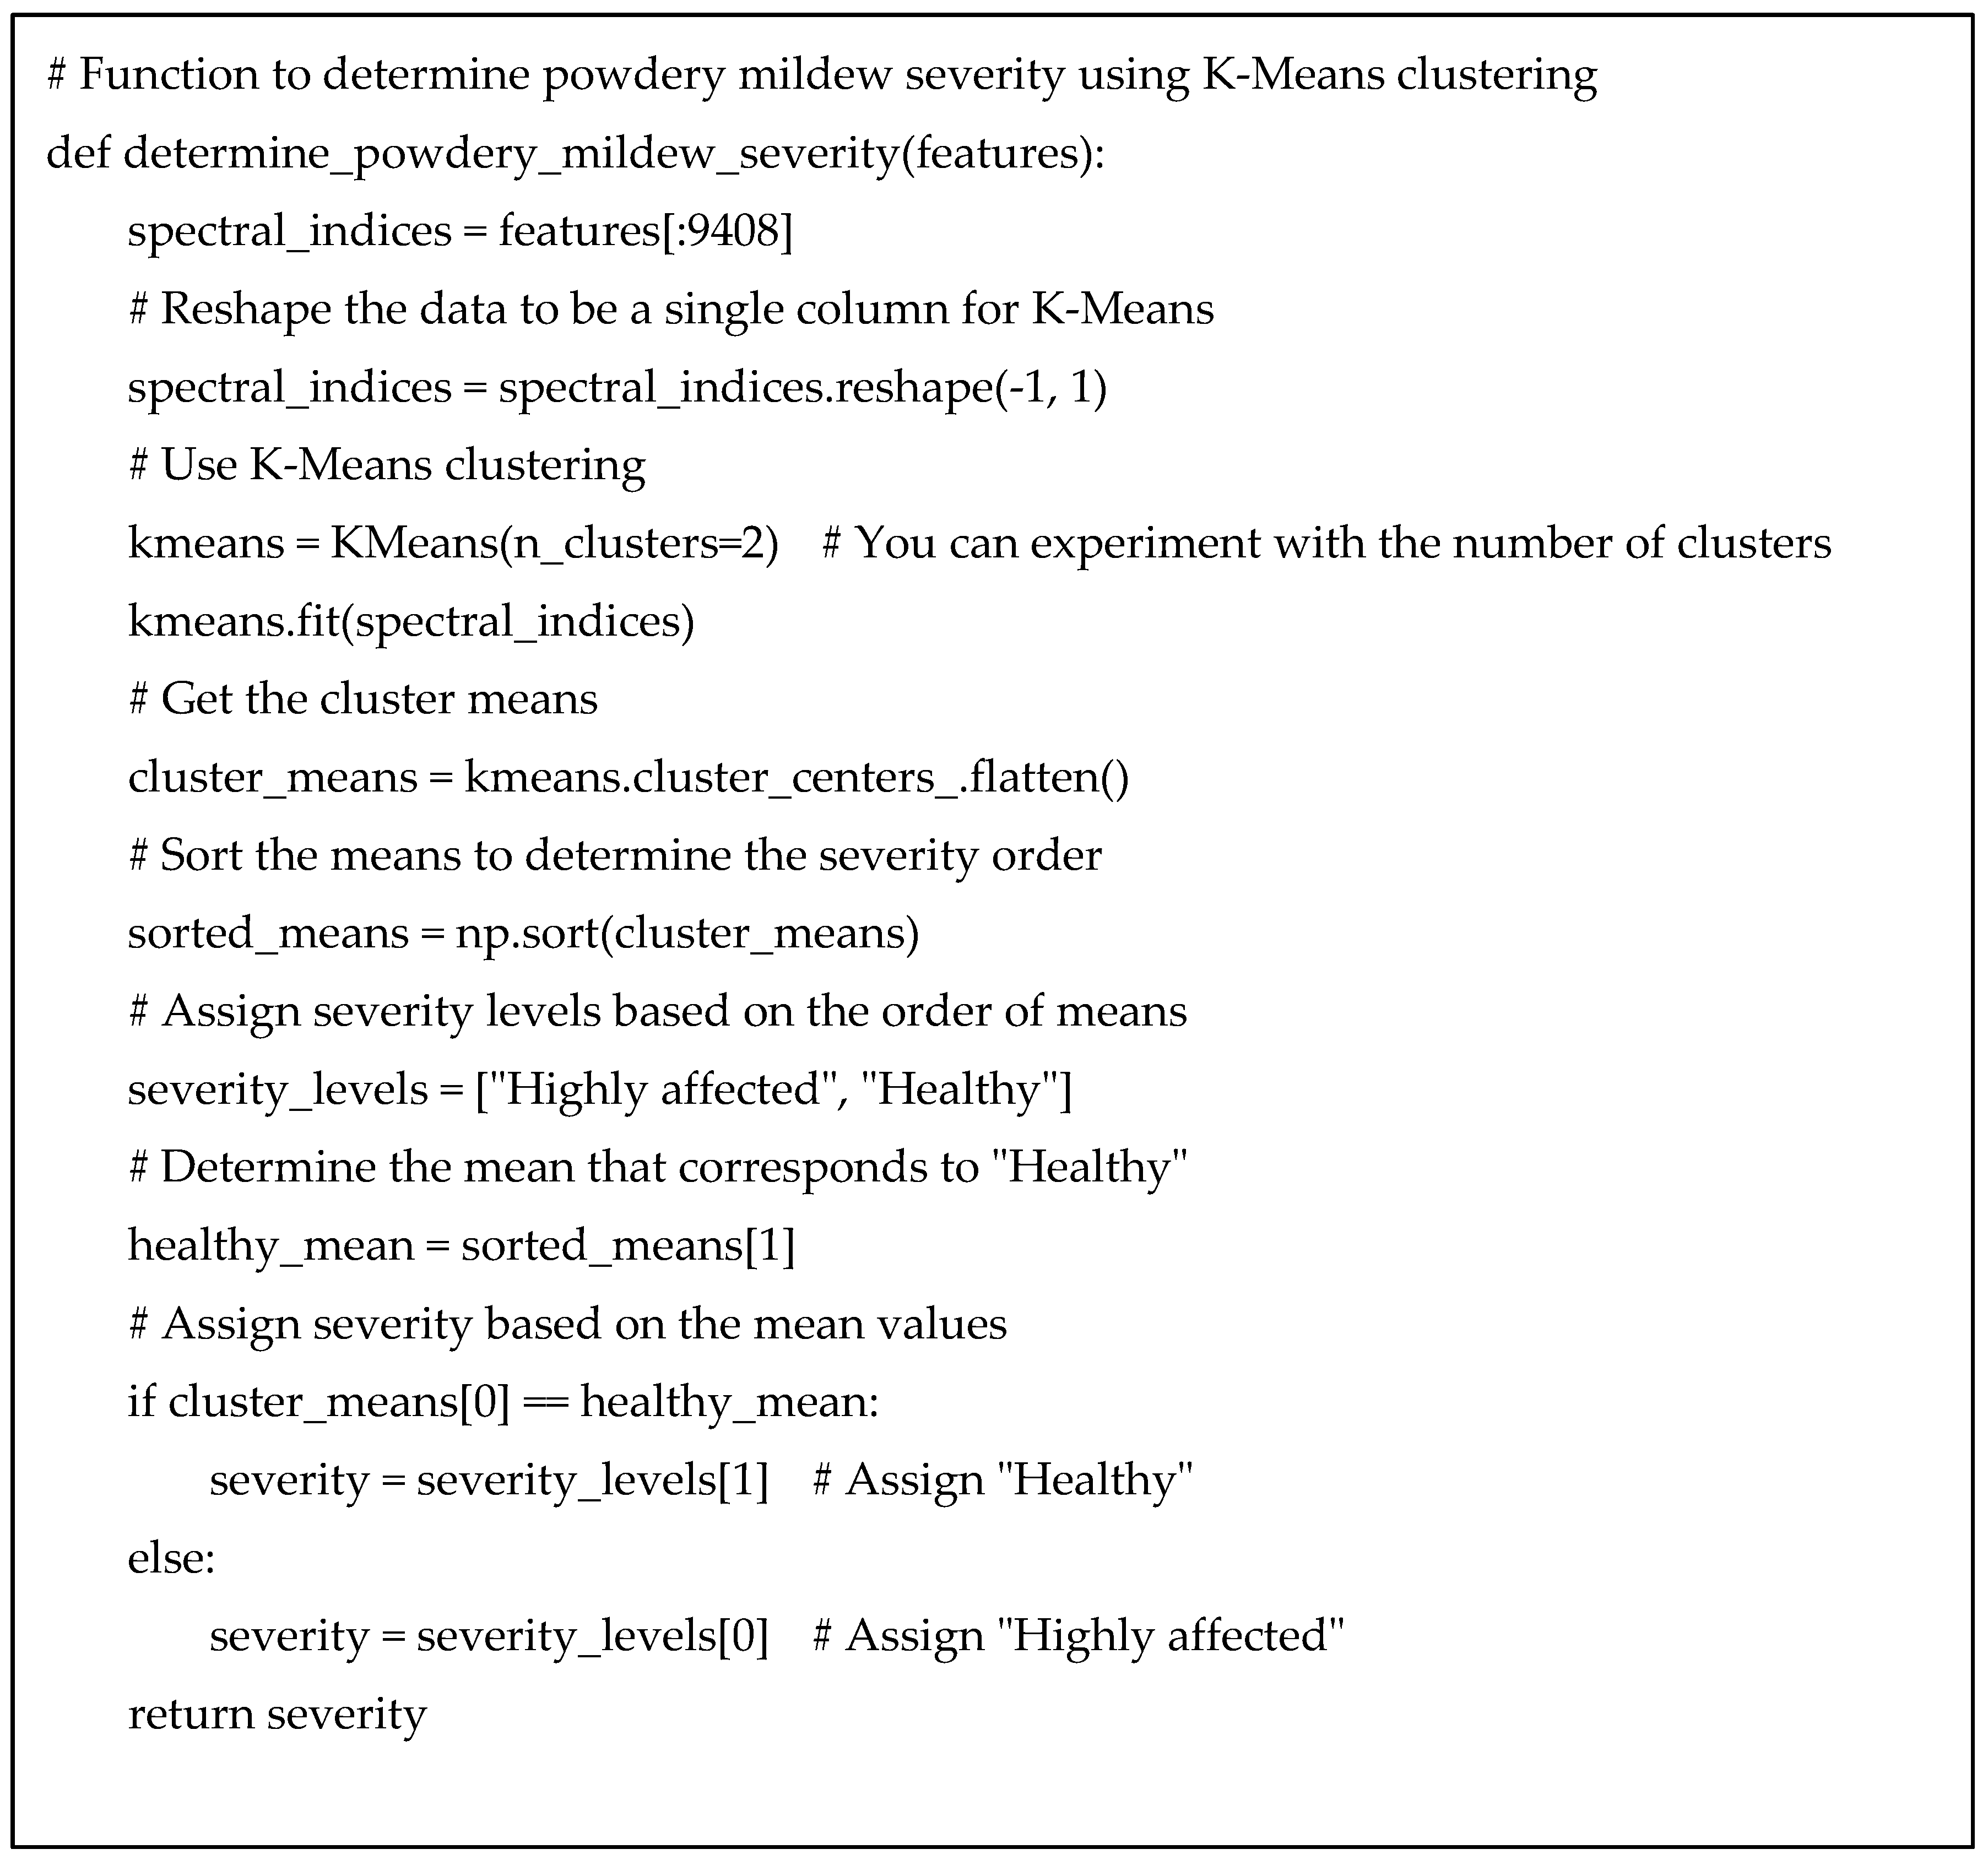
The primary focus is on feature extraction from a simulated 3D hyperspectral cube of SHSI and subsequent determination of powdery mildew severity using the K-means clustering algorithm. The hyperspectral cube is initially constructed by stacking individual spectral bands obtained from simulated hyperspectral images. The shape of the resulting 3D cube is then visualized in a 3D plot, providing a comprehensive view of the spectral information across different bands. Feature extraction encompasses a diverse set of methodologies, including the computation of spectral indices, Haralick texture features, statistical measures, spatial features, reflectance spectra, normalized difference NDVI, chlorophyll index, texture analysis, PCA results, vegetation indices, water absorption bands, fluorescence indicators, additional spatial metrics, normalized difference NDWI. These extracted features collectively capture various aspects of the hyperspectral data.
The visualization of these features is facilitated through a series of subplots, each dedicated to a specific feature category. Spectral indices, Haralick features, statistical measures, spatial features, and other relevant metrics are visually presented, providing insights into the distribution and patterns of the extracted features. The code also includes a function to determine powdery mildew severity, where K-means clustering is applied to specific subsets of the extracted features. Notably, the K-means algorithm is employed to cluster NDVI values, and severity levels are assigned based on the order of cluster means. The resulting severity level is printed, highlighting the potential of K-means in classifying powdery mildew severity based on the distinctive features extracted from the 3D hyperspectral cube. This comprehensive approach, combining feature extraction and K-means clustering, constitutes a key step in enhancing the precision and interpretability of disease severity assessment in agricultural applications.
3. Results and Discussion
The experiments were conducted on a HP Pavilion Gaming Laptop model 16-a01xxx featuring an Intel(R) Core (TM) i7-10870H CPU running at a base frequency of 2.20GHz and a maximum Turbo Boost speed of 2.21GHz. The system was equipped with 16.0 GB of RAM, with 15.8 GB usable for efficient processing during the experimental procedures. Operating under a 64-bit architecture, the system type was classified as x64-based. This hardware configuration provided a robust and capable computing environment for the execution of the project's experiments, ensuring optimal performance and reliable results.
In Figure 9, illustrates the dataset features related to powdery mildew-infected tomato crops, employing the GMM. While GMM is a powerful method, particularly for capturing complex patterns and variations in the data, its application in this context reveals nuances associated with the presence of powdery mildew. The features derived from GMM shed light on the subtle spectral and spatial changes induced by the pathogen
In contrast, Figure 10 the dataset features corresponding to healthy tomato crops are generated using the K-means clustering method. The K-means algorithm excels in extracting meaningful patterns from hyperspectral data, contributing to a comprehensive characterization of the healthy state. The features obtained through K-means encapsulate both spectral and spatial information, providing a detailed representation of the crops' well-being.
This comparative analysis of healthy and powdery dataset features showcases the complementary strengths of K-means and GMM in elucidating distinct aspects of plant health and disease severity in hyperspectral imagery. The discernible differences in the extracted features highlight the impact of the disease on both the spectral and spatial aspects of the leaf, providing valuable insights into the distinctive signatures associated with powdery mildew infection.
Figure 11 visually illustrates the transformative impact of the proposed methodology on disease detection in tomato crops. The left side of the figure displays a live leaf in its normal RGB state, captured through OpenCV. The initial image depicts a leaf marked by distress, evident in the presence of conspicuous black spots, indicative of potential fungal infections, pest infestations, or other physiological ailments affecting its health. In stark contrast, the second image features a robust and healthy leaf, free from any discernible imperfections or discolorations. To enhance the analysis, HSI simulations have been applied to both images, offering a detailed examination of the leaves' spectral characteristics across various wavelengths. The SHSI images not only offer a richer context for disease analysis but also exemplify the efficacy of the integrated approach in enhancing the precision of plant disease severity detection. Here the third image represent the k-means clustering map of the SHSI leaf image reveals spectral similarities among pixels, grouping them into distinct clusters. This map aids in identifying spatial patterns of different biochemical compositions within the leaf, providing insights into its physiological characteristics. To assess the severity of the captured live leaves, here we employed the k-means clustering method as a quantitative analysis tool. This involved segmenting the leaf images into distinct clusters based on pixel intensity values, which allows for the identification of patterns and variations in the data. The resulting clustered images served as a visual representation of the different regions or groups within the leaf, aiding in the characterization of anomalies or patterns associated with stress. Subsequently, by analyzing the characteristics of these clusters, we were able to derive a quantitative measure of severity. Specifically, the application of k-means facilitated the categorization of severity levels, distinguishing between low and high severity based on the identified patterns and clusters within the leaf images, providing a nuanced and data-driven approach to assessing the health and stress levels of the captured leaves.
This code snippet in Figure 12 transforms RGB images into SHSI, mimicking the characteristics of hyperspectral data. The RGB images are loaded, normalized, and combined to create a 3D hyperspectral cube, facilitating subsequent feature extraction and disease severity assessment in agricultural applications.
This code snippet in Figure 13 utilizes GMM clustering for assessing powdery mildew severity in a hyperspectral cube. Spectral indices are extracted, normalized, and clustered using GMM, with severity levels assigned based on the cluster means, offering a probabilistic approach for disease evaluation in agricultural scenarios.
The code snippet in Figure 14 employs the K-Means clustering method to determine the severity of powdery mildew in a hyperspectral cube. Spectral indices are extracted, normalized, and clustered using K-Means, with severity levels assigned based on the cluster means, providing an effective approach for disease assessment in agriculture.
4. Conclusion
In conclusion, this research pioneers an innovative approach to address the challenges of powdery mildew detection in tomato crops, caused by the Leveillula taurica pathogen. The study integrates hyperspectral imaging, deep learning, and unsupervised clustering methodologies, providing a comprehensive framework for assessing disease severity. The workflow encompasses live image acquisition, RGB conversion, simulated hyperspectral image generation, 3D visualization cube construction, and severity detection. The proposed model leverages both GMM and K-means clustering for severity assessment, transcending traditional limitations by incorporating spatial and spectral dimensions. The utilization of pre-trained VGG-16 for feature extraction, a Neural Network generator model for simulated hyperspectral image conversion, and clustering methods contribute to the sophistication and effectiveness of the methodology. The obtained results not only enhance the precision of powdery mildew severity detection but also advance the broader field of agricultural diagnostics, offering practical insights for disease management.
Furthermore, in our study, the K-means clustering method demonstrated superior performance compared to the GMM in measuring the severity of powdery mildew in tomato crops. The K-means approach exhibited enhanced efficiency and accuracy for feature extraction and severity assessment within the considered dataset. This finding underscores the effectiveness of K-means clustering as a valuable tool for agricultural diagnostics, particularly in the context of powdery mildew detection and severity measurement in tomato crops.
Future Scope
The success of this research opens avenues for future exploration and refinement. Firstly, the integration of more advanced deep learning architectures and optimization techniques could further enhance the feature extraction and classification capabilities, potentially improving accuracy and generalization. Additionally, the proposed model could benefit from an expanded dataset, incorporating diverse environmental conditions and multiple tomato varieties to enhance robustness and applicability. Exploring real-time implementation in field conditions would bridge the gap between laboratory experimentation and practical agricultural settings. Further research could delve into the development of user-friendly tools and applications that enable farmers to deploy and interpret hyperspectral imaging for on-the-spot disease assessment. Despite its potential, the proposed project encounters several limitations that warrant consideration. Firstly, the dependence on specialized and costly hyperspectral imaging hardware raises concerns about the feasibility and affordability of widespread adoption, particularly in resource-constrained agricultural settings. Acquiring a diverse and high-quality dataset for training and evaluation poses a significant challenge, and the model's performance may be contingent on the availability and representativeness of such data. Furthermore, the generalization of the model to different environmental conditions, tomato varieties, and disease stages remains uncertain and needs thorough validation in diverse agricultural settings. The sensitivity of deep learning models to hyperparameter choices may demand expert tuning, potentially hindering usability for non-experts. The complex workflow, involving deep learning, neural network generation, and statistical modeling, may impede interpretability, raising questions about the practical understanding of results by agricultural practitioners. Additionally, the framework could be extended to encompass a broader range of plant diseases, providing a versatile solution for comprehensive crop health monitoring. Collaborations with experts in plant pathology and agricultural science could further validate and optimize the proposed methodologies, paving the way for transformative advancements in precision agriculture and sustainable crop management.
Author Contributions
Conceptualization, S.K.; methodology, S.K., M.M., and B.B.; software, S.K., Y.S., A.B.; validation, M.M. and B.B.; data curation, Y.S., A.B.; writing— S.K., M.M., B.B., Y.S., and A.B.; writing—review and editing, M.M, B.B.; supervision, S.K., M.M., B.B. All authors have read and agreed to the published version of the manuscript.
Funding
This research was partly funded by Zayed University, grant number 12091.
Data Availability Statement
Our code is available at https://colab.research.google.com/drive/1wMvqsuZNY_lB2INmyWWqSZYm87wVckv0?usp=sharing
Acknowledgments
Not applicable.
Conflicts of Interest
The authors declare no conflict of interest. The funders had no role in the design of the study; in the collection, analyses, or interpretation of data; in the writing of the manuscript, or in the decision to publish the results.
References
- Rahman, S. U., Alam, F., Ahmad, N., & Arshad, S. (2023). Image processing based system for the detection, identification and treatment of tomato leaf diseases. Multimedia Tools and Applications, 82(6), 9431-9445. [CrossRef]
- Devaraj, A., Rathan, K., Jaahnavi, S., & Indira, K. (2019, April). Identification of plant disease using image processing technique. In 2019 International Conference on Communication and Signal Processing (ICCSP) (pp. 0749-0753). IEEE.
- Zhao, T., Nakano, A., Iwaski, Y., & Umeda, H. (2020). Application of hyperspectral imaging for assessment of tomato leaf water status in plant factories. Applied Sciences, 10(13), 4665. [CrossRef]
- Lin, K., Gong, L., Huang, Y., Liu, C., & Pan, J. (2019). Deep learning-based segmentation and quantification of cucumber powdery mildew using convolutional neural network. Frontiers in plant science, 10, 155. [CrossRef]
- Barbedo, J. G. A. (2018). Impact of dataset size and variety on the effectiveness of deep learning and transfer learning for plant disease classification. Computers and electronics in agriculture, 153, 46-53. [CrossRef]
- Nguyen, C., Sagan, V., Maimaitiyiming, M., Maimaitijiang, M., Bhadra, S., & Kwasniewski, M. T. (2021). Early detection of plant viral disease using hyperspectral imaging and deep learning. Sensors, 21(3), 742. [CrossRef]
- Pushparaj, P., Dahiya, N., & Dabas, M. (2021). Reconstruction of hyperspectral images from RGB images. In IOP Conference Series: Materials Science and Engineering (Vol. 1022, No. 1, p. 012102). IOP Publishing.
- Yan, L., Wang, X., Zhao, M., Kaloorazi, M., Chen, J., & Rahardja, S. (2020). Reconstruction of hyperspectral data from RGB images with prior category information. IEEE Transactions on Computational Imaging, 6, 1070-1081. [CrossRef]
- Sreedevi, A., & Manike, C. (2022). A smart solution for tomato leaf disease classification by modified recurrent neural network with severity computation. Cybernetics and Systems, 1-41. [CrossRef]
- Alatawi, A. A., Alomani, S. M., Alhawiti, N. I., & Ayaz, M. (2022). Plant disease detection using AI based vgg-16 model. International Journal of Advanced Computer Science and Applications, 13(4).
- Gonog, L., & Zhou, Y. (2019, June). A review: generative adversarial networks. In 2019 14th IEEE conference on industrial electronics and applications (ICIEA) (pp. 505-510). IEEE.
Figure 1.
Plant Diseases Fundamental [2].
Figure 1.
Plant Diseases Fundamental [2].
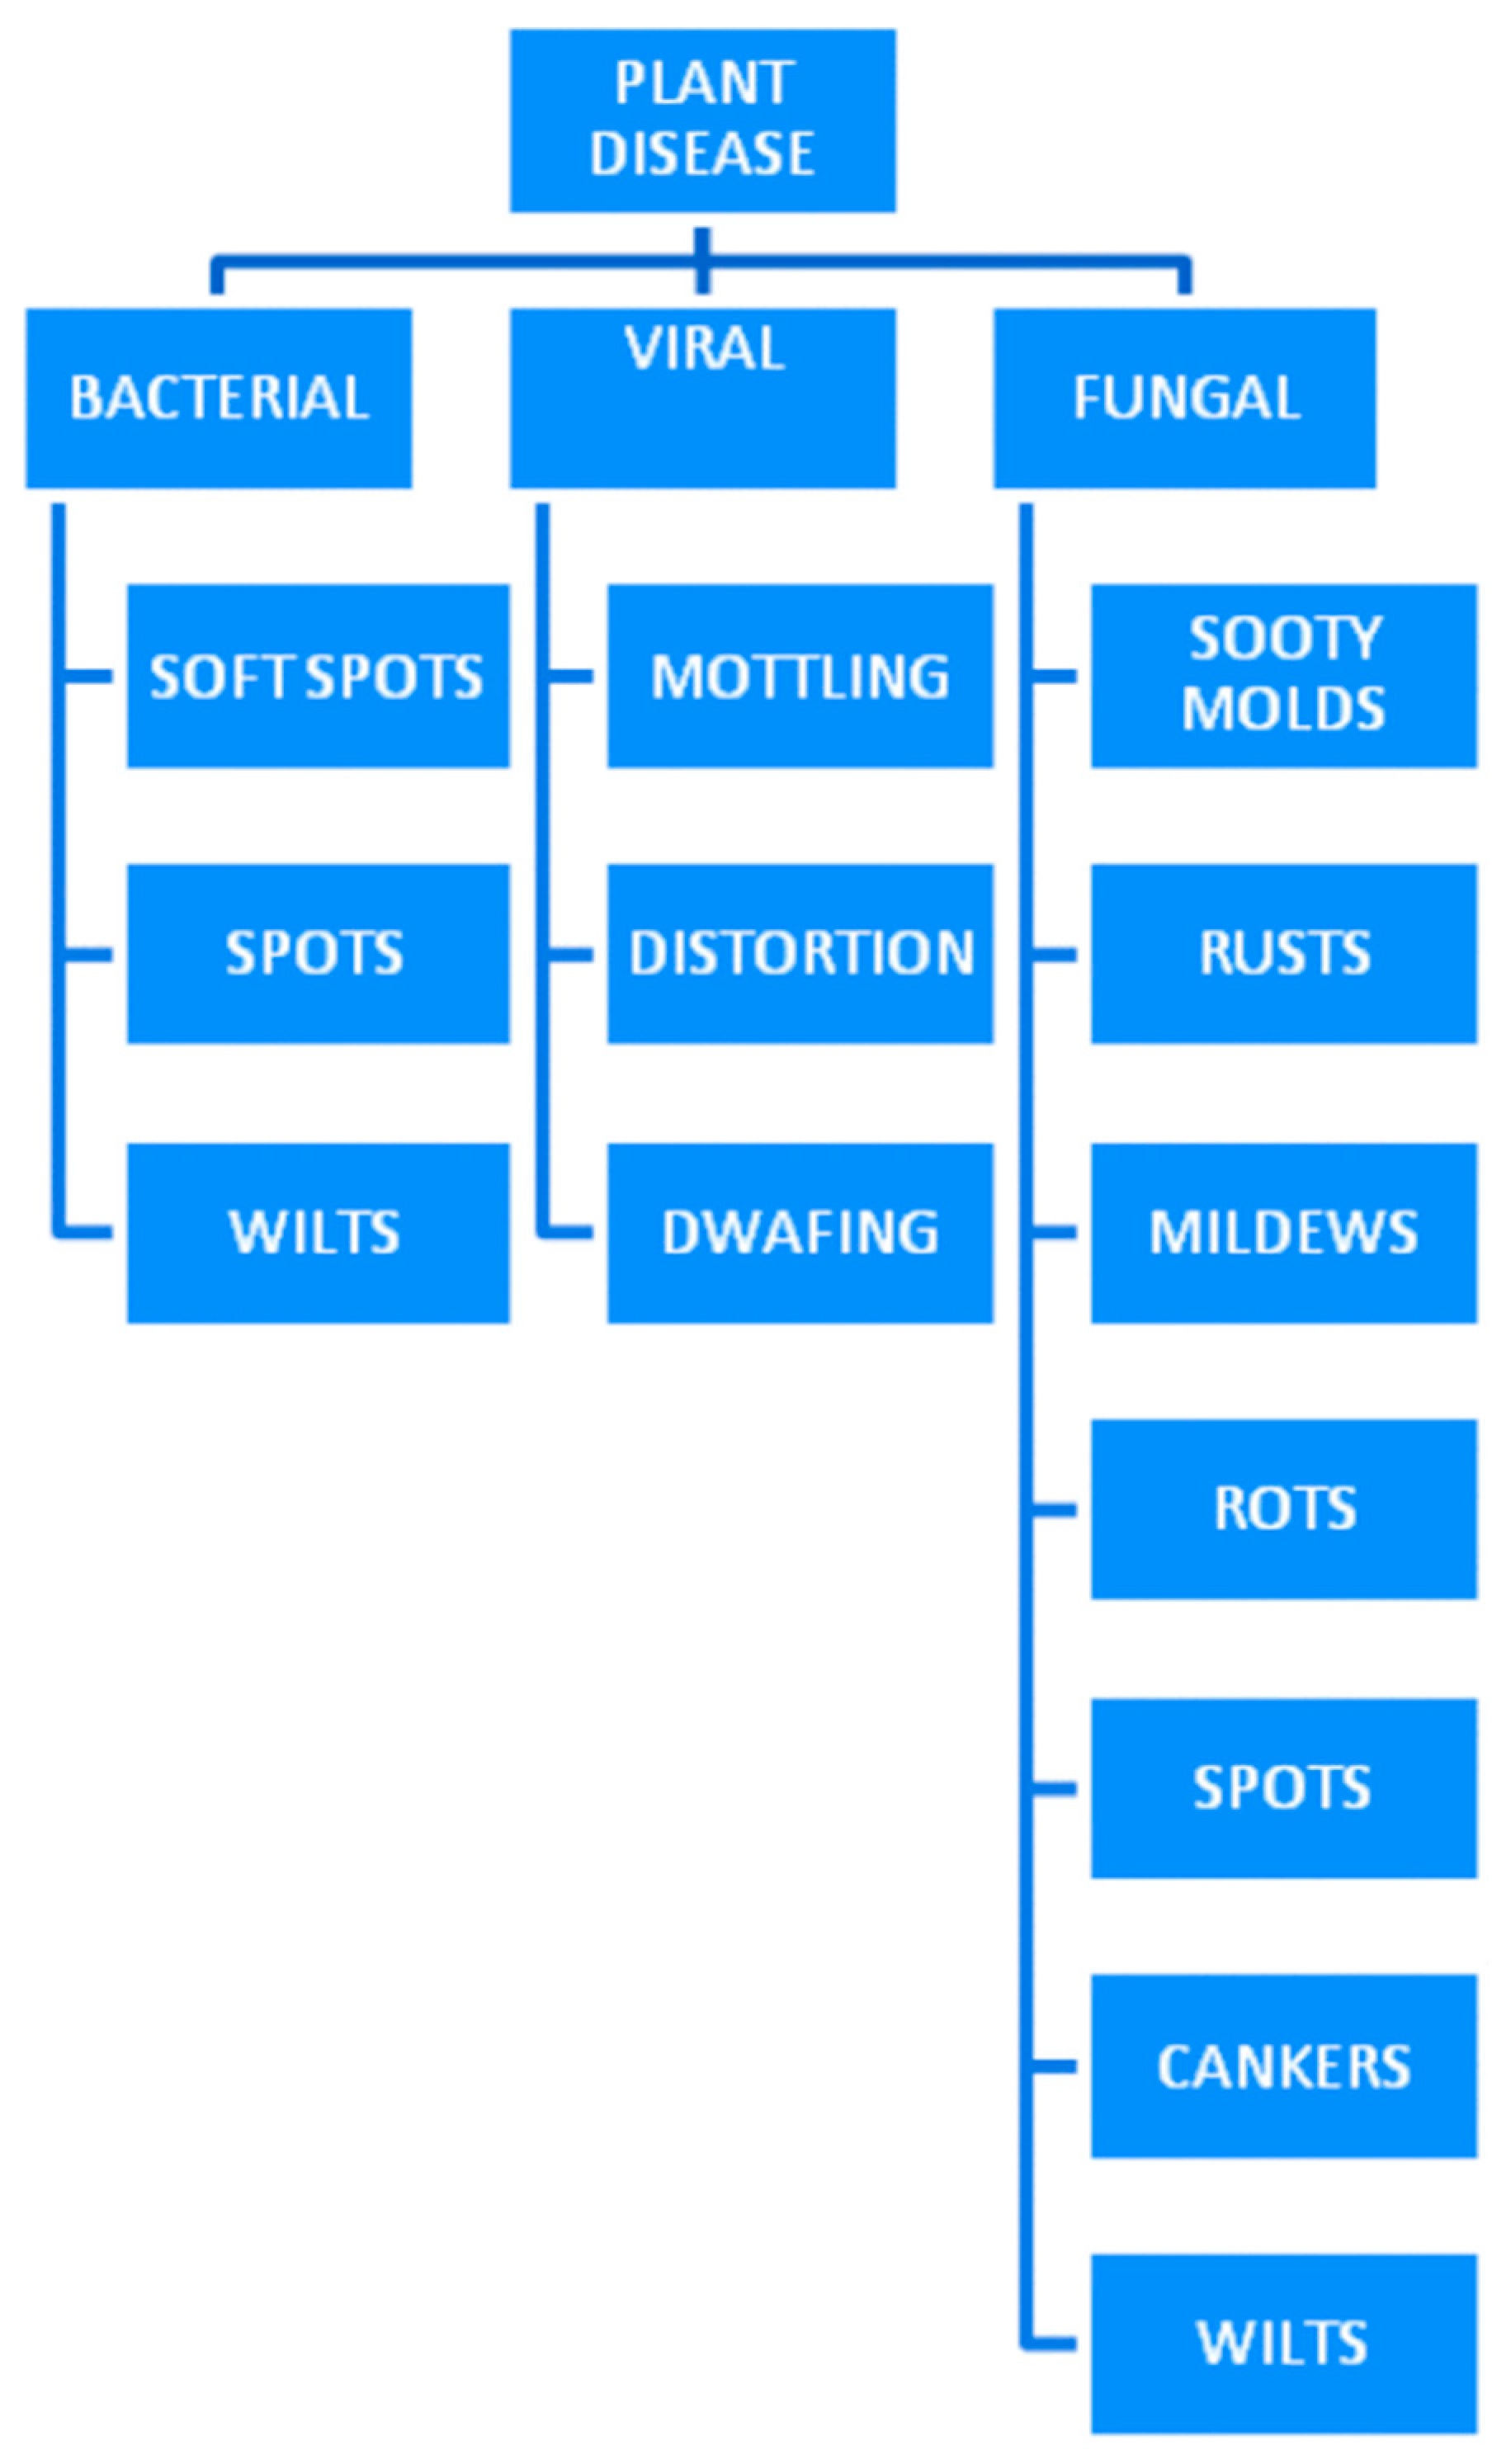
Figure 2.
RGB image and Hyperspectral image at a 1390 nm wavelength [3] of two different tomato leaves.
Figure 2.
RGB image and Hyperspectral image at a 1390 nm wavelength [3] of two different tomato leaves.
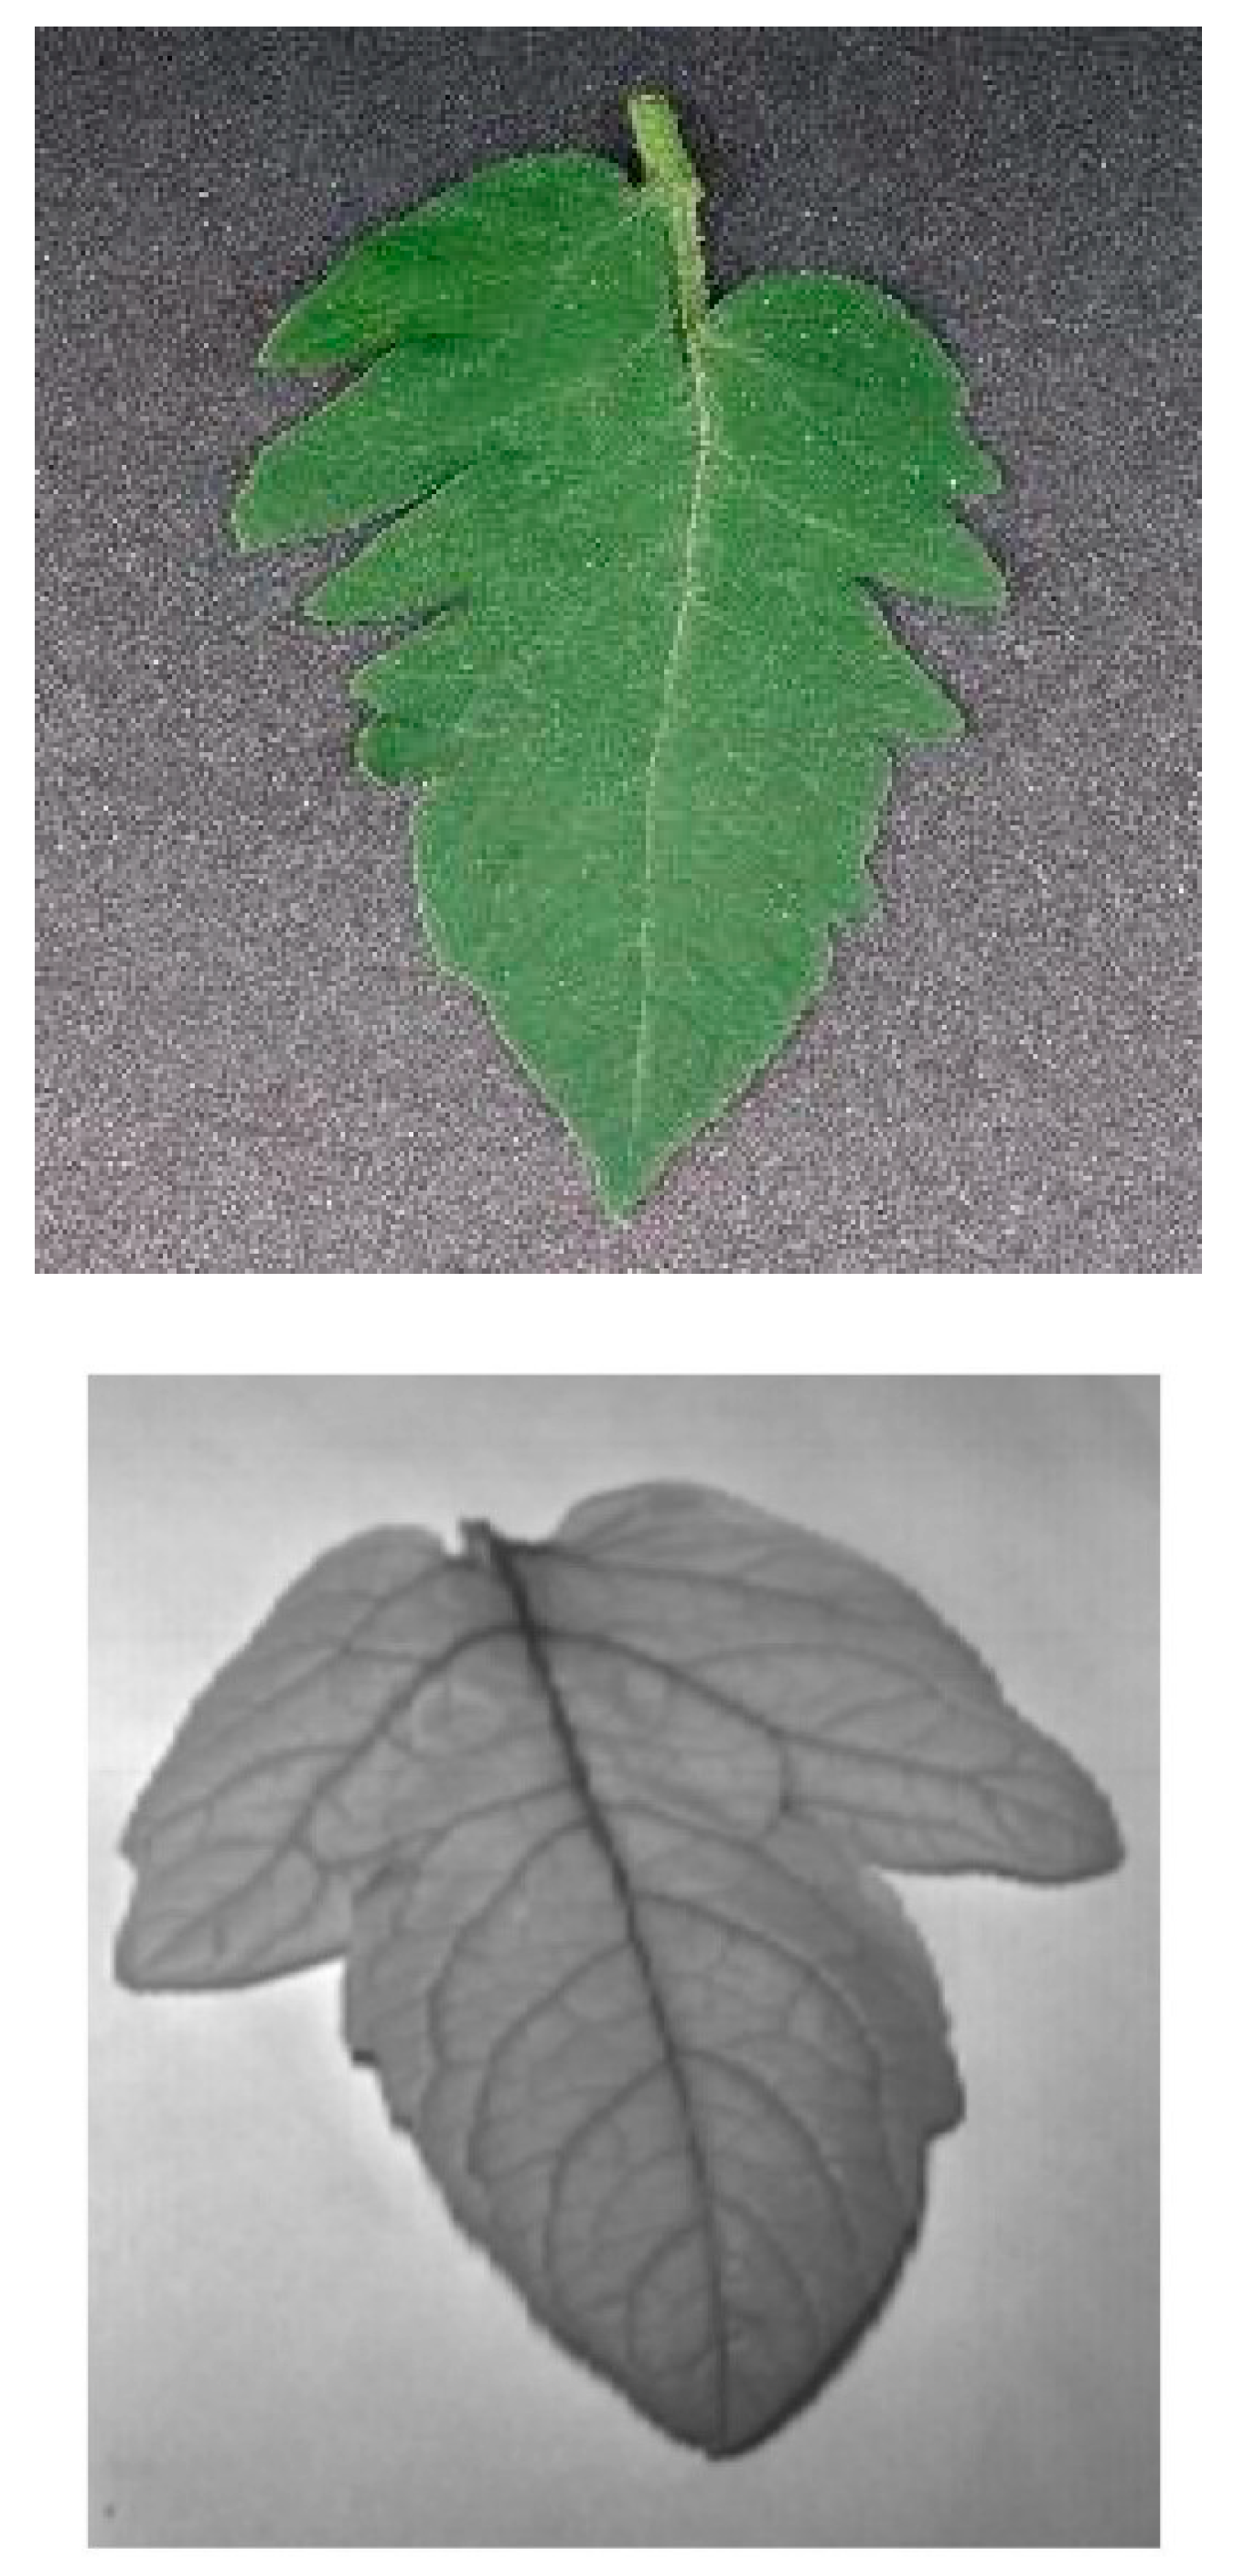
Figure 3.
Block diagram of the proposed method.
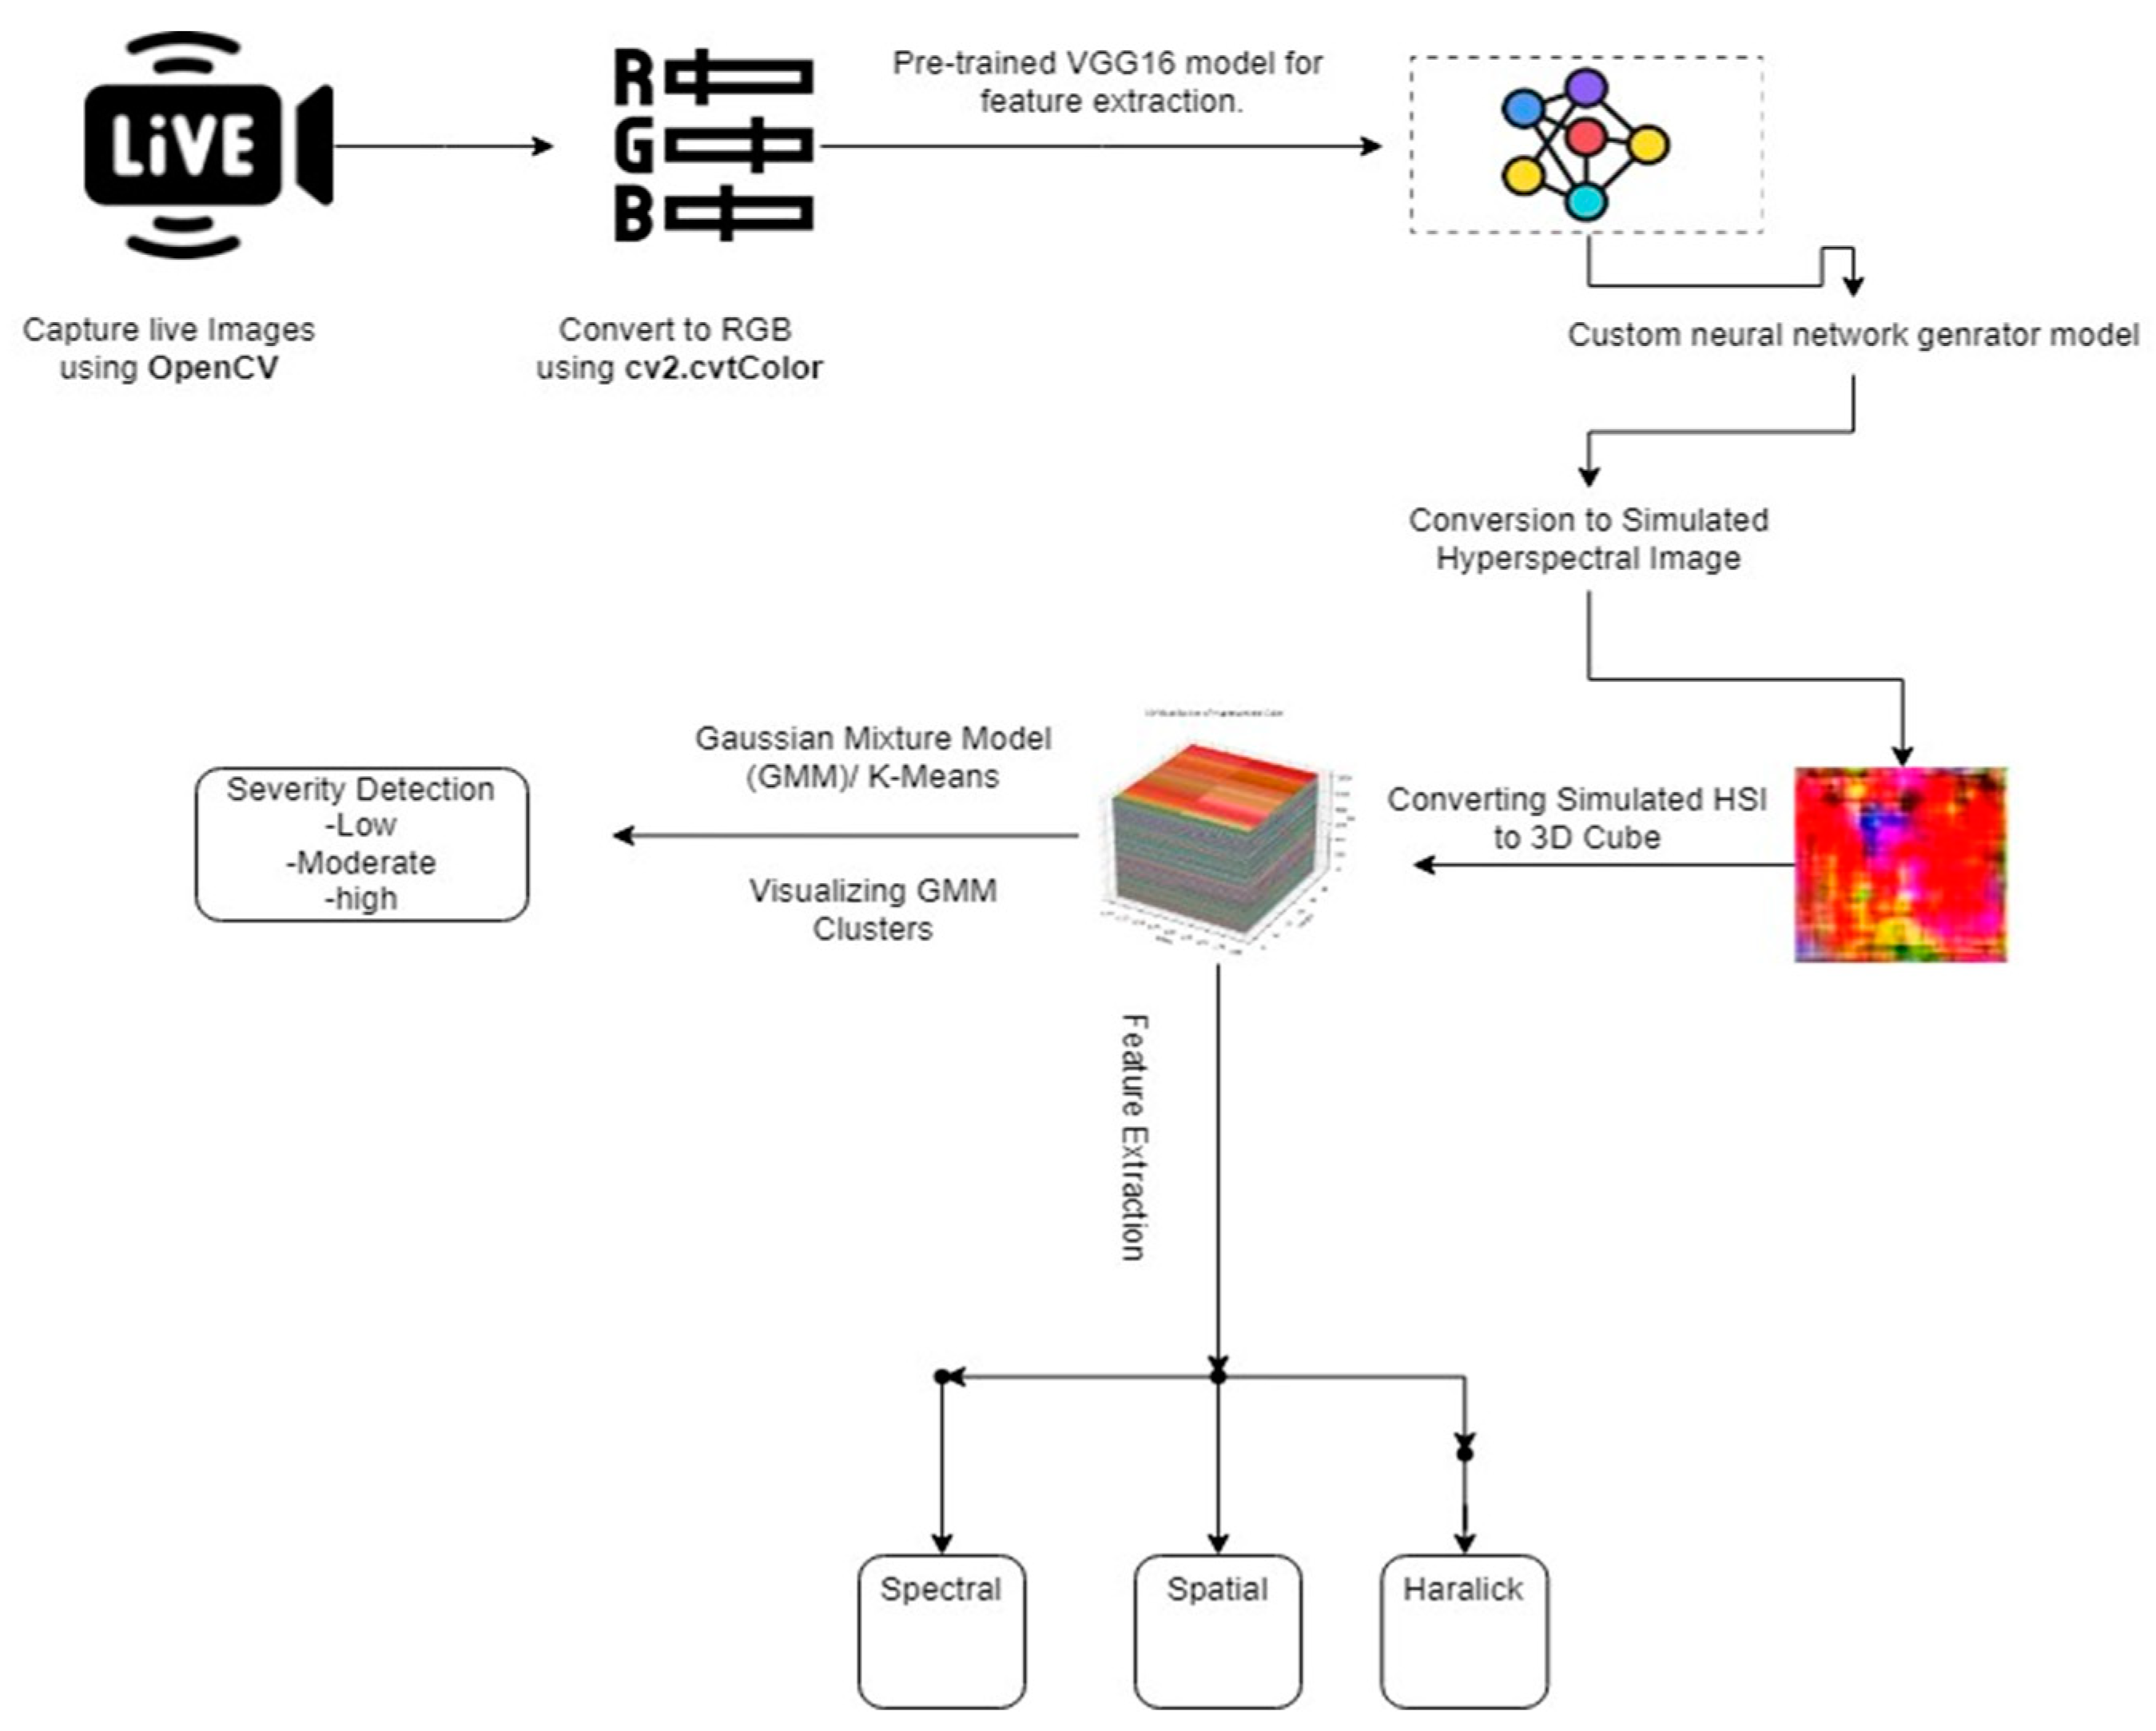
Figure 4.
Live captured normal Image and its RGB Image of a leaf.
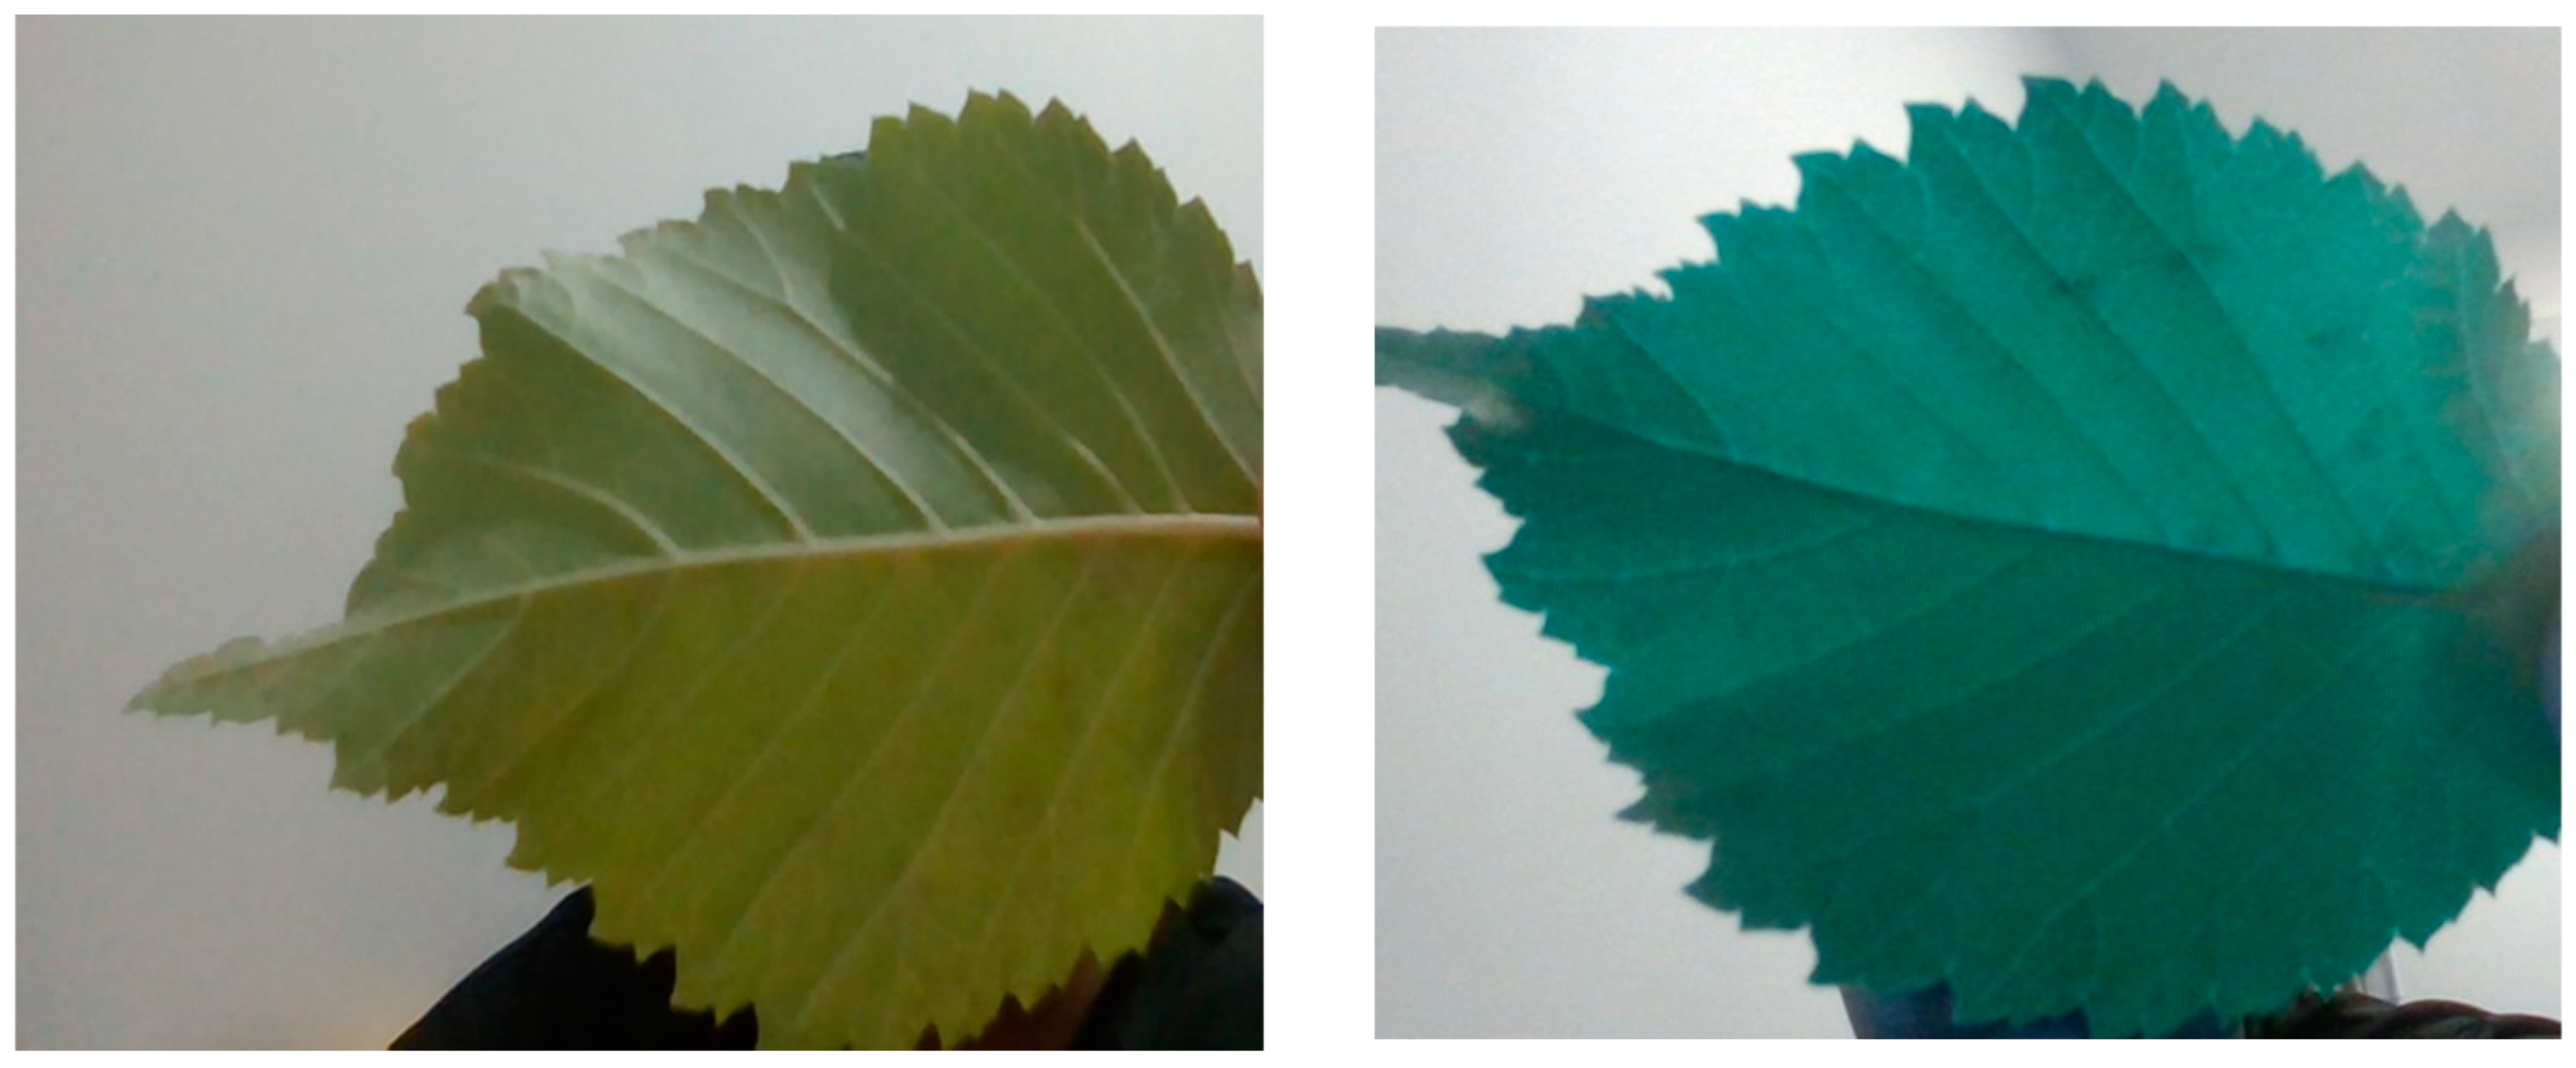
Figure 5.
VGG-16 architecture delineates the precise positioning of its diverse layers [10].
Figure 5.
VGG-16 architecture delineates the precise positioning of its diverse layers [10].
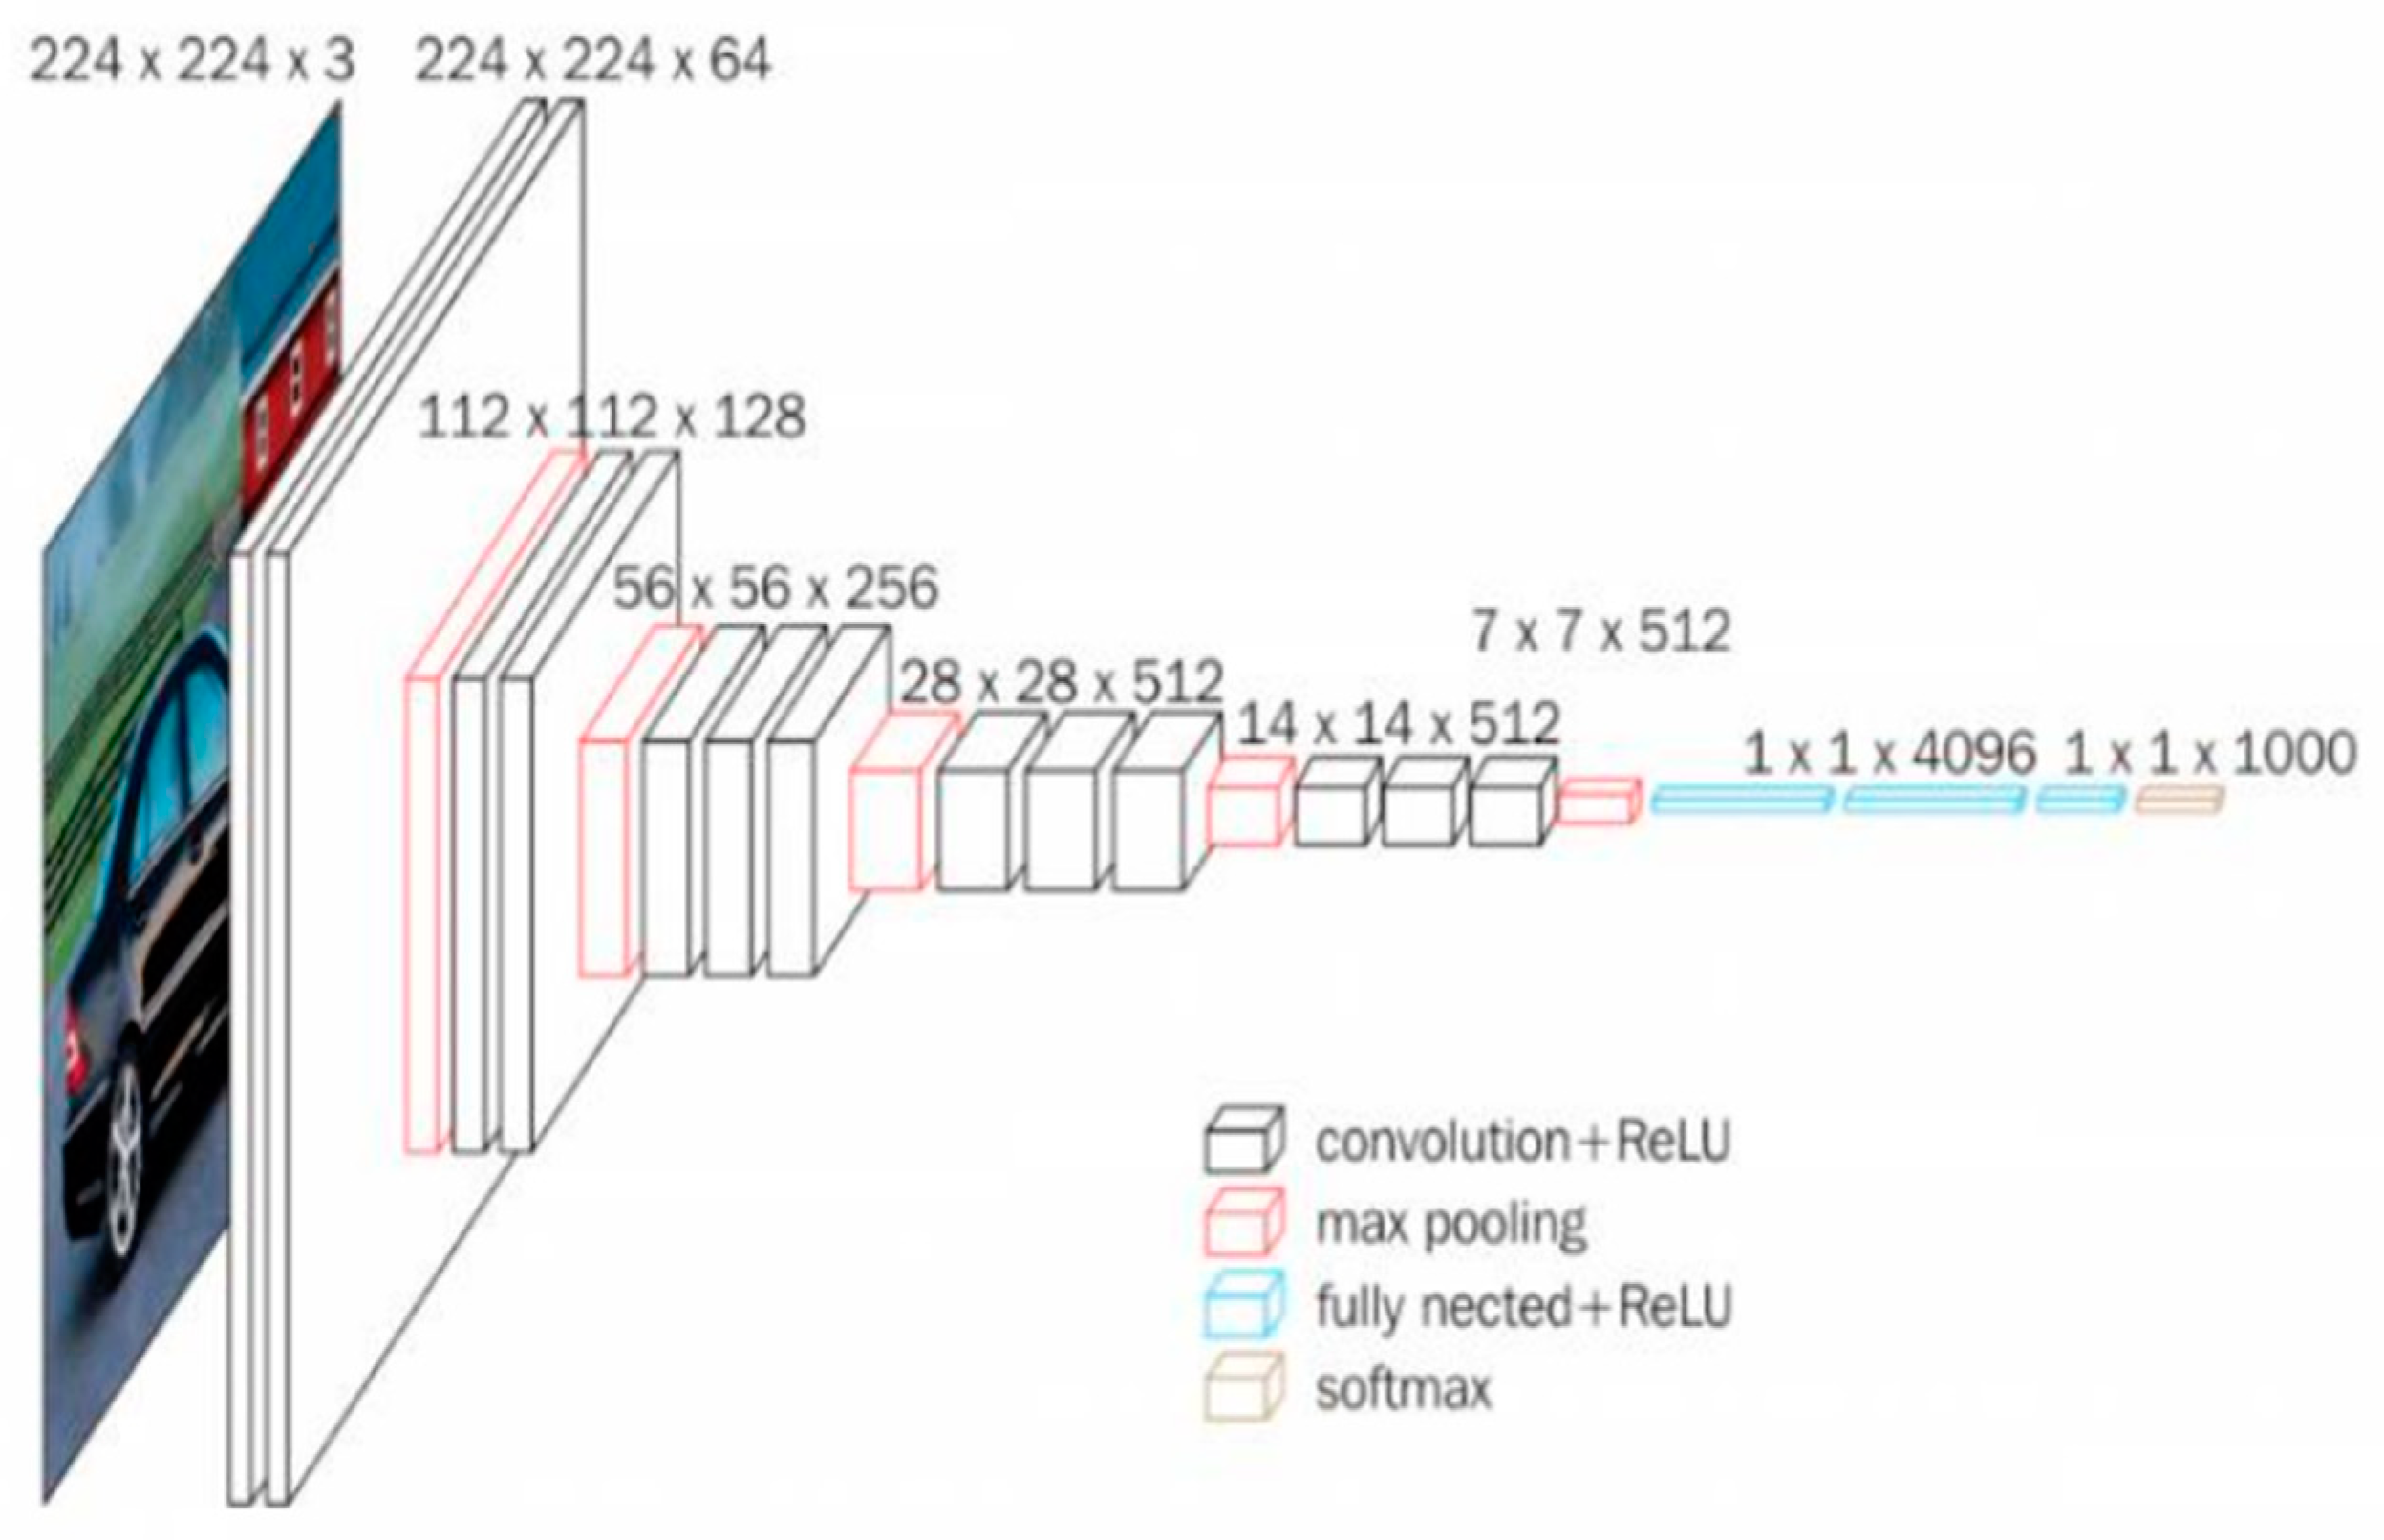
Figure 6.
SHSIs images of Healthy and powdery tomato leaf from the dataset.
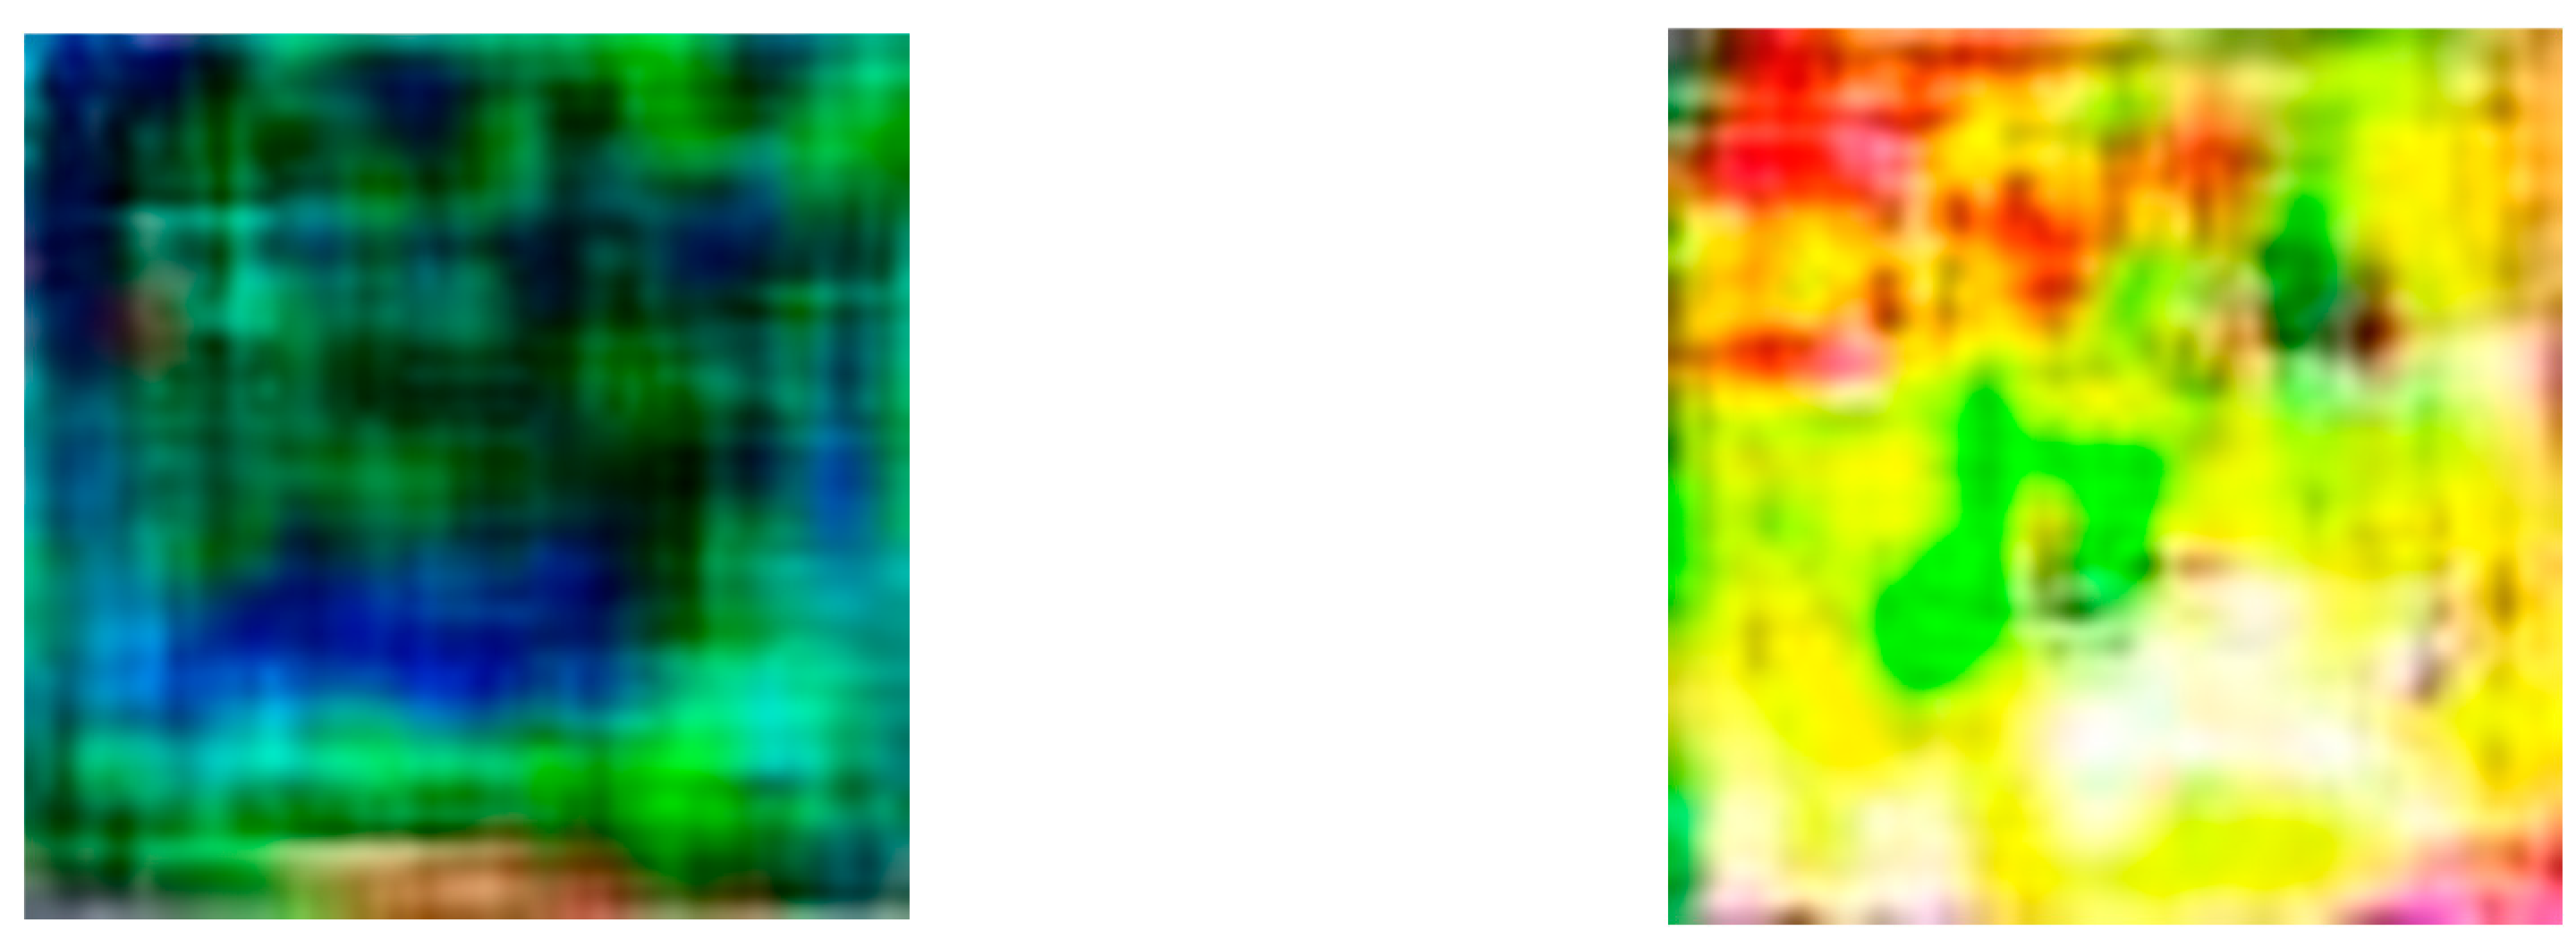
Figure 7.
The architecture of a Generative Adversarial Network (GAN) [11].
Figure 7.
The architecture of a Generative Adversarial Network (GAN) [11].
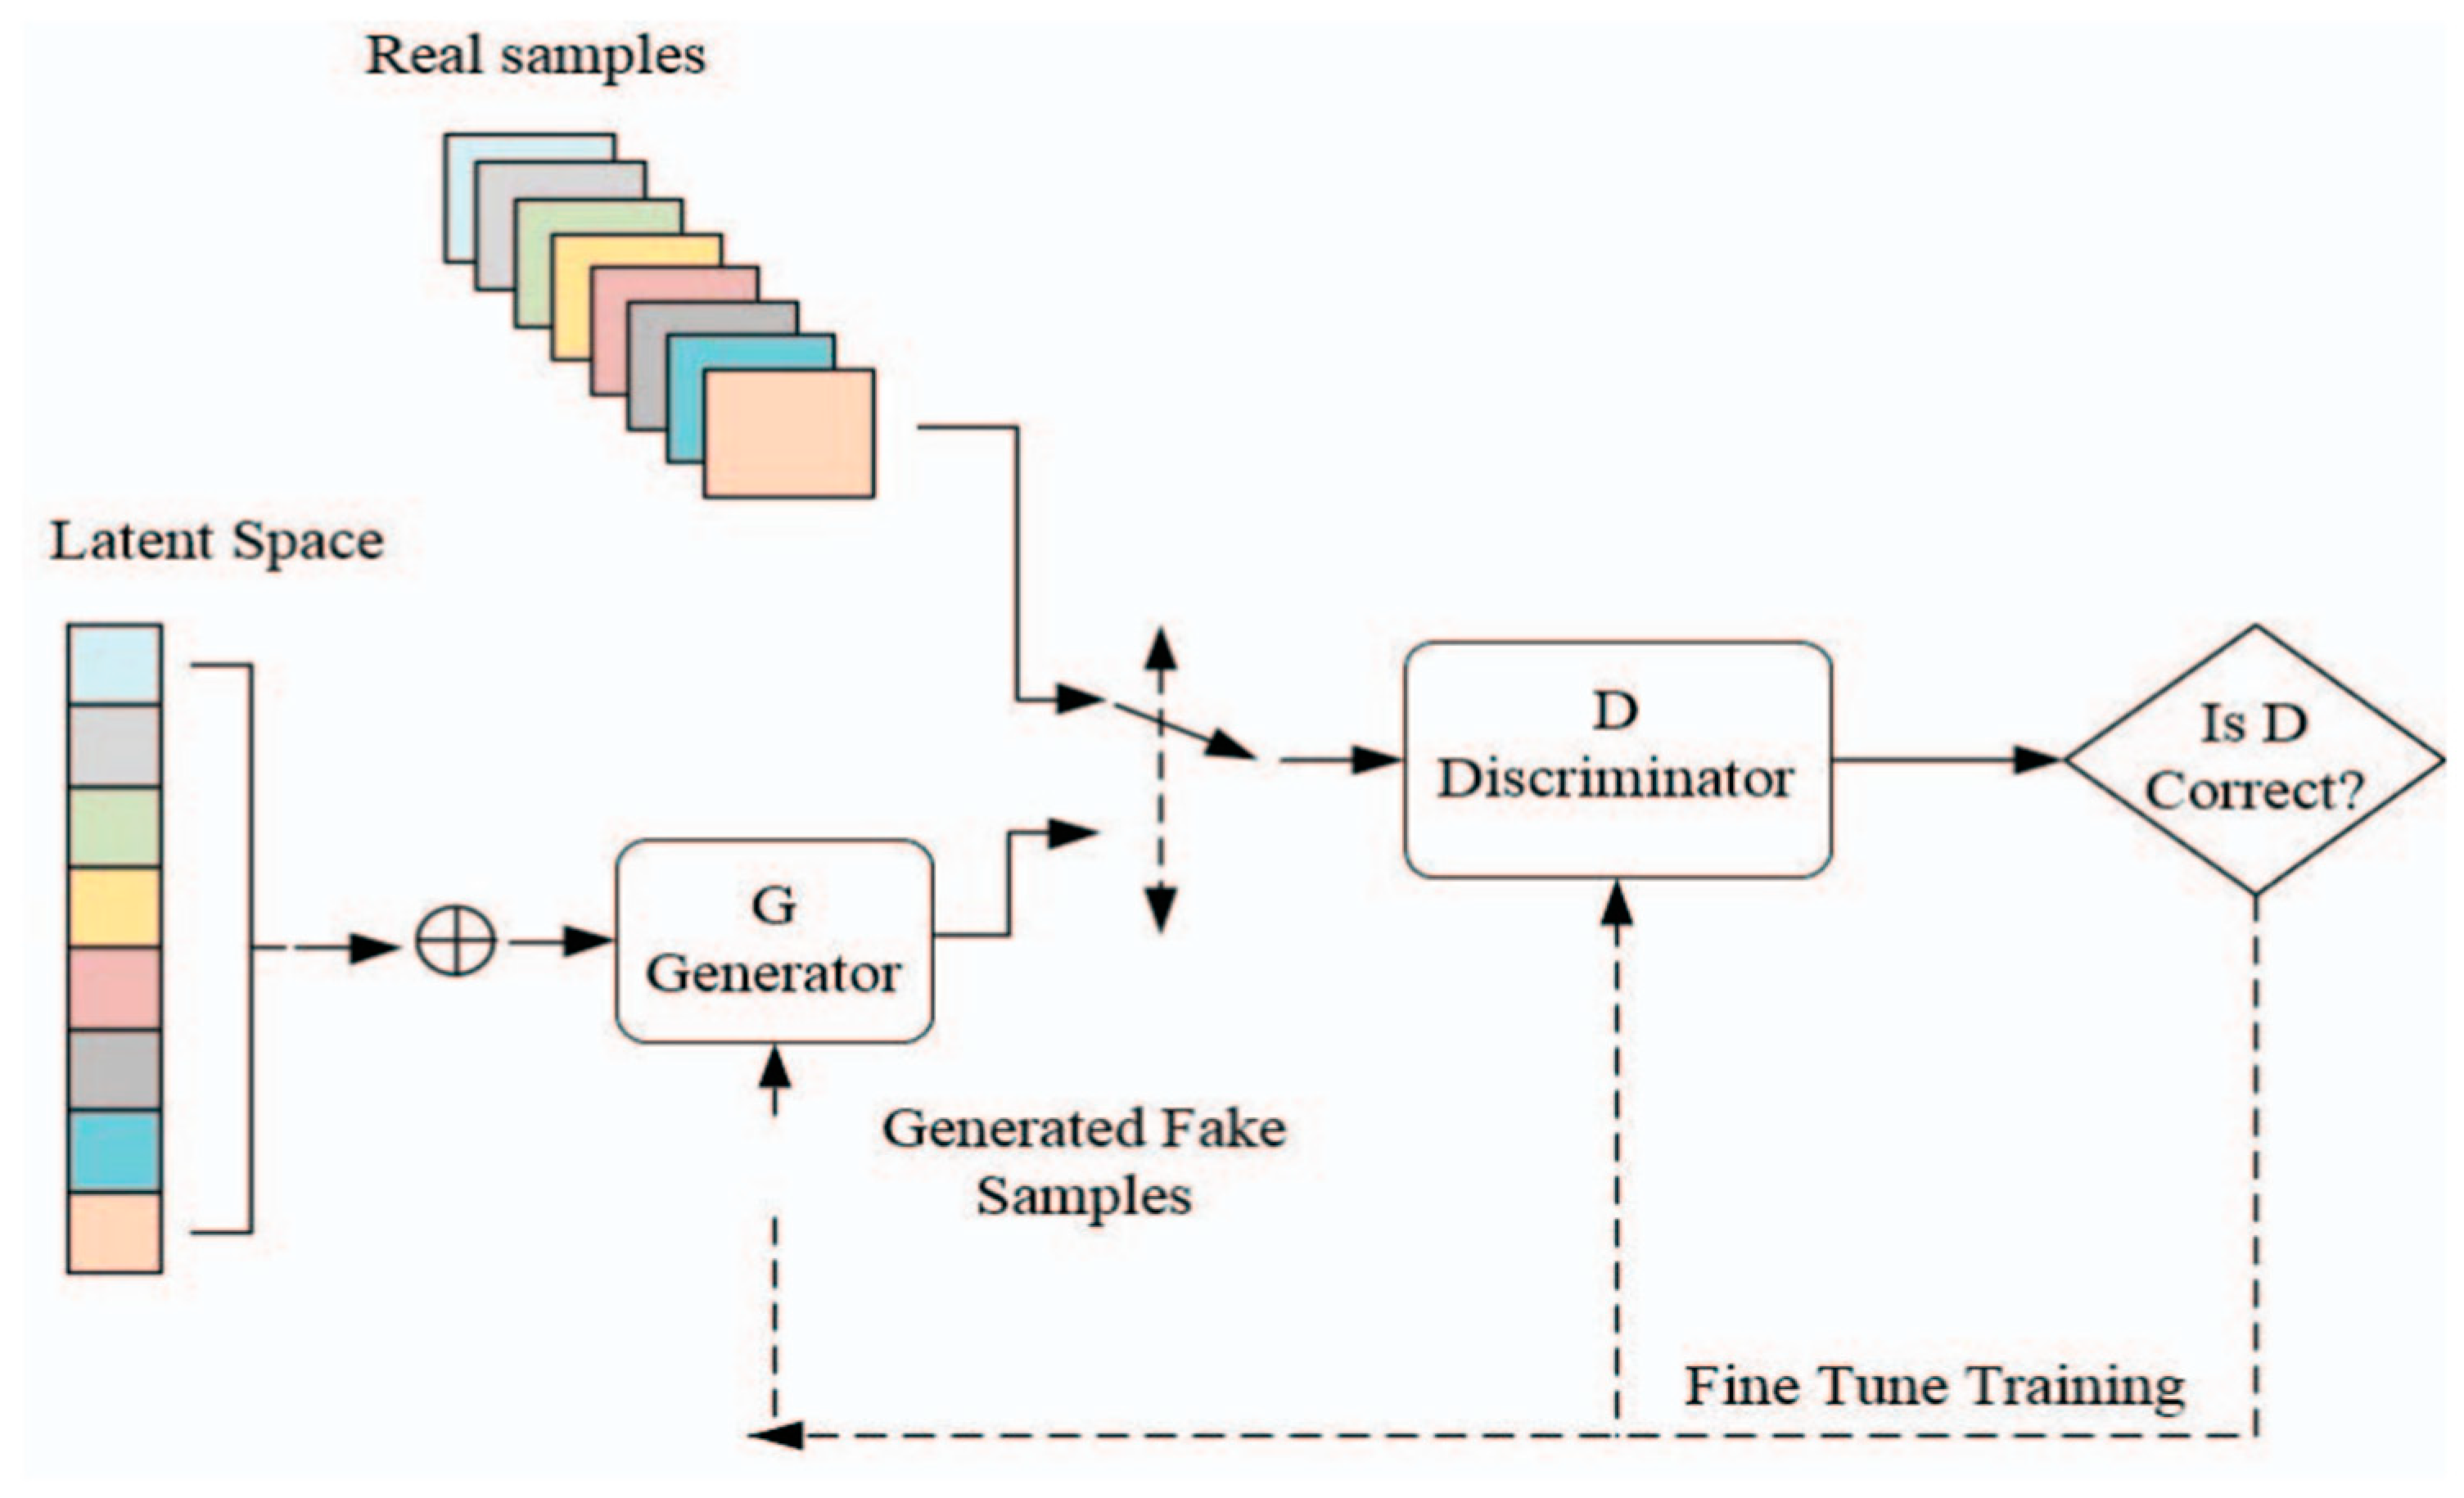
Figure 8.
Hyperspectral 3D Cubes for Healthy and Powdery Mildew leaves respectively.
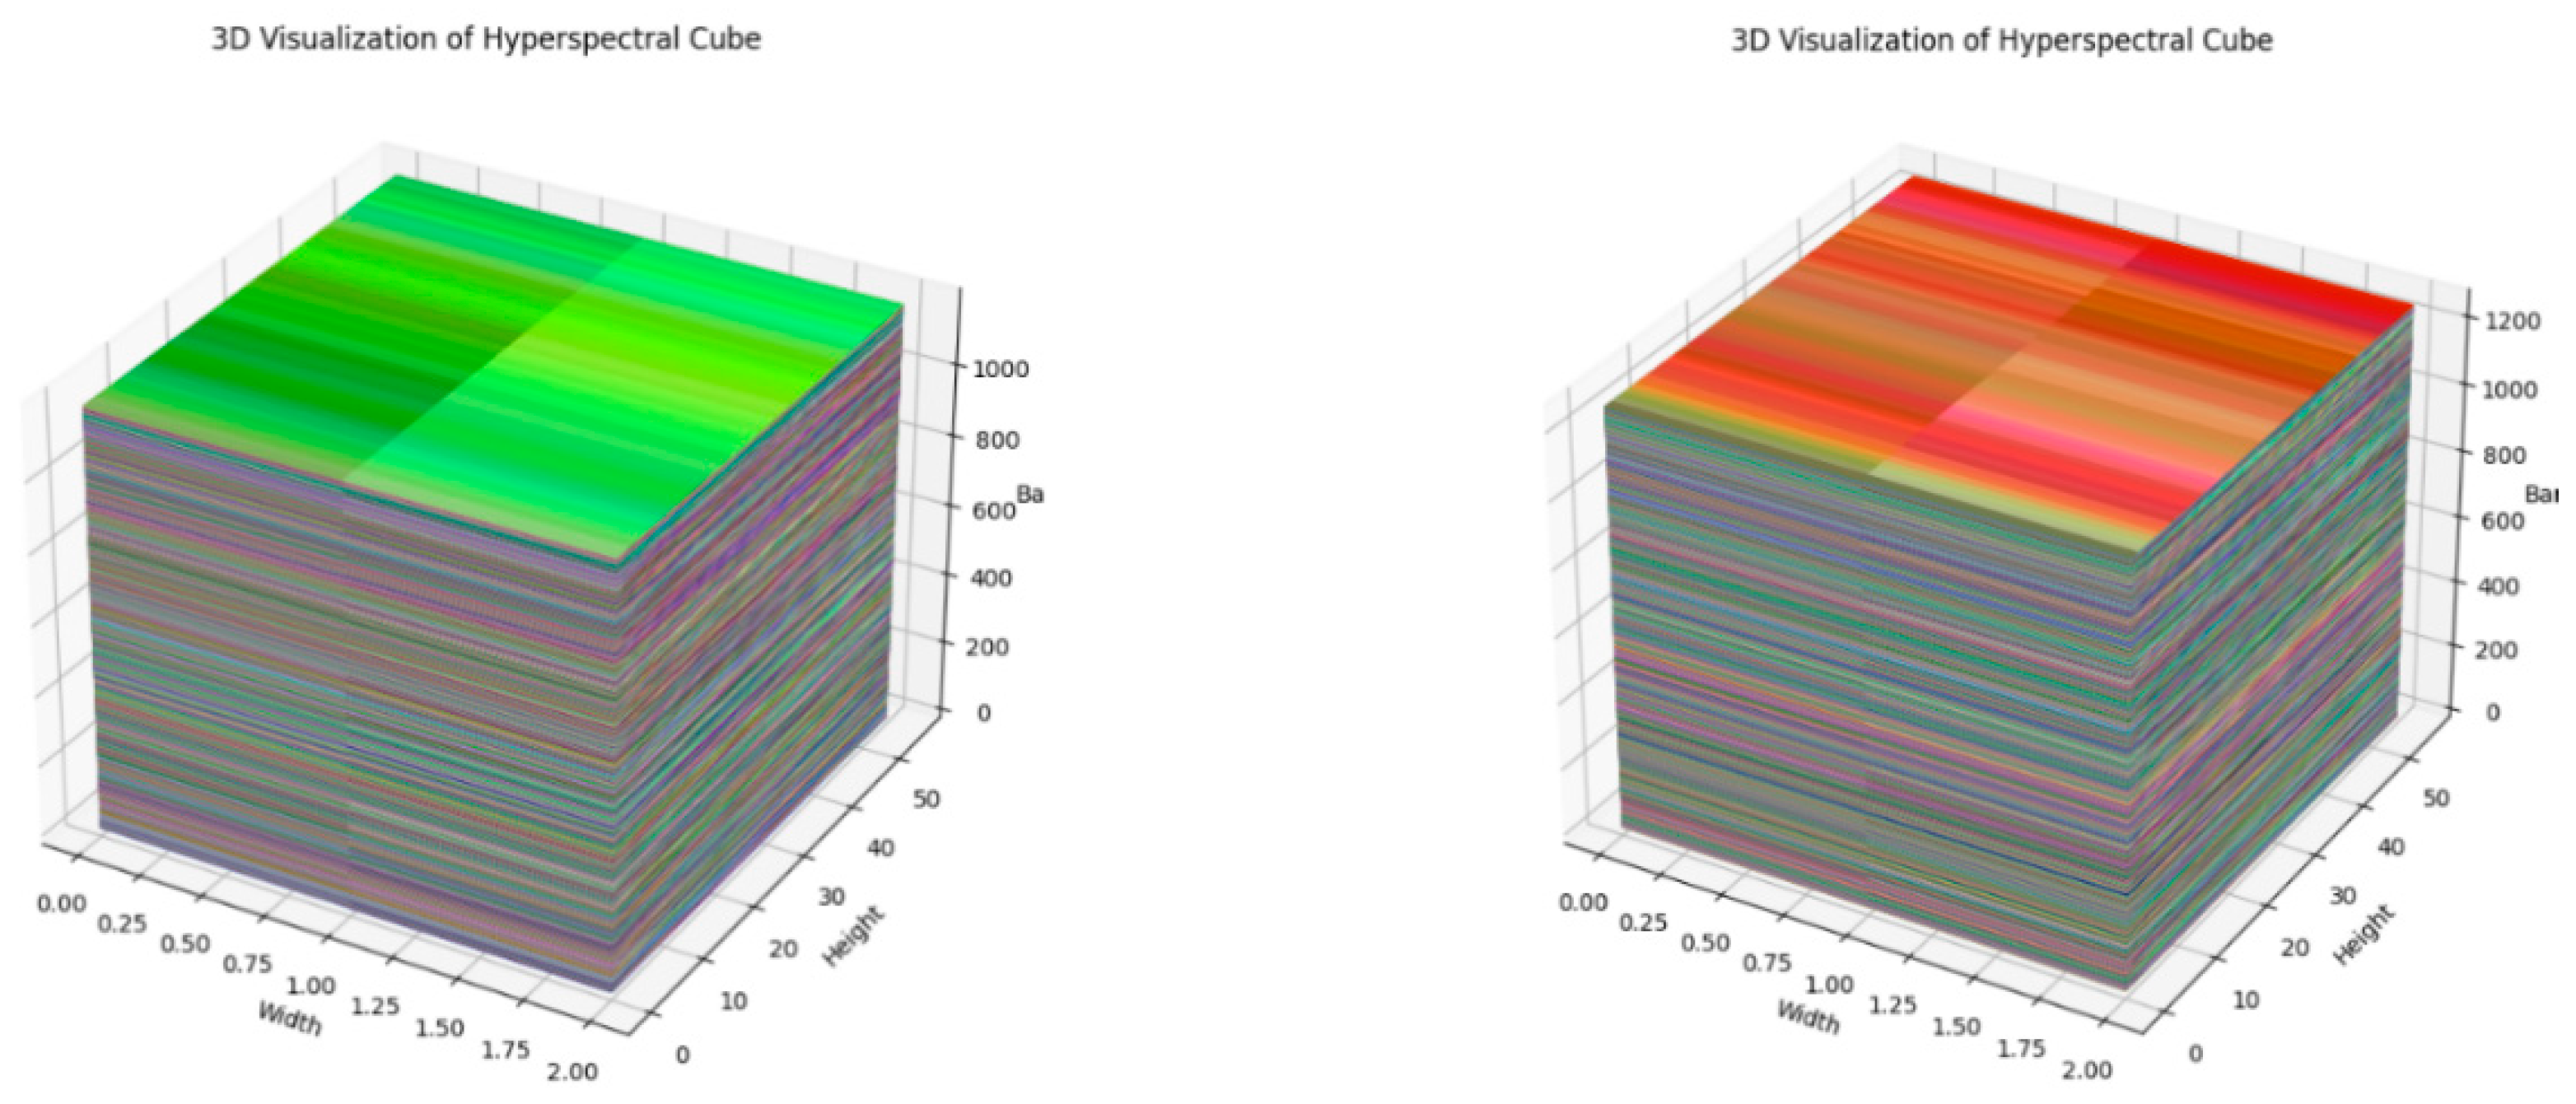
Figure 9.
Healthy and Powdery leaf image features extraction graph using GMM model on predefined dataset.
Figure 9.
Healthy and Powdery leaf image features extraction graph using GMM model on predefined dataset.
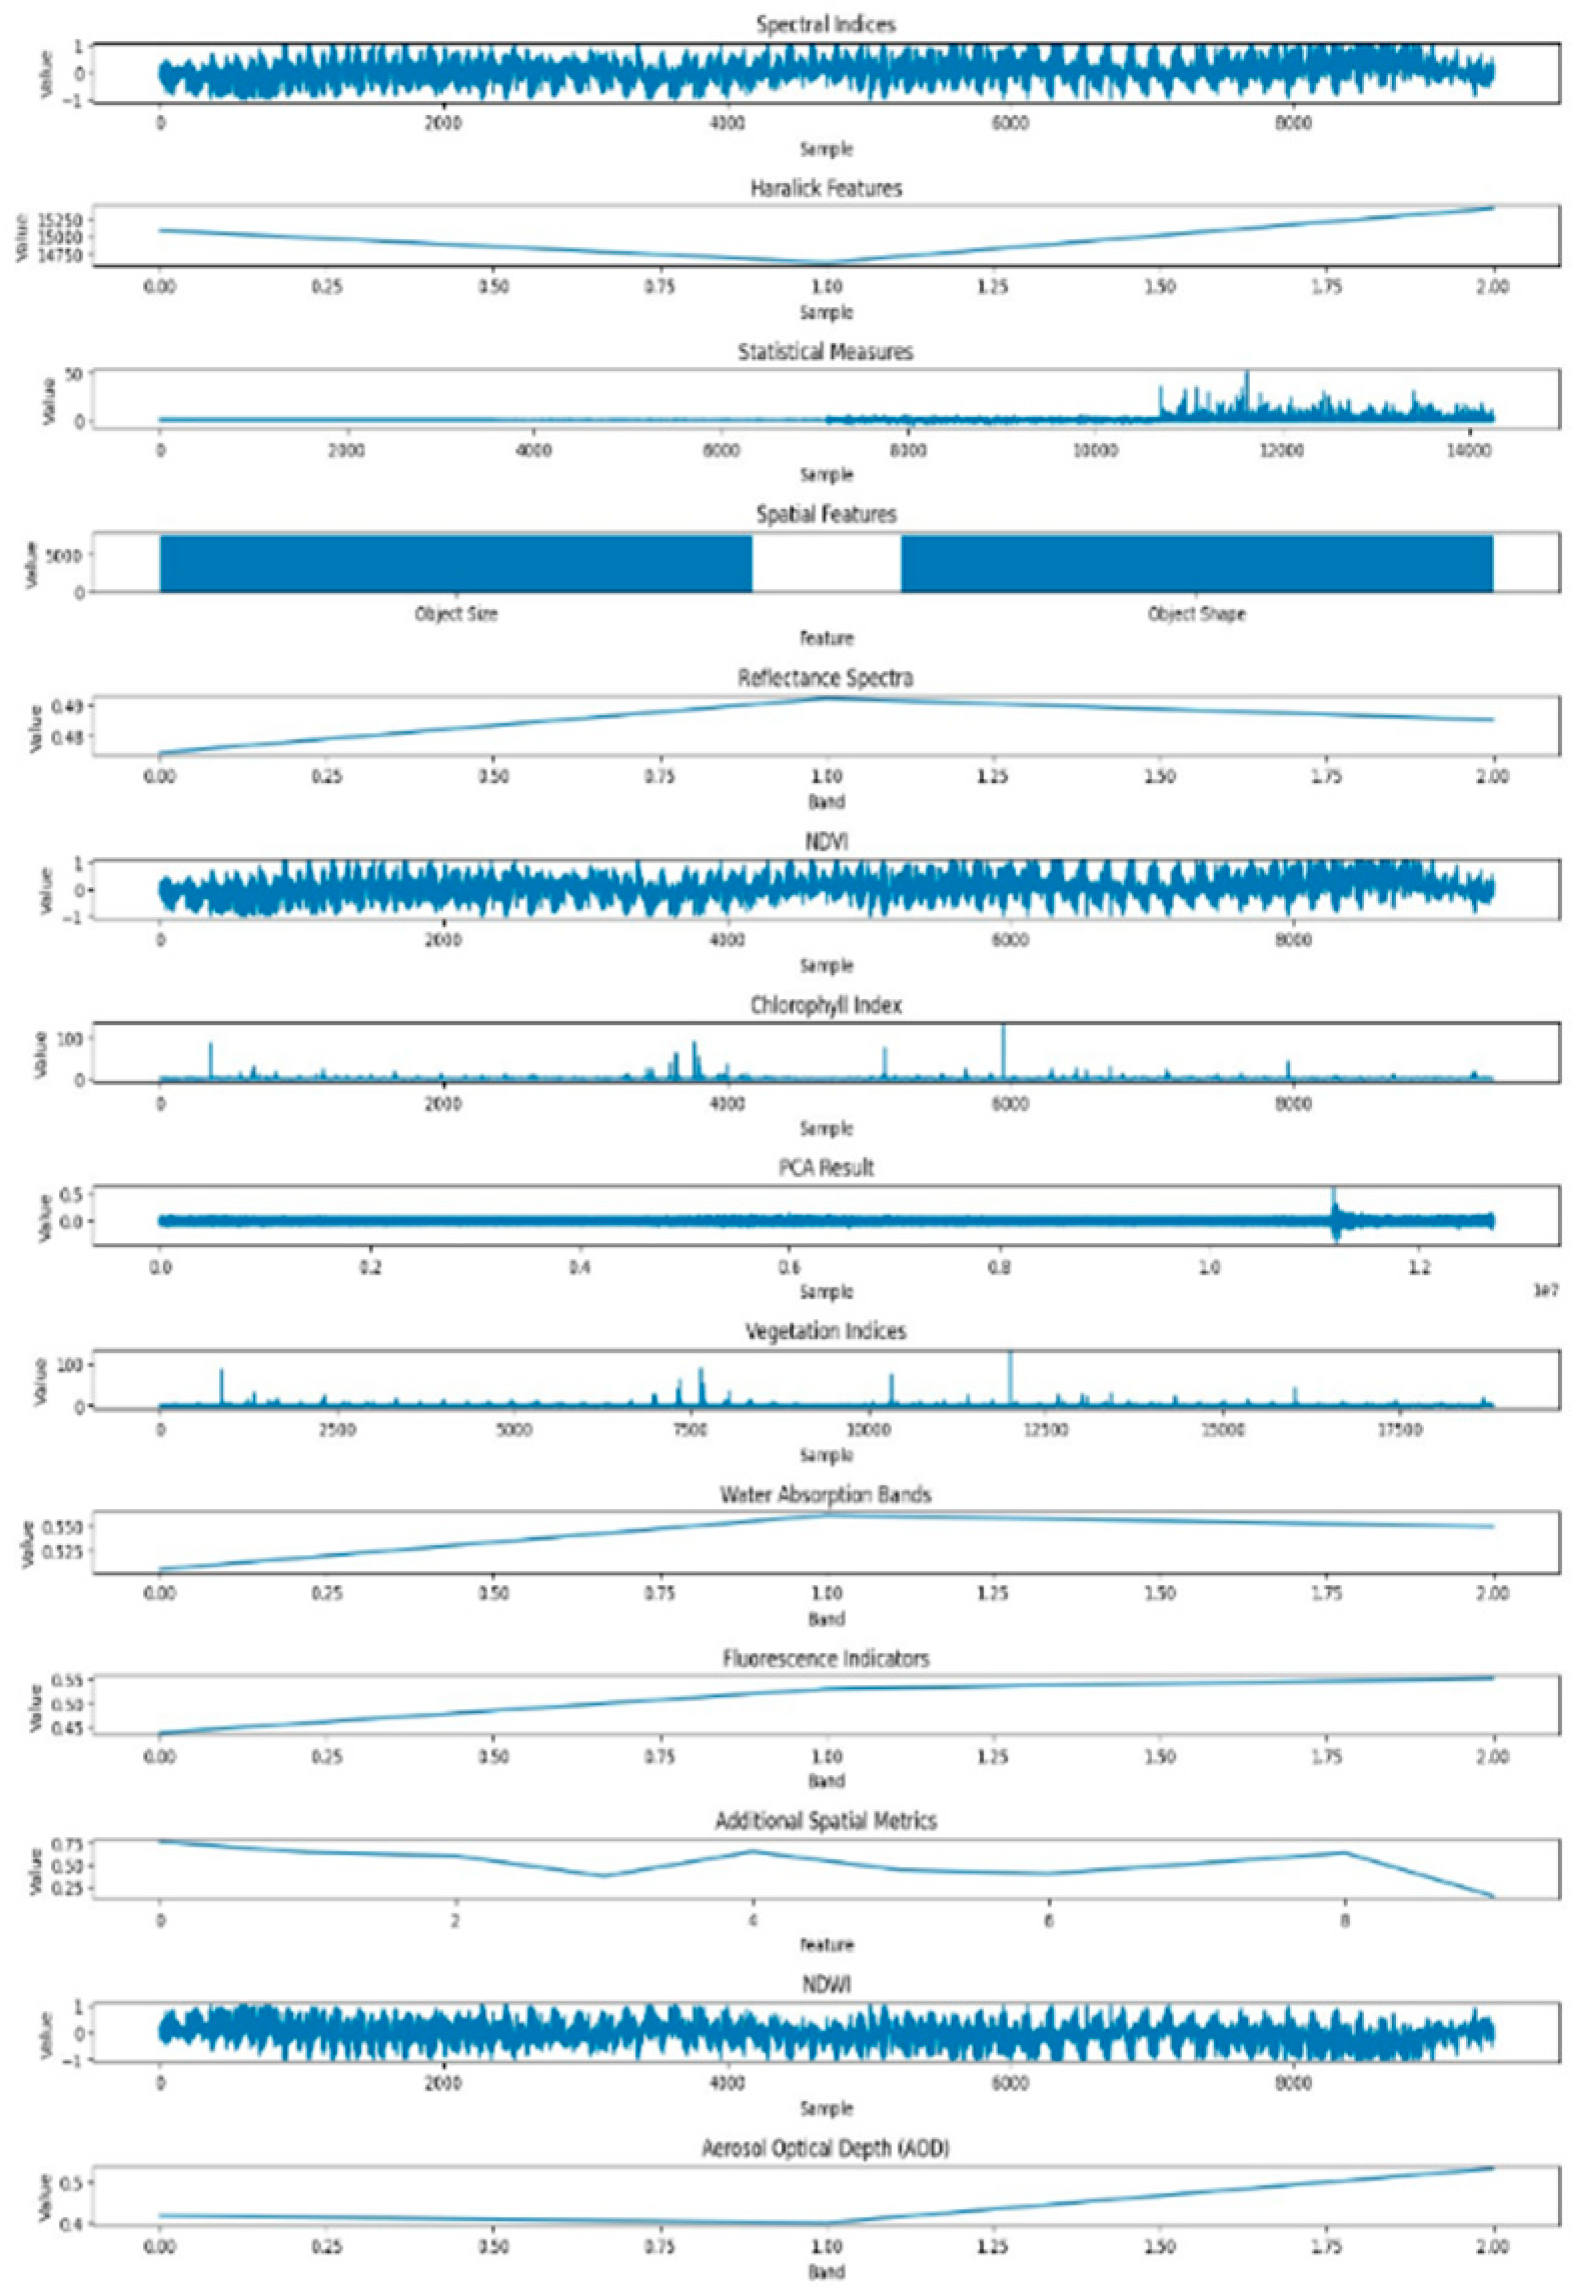
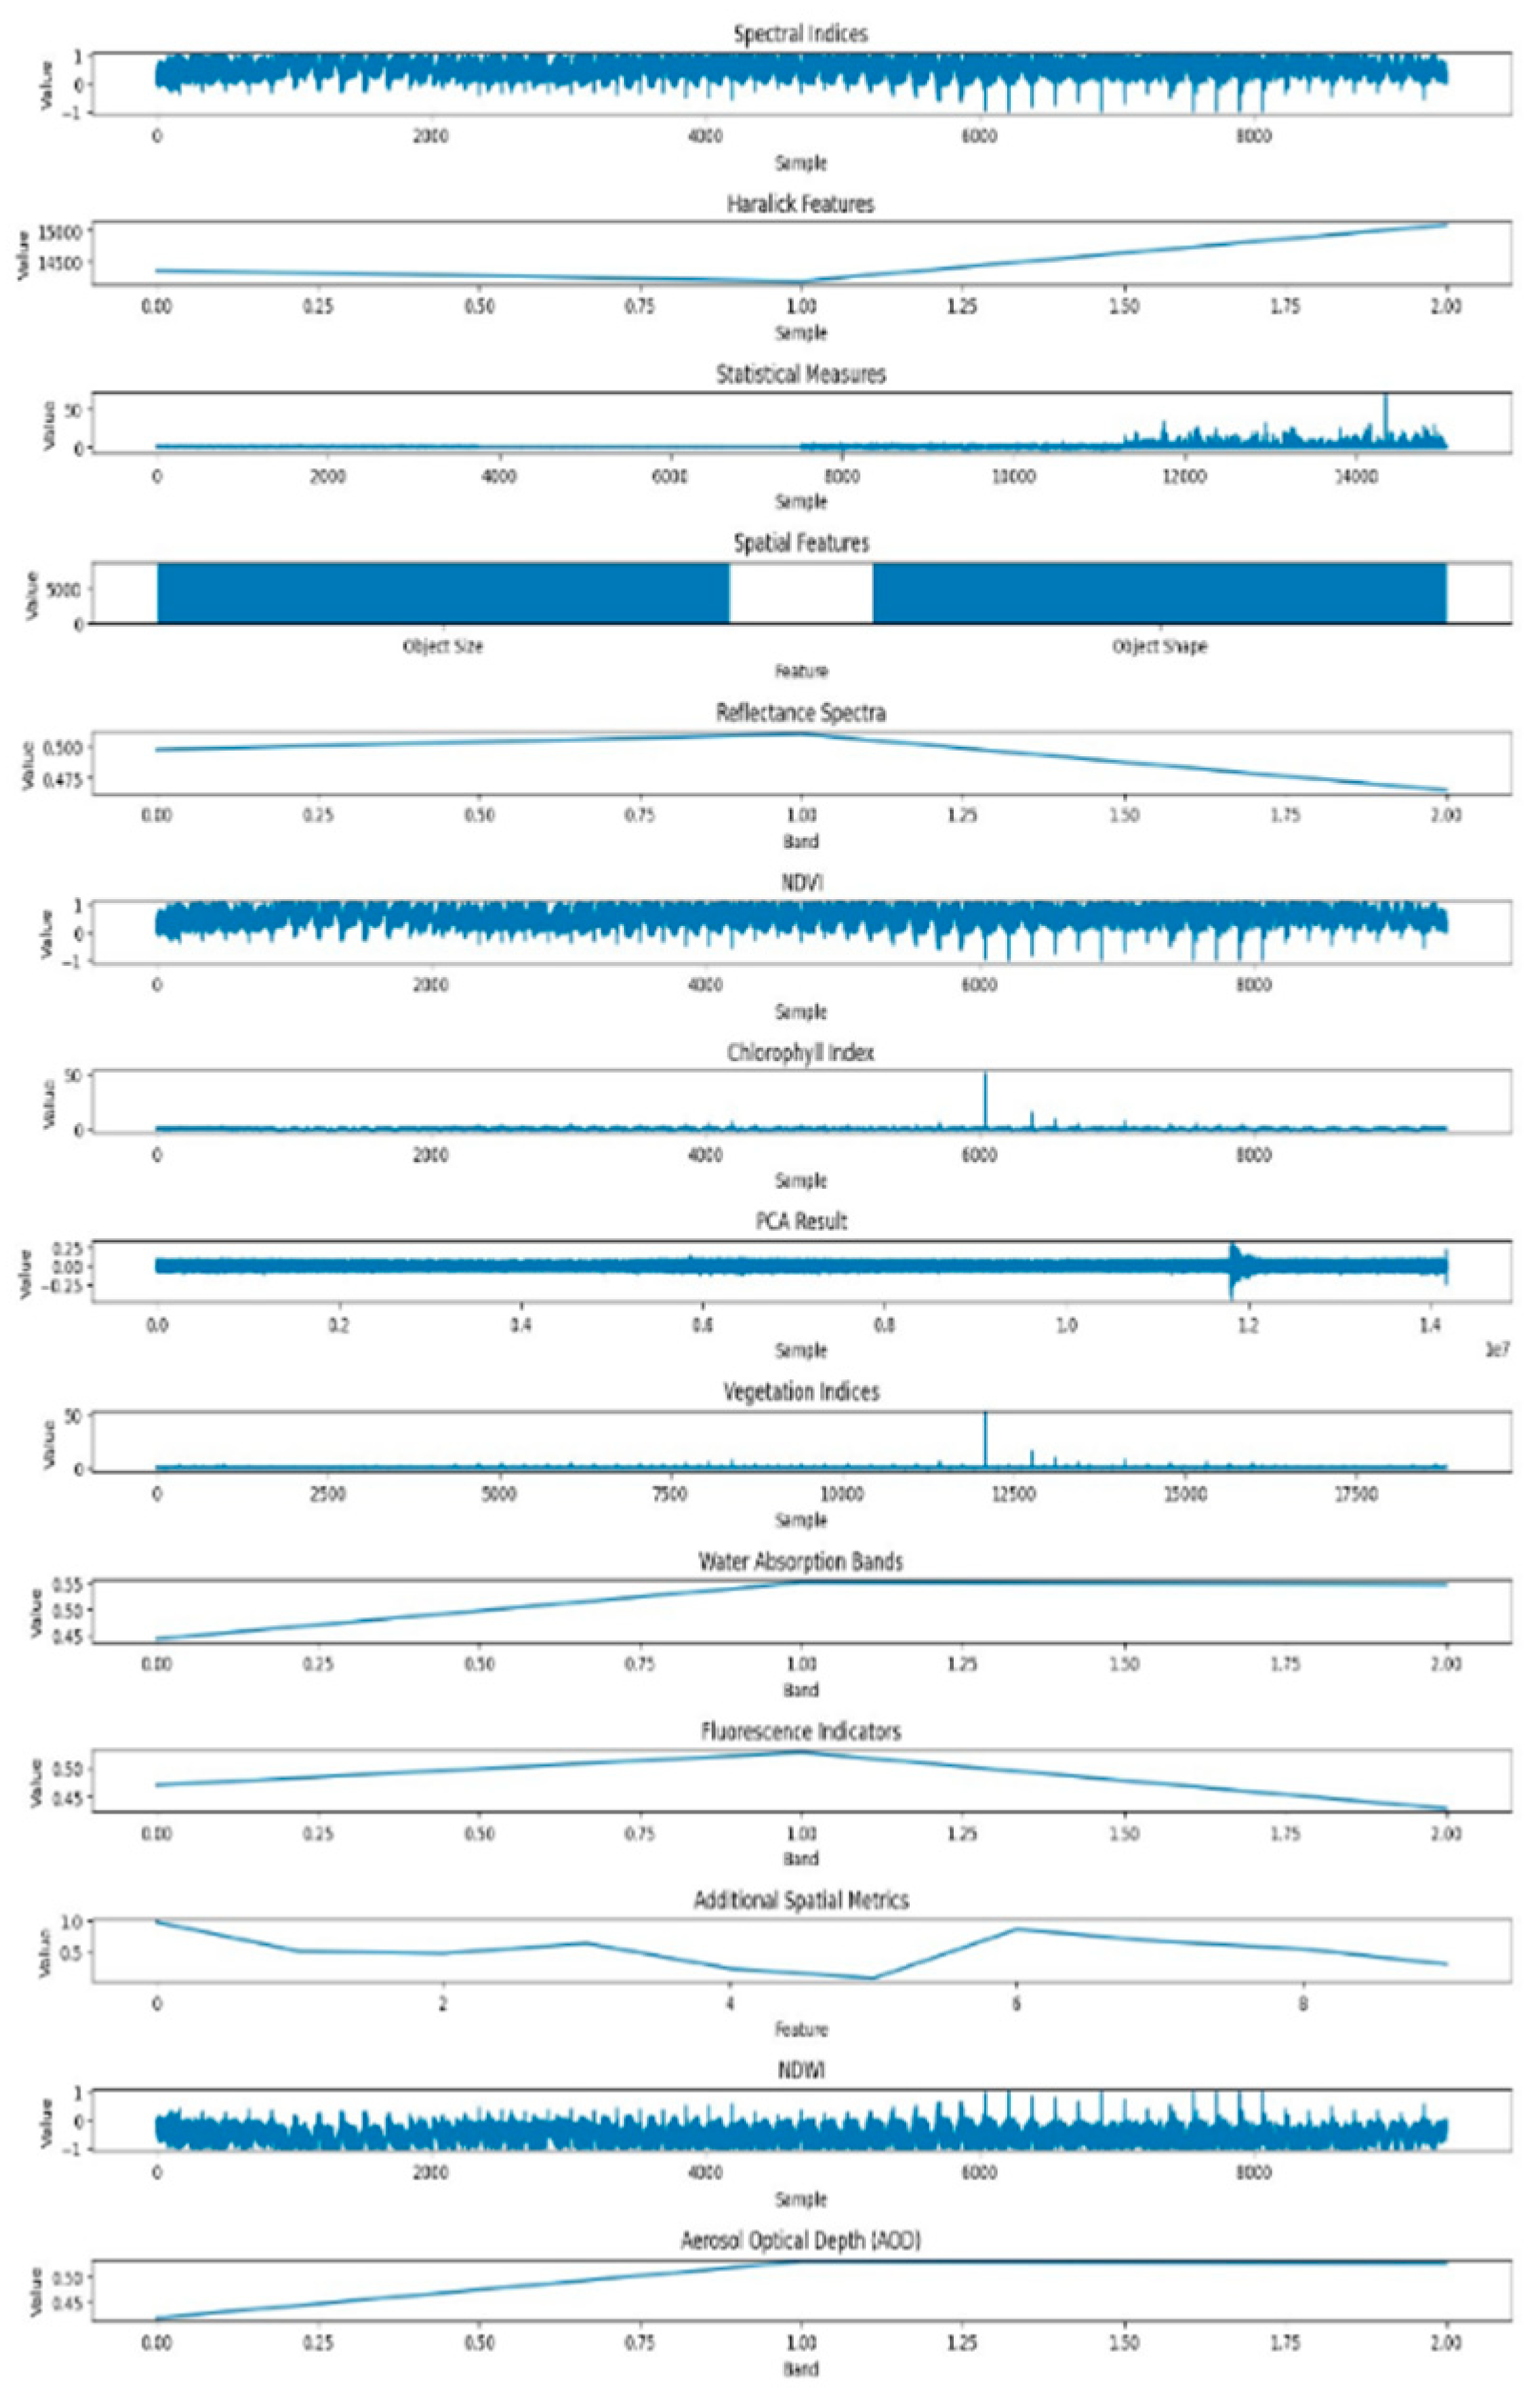
Figure 10.
Healthy and Powdery leaf image features extraction graph using K-means model on predefined dataset.
Figure 10.
Healthy and Powdery leaf image features extraction graph using K-means model on predefined dataset.
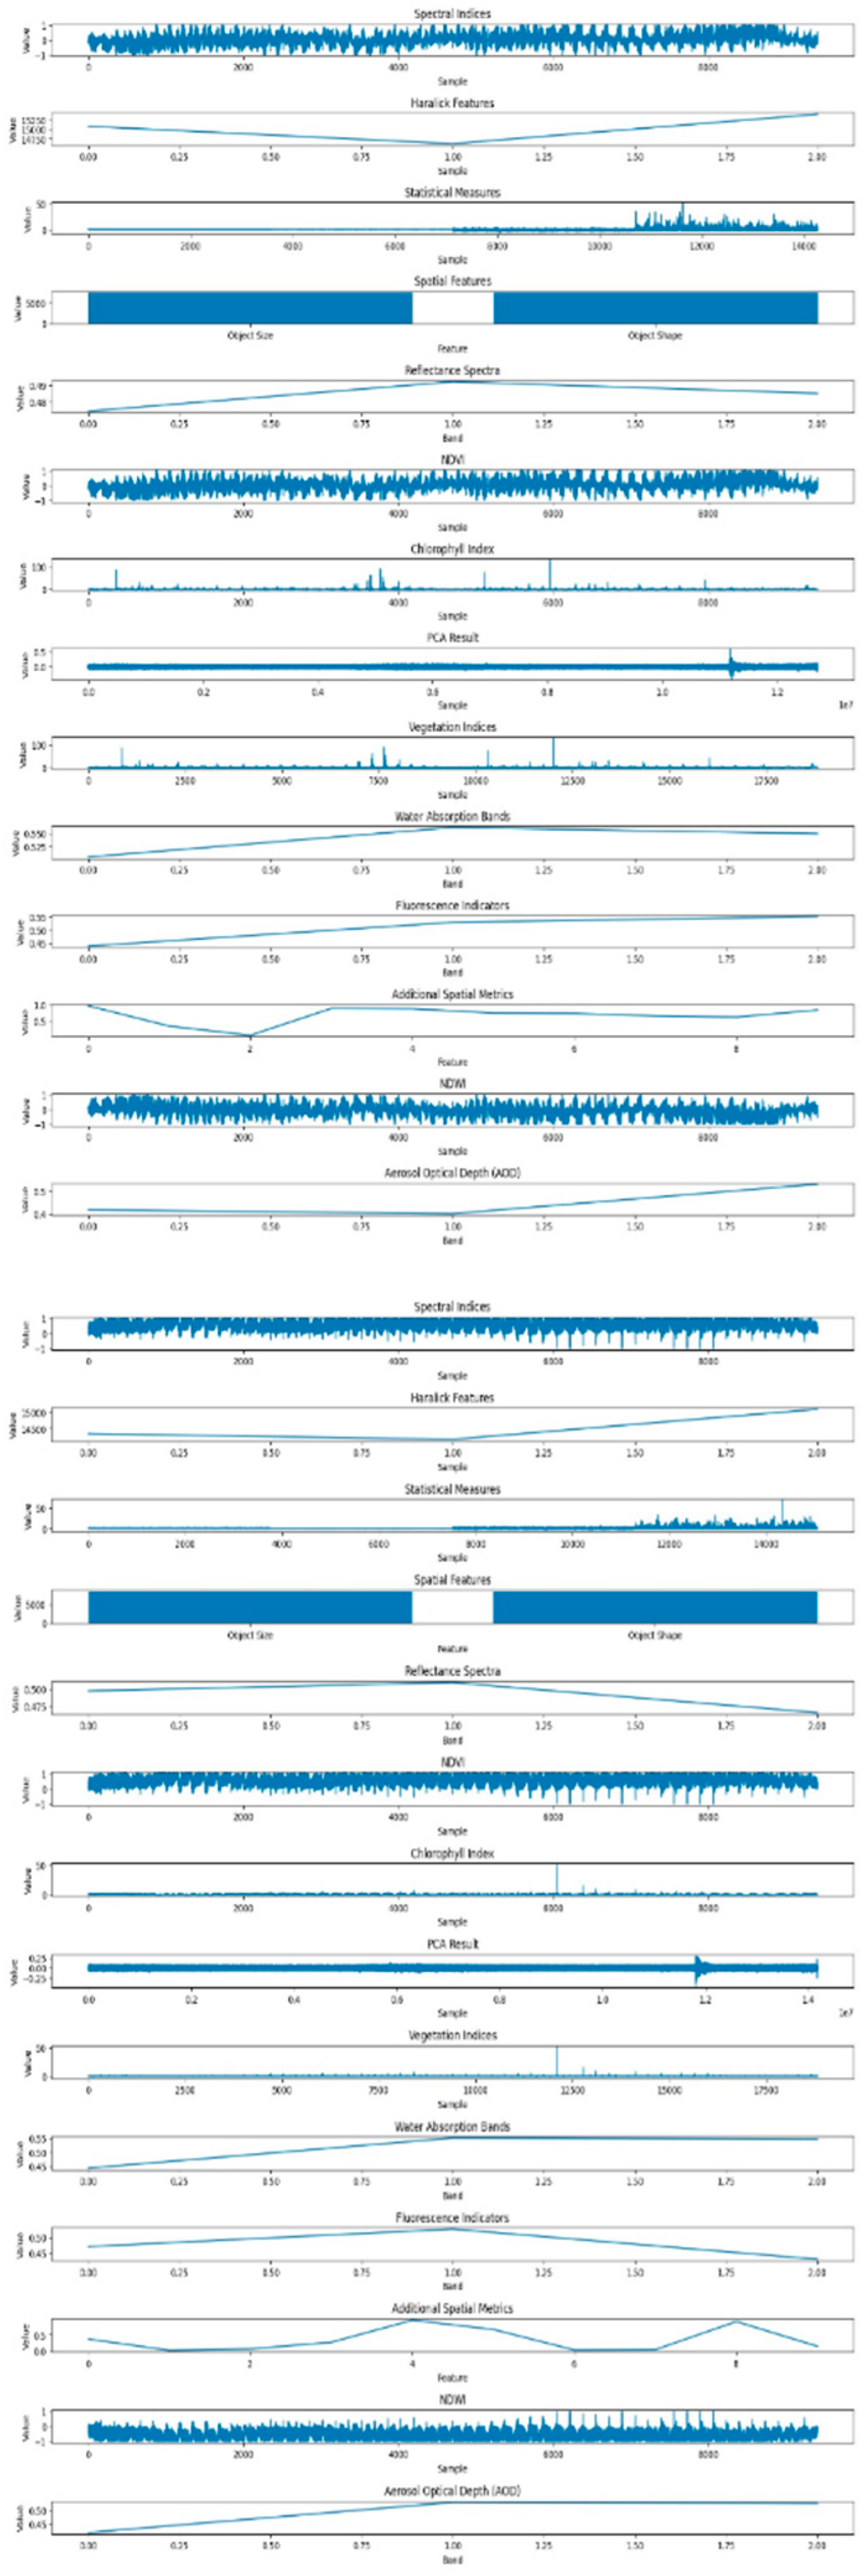
Figure 11.
Live leaf normal and its respective SHSI images and severity measurement using k-means method.
Figure 11.
Live leaf normal and its respective SHSI images and severity measurement using k-means method.
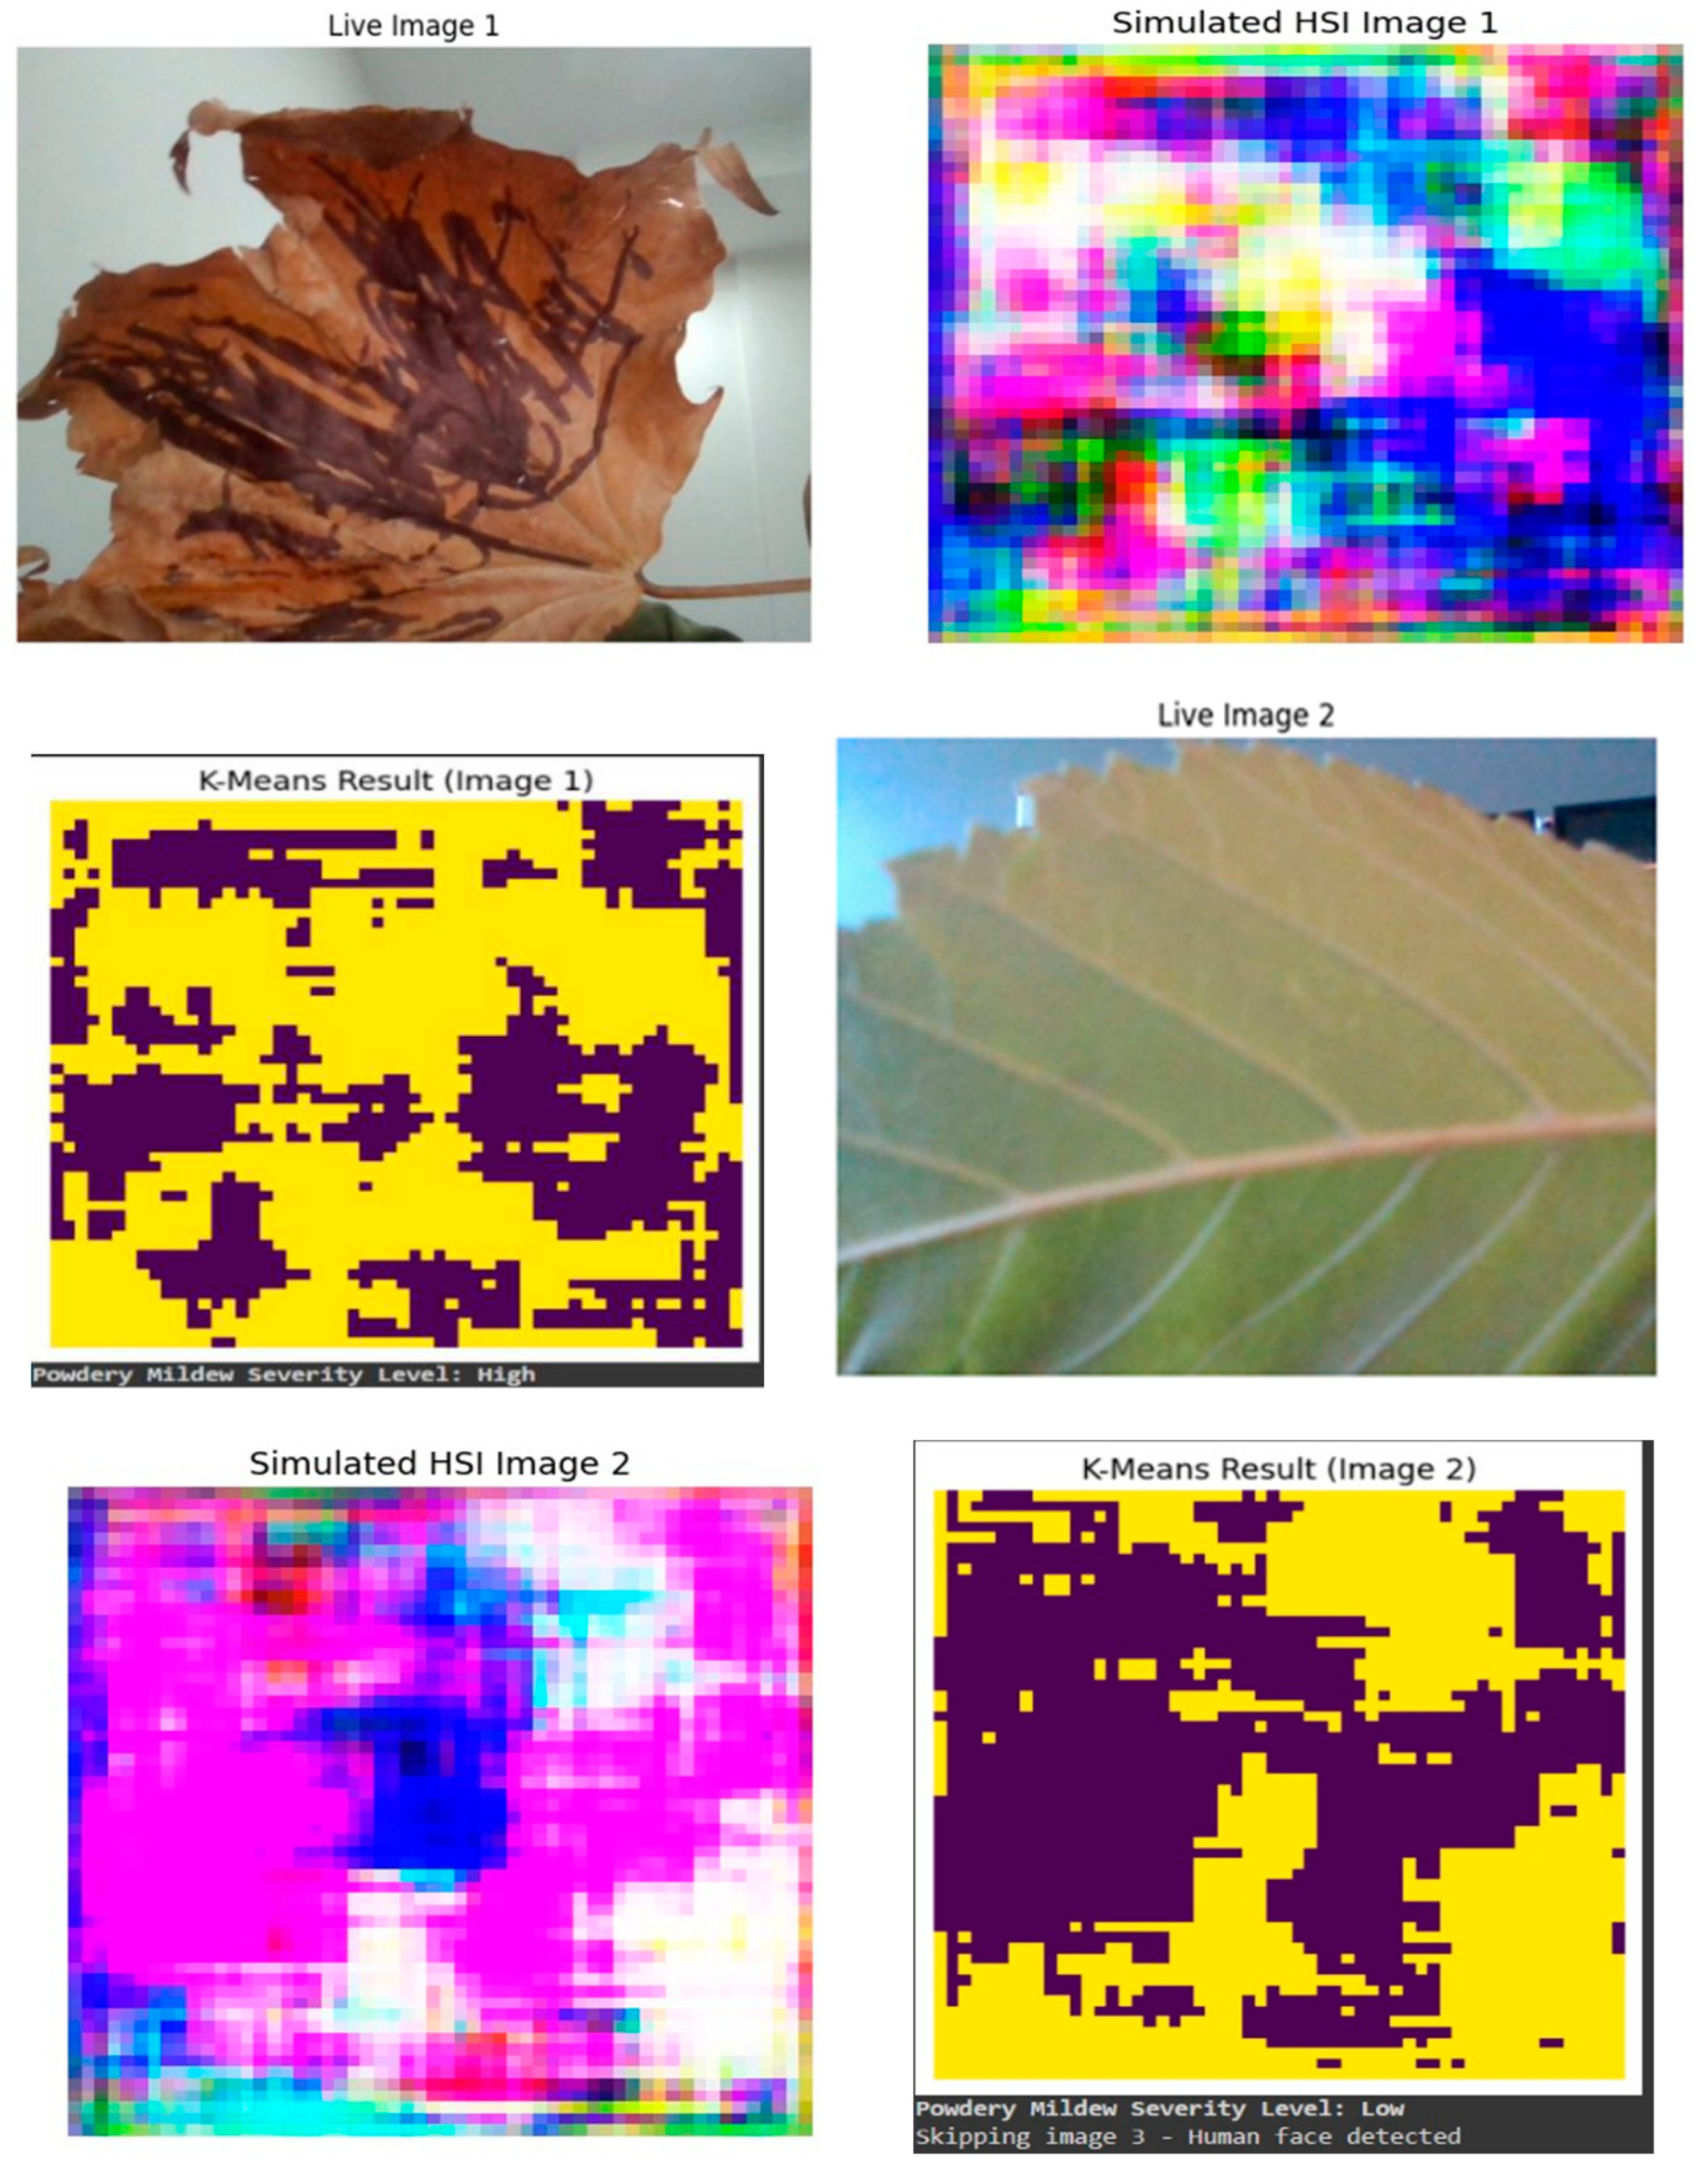
Figure 12.
Transforming RGB images into Simulated Hyperspectral Images.
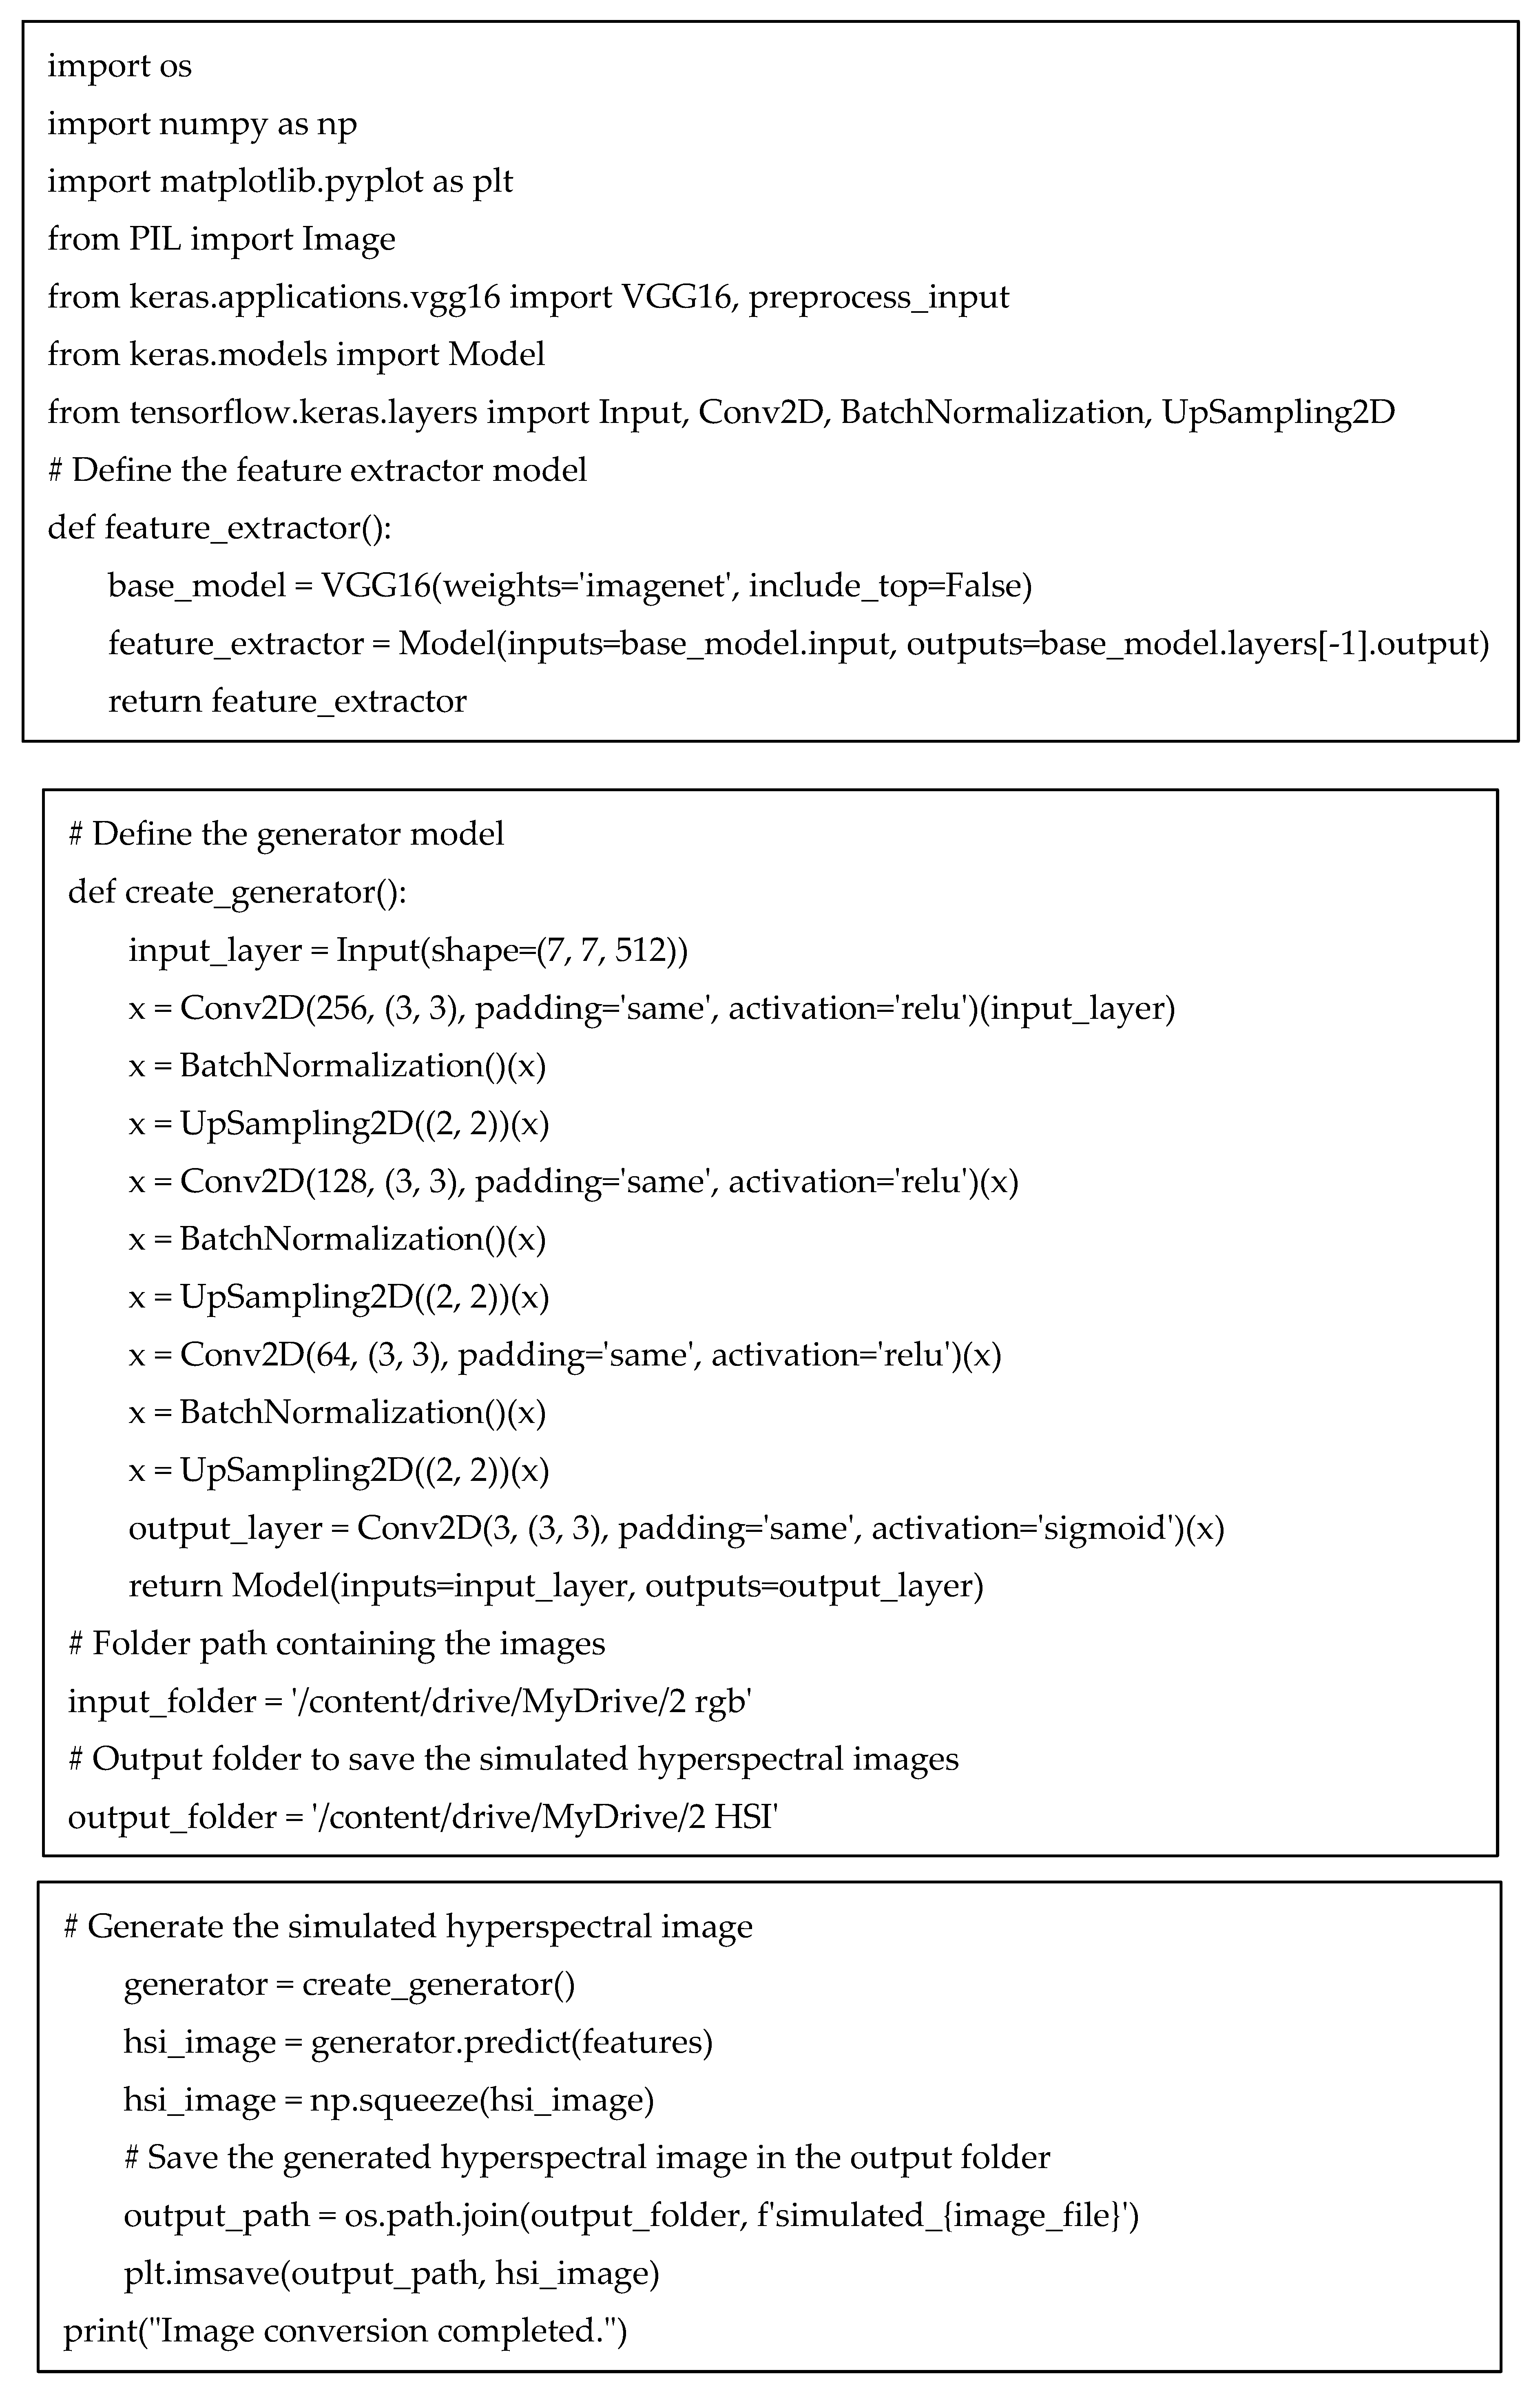
Figure 13.
Severity measurement by GMM model.
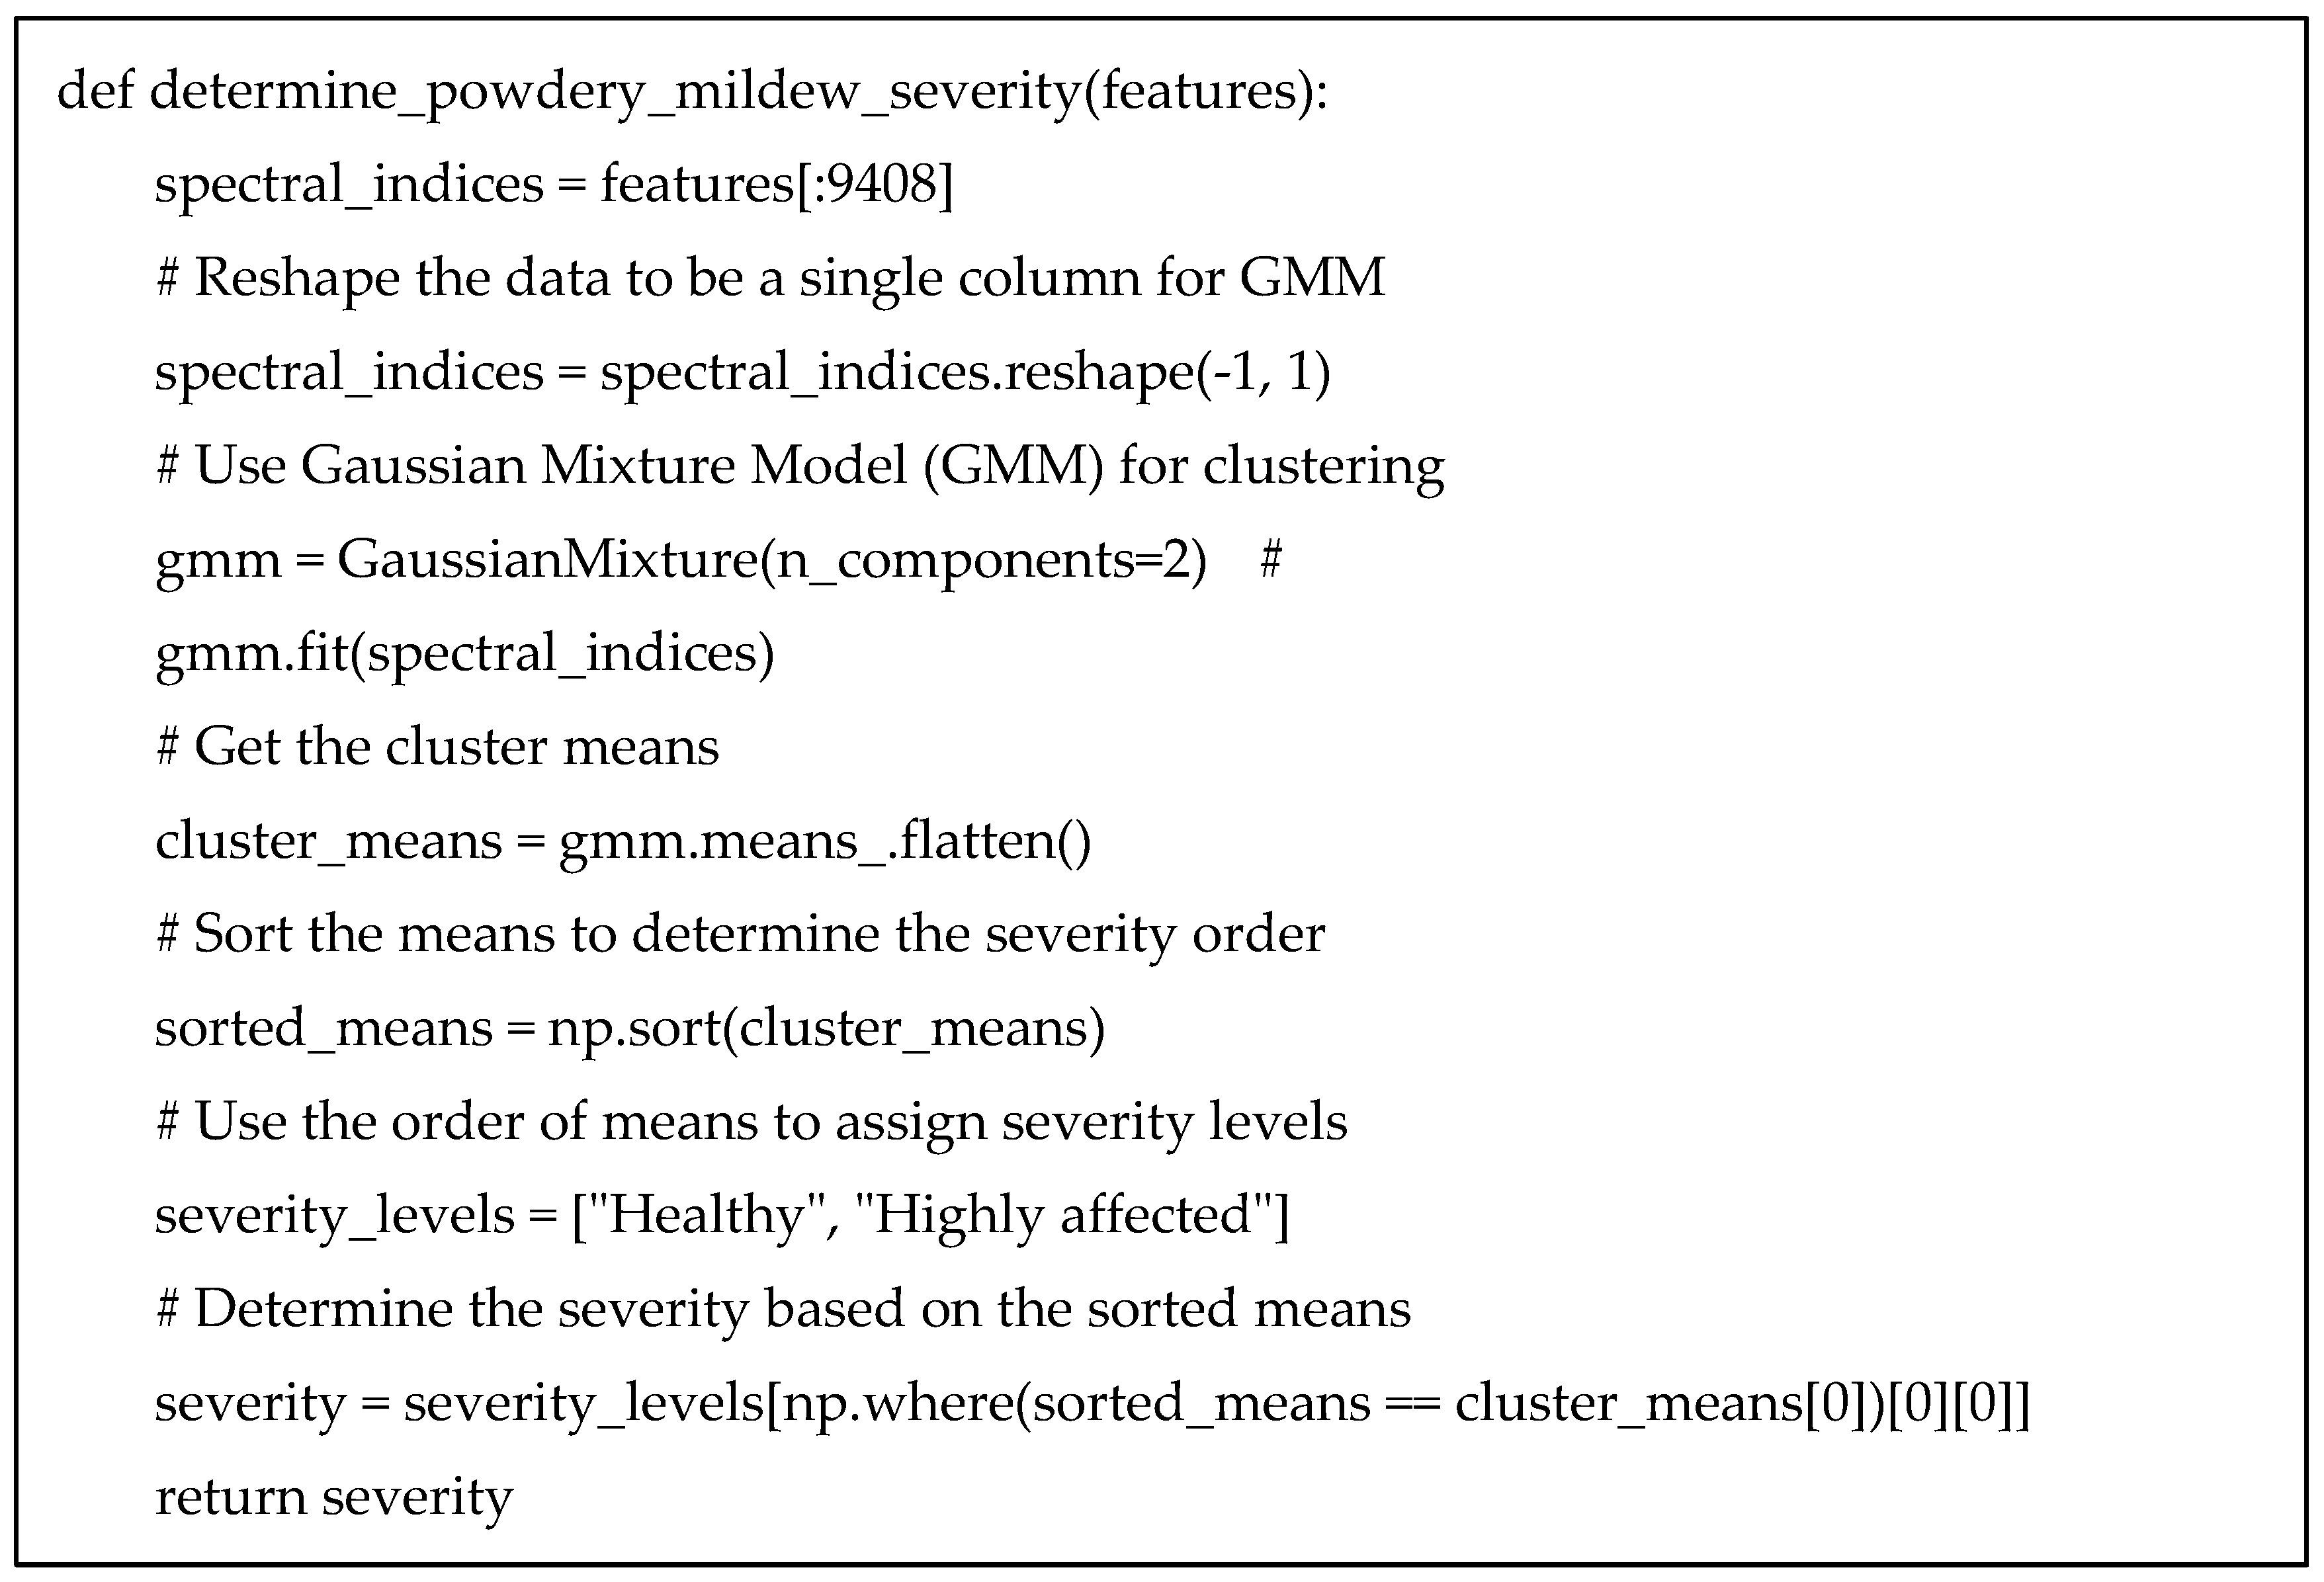
Figure 14.
Severity measurement by k-means model.
Disclaimer/Publisher’s Note: The statements, opinions and data contained in all publications are solely those of the individual author(s) and contributor(s) and not of MDPI and/or the editor(s). MDPI and/or the editor(s) disclaim responsibility for any injury to people or property resulting from any ideas, methods, instructions or products referred to in the content. |
© 2024 by the authors. Licensee MDPI, Basel, Switzerland. This article is an open access article distributed under the terms and conditions of the Creative Commons Attribution (CC BY) license (http://creativecommons.org/licenses/by/4.0/).
Copyright: This open access article is published under a Creative Commons CC BY 4.0 license, which permit the free download, distribution, and reuse, provided that the author and preprint are cited in any reuse.


