Submitted:
26 January 2024
Posted:
29 January 2024
You are already at the latest version
Abstract
The moisture content of maize seed is an important indicator for evaluating seed quality and a fundamental item in grain testing. The experiment used direct drying method to measure the moisture content of 80 different varieties of maize samples, and captured their images using a hyperspectral imaging (HSI) system in the spectral range of 1100~2498nm. By comparing seven spectral preprocessing methods, the PLSR model established after Normalize pretreatment had the best effect. The characteristic wavelengths were selected by Successive Projections Algorithm (SPA), Competitive Adaptive Reweighted Sampling (CARS) and Uninformative Variable Elimination (UVE). Twelve prediction models were established for full band spectra and characteristic wavelengths based on PLSR, PCR and SVM. By comparing the performance of the prediction models, it was found the Normalize-SPA-PLSR algorithm was optimized. The values of RC2 and RP2 in the model were higher, which were 0.9936 and 0.9933, respectively, while the values of RMSEP and RMSECV were lower, which were 0.0357 and 0.0380, respectively. The Normalize-SPA-PLSR model was used as a visual prediction model for moisture content of maize seed, the 20 maize varieties in the prediction set were visualized to obtain visualized color images of moisture content. The color differences between different moisture content images were significant. The result indicated that hyperspectral imaging could accurately, rapidly, and non-destructive predict moisture content of maize seed, which provided technical support for moisture content detection in the process of maize harvest, storage and processing.
Keywords:
Hyperspectral imaging
; Moisture content
; Maize seed
; Non-destructive
; Visualization
1. Introduction
Maize is an important grain crop and cash crop in China. It is very important to control the moisture content in the process of storage and breeding. After threshing, the embryo structure of maize is exposed in the external environment, which makes maize seeds vulnerable to the interference of the external environment, resulting in low storage stability. During storage, it will be of great use to keep the moisture content of corn grain below 13% in order to reduce the metabolic rate of corn grain in the sink, prevent excessive heat generation from causing mildew, and ensure the nutritional content and seed vigor of seeds [1,2,3]. In addition, in the process of breeding, the maize seeds stored in the storehouse for a long time have very high requirements for the temperature and humidity of the environment, and the moisture content carried by the seeds when they are stored in the storehouse has an important impact on the germination rate of the seeds in the future [4]. Therefore, the control and detection ofareoisture content is the key link to ensure the quality of corn seeds during the process of corn warehousing.
At present, the moisture content of maize seed is usually detected by drying or chemical methods to remove the water in the corn grains, and the moisture content of the sample can be calculated [5,6]. Although these methods have high detection accuracy, they destroy the activity of the seeds. If there are more batches of corn, more samples need to be sampled, which consumes time and labor.
Hyperspectral imaging(HSI) integrates the advantages of spectroscopy and imaging, enabling simultaneous nondestructive testing of multiple targets and visualization of material composition content [7]. This technology has the characteristics of multiple continuous wavebands, high spectral resolution and “map one”, meeting the demands of rapid nondestructive testing. In recent years, it has been widely and in-depth studied and applied in the quality detection of agricultural products and food [8,9,10,11,12,13,14,15,16,17]. Nicola et al. used HSI to detect the moisture and lipid content of single coffee bean, and visualized the distribution of moisture and lipid content [18]. Xu et al. collected hyperspectral images of single cucumber seeds in the range of 400~1000nm and 1050~2500nm, and predicted the moisture content of single cucumber seeds based on the two bands and conducted visualization analysis. It was found that the predicted effect of moisture content in the range of 1000~2500nm was better [19]. Jennifer et al. realized the moisture content detection and visualization of single peanut kernels in the range of 900~1700nm, but only used the weighted regression coefficient method to extract characteristic wavelengths [20]. Wakholi et al. used HSI to measure the vitality of corn seeds and visualized the results [21]. Zhang et al. combined HSI and deep convolutional generative adversarial network to predict the oil content of single maize kernel, the results indicated the potential of HSI in the oil detection of maize seeds [22]. As for moisture content detection in maize seeds, some scholars have carried out some research using HSI, for example, Wang et al. established a CARS-SPA-LS-SVM model to measure the moisture content of seeds, the accuracy of this model reaches 93.11% [23].
In conclusion, HSI is feasible for rapid detection of moisture content in maize grains, and 1000~2500nm is the ideal wavelength for moisture content detection. However, the study of corn seed in Northeast China is not enough, with no research on spectral preprocessing and selection methods for characteristic wavelengths, and the accuracy obtained is not high. In this article, eight different kinds of maize seeds were chosen as the research object. Compared seven preprocessing methods and three feature wavelength selection methods to find the optimal prediction model. Detected and visualized the moisture content of maize seeds in the spectral range of 1100~2498nm with 218 bands. Through this study, we can provide an experimental basis for the application of HSI in the quality detection of seed, and provided technical support for moisture content detection in the process of maize harvest, storage and processing.
2. Materials and Methods
2.1. Samples
The maize seeds used in the experiment were provided by Jilin Guangde Agricultural Technology Co., Ltd. (located at 42°39′ N and 126°08′ E), including 80 varieties such as XX27, ZH525, ST8, JY2, XY128, etc. All seeds were uncoated, and there was no significant difference in surface properties. Figure 1 is the picture of five kinds of seeds in the experimental samples.
100g samples of each variety were placed in Petri dishes respectively, and hyperspectral images were collected after 72 hours of standing in the laboratory. Then, the moisture content of each variety of corn samples was measured according to the direct drying method in GB5009.3-2016 National Food Safety Standard-Determination of Moisture in Food. Each variety was measured three times, and the average value was taken as the moisture content of the variety of corn seeds.
2.2. Experimental Equipment
The experiment utilized a hyperspectral imaging system to collect spectral images of various corn varieties. The system includes a 150W halogen lamp symmetrical linear light source (IT3900, Illumination Technologies, USA), a 1000~2500nm spectral module (ImSpector N25E, Spectral Imaging Ltd., Oulu, Finland), a resolution of 1600×1200 area array CCD camera (Bobcat ICL-1410, Florida, USA), a precision mobile control platform (IRCP-0076-400, Isuzu Optics Corp., Taiwan), and a dark box for minimizing environmental interference (1.2×1.4×0.5m), as well as a computer for control and data acquisition. Image acquisition and displacement control are managed by Spectral Image-N25E software, while data processing and model establishment are carried out using Matlab.
Before image acquisition, adjust the object distance, exposure time, focal length, and moving speed of the optical system to ensure that the captured image shape is clear and accurate. After multiple experiments, the following parameters were set: when adjusting the lens focal length to 30~40cm, the actual acquisition line width was obtained to be 10~13cm; Set the exposure time to 10ms; The platform moves at a speed of 7mm/s to meet the shooting requirements.
During image acquisition, black and white noise is acquired for black and white correction to reduce or eliminate the effects of dark current, stray light, and noise interference from charge-coupled devices in hyperspectral cameras [24,25]. The correction formula is:
Where, R is the corrected image, Iraw is the original image, Iwhite is the fully white-calibrated image, and Idark is the fully black-calibrated image.
2.3. Data Processing and Modeling Methods
2.3.1. Preprocessing Methods
In hyperspectral imaging systems, data preprocessing is a crucial step, as it directly affects the accuracy of subsequent analysis and model construction. Common preprocessing methods include scatter correction, baseline correction, smoothing, and scaling [26,27,28]. The selection and application of these methods should be tailored to the specific characteristics of the data and the analysis requirements. Please conduct in-depth analysis on the selection and applicability of preprocessing methods, the reasons for the absence of standard preprocessing algorithms, and the lack of widely recognized evaluation metrics. The preprocessing methods used in this article include: Moving Average, S-G smoothing, Baseline, Normalize, Standard Normal Variate (SNV), Multivariate Scatter Correction (MSC), and Detrending. A PLSR model was developed for the preprocessed spectral data to determine the optimal preprocessing method.
2.3.2. Successive Projections Algorithms (SPA) Method
SPA algorithm is a forward variable dimensionality reduction algorithm proposed by Araujo et al. that minimizes collinearity in vector space. It can eliminate redundant information in the original spectral data, and thus facilitate spectral feature wavelength selection [29,30]. SPA is a forward selection method, which starts with one wavelength and merges a new wavelength at each iteration until all wavelengths are merged. The goal is to solve the collinearity problem and select wavelengths with minimal redundancy in information content [31]. The first wavelength is represented by , and the total number of wavelengths is , the specific implementation steps are as follows:
- Arbitrarily select a column in the spectral matrix , is the initial wave band , where . The number of variables to be extracted is .
- Before the iteration starts, assign to .
- Denote the set of remaining vector positions as :
- Compute the projections of onto the remaining column vectors separately:
- Take the maximum value of the projection values, denoted as:
- Take the maximum projection value as the initial value for the next iteration, return to step 2, and perform cyclic calculations.
- The combination of all bands obtained by dimensional reduction is denoted as S:
2.3.3. Competitive Adaptive Reweighted Sampling (CARS) Method
CARS is a feature selection method that combines Monte Carlo sampling with PLS model regression coefficients, mimicking the principle of "survival of the fittest" in Darwinian theory [32,33]. In the CARS algorithm, adaptive weighted sampling is used to retain points with larger absolute values of regression coefficients in the PLS model as a new subset, removing points with smaller weights, and then establishing a PLS model based on the new subset. After multiple calculations, the wavelengths in the subset with the minimum RMSECV for the PLS model are selected as feature wavelengths. The specific process of CARS algorithm is as follows:
- By employing the Monte Carlo sampling method, a fixed number of samples are randomly selected each time from the calibration set for the modeling set, while the remaining samples form the prediction set for building the PLS model. The number of Monte Carlo samples (N) must be predetermined.
- Calculate the absolute value weight of the regression coefficient in the PLS model for each iteration. represents the absolute value of the regression coefficient for the ith variable, and denotes the absolute value weight of the regression coefficient for the th variable.
- Use the exponentially decreasing function (EDF) to remove wavelengths with relatively smaller absolute values of regression coefficients. The proportion of retained wavelength points based on the EDF is calculated during the th MC sampling for building a PLS model.Where , .
- During each sampling, the number of wavelength variables selected for PLS modeling using adaptive weighted sampling (ARS) is , and the RMSECV is calculated.
- After repeating times of sampling, the CARS algorithm yields sets of candidate feature wavelength subsets and their corresponding RMSECV values. The subset of wavelength variables corresponding to the minimum RMSECV value is chosen as the feature wavelengthes.
2.3.4. Uniformative Variable Elimination (UVE) Method
UVE algorithm can remove wavelength variables with a small effect on modeling co-efficiency and select characteristic wavelength variables [34]. Its main idea is to introduce artificial random noise information and combine it with PLS to establish a regression cross-validation model. The quotient of the mean and standard deviation of the regression coefficients is calculated as an evaluation index to measure the importance of the characteristic wavelength variables. At the same time, when introducing random noise, the maximum value of the noise matrix is used as the upper and lower limits of the algorithm threshold. The characteristic variables with a result higher or lower than the threshold are selected as the final optimized feature vector information.
There are samples, is the independent variable matrix, is the dependent variable vector, and the PLS model selects the optimal number of principal factors as . The specific algorithm is analyzed as follows:
- is a random noise matrix, and construct a new independent variable matrix:
- Establish a PLS regression model for and , and obtain the regression coefficient matrix .
- The average value and standard deviation of the regression vector can be obtained through the regression coefficient matrix . The calculation formula for is as follows:
- The threshold value of standard deviation is . If , then the variable is the preferred eigenvector, and the selected subset is the feature wavelength set extracted by the UVE algorithm.
2.3.5. Model Building and Evaluation
Partial Least Squares Regression (PLSR), Principal Component Regression(PCR) and Support Vector Machine Regression(SVMR) were used to develop the quantitative spectral analysis model for the moisture content of maize seeds. The performance of the models was evaluated mainly by the coefficient of determination () and root mean square error () [35,36].
The calculation formula for is:
Where, is the actual measured value, is the predicted value, is the average measured value, and represents the average predicted value. is the coefficient of determination with a value range of [0,1]. The closer is to 1, the better the prediction effect of the regression model.
The calculation formula for is:
Where, is the number of samples, is the actual value of the ith sample, is the predicted value of the ith sample.
During the modeling process, the closer the and of the model are to 1 and 0, the better the fitting effect and stability of the model, and the better it captures data patterns with lower error; During prediction, the closer and are to 1 and 0, the stronger the predictive ability of the model, which can accurately predict future data based on existing data; In model validation, he closer and are to 1 and 0, the better the model performs in cross-validation,indicating that the model has good generalization ability and can maintain stable performance on different data sets. If the values of and are large with minimal difference, and the values of and are small with minimal difference, the model’s consistent performance across various metrics indicates its high reliability and credibility.
3. Results and Discussion
3.1. Sample Division
SPXY algorithm was used to divide the samples into a calibration set and a prediction set according to the ratio of 4:1. The moisture content of the samples is shown in Table 1. The range of moisture content for the calibration set samples covers the range of the prediction set, indicating that the sample set division is reasonable.
3.2. Spectral Curve Analysis
In the experiment, we obtained hyperspectral data with a wavelength range of 935.5~2539nm, containing 256 bands. However, the initial and final sections were significantly affected by noise during the data acquisition. To ensure the accuracy of the research, we excluded these sections during analysis. Therefore, we used the middle 218 bands, which have a wavelength range of 1065~2432nm, for in-depth exploration. The average spectral curve of 80 samples is shown in Figure 2. According to existing research, the absorption band of the O-H bond in water molecules in maize seeds is between 920nm and 1950nm [37]. As shown in the figure, the absorption peak at 1450nm is related to the overtone vibration of the O-H bond, while the absorption peak at 1940nm represents the combination frequency characteristic of the O-H bond [38]. These two peaks are characteristic bands of moisture content.
3.3. Spectral Preprocessing
In order to reduce the influence of irrelevant information and noise on spectral data, it is necessary to preprocess the spectral data. The PLSR model takes into account the relationship between independent and dependent variables, allowing for regression modeling under conditions of severe multicollinearity among independent variables. Therefore, the PLSR model was selected to compare the effects of different preprocessing methods. The leave-one-out cross-validation method was employed to calculate the root mean square error of cross-validation () as an evaluation metric for the model. After processing the spectral data by the seven preprocessing methods, the PLSR models were built separately, and the preprocessing results are shown in Table 2. As shown in Table 2, the for the prediction model without preprocessing is 0.0632, and the coefficient of determination () is 0.9772. After preprocessing, the stability of the model and the performance of cross-validation were enhanced. Specifically, the model processed by the Normalize method exhibited the minimum of 0.0410, and the highest of 0.9890. Therefore, this paper will be analyzed based on the data after Normalize preprocessing.
3.4. Feature Wavelength Extraction
Hyperspectral images have huge spectral band resources, which lead to the increase of the correlation between adjacent band images and generate a large amount of redundant information, bringing great difficulties for data analysis and modeling. Therefore, it is very necessary to reduce the dimensionality of hyperspectral images through feature selection and extraction, and express the information of the overall data set with a small number of variables. In this study, SPA, CARS and UVE were used to extract the feature wavelengths from the spectral data after pretreatment of maize seeds.
3.4.1. Feature Wavelengths Extracted by SPA
Using SPA to extract the characteristic wavelengths of the moisture content. Figure 3a illustrates the variation in RMSE as the number of variables increases, when the number of variables is 17, the minimum RMSE is 0.0044. Figure 3b illustrates the locations of the selected characteristic wavelengths. The extracted wavelengths include 1317nm, 1380nm, 1418nm, 1487nm, 1506, 1562, 1714, 1846, 1890, 1909, 1934, 1959, 2048, 2085, 2123, 2230nm and 2407nm, making up 7.8% of the entire spectral range.
3.4.2. Feature Wavelength Extracted by CARS
Using CARS to extract the characteristic wavelengths of the moisture content, set the number of Monte Carlo samples to 50, and use 10-fold cross-validation method. It can be seen from Figure 4a, with the increase in sampling times, the number of variables selected by CARS gradually decreases, and the trend of this change is from a rapid decrease to a more gradual approach to stability. Figure 4b shows the trend of interactive validation error rate during the selection process, with the lowest error rate observed when the sampling time is 11. Figure 4c shows the change in the regression coefficient path as the number of samples increases. When the number of samples is 11, the RMSECV is minimized. Through CARS selection, 24 feature wavelengths were identified, including: 1367nm, 1581nm, 1625nm, 1733nm, 1777nm, 1783nm, 1814nm, 1859nm, 1865nm, 1877nm, 1890nm, 1947nm, 1959nm, 1966nm, 1985nm, 1997nm, 2066nm, 2085nm, 2104nm, 2161nm, 2174nm, 2186nm, 2218nm, and 2413nm, accounting for 11% of the total wavelengths. Figure 5 shows the location of these feature wavelengths in the spectrum.
3.4.2. Feature wavelength extracted by UVE
When the potential variable was set to 12, the PLS model has the minimum value of 0.3036. As shown in Figure 6a, there are 218 wavelength variables on both sides of the vertical dashed line, with the left side being the spectral variable matrix of maize seeds and the right side being the added random noise matrix with the same number of spectral variables. The two horizontal dashed lines represent the upper and lower limits of the variable selection threshold, and the variables outside the dashed lines correspond to the screened characteristic wavelengths. Through UVE selection, 39 feature wavelengths were identified, including: 1619nm, 1625nm, 1632nm, 1638nm, 1802nm, 1808nm, 1814nm, 1877nm, 1884nm, 1890nm, 1896nm, 1903nm, 1909nm, 1915nm, 1922nm, 1928nm, 1934nm, 1953nm, 1959nm, 1966nm, 2003nm, 2010nm, 2016nm, 2085nm, 2092nm, 2098nm, 2104nm, 2111nm, 2117nm, 2123nm, 2129nm, 2136nm, 2142nm, 2148nm, 2155nm, 2161nm, 2167nm, 2363nm, and 2369nm, accounting for 17.9% of the total wavelengths. Figure 6b shows the location of the characteristic wavelengths in the spectrum.
3.5. Establishment of Regression Model
After preprocessing the spectra by Normalize algorithm, PLSR, PCR, and SVMR models were established based on the spectra of 1100~2498 nm. The root mean square error of prediction () value of the prediction set was used as an indicator to evaluate the prediction performance of the models. As shown in Table 3, the PLSR model has the lowest and , indicating that the prediction effect and stability of the PLSR model based on the full band spectrum are better.
In order to improve the modeling speed and model robustness, PLSR, PCR, and SVMR models were established for 17, 24, and 39 characteristic wavelengths selected by SPA, CARS, and UVE algorithms, respectively. As shown in Table 3, the of the three models established by the characteristic wavelengths selected by the SPA algorithm were all reduced compared to the models established by the full band, while the prediction effects of the CARS and UVE algorithms on the models were not obvious and even reduced the prediction effect, but also effectively reduced the spectral dimension. Among the models established based on characteristic wavelengths, the SPA-PLSR model had the lowest value of 0.0339, indicating that the modeling and prediction effect of the characteristic wavelengths selected by the SPA algorithm was better, which may be due to the fact that the SPA algorithm can effectively reduce spectral collinearity. Therefore, the Normalize-SPA-PLSR model was used as a visual prediction model for maize seed moisture content.
3.6. Visualization Analysis of Moisture Content in Maize Seeds
During the harvesting, processing, and storage of corn, it is impossible to directly determine the moisture content using the naked eye. However, using the predictive model, it is possible to calculate the predicted value of the moisture content for each pixel on the hyperspectral image, obtain a grayscale image, and then perform pseudo-color transformation on the grayscale image to obtain a visualization of the moisture content of the maize seeds.
Figure 7 is a visualization of the moisture content of four varieties of maize seeds predicted by the Normalize-SPA-PLSR model. The color gradient bar represents the moisture content from low to high, ranging from 0 to 12%. The average moisture content of XX27 is 11.53%, ZH525 is 10.16%, ST805 is 8.78%, and JY205 is 7.45%. From Figure 7, it can be seen that the moisture content of different varieties of maize seeds varies in color, and the color differences are significant. Although there are differences in the color of different grains in the same image, the differences are small. Visualizing the hyperspectral images of 20 varieties of maize seeds in the prediction set, the results show that different moisture contents of maize seeds correspond to different colors, and the range of moisture content can be determined by the change in the image color.
4. Discussion
In this study, based on hyperspectral imaging technology and combined with machine learning methods, a Normalize-SPA-PLSR model was proposed through comparative analysis to achieve rapid and non-destructive measurement of the moisture content of maize seeds. The model quality was evaluated by and . On the training set, = 0.9936 and = 0.0278, indicating that the model can accurately fit the training data. On the test set, = 0.9930 and = 0.0339, indicating that the model can make good predictions on unknown data. In addition, the is slightly higher than , which may be related to the different distributions of sample features in the test set and the training set. Combined with image processing technology, the moisture content of maize seeds was visualized, and the moisture content range of seeds was visually represented by color. The application and promotion of hyperspectral imaging technology in agriculture provides technical support.
Previous studies lacked in-depth analysis and research on methods for preprocessing spectral data and extracting feature wavelengths. This study addresses this gap and enhances the prediction accuracy of moisture content. Additionally, a method for visualizing moisture content in maize seeds has been introduced. Compared to traditional measurement methods, it offers advantages of being non-destructive, rapid, and accurate, offering technical support for the harvest, storage, and processing of maize seeds. However, this study also faces shortcomings and areas for improvement. Significant variations exist between the endosperm and embryo surfaces of maize seeds. This study focuses solely on the endosperm surface, complicating the measurement process and potentially introducing measurement errors. In future studies, it might be advisable to consider incorporating methods for identifying the placement of maize seeds and detecting the moisture content on the embryo surface, thereby enhancing the model’s accuracy and applicability.
5. Conclusions
This study uses hyperspectral imaging technology to quickly and non-destructively detect the moisture content of maize seeds. The main conclusions are as follows:
- Using seven preprocessing methods to establish a PLSR model for spectral data in the 1100~2498 nm band, it was found that the Normalize method resulted in the highest value, the lowest value, and the best model stability.
- SPA, CARS, and UVE were employed to extract characteristic wavelengths. These methods resulted in the extraction of 17, 24, and 39 wavelengths, respectively, which constitute 7.8%, 11%, and 17.9% of the spectral data, effectively reducing the dimensionality of the spectrum.
- By integrating the feature wavelength extraction method with the modeling approach, we evaluated the efficacy of 12 models. Notably, the Normalize-SPA-PLSR model exhibited notably high and values of 0.9936 and 0.9939, respectively, along with notably low and values of 0.0339 and 0.0377, respectively. This model demonstrated commendable stability and predictive accuracy, allowing for rapid, accurate, and loss-free detection of the moisture content in maize seeds.
- Visualize the 20 hyperspectral images in the prediction set. The color of the visualized images of maize seeds with varying moisture contents varies, and the corresponding color changes are also evident. The moisture content range of the maize seeds can be determined by the color changes in the images.
In summary, hyperspectral imaging technology can achieve rapid and non-destructive detection of the moisture content of maize seeds. The established Normalize-SPA-PLSR model demonstrates good predictive performance, offering a methodological basis for further research on maize seed quality detection and system development.
Author Contributions
Conceptualization, X.X.; Data curation, Y.Y.; Formal analysis, H.X.; Funding acquisition, G.N.; Investigation, Y.Y.; Methodology, H.X.; Project administration, D.H.; Resources, H.X.; Software, H.X.; Supervision, X.X. ; Validation, Y.Y.; Writing-original draft, H.X.; Writing-review & editing, X.X. All authors have read and agreed to the published version of the manuscript.
Funding
This research was funded by Jilin Provincial Key Research and Development Project (Grant No. 20230201099GX).
Institutional Review Board Statement
Not applicable.
Informed Consent Statement
Not applicable.
Data Availability Statement
All relevant data presented in the article are stored according to institutional requirements and, as such, are not available online. However, all data used in this manuscript can be made available upon request to the authors.
Acknowledgments
The authors sincerely thank Jilin Guangde agricultural science and technology Co., Ltd. for providing corn seed samples and supporting the chemometric experiment.
Conflicts of Interest
The authors declare no conflict of interest.
References
- Zhou, K.C.; He, C.A.; Ji, C.X. Storage techniques and selection methods for maize seeds. Scientific and Technological Innovation 2020, 10, 126–127. [Google Scholar]
- Tenaillon, M.I.; Charcosset, A. A European perspective on maize history. C. R. Biol. 2011, 334, 221–228. [Google Scholar] [CrossRef]
- Niaz, I.; Dawar, S.; Sitara, U. Effect of different moisture and storage temperature on seed borne mycoflora of maize. Pak. J. Bot. 2011, 43, 2639–2643. [Google Scholar]
- Wang, J.S. A study on the technical conditions for storage of maize seeds. Seed 1994, 01, 6–9. [Google Scholar]
- Bashkir, I.; Defraeye, T.; Kudra, T.; Martynenko, A. Electrohydrodynamic drying of Plant-based foods and food model systems. Food Eng. Rev. 2020, 12, 473–497. [Google Scholar] [CrossRef]
- Yang, L.; Lv, Q.; Zhang, H. Experimental study on direct harvesting of corn kernels. Agriculture 2022, 12, 919. [Google Scholar] [CrossRef]
- An, D.; Zhang, L.; Liu, Z.; Liu, J.; Wei, Y. Advances in infrared spectroscopy and hyperspectral imaging combined with artificial intelligence for the detection of cereals quality. Crit. Rev. Food Sci. Nutr. 2022, 20, 1–31. [Google Scholar] [CrossRef]
- Yuan, L.; Yan, P.; Han, W. Detection of anthracnose in tea plants based on hyperspectral imaging. Computers and Electronics in Agriculture 2019, 167, 105039. [Google Scholar] [CrossRef]
- Deng, S.G.; Xu, Y.F.; Li, X.L.; He, Y. Moisture content prediction in tealeaf with near infrared hyperspectral imaging. Computers and Electronics in Agriculture 2015, 118, 38–46. [Google Scholar] [CrossRef]
- Wei, Y.Z.; Wu, F.Y.; Xu, J. Visual detection of the moisture content of tea leaves with hyperspectral imaging technology. Journal of Food Engineering 2019, 248, 89–96. [Google Scholar] [CrossRef]
- Mohammed, K.; Gamal, E.M.; Sun, D.W.; Paul, A. Prediction of some quality attributes of lamb meat using Near-infrared Hyperspectral Imaging and Multivariate Analysis. Analytica Chimica Acta 2011, 714, 57–67. [Google Scholar]
- Wang, Y.L.; Peng, Y.K.; Zhuang, Q.B.; Zhao, X.L. Feasibility analysis of NIR for detecting sweet corn seeds vigor. J. Cereal Sci. 2020, 93, 7. [Google Scholar] [CrossRef]
- Fan, Y.M.; Ma, S.C.; Wu, T.T. Individual wheat kernels vigor assessment based on NIR spectroscopy coupled with machine learning methodologies. T echnol. 2020, 105, 7. [Google Scholar] [CrossRef]
- Wang, S.N.; Tan, Y.; Liu, C.Y.; Song, S.Z.; Li, Z. Classification and identification of soybean varieties by density functional theory combined with Raman spectroscopy. Journal of Sensor Technology and Application 2022, 10, 177–186. [Google Scholar]
- Ma, T.; Tsuchikawa, S.; Inagaki, T. Rapid and non-destructive seed viability prediction using near-infrared hyperspectral imaging coupled with a deep learning approach. Comput. Electron. Agric. 2020, 177, 105683. [Google Scholar] [CrossRef]
- Appeltans, S.; Pieters, J.G.; Mouazen, A.M. Potential of laboratory hyperspectral data for in-field detection of Phytophthora infestans on potato. Precis. Agric. 2021, 23, 876–893. [Google Scholar] [CrossRef]
- Ruett, M.; Junker-Frohn, L.V .; Siegmann, B.; Ellenberger, J.; Jaenicke, H.; Whitney , C.; Luedeling, E.; Tiede-Arlt, P .; Rascher, U. Hyperspectral imaging for high-throughput vitality monitoring in ornamental plant productio. Sci. Hortic. 2022, 291, 110546. [CrossRef]
- Nicola, C.; Martin, B.W.; Stephen, G.; Ian, D.F. Rapid prediction of single green coffee bean moisture and lipid content by hyperspectral imaging. Journal of Food Engineering 2018, 227, 18–29. [Google Scholar]
- Xu, Y.; Zhang, H.; Zhang, C.; Wu, P.; Li, J.; Xia, Y.; Fan, S. Rapid prediction and visualization of moisture content in single cucumber (Cucumis sativus L.) seed using hyperspectral imaging technology. Infrared Physics & Technology 2019, 102, 103034. [CrossRef]
- Jennyfer, J.D.; Jose, D.G.; Kevin, F.Y. Rapid and Non-destructive measurement of moisture content of peanut (Arachis hypogaea L.) kernel using a near-infrared hyperspectral imaging technique. Journal of Food Measurement and Characterization 2021, 15, 3069–3078. [Google Scholar]
- Wakholi, C.; Kandpal, L.M.; Lee, H.; Bae, H.; Park, E.; Kim, M.S.; Mo, C.; Lee, W.H.; Cho, B.K. Rapid assessment of corn seed viability using short wave infrared line-scan hyperspectral imaging and chemometrics. Sens. Actuators B-Chem. 2018, 255, 498–507. [Google Scholar] [CrossRef]
- Zhang, L.; Wang, Y.; Wei, Y.; An, D. Near-infrared hyperspectral imaging technology combined with deep convolutional generative adversarial network to predict oil content of single maize kernel. Food Chem. 2022, 370, 131047. [Google Scholar] [CrossRef]
- Wang, Z.; Fan, S.X.; Wu, J.Z.; Zhang, C.; Xu, F.Y.; Yang, X.H.; Li, J.B. Application of long-wave near infrared hyperspectral imaging for determination of moisture content of single maize seed. Spectrochimica Acta 2021, 254, 19666–119666. [Google Scholar] [CrossRef]
- Baranowski, P.; Mazurek, W.; Pastuszka-Woźniak, J. Supervised Classification of Bruised Apples with Respect to the Time After bBruising on the Basis of Hyperspectral Imaging Data. Postharvest Biol. Technol. 2013, 86, 249–258. [Google Scholar] [CrossRef]
- Menesatti, P.; Zanella, A.; Andrea, S. Supervised Multivariate Analysis of Hyper-spectral NIR Images to Evaluate the Starch Index of Apples. Food and Bioprocess Technology 2009, 2, 308–314. [Google Scholar] [CrossRef]
- Yu, Z.H.; Chen, X.C.; Zhang, J.C.; Su, Q.; Wang, K.; Liu, W.H. Rapid and non-destructive estimation of moisture content in caragana korshinskii pellet feed using hyperspectral imaging. Sensors 2023, 23, 7592. [Google Scholar] [CrossRef]
- Rinnan, S.; Berg, F.; Engelsen, S.B. Review of the most common pre-processing techniques for near-infrared spectra. TrAC Trends Anal. Chem. 2009, 28, 1201–1222. [Google Scholar] [CrossRef]
- Gerretzen, J.; Szymańska, E.; Bart, J.; Davies, A.N.; Manen, H.J.; Heuvel, E.R.; Jansen, J.J.; Buydens, M.C. Boosting model performance and interpretation by entangling preprocessing selection and variable selection. Anal. Chim. Acta 2016, 938, 44–52. [Google Scholar] [CrossRef] [PubMed]
- Araújo, M.C.U.; Saldanha, T.C.B.; Galvão, R.K.H.; Yoneyama, T.; Chame, H. C.; Visani, V. The successive projections algorithm for variable selection in spectroscopic multicomponent analysis. Chemometrics and Intelligent Laboratory Systems 2001, 57, 65–73. [Google Scholar] [CrossRef]
- Kawakami Harrop Galvão, R.; Fernanda Pimentel, M.; Cesar Ugulino Araujo, M.; Yoneyama, T.; Visani, V. Aspects of the successive projections algorithm for variable selection in multivariate calibration applied to plasma emission spectrometry. Analytica Chimica Acta 2001, 443(1), 107–115. [Google Scholar] [CrossRef]
- Malley , D.F.; McClure, C.; Martin, P .D.; Buckley , K.; McCaughey , W.P . Compositional analysis of cattle manure during composting using a field-portable near-infrared spectrometer. Commun. Soil. Sci. Plant Anal. 2005, 36, 455–475. [CrossRef]
- Li, H.; Liang, Y.; Xu, Q.; Cao, D. Key wavelengths screening using competitive adaptive reweighted sampling method for multivariate calibration. Analytica Chimica Acta 2009, 648(1), 77–84. [Google Scholar] [CrossRef]
- Miao, X.; Miao, Y.; Gong, H.; Tao, S.; Chen, Z.; Wang, J.; Chen, Y.; Chen, Y. NIR spectroscopy coupled with chemometric algorithms for the prediction of cadmium content in rice samples. Spectrochimica Acta Part A: Molecular and Biomolecular Spectroscopy 2021, 257, 119700. [Google Scholar] [CrossRef]
- Liu, Y.; Wang, Q.; Shi, X.; Gao, X. Hyperspectral nondestructive detection model of chlorogenic acid content during storage of honeysuckle. Transactions of the Chinese Society of Agricultural Engineering 2019, 35(13), 291–299. [Google Scholar]
- Qin, C.; Shi, G.; Tao, J.; Yu, H.; Jin, Y.; Xiao, D.; Zhang, Z.; Liu, C. An adaptive hierarchical decomposition-based method for multi-step cutterhead torque forecast of shield machine. Mechanical Systems and Signal Processing 2022, 175, 109148. [Google Scholar] [CrossRef]
- Wang, Z.; Li, J.; Zhang, C.; Fan, S. Development of a general prediction model of moisture content in maize seeds based on LW-NIR hyperspectral imaging. Agriculture 2023, 13, 359. [Google Scholar] [CrossRef]
- Chu, X.L.; Chen, P.; Li, J.Y. Progresses and perspectives of near infrared spectroscopy analytical technology. Journal of Instrumental Analysis 2020, 39, 1181–1188. [Google Scholar]
- David, B.; Heiko, D.; Sina, B.; Wolfgang, F.; Peter, I. Determining particle size and moisture content by near-infrared spectroscopy in the granulation of naproxen sodium. J. Pharmaceut. Biomed. 2018, 151, 209–218. [Google Scholar]
Figure 1.
Pictures of five kinds of seeds in the experimental samples.
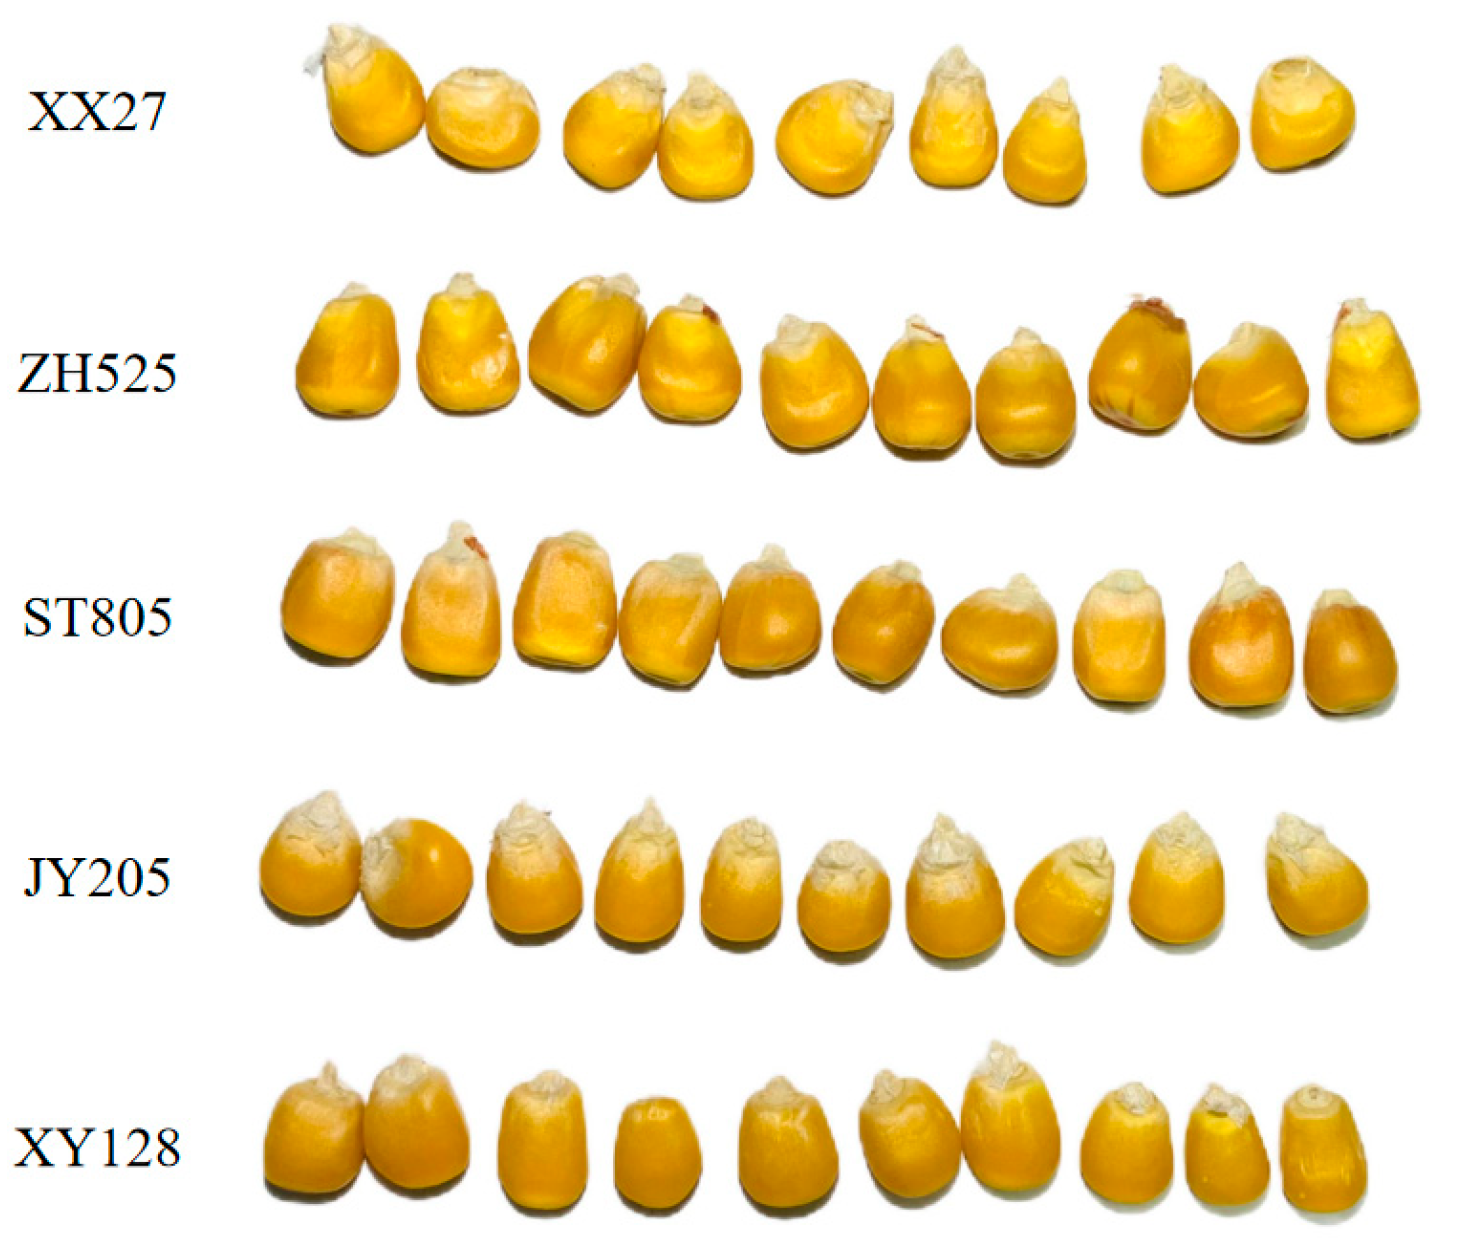
Figure 2.
Reflectance curves of spectrum.
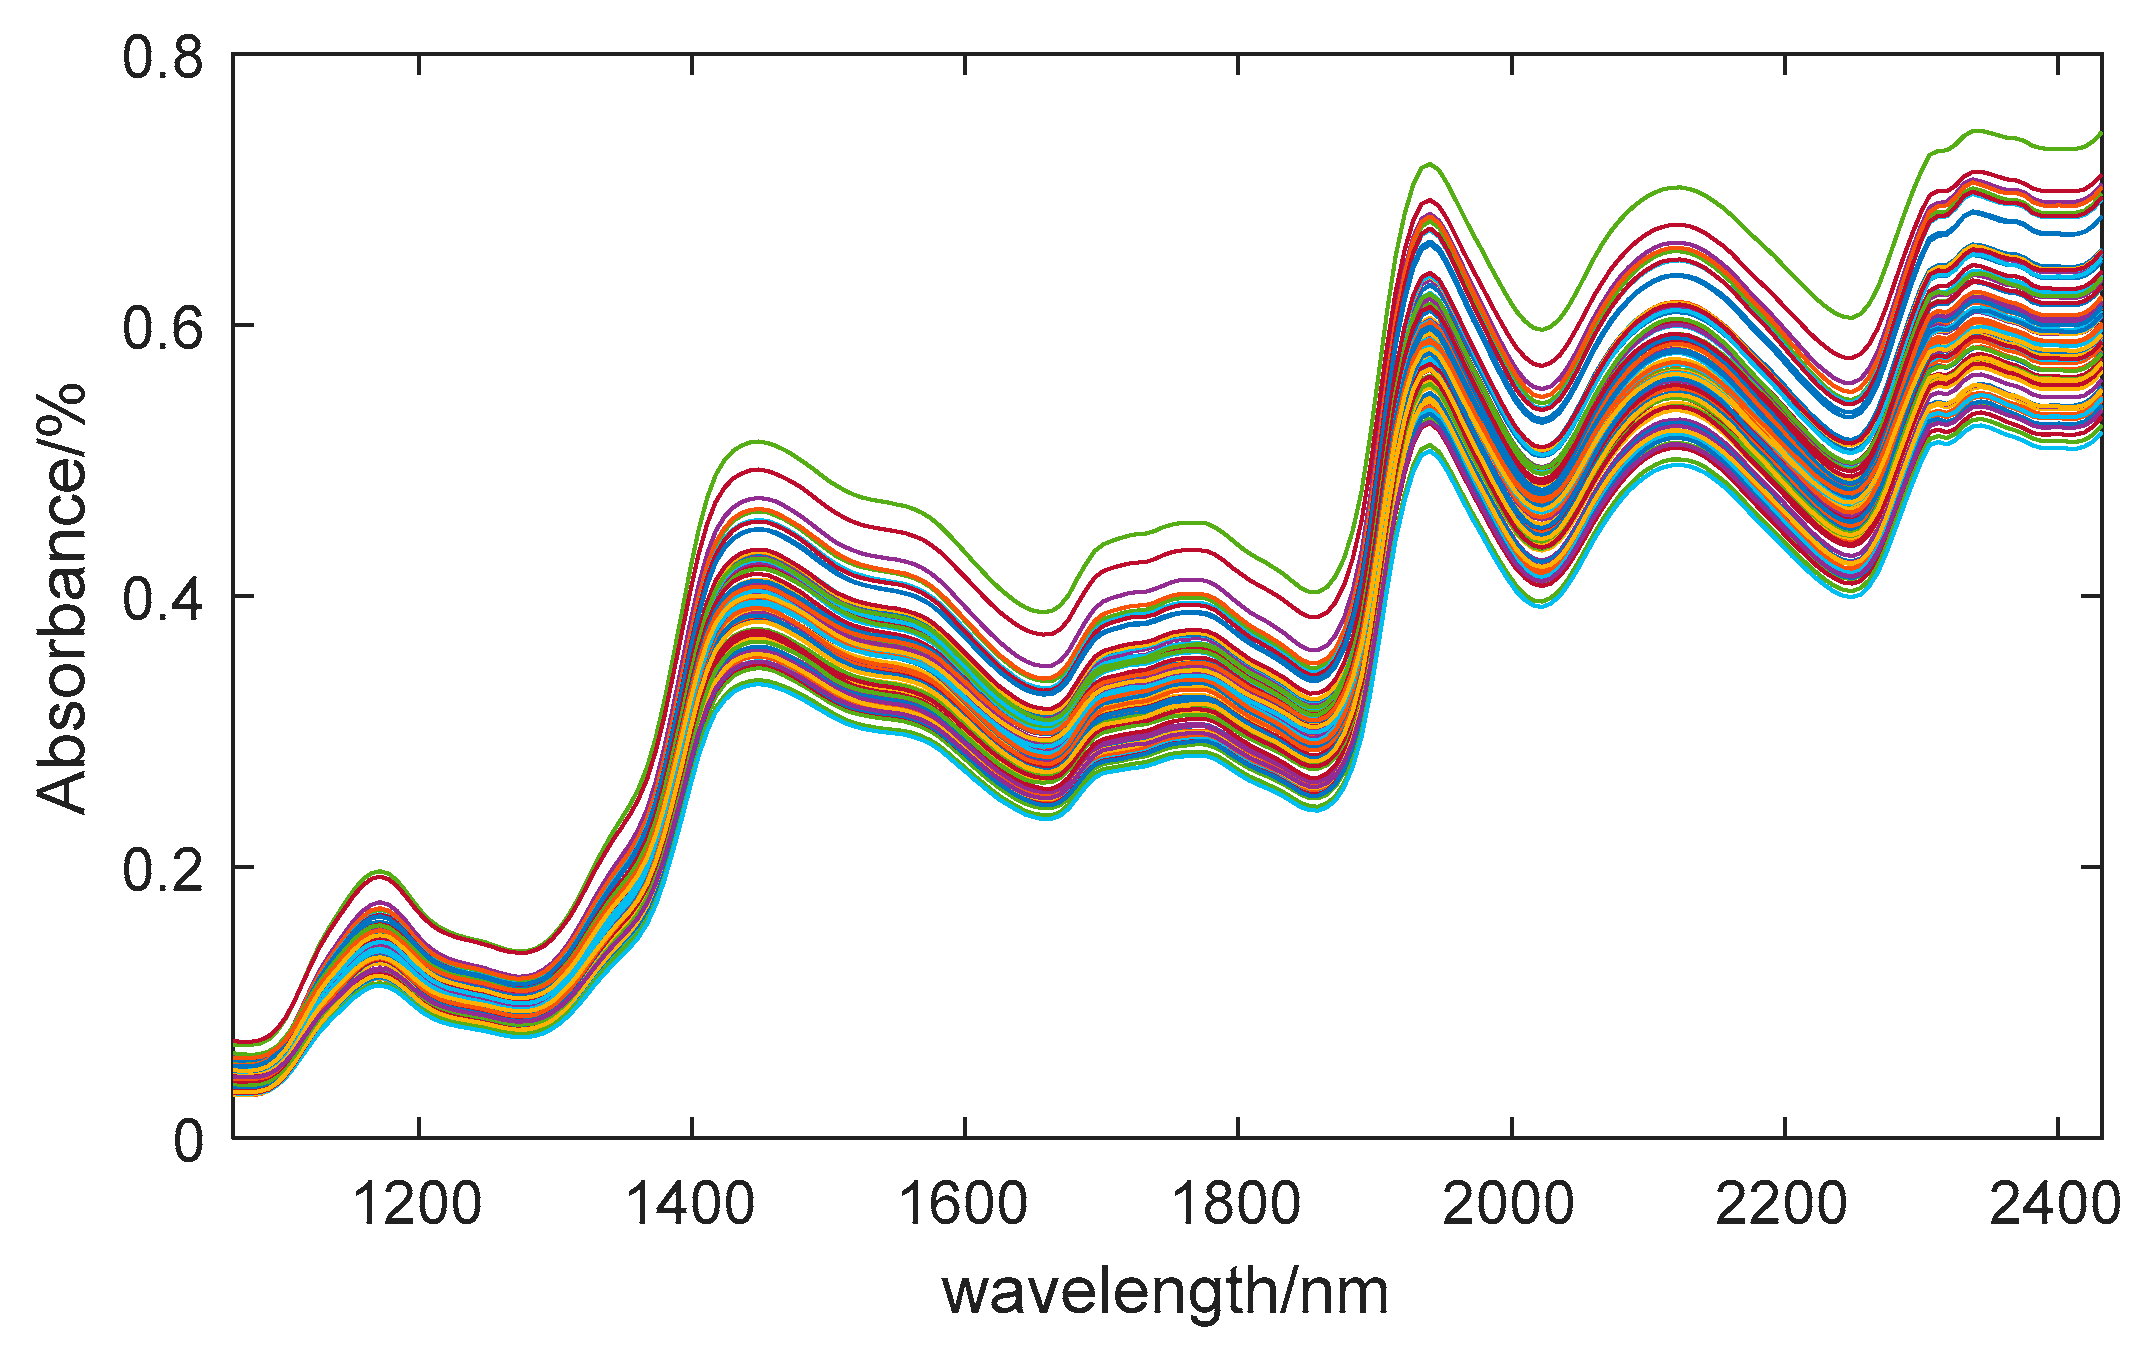
Figure 3.
SPA feature extraction results of moisture content. (a) Correlation between RMSE and the the number of variables; (b) Location of the characteristic wavelengths.
Figure 3.
SPA feature extraction results of moisture content. (a) Correlation between RMSE and the the number of variables; (b) Location of the characteristic wavelengths.
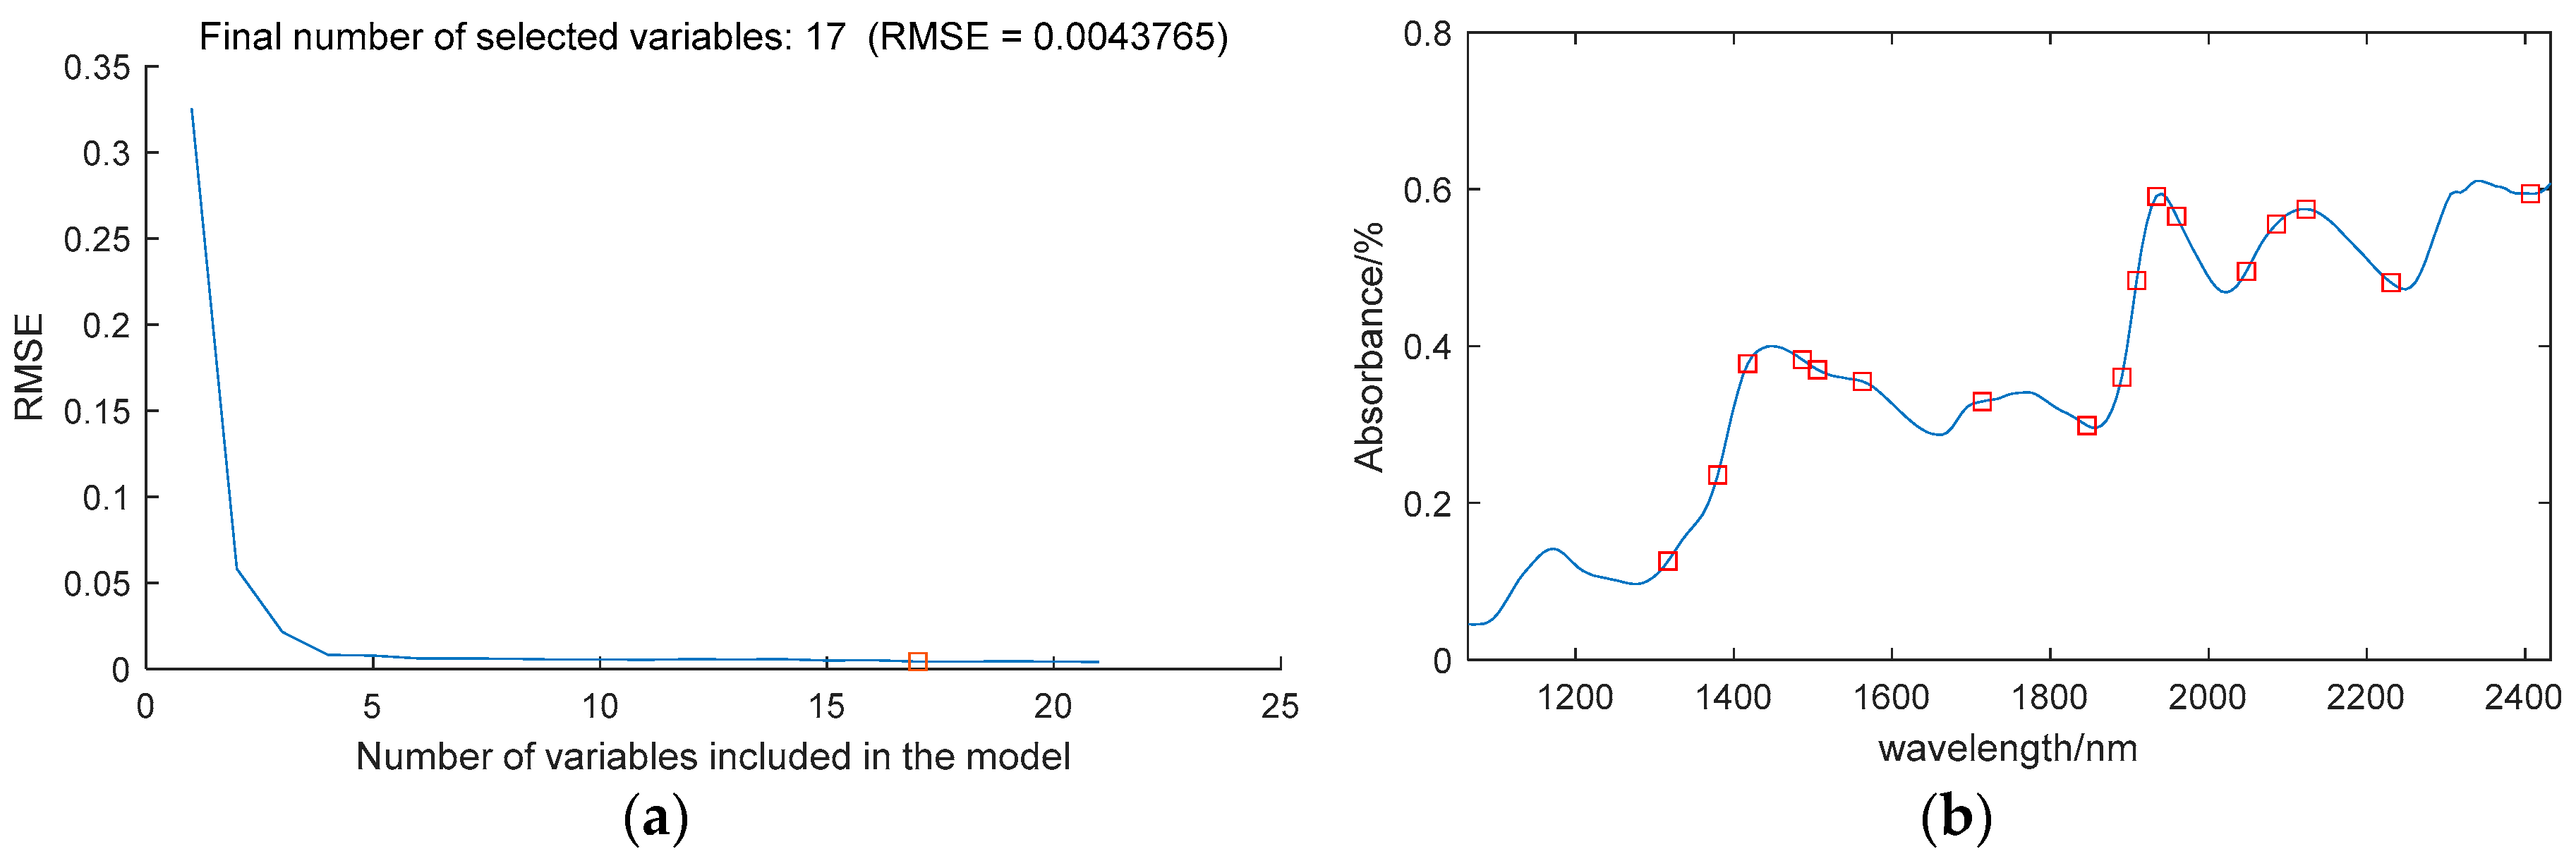
Figure 4.
Selection process of CARS variables. (Different color curves represent different variables) As the number of samples increases. (a) Trends in the number of sampled variables; (b) Trends in values; (c) Trends in regression coefficients for each variable.
Figure 4.
Selection process of CARS variables. (Different color curves represent different variables) As the number of samples increases. (a) Trends in the number of sampled variables; (b) Trends in values; (c) Trends in regression coefficients for each variable.
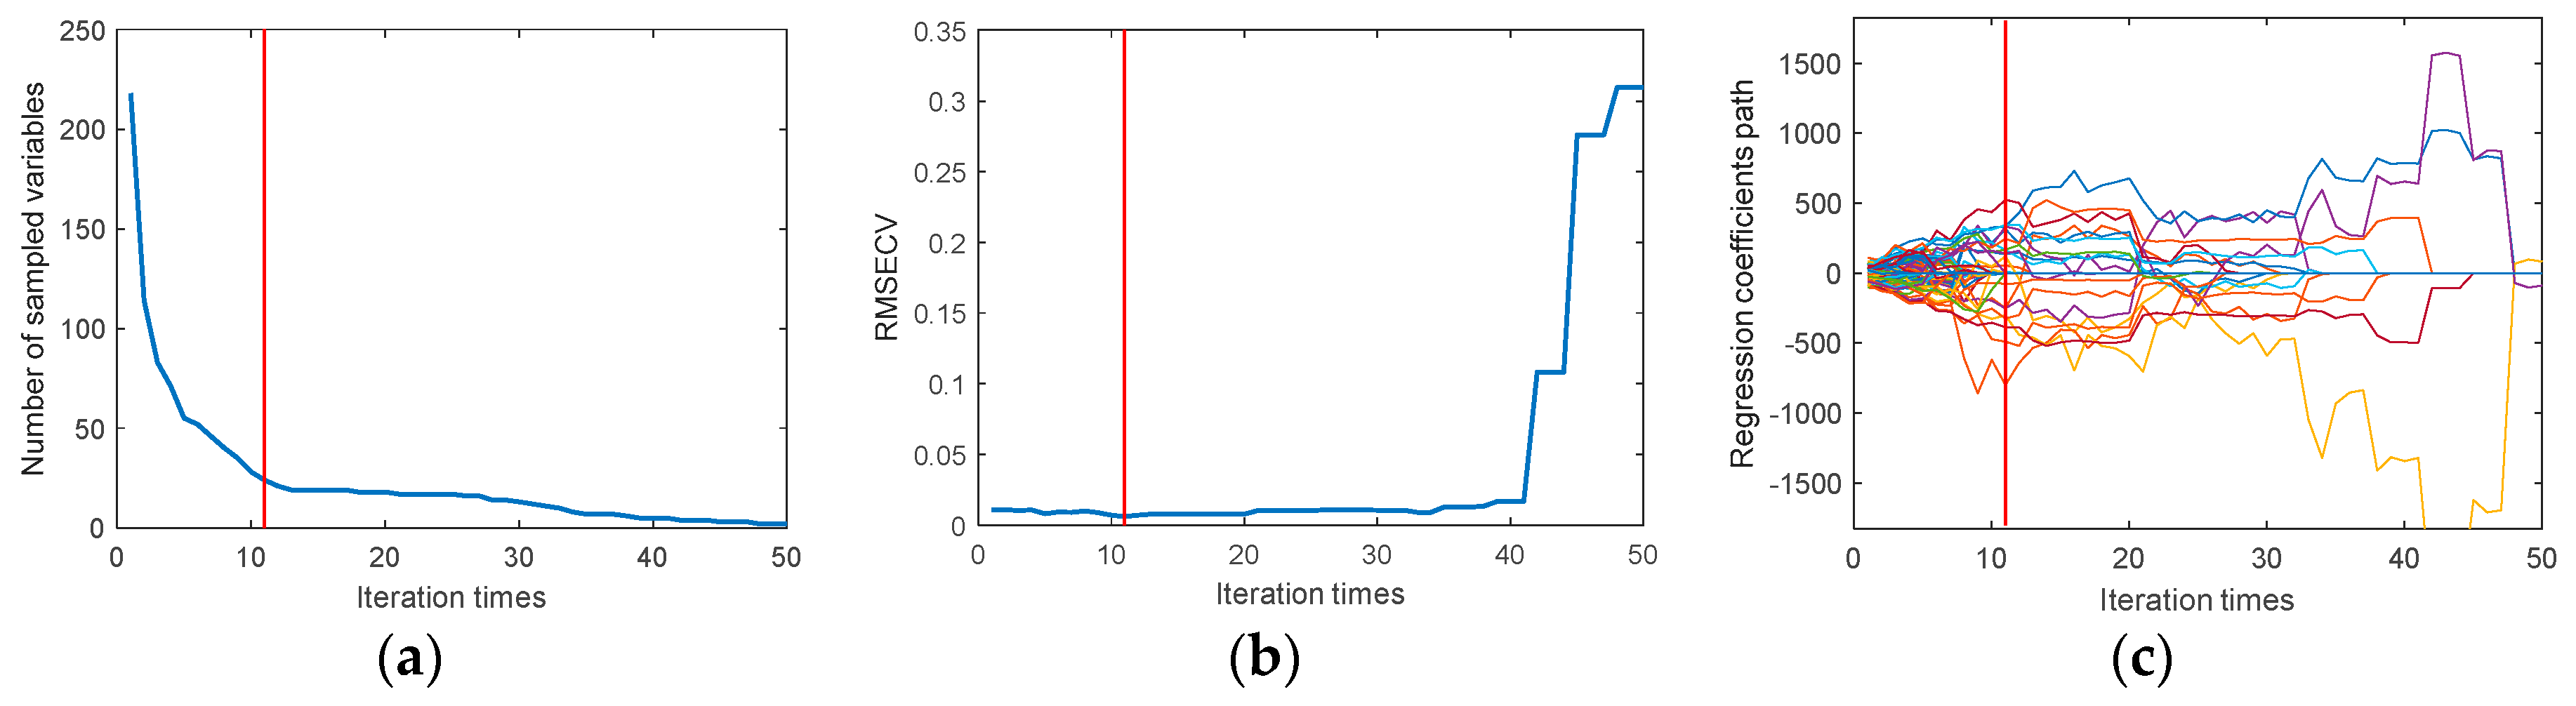
Figure 5.
Feature wavelengths extracted by CARS.
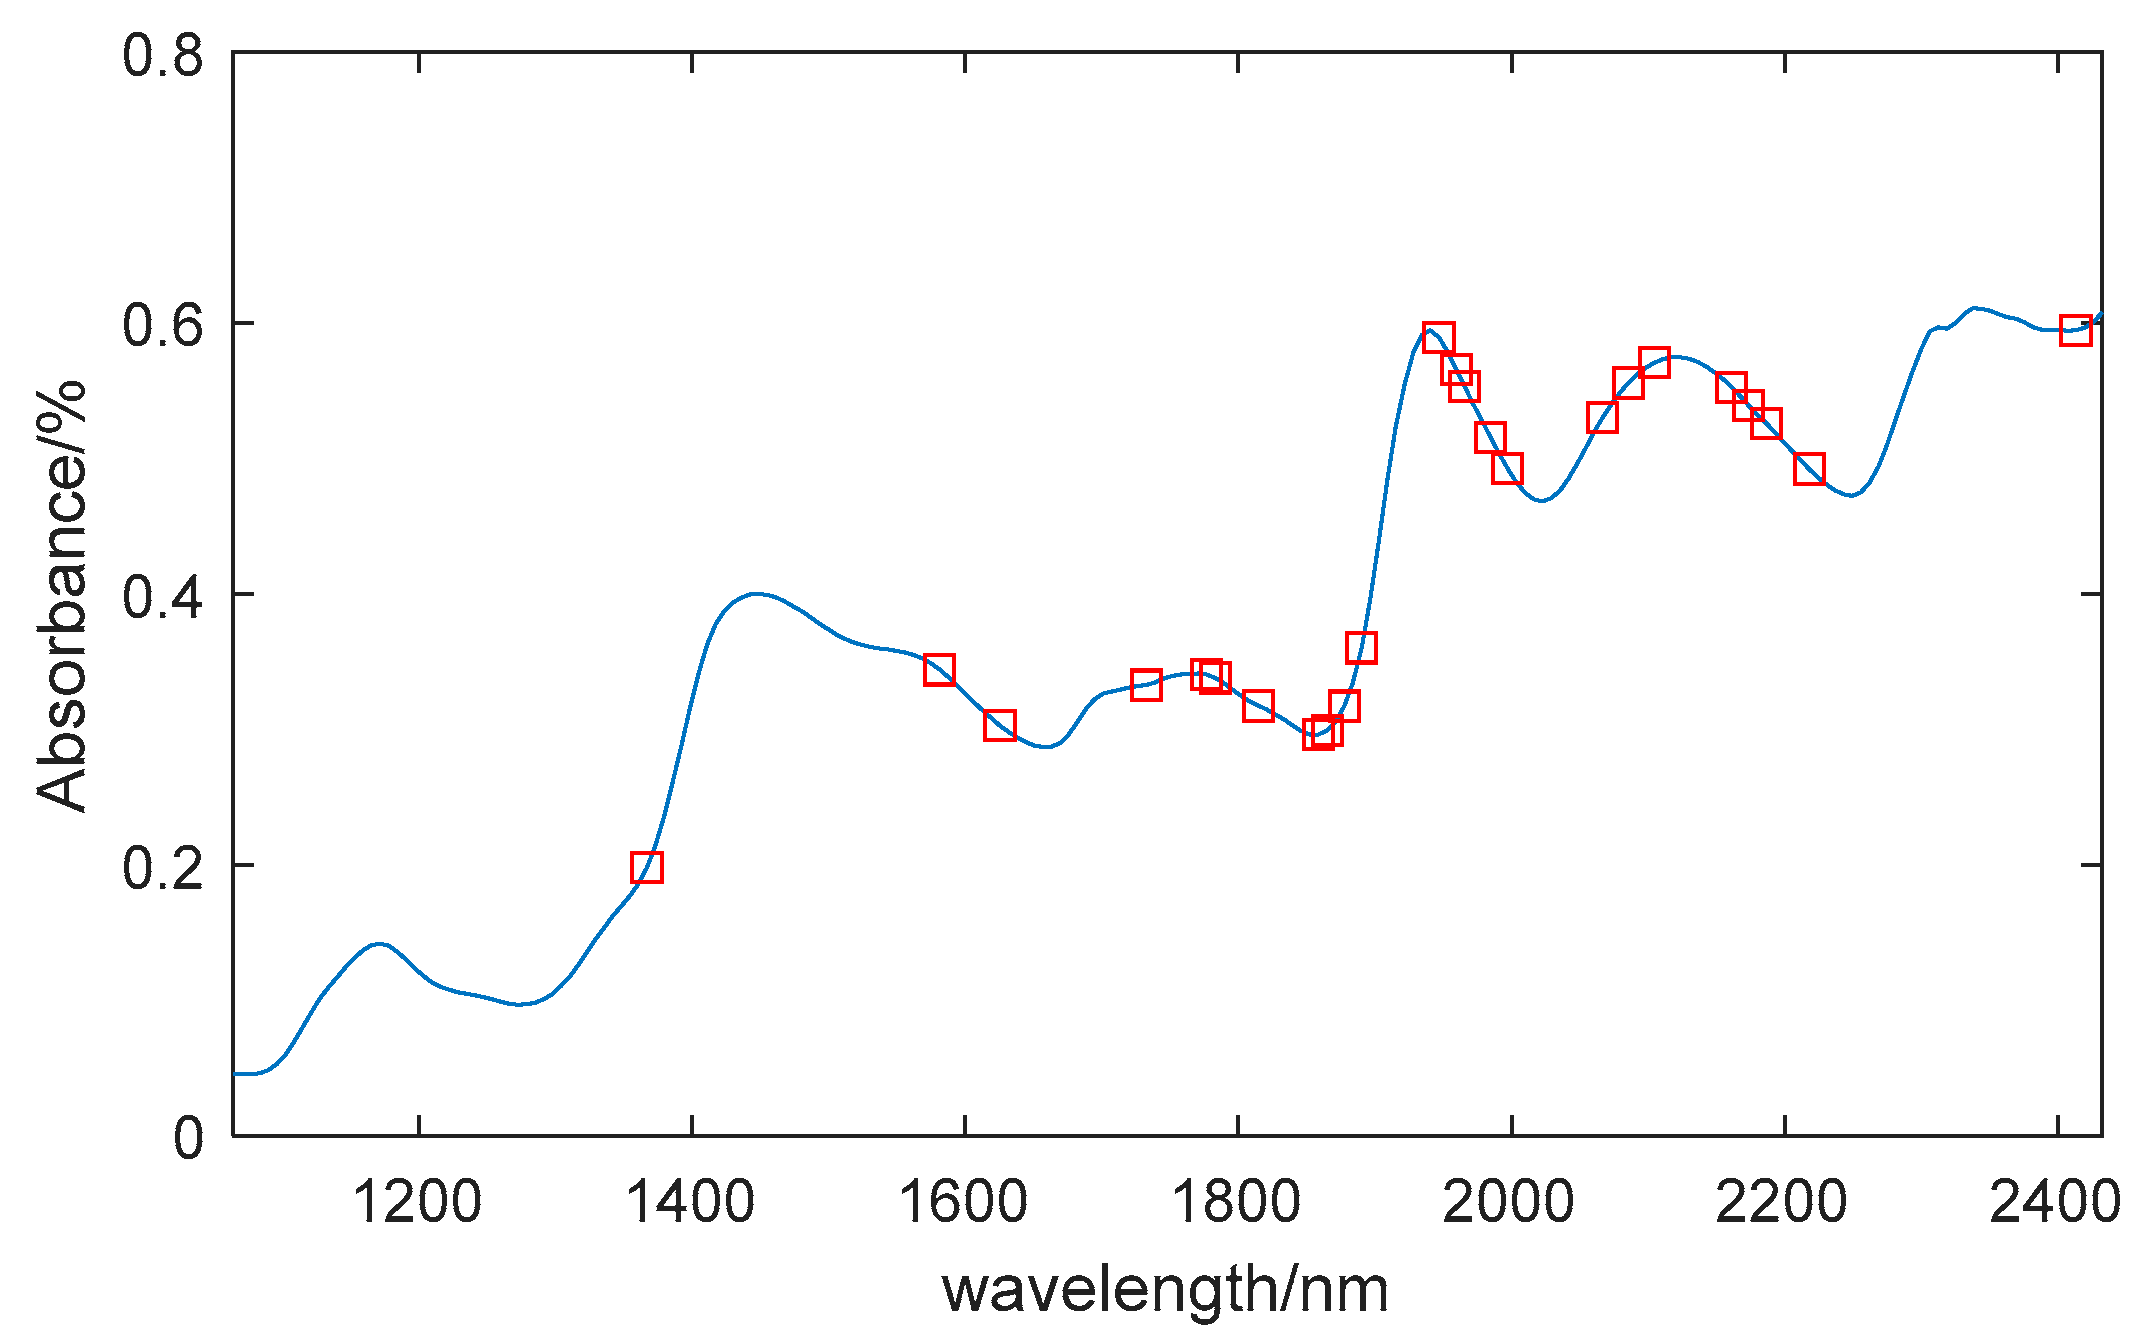
Figure 6.
UVE feature extraction results of moisture content. (a) Stability distribution curve of UVE-PLS model; (b) Location of selected variables.
Figure 6.
UVE feature extraction results of moisture content. (a) Stability distribution curve of UVE-PLS model; (b) Location of selected variables.
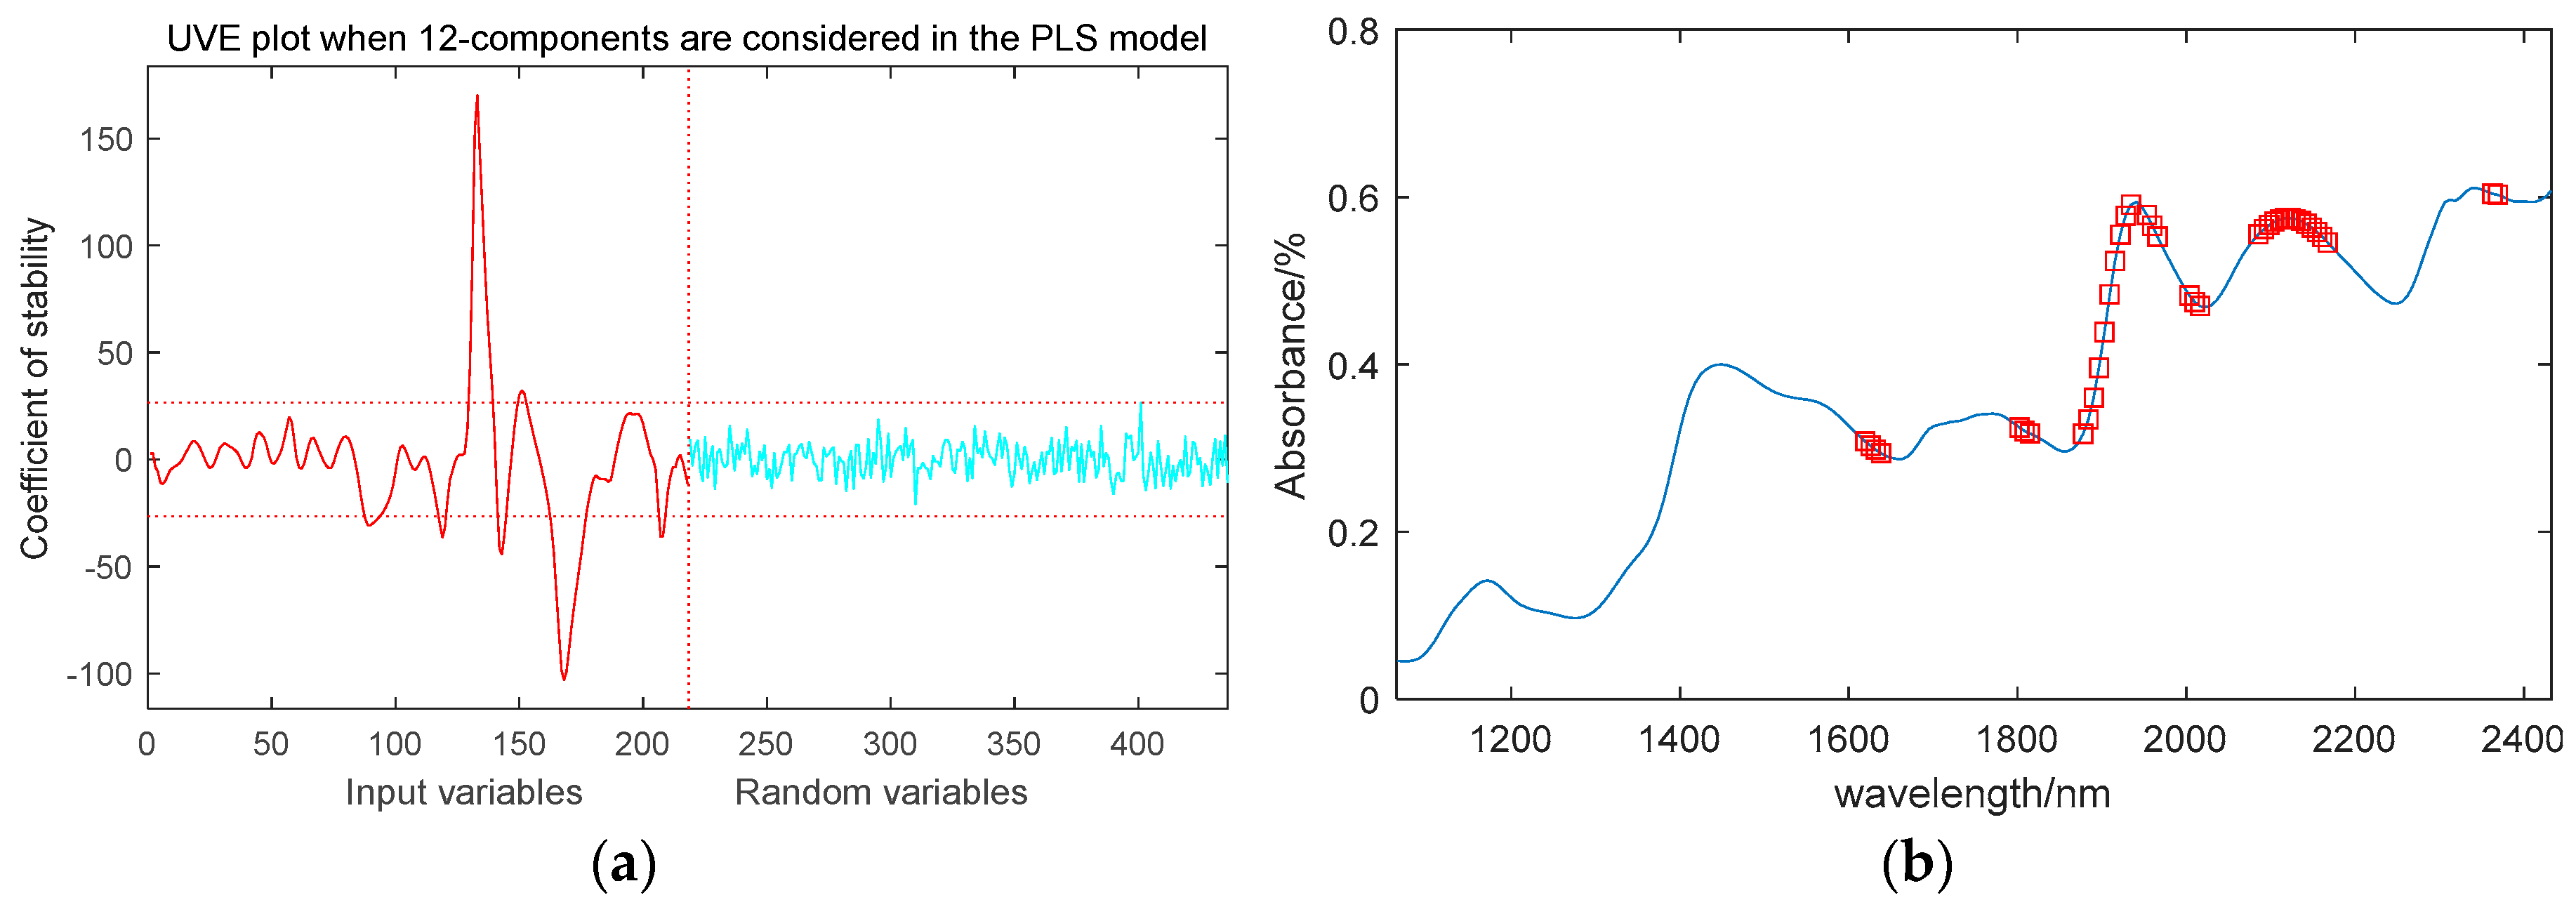
Figure 7.
Selected characteristic wavelengths by UVS.
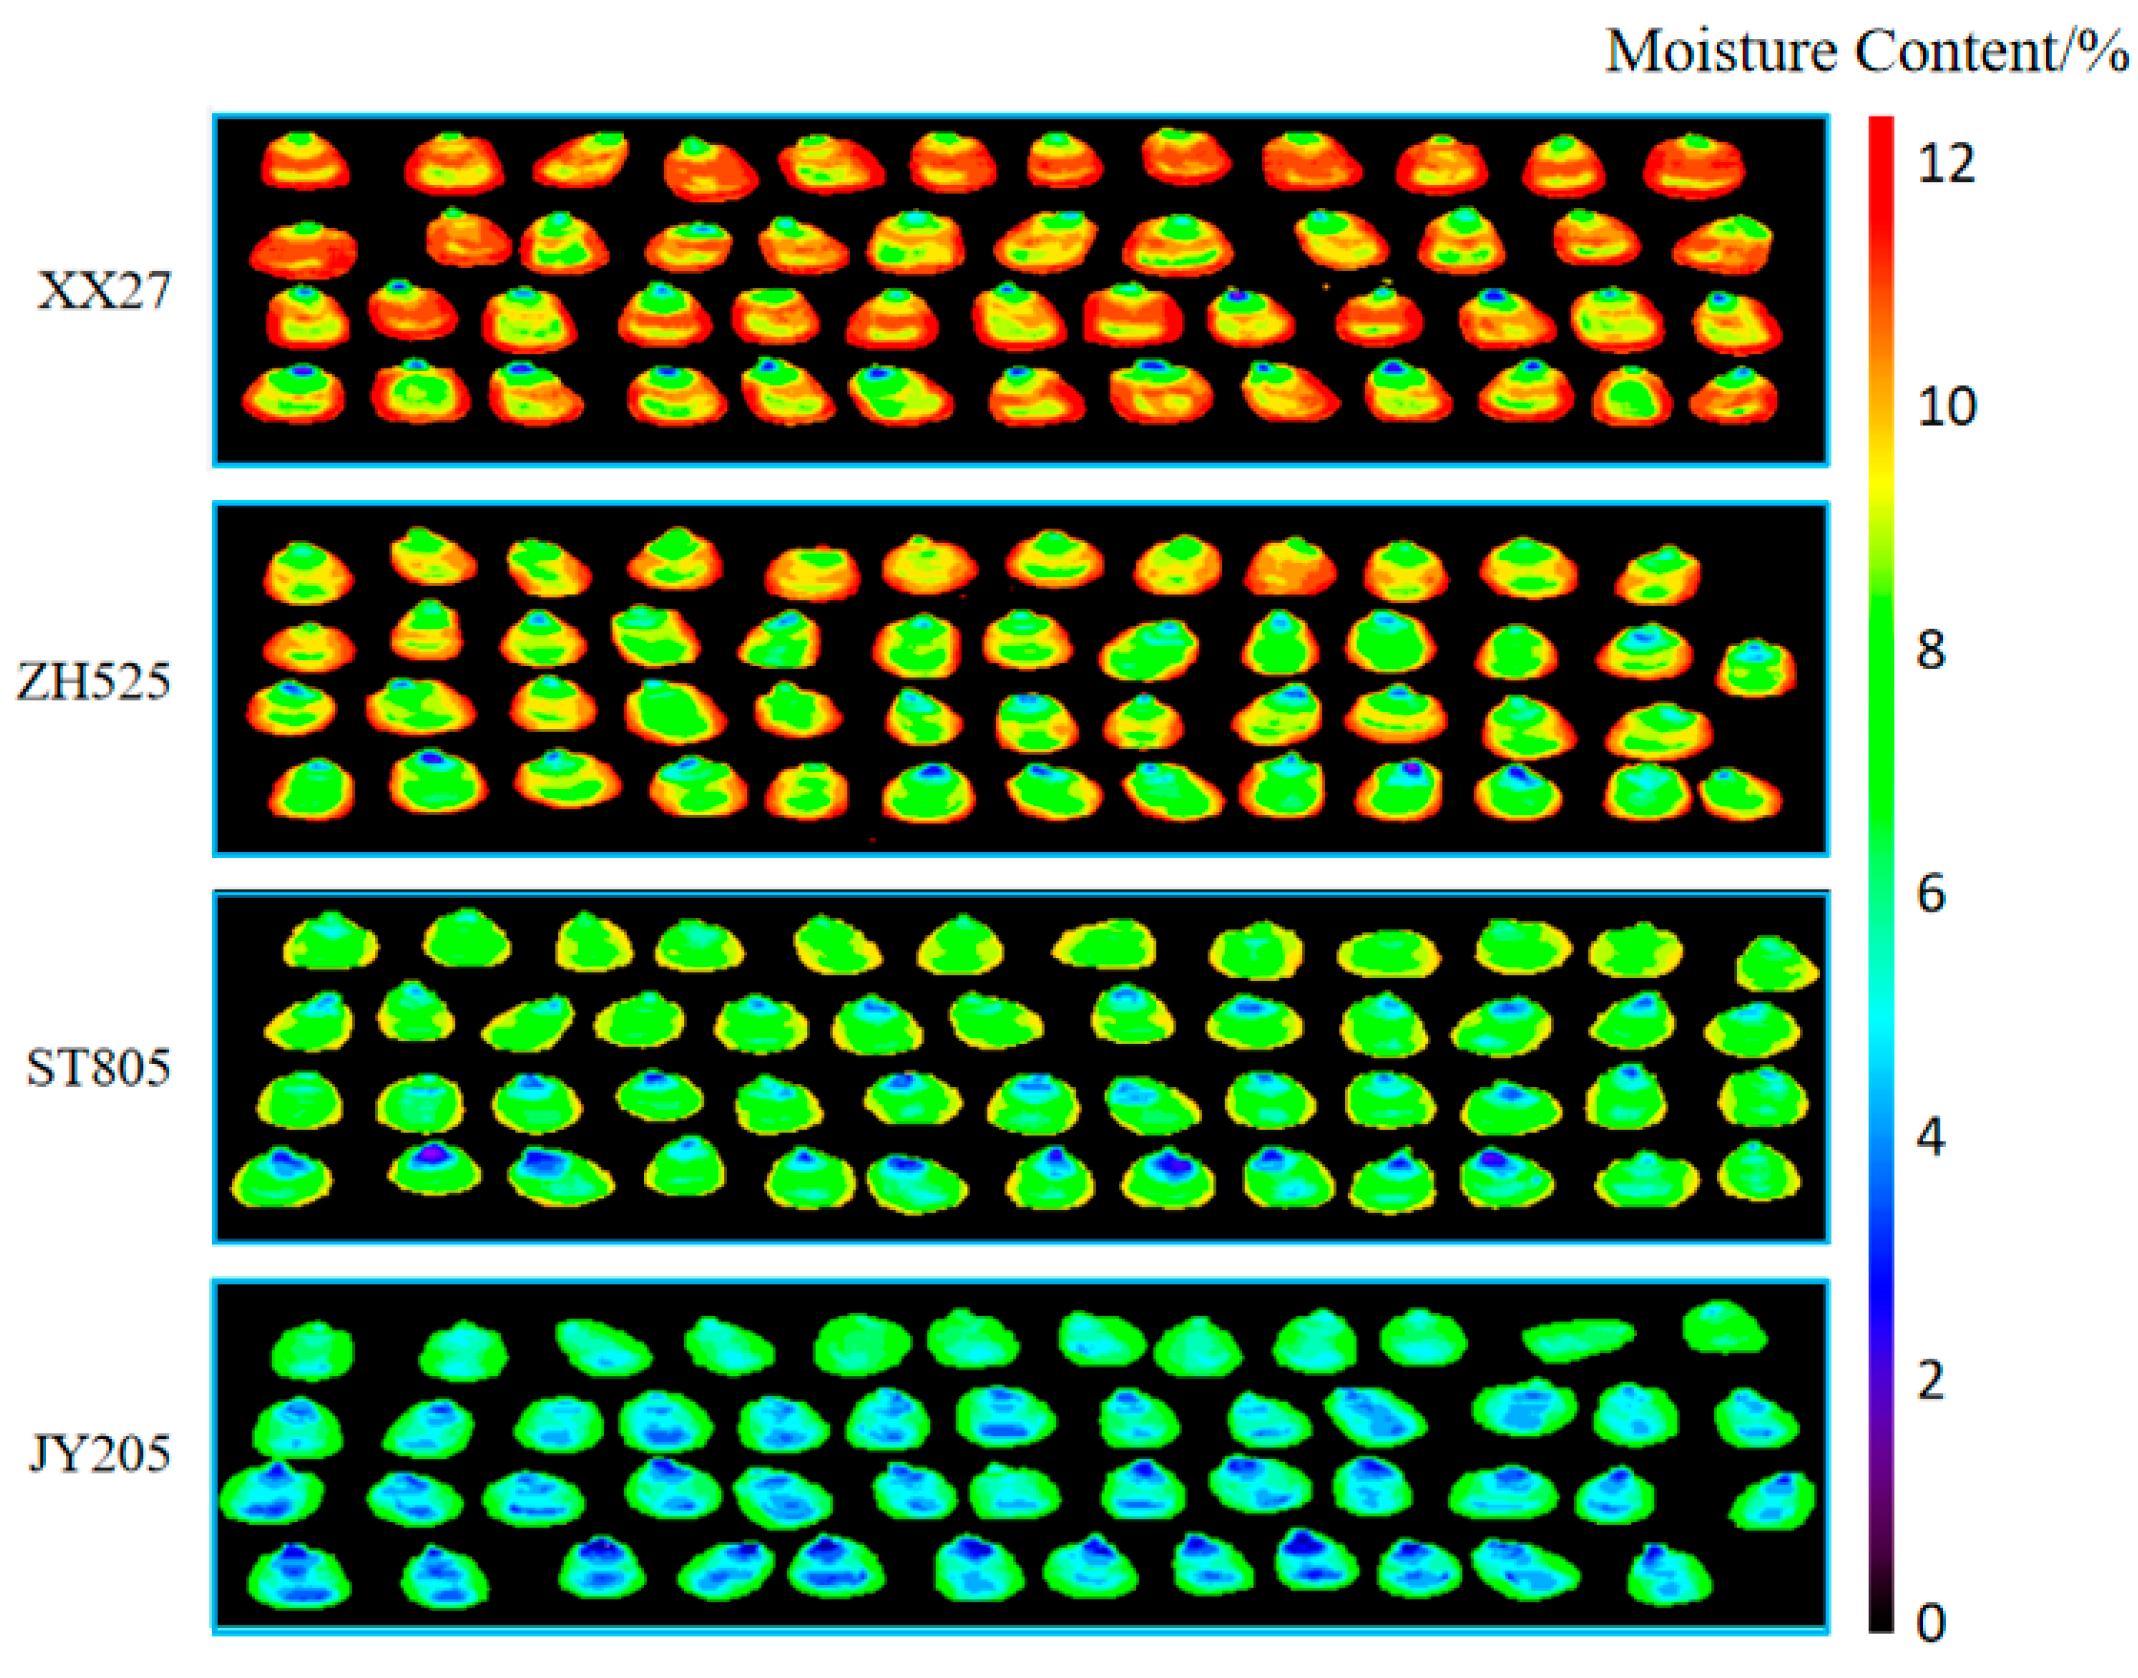

Table 1.
Moisture content of samples.
| Sample set | Number of samples | Moisture content/% | |||
|---|---|---|---|---|---|
| Maximum value | Minimum value |
Average value |
Standard deviation | ||
| Calibration set | 60 | 11.9930 | 7.3770 | 9.118 | 0.3786 |
| Validation set | 20 | 11.9770 | 7.4300 | 9.2719 | 0.3900 |
| Total sample | 80 | 11.9930 | 7.3770 | 9.2335 | 0.3804 |
Table 2.
PLSR model based on different pretreatment methods.
| Pretreatment method | Calibration set | Validation set | ||
|---|---|---|---|---|
| No pretreatment | 0.9772 | 0.0571 | 0.9720 | 0.0632 |
| Moving Average | 0.9789 | 0.0553 | 0.9746 | 0.0589 |
| S-G smoothing | 0.9792 | 0.0549 | 0.9732 | 0.0596 |
| Normalize | 0.9890 | 0.0378 | 0.9886 | 0.0410 |
| Baseline | 0.9835 | 0.0485 | 0.9791 | 0.0548 |
| SNV | 0.9842 | 0.0526 | 0.9811 | 0.0497 |
| MSC | 0.9774 | 0.0568 | 0.9723 | 0.0631 |
| Detrending | 0.9883 | 0.0406 | 0.9730 | 0.0624 |
Table 3.
Performance of models based on different characteristic wavelengths selecting methods.
| Model | Bands | Calibration set | Validation set | Prediction set | |||
|---|---|---|---|---|---|---|---|
| PLSR | 218 | 0.9932 | 0.0289 | 0.9882 | 0.0380 | 0.9933 | 0.0357 |
| PCR | 218 | 0.9344 | 0.0890 | 0.9242 | 0.0981 | 0.9152 | 0.1265 |
| SVMR | 218 | 0.9789 | 0.0532 | 0.9468 | 0.0811 | 0.9655 | 0.0739 |
| SPA-PLSR | 17 | 0.9936 | 0.0278 | 0.9883 | 0.0377 | 0.9939 | 0.0339 |
| SPA-PCR | 17 | 0.9711 | 0.0593 | 0.9597 | 0.0712 | 0.9635 | 0.0840 |
| SPA-SVMR | 17 | 0.9766 | 0.0690 | 0.9676 | 0.0923 | 0.9751 | 0.0690 |
| CARS-PLSR | 24 | 0.9881 | 0.0381 | 0.9853 | 0.0426 | 0.9888 | 0.0460 |
| CARS-PCR | 24 | 0.9418 | 0.0841 | 0.9359 | 0.0896 | 0.9319 | 0.1212 |
| CARS-SVMR | 24 | 0.9545 | 0.0953 | 0.9664 | 0.0649 | 0.9478 | 0.1130 |
| UVE-PLSR | 39 | 0.9765 | 0.0534 | 0.9723 | 0.0592 | 0.9684 | 0.0821 |
| UVE-PCR | 39 | 0.9762 | 0.0538 | 0.9731 | 0.0583 | 0.9701 | 0.0804 |
| UVE-SVMR | 39 | 0.9851 | 0.0470 | 0.9598 | 0.0706 | 0.9728 | 0.0615 |
Disclaimer/Publisher’s Note: The statements, opinions and data contained in all publications are solely those of the individual author(s) and contributor(s) and not of MDPI and/or the editor(s). MDPI and/or the editor(s) disclaim responsibility for any injury to people or property resulting from any ideas, methods, instructions or products referred to in the content. |
© 2024 by the authors. Licensee MDPI, Basel, Switzerland. This article is an open access article distributed under the terms and conditions of the Creative Commons Attribution (CC BY) license (http://creativecommons.org/licenses/by/4.0/).
Copyright: This open access article is published under a Creative Commons CC BY 4.0 license, which permit the free download, distribution, and reuse, provided that the author and preprint are cited in any reuse.


