Preprint
Article

A Pavement Crack Detection and Evaluation Framework of UAV inspection System Based on Deep Learning

Altmetrics

Downloads

108

Views

23

Comments

0

A peer-reviewed article of this preprint also exists.

Submitted:

26 January 2024

Posted:

26 January 2024

You are already at the latest version

Alerts
Abstract
Existing studies often lack a systematic solution for Unmanned Aerial Vehicles (UAV) inspection system, which hinders their widespread application in crack detection. To enhance its practicality, this study proposes a formal and systematic framework for UAV inspection systems, specifically designed for automatic crack detection and pavement distress evaluation. The framework integrates UAV data acquisition, deep learning based crack identification, and road damage assessment in a comprehensive and orderly manner. Firstly, the flight control strategy is presented, and road crack data is collected using the DJI Mini 2 UAV imagery, establishing a high-quality UAV crack image datasets with ground truth information. Secondly, a validation and comparison study is conducted to enhance the automatic crack detection capability and provide an appropriate deployment scheme for UAV inspection systems. This study develops automatic crack detection models based on mainstream deep learning algorithms(namely, Faster-RCNN, YOLOv5s, YOLOv7-tiny, and YOLOv8s) in urban road scenarios. The results demonstrate that the Faster-RCNN algorithm achieves the highest accuracy and is suitable for online data collection of UAV and offline inspection at work stations. Meanwhile, the YOLO models, while slightly lower in accuracy, are the fastest algorithm and are suitable for lightweight deployment of UAV with online collection and real-time inspection. Quantitative measurement methods for road cracks are presented to assess road damage, which will enhance the application of UAV inspection systems and provide factual evidence for maintenance decisions made by road authorities.
Keywords: 
Subject: Engineering  -   Civil Engineering

1. Introduction

Roads are one of the crucial transportation infrastructures that deteriorate over time due to factors such as heavy vehicles, changing weather conditions, human activity, and the use of inferior materials. This deterioration impacts economic development, travel safety, and social activities [1]. Therefore, it is crucial to periodically assess the condition of roads to ensure their longevity and safety. Additionally, it is imperative to accurately and promptly identify road damage, especially cracks, in order to prevent further deterioration and enable timely repairs.
Currently, pavement condition inspection technologies mainly include traditional manual measurements and automatic distress inspections, such as vehicle-mounted inspection [2]. Manual inspection methods rely primarily on visual discrimination, requiring personnel to travel along roads to identify damage points. However, this approach is slow, laborious, subjective, lower accuracy, and time-consuming [3]. Therefore, the development of automatic inspection technologies is crucial for quickly and accurately detecting and identifying cracks on the road. In recent years, intelligent crack inspection systems have gained increasing attention and application. Vehicle-mounted inspection and its intelligent system [4]; Guo et al.[5] utilize core components such as on-mounted high-definition image sensors, laser sensors, and infrared sensors etc. These components enable the acquisition of high-precision road crack data in real-time. However, the overall configuration of the vehicle-mounted system is expensive and limited in scope, making it challenging to widely apply [2].
Notably,automatic pavement distress inspection has traditionally utilized image processing techniques such as Gabor filtering [6], edge detection, intensity thresholding [7], and texture analysis. Cracks are identified by analyzing the changes in edge gradients and intensity differences compared to the background, and then extracting them through threshold segmentation [2]. However, these methods are highly influenced by environmental factors, including lighting conditions, which can affect their accuracy. Moreover, these methods are not effective when the camera configurations vary, making their widespread use impractical [1,8]. Given the limitations of these traditional approaches, it is crucial to develop a cost-effective, accurate, fast, and independent method for the accurate detection of road cracks.
In recent years, there have been significant advancements in machine learning and deep learning algorithms, leading to the emergence of automatic deep learning methods as accurate alternatives to traditional object recognition methods. These methods have shown immense potential in visual applications and image analysis, particularly in road distress inspection [1,8]. Krizhevsky et al.[9] proposed a deep convolutional neural network (CNN) architecture for image classification, especially in the detection of distresses in asphalt pavements. Cao et al.[3] presented an attention-based crack network(ACNet) for automatic pavement crack detection. Extensive experiments on the CRACK500 demonstrated ACNet achieved higher detection accuracy compared to eight other methods. Tran et al.[10] utilized a supervised machine learning network called RetinaNet to detect and classify various types of cracks developed in asphalt pavements, including lane markers. The validation results showed that the trained network model achieved an overall detection and classification accuracy of 84.9%, considering both the crack type and severity level. Xiao et al.[11] proposed an improved model called C-Mask RCNN, which enhances the quality of crack region proposal generation through cascading multi-threshold detectors. Experimental results indicated that the mean average precision of the C-Mask RCNN model's detection component was 95.4%, surpassing the conventional model by 9.7%. Xu K et al.[12] also proposed a crack detection method based on an improved Faster-RCNN for small cracks in asphalt pavements, even under complex backgrounds. The experiments demonstrated that the improved Faster-RCNN model achieved a detection accuracy of 85.64%. Xu X et al.[13] conducted experiments to evaluate the effectiveness of Faster R-CNN and Mask R-CNN and compared their performance in different scenarios. The results showed that Faster R-CNN exhibited superior crack detection accuracy compared to Mask R-CNN, while both models demonstrated efficiency in completing the detection task with a small training datasets. The study focuses on comparing Faster R-CNN and Mask R-CNN, but does not compare the proposed methods with other existing crack detection methods. In general, these above mentioned methods not only detect the category of an object but also determine the object's location in the image [14]. The use of deep learning methods can reduce labor costs and improve work efficiency and intelligence in recognizing road cracks [1].
Meanwhile, Unmanned aerial vehicles (UAV) have demonstrated their versatility in a wide range of applications, including urban road inspections. This is attributed to their exceptional maneuverability, extensive coverage, and cost-effectiveness [2]. Equipped with high-resolution cameras and various sensors, these vehicles can capture images of the road surface from multiple angles and heights, providing a comprehensive assessment of its condition. Several researchers have utilized UAV imagery to study deep learning methods for road crack object detection, and they have achieved impressive accuracy results. Yokoyama et al.[15] proposed an automatic crack detection technique using artificial neural networks. The study focused on classifying cracks and non-cracks, and the algorithm achieved a success rate of 79.9%. Zhu et al.[2]utilized images collected by UAV to conduct experimental comparisons of three deep learning target detection methods (Faster R-CNN, YOLOv3, YOLOv4) via convolutional neural networks(CNN). The study verified that the YOLOv3 algorithm is optimal, with an accuracy of 56.6% mAP . In another study, Jiang et al.[16]proposed a RDD-YOLOv5 algorithm with Self-Attention for UAV road crack detection, which significantly improved the accuracy with an mAP of 91.48% . Furthermore, Zhang et al.[17] proposed an improved YOLO3 algorithm for road damage detection from UAV imagery, incorporating a multi-layer attention mechanism. This enhancement resulted in an improved detection accuracy with an mAP of 68.75%. Samadzadegan et al.[1] utilized the YOLOv4 deep learning network and evaluated the performance using various metrics such as F1-score, precision, recall, mAP, and IoU. The results show that the proposed model has acceptable performance in road crack recognition. Additionally, Zhou et al.[18] introduced a UAV visual inspection method based on deep learning and image segmentation for detecting cracks on crane surfaces. Moreover, Xiang et al.[19] presented a lightweight UAV road crack detection algorithm, called GC-YOLOv5s, which achieved an accuracy validation mAP of 74.3%, outperforming the original YOLOv5 by 8.2%. Wang et al.[20] introduces BL-YOLOv8, an improved road defect detection model that enhances the accuracy of detecting road defects compared to the original YOLOv8 model. BL-YOLOv8 surpasses other mainstream object detection models, such as Faster R-CNN, SDD, YOLOv3-tiny, YOLOv5s, YOLOv6s, and YOLOv7-tiny, by achieving detection accuracy improvements of 17.5%, 18%, 14.6%, 5.5%, 5.2%, 2.4%, and 3.3%, respectively.Furthermore, Omoebamije et al.[21] proposed an improved CNN method based on UAV imagery, demonstrating a remarkable accuracy of 99.04% on a customized test datasets. Lastly, Zhao et al.[22] proposed a highway crack detection and CrackNet classification method using UAV remote sensing images, achieving 85% and 78% accuracy for transverse and longitudinal crack detection, respectively. These aforementioned studies primarily aim to enhance the deep learning algorithm using UAV images. This enhancement improves the accuracy of road crack detection and also establishes the methodological foundation for the crack target recognition algorithm discussed in this paper.
However, most above-mentioned studies primarily focus on UAV detection algorithms and neglect UAV data acquisition and high-quality imagery integrated into detection methods. For instance, the flight settings required for capturing high-quality images have not been thoroughly studied [2]. Flying too high or too fast may result in poor quality images [22]. Zhu et al.[2] and Jiang et al.[16] both introduced flight setup and experimental tricks for efficient UAV inspection. Liu K.C.,et al.[23] proposed a systematic solution to automatic crack detection for UAV inspection. These studies are still uncompleted due to its lacks of the detailed data acquisition and pavement distress assessment. Additionally, there is a lack of quantitative measurement methods for cracks, which hampers accurate data support for road distress evaluation. Furthermore, inconsistency in flight altitude and the absence of ground real-scale information of the cracks adversely impact the subsequent quantitative assessment of the cracks.
Obviously, existing studies frequently lack a systematic solution or integrated framework for UAV inspection technology, which hinders its widespread application in pavement distress detection. Therefore, this study aims to propose a formal and systematic framework for automatic crack detection and pavement distress evaluation in UAV inspection systems, with the goal of making it widely applicable.
Our proposed framework of UAV inspection system for automatic road crack detection offers several advantages: (1).It demonstrates a more systematic solution. The framework integrates data acquisition, crack identification, and road damage assessment in orderly and closely linked steps, making it a comprehensive system.(2).It exhibits greater robustness. By adhering to the flight control strategy and model deployment scheme, the drone ensures high-quality data collection while employing state-of-the-art automatic detection algorithms based on deep learning models that guarantee accurate crack identification. (3).It presents enhanced practicality. The system utilizes the cost-effective DJI Min2 drone for imagery acquisition and DL-based model deployment, making it an economically viable solution with significant potential for widespread implementation.
The rest of this paper is organized as follows: Section 2 presents the framework for UAV inspection system designed specifically for pavement distress analysis. In Section 3, we provide a comprehensive overview of four prominent deep learning-based crack detection algorithms, namely Faster-RCNN, YOLOv5s, YOLOv7-tiny, and YOLOv8s, along with their distinctive characteristics. Section 4 elaborates on the well-defined procedures employed for UAV data acquisition and subsequent data reprocessing. The experimental setup and comparative results are presented in Section 5. In Section 6, we propose quantitative methods to evaluate road cracks and assess pavement distress levels. Finally, in Section 7, we summarize our research while discussing its future work.

2. Framework of UAV Inspection System

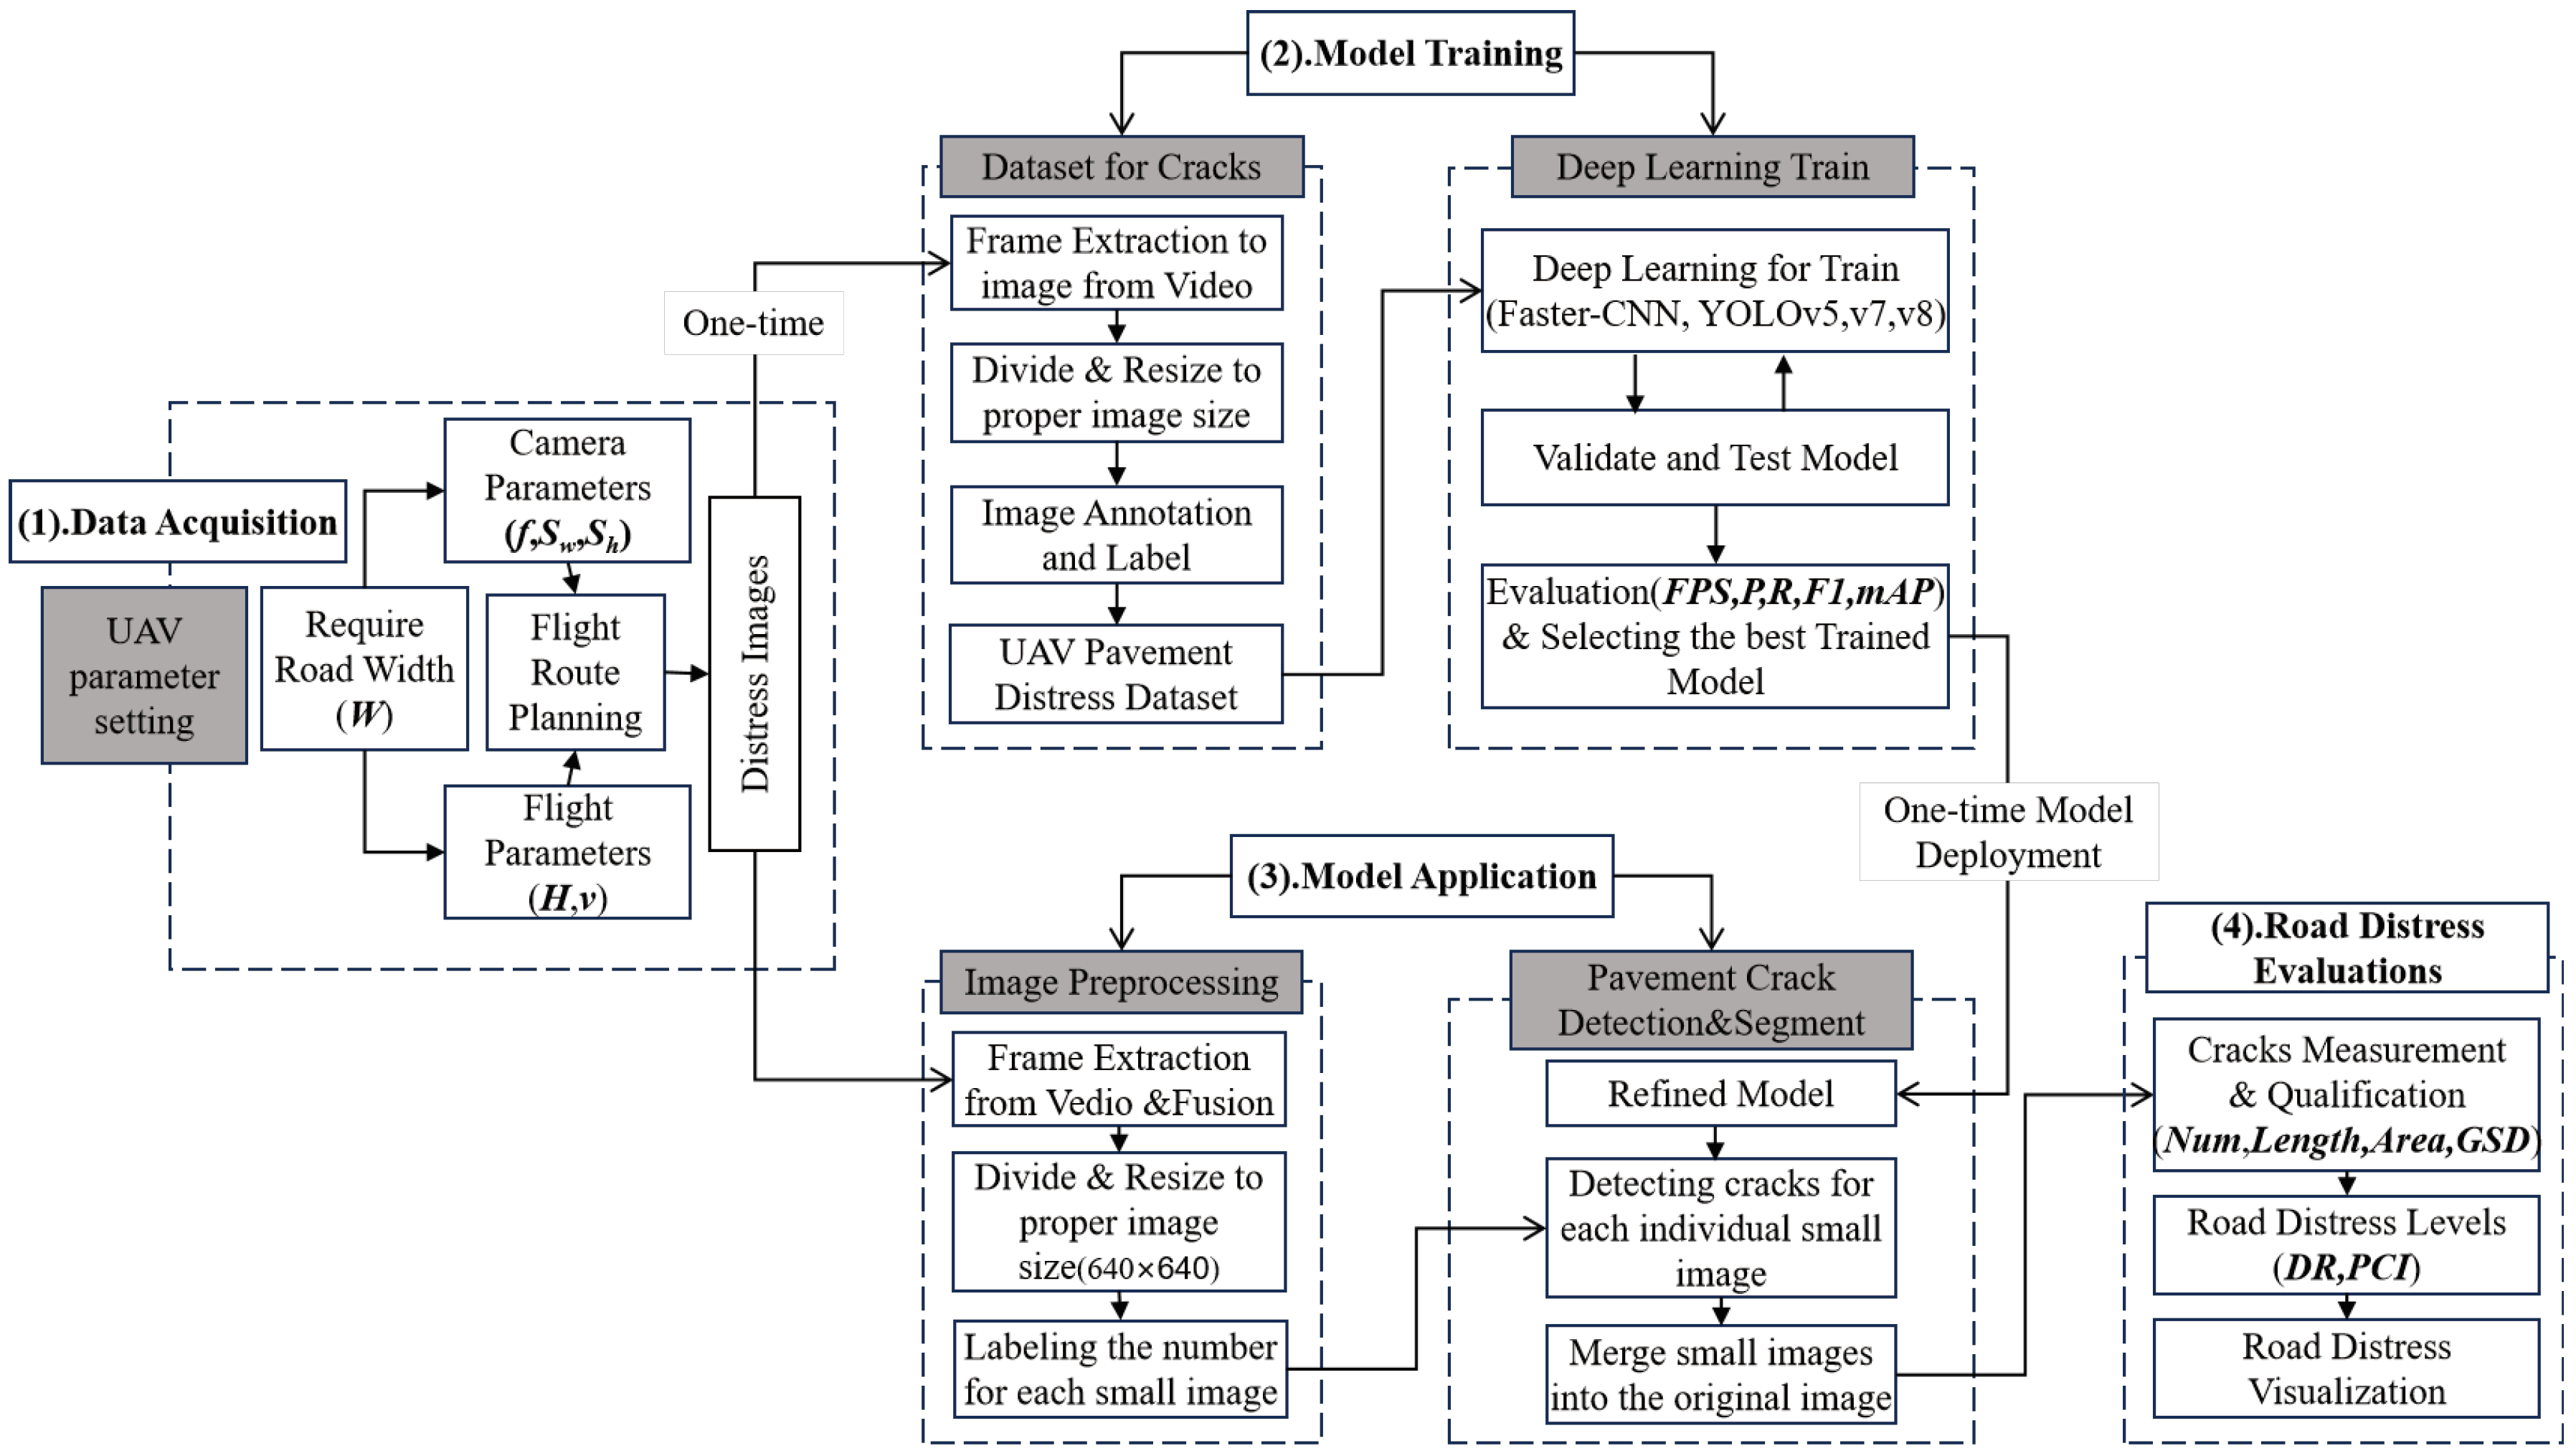
To enhance the practical application of the UAV inspection system in road crack detection, this study presents a comprehensive DL-based method and technical solution framework. As illustrated in Figure 1, the technical framework consists of four main components: (1) Data Acquisition: a flight suitability parameter model is established to ensure high-quality pavement imagery acquisition by the UAV. Prior image data is utilized to create a crack datasets for model training, while the subsequent phase is directly employed for pavement crack detection. (2) Model Training &Evaluation: UAV imagery are pre-processed through frame extraction, image dividing, and data enhancement, and then labeled according to five major categories of cracks (longitudinal, transverse, diagonal, mesh, and no cracks) to create the datasets. Based on this, four mainstream DL target detection algorithms (Faster-RCNN, YOLOv5, YOLOv7, and YOLOv8) are individually conducted for road crack detection model training. Finally, the models are compared and validated using precision (P), recall (R), F1-score, and mean accuracy precision(mAP) as evaluation metrics, and the best model is selected. (3) Model Application&Road Crack Detection: The preferred model is employed to identify road crack targets using UAV imagery. To reduce computing resources, the full-scale images were divided into smaller images before detection. (4)Road Distress Evaluations: Quantitative assessments (For instance, Cracks Count, Cracks Length, Crack Area etc.) are conducted to evaluate pavement distress, which provide factual evidence and a solid data foundation for evaluating road damage and planning road repair work for transportation department.

3. Deep Learning Algorithms

In recent years, there has been significant progress in deep learning technology, leading to a paradigm shift in target detection methods from traditional algorithms based on manual features to deep neural network-based detection methods [24]. These deep learning algorithms can be categorized into two major approaches (Figure 2): (1) Two-Stages methods (Two-Stages algorithms), which involve labeling multiple target candidate regions in the image and subsequently classifying and regressing the boundary of each candidate region. Representative algorithms belonging to this approach include the RCNN series. (2) Single-Stage methods (One-Stage algorithms), which directly perform localization and classification of all detected targets across the entire image without requiring explicit labeling of candidate regions. Representative algorithms belonging to this approach include the YOLO (You Only Look Once) series. Both approaches have their own advantages, with the single-stage algorithm being faster and the two-stage algorithm being more accurate. Therefore, this study selects the Faster RCNN algorithm[25]and the YOLOv5 algorithm[26] as typical representatives of these two major approaches. Additionally, the latest improved algorithms of YOLOv5, namely YOLOv7[27] and YOLOv8[28], are introduced into comparative validation in this study on deep learning algorithms for road crack detection using drones.

3.1. Faster-RCNN Algorithm

The Faster-RCNN algorithm is a typical representative example of a Two-Stage algorithm for target detection. The Faster-RCNN model consists of four components: Backbone, Region Proposal Networks (RPN), ROI(Region of Interest)Pooling, and Classifier. The Backbone extracts a feature map that is used for candidate detection area extraction and classification. The RPN further refines the candidate detection areas based on the initial feature map, which may contain the target features. These refined areas are then used for further classification and localization. The ROI Pooling fine-tunes the candidate detection areas based on their candidate box coordinates. Finally, the Classification component uses the proposals and feature maps to determine the category of the proposal and regress the candidate detection frames to obtain their final precise locations.
The network architecture of Faster-RCNN is illustrated in Figure 3. Firstly, an arbitrary input image (P × Q) is resized to a standard image (M × N) and then fed into the network. The backbone (e.g., VGG, ResNet, etc.) extracts features from the M × N image, followed by convolution and pooling operations, resulting in feature maps for this input. These feature maps contain information about different scales and semantics, enabling the detection of objects with various scales and shapes in the image. In the Region Prediction Network (RPN), the RPN network performs a 3 × 3 convolution to generate Positive Anchors and the corresponding Bounding Box Regression offsets. It then calculates Proposals, which are utilized by the ROI pooling layer to extract the Proposals from the Feature Maps. The Proposal Feature is further processed through fully connected and softmax networks for classification.

3.2. YOLO Series Algorithms

The YOLO series algorithm is a typical representative example of the One-stage algorithm target detection model. In comparison to the Faster RCNN algorithm, YOLO eliminates the need for extracting candidate regions that may contain targets. It completes the detection task using only one network and predicts the category and location of the target object in the detection output through regression. Currently, YOLOv5 is the initial model of the series, which has proven to be stable and widely used in lightweight road crack detection methods due to its excellent accuracy[17,21]. YOLOv5 consists of several networks with different depths, namely n, s, m, l, and x. The depth and width of the network increase in the order of n, s, m, l, and x. Among these options, YOLOv5s is suitable for small deep networks or small-scale datasets.
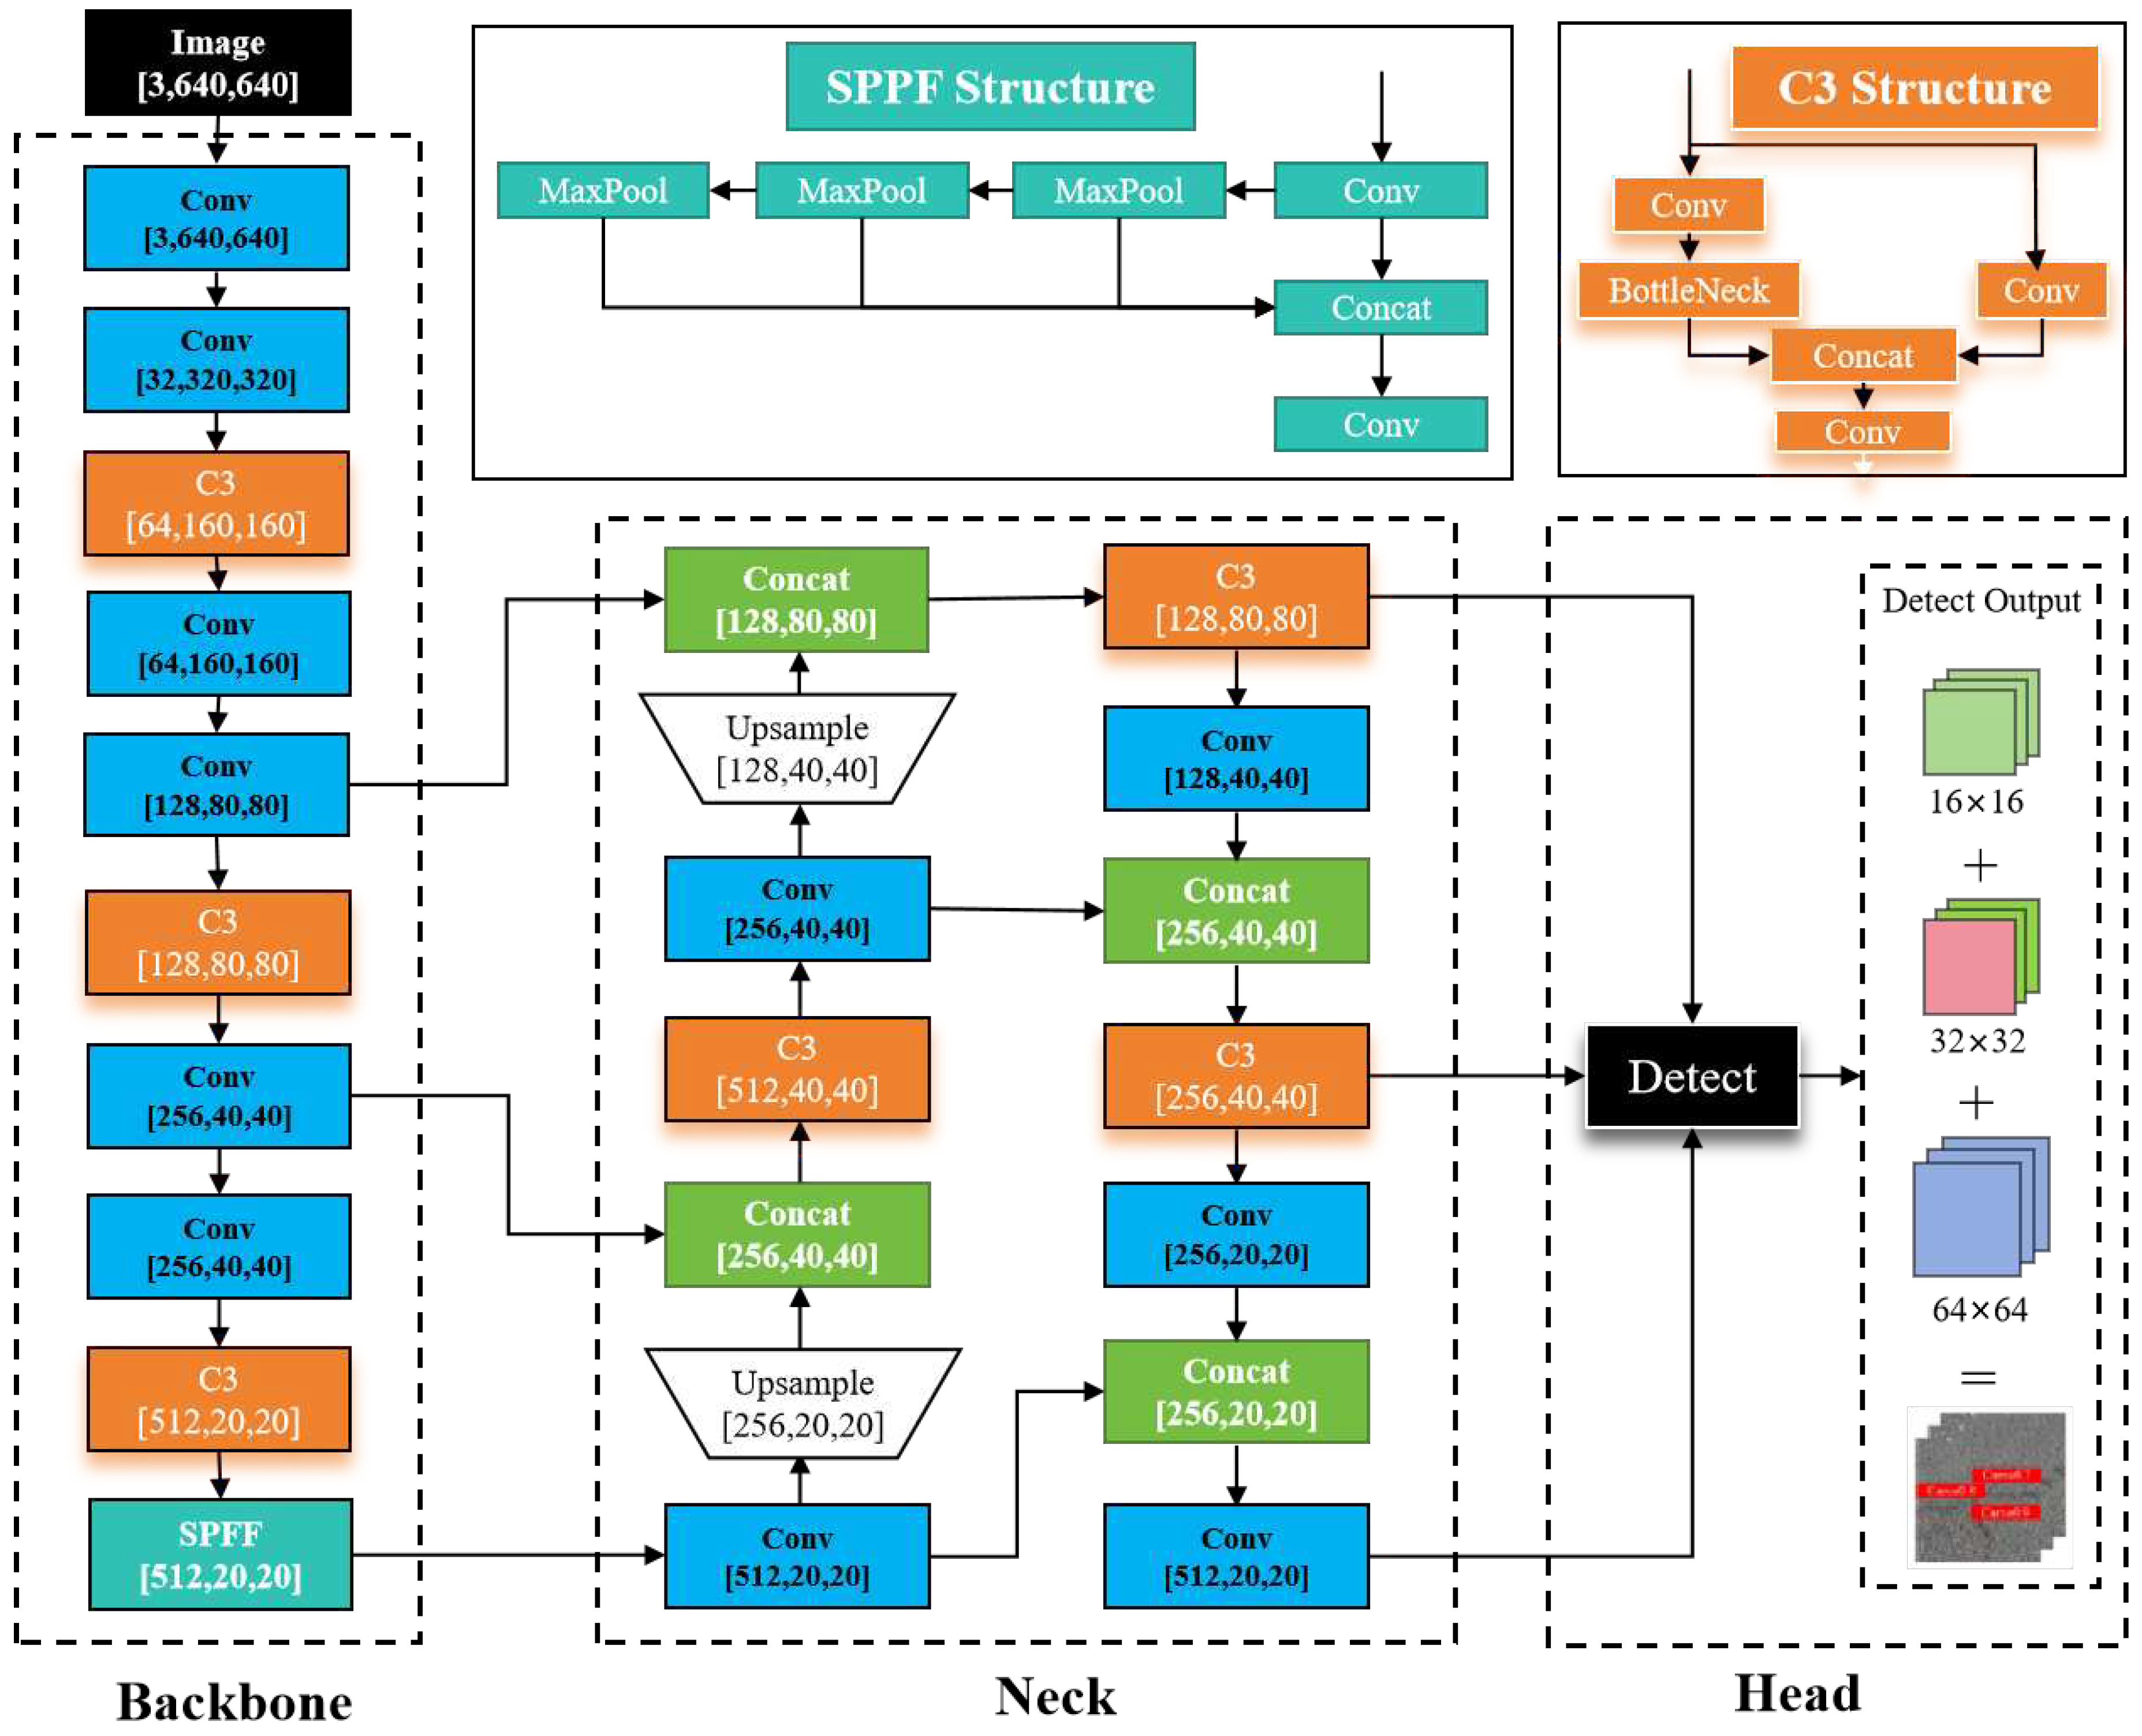
The network architecture of YOLOv5 is depicted in Figure 4. The model is comprised of three main components: the backbone network (BackBone), the neck network (Neck), and the head detection network (Head). The backbone network (Backbone) primarily performs feature extraction by utilizing a convolutional network to extract object information from the image. This information is then used to create a feature pyramid, which is later employed for target detection. The backbone network consists of various modules such as the Focus module, Conv module, C3 module, and SPFF module. Notably, the SPPF (Spatial Pyramid Pooling Faster) module is capable of converting feature maps of any size into fixed-size feature vectors. This allows for the fusion of local and global features at the Feather Map level and further expands the receptive field of the feature map. Consequently, objects can be effectively detected even when input at different scales. The neck network (Neck) is responsible for the multi-scale feature fusion of the feature map. It adopts the structure of the Feature Pyramid Network (FPN) and the Path Aggregation Network (PAN), which enhances the model's ability to capture object features at various scales and improves the accuracy and performance of target detection. The head network (Head), also known as the detection module, utilizes techniques like anchor boxes to process the input feature mapping and generate regression predictions. These predictions include information about the type, location, and confidence of the crack detection object.
YOLOv7 [27] is an enhanced target detection framework based on YOLOv5. It incorporates a deeper network structure and robust methods, resulting in improved accuracy and speed compared to YOLOv5. YOLOv7 introduces several techniques, such as Long-Range Attention Off Network (ELAN) and Bottleneck Attention Module (BAM), to enhance its learning capability. ELAN expands, shuffles, and merges the quantity (Cardinality), thereby improving the equilibrium state of the learning network. To prevent overfitting, YOLOv7 employs a regularization method similar to DropBlock. This regularization method enhances the stability and robustness of the model, enabling it to be trained on larger datasets.
YOLOv8 [28] was released in January 2023 by Ultralytics, the company that developed YOLOv5. YOLOv8 further optimizes the model structure and training strategy based on YOLOv7 to enhance both detection speed and accuracy. Notably, YOLOv8 incorporates a more efficient long-range attention network called Extended-ELAN (E-ELAN), which enhances the model's feature extraction capability. Moreover, YOLOv8 introduces new loss functions, such as VFL Loss and Loss+DFL (Distribution Focal Loss), to improve the model's localization accuracy and category differentiation ability. Additionally, YOLOv8 employs new data enhancement methods, including Mosaic + MixUp, to enhance the generalization and robustness of the model.
In the current field of deep learning models, Faster-RCNN, YOLOv5, YOLOv7, and YOLOv8 are all target detection methods known for their high accuracy and advanced algorithms. However, there are some variations in terms of model structure, accuracy, speed, training strategy, and robustness. The selection of the appropriate algorithm should be based on specific requirements and application scenarios to effectively address the needs of UAV road crack target detection.

4. UAV Data Acquisition and Preprocessing

4.1. Flight Control Strategy

During the flight process of a UAV equipped with a high-definition camera, the acquired imagery may suffer from distortion, degradation, or uncovered road due to improper human control or mismatched flight parameters. Therefore, it is crucial to establish a flight control strategy and experimental techniques for UAV flight parameters to enhance the quality of imagery captured by UAV in real-world scenarios.

4.1.1. Flight Height

To determine the optimal altitude of the UAV and ensure efficient flight, the following considerations should be taken into account: (i) The UAV camera view should cover the full width of the road that needs to be inspected;(ii) It is important to avoid any interference from auxiliary facilities such as road trees and street lights during the flight; (iii)To minimize image distortion, it is crucial to maintain a constant altitude, consistent speed, and capture vertical imagery.
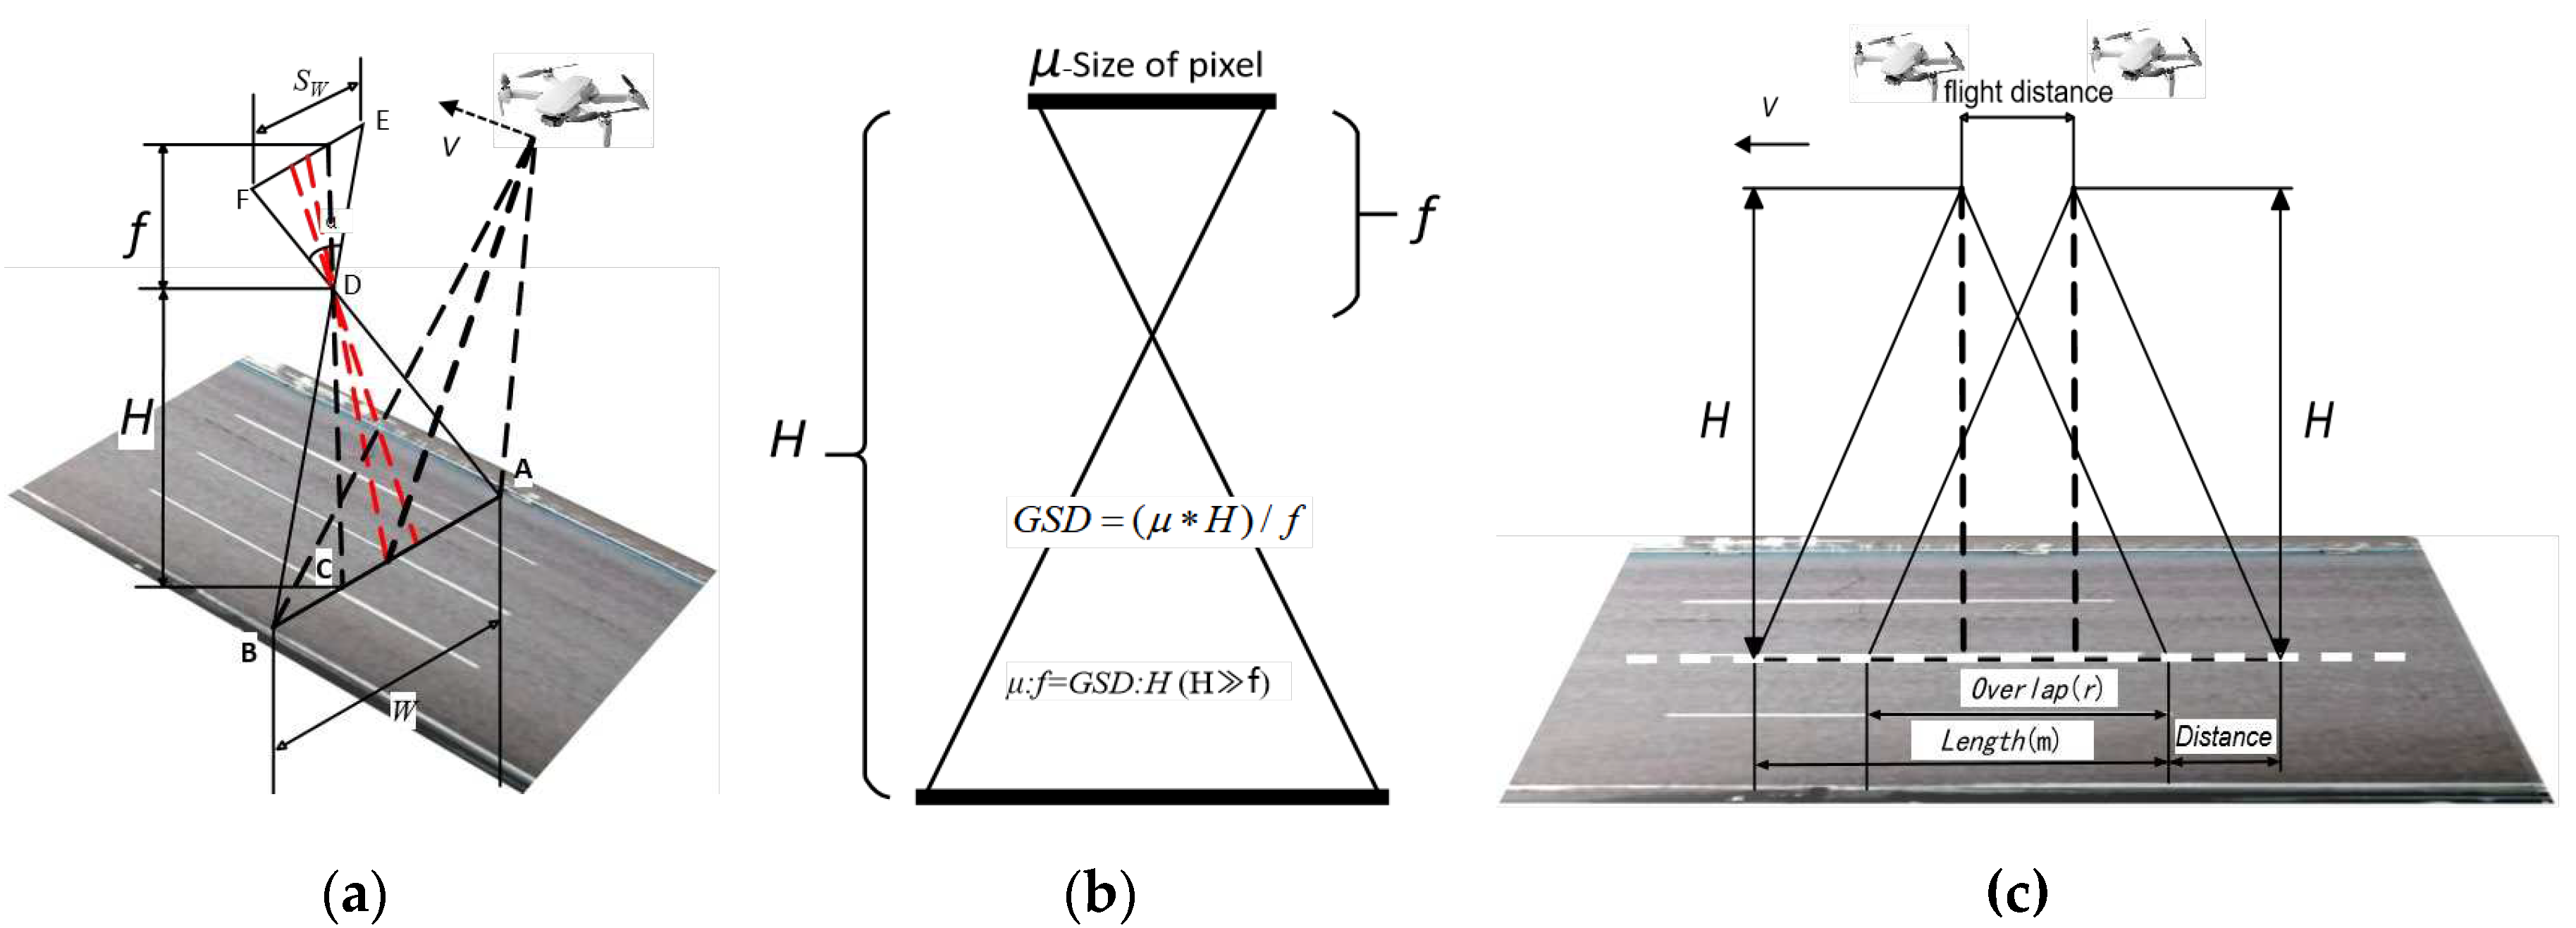
To cover the full width of the pavement, a minimum flight altitude is required. Based on Pinhole Imaging Principle and the Triangular Similarity Geometric Relationship (Figure 5a), the minimum flight altitude should satisfy Equation (1):
H ( f W ) / S w
where H represents flight vertical height. f represents the focal length of the camera. W represents the width of the road to be inspected. Sw represents the camera sensor size (Sw× Sh).
In our experiment, the DJI Mini 2 drone was chosen to perform flight mission. The camera sensor format is CMOS 1/2.3 inches, with a full-frame sensor size of 17.3mm × 13.0 mm. The main focal length(f) is 24.0 mm. The experimental pavement consists of a bi-directional eight-lane road. To ensure high-definition imagery quality, the experiment was conducted only on the left lane, from east to west. Given the width of the road(W) was measured to be 16 m. The minimum flight altitude was calculated at 22.20 m.Taking into account the tolerance for flight stability, the final flight height was chosen as 22.5 m.

4.1.2. Ground Sampling

The Ground Sampling Distance (GSD) is a crucial parameter in remote sensing and image processing. It quantifies the distance between individual pixels in an image and the ground truth, which directly affects the accuracy of geospatial measurements for cracks. (i) DJI can officially provide GSD values that are applicable to a wide range of focal lengths[16].The most commonly observed GSD value, typically associated with a 24 mm focal length, is calculated as H/55. (ii) Alternatively, GSD can be derived directly from the diagram in Figure 5b, using Equation (2):
G S D ( μ H ) / f
where GSD represents ground sampling distance of flight,sand its unit is cm/pixel; μ is the image pixel calibration size (μm), which can be officially provided by DJI. Take DJI Mini 2 as an example, μ is given as 4.4μm. If the flight height is 22.5m, thereby, GSD can be computed as 0.4125cm/pixel.

4.1.3. Flight Velocity

The appropriate flight velocity is also essential in UAV imagery acquisition to avoid redundancy and motion blurring. It should be determined based on the degree of overlap between neighboring images and the consistency and quality stability of the aerial images. Typically, a minimum forward overlap of 75% and a minimum side overlap of 60% are recommended. Figure 5c illustrates how the flight velocity can be calculated based on the desired overlap degree and the sampling frequency of the neighboring frames, using Formula (3):
v = L ( 1 r ) / t
where v is the flight velocity (m/s), t represents the shooting interval of two adjacent images (s), typically set to 2. The overlap degree(r) is defined as the forward overlap and is commonly taken as 50%~75% since UAV are often operated at the same speed and uniform linear motion with the forward direction. L represents the ground truth length of the road in a image (m). L can be determined based on GSD and the road width (W) covered by UAV imagery, using the following formula.
L = W / G S D = W f / ( μ H )
In our experiment, the road width(W) is chosen as 16.0m, GSD was computed as 0.4125m/pixel using Eq.(2), thereby the ground-truth road length(L) in a image is calculated as 38.78m using Eq.(4). Given that the sampling frequency t is 2s, the forward overlap of captured images is set to 75%. According to the Eq.(3), the minimum speed v is 4.85m/s, and finally 5m/s is determined as the flight velocity for this experiment.

4.2. UAV Imagery Data Preprocessing

4.2.1. Frame Extraction&Fusion From UAV Imagery Video

Video frame data plays a crucial role in acquiring UAV pavement crack images. In order to obtain and supplement the original pavement crack datasets, it is necessary to extract and crop the frames. During the frame extraction process, it is important to consider the overlap, spacing, and seamless of neighboring video frames to ensure the integrity and independence of each frame. Additionally, the setting of the frame extraction interval is of utmost importance. If the interval is too large, it may result in a lack of seamless fusion and docking. On the other hand, if the interval is too small, On the other hand, if the interval is too small, there will be significant overlap between frames, leading to an excessive number of frame and increased computing cost. The formula for calculating the extraction interval number (N) is as follows:
N [ G S D × F l × ( 1 r ) v × f p s ]
where Fl is frame image size (px), i.e., the flight direction; fps represents frames per second in each video; and other variables are described in the previous section.
For this experiment, UAV imagery in the DJI Mini 2 is set to 4K HD, which corresponds to the DJI official frame image size of 3840px×2160px. Namely, Fl is taken as 3840px. The fps is officially 24f∙s-1, GSD and v were calculated to be 0.4125cm/pixel and 5.0m/s as above, respectively. The overlap(r) is taken as 75%. Using the Eq. (5), the extraction interval number (N) was found to be [19.01], which was rounded to 19. Finally,to ensure sufficient overlap, this study extracts a image every 19 frames from video. The extracted frame images are then used to stitch together overlapping parts of neighboring frames using the picture fusion technique.

4.2.2. Pavement Cracks Datasets With GSD Information

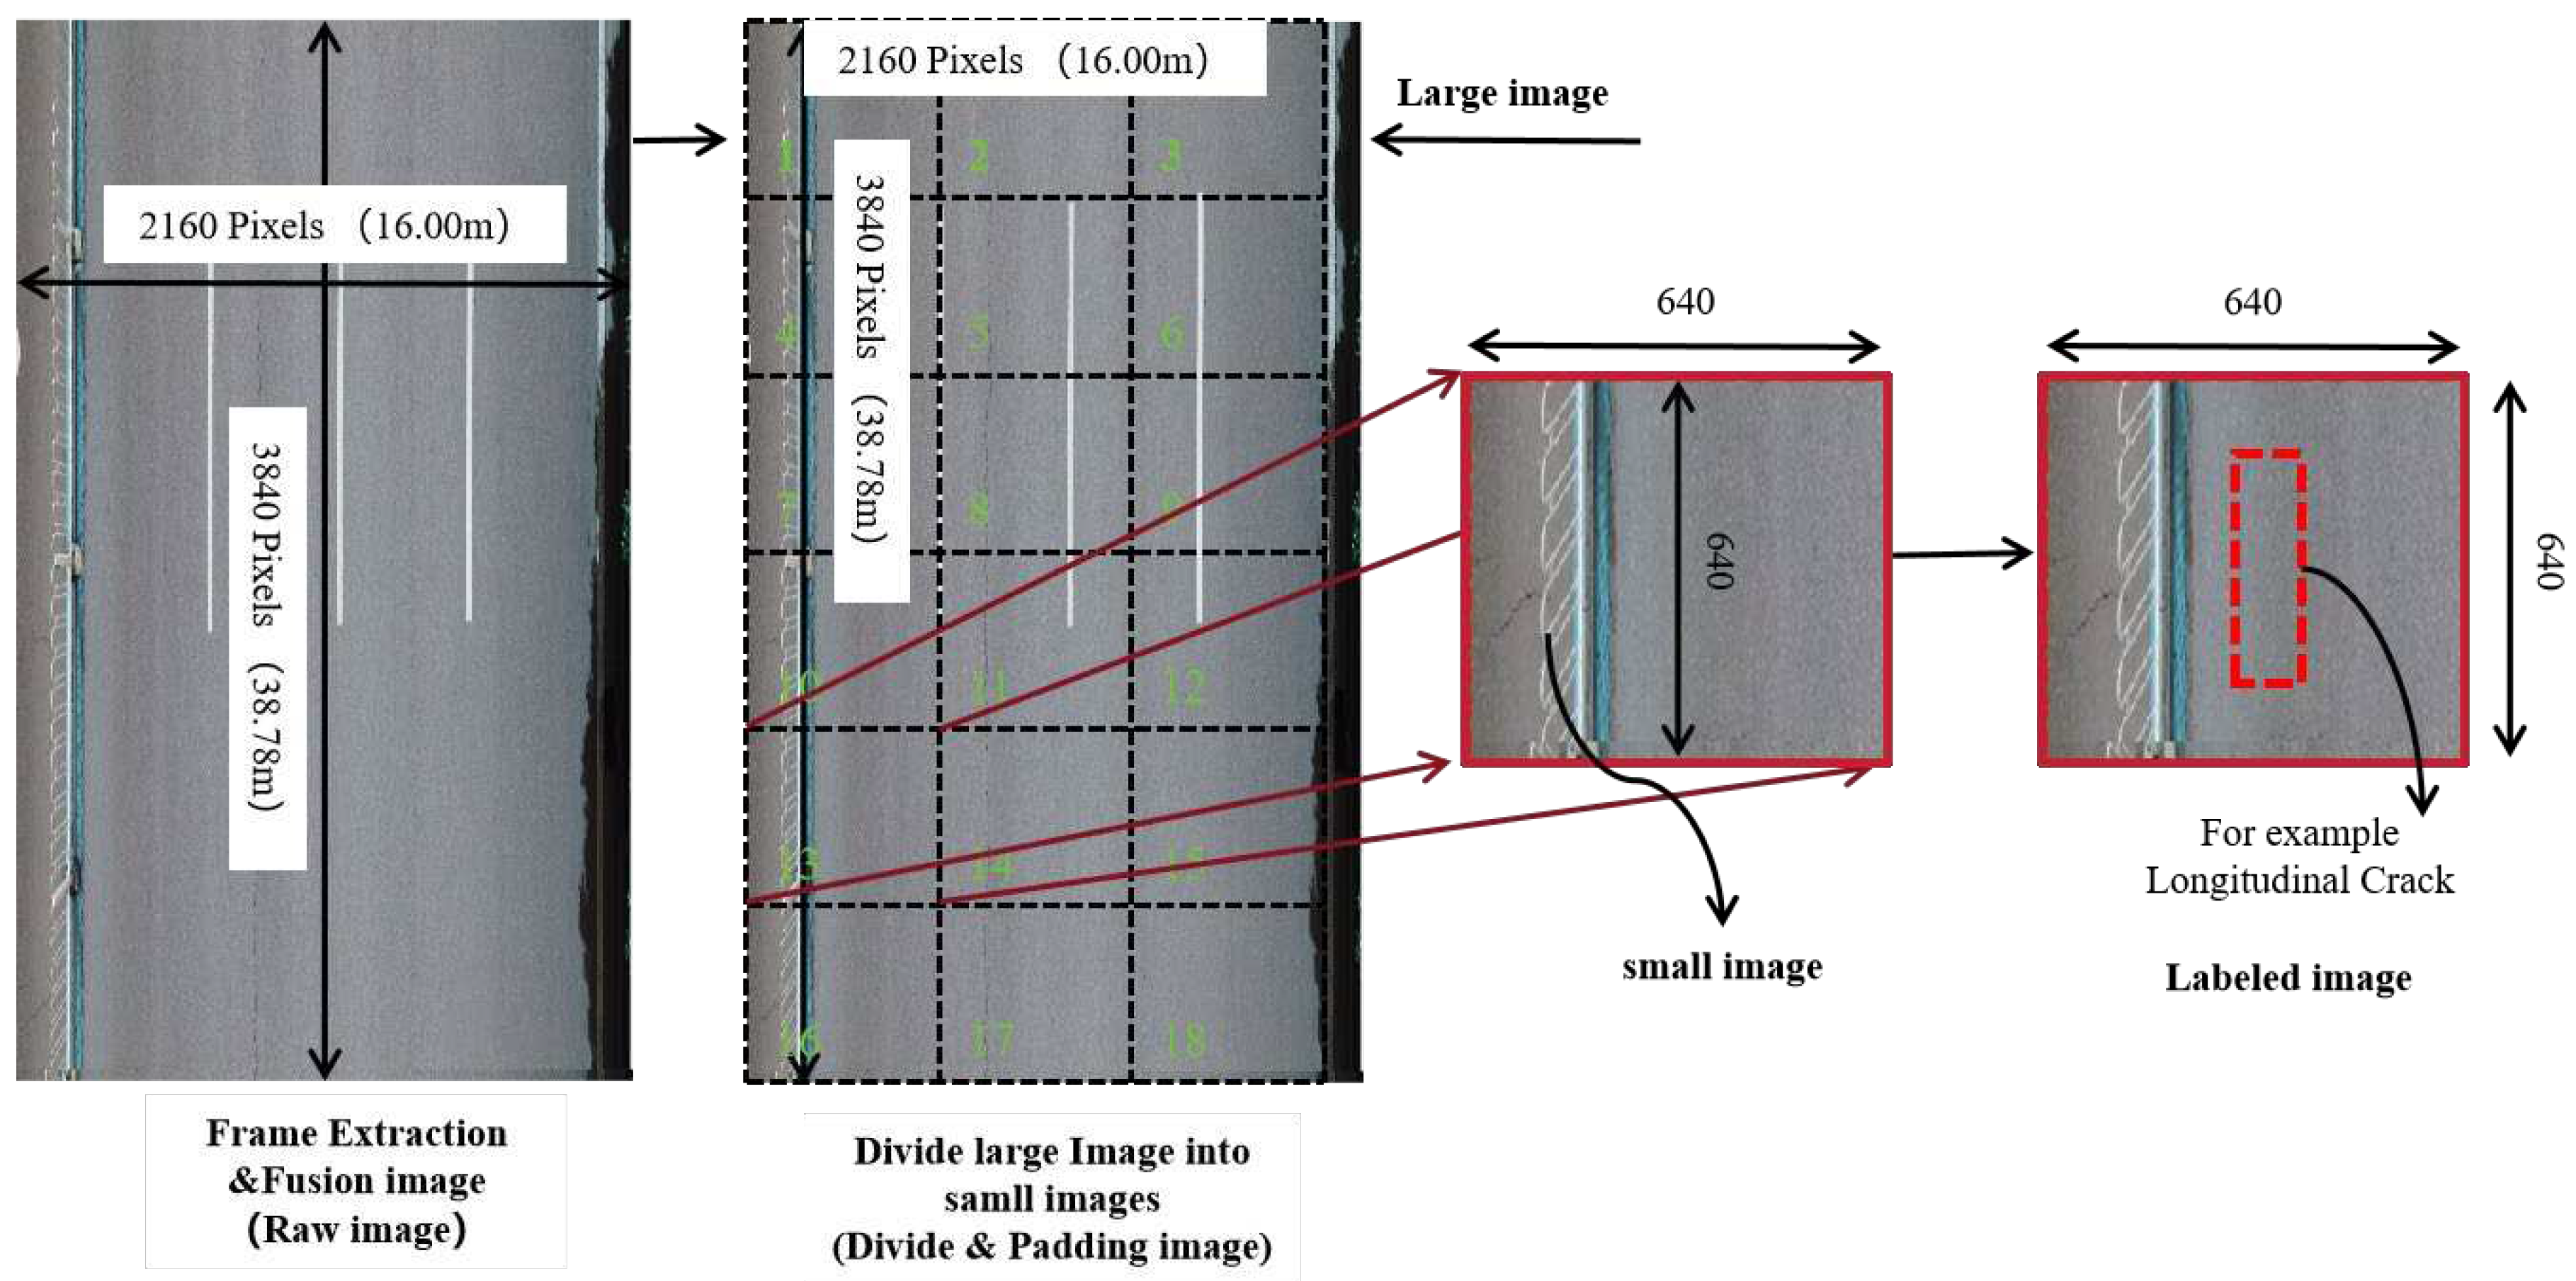
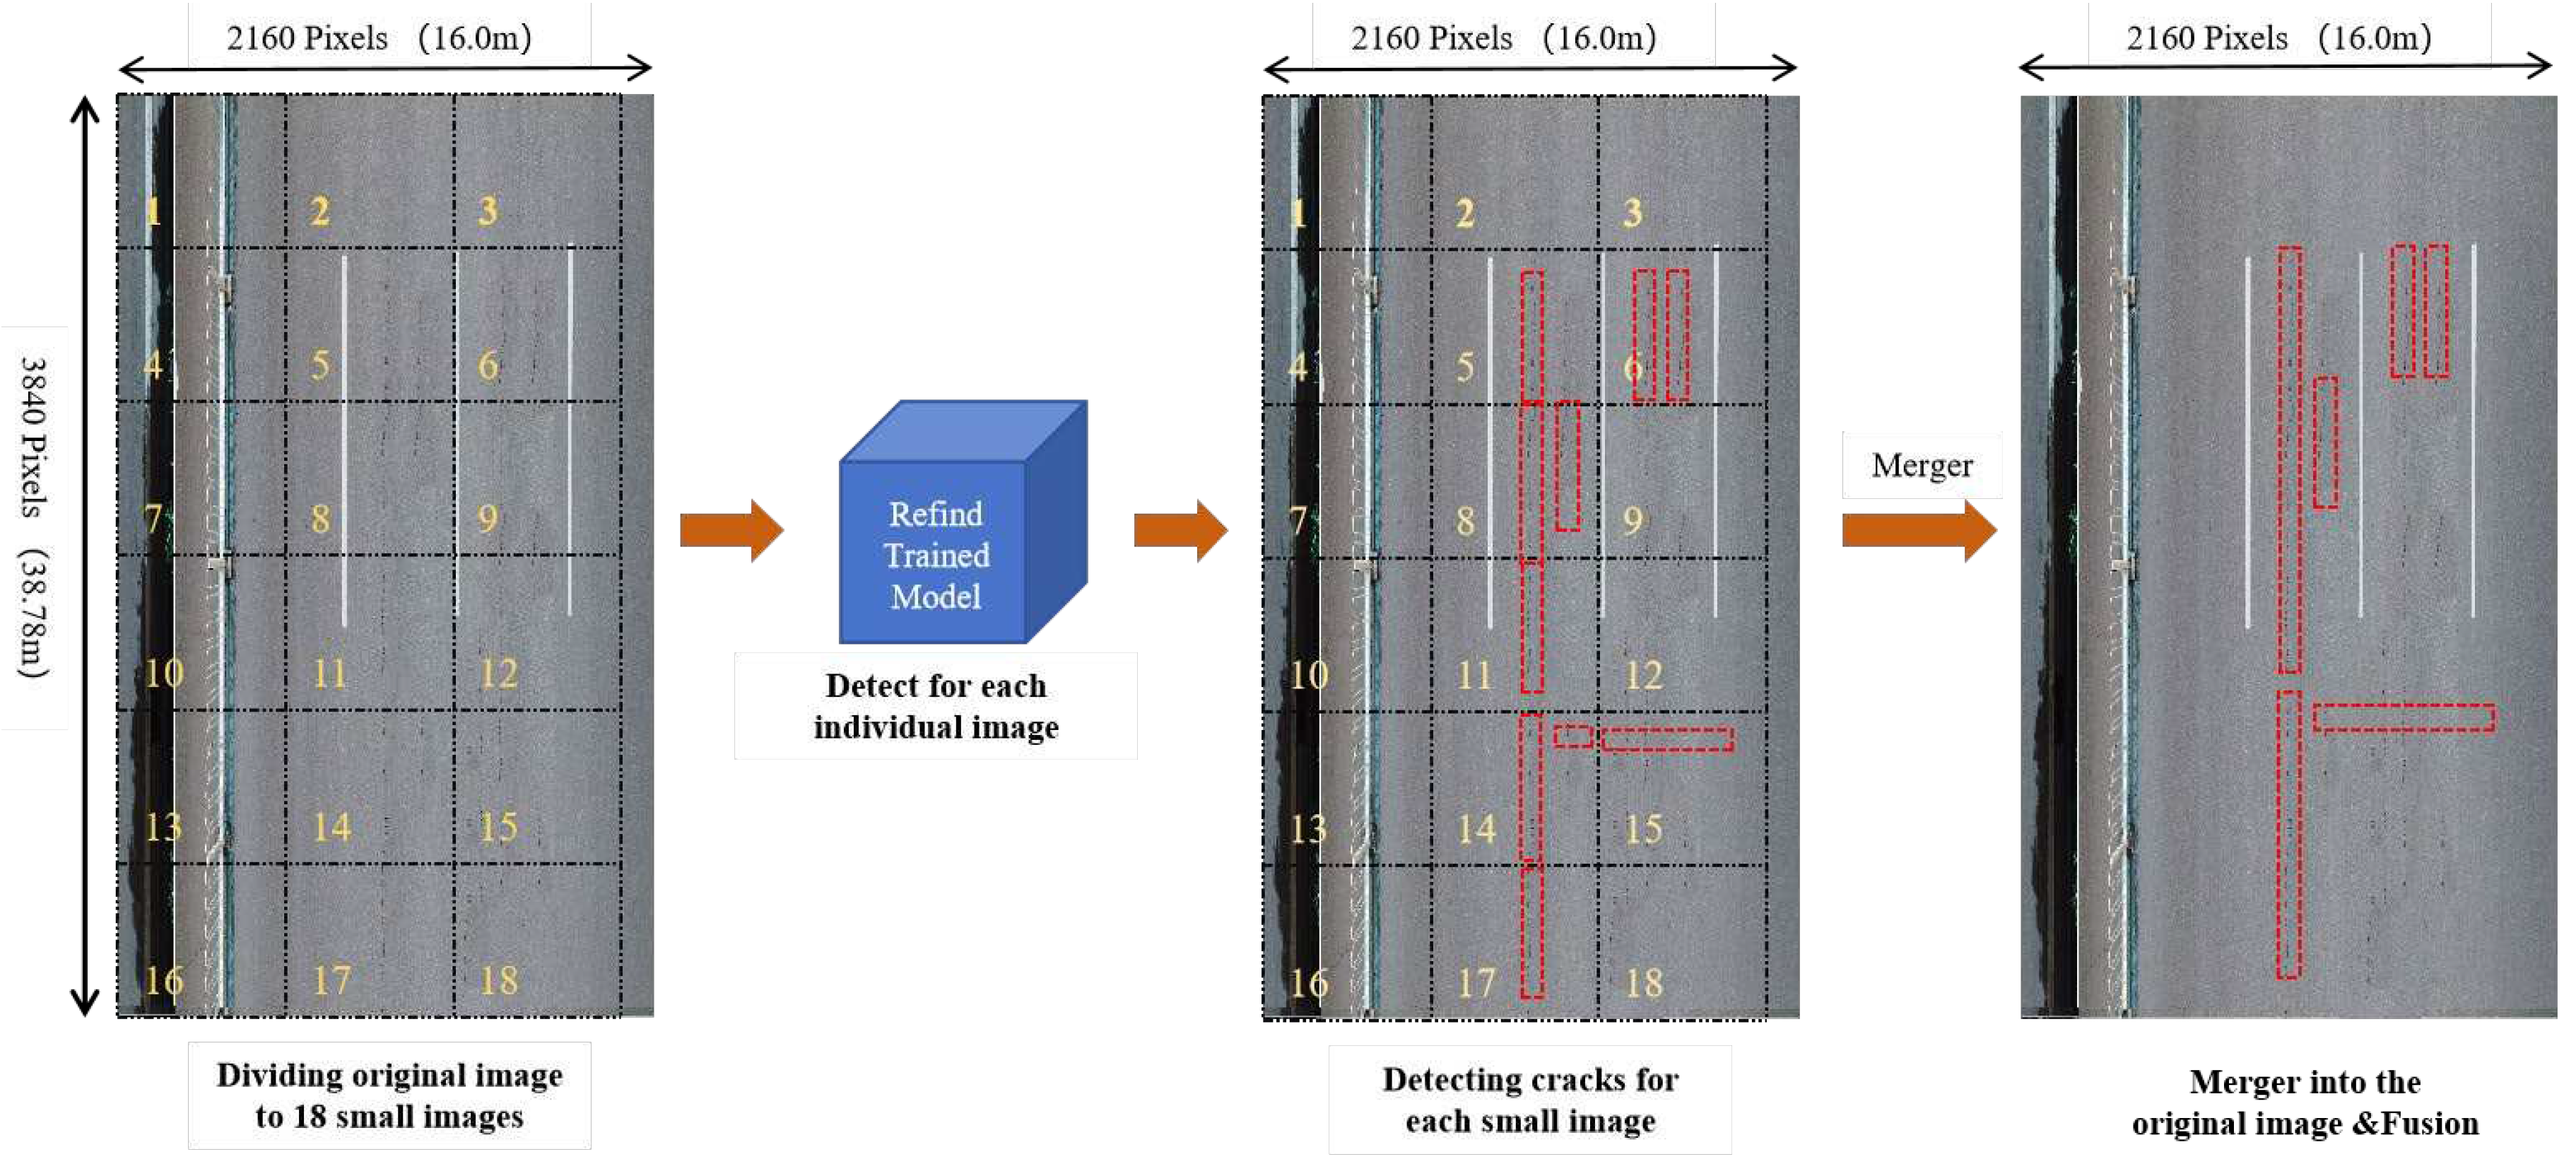
Due to the large size of the acquired images or frame images, utilizing them directly as input for model training would lead to a sluggish training speed and significant consumption of processing resources. Therefore, to enhance parallel batch computing speed, the deep learning models have specific requirements for the training image datasets. The original images need to be trimmed after frame extraction and fusion, resulting in images with consistent specifications. In this experiment, the extracted frame images from video are used as the initial images, which are further cropped into 640px×640px specification images. The cropping process is shown in Figure 6. Assuming the original image size of a frame is 3840px×2160px road image, 18 of 640px×640px specification images can be cropped. To expand the number of samples for crack categories, data enhancement methods such as augmentation, translation, flipping, and rotation are applied. Additionally, the blurred images are removed to ensure they do not affect the training effect of the model training. The UAV crack original datasets are constructed by manually screening, classifying, and confirming the coverage of the four major crack categories and the no-crack images.
Road crack labeling plays a crucial role in training and testing deep learning models. The accuracy of labeling directly impacts the quality of model learning. In this experiment, we employed various methods, including manual visual labeling and the Labelimg tool, to decipher, mark, and categorize different types of cracks based on the original UAV crack datasets. The goal was to create an improved training set for crack recognition. Based on the prominence of cracks and their associated damage hazards, road cracks were categorized into four types: longitudinal cracks, transverse cracks, diagonal cracks, and mesh cracks. These categories are illustrated in Table 1.
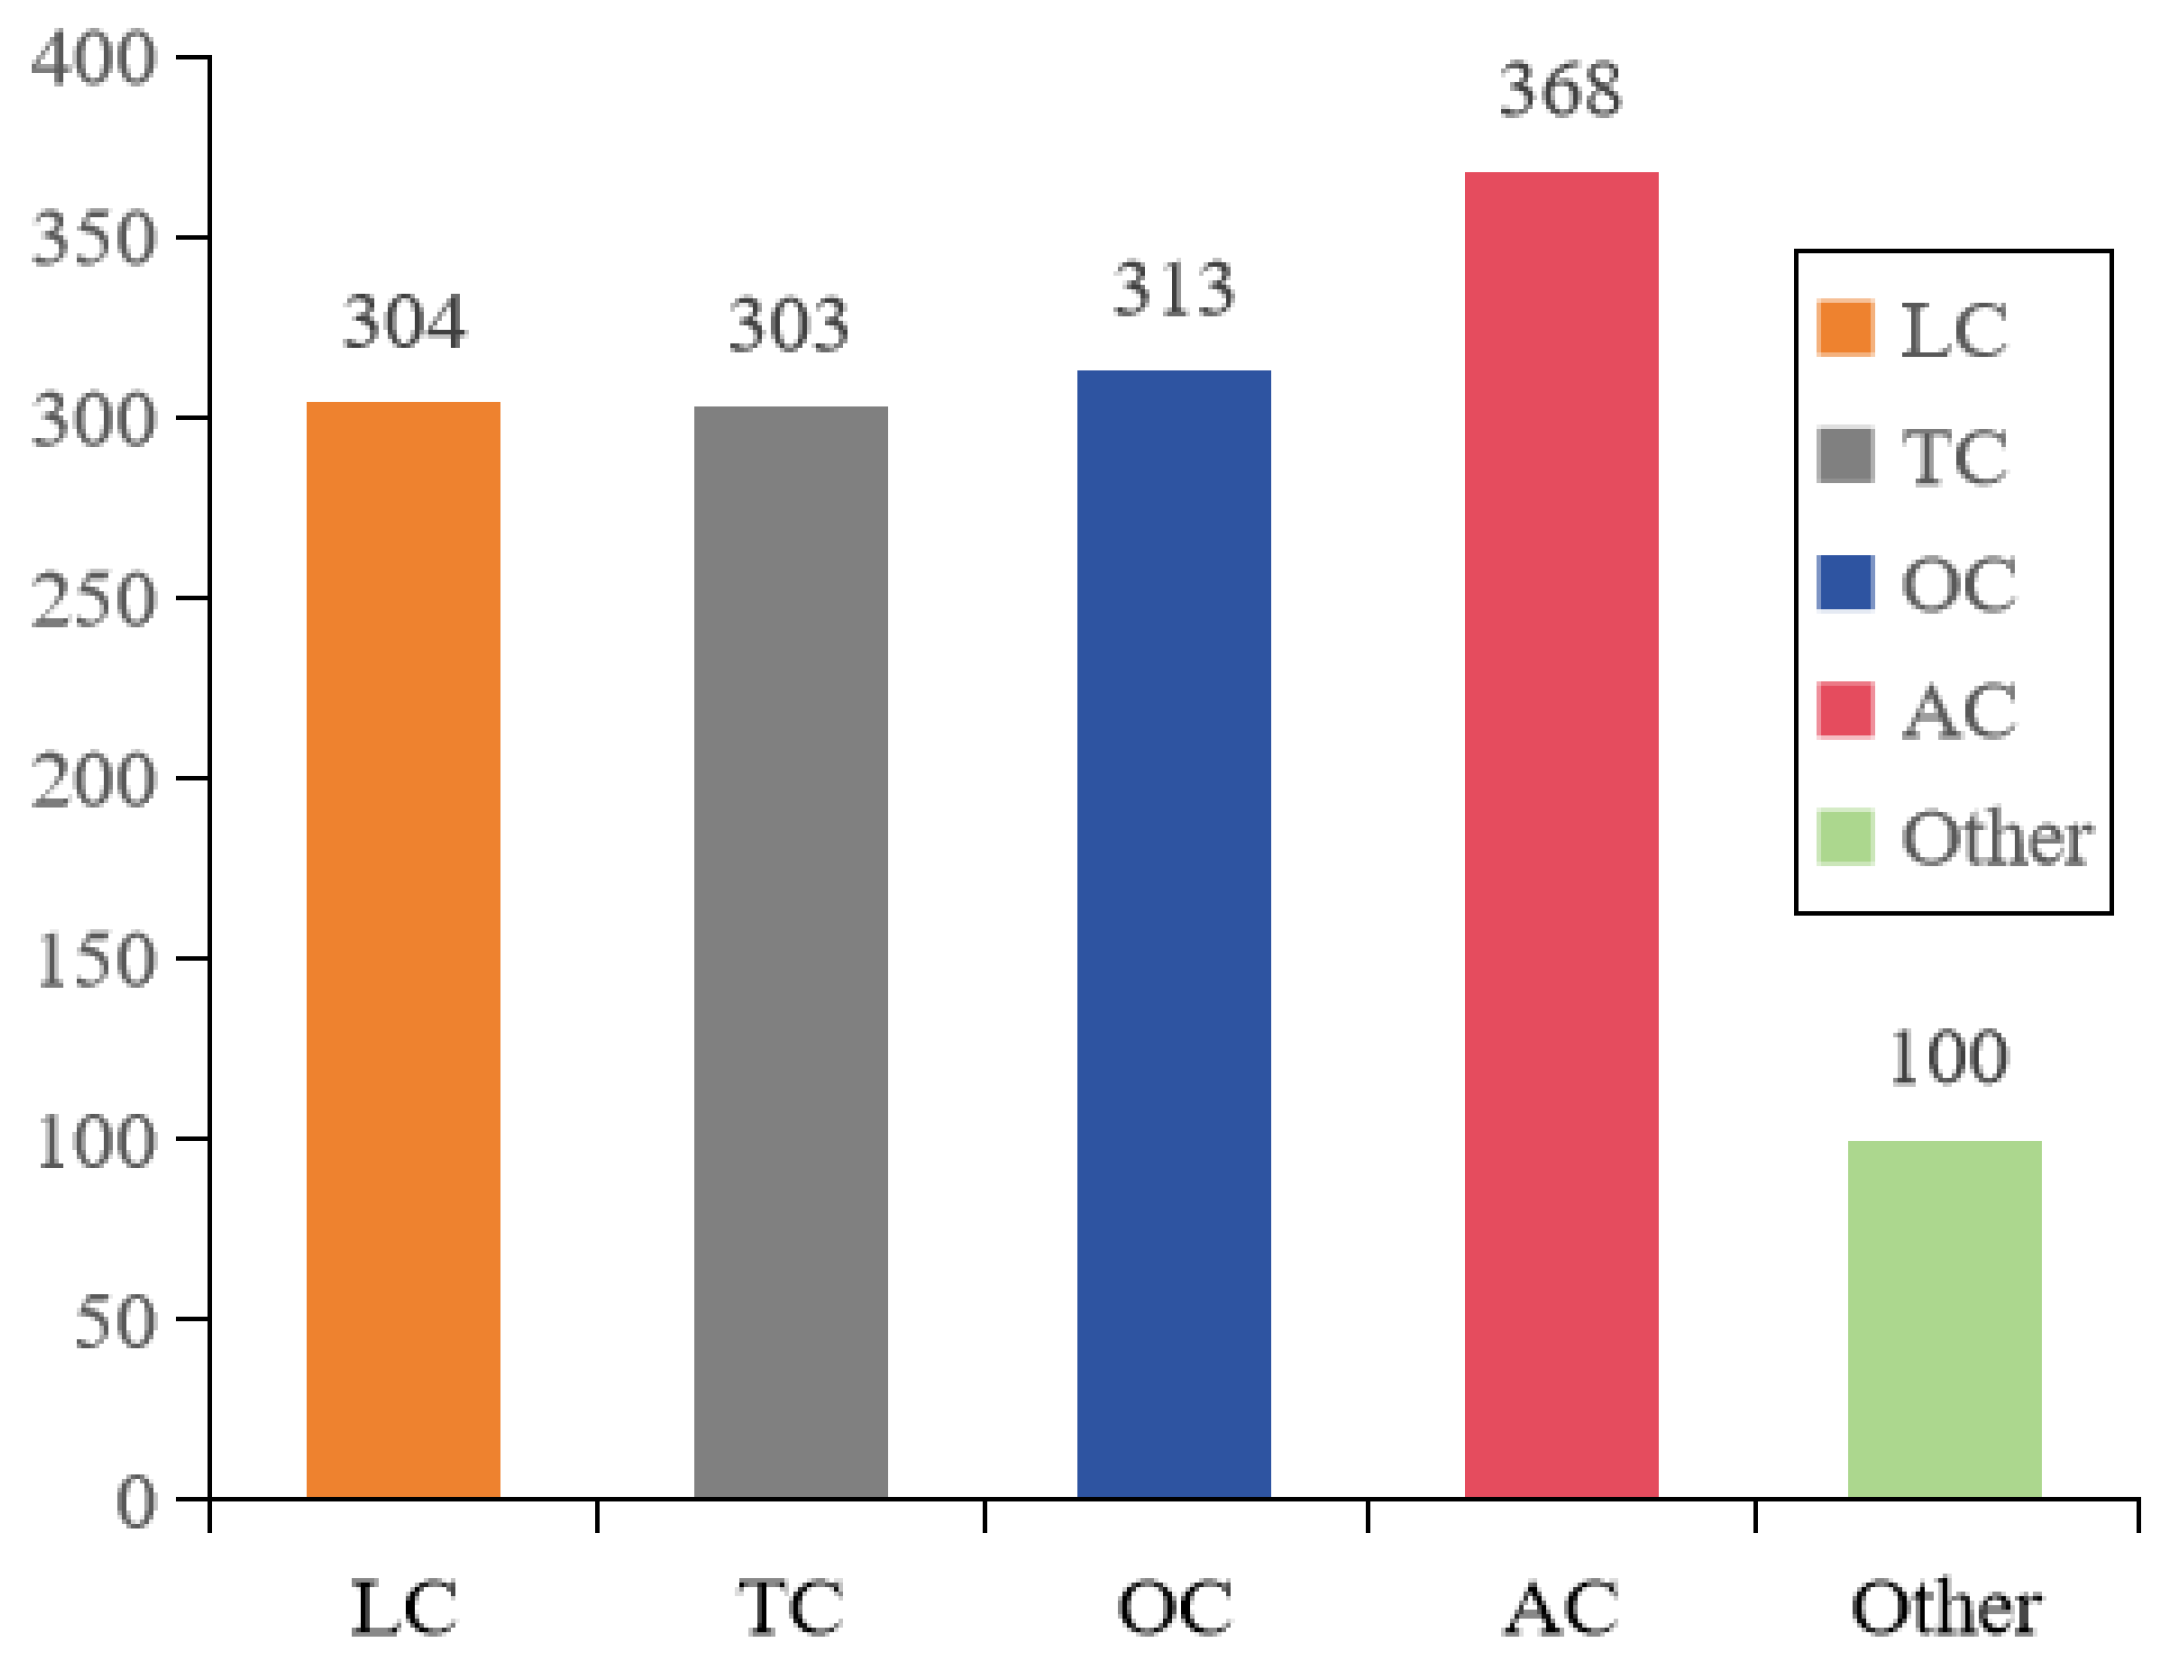
Generally, the problem of imbalanced sample distribution in datasets can often lead to overfitting of the model[29]. To address this issue, this experiment fully considered the balance of sample distribution when creating the labeling datasets. Each type of road pavement crack has a more equal number distribution, as shown in Figure 7. A total of 1,388 pavement cracks images based on UAV were collected and labeling, with 304 samples identified as longitudinal crack (LC) type, 303 samples identified as transverse crack (TC) type, 313 samples identified as obliquely oriented crack (OC) type, 368 samples identified as alligator crack (AC) type, and 100 samples identified as no-crack type. To ensure the DL-based model’s effectiveness, the datasets was divided into training, validation, and test sets in the ratio of 80%, 10%, and 10% ,respectively.
Notably, existing crack datasets often do not provide ground-truth information, particularly regarding the spatial resolution of UAV imagery. This lack of information directly affects the accuracy of crack identification and measurement in future studies. In this study, the UAV data collection process included the recording of real-time flight height, an important parameter for each image. Thereby,the Ground Sample Distance (GSD) can be calculated using Formula(2) ,and also documented in each treated image, which is crucial for the subsequent automated evaluation of pavement damage.

5. Experiments and Results

5.1. Experimental scenario

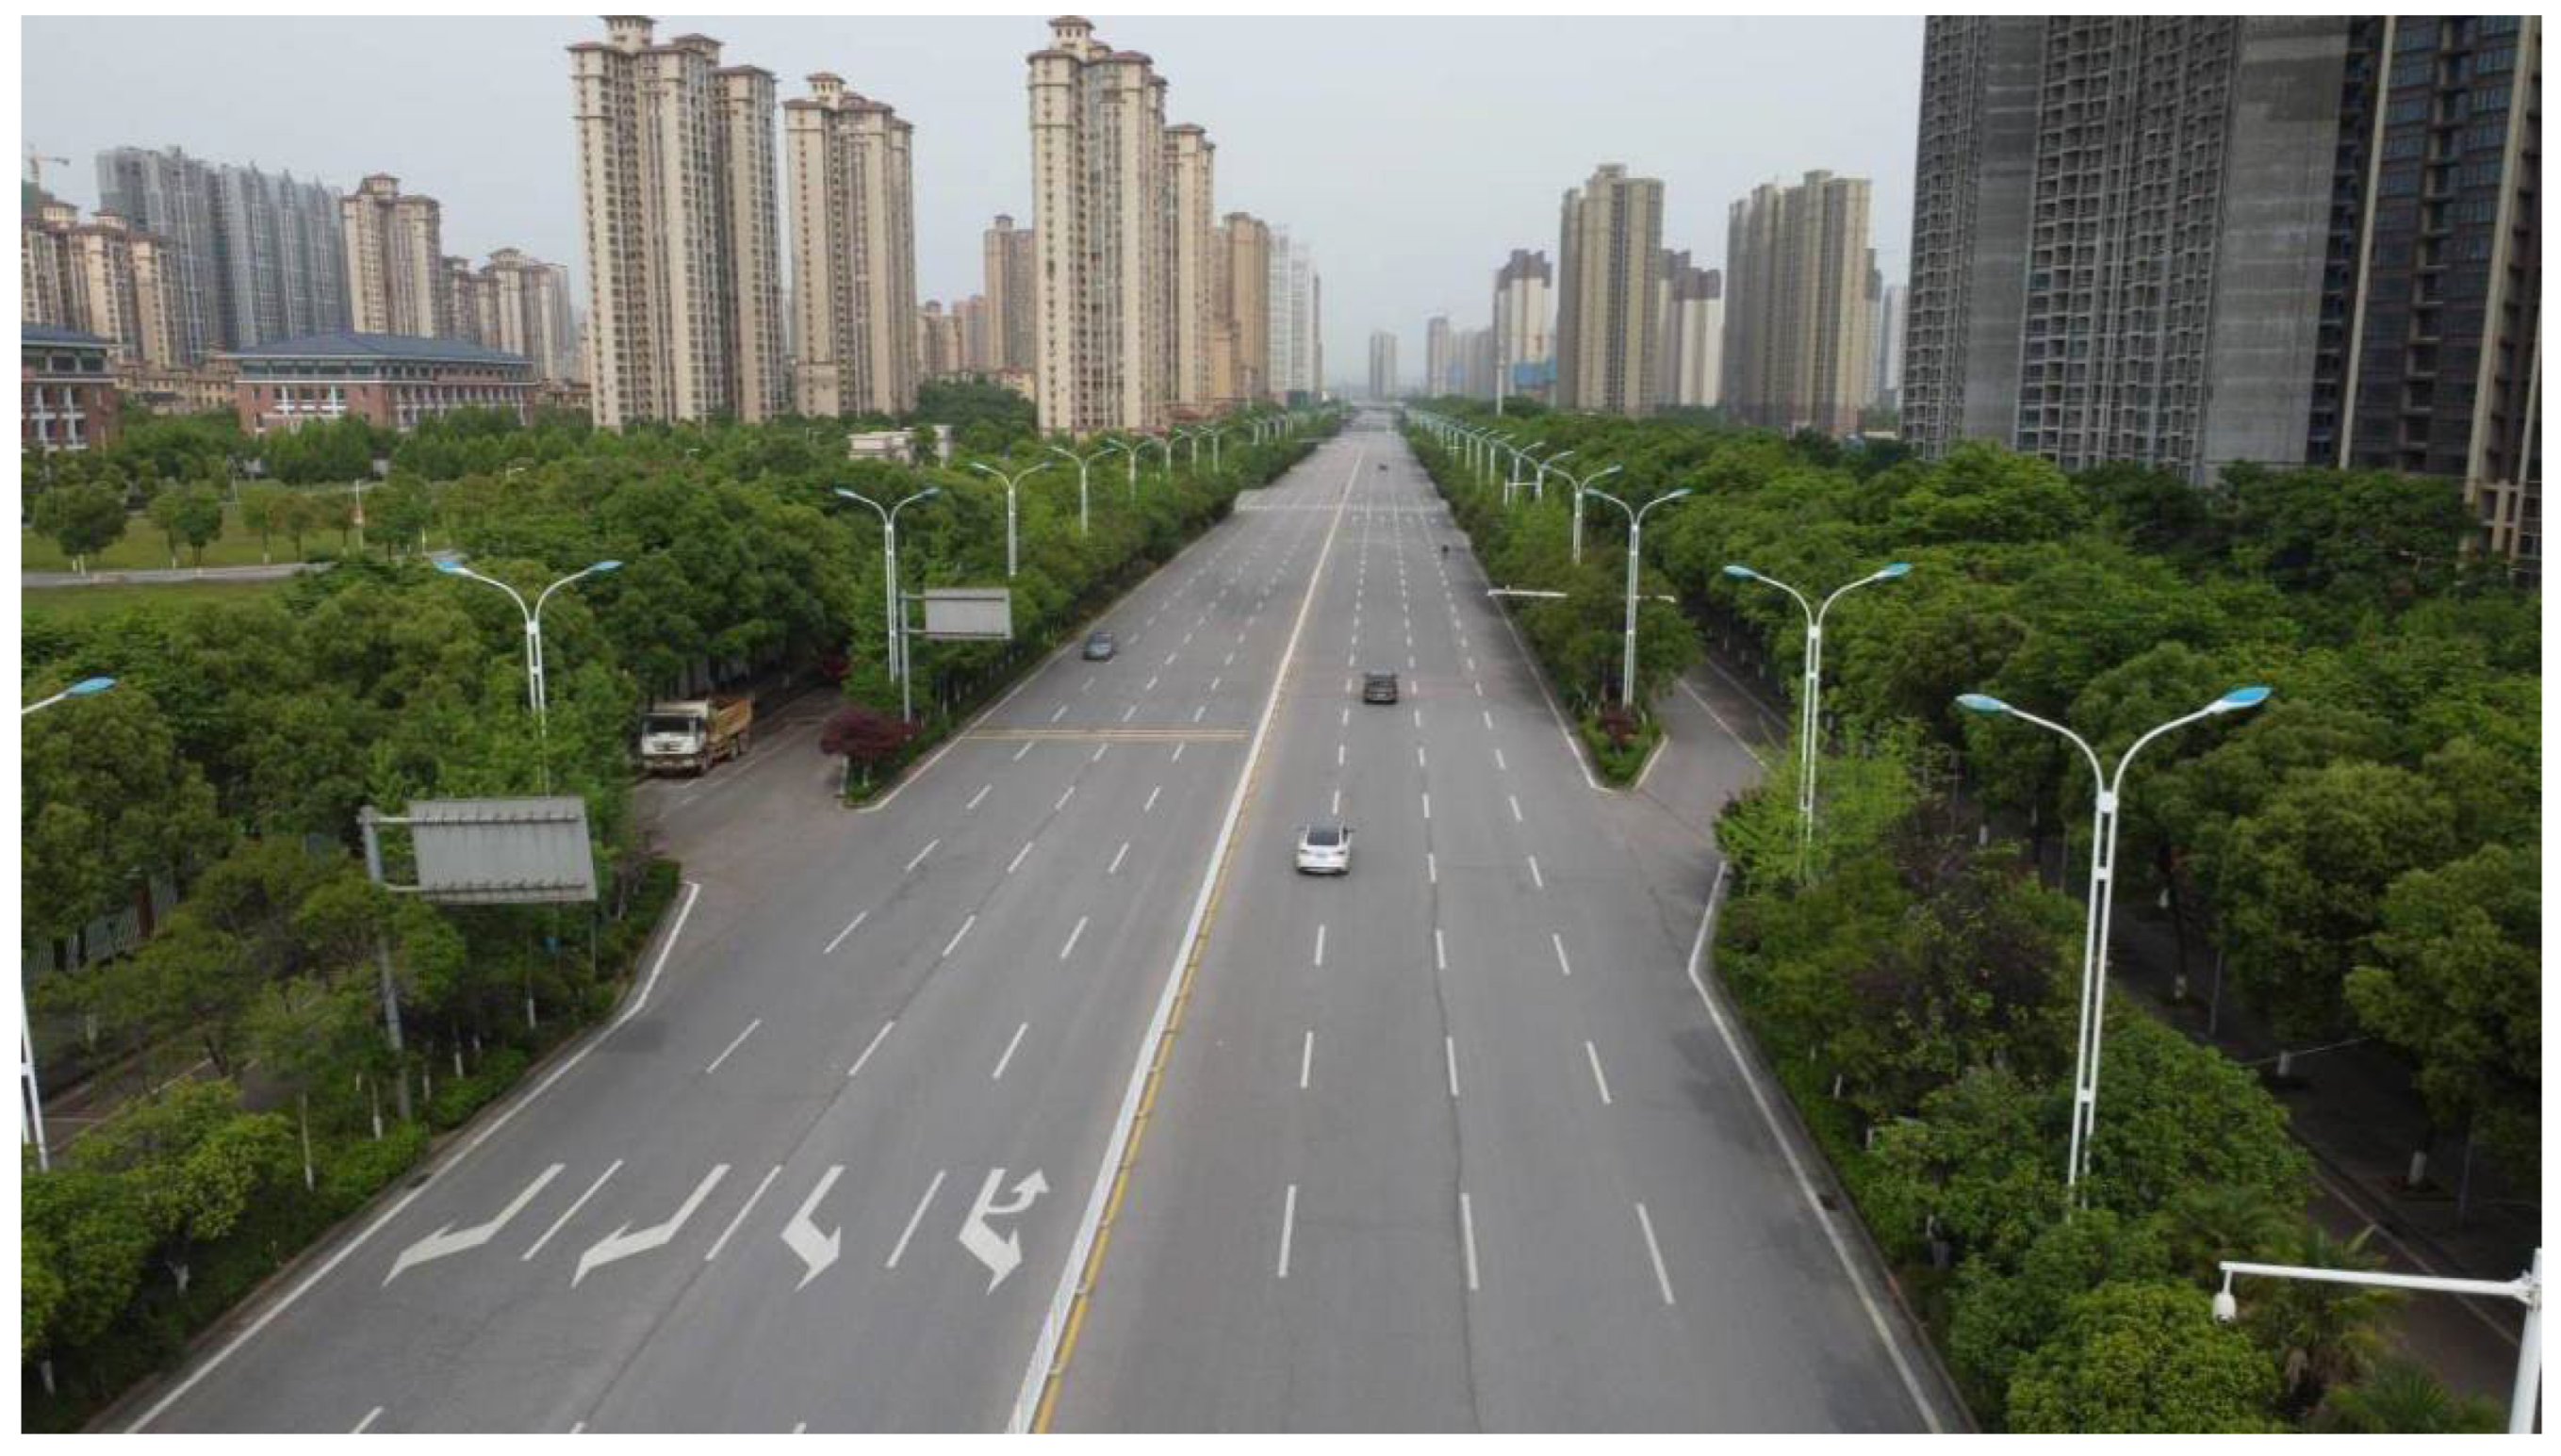
In this experiment, the flight mission is located in Xuefu Road, Xiangtan City, Hunan Province, China, as shown in Figure 8. The Xuefu Road is an asphalt pavement with Two-way Eight Lanes and a One-way road width of 16m. The UAV aerial photography covered a distance of 1.5km. The road was built and opened to traffic in 2010. After more than 13 years, the road surface has suffered significant damage, including transverse cracks, longitudinal cracks, alligator crack, and no-crack. The experiment was conducted at 10:00 a.m. on a sunny day with relatively sparse traffic. Based on the previously obtained UAV flight parameters, the flight height(H) was set to 22.5m, and the flight velocity (v) was set to 5.0m/s.

5.2. Experimental Configuration

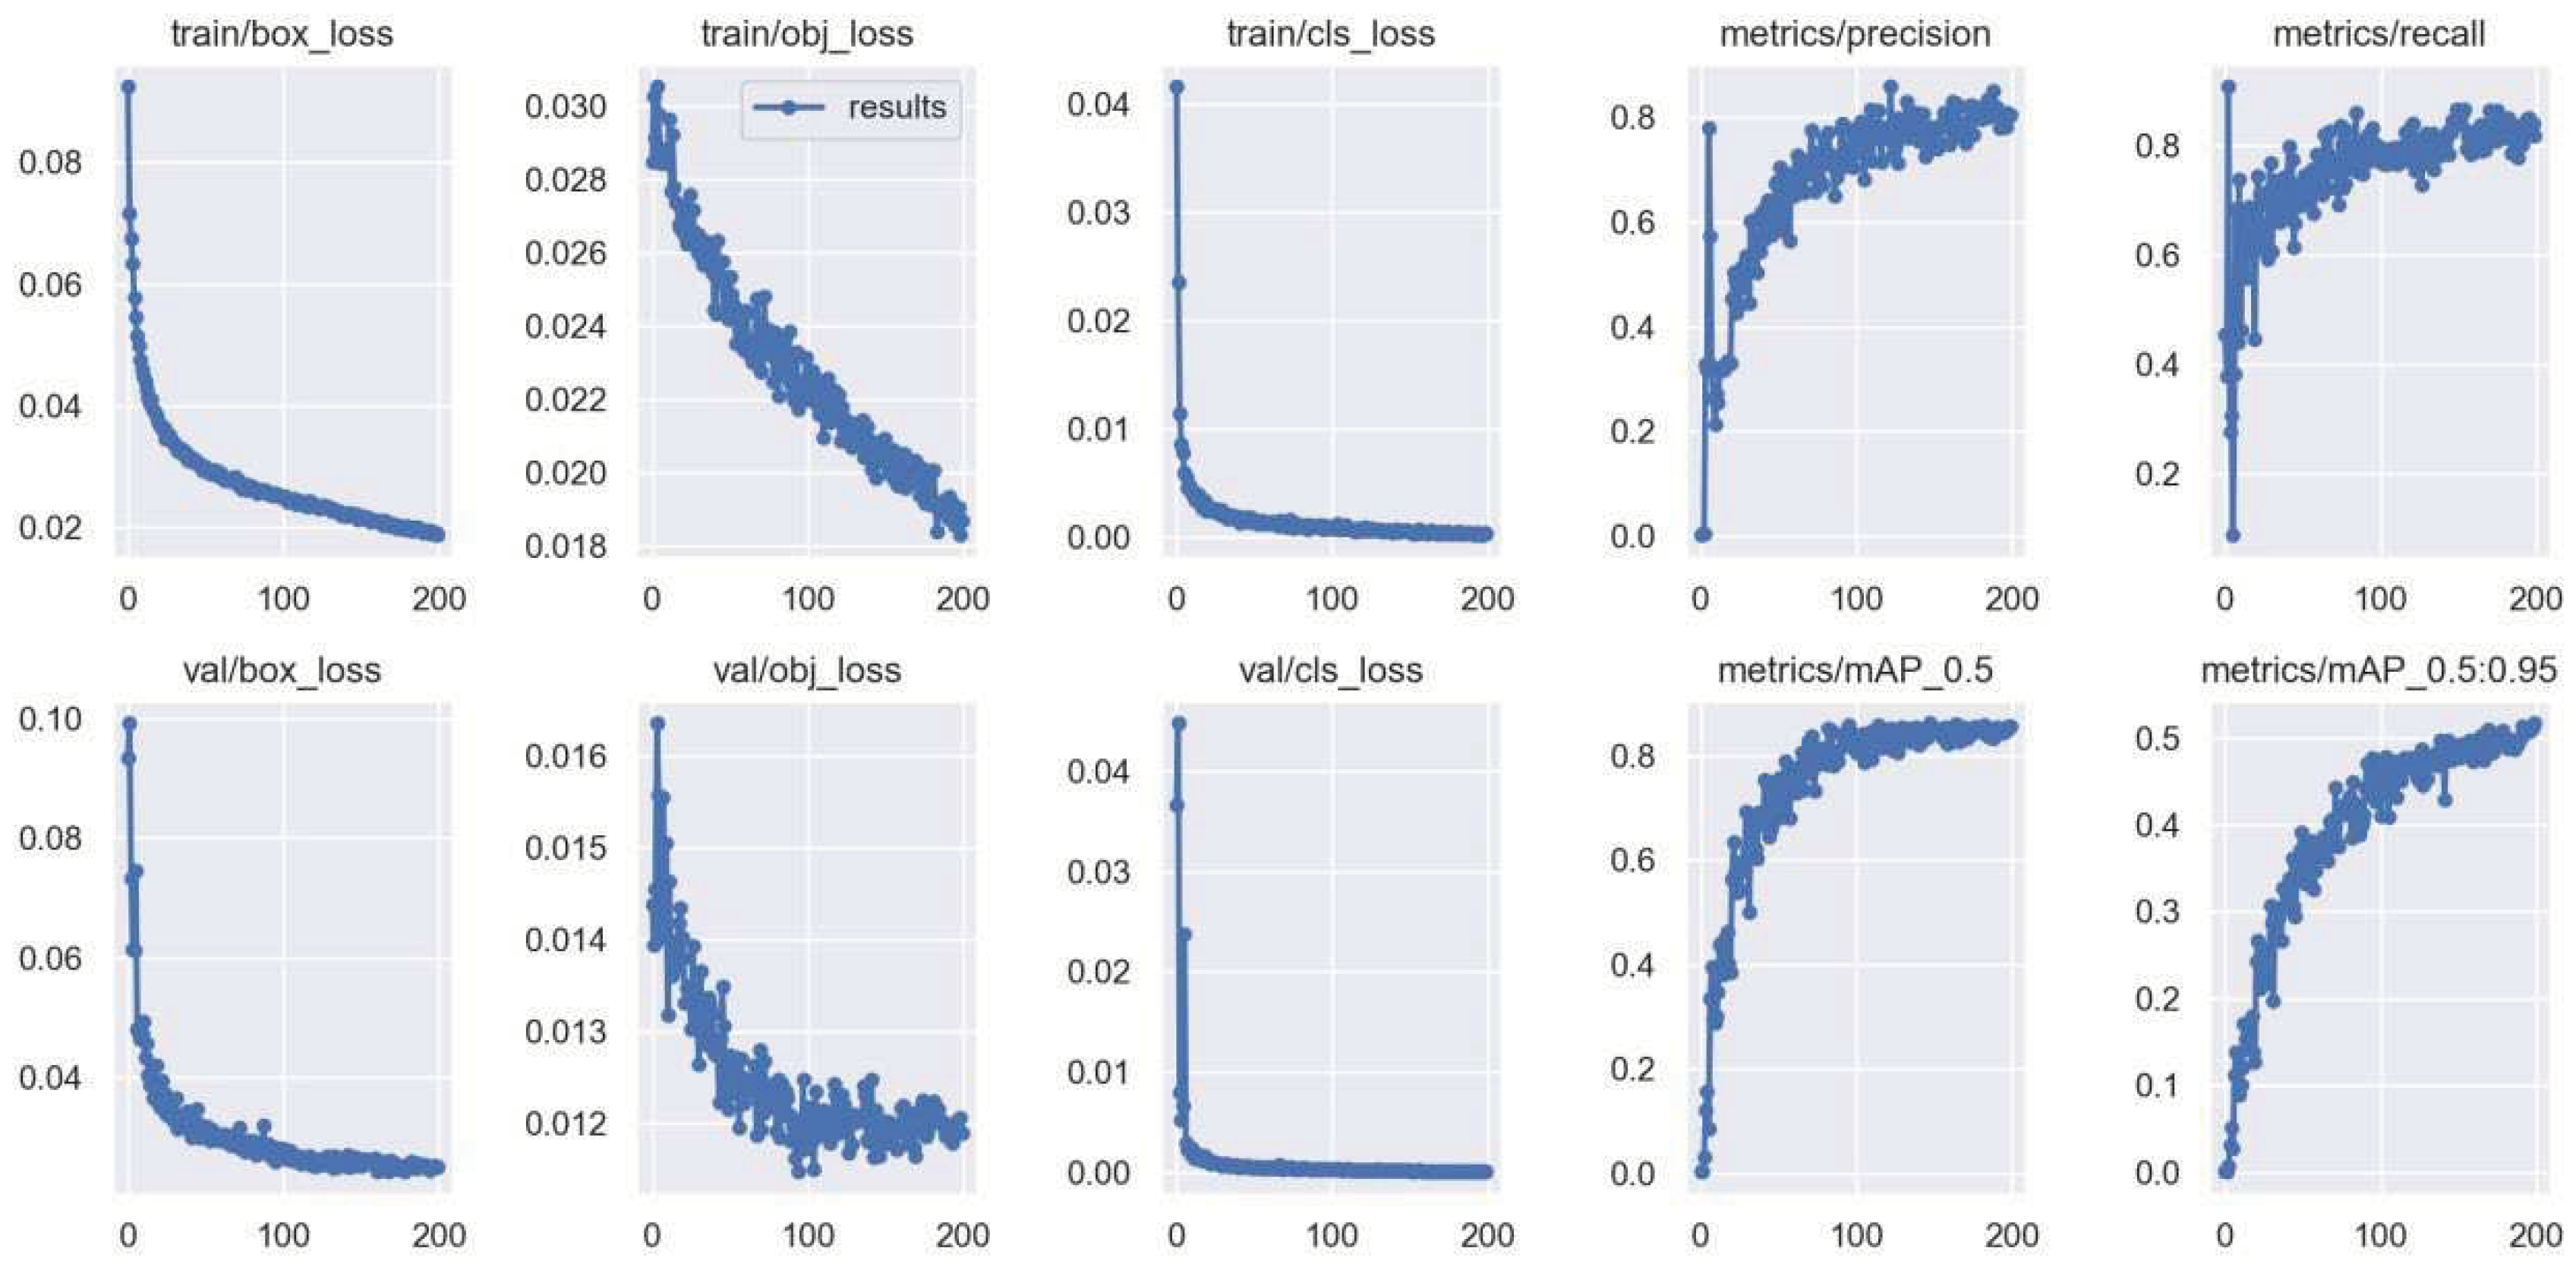
The deep learning algorithms used in this experiment were executed on the same specifications. The specific configuration and experimental environment are detailed in Table 2. The Faster-RCNN model employed the VGG feature extraction network, while YOLOv5, YOLOv7, and YOLOv8 utilized YOLOv5s, YOLOv7-tiny, and YOLOv8s respectively. The input image size of these models was unified to 640px × 640px. The training iterations (Epoch) were set to 200, as depicted in Figure 9. The YOLO algorithm series models were trained with a batch size of 8, whereas the Faster-RCNN used a batch size of 4. The experiment's hyperparameters were configured as follows: the initial learning rate was set to 0.01, the learning rate decay employed the Cosine Annealing algorithm, the optimizer used was SGD (Stochastic Gradient Descent), and the Momentum was set to 0.937.

5.3. Evaluation Metrics of Models

5.3.1. Running Performance

To validate the computational complexity of deep Learning models, five evaluation metrics in this experiment are firstly used to assess the algorithm’s running performance:the number of parameters, video memory usage, training duration, memory consumption, and frame rate(FPS) . It is important to note that FPS measures the number of images processed per second and serves as a significant indicator of prediction speed.

5.3.2. Accuracy Effectiveness

Furthermore, in order to demonstrate the algorithm's effectiveness of deep Learning models, four evaluation metrics in this experiment are used to access the detection accuracy:Precision(P), Recall (R), F1-Score, Average Precision (AP), and Mean Average Precision (mAP). P represents the probability of correct target detection and is calculated as the ratio of the number of correctly classified samples (TP)to the total number of samples. R represents the probability of correctly recognizing the target among all positive samples and is calculated as the ratio of the number of correctly classified positive samples to the number of all positive samples. F1-Score is a comprehensive evaluation index that takes into account the effects of accuracy and recall. AP is obtained by calculating the area under the Precision-Recall curve and reflects the precision of individual crack category. The mAP characterizes the average across four crack categories and reflects the overall classification precision of crack prediction.

5.4. Experimental Results

To validate the viability of our proposed framework in analyzing UAV imagery crack datasets, this study employed four prominent deep learning algorithms (Faster-RCNN, YOLOv5s, YOLOv7-tiny, and YOLOv8s) for conducting pavement crack object detection and comparative analysis. The experiments were conducted using identical hardware and software environments, with consistent iteration numbers, training datasets, validation datasets, and test datasets. The results were evaluated based on model performance during execution, recognition accuracy of the models, and variations in crack category classification.

5.4.1. Comparison results of Running Performance

The operational performance of four models is presented in Table 3. Among them, the Faster-RCNN model exhibits significantly lowest performance, with the highest number of parameters (136.75×10⁶), memory consumption(534.2MB), and video memory usage(5.6GB), as well as the longest training duration (7.1h) and the lowest frame rate (12.80f·s-1). On the other hand, the YOLO series models, which are single-stage algorithms, demonstrate significantly faster running performance. The YOLOv7-tiny model has the fewest parameters and minimal memory requirements, while achieving higher frame rates for YOLOv5s and YOLOv8s, along with faster execution speed.
When considering identical datasets, it can be concluded that the Faster-RCNN model requires superior running performance and environment configuration, whereas the YOLO model series requires lower hardware and software environment configuration, while offering faster training speeds. Consequently, the YOLO model series algorithms are highly suitable for lightweight deployment of real-time detection tasks on UAV platforms.

5.4.2. Comparison Results of Detection Accuracy

(1). The results of Overall Detection Accuracy
The results of comparing the overall detection accuracy are presented in Table 4. Among all models, the Faster-RCNN model demonstrates the highest accuracy, surpassing the YOLO series models in all evaluation indexes of accuracy. It achieves precision(P), recall (R), F1 value, and mean average precision (mAP) of 75.6%, 76.4%, 75.3%, and 79.3% respectively. Among the YOLO series models, YOLOv7-tiny exhibits lower overall precision with values of 66.9% (P), 66.5% (R), 66.7% (F1-score), and 65.5% (mAP). On the other hand, both YOLOv5s and YOLOv8s show similar overall precision but slightly inferior to Faster-RCNN by approximately a margin of around 3% to 5%.
(2). The results of Detection Accuracy Under Different Crack Types
To further clarify the discrepancies in model recognition accuracy among different crack categories, a comparative analysis of model recognition accuracy was conducted for four types of cracks: longitudinal crack (LC), transverse crack (TC), oblique crack (OC), and mesh crack (AC). The results are presented in Table 5.
(i).Regarding the identification of longitudinal cracks (LC), the Faster-RCNN model exhibits the highest accuracy with an average precision (AP) of 85.7% and the highest F1 value of 82.3%. In contrast, the YOLO series demonstrates relatively inferior average precision, with YOLOv7-tiny exhibiting the lowest performance. Therefore, Faster-RCNN outperforms other models in recognizing longitudinal cracks.
(ii).For transverse cracks (TC), the YOLOv8s model achieves superior recognition accuracy with an AP score of 89.5%, followed by YOLOv5s. Although there is a slight decrease in F1 score for YOLOv8s compared to YOLOv5s, their overall recognition accuracies do not significantly differ from each other; however, YOLOv7-tiny displays weaker recognition accuracy.
(iii).All four algorithm models exhibit low recognition accuracy and F1 values for oblique cracks (OC) compared to other types of cracks; however, among them, Faster-RCNN still maintains the highest level of recognition accuracy while all models belonging to the YOLO series demonstrate lower levels of recognition accuracy—this explains why Faster-RCNN performs better overall.
(iv).In terms of recognizing mesh cracks (AC), outstanding performance is observed from the YOLOv8s model which attains remarkable recognition accuracy and F1 value at 91.0% and 90.6%, respectively; meanwhile, although slightly less effective than its counterpart, the YOLOv5s model also showcases commendable performance whereas poor performance is exhibited by the YOLOv7-tiny model.
(3). The results of Detection Accuracy Under Different Crack Datasets
In this study, our self-made pavement cracks datasets is strictly follows UAV flight parameter settings and data acquisition process mentioned in Section 4. To validate the reliability and advantages of our self-made cracks datasets, we conducted a comparative study using these four model algorithms on existing various open-source UAV pavement cracks datasets. Our experiment involved comparing the detection accuracy of our cracks datasets with datasets such as UAPD[2], RDD2022[30], UMSC[19], UAVRoadCrack[21] and CrackForest[31]. We evaluated and compared the accuracy performance of Faster-RCNN, YOLOv5, YOLOv7-tiny, and YOLOv8s after 200 training cycles, as well as Faster-RCNN after 15 rounds.
The results, as presented in Table 6, indicate that our lab's datasets outperforms the other datasets used in similar models on most metrics, exhibiting the highest accuracy for crack recognition and algorithmic efficiency. However, model performance varies across different datasets; while UAVRoadCrack performs relatively well, UAPD dataset shows the worst performance. These findings strongly highlight the advantages of utilizing our self-collected pavement images via UAV and emphasize the importance of flight parameter modeling for the quality control of UAV imagery.
(4). The results of Detection Effectiveness
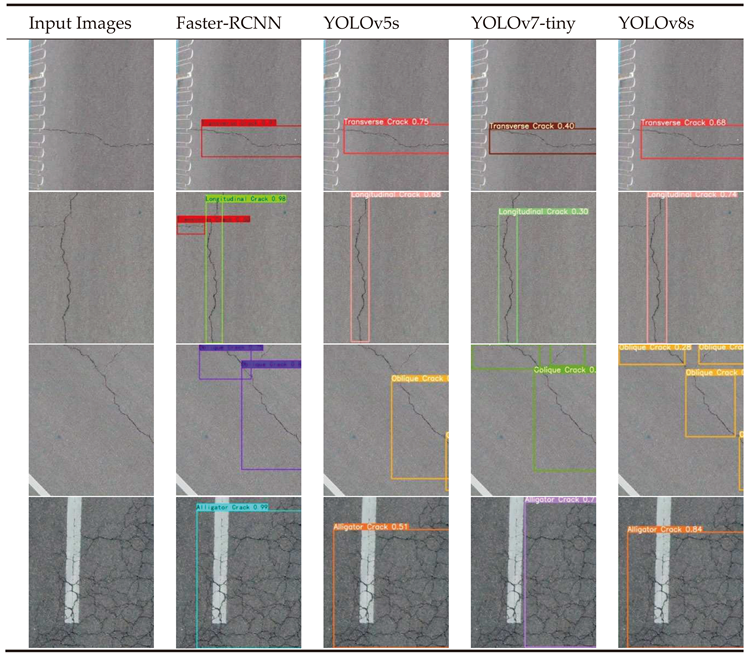
To facilitate a more intuitive comparison of the effects, a specific image with four types of cracks was selected from the test set to evaluate and compare their recognition performance, as presented in Table 7. Based on the results obtained, it is evident that Faster-RCNN outperforms the YOLO series algorithms in terms of overall performance. It is worth noting that for challenging oblique cracks (OC), all YOLO series algorithms exhibit unsatisfactory recognition with low confidence levels, often resulting in omission or separate identification of complete cracks; whereas the Faster-RCNN model demonstrates superior capability in recognizing oblique cracks (OC) more comprehensively. Additionally, the Faster-RCNN model also exhibits excellent performance in detecting subtle cracks, as shown in Table 7. For instance, it successfully identifies a subtle transverse crack within a longitudinal crack. In other crack types, all four modeling algorithms demonstrate effectiveness in crack detection. A comparative analysis considering both combined effects and confidence levels reveals that Faster-RCNN achieves the best overall performance; among the YOLO series algorithms, YOLOv5s and YOLOv8s show comparable results while YOLOv7-tiny performs relatively poorly with lower confidence levels observed across all detected results.
In summary, this experiment compared the accuracy and effectiveness of different models for crack recognition from UAV imagery. The Faster-RCNN model demonstrated the highest accuracy and effectiveness in recognizing fine cracks. On the other hand, the YOLO series model showed a significant advantage in terms of training speed and low requirements for video memory. Among the YOLO models, YOLOv5s and YOLOv8s exhibited comparable recognition accuracy, while YOLOv7-tiny performed the worst. The experiment primarily focused on evaluating the data acquisition quality of UAV imagery, which yielded optimal results in the testing phase.

6. Road Crack Measurements and Pavement Distress Evaluations

The primary goal of road crack recognition is to evaluate pavement damage on roads. This will help enhance the application of these models and provide factual evidence for maintenance decisions made by road authorities. After conducting a comparative study of various modeling algorithms, it was determined that the model trained by Faster-RCNN outperformed YOLO serial models and can be identified as the refined model for this experiment.
Due to the large size of the obtained images, it is not efficient to use them directly for road crack recognition. This would result in slow recognition speed and require a significant amount of processing resources. To address this issue and ensure that the UAV recognition model remains small and fast, the strategy of 'Divide and Merge' is employed into the UAV imagery with large-size photos . This strategy utilizes a 'Divide-Recognition-Merge-Fusion' method during the crack detection, as illustrated in Figure 10. The original frame image (3840px×2160px) is divided into 18 of consistency smaller images (640px×640px), each assigned with a unique number. Using the optimal model trained by Faster-RCNN in this experiment, cracks are identified within each cropped image. Finally, these identified images are stitched together, with overlapping multi-crack confidence recognition boxes merging with neighboring combinations.

6.1. Measurement Methods of Pavement Cracks

The measurement methods for crack analysis play a crucial role in statistically analyzing the quantity of cracks. These methods consider various factors such as crack location, crack type, crack length, crack width, crack depth, and crack area. In order to improve the practicality of these methods in road damage maintenance, the quantity of cracks can be roughly estimated, temporarily excluding small cracks.
(i) Pavement Crack Location: The pixel position of the detected crack in the original UAV imagery can be determined based on the corresponding image number; meanwhile, the actual ground position can be inferred through GSD calculation.
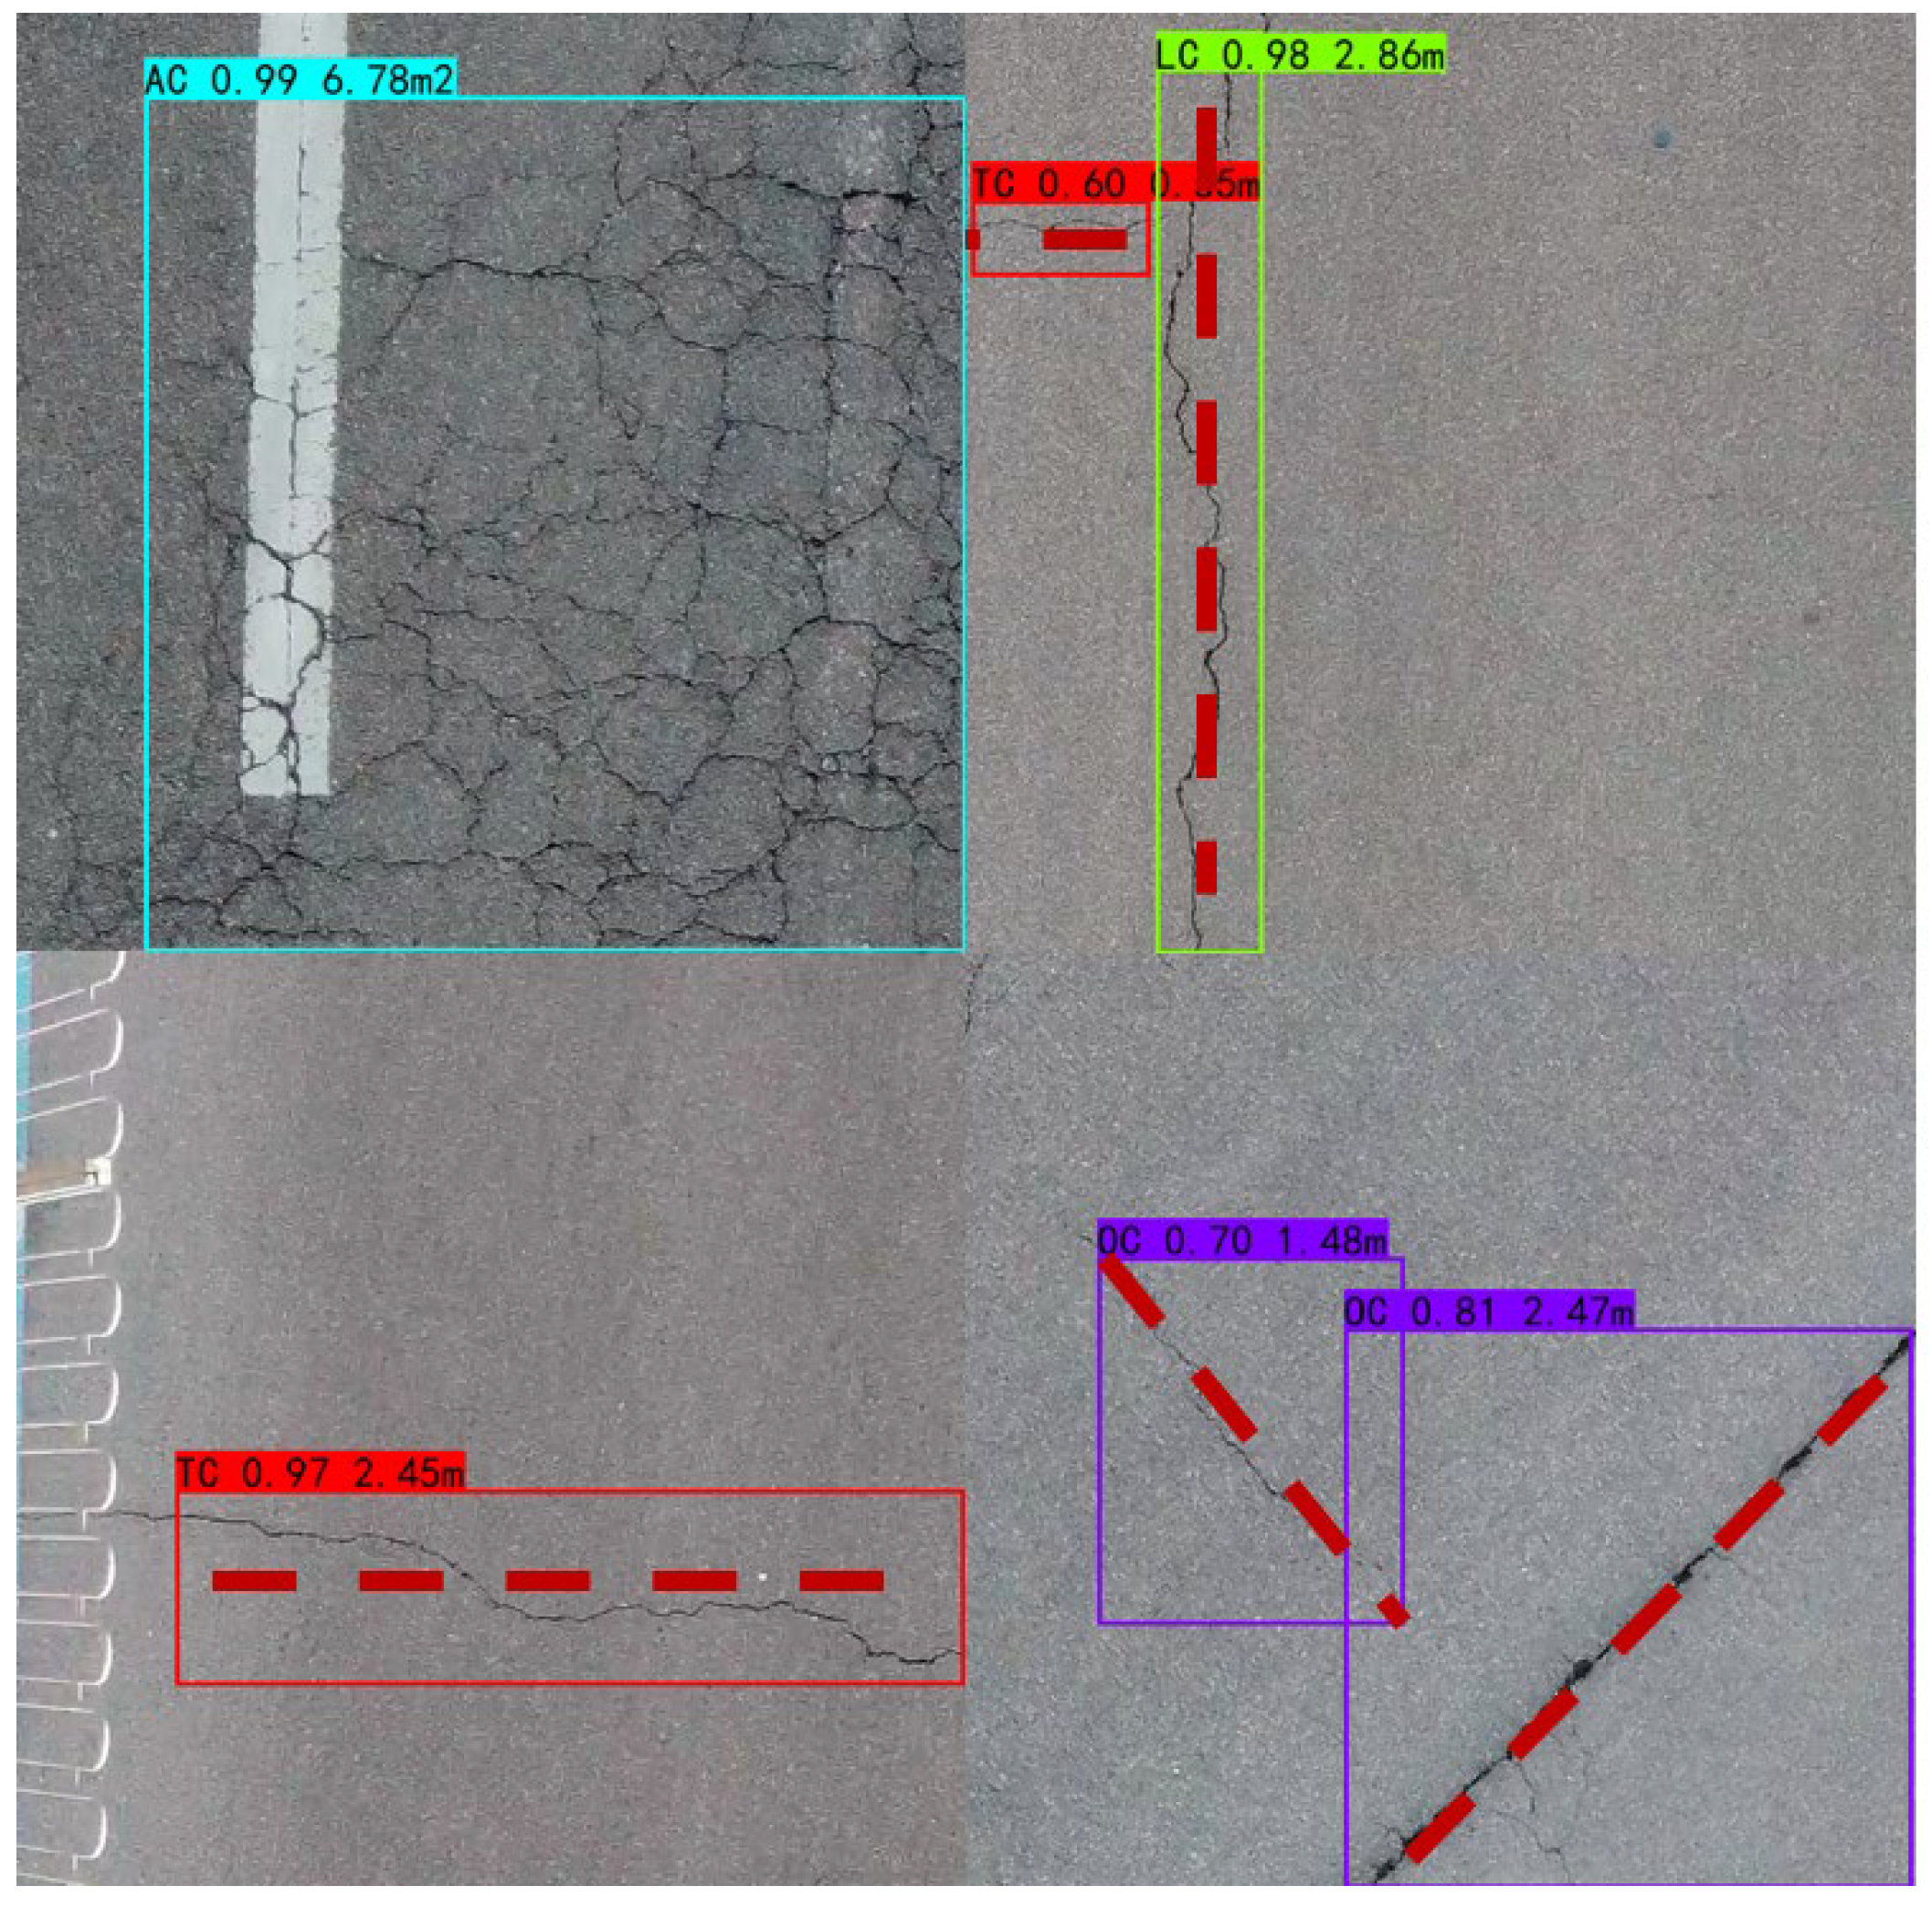
(ii) Pavement Crack Length: It can be determined based on the pixel size of the confidence frame model, as illustrated in Figure 11. Horizontal cracks are measured by their horizontal border pixel lengths; vertical cracks by their vertical border pixel lengths; diagonal cracks by estimated border diagonal distance pixels; and mesh cracks primarily by measuring border pixel areas.
(iii) Pavement Crack Width: The maximum width of a crack can be determined by identifying the region with the highest concentration of extracted crack pixels.
(iv) Pavement Crack Area: It mainly aims at alligator crack (AC) ,with the measurement of crack area. It can be calculated by the pixels of AC based on the confidence frame model.
Finally, to determine the location, length (L), and area (A) of road crack with ground truth, the quantitative results of cracks can be multiply the ground sampling distance (GSD, Unit: cm/pixel) by the pixels at which it is located. The actual length or width of the crack in meters can be calculated as pixel length (m) × GSD/100, while the actual area of the block affected by the crack in square meters can be derived from pixel area (m2) × GSD2/1002.

6.2. Evaluation Methods of Pavement Distress

The evaluation of pavement damage can be determined using the internationally recognized pavement damage index (PCI), which is also adopted in China. The PCI provides a crucial indicator for assessing the level of pavement integrity. Additionally, the pavement damage rate (DR) represents the most direct manifestation and reflection of physical properties related to pavement condition. In this study, we refer to specifications such as 'Technical Code of Maintenance for Urban Road(CJJ36-2016)' [33] and 'Highway Performance Assessment Standards(DB11/T1614-2019)'[34] from Chinese government, incorporating their respective calculation formulas as follows:
D R = 100 × i = 1 N w i A i / A
P C I = 100 a 0 D R a 1
where, Ai is the damage area of the pavement of the ith crack type (m2), N is the total number of damage types, and here it is taken as 4; A is the pavement area of the investigated road section (multiply the investigated road length by the effective pavement width, m2); wi is the damage weight of the pavement of the ith crack type, directly set as 1. According to the "Highway Performance Assessment Standards(DB11/T 1614-2019)"[34], a0 and a1 represent the material coefficient of the pavement, in which asphalt pavement is taken as a0=10, a1= 0.4; while concrete pavement is takes as a0=9, a1= 0.42. It is evident that higher DR leads to lower PCI value, indicating poorer pavement integrity.

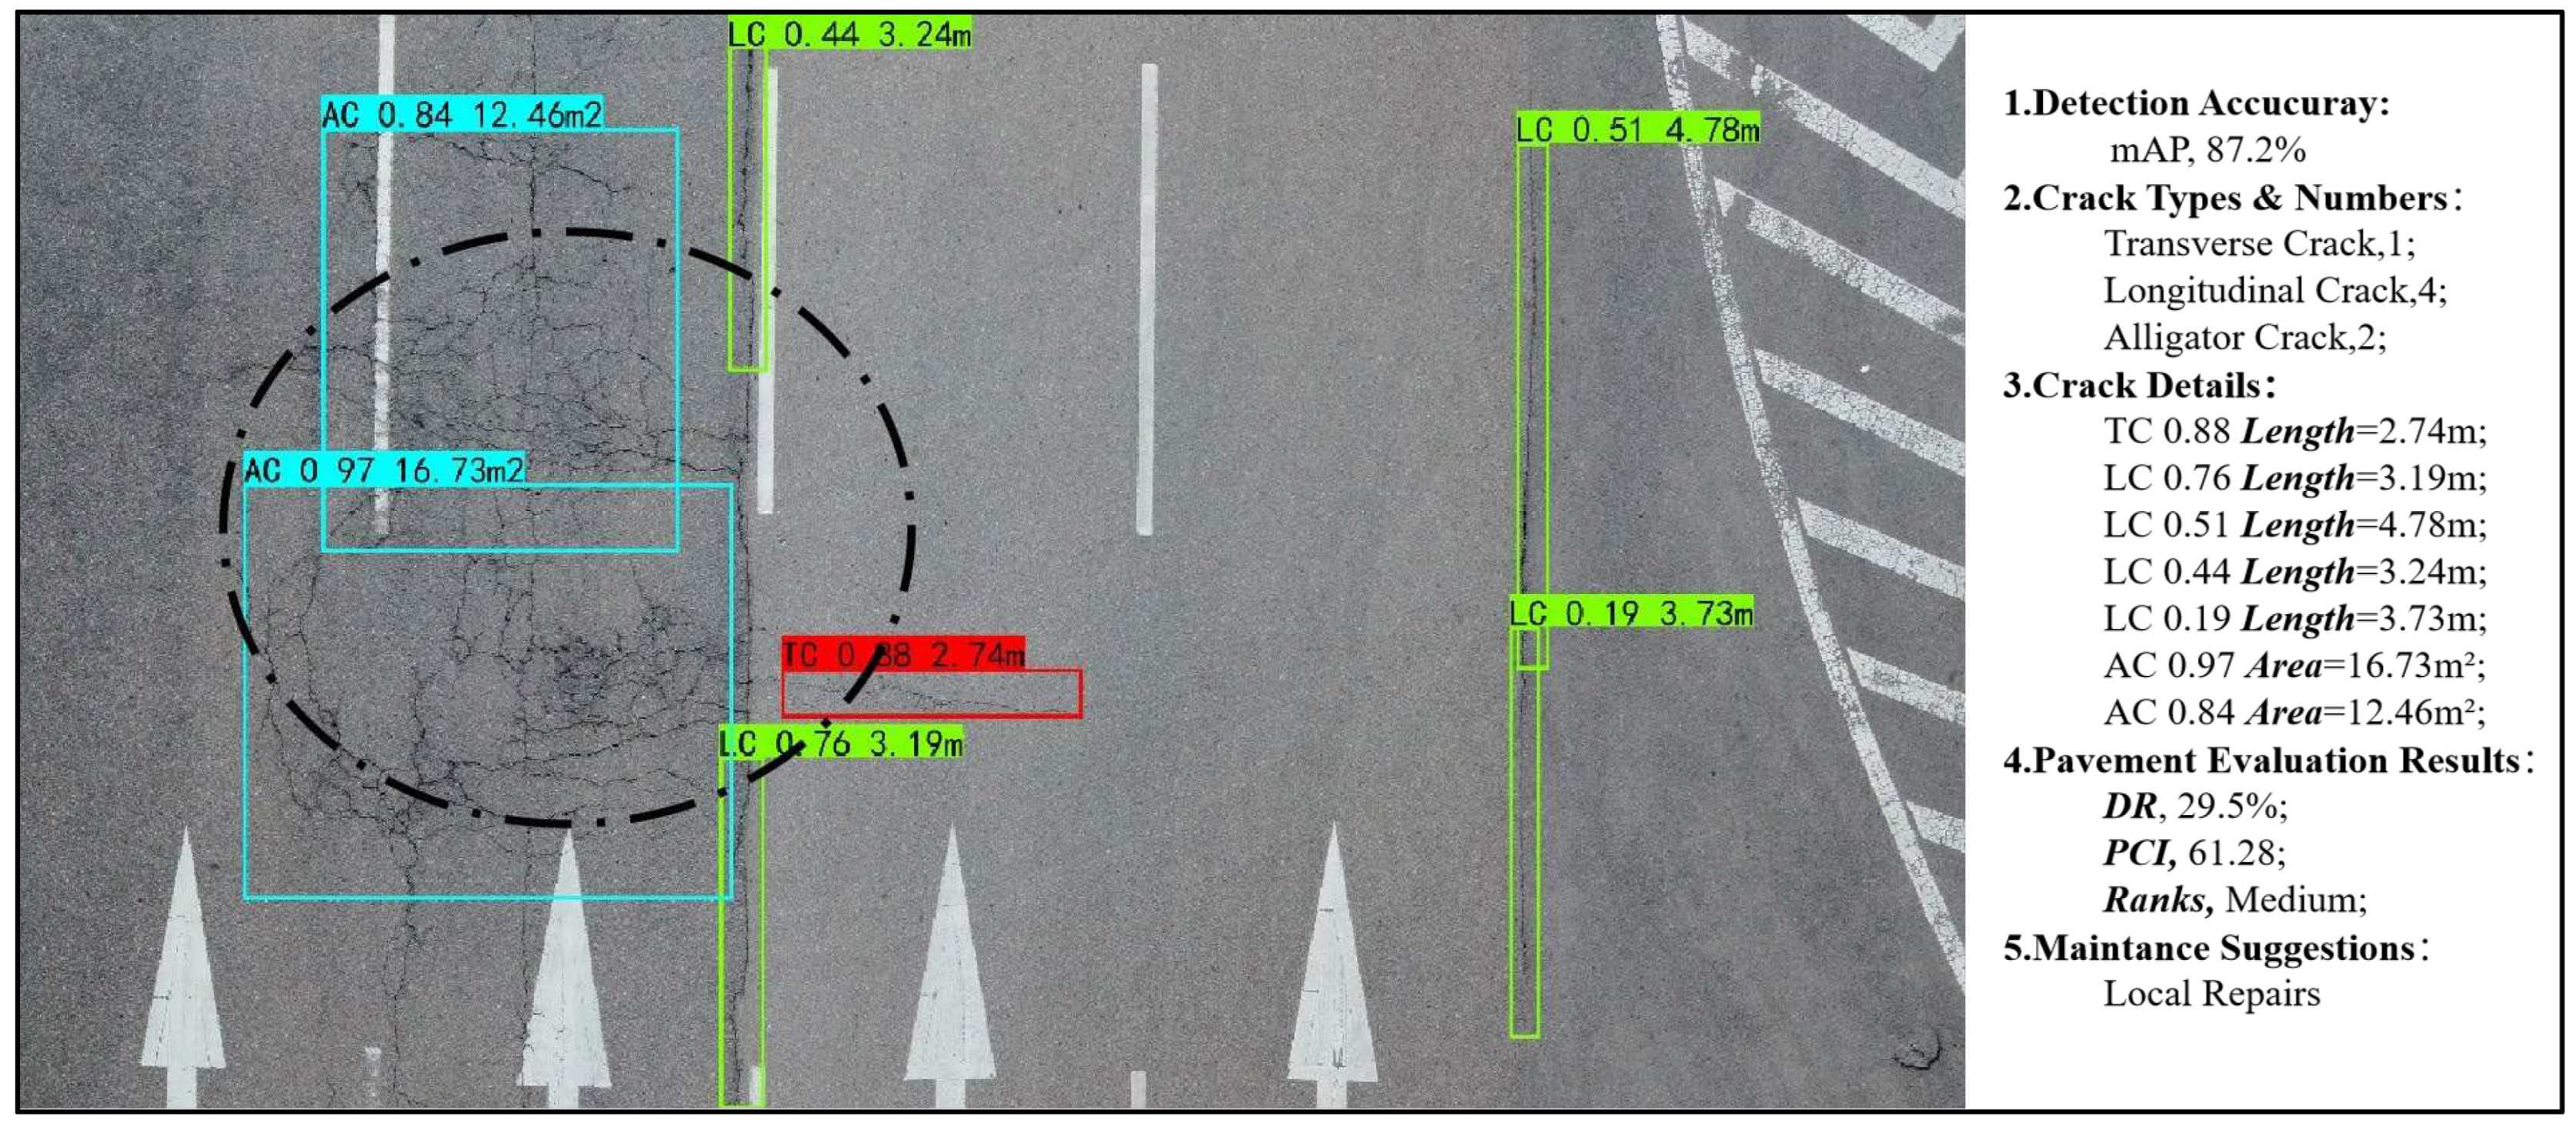
6.3. Visualization Results of Pavement Distress

The original, frame image is utilized for crack detection in this experiment, as visualized in Figure 12. On the right side, the statistical results of the four types of crack measurement are presented. This study employed the preferred Faster-RCNN trained model with an remarkable detection accuracy of 87.2%(mAP). By conducting crack measurement and statistics on a regional road section, the damage rate (DR) of 29.5% and the pavement damage index (PCI) of 61.28 are calculated, indicating a medium rating for road section integrity in this region.

7. Discussions

This study proposes a comprehensive and systematic framework and method for automatic crack detection and pavement distress evaluation in UAV inspection system. The framework begins by establishing flight parameters settings and experimental techniques to enhance the high-quality imagery using the DJI Min2 drone in real-world scenarios. Additionally, a benchmark dataset has been created and made available to the community. The dataset includes important information such as GSM, which is essential for evaluating pavement distress. In this experiment, our self-made crack dataset demonstrates its superiority compared to existing datasets used in similar algorithms, achieving the highest accuracy in crack recognition and algorithmic efficiency. The experimental result (refer to Table 6) revealed the significance of data acquisition quality in the accuracy of crack target recognition, with high-quality image data from the UAV imagery effectively improving recognition accuracy.
In this experiment, the detection capability for road crack in UAV inspection system can be enhanced through a range of strategies. Firstly, adhering to a drone flight control strategy ensures consistent high and stable speed during data acquisition on urban roads. This guarantees the collection of clear and high-quality drone images with attached real spatial scale information for distress assessment. Secondly, the sampling 'divide and conquer' strategy for model training and target detection involves various key steps, including ‘the frame extracting from video &image cropping for large image’, ‘model learning and crack detection for small images’, as well as ‘fusion and splicing from small images’. This approach effectively improves the accuracy of identifying cracks in large-scale images while enhancing the operational efficiency of these models. Thirdly, the deployment of drone detection algorithms using both 'online-offline' and 'online-online' strategies provides flexibility based on different scenarios. The 'One-stage' algorithm operates quickly but has lower detection accuracy, whereas the 'Two-stage' algorithm exhibits slower running efficiency but higher detection accuracy. These deep learning models can be deployed accordingly, depending on specific application scenarios. For instance, in sudden situations requiring fast real-time detection, the lightweight deployment using the 'two-stage' algorithm such as YOLO series models can be employed.
To propose a suitable deployment scheme for the UAV inspection system, this study utilizes prominent deep learning algorithms, namely Faster-RCNN, YOLOv5s, YOLOv7-tiny, and YOLOv8s, for pavement crack object detection and comparative analysis. The results reveal that Faster-RCNN demonstrates the best overall performance, with a precision (P) of 75.6%, a recall (R) of 76.4%, an F1 score of 75.3%, and a mean Average Precision (mAP) of 79.3%. Moreover, the mAP of Faster-RCNN surpasses that of YOLOv5s, YOLOv7-tiny, and YOLOv8s by 4.7%, 10%, and 4% respectively. This indicates that Faster-RCNN outperforms in terms of detection accuracy but requires higher environment configuration, making it suitable for online data collection using UAV and offline inspection at work stations. On the other hand, the YOLO serial models, while slightly less accurate, are the fastest algorithms and are suitable for lightweight deployment of UAV with online collection and real-time inspection. Many studies have also proposed refined YOLO-based algorithms for crack detection in drones, mainly due to their lightweight deployment in UAV system. For instance, the BL-YOLOv8 model[20] reduces both the number of parameters and computational complexity compared to the original YOLOv8 model and other YOLO serial models. This offers the potential to directly deploy the YOLO serial models on cost-effective embedded devices or mobile devices.
Finally, road crack measurement methods are presented to assess road damage, which will enhance the application of the UAV inspection system and provide factual evidence for maintenance decisions made by the road authorities.Notably, crack is a significant indicator for evaluating road distress. In this study, the evaluation results are primarily obtained through a comprehensive assessment of the crack area, degree of damage, and their proportions. However, relying solely on cracks to determine road distress may be deemed limited, and it should only be considered as a reference for relevant road authorities. Therefore, it is essential to conduct a comprehensive evaluation that takes into account multiple factors, such as rutting and potholes.

8. Conclusion

Traditional manual inspection of road cracks is inefficient, time-consuming, and labor-intensive. Additionally, using multifunctional road inspection vehicles can be expensive. However, the use of UAVs equipped with high-resolution vision sensors offers a solution. These UAVs can remotely capture and display images of the pavement from high altitudes, allowing for the identification of local damages such as cracks. The UAV inspection system, which is based on the commercial DJI Min2 drone, offers several advantages. It is cost-effective, non-contact, highly precise, and enables remote visualization. As a result, it is particularly well-suited for remote pavement detection. In addition,the automatic crack-detection technology based on deep learning models brings significant additional value to the field of road maintenance and safety. It can be integrated into the commercial UAV system, thereby reducing the workload of maintenance personnel.
In this study, the contributions are summarized as follows: (1).A pavement crack detection and evaluation framework of UAV inspection system based on deep learning has been proposed and can be provided a technical guidelines for the road authorities. (2). To enhance the automatic crack detection capability and design a suitable scheme for implementing deep learning-based models in UAV inspection system, we conducted a validation and comparative study on prevalent deep learning algorithms for detecting pavement cracks in urban road scenarios. The study demonstrates the robustness of these algorithms in terms of performance and accuracy, as well as their effectiveness in handling our customized crack image datasets and other popular crack datasets. Furthermore, this research provides recommendations for leveraging UAV in deploying these algorithms. (3).Quantitative methods for road cracks are proposed and pavement distress evaluations are also carried out in our experiment. Obviously, our final evaluation results is also guaranteed according to GSD. (4). The pavement cracks image dataset integrated with GSD has been established and made publicly available for the research community, serving as a valuable supplement to existing crack databases.
In summary, the UAV inspection system under guidance of our proposed framework has been proved to be feasible,yielding more satisfactory results.However, drone inspection has the inherent limitation of limited battery life, making it difficult to perform long-distance continuous road inspection tasks. Drones are better suited for short-distance inspections in complex urban scenarios [16]. With advancements in drone and vision computer technology, drones equipped with lightweight sensors and these lightweight crack detection algorithms are expected to gain popularity for road distress inspection. In the future, this study aims to incorporate improved YOLO algorithms into the UAV inspection system to enhance road crack recognition accuracy. Furthermore,in order to establish a comprehensive UAV inspection system for road distress, we plan to continue researching multi-category defect detection systems in the future, including various road issues such as rutting and potholes, among which are cracks. Additionally, efforts will be made to enhance UAV flight autonomy for stability and high-speed aerial photography, further improving the quality of aerial images and catering to the requirements of various complex road scenarios.
Author Contributions

Conceptualization, X.C. and C.L.; methodology, X.C. and L.C.; software, C.L. and L.C.; validation, C.L. and L.C.; formal analysis, X.C. and Y.Z.; investigation, L.C.,C.L. and Y.Z.; resources, X.C. and C.L.; data curation, C.L.,X.L.; writing—original draft preparation, X.C., C.L.,and Y.Z.; writing—review and editing, X.C. All authors have read and agreed to the published version of the manuscript.

Funding

This research was funded by China Postdoctoral Science Foundation (2017M622577), Hunan Provincial Natural Science Foundation (2018JJ2118). Chinese national college students innovation and entrepreneurship training program(S202310534031,4169).

Institutional Review Board Statement

Not applicable.

Informed Consent Statement

Not applicable.

Data Availability Statement

The data that support the findings of this study are available from the corresponding author upon reasonable request.

Acknowledgments

The authors would like to express many thanks to all the anonymous reviewers.

Conflicts of Interest

The authors declare no conflict of interest.

References

  1. Samadzadegan, F.; Dadrass Javan, F.; Hasanlou, M.; Gholamshahi, M.; Ashtari Mahini, F. Automatic Road Crack Recognition Based on Deep Learning Networks from UAV Imagery.ISPRS Ann. Photogramm. Remote Sens. Spatial Inf. Sci., X-4/W1-2022, 685–690. 2023. [CrossRef]
  2. Zhu, J.; Zhong, J.; Ma, T.; Huang, X.; Zhang, W.; Zhou, Y. Pavement distress detection using convolutional neural networks with images captured via UAV. Automation in Construction 2022, 133, 103991. [CrossRef]
  3. Cao, J; Yang, G.T; Yang, X.Y. Pavement Crack Detection with Deep Learning Based on Attention Mechanism. Journal of Computer-Aided Design & Computer Graphics 2020, 32(8):1324-1333. [CrossRef]
  4. Qi, S.; Li, G.; Chen, D.; Chai, M.; Zhou, Y.; Du, Q.; Cao, Y.; Tang, L.; Jia, H. Damage Properties of the Block-Stone Embankment in the Qinghai–Tibet Highway Using Ground-Penetrating Radar Imagery. Remote Sensing 2022, 14, 2950. [CrossRef]
  5. Guo, S.; Xu, Z.; Li, X.; Zhu, P. Detection and Characterization of Cracks in Highway Pavement with the Amplitude Variation of GPR Diffracted Waves: Insights from Forward Modeling and Field Data. Remote Sensing 2022, 14, 976. [CrossRef]
  6. Salman, M.; Mathavan, S.; Kamal, K.; Rahman, M. Pavement crack detection using the Gabor filter. In Proceedings of the 16th international IEEE conference on intelligent transportation systems (ITSC 2013), The Hague, Netherlands, 2013; pp. 2039-2044. [CrossRef]
  7. Ayenu-Prah, A.; Attoh-Okine, N. Evaluating pavement cracks with bidimensional empirical mode decomposition. EURASIP Journal on Advances in Signal Processing 2008, 1-7. [CrossRef]
  8. Majidifard, H.; Adu-Gyamfi, Y.; Buttlar, W.G.J.C.; materials, b. Deep machine learning approach to develop a new asphalt pavement condition index. Construction and building materials 2020, 247, 118513. [CrossRef]
  9. Krizhevsky, A.; Sutskever, I.; Hinton, G.E. ImageNet classification with deep convolutional neural networks. Communications of the ACM 2017, 60, 84-90. [CrossRef]
  10. Tran, V.P.; Tran, T.S.; Lee, H.J.; Kim, K.D.; Baek, J.; Nguyen, T.T. One stage detector (RetinaNet)-based crack detection for asphalt pavements considering pavement distresses and surface objects. Journal of Civil Structural Health Monitoring 2021, 11, 205-222. [CrossRef]
  11. Xiao, L.Y.; Li, W.; Yuan, B.; Cui, Y.Q.; Gao, R.; Wang, W.Q. Pavement Crack Automatic Identification Method Based on Improved Mask R-CNN Model. Geomatics and Information Science of Wuhan University 2022,47(4),623-631. [CrossRef]
  12. Xu, K.; MA, R.G. Crack detection of asphalt pavement based on improved faster RCNN. Computer Systems & Applications 2022, 31, 341-348. [CrossRef]
  13. Xu, X.; Zhao, M.; Shi, P.; Ren, R.; He, X.; Wei, X.; Yang, H. Crack detection and comparison study based on faster R-CNN and mask R-CNN. Sensors 2022, 22, 1215. [CrossRef]
  14. Yan, K.; Zhang, Z. Automated asphalt highway pavement crack detection based on deformable single shot multi-box detector under a complex environment. IEEE Access 2021, 9, 150925-150938. [CrossRef]
  15. Yokoyama, S.; Matsumoto, T. Development of an automatic detector of cracks in concrete using machine learning. Procedia engineering 2017, 171, 1250-1255. [CrossRef]
  16. Jiang, Y.T; Yan, H.T; Zhang, Y.R; Wu, K.Q; Liu, R.Y; Lin, C.Y. RDD-YOLOv5: Road Defect Detection Algorithm with Self-Attention Based on Unmanned Aerial Vehicle Inspection. Sensors 2023, 23, 8241. [CrossRef]
  17. Zhang, Y.; Zuo, Z.; Xu, X.; Wu, J.; Zhu, J.; Zhang, H.; Wang, J.; Tian, Y. Road damage detection using UAV images based on multi-level attention mechanism. Automation in Construction 2022, 144, 104613. [CrossRef]
  18. Zhou, Q.; Ding, S.; Qing, G.; Hu, J. UAV vision detection method for crane surface cracks based on Faster R-CNN and image segmentation. Journal of Civil Structural Health Monitoring 2022, 12, 845-855. [CrossRef]
  19. Xiang, X.; Hu, H.; Ding, Y.; Zheng, Y.; Wu, S.J.A.S. GC-YOLOv5s: A Lightweight Detector for UAV Road Crack Detection. Applied Sciences 2023, 13, 11030. [CrossRef]
  20. Wang, X.; Gao, H.; Jia, Z.; Li, Z. BL-YOLOv8: An Improved Road Defect Detection Model Based on YOLOv8. Sensors 2023, 23, 8361. [CrossRef]
  21. Omoebamije, O.; Omoniyi, T.M.; Musa, A.; Duna, S. An improved deep learning convolutional neural network for crack detection based on UAV images. Innovative Infrastructure Solutions 2023, 8, 236. [CrossRef]
  22. Zhao, Y.; Zhou, L.; Wang, X.; Wang, F.; Shi, G. Highway Crack Detection and Classification Using UAV Remote Sensing Images Based on CrackNet and CrackClassification. Applied Sciences 2023, 13, 7269. [CrossRef]
  23. Liu, K. Learning-based defect recognitions for autonomous uav inspections. arXiv preprint arXiv 2023, 2302.06093. arXiv:arXiv:2302.06093v1.
  24. Zou, Z.; Chen, K.; Shi, Z.; Guo, Y.; Ye, J. Object detection in 20 years: A survey. Proceedings of the IEEE 2023. arXiv:arXiv:1905.05055v3.
  25. Bubbliiiing. Faster-RCNN-PyTorch [CP].https://github.com/bubbliiiing/faster-rcnn-pytorch, 2023.
  26. UItralyics.YOLOv5[CP]. https://github.com/ultralytics/yolov5 , 2020.
  27. Wong,K.Y.YOLOv7[CP]. https://github.com/WongKinYiu/yolov7 , 2023.
  28. Ultralytics.YOLOv8[CP]. https://github.com/ultralytics/ultralytics , 2023.
  29. Ren, S.; He, K.; Girshick, R.; Sun, J. Faster r-cnn: Towards real-time object detection with region proposal networks. Advances in neural information processing systems 2015, 28. [CrossRef]
  30. Buda, M.; Maki, A.; Mazurowski, M.A. A systematic study of the class imbalance problem in convolutional neural networks. Neural networks 2018, 106, 249-259. [CrossRef]
  31. Sami, A.A.; Sakib, S.; Deb, K.; Sarker, I.H. Improved YOLOv5-Based Real-Time Road Pavement Damage Detection i-n Road Infrastructure Management. Algorithms 2023, 16, 452. [CrossRef]
  32. Faramarzi, M. Road damage detection and classification using deep neural networks (YOLOv4) with smartphone images. Available at SSRN 2020. [CrossRef]
  33. Ministry of Housing and Urban-Rural Development of the People’s Pepublic of China. Technical Code of Maintenance for Urban Road (CJJ36-2016). Available online: https://www.mohurd.gov.cn/gongkai/zhengce/zhengcefilelib/201702/20170228_231174.html. (Accessed on May 10th 2023).
  34. Ministry of Transport of the People’s Republic of China. Highway Performance Assessment Standards (JTG 5210-2018). Available online: https://xxgk.mot.gov.cn/2020/jigou/glj/202006/t20200623_3313114.html. (Accessed on May 10th 2023).
Figure 1. A framework of UAV inspection system based on deep-learning for pavement distress.
Preprints 97381 g001
Figure 2. A road map of object detection models(Modified from [23]).
Preprints 97381 g002
Figure 3. A illustration of Faster-RCNN (Modified from [28]).
Preprints 97381 g003
Figure 4. Network architecture of YOLOv5.
Preprints 97381 g004
Figure 5. Diagram of the main flight parameters(a,c modified from [16] ). (a) flight height(H); (b) ground sampling distance (GSD);(c) flight velocity(v).
Preprints 97381 g005
Figure 6. Diagram of trimming process for the large frame image.(Modified from [10]).
Preprints 97381 g006
Figure 7. Samples and distribution of the pavement crack datasets.
Preprints 97381 g007
Figure 8. Experimental Road and Scenario.
Preprints 97381 g008
Figure 9. Loss plot of the YOLOv5s model (the optimal iterations number is 200).
Preprints 97381 g009
Figure 10. Illustration of “Divide and Merge strategy” of UAV imagery for crack detection.
Preprints 97381 g010
Figure 11. Diagram of Crack Measurements.
Preprints 97381 g011
Figure 12. Visulization results of crack detection and pavement distress evaluation.
Preprints 97381 g012
Table 1. Classification and description of road cracks.
Longitudinal Crack (LC) Transverse Crack
(TC)
Oblique Crack
(OC)
Alligator Crack
(AC)
No-Cracks
(Other)
Preprints 97381 i001 Preprints 97381 i002 Preprints 97381 i003 Preprints 97381 i004 Preprints 97381 i005
Table 2. Configuration of the experimental environment.
Software Configure Matrix Versions
Operating system Windows10 Python 3.9
CPU Intel Core i5-9300H PyTorch 2.0
GPU NVIDIA GeoForce GTX 1660Ti 6G CUDA 11.8
Table 3. The results of running performance with various models.
Models Number of Parameters(×106) Training Duration(h) Memory consumption(MB) Video Memory Usage(GB) FPS(f·s-1)
Faster-RCNN 136.75 7.1 534.2 5.6 12.80
YOLO v5s 7.02 3.7 14.12 3.5 127.42
YOLO v7-tiny 6.01 3.8 12.01 1.9 82.56
YOLO v8s 11.13 3.1 21.98 3.6 125.74
Table 4. Results of overall accuracy with various models (%).
Models Precision Recall F1-score mAP
Faster-RCNN 75.6 76.4 75.3 79.3
YOLO v5s 75.1 71.0 72.6 74.0
YOLO v7-tiny 66.9 66.5 66.7 65.5
YOLO v8s 74.4 75.6 75.0 77.1
Table 5. Results of detection accuracy with various models under four crack types (%).
Models AP(%) F1-Score
TC LC AC OC TC LC AC OC
Faster-RCNN 85.7 83.4 60.2 87.8 82.3 78.0 58.1 82.9
YOLO v5s 75.5 87.4 43.8 89.1 72.3 86.5 43.5 88.0
YOLO v7-tiny 70.4 81.2 40.7 80.7 70.0 79.0 44.8 77.1
YOLO v8s 75.4 89.5 45.4 91.0 74.4 85.0 48.5 90.6
Table 6. Comparison of model valuation with various UAV cracks datasets.
Datasets Faster-RCNN YOLO v5s YOLO v7-tiny YOLO v8s
FPS
(f.s-1)
F1
(%)
mAP
(%)
FPS (f.s-1) F1
(%)
mAP
(%)
FPS (f.s-1) F1
(%)
mAP
(%)
FPS (f.s-1) F1
(%)
mAP
(%)
UAPD[2] 9.14 47.9 48.8 59.7 52.7 57.7 74.51 56.7 52.8 65.4 57.4 58.6
RDD2022[30] 11.36 69.5 68.8 63.21 65.2 60.9 65.47 63.1 65.6 53.71 66.5 67.7
UMSC[19] 11.72 73.4 68.8 97.87 68.7 74.3 76.81 63.8 70.1 89.78 72.8 70.4
UAVRoadCrack[21] 10.57 68.9 68.5 108.6 77.8 75.7 75.39 62.5 65.3 69.36 71.0 68.8
CrackForest[31] / 57.4 59.1 / 57.8 58.8 67.45 61.2 63.5 61.21 60.9 65.2
Our Datasets 12.80 75.3 79.3 127.4 72.6 74.0 82.56 66.7 65.5 125.7 75.0 77.1
Table 7. Comparison of detection results with various models.
Preprints 97381 i006
Disclaimer/Publisher’s Note: The statements, opinions and data contained in all publications are solely those of the individual author(s) and contributor(s) and not of MDPI and/or the editor(s). MDPI and/or the editor(s) disclaim responsibility for any injury to people or property resulting from any ideas, methods, instructions or products referred to in the content.
Copyright: This open access article is published under a Creative Commons CC BY 4.0 license, which permit the free download, distribution, and reuse, provided that the author and preprint are cited in any reuse.
Prerpints.org logo

Preprints.org is a free preprint server supported by MDPI in Basel, Switzerland.

Subscribe

© 2024 MDPI (Basel, Switzerland) unless otherwise stated