Submitted:
22 January 2024
Posted:
23 January 2024
You are already at the latest version
Abstract
Cuba is struggling with a growing environmental problem: the uncontrolled spread of the allochthonous weed species marabou (Dichrostachys cinerea) throughout the country. Over the last 70 years, marabou has become a formidable invasive species that poses a threat to Cuban biodiversity and agricultural productivity. In this paper, we present a free and affordable method for regularly mapping the spatial distribution of the marabou based on the Google Earth Engine platform and ecological surveys. To test its accuracy, we develop an 18-year analysis (2000–2018) of marabou dynamics using the Valle de los Ingenios, a Cuban UNESCO World Heritage Site, as an experimental model. Our spatial analysis reveals clear patterns of marabou distribution and highlights areas of concentrated growth. Temporal trends illustrate the dynamic nature of the species, identifying periods of expansion and decline. In addition, our system is able to detect specific, large-scale human interventions against the marabou plague in the area. The results highlight the urgent need for remedial strategies to maintain the fragile balance in the region.
Keywords:
Google Earth Engine (GEE)
; invasive species
; phenology
; Landsat 8
; marabou
1. Introduction
The global landscape is constantly being shaped by the interplay of various ecological forces, with the invasion of alien species standing out as a powerful agent of change. In this intricate ecological web, allochthonous invasive weed species have proven to be particularly resilient actors that significantly impact sensitive ecosystems.
According to the European Commission's definition of invasive weeds from Regulation (EU) No. 1143/2014, invasive plant species are those that, once introduced or spread, threaten or negatively impact biodiversity and certain ecosystem services. In recent decades, invasive weeds have severely threatened local biodiversity, ecosystem services, environmental quality and human health [1]. The United Nations (UN) Intergovernmental Platform on Biodiversity and Ecosystem Services (IPBES) estimates that about one-fifth of the Earth’s surface, including global biodiversity hotspots, is threatened by biotic invaders. This means that 60% of global species extinctions have been caused by invasive alien species alone or in combination with other causes, at an annual cost of 423 billion USD [2].
Several hypotheses have been proposed to explain the invasion of invasive weeds into new habitats, such as the release of enemies, new weapons and empty niches. However, not every hypothesis is sufficient to explain the invasion of these species [3]. The enemy release hypothesis states that some invasive weeds are more successful in new habitats when they are kept away from natural enemies such as pathogens and herbivores found in their original habitats, which is the case for marabou [4]. Furthermore, the functioning of ecosystems on islands such as Cuba is more affected by invasive weeds than on the mainland [5].
Various invasive plants introduced for the benefit of humans are known to cause ecological and economic damage as they compete for nutrients, light and water [6] and cause significant losses in agriculture and livestock as they increase the costs of their effective management [7]. Their impact is not only economic, as many of these weeds are known to impair ecosystem services such as aesthetics, recreation, culture and regulation [8]. Invasive weeds also affect regulating ecosystem services such as hazard mitigation (e.g. landslides), water purification, pest control, pollination and climate change, which are inextricably linked to agriculture and forestry [8,9].
Eradicating an invasive weed species is a complex process that usually requires extensive resources and long-term monitoring of invasive plant dynamics. Eradication of weeds is often limited at the local level due to various constraints, such as the removal of weeds that spread over large areas. In this context, the regeneration capacity of important perennial weeds such as marabou is also a limiting factor, requiring additional and repeated treatments [10]. Given the negative impact of many invasive weeds, there is an urgent need to prioritize and develop cost-effective and ecologically sound strategies to control them [11].
Marabou (Dichrostachys cinerea L. Wight & Arn.), a shrub or small tree with twisted trunks, grayish bark and smooth spines on the lateral branches, reaches a height of 4 to 5 meters, even up to 10 meters on suitable soils. It was first introduced to Cuba a century and a half ago. However, it was only in the second half of the 20th century that this seemingly harmless plant developed into a major ecological problem. Its high stress tolerance combined with its numerous thorns and resistance to cutting and burning contributed to its uncontrolled spread. Other reasons for the uncontrolled spread of the marabou plant are the dispersal of its seeds by livestock and the high persistence of these seeds in the soil. In addition, the plant reproduces by root buds and has the remarkable ability to produce shoots even when it is not completely eradicated. The collective impact of these traits is the abandonment of land where marabou occurs, as farmers struggle with the physical and economic challenges associated with eradicating the plant. As a result, this weed has spread massively throughout Cuba, particularly in areas already contaminated by overexploitation and abandoned farmland [12].
The Valle de los Ingenios, a UNESCO World Heritage Site, is witness to the ecological consequences of the uncontrolled spread of the marabou plant. The Valle de los Ingenios is a series of three interconnected valleys located about 12 km outside the city of Trinidad and covering an area of 270 km². These valleys — San Luis, Santa Rosa and Meyer — were a center of sugar production from the late 18th to the late 19th century. At the height of the Cuban sugar industry, more than fifty sugar cane mills were in operation in the three valleys, employing over 30,000 slaves. When the valley was declared a UNESCO World Heritage Site in 1988, it was home to dilapidated sugar mills, summer houses, slave barracks and other facilities associated with sugar cane cultivation, as well as active sugar cane plantations. However, the unstoppable advance of the invasive weed marabou has left an indelible mark on this historically and culturally significant landscape [13].
Given the enormous challenge of field assessment, as it's almost impossible to reach the marabou thicket amidst the ubiquitous bush with its many long, hard thorns, remote sensing techniques have proven to be important tools. These techniques play a crucial role in identifying and classifying the weed in various regions of Cuba, including the Valle de los Ingenios [14,15]. Remote sensing, a pivotal component of our study, leverages advanced aerospace technology and geospatial data analysis to monitor vegetation cover through satellite imagery [16,17]. Image processing techniques, such as digital classification, play a critical role in extracting information from satellite images based on digital layers (DL) or reflectance. This process involves grouping pixels based on their values and associating them with specific land cover types to generate detailed maps and directories [18]. Digital image classification, a form of pattern recognition, uses surface features to recognize patterns associated with the location of each pixel [19,20]. Two different classification methods, supervised and unsupervised, depend on how the training statistics are obtained [19]. In the supervised classification approach used here, the process is driven by terrain-specific prior knowledge. Users delineate representative areas for each category of interest, and the pixels within these areas are used to assign the remaining pixels to categories based on the similarity of their reflectance or DL values. The input data can come from field studies, photo interpretations, articles or maps of the area of interest [19]. As described by Hasmadi et al [21], the process of digital image classification involves three phases: (i) the training phase, in which the categories of interest are digitally defined; (ii) the mapping phase, in which the image pixels are grouped into categories; and (iii) the testing phase, in which the results are verified. In these terms, remote sensing, especially when integrated across different spatial and temporal scales, has the potential to shed light on the dynamics of invasions and reveal their drivers, which can improve the efficiency of control measures [22].
These remote monitoring techniques are of particular interest for agricultural cooperation/development projects in developing countries, such as Cuba. In these countries, access to the desired areas is not always possible or granted; therefore, low-cost, regular remote monitoring would be an invaluable tool for both international cooperation agencies and local authorities [23]. Unfortunately, neither access to regular, expensive, high-resolution satellite imagery required for such consistent analysis nor expensive GIS software licenses are always available or affordable for local authorities, thus hampering the desired technology transfer between international agencies and local institutions. As a starting point for various scientific and agronomic analysis the quantitative description of spatial patterns of plant species [24] has improved and accelerated in recent years with the development of new geographic information technologies, such as remote sensing [25,26]. These technologies, using medium and high resolution satellite imagery, have already shown the ability to map global forest associations or similar detailed floristic contexts [27,28]. The development of an analytical tool capable of remotely quantifying the degree of marabou infestation in large areas, using free cloud-based geospatial analysis platforms and satellite imagery, would be of great interest for assessing the problem of marabou infestation development in Cuba. To achieve this goal, the Google Earth Engine (GEE) is used in this study. GEE is a cloud-based platform that serves as a repository for various data sets from different satellites and platforms. GEE offers the advantage that no satellite images need to be downloaded and the algorithms can be applied directly to the products stored on the servers. This not only increases processing speed, but also facilitates the development of applications with scalable analysis capabilities in both space and time. In addition, GEE is a free service that can be run on not very demanding computers with a medium-speed Internet connection.
The process of image analysis includes the creation of a classifier based on field data from 2014. This classifier, developed with the Google Earth Engine, serves as the basis for the assessment of marabou populations in subsequent years. The methodology involves the creation of composite images that are representative of each year and combine the mean values of each valid pixel across the year. This approach, combined with the use of Landsat imagery directly corrected for surface reflectance (USGS Level 2-A product) and Fmask to detect clouds and cloud shadows, ensures the reliability of the results. To further improve the analysis, the study introduces a temporal filter to distinguish between perennial vegetation, such as marabou, and seasonal vegetation. By isolating marabou from the broader vegetation context, the study aims to provide a nuanced understanding of its distribution patterns over the years. The classification algorithm, trained on the 2014 field data, incorporates machine learning techniques to optimize accuracy and reliability.
The analysis of images from the Valle de los Ingenios over a period from 2000 to 2018 therefore provides an excellent experimental model to test the accuracy of this new tool, as two huge human-triggered milestones related to the marabou plague in this area are well documented and can be used as benchmarks. In the future, this new tool will provide farmers, agronomists, and local authorities with a comprehensive overview of the evolution of marabou infestations throughout the valley over the years by comprehensively examining the spatial and temporal patterns of marabou distribution in Valle de los Ingenios.
The aim of this study is to provide a comprehensive, economically affordable tool to analyze the spatial and temporal distribution of the marabou in this region. Both analytical and spatial approaches will be used to understand the dynamics of its invasion and provide valuable insights to both scientists and land managers concerned with the consequences of invasive species in unique and culturally significant landscapes.
2. Materials and Methods
2.1. Study Area
The experimental model for this study is the Valle de los Ingenios, which is located in the province of Sancti Spíritus, Cuba, and covers an area of approximately 250 km². This region, a UNESCO World Heritage Site since 1988, together with the city of Trinidad, faces significant ecological challenges due to the invasive marabou plant (Dichrostachys cinerea). In addition, the area has been affected by two major human interventions in the last 20 years that have severely impacted the spread of the marabou plant in the area. One intervention was the abandonment of sugarcane processing in the valley, which began in 2002 and ended in 2005 with the closure of Central FNTA, the last sugar factory in the area [29]. This led to both a significant decline in agricultural activities and an increase in abandoned agricultural land. The other milestone was the clearing of large marabou-infested areas in the valley with heavy machinery by the national government in 2014-2015 [30]. These two well-known, time-limited human interventions served as benchmarks to ensure the accuracy of our methods.
The precise delineation of the Valle de los Ingenios was initially challenging due to the lack of accurate cartographic data. Initially, efforts were made on the GDAM servers to delineate the Sancti Spiritus region, but this approach proved untenable as it included coastal and mountainous areas beyond the intended scope [31]. As a result, the University of Sancti Spiritus (Cuba) provided images that were crucial to the study, albeit less detailed and to scale (Figure 1). These images were georeferenced and played a crucial role in the precise delineation of the valley. In the search for an optimal boundary, a systematic assessment of different elevation levels was carried out: 80 m, 100 m and 120 m. The aim was to determine the most suitable altitude for the demarcation at hand. The main objective of this study was to determine the altitude that would allow the most accurate and meaningful delimitation of the identified valley boundaries.
2.2. Methodology
2.2.1. Data Source
Satellite images and image processing: A comprehensive dataset of Landsat 5, Landsat 7 and Landsat 8 satellite images from the period 2000 to 2018 was used for the study. The images with a spatial resolution of 30 m were carefully curated using the Google Earth Engine (GEE) platform. It is important to take into account the operating times of the satellites: Landsat 5 (TM) was active from March 1984 to January 2013, Landsat 7 (ETM+) from April 1999 to the present, and Landsat 8 (OLI) from February 2013 to the present. Despite the advantages offered by the Landsat family, challenges have arisen due to missing data and gaps caused by sensor failures. For example, Landsat 7's ETM+ sensor has provided images with missing data in the form of intermittent bands since June 2003, making analysis difficult. However, by combining data from different sensors, the temporal resolution could be increased to 7 days, allowing a more detailed understanding of Marabu's annual cycle. In this study, the optical bands of the electromagnetic spectrum played a crucial role in the analysis. Specifically, bands 1, 2, 3, 4, 5 and 7 of the Thematic Mapper (TM) and Enhanced Thematic Mapper Plus (ETM+) sensors and bands 2, 3, 4, 5, 6 and 7 of the Operational Land Imager (OLI) sensor were used [32]. In addition, three bands relating to the temporal development of the Normalized Vegetation Index (NDVI) will be considered in more detail later.
2.2.2. Data Preprocessing
Satellite imagery and data preprocessing: Landsat imagery was used directly in its surface-reflective form, in particular the USGS Level 2-A product. This approach was complemented by an atmospheric correction using the MODTRAN model to ensure an accurate radiometric calibration. In addition, a cloud and cloud shadow mask created using Fmask [33] proved helpful in overcoming the challenges associated with heavy cloud cover in regions such as Cuba. Given the dynamic nature of cloud-covered areas, of the 23 possible images resulting from the combination of Landsat observations, only about 6 or 7 valid images could be obtained per year. This complexity was further increased by variations in the valid zones at different times.
2.2.3. Harmonic Curve Development
The harmonic curve method uses a mathematical model to represent the variation of NDVI values over time [34]. The model can be expressed as follows:
where NDVI is the normalized difference vegetation index, A is the amplitude, B is the phase, φ is the mean value and f is the frequency. The frequency indicates the number of cycles per year, which varies according to vegetation type and location.
NDVI = A + B * cos(2πft + φ)
The first step in developing the harmonic curve was to calculate the mean values for each pixel per cycle. This was done on a grid with three bands representing the parameters of the harmonic NDVI curve: Phase, Amplitude and Mean. The calculation was performed by interpolation using the Google Earth Engine (GEE) platform, which ensured the accuracy of the temporal dynamics representation. In addition, the NDVI was calculated for each scene, which provides important information about the state and dynamics of the vegetation. To improve data quality and reliability, a NoData filter was applied to systematically remove invalid pixels and artifacts from the dataset.
Harmonic curve integration: In addition, the harmonic curve method involved extracting the phase, amplitude and mean of the annual NDVI curve for each pixel using GEE. These parameters served as concise representations of the NDVI curve features for each cycle. The three parameters of the harmonic NDVI curve were integrated into a grid together with the median values of the individual Landsat bands. This integration resulted in a composite image with a total of nine bands for each cycle, providing a comprehensive data set for further analysis. This combined approach ensured a robust representation of the evolution of the harmonic curve and combined the strengths of mathematical modeling and remote sensing techniques. The integration of these techniques formed a coherent methodology for obtaining meaningful information on vegetation dynamics over time in the Valle de los Ingenios.
2.2.4. Field Data
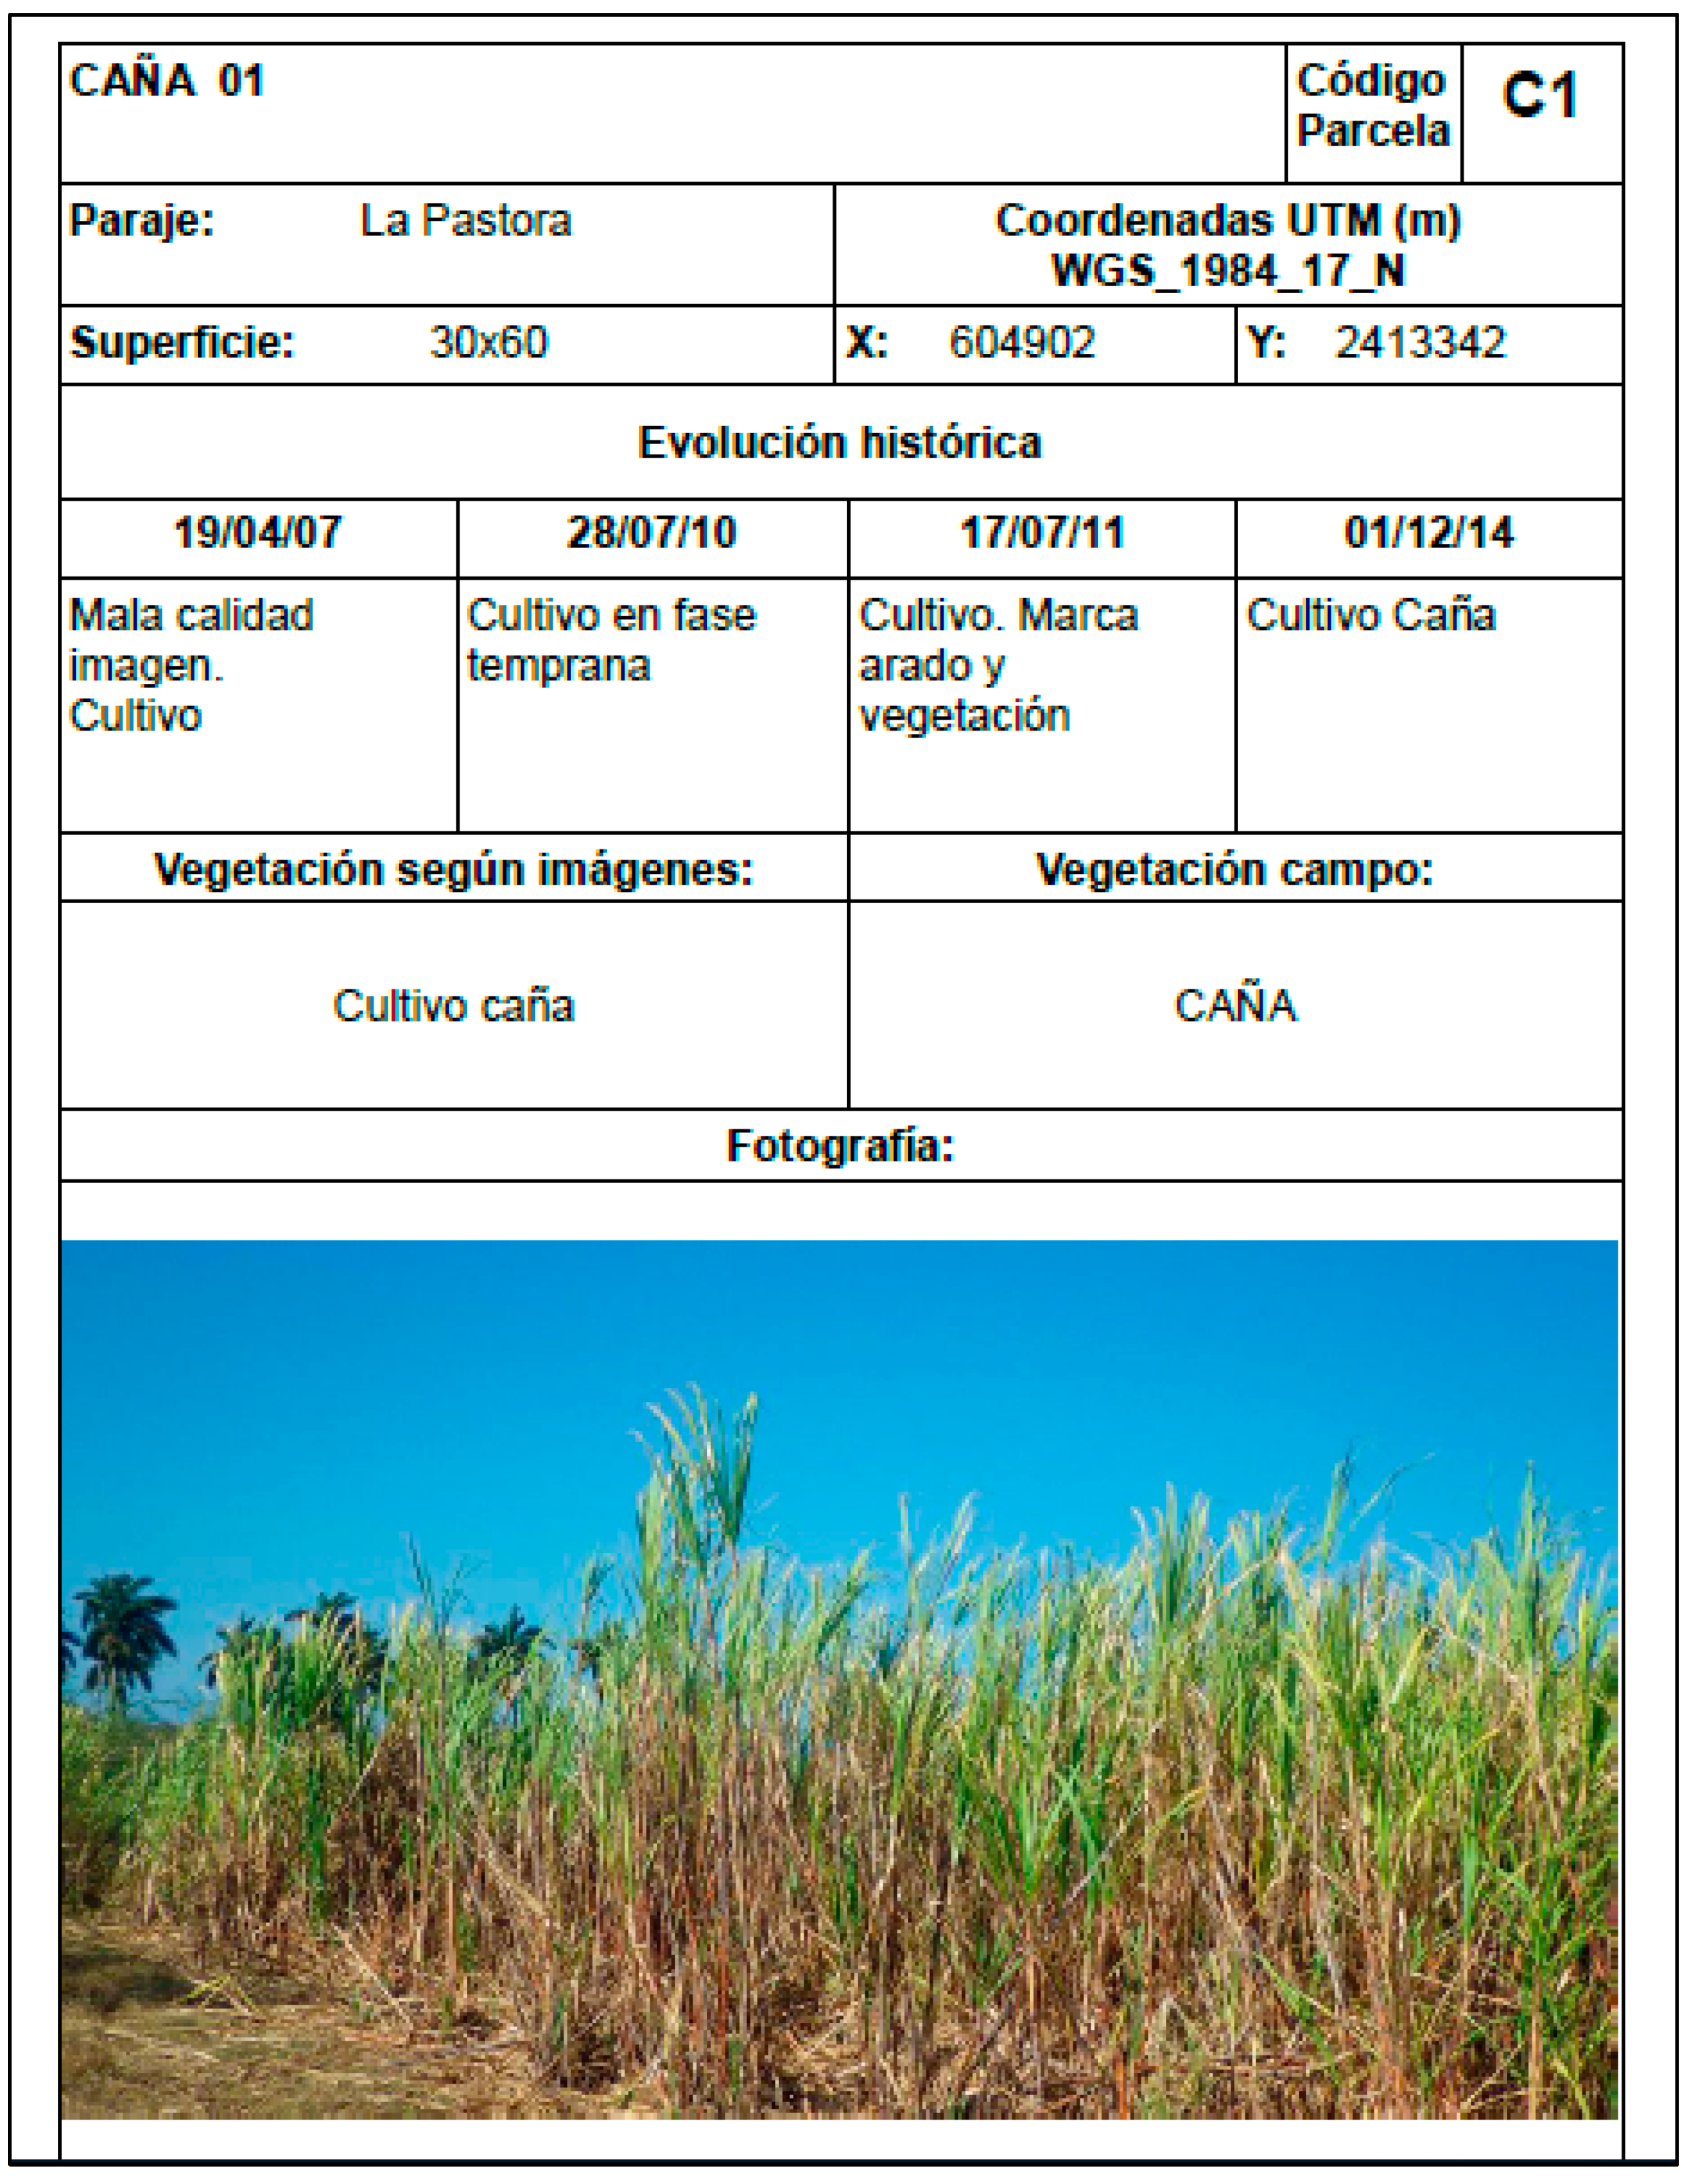
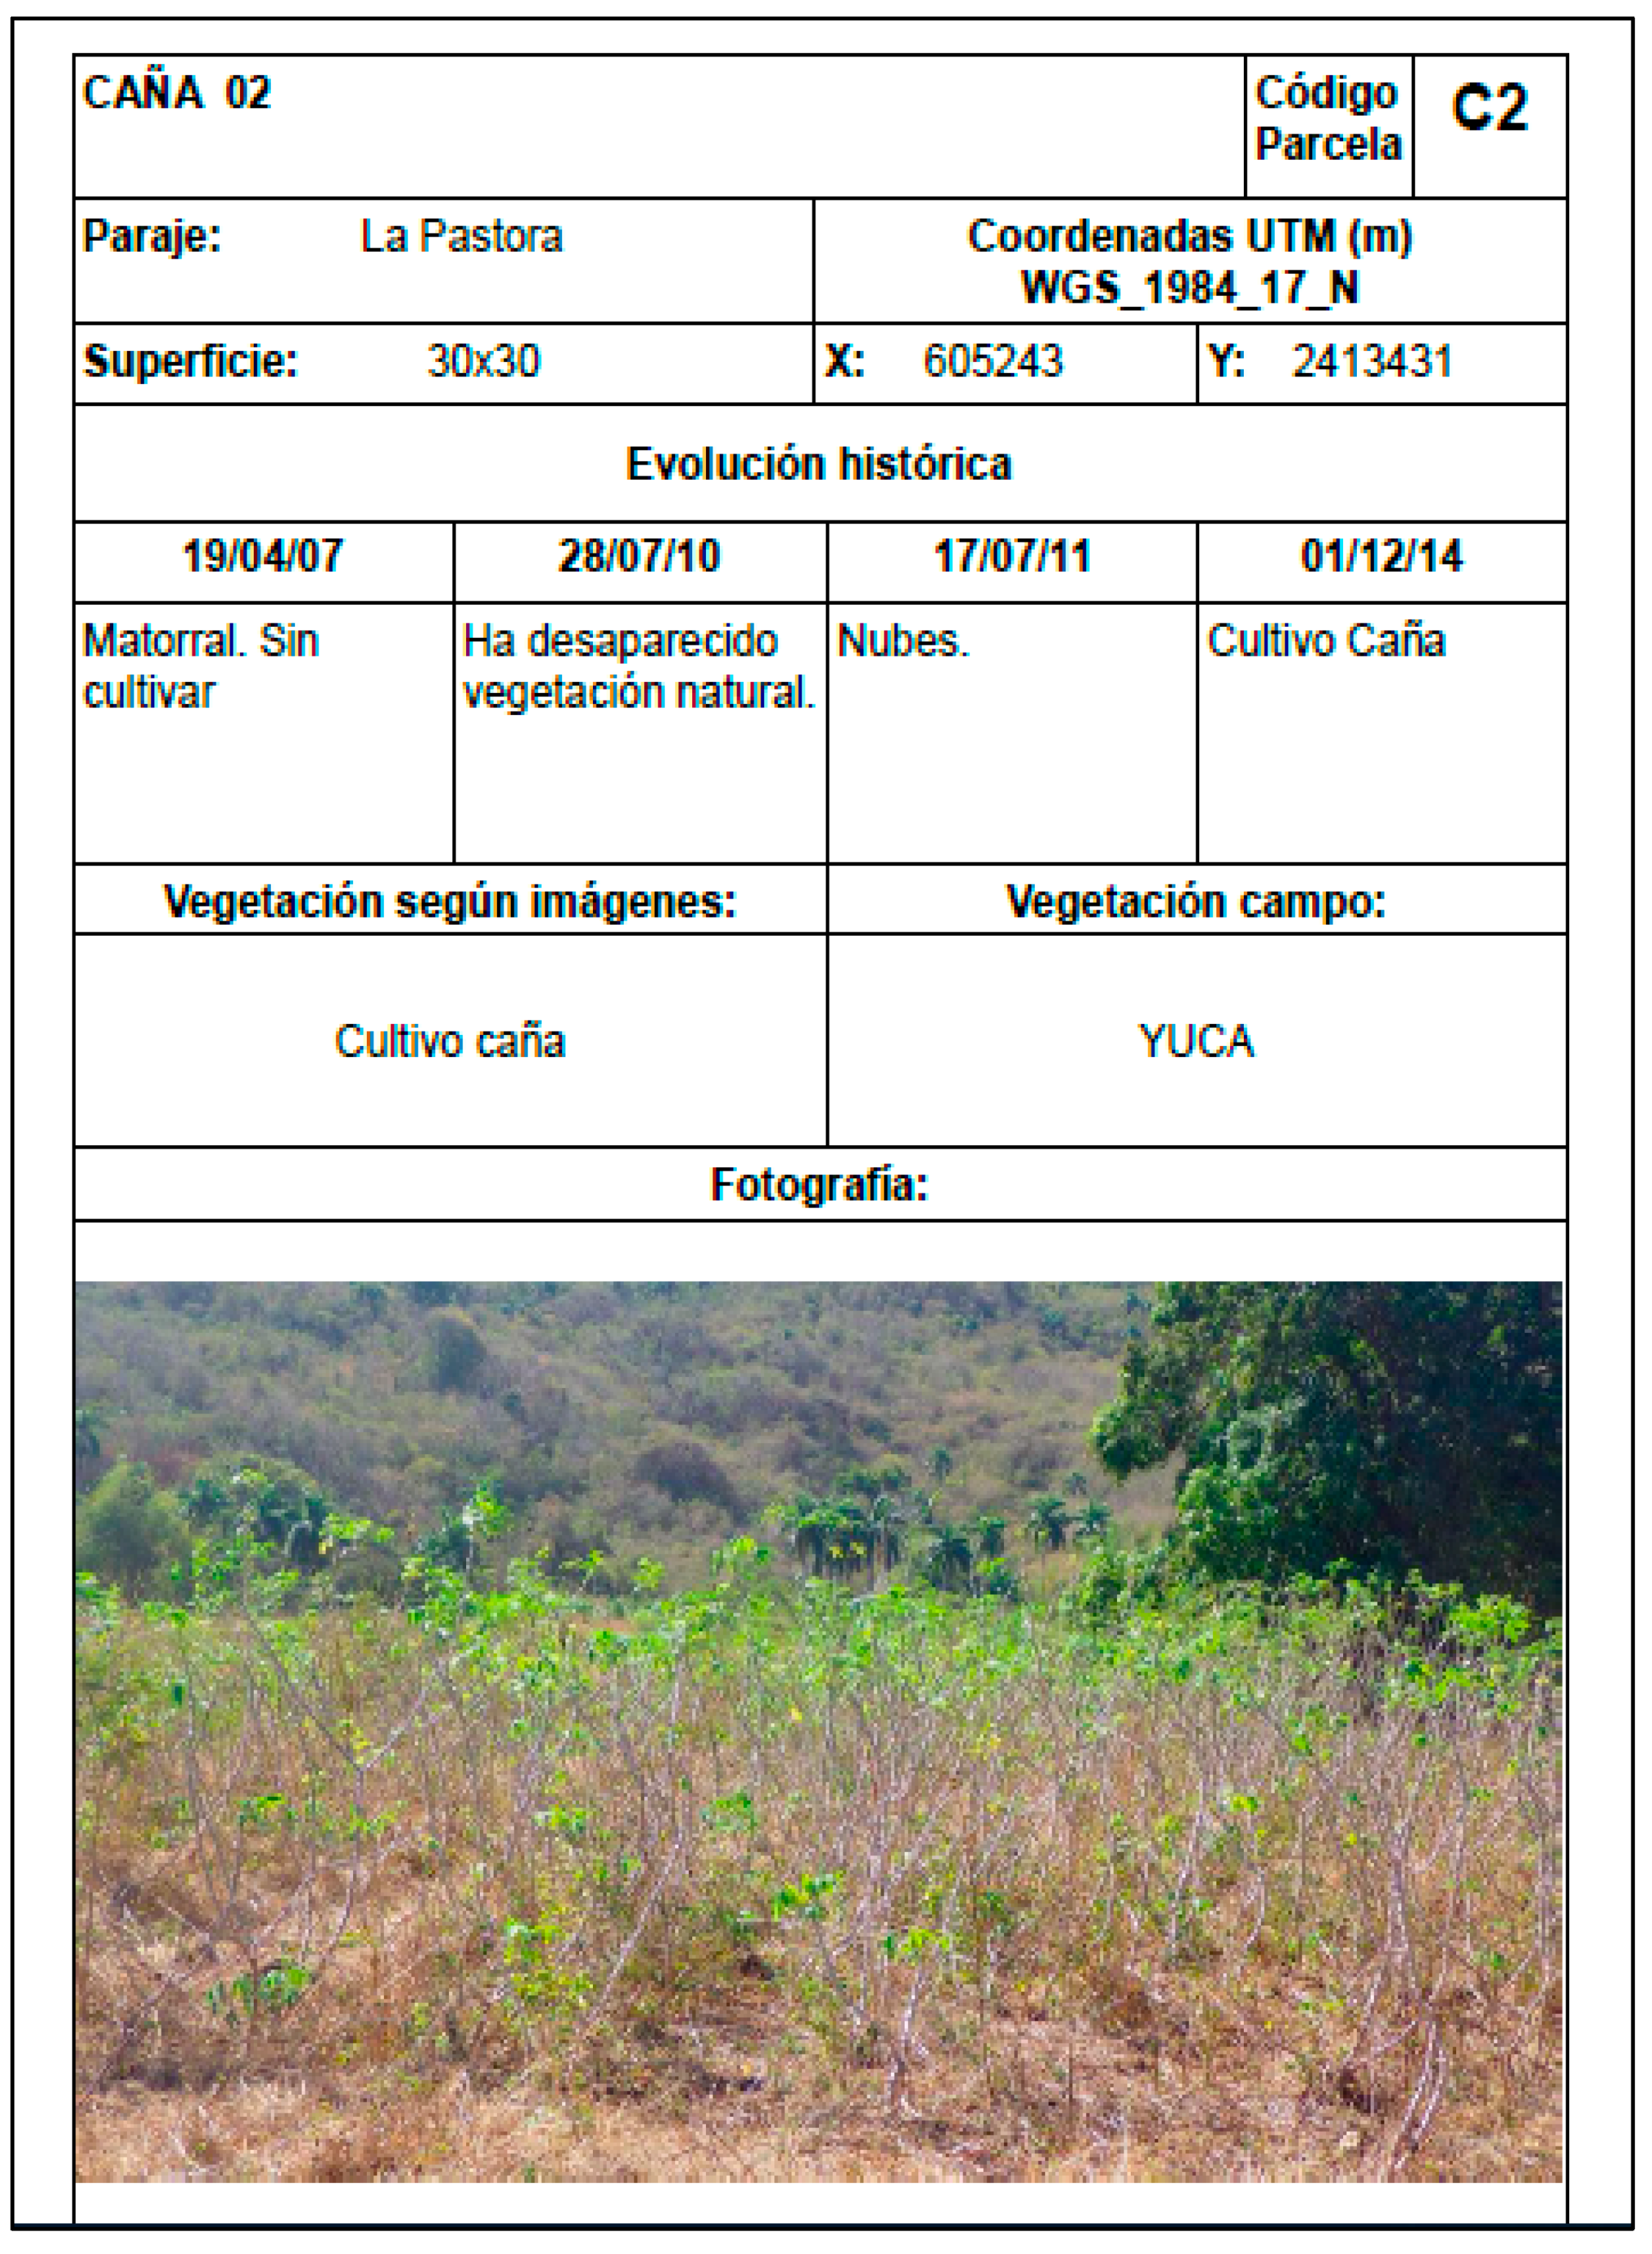
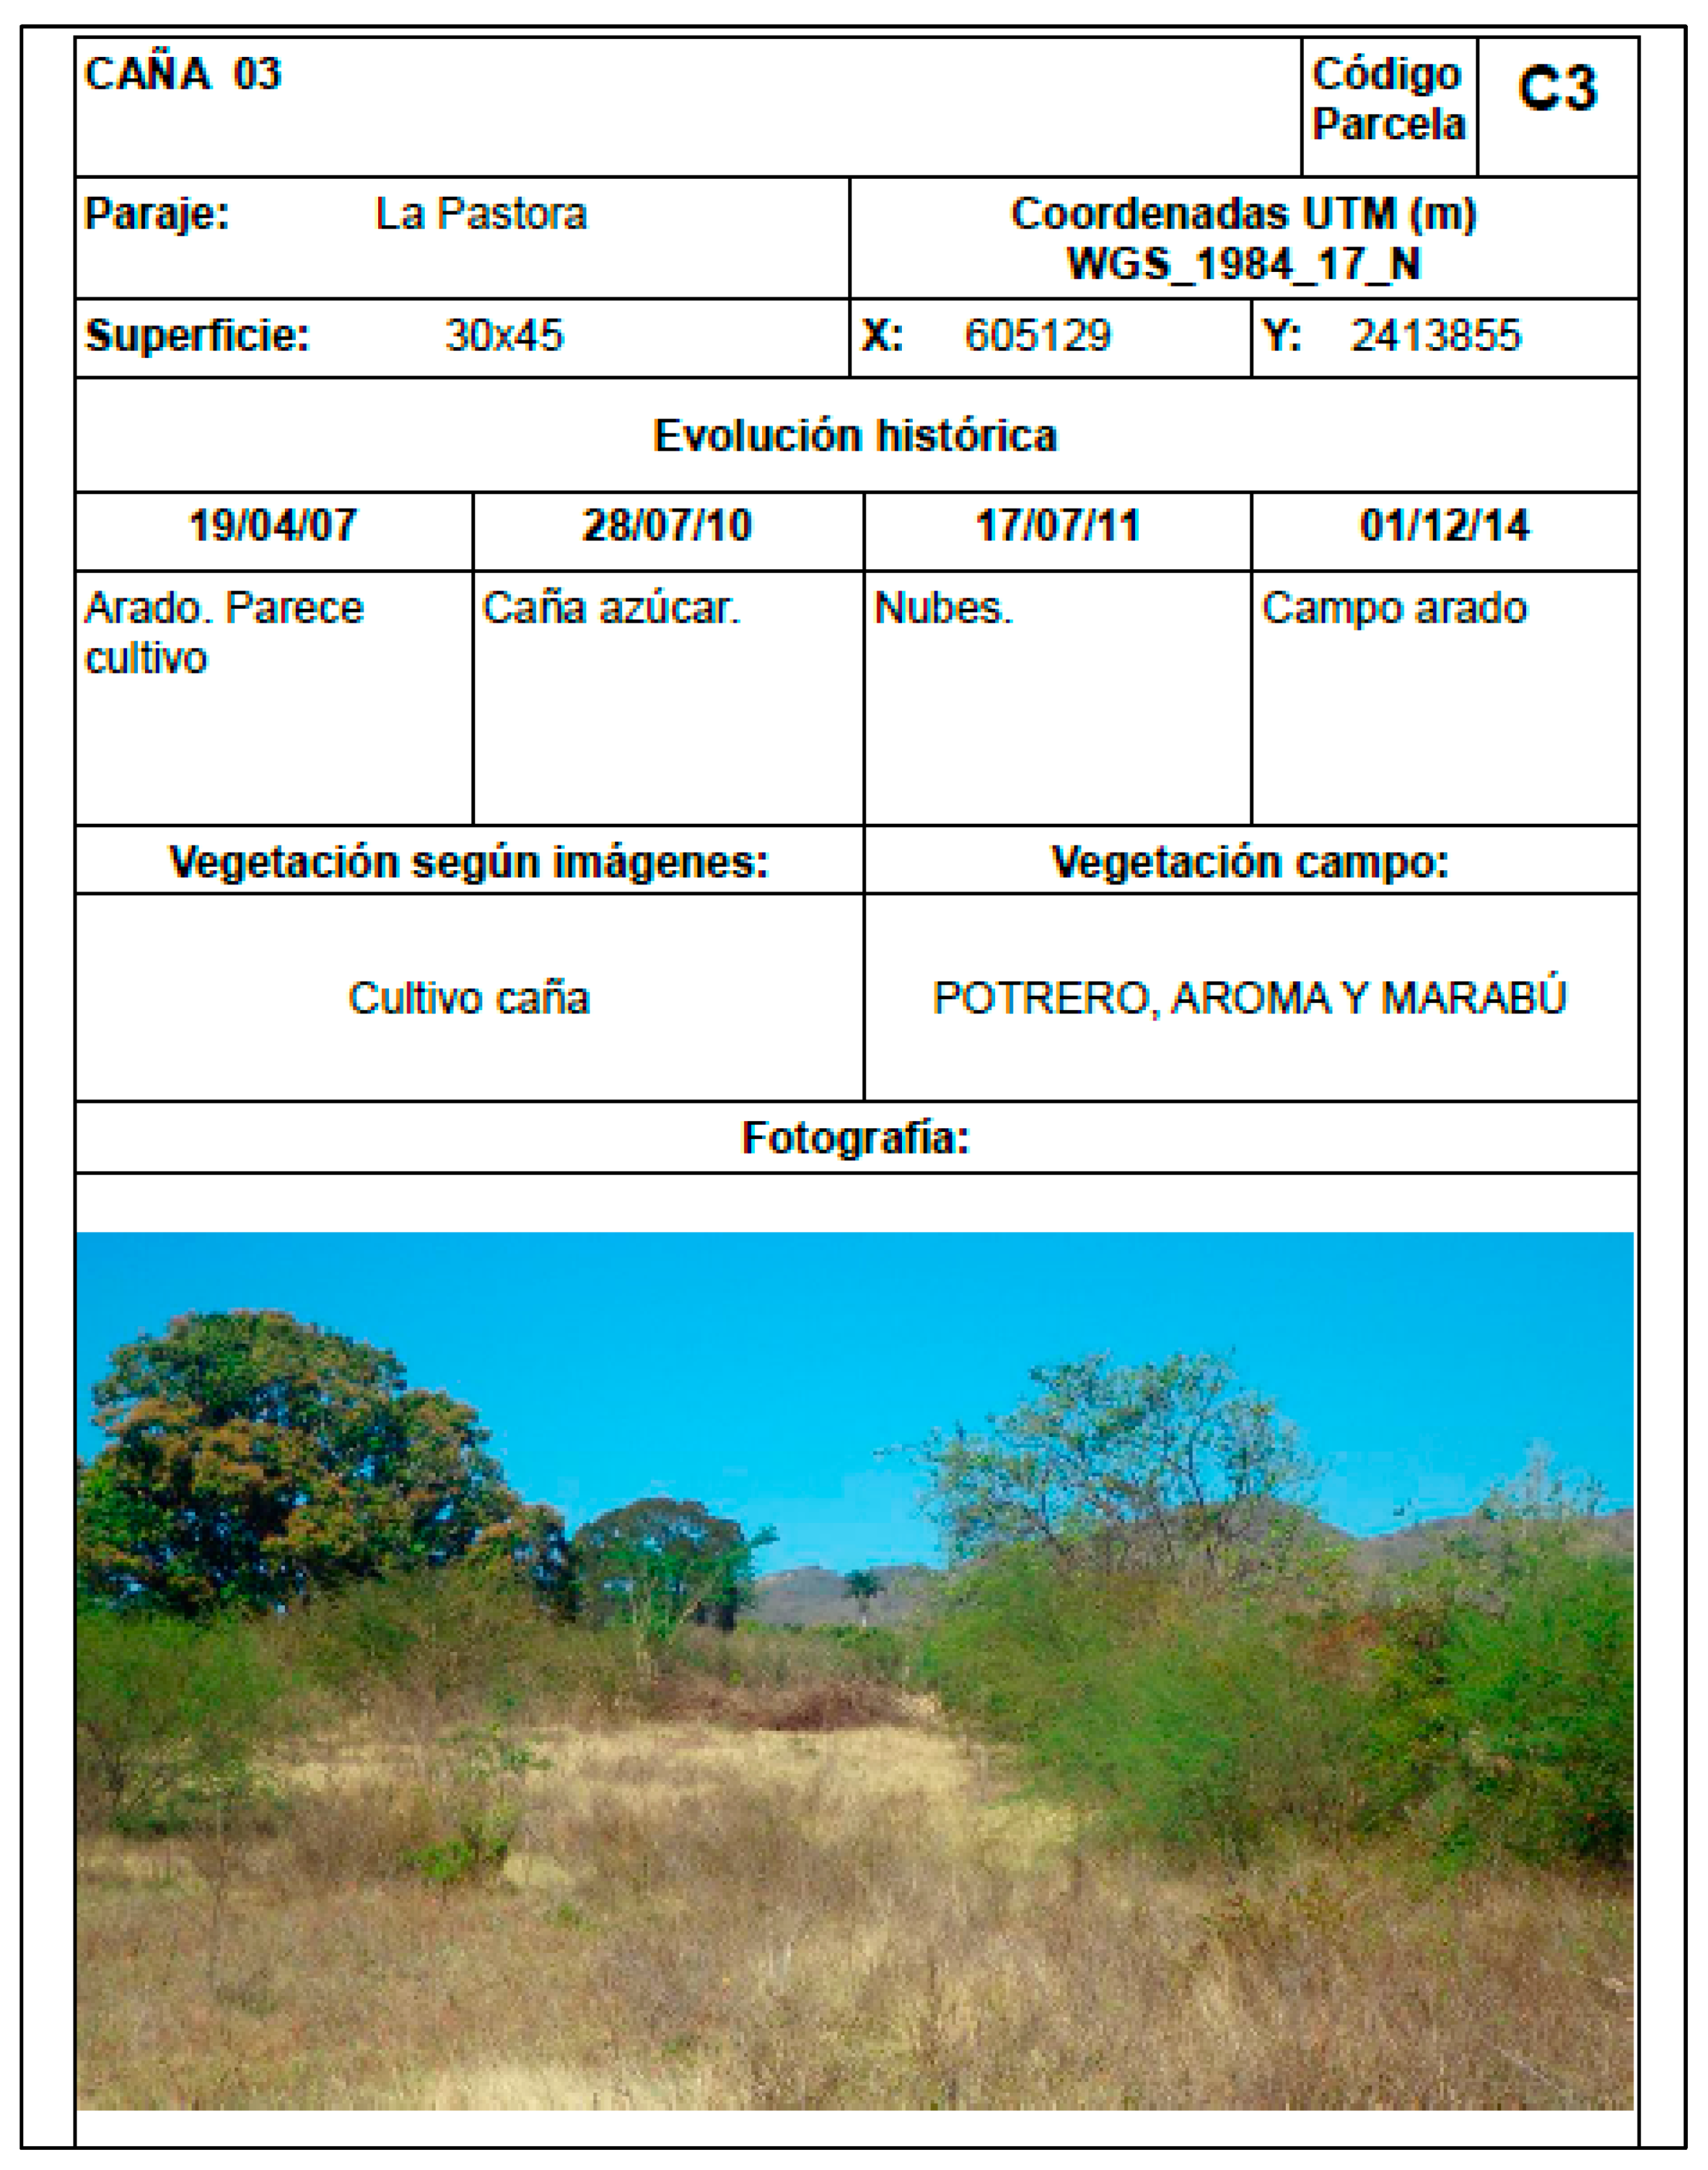
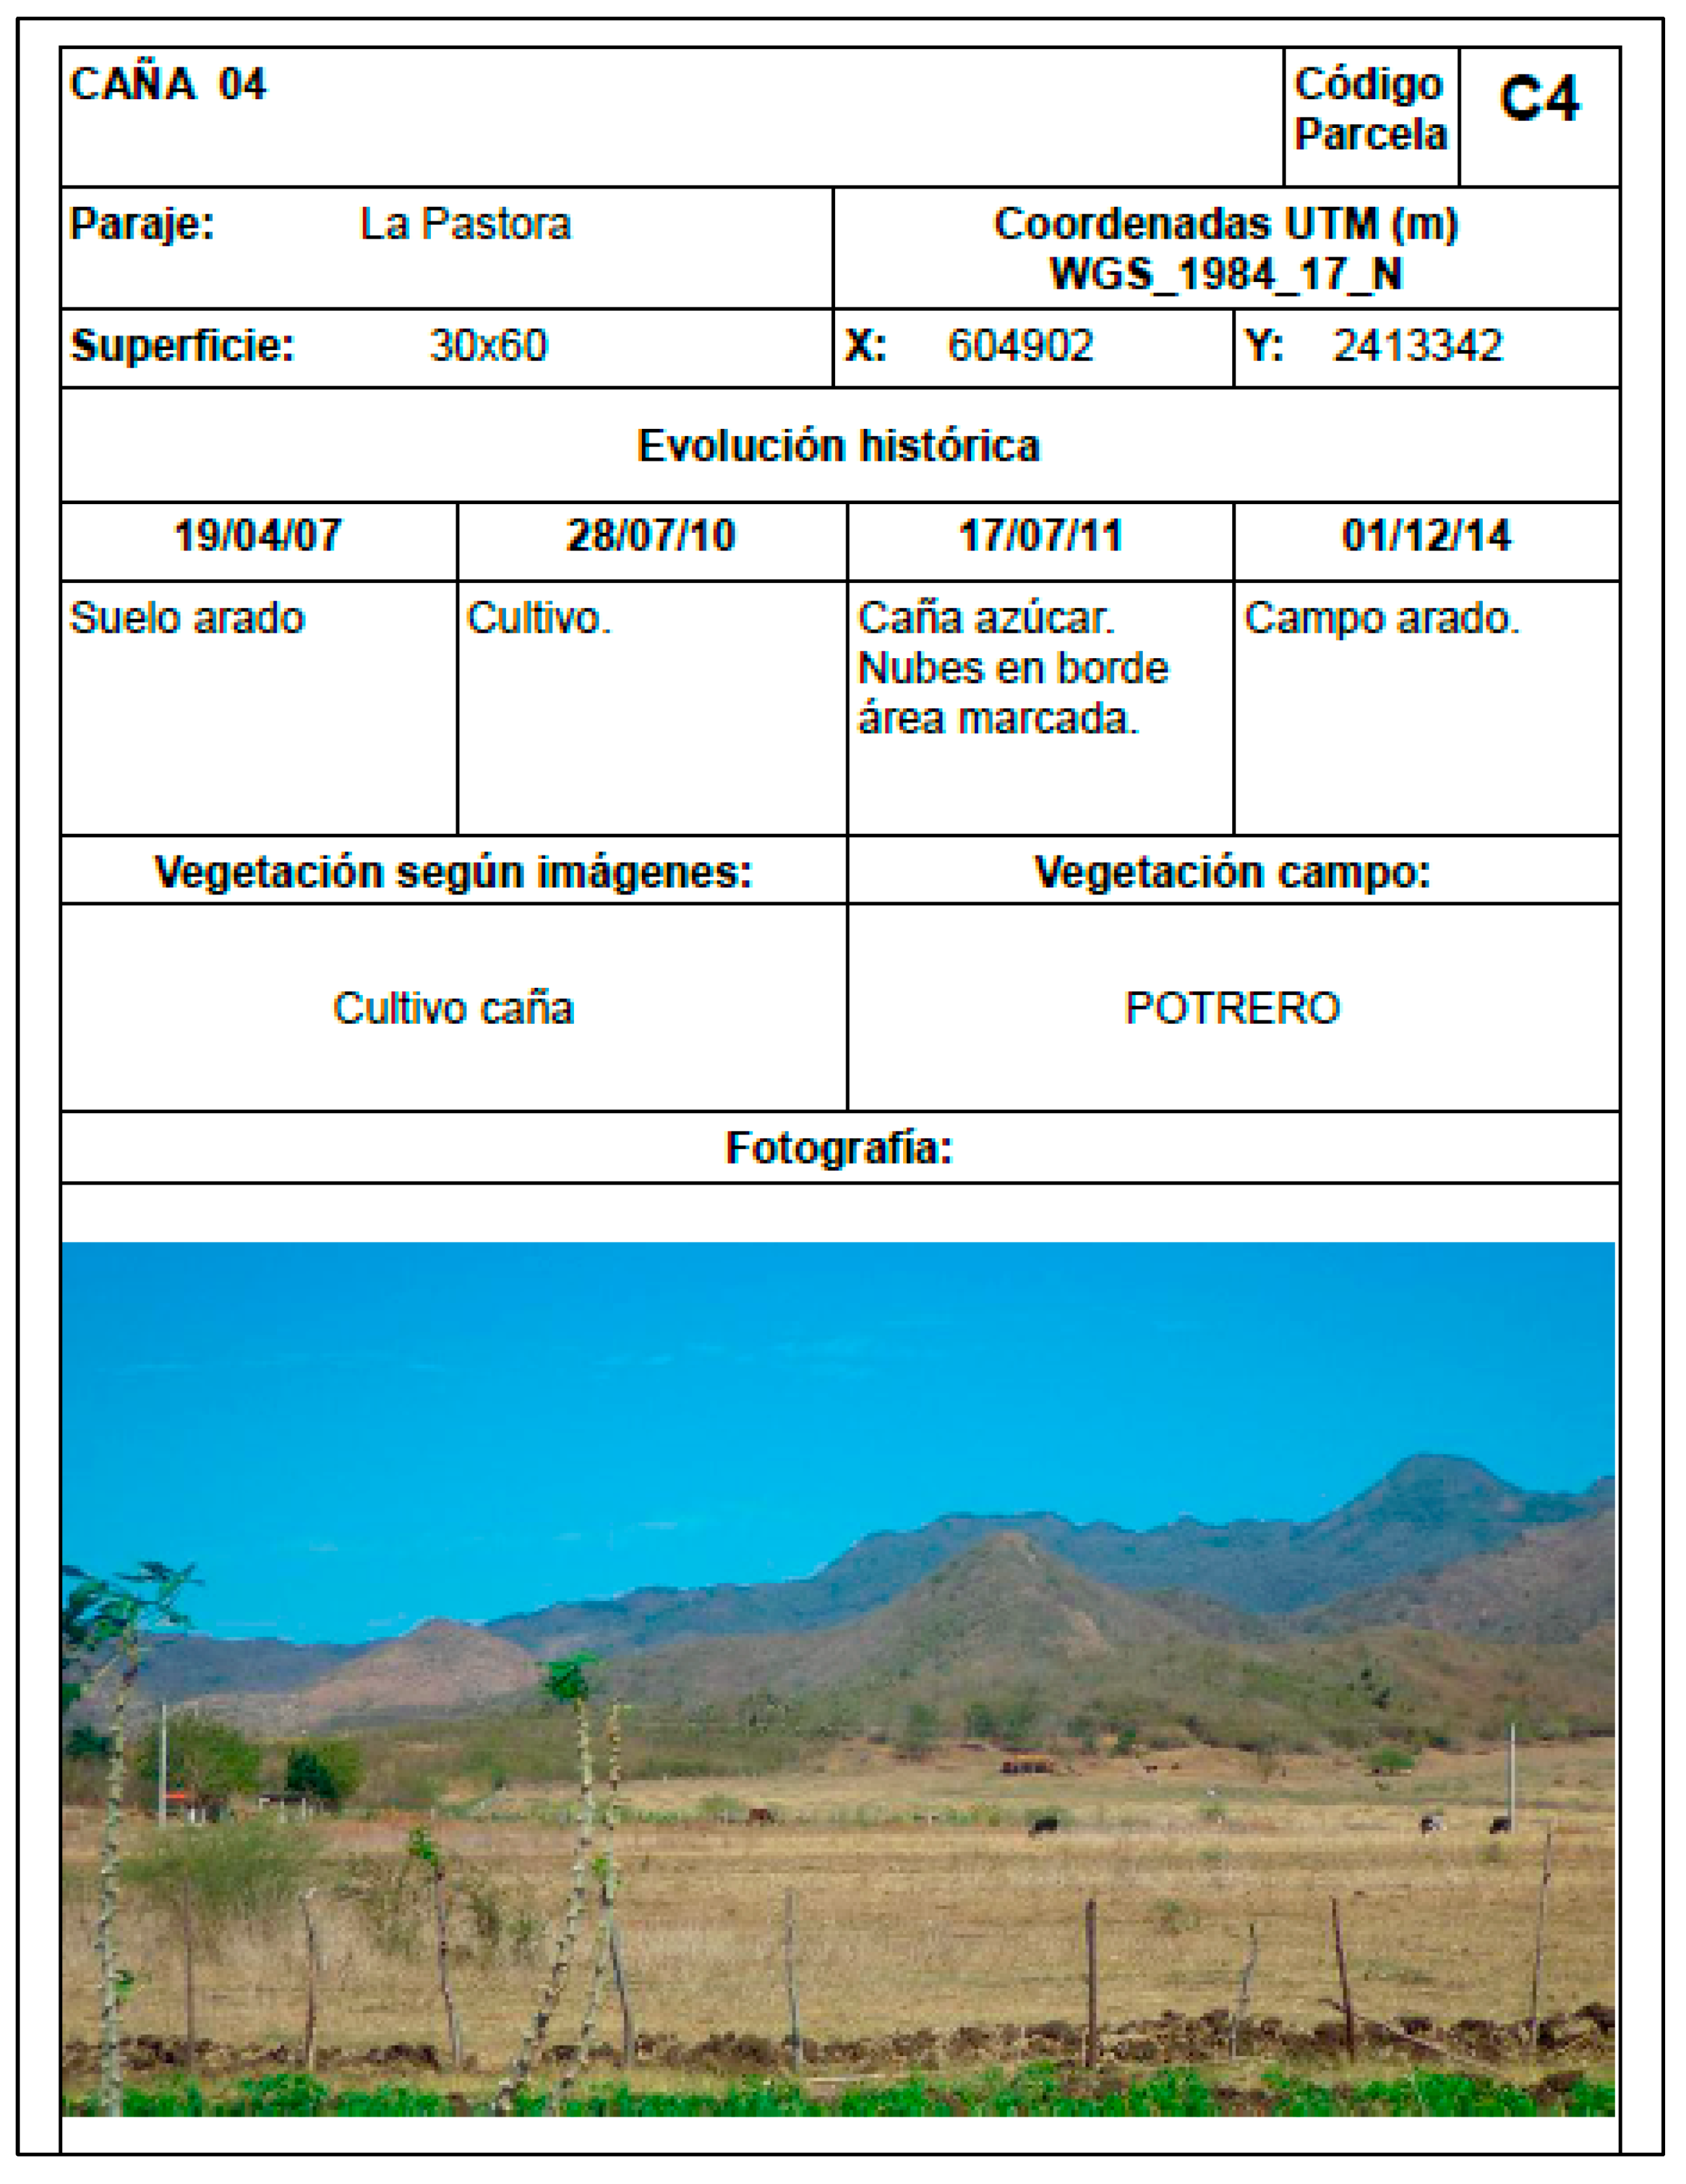
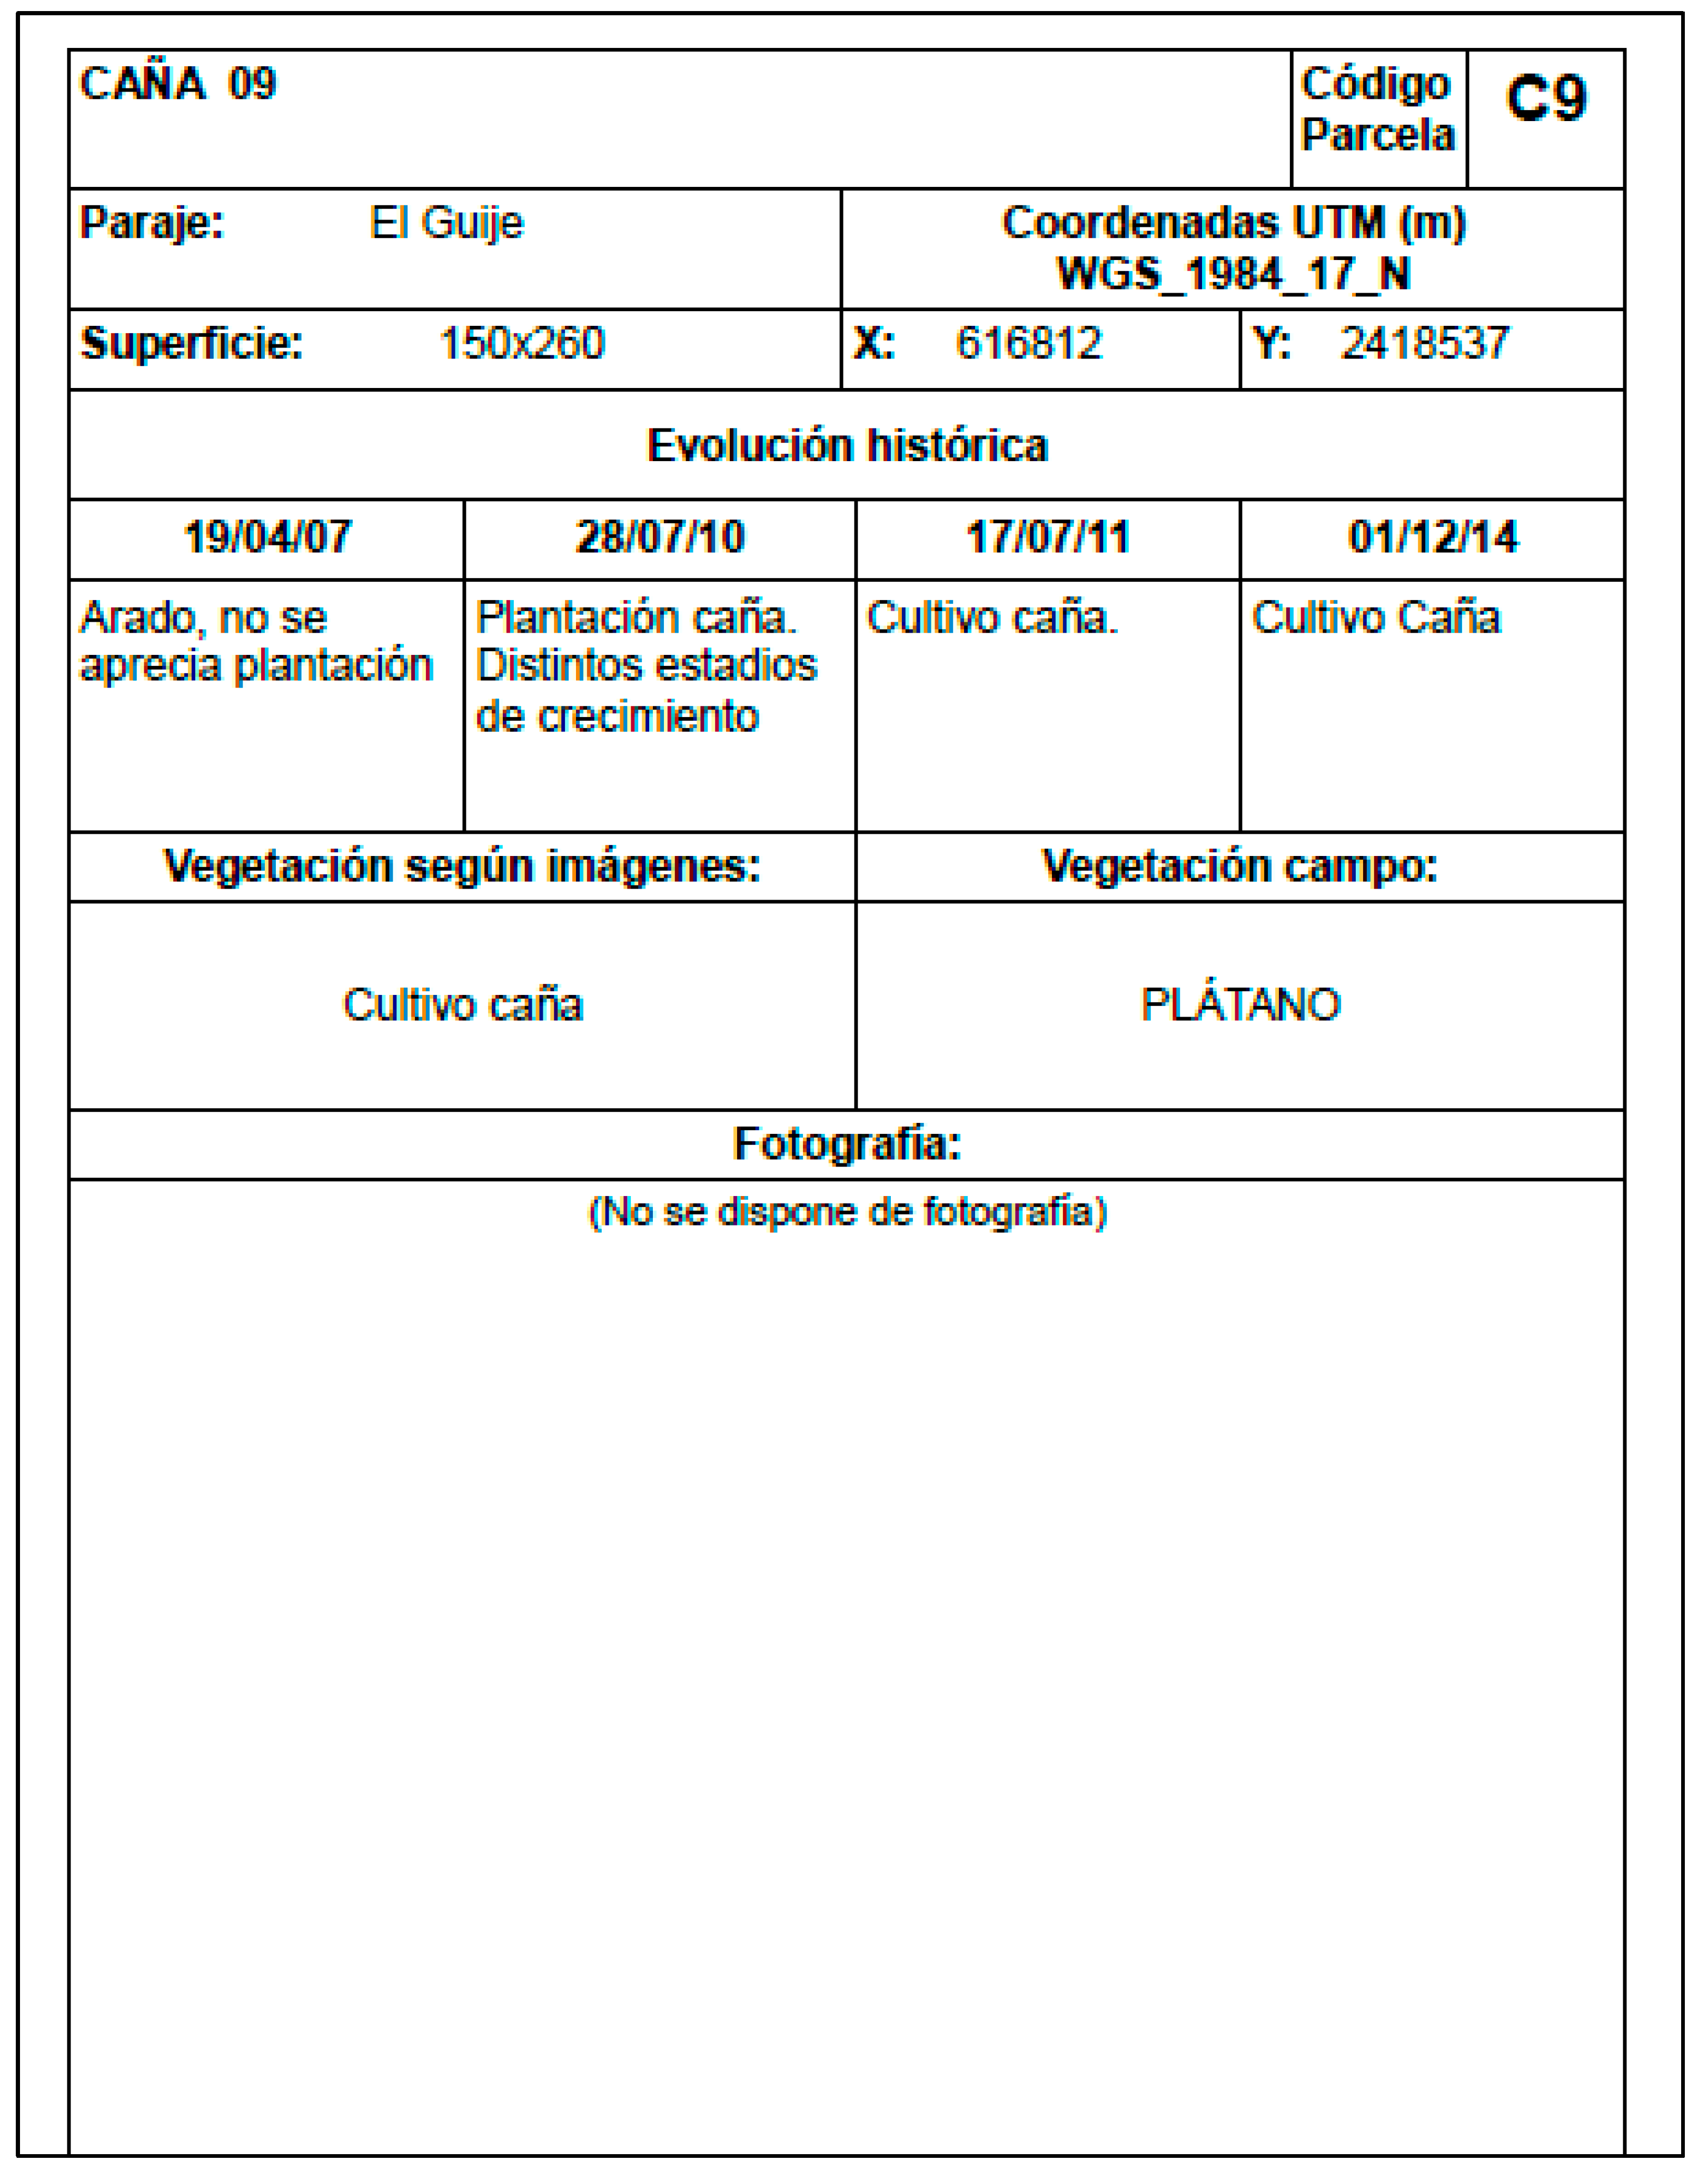
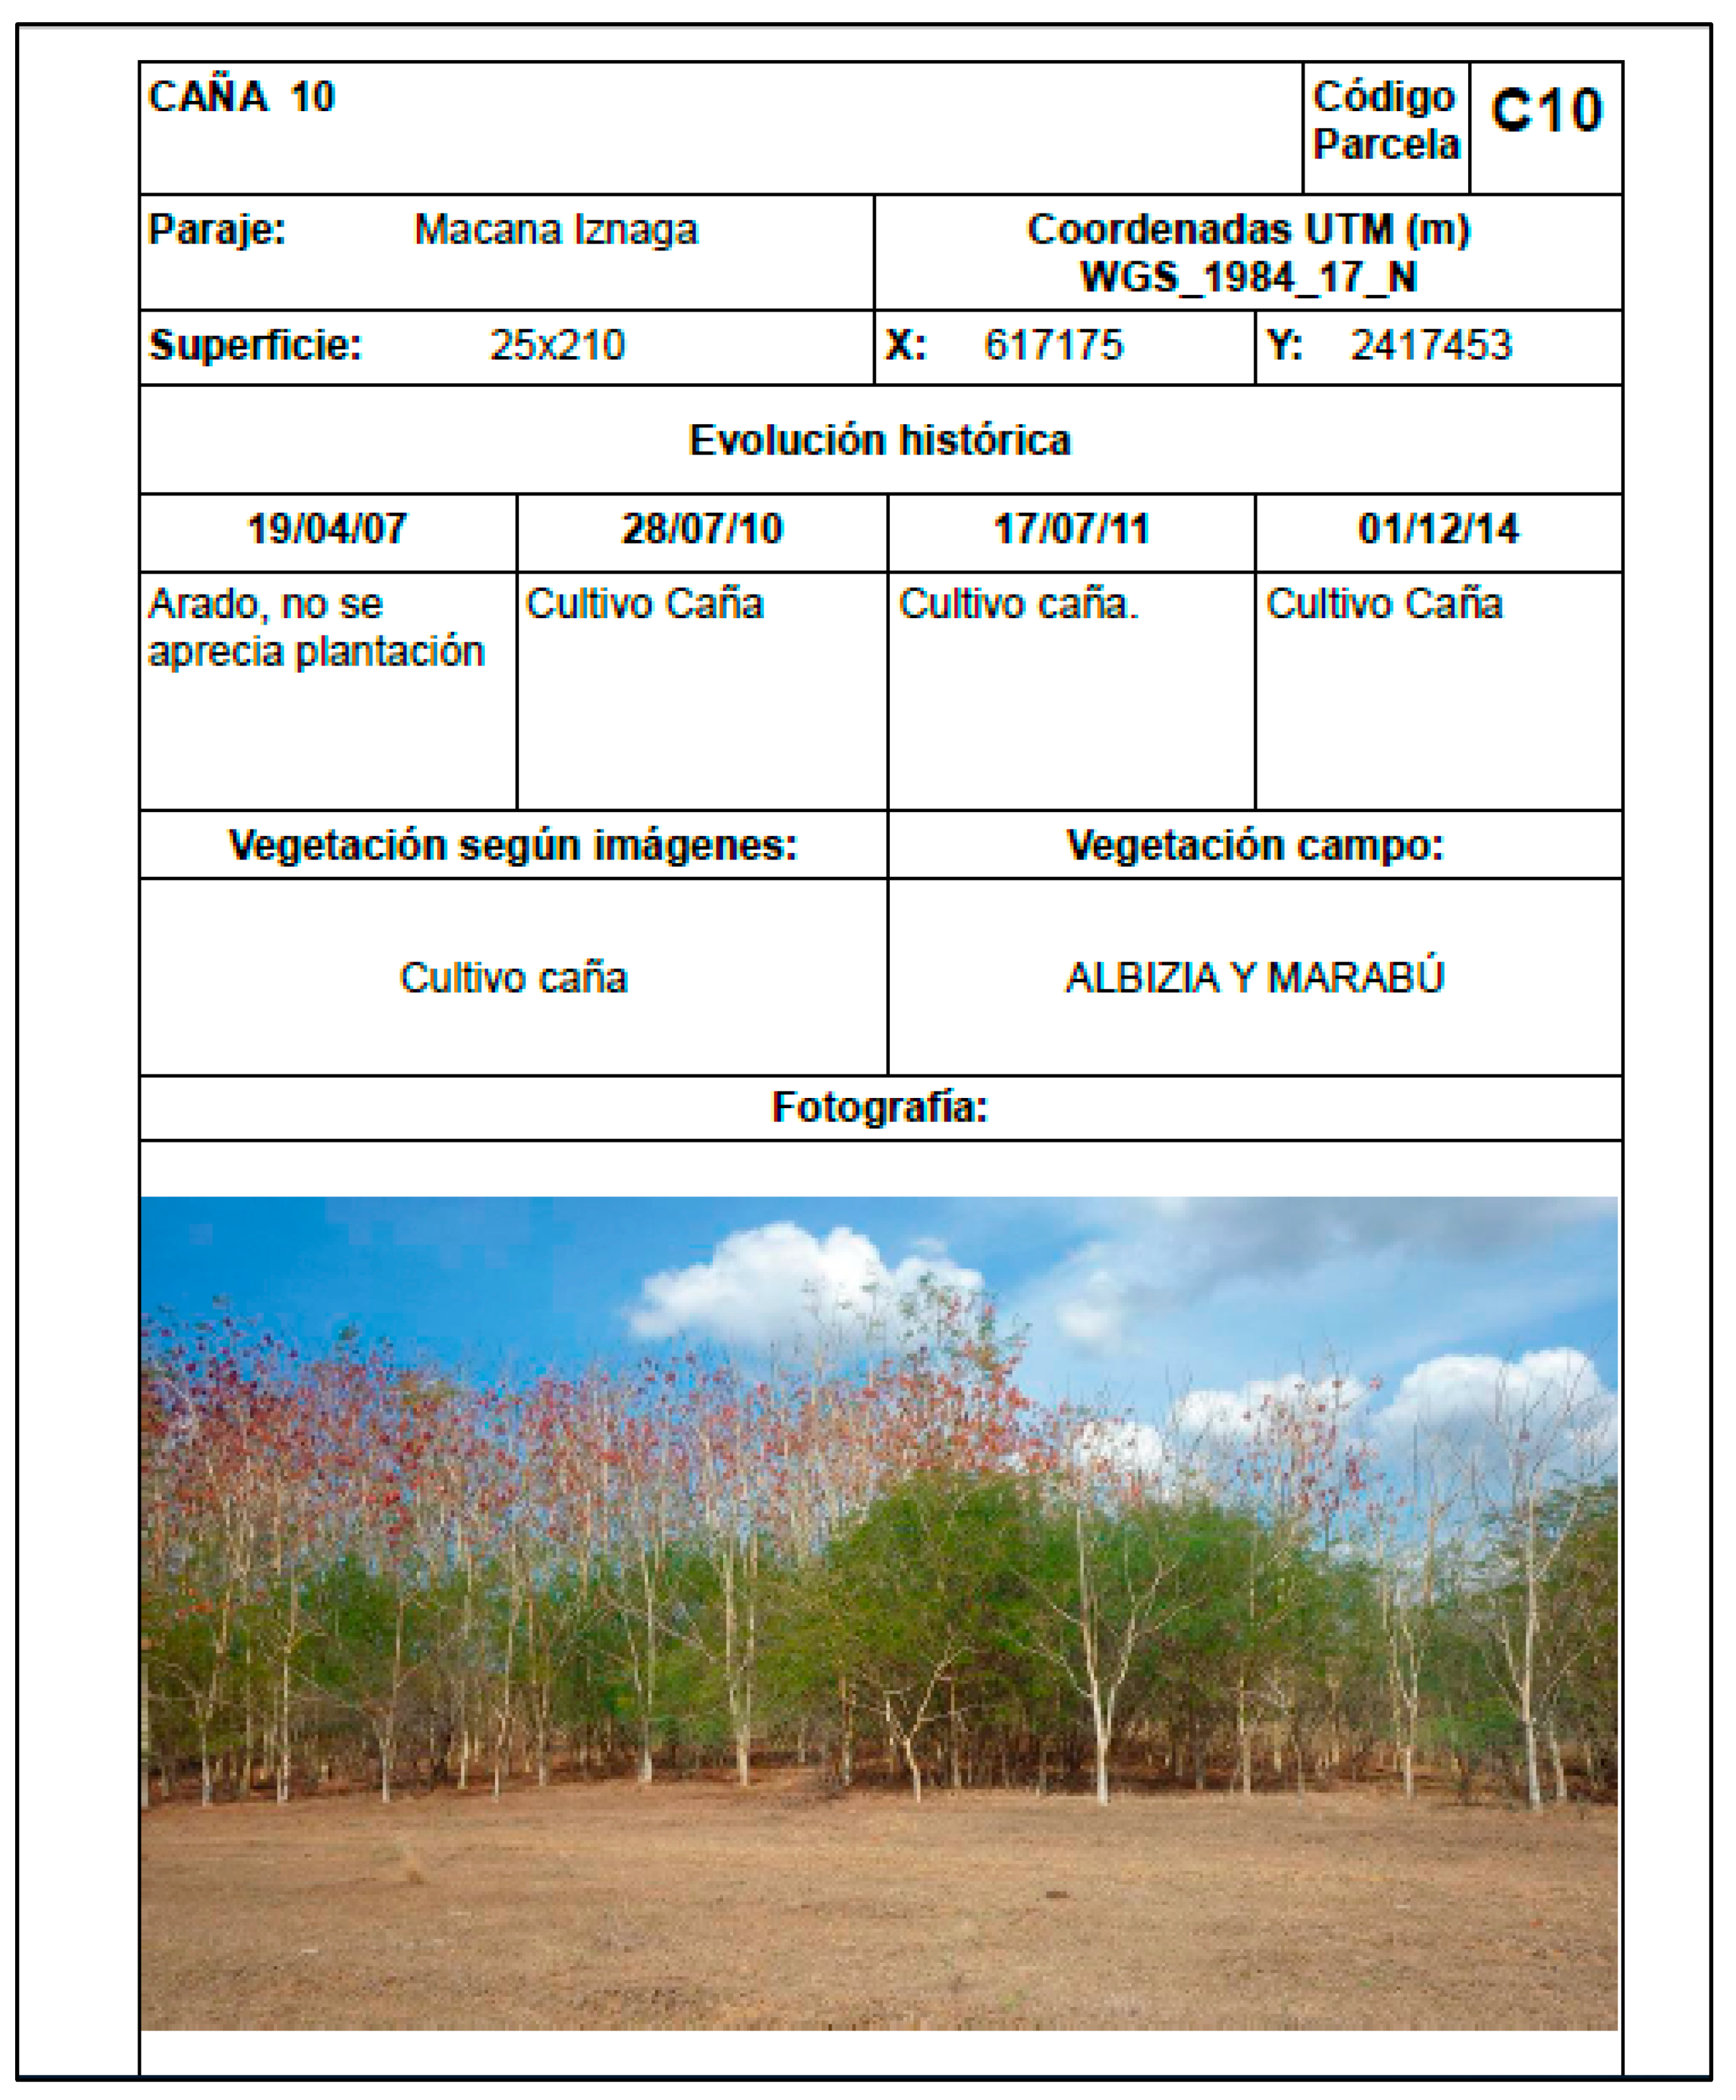
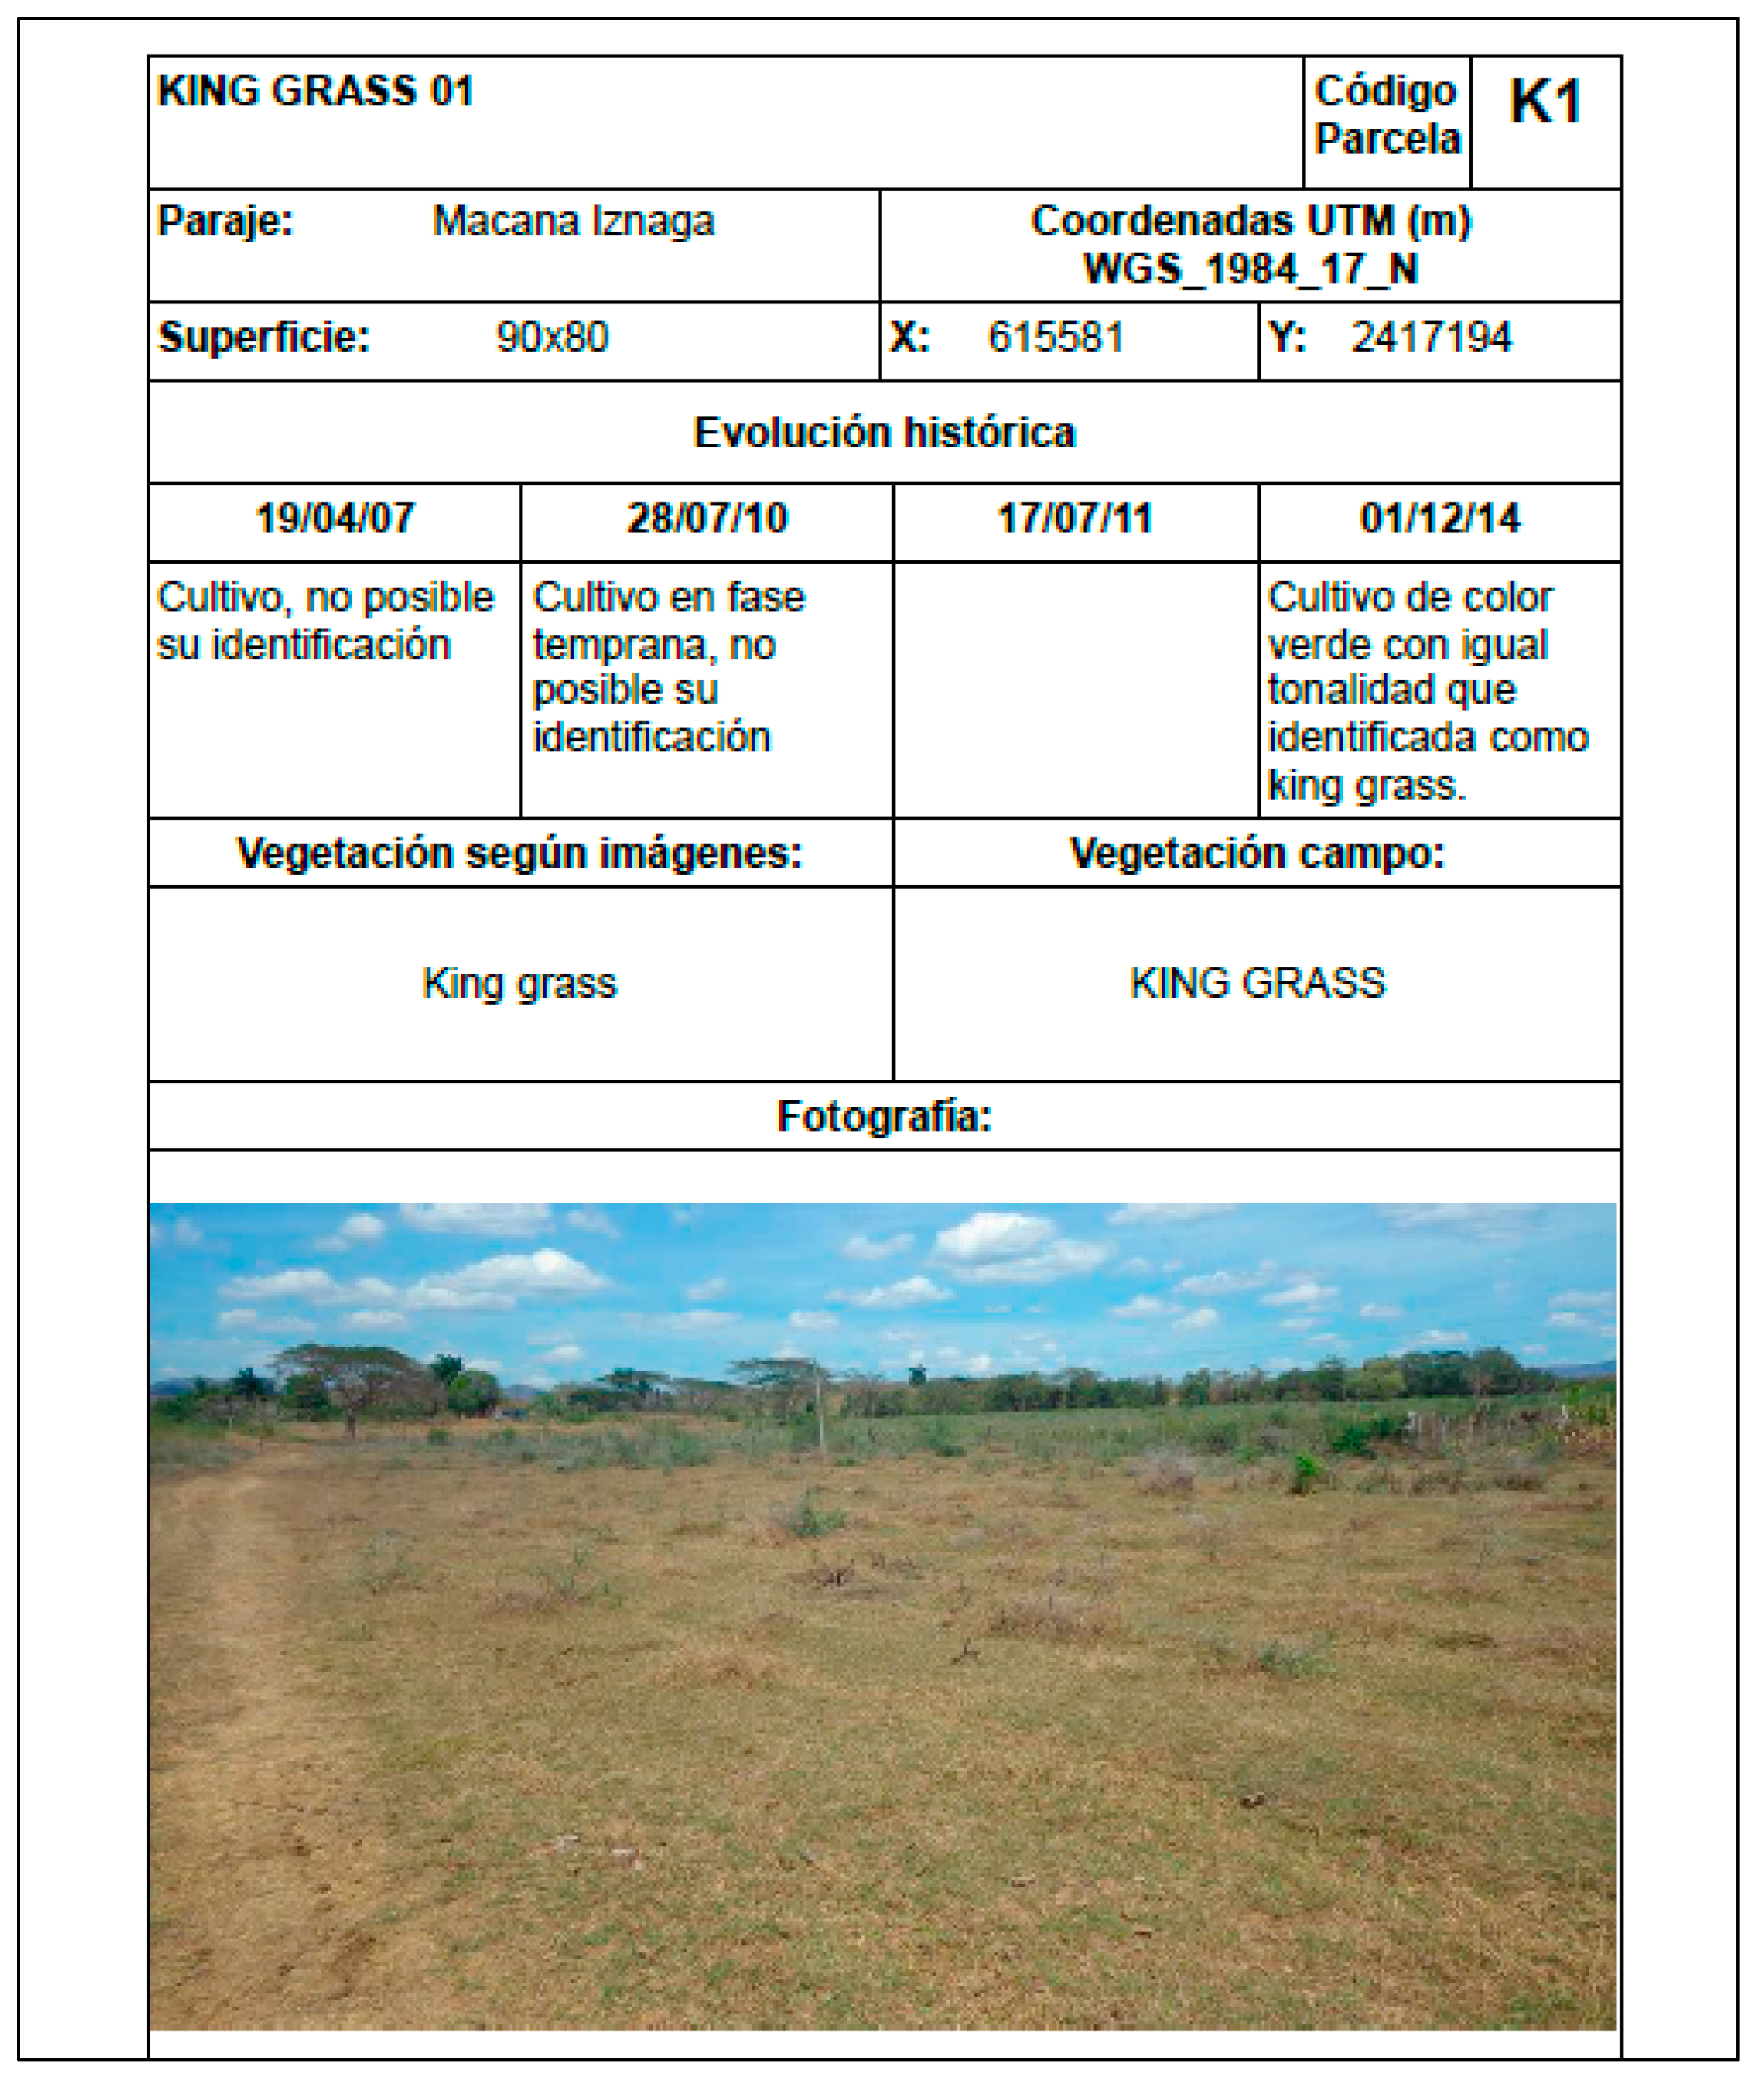
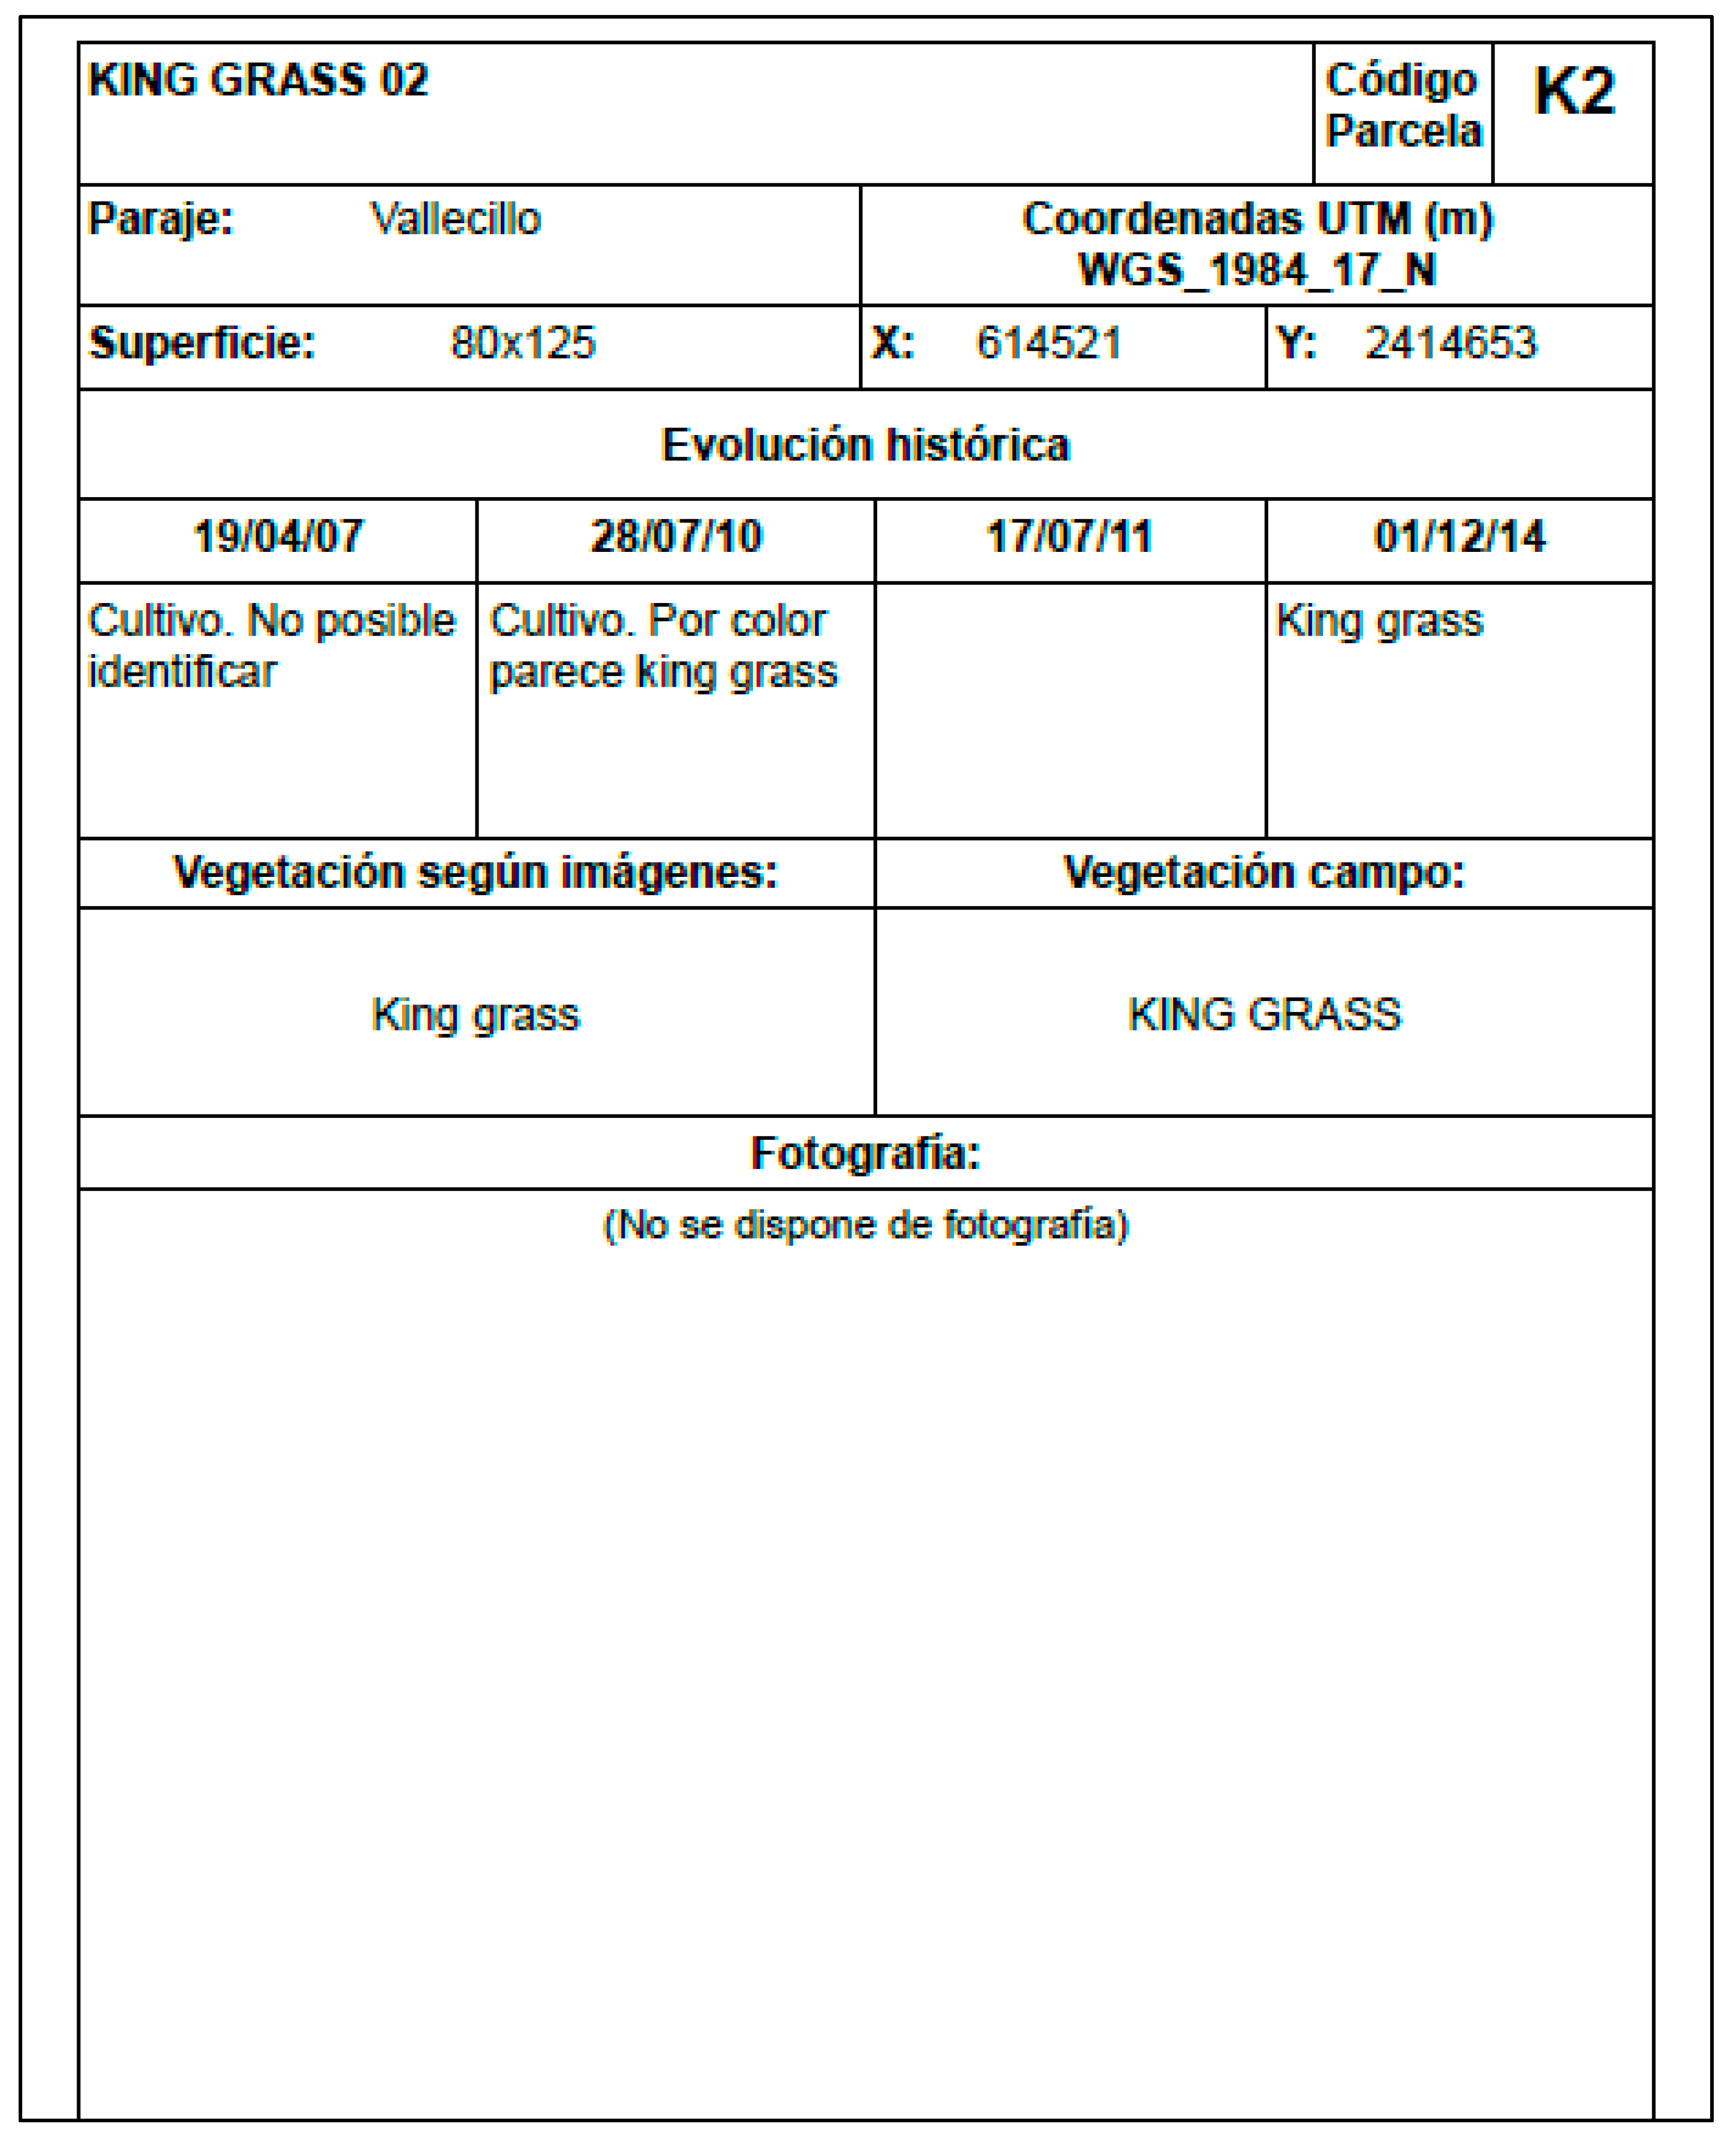
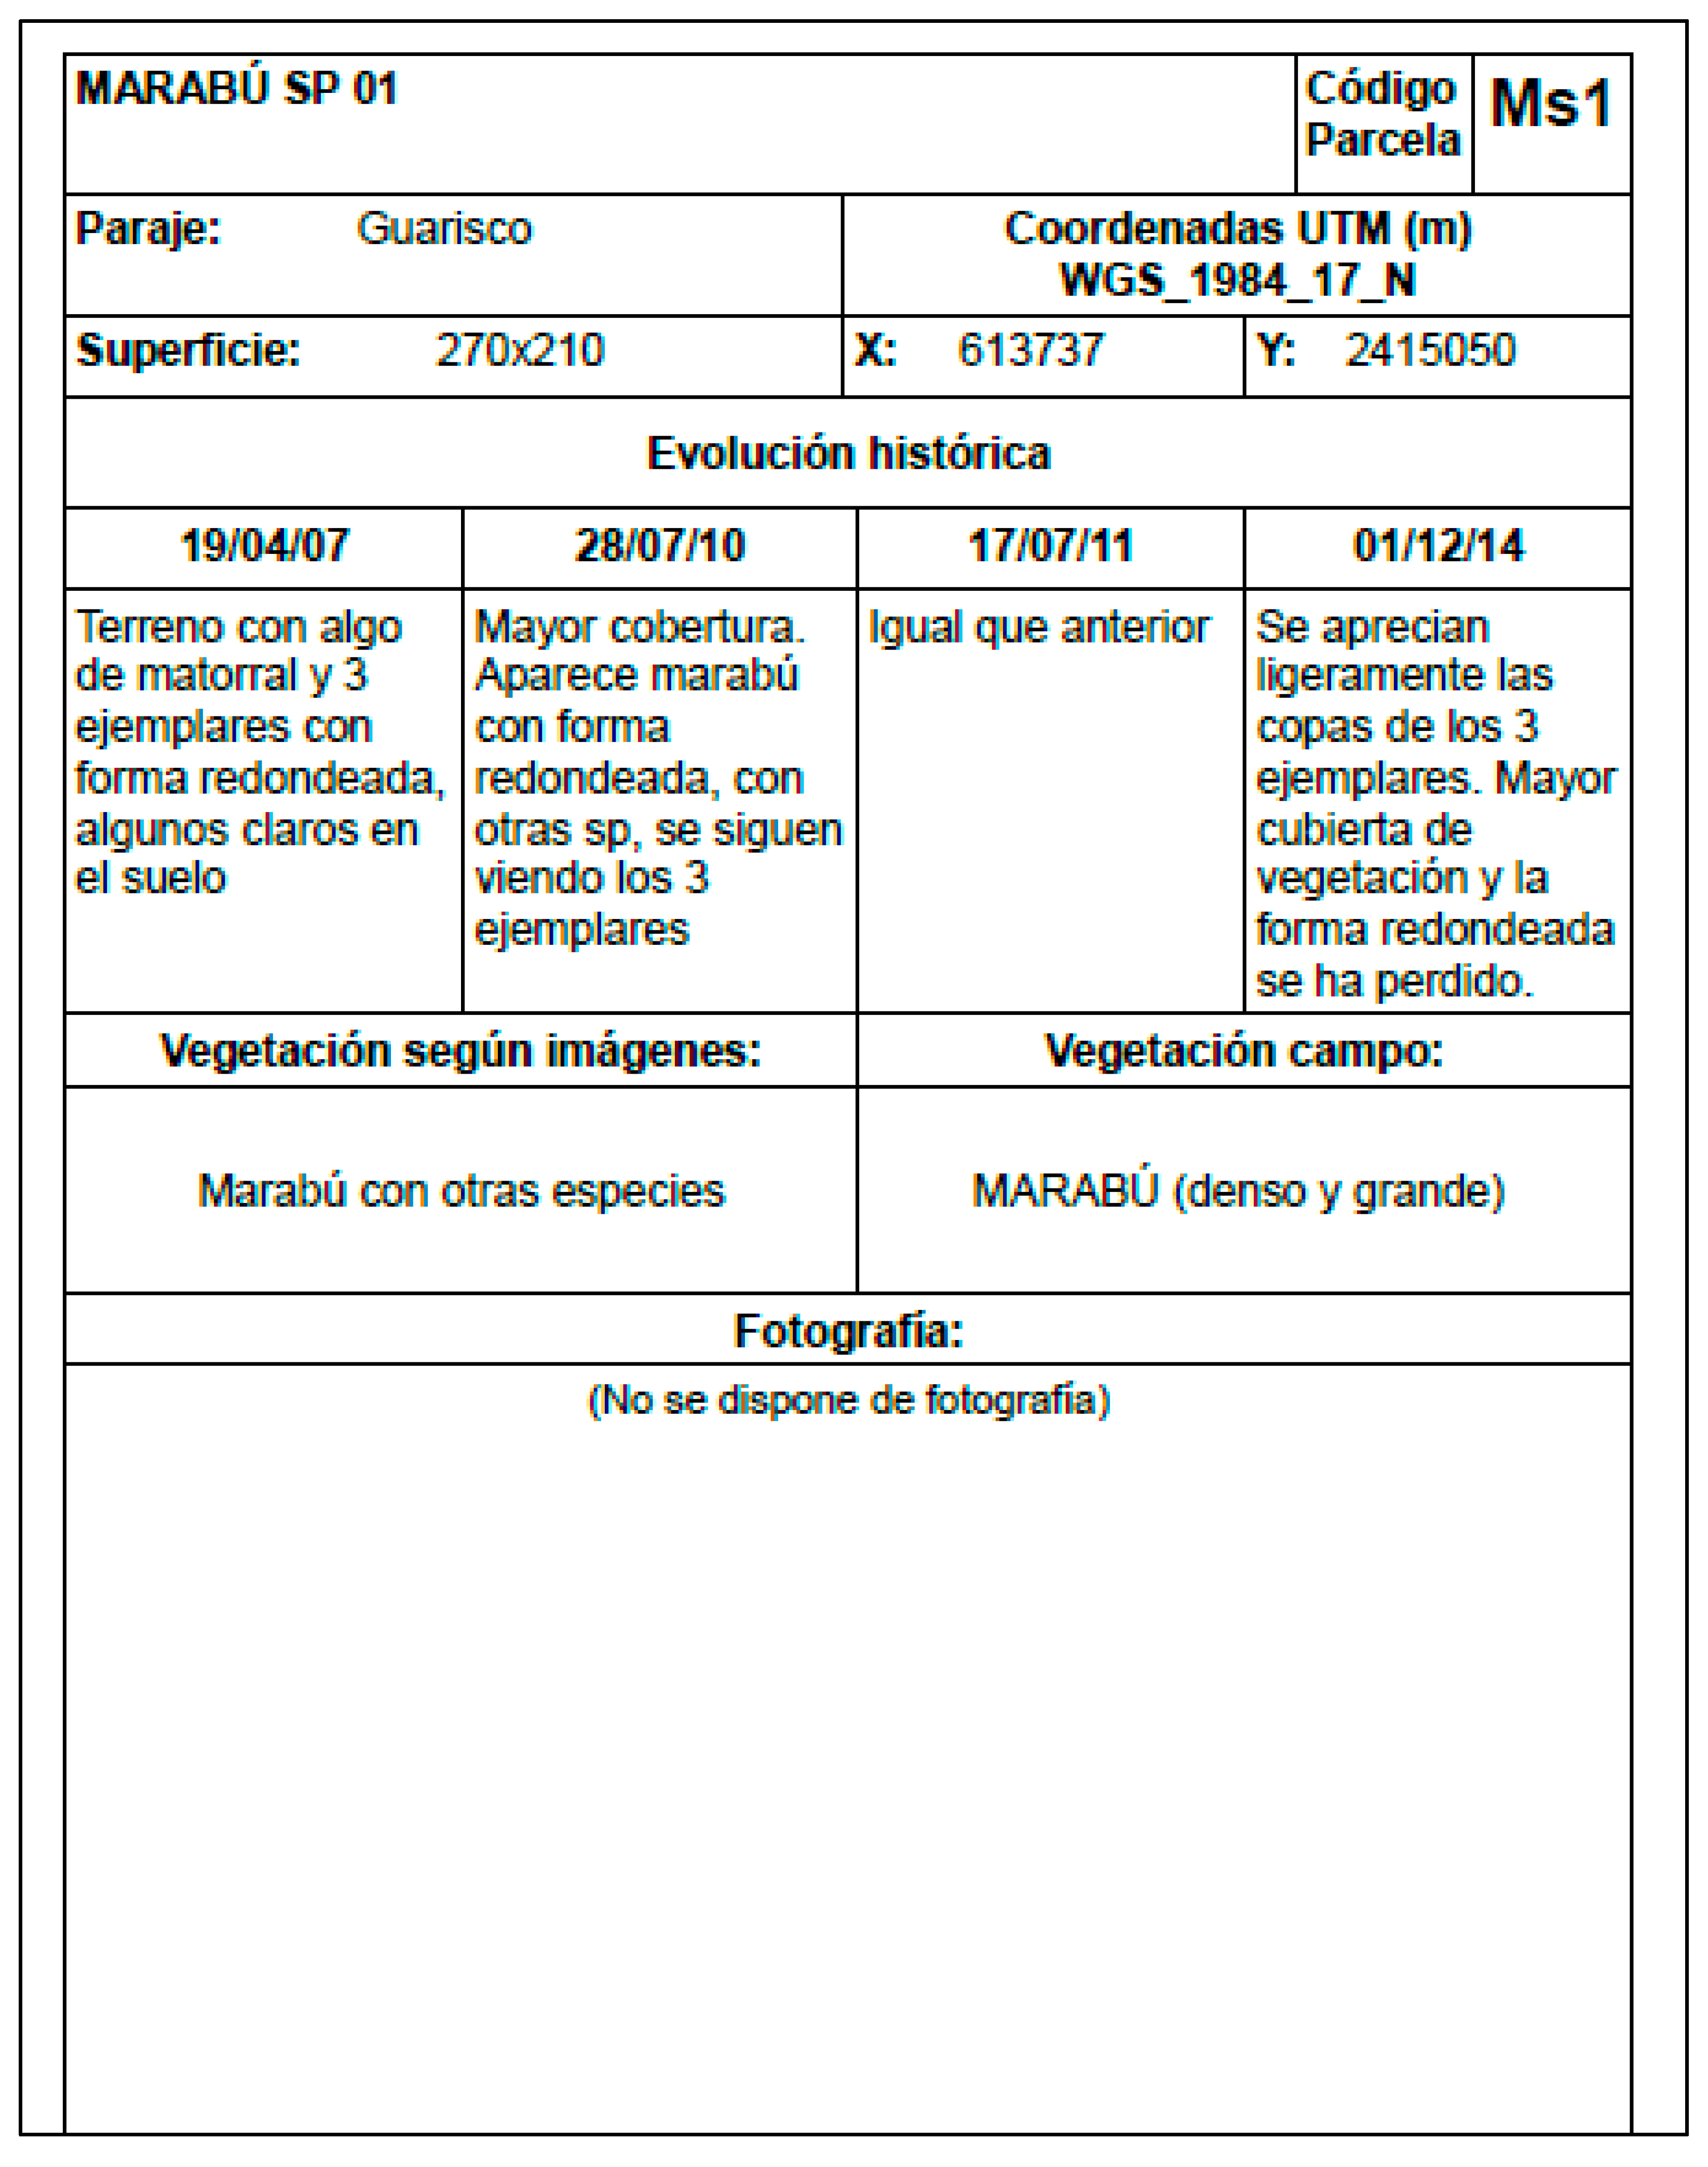
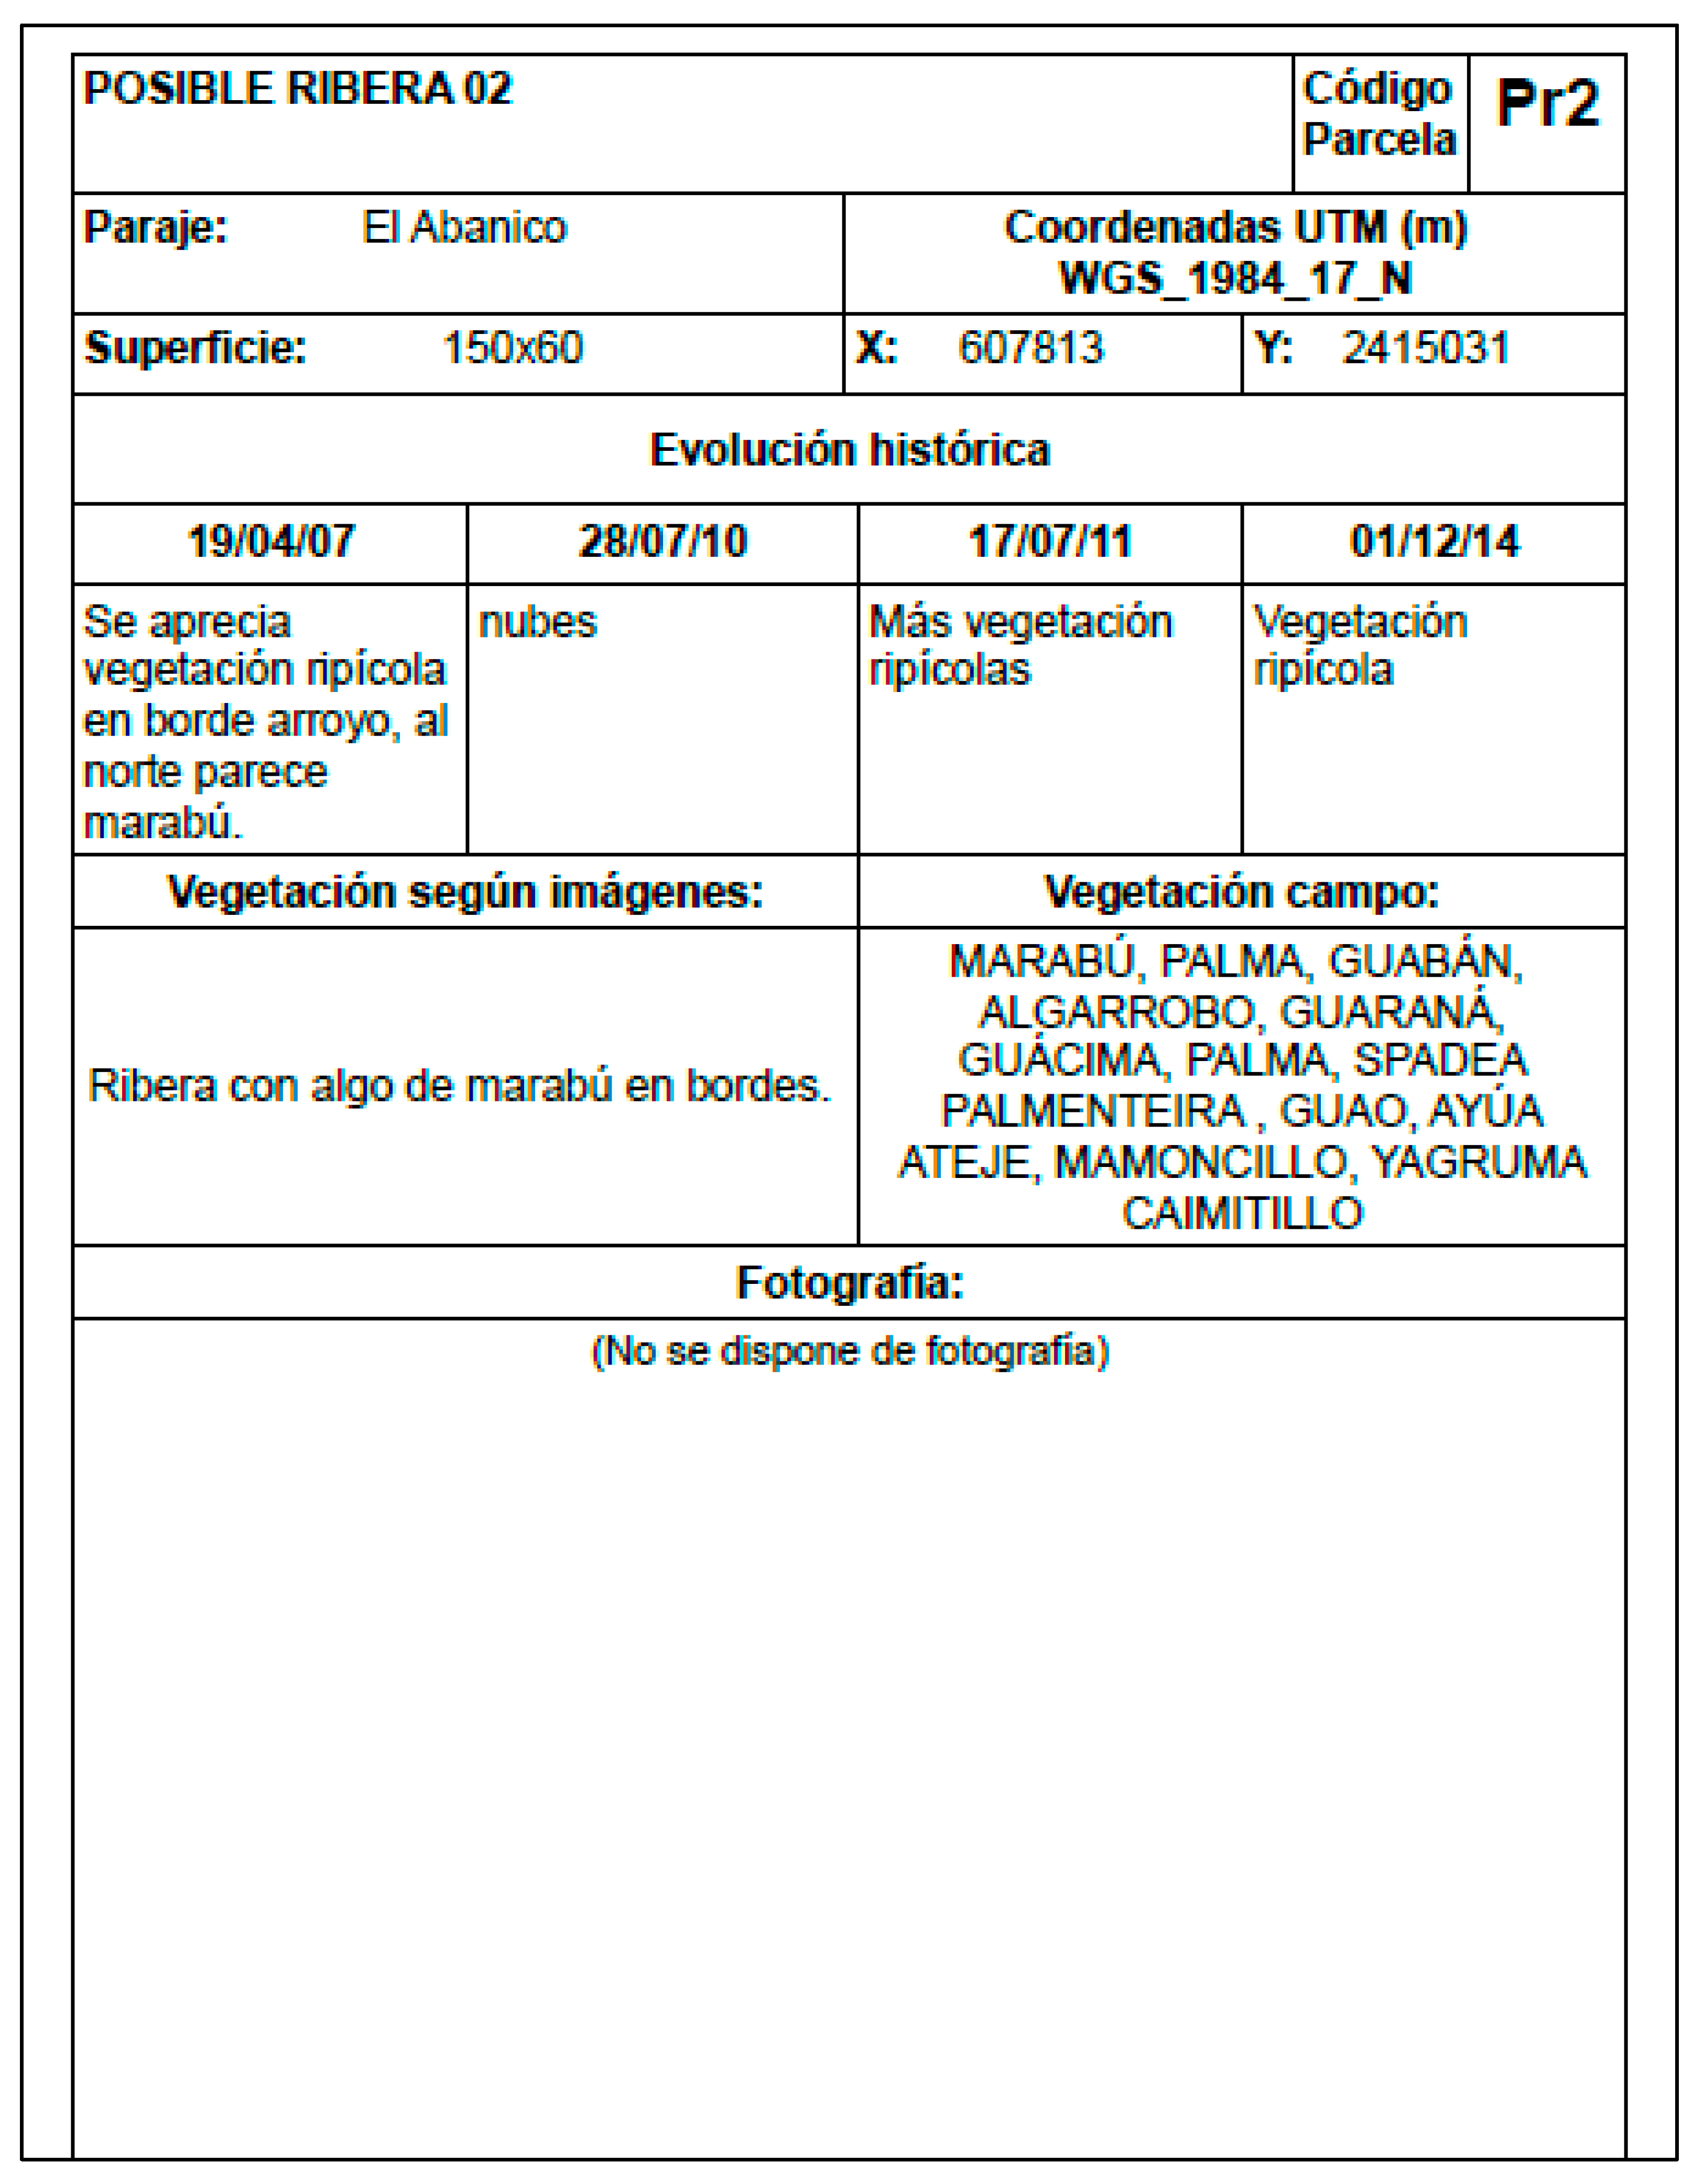
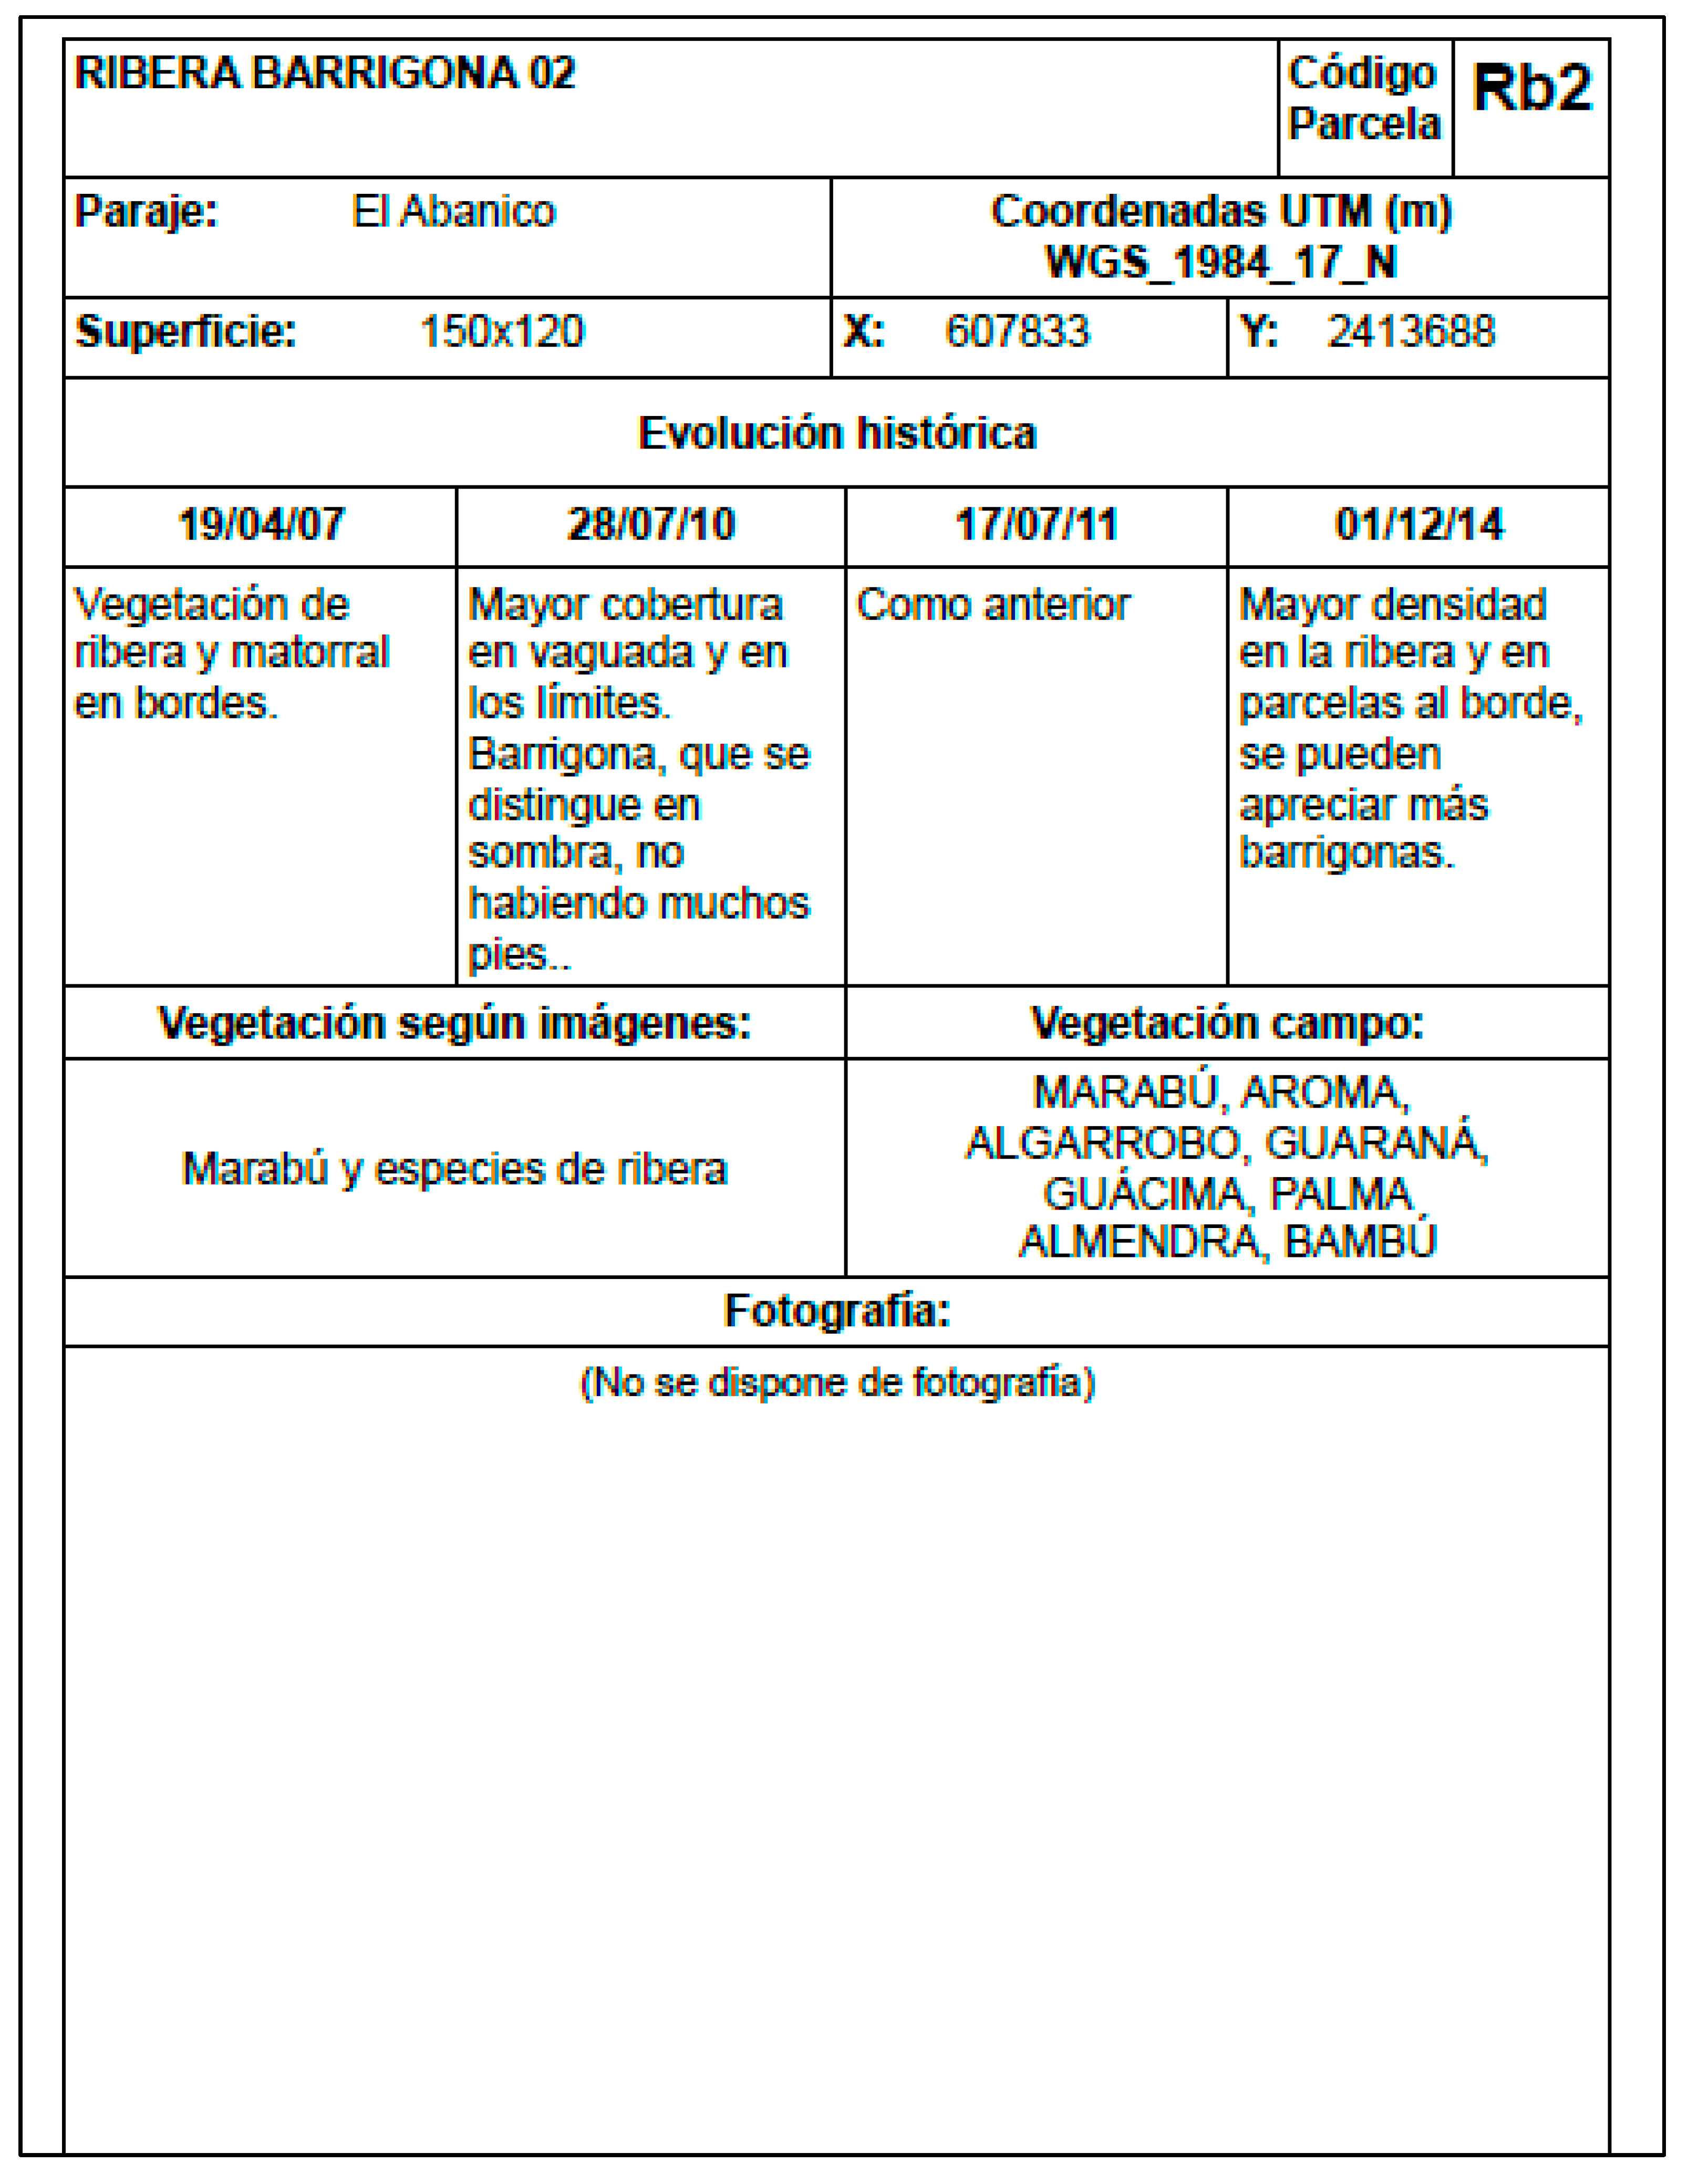
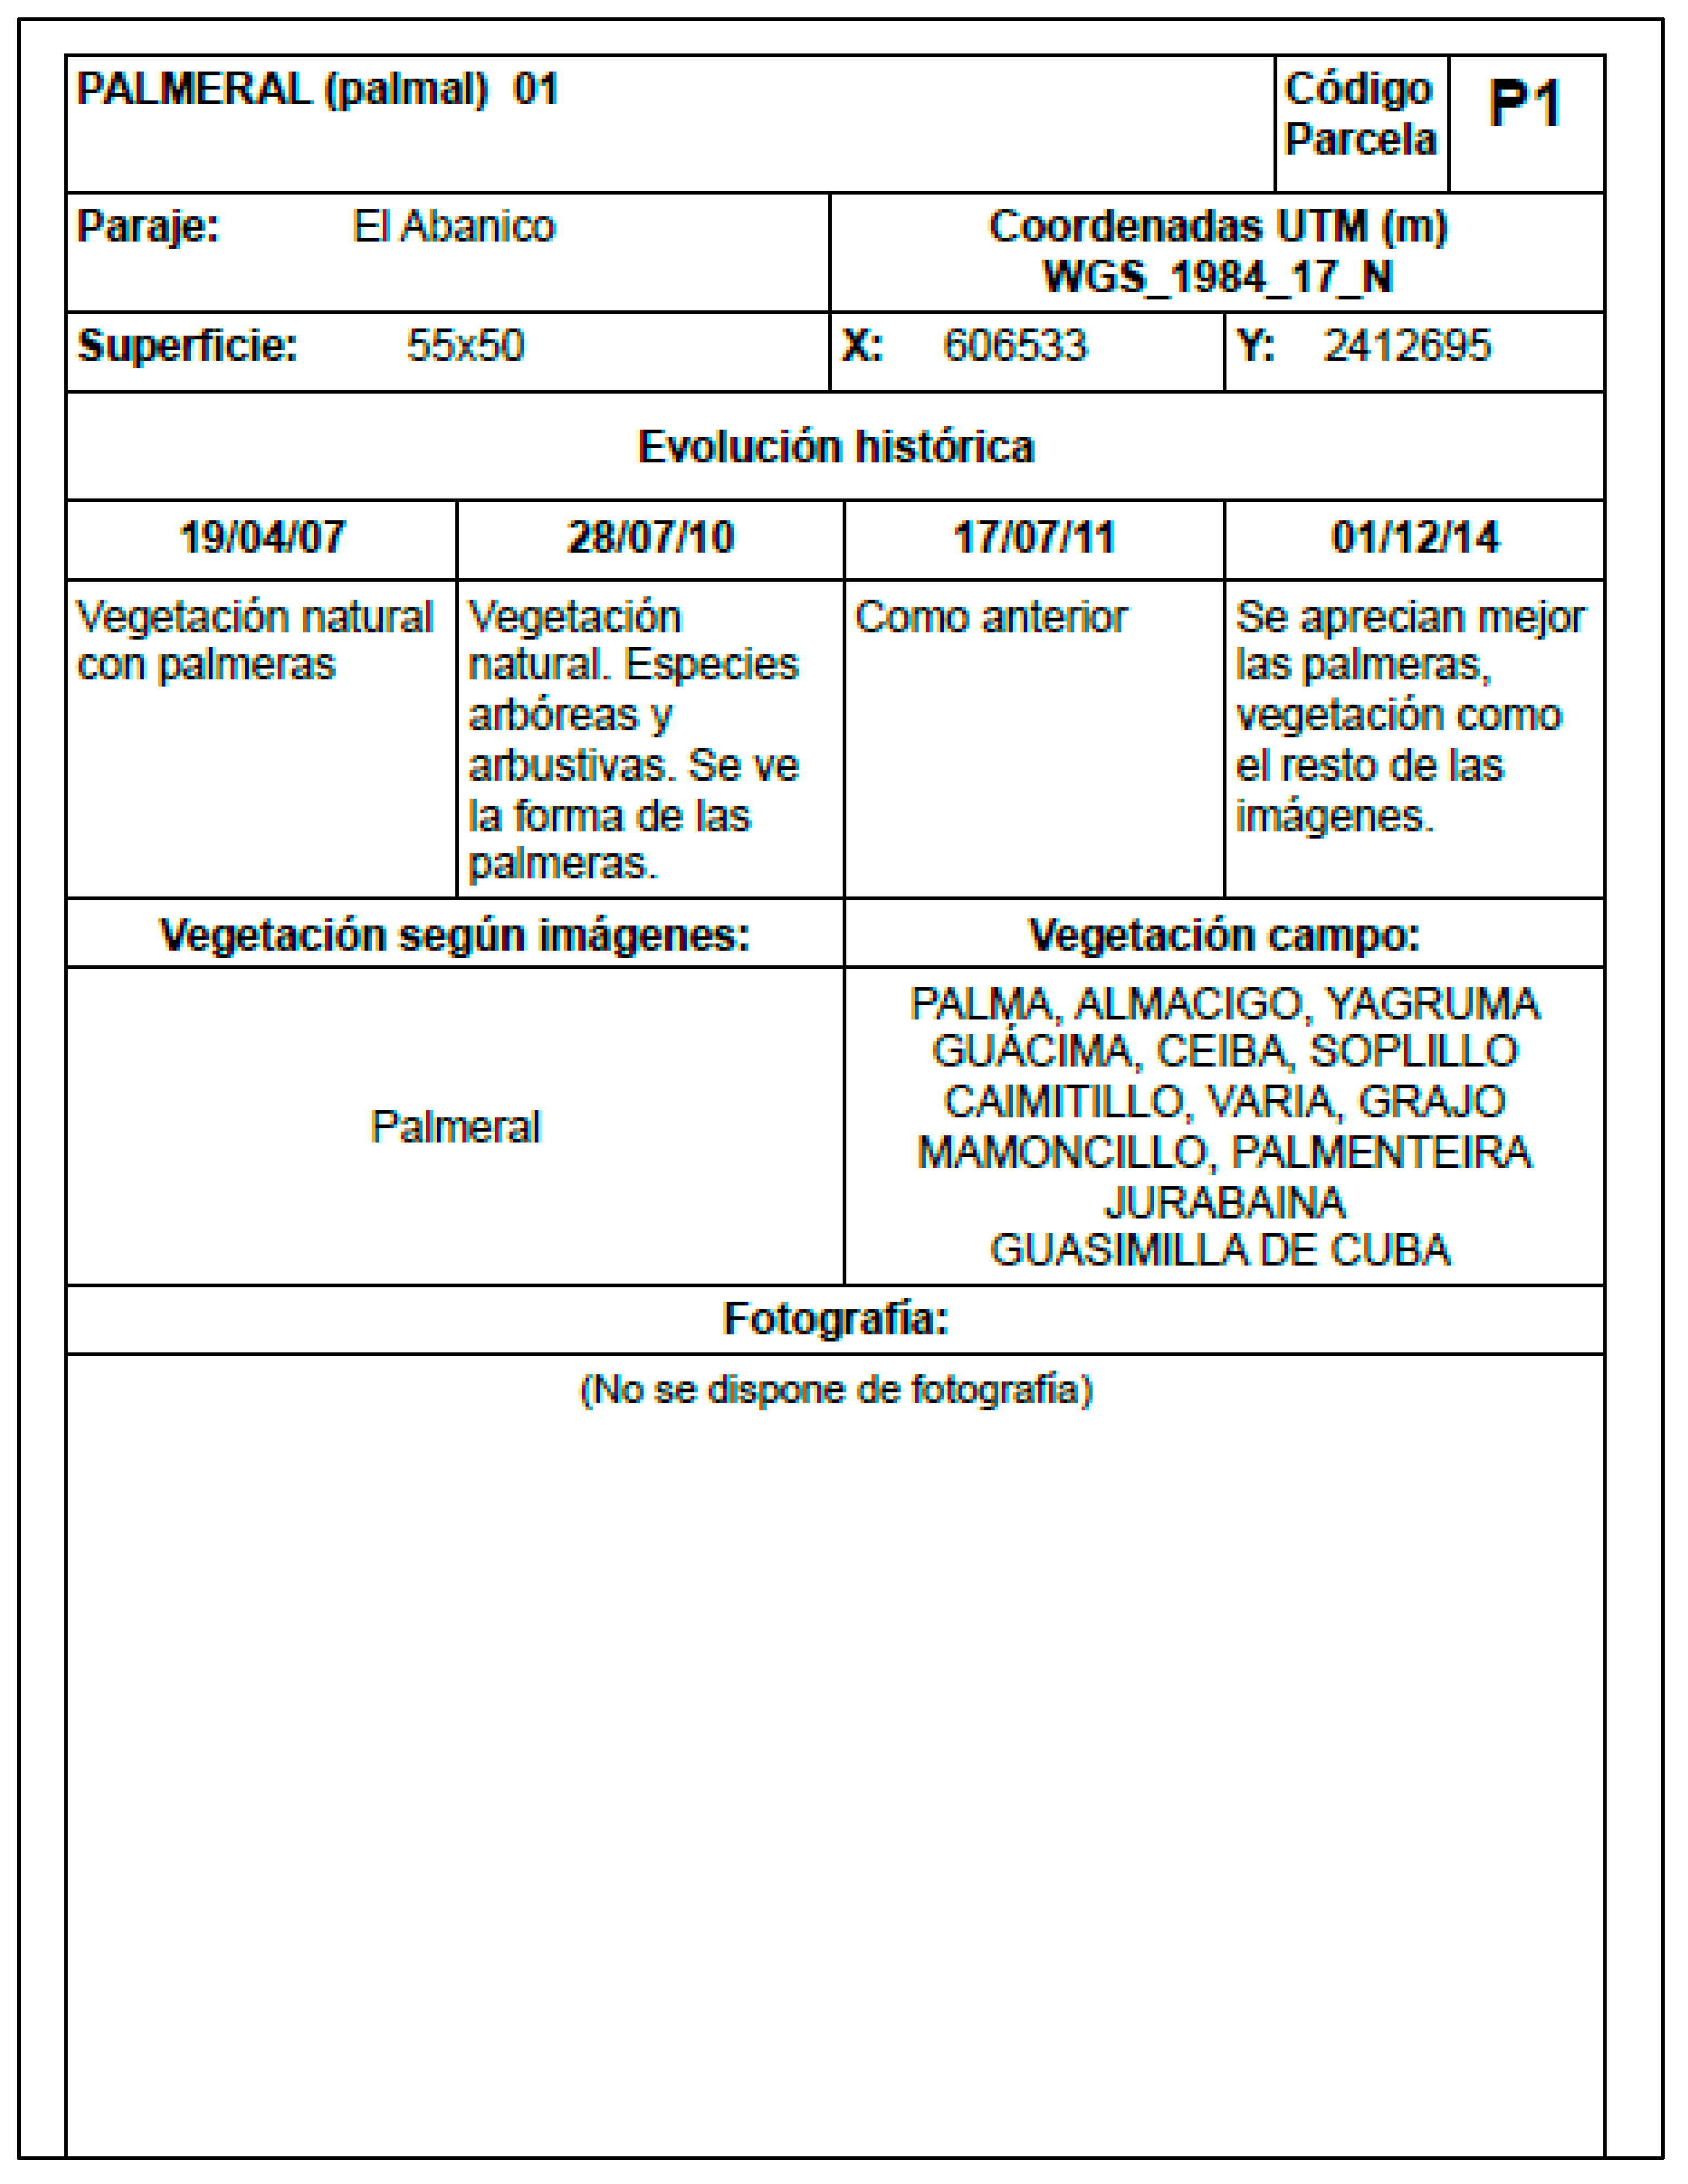
The ground truth required to develop the classifier comes from extensive field data collected in 2014, with fieldwork focusing primarily on identifying different vegetation types. Some soil types, such as water and urban areas, were identified directly in the images as there was no possibility of confusion. A total of 29 data points were strategically selected to represent different land cover classes, including marabou (Mar), palm (Pal), riparian vegetation (Rib), sugarcane (Caña), king grass (King), cassava (Cass), pasture (Past), banana (Ban), etc., which were meticulously recorded (Table 1). This diversity of classes was intended to capture the broad spectrum of land cover in the Valle de los Ingenios. To address concerns about the classification process and the purity of the ground-truth plots, detailed information has been included in Appendix A. This section provides a detailed description of the training data and sample plots and explains the process used to derive the random forest classifications. It also includes information on the purity of each plot, addressing questions about the presence of various elements such as roads, agricultural infrastructure, residential buildings, etc. In addition, Appendix A serves to reconcile any inconsistencies in the land cover class names in the different sections of the document to ensure transparency and clarity in our classification methodology. A deliberate choice was made to abstain from creating a land-use map, aligning with the study's core objective of just monitoring changes in marabou distribution within the Valle de los Ingenios. For the training and validation of the model, high-resolution satellite imagery was used to extract multiple pixels within each of the 29 plots. The resulting confusion matrix, comprising 136 points, reflects the classification of each pixel within these plots using the trained random forest (RF) model. This approach ensures a comprehensive and representative assessment of the model's performance.
2.2.5. Classification Algorithm
In the context of this study, the classification criterion employed for the distribution of marabou is straightforward: if contains any amount of marabou, it is unequivocally classified as marabou. In this study, the image classification methods in the Google Earth Engine (GEE) were examined in detail. The methodology included a thorough evaluation of four different supervised classification algorithms within GEE: CART, RandomForest, NaiveBayes and SVM. The process involved the creation of confusion matrices for each algorithm with the aim of identifying the most appropriate classifier that could explain the predominant variance in the dataset.
The parameterization of the random forest algorithm (RF) included the selection of the following input variables from the Landsat 8 images: B2 (blue band), B3 (green band), B4 (red band), B5 (near-infrared band), B6 (shortwave infrared band 1), B7 (shortwave infrared band 2), the phase band, the magnitude band, and the NDVI band (calculated from the red band and the near-infrared band). The number of trees in the RF classifier was set to 100, which was considered an appropriate value for this dataset. However, it is important to note that the optimal number of trees may vary depending on the specific characteristics of the data. To ensure the generalizability of the classifier, it was evaluated on a separate dataset consisting of 30% of the images in the sample region. The overall accuracy of the classifier was 90%. These results demonstrate the effectiveness of the RF algorithm in classifying satellite images of the Valle de los Ingenios. For transparency and reproducibility, the full programming code for the RandomForest algorithm in Google Earth Engine (GEE) is included in Appendix B Researchers and practitioners can refer to this appendix to gain a detailed understanding of the implementation and configuration of the algorithm.
2.2.6. Workflow Overview
Workflow overview is summarized in Figure 2
2.2.7. Temporal Considerations
A classifier developed from the 2014 field data was systematically applied to each annual cycle. For periods prior to 2014, semi-annual cycles were considered due to the limited Landsat 5 data. From 2014 onwards, Landsat 7 and Landsat 8 images acquired every 8 days enabled annual classification. The application of the classifier resulted in maps that illustrate the temporal evolution of marabou vegetation in the Valle de los Ingenios for each cycle and provide valuable insights into vegetation dynamics over time.
2.2.8. Code Accessibility
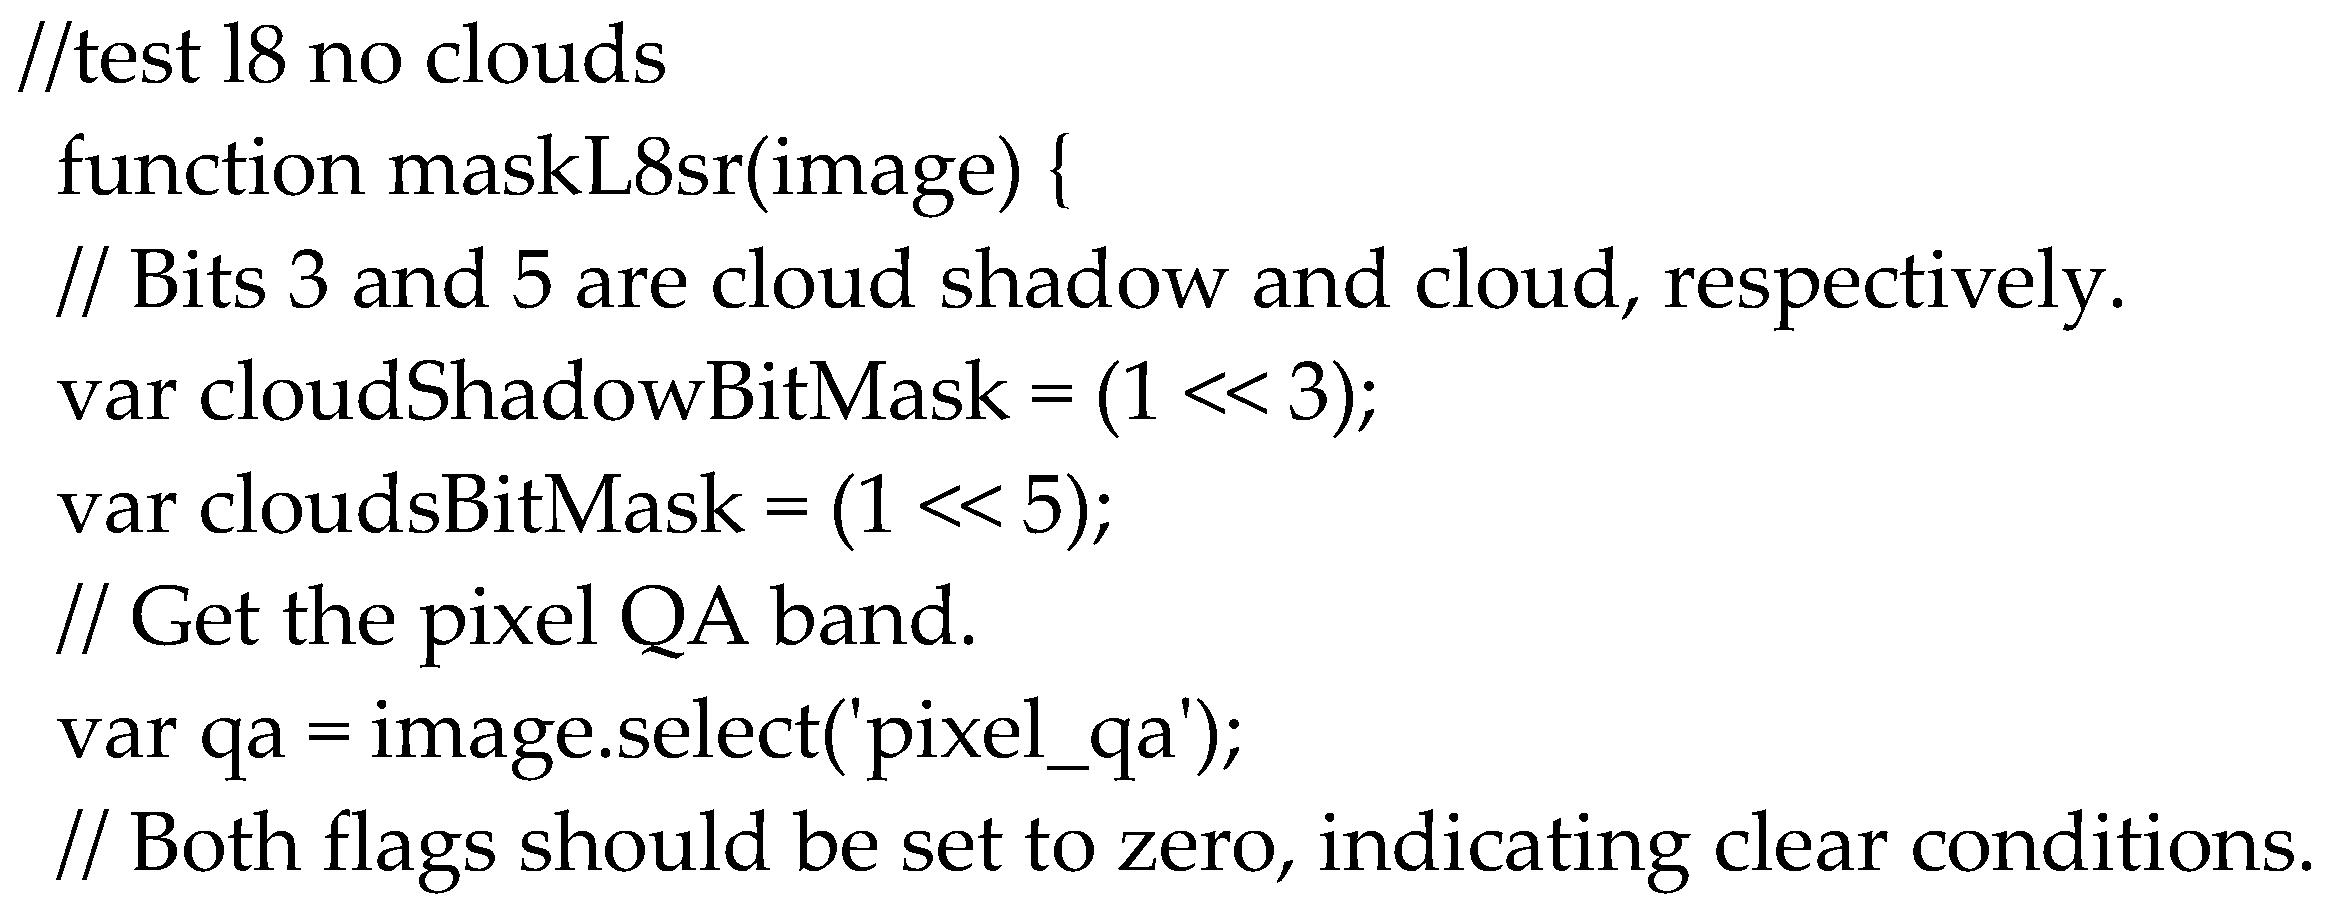
To ensure transparency and reproducibility, the entire code that implements the classification and analysis processes is openly accessible via the GEE code editor at code.earthengine.google.com. This accessibility, which is described in detail in Appendix B, facilitates verification and replication of the methodology, thereby increasing the robustness and verifiability of the results. Researchers and practitioners interested in exploring or validating the approach can easily access the code to gain a comprehensive understanding and application.
3. Results
3.1. Valley Mapping at an Elevation Threshold of 100 Meters
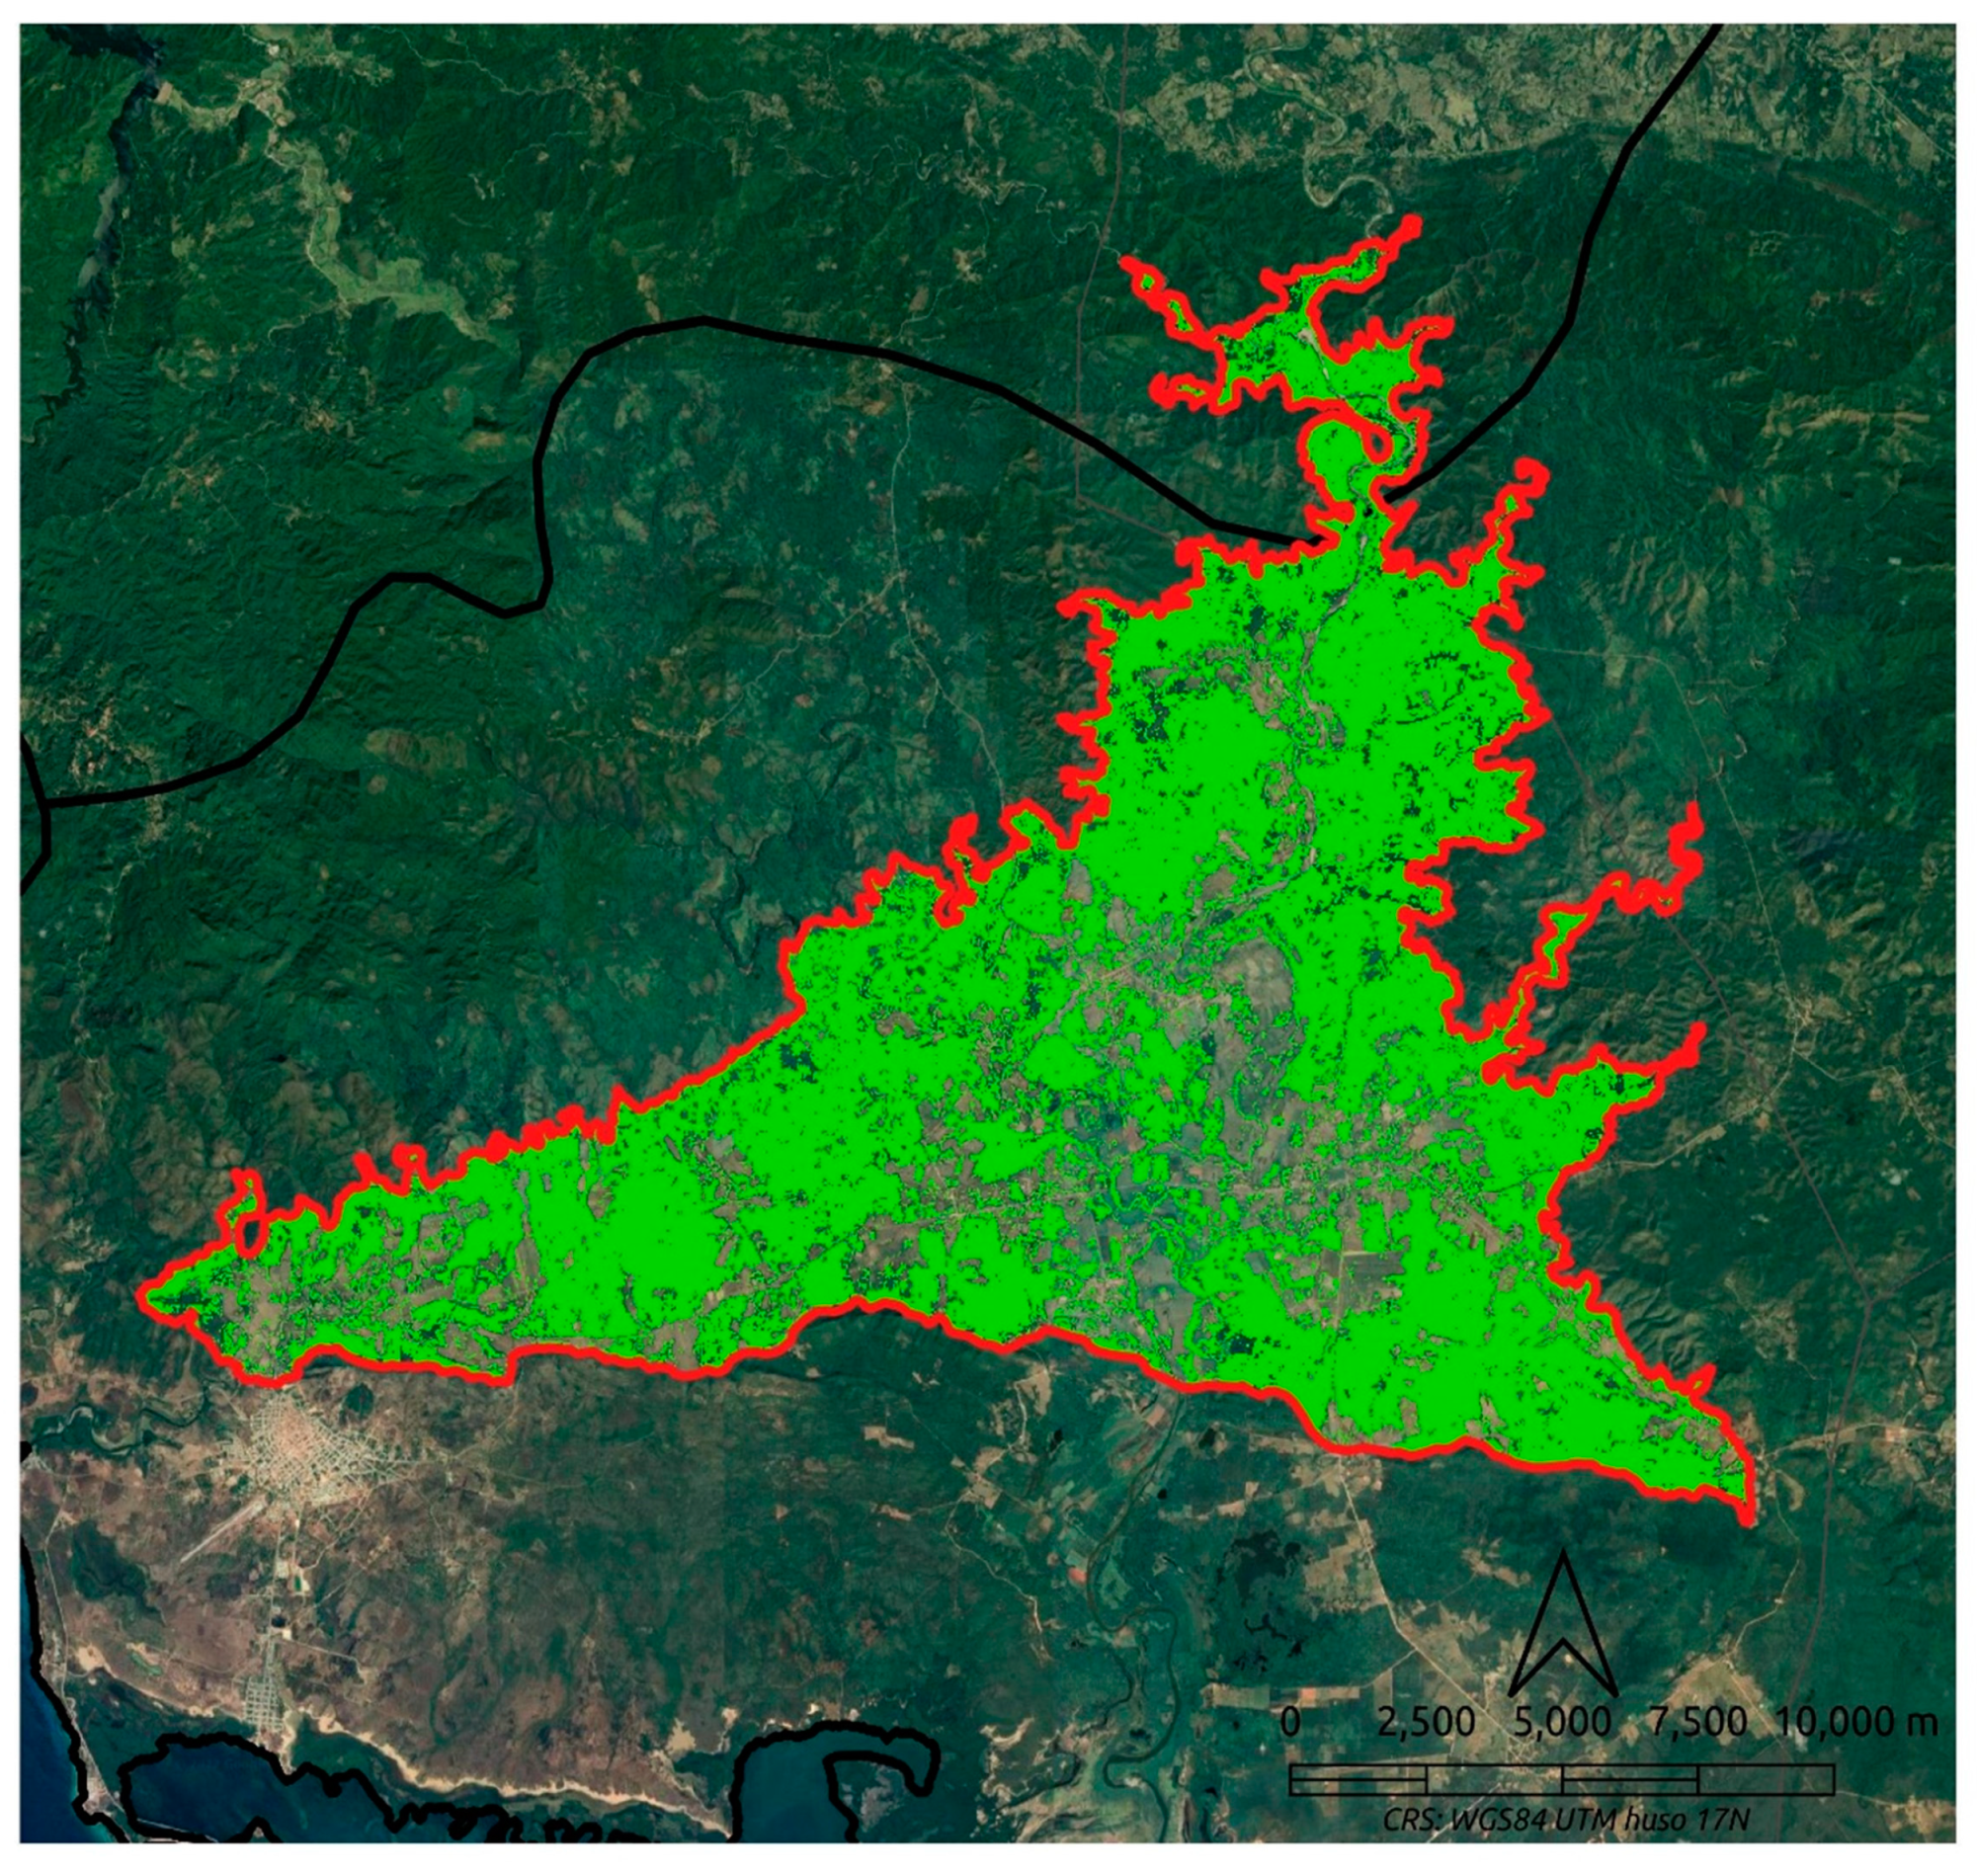
The integration of digital terrain models (DTM) with satellite imagery was crucial for the delineation of the Valle de los Ingenios. After testing different elevation levels, the application of an elevation threshold of 100 m made it possible to delineate the northern, eastern and western extent of the valley. The overlay of these boundaries with the images provided by the local authorities resulted in a coherent representation of the topography of the valley (Figure 3).
However, the southern boundary proved to be a difficult task as elevation 100 alone could not fully capture the intricate features of the valley. To solve this problem, various mountain ranges bounding the southern edge of the valley were considered in conjunction with high-resolution image interpretation. Thank to this comprehensive strategy, the southern boundaries could be precisely determined, ensuring an accurate representation of the Valle de los Ingenios in its entirety.
The resulting map, derived from the integration of elevation data and satellite imagery, provided a visually compelling representation of the geographic contours of the valley. Our digital delineation yielded a total area of 22,919.12 ha, which is close to the 250 km2 normally attributed to the valley. This elevation-based mapping approach served as a fundamental step in understanding the spatial characteristics of the Valle de los Ingenios and formed the basis for subsequent analysis and interpretation
3.2. Harmonic Curves
Harmonic curves were used to represent the temporal variability of the NDVI values for each pixel of the study area. The curves were calculated using the integrated tools of Google Earth Engine (GEE) and are based on data from Landsat 5, Landsat 7 and Landsat 8 satellite imagery from 2000 to 2018 (Figure 4).
The results of the harmonic curve analysis provided insight into the temporal dynamics of marabou vegetation in the study area and showed that marabou vegetation in the study area exhibits a seasonal cycle with peaks in NDVI during the local lighter, wet season (June to October) and minima during the darker, dry season (November to May) (Figure 5). This is consistent with a phase of 0.75 indicating that the peak in NVDI values occurs in the middle of the lighter, wetter season (Figure 5). These harmonic temporal NDVI changes are common in perennial species and may be related to changes in the photosynthetic activity of marabou due to the alternation between wet and sunny or dry and dark conditions [35] The mean NDVI value for marabou vegetation in the study area was 0.75, indicating that marabou is a relatively productive vegetation species. The amplitude of 0.48 suggests that NDVI values vary by up to 40% over the course of a year, which is relatively small compared to other vegetation types, but again consistent with NVDI variability in tropical vegetation, where sunlight and water levels can vary over time but are not limiting factors [36]
3.3. Confusion Matrix
Based on field data collected in 2014, the random forest algorithm proved to be the best choice, exhibiting good overall accuracy. Its adaptive nature proved helpful in effectively recognizing complicated patterns and ensured accurate classification across a wide range of land cover types. With an overall accuracy of 0.9265, Random Forest categorized more than 92% of the data correctly and showed the best accuracy in assigning labels to different land cover classes. Furthermore, the kappa coefficient yielded a value of 0.8996. This robust kappa value shows that the RamdomForest algorithm was able to recognize patterns within the dataset, even when randomness was taken into account (Table 2)
3.4. Coverage Maps and Data
The analysis of the development of the marabou infestation in the Valle de los Ingenios revealed a complex pattern of spatial distribution and temporal development. Originally, the marabou area was relatively small, covering 7,908.1 hectares in 2002, until it declined to 5,067.5 hectares in 2004. During this period, the situation remained stable, and the infestation was mainly concentrated in the northern, eastern, and western borders of the valley, bordering the Sierra del Escambray, a mountainous region with limited agricultural activity and difficult access (Figure 6a, Table 3)).
Between 2004 and 2005, coinciding with the closure of the last sugar factory in the region (Central FNTA or Central Trinidad), the area affected by marabou increased dramatically, tripling from 5,067 hectares in 2004 to an astonishing 14,376 hectares in 2006. A comparison of the distribution maps for these years shows that the marabou's main areas of distribution are along the Sierra del Escambray, which has served as a weed reservoir since 2002, and along the Carretera 12 road (which connects Trinidad to the town of Sancti Spiritus), which has proven to be an important distribution route for the weed (Figure 6b, Table 3).
From 2006 to 2015, the area affected by marabou remained relatively stable, fluctuating between 14,376 hectares in 2006 and 12,326 hectares in 2010. Despite the general stability, the local community actively sought to control the infestation, focusing on accessible areas of high tourist value, such as the main roads, which previously favored the spread of marabou (Appendix C, Table 3)).
In 2015, coinciding with the Cuban government's institutional campaign against marabou on the occasion of the 500th anniversary of the city of Trinidad, a significant decrease in the area infested by marabou was observed. The affected area decreased from 12,796 hectares in 2015 to 10,330 hectares in 2016 and further to 8,772 hectares in 2017. The cleared areas were mainly located along the main roads, which was due to the accessibility of these areas for heavy machinery and the municipality's increased focus on clearing areas of high tourist importance (Figure 6c). As more areas were cleared, farmers gained easier access to previously inaccessible areas, which may explain the decrease in marabou-affected areas in 2017 after the government initiative was completed (Appendix C, Table 3).
In the last third of the study period (2018-2021), a progressive increase in marabou-affected area was observed, rising from 9,329 hectares in 2018 to over 15,000 hectares in 2020 and 2021, marking the highest values in the analyzed time series (Figure 6d, Appendix C, Table 3). This resurgence can possibly be attributed to the clearing of previously abandoned sugarcane fields that had acted as barriers to the spread of marabou. The removal of these barriers facilitated the spread of the marabou plant into new areas, leading to the observed increase in infestation.
4. Discussion
The rapid spread of the marabou plant, an invasive plant species, poses a significant ecological and economic threat to the Valle de los Ingenios, a UNESCO World Heritage Site in Cuba. In our study, Google Earth Engine (GEE), a cloud-based platform for geospatial analysis, was used to comprehensively assess the spatial and temporal distribution of marabou infestation in the valley. Our results first highlight the importance of using cost-effective and user-friendly tools such as Google Earth Engine to assess marabou infestation in developing countries. GEE's ability to accurately locate and monitor marabou infestations over time, as well as its ability to detect the impact of human activities on the environment, make it a valuable tool for environmental management and decision making [37,38]. Furthermore, our results are consistent with previous findings that emphasize the importance of time series analysis, particularly the NDVI, for understanding the successional trajectories of both tropical forests and coastal areas [36,39]. The intricate relationship between forest and coastal structure and NDVI can be applied to our context and helps characterize marabou infestation stages in mixed environments such as Valle de los Ingenios.
By analysing nearly two decades of satellite imagery, our data revealed a complex pattern of marabou expansion and decline influenced by a variety of factors. Initially, the marabou population remained relatively small, but after the closure of the last sugar factory in the area in 2005, it increased dramatically. This sharp increase is attributed to the abandonment of agricultural land following the disappearance of the sugar industry in the area, which provided ideal conditions for marabou dispersal. The observed pattern of marabou dispersal indicates a complex interplay between ecological and socio-economic factors. The abandonment of agricultural land after the closure of the sugar factory created favourable conditions for marabou settlement and dispersal. Thus, the colonization dynamics of marabou followed known patterns, such as the location of initial dispersal areas in natural weed reservoirs such as hard-to-reach mountainous areas on the edge of the valley and the use of roads and railroads as dispersal routes, which are common strategies for both allochthonous and autochthonous weed dispersal [40].
The subsequent government-led campaign against marabou in 2015, which coincided with the 500th anniversary of the city of Trinidad, led to a significant reduction in the area infested with marabou. Since then, however, the marabou population has rebounded, possibly due to the clearing (but not subsequent utilization) of previously abandoned sugarcane fields, which previously acted as a barrier to the spread of marabou. As with many other invasive weeds, allochthonous marabou is more competitive than native species and rapidly colonizes cleared areas if they are not restored or used for agriculture. This aggressive colonization dynamic has already been observed in invasive weed species [40,41,42] and poses a real threat to both agriculture and biodiversity. In this respect, our results are consistent with other studies on invasive weed species which are based on phenology-based mapping, such as Labonté et al. [43], use satellite images to determine the influence of disturbance and management practices on the spread of invasive plants [44], or demonstrate the importance of time-series analysis in invasive species mapping [45].
Our results also emphasize the importance of evaluating different marabou control methods, especially given the observed resurgence of marabou after clearing activities. Tailored strategies may be needed that are adapted to Cuban specificity and take into account the specific characteristics of different areas. For example, the promotion of agricultural activity and the reforestation of native forests near the Escambray Mountains and the enhancement of the tourist landscape along the transportation routes in the valley itself could be promising approaches. Our results emphasize the need for a comprehensive approach to marabou management that addresses both the ecological and socio-economic drivers of marabou expansion. This includes measures to restore abandoned agricultural land, the promotion of sustainable agricultural practices and the involvement of the local population in management measures.
It is important to acknowledge the limitations of our study, particularly in the validation process. Validation was conducted exclusively for the year 2014, which introduces potential issues related to differences between satellite platforms. The projection of the 2014 model without further validation is a limitation, and the relatively high accuracy achieved using only NDVI suggests that the use of additional complementary parameters would be beneficial for more comprehensive analyses in the future. The variation in satellite platforms can introduce discrepancies that need to be considered when interpreting the results. Addressing these limitations will help to improve the accuracy and robustness of invasive species analyses, making them more applicable for effective environmental management and decision-making. Anyway, it is worth noting that marabou, being a woody, evergreen plant, exhibits less spectral change compared to annual or deciduous woody plants. This means that NDVI may be a more reliable indicator of marabou presence than it would be for other types of invasive species.
Author Contributions
Conceptualization, E.M., E.G. and J.M.; methodology, E.M. and E.G.; validation, R.A.; formal analysis, E.M.; investigation, R.A.; resources, R.A.; data curation, R.A.; writing—original draft preparation, E.M.; writing—review and editing, J.M.; visualization, E.G.; supervision, J.M.; project administration, J.M.; funding acquisition, J.M. All authors have read and agreed to the published version of the manuscript.
Funding
This study was funded by the Andalusian Agency for International Development and Cooperation (AACID) [grant number 2017DEC013].
Data Availability Statement
The data that support the findings of this study are available on reasonable request from the corresponding author
Conflicts of Interest
The authors declare no conflict of interest.
Appendix A. Original Field Sampling Sheets

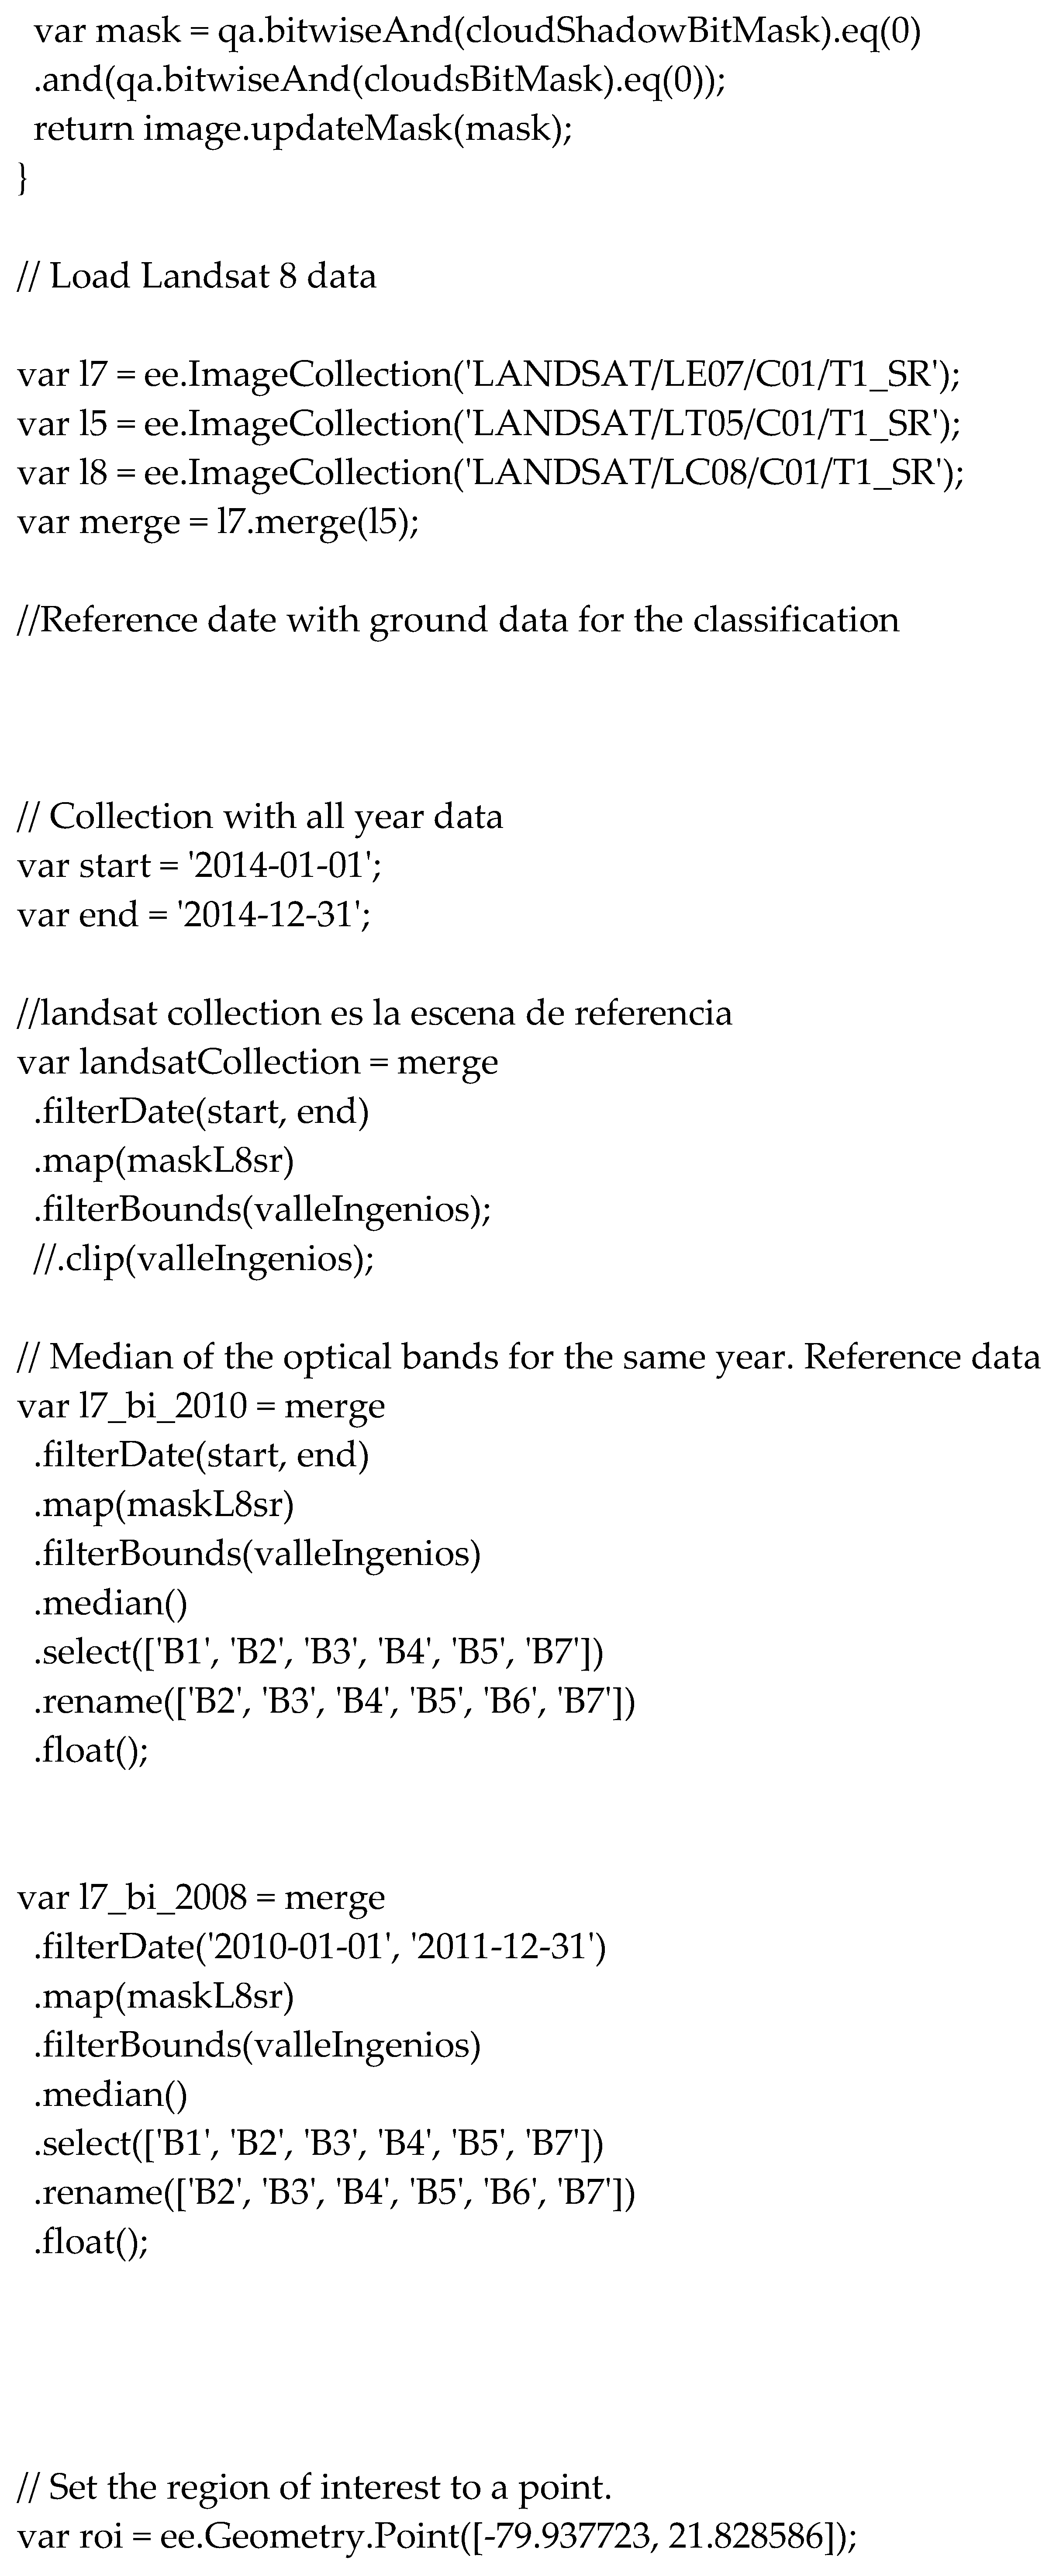
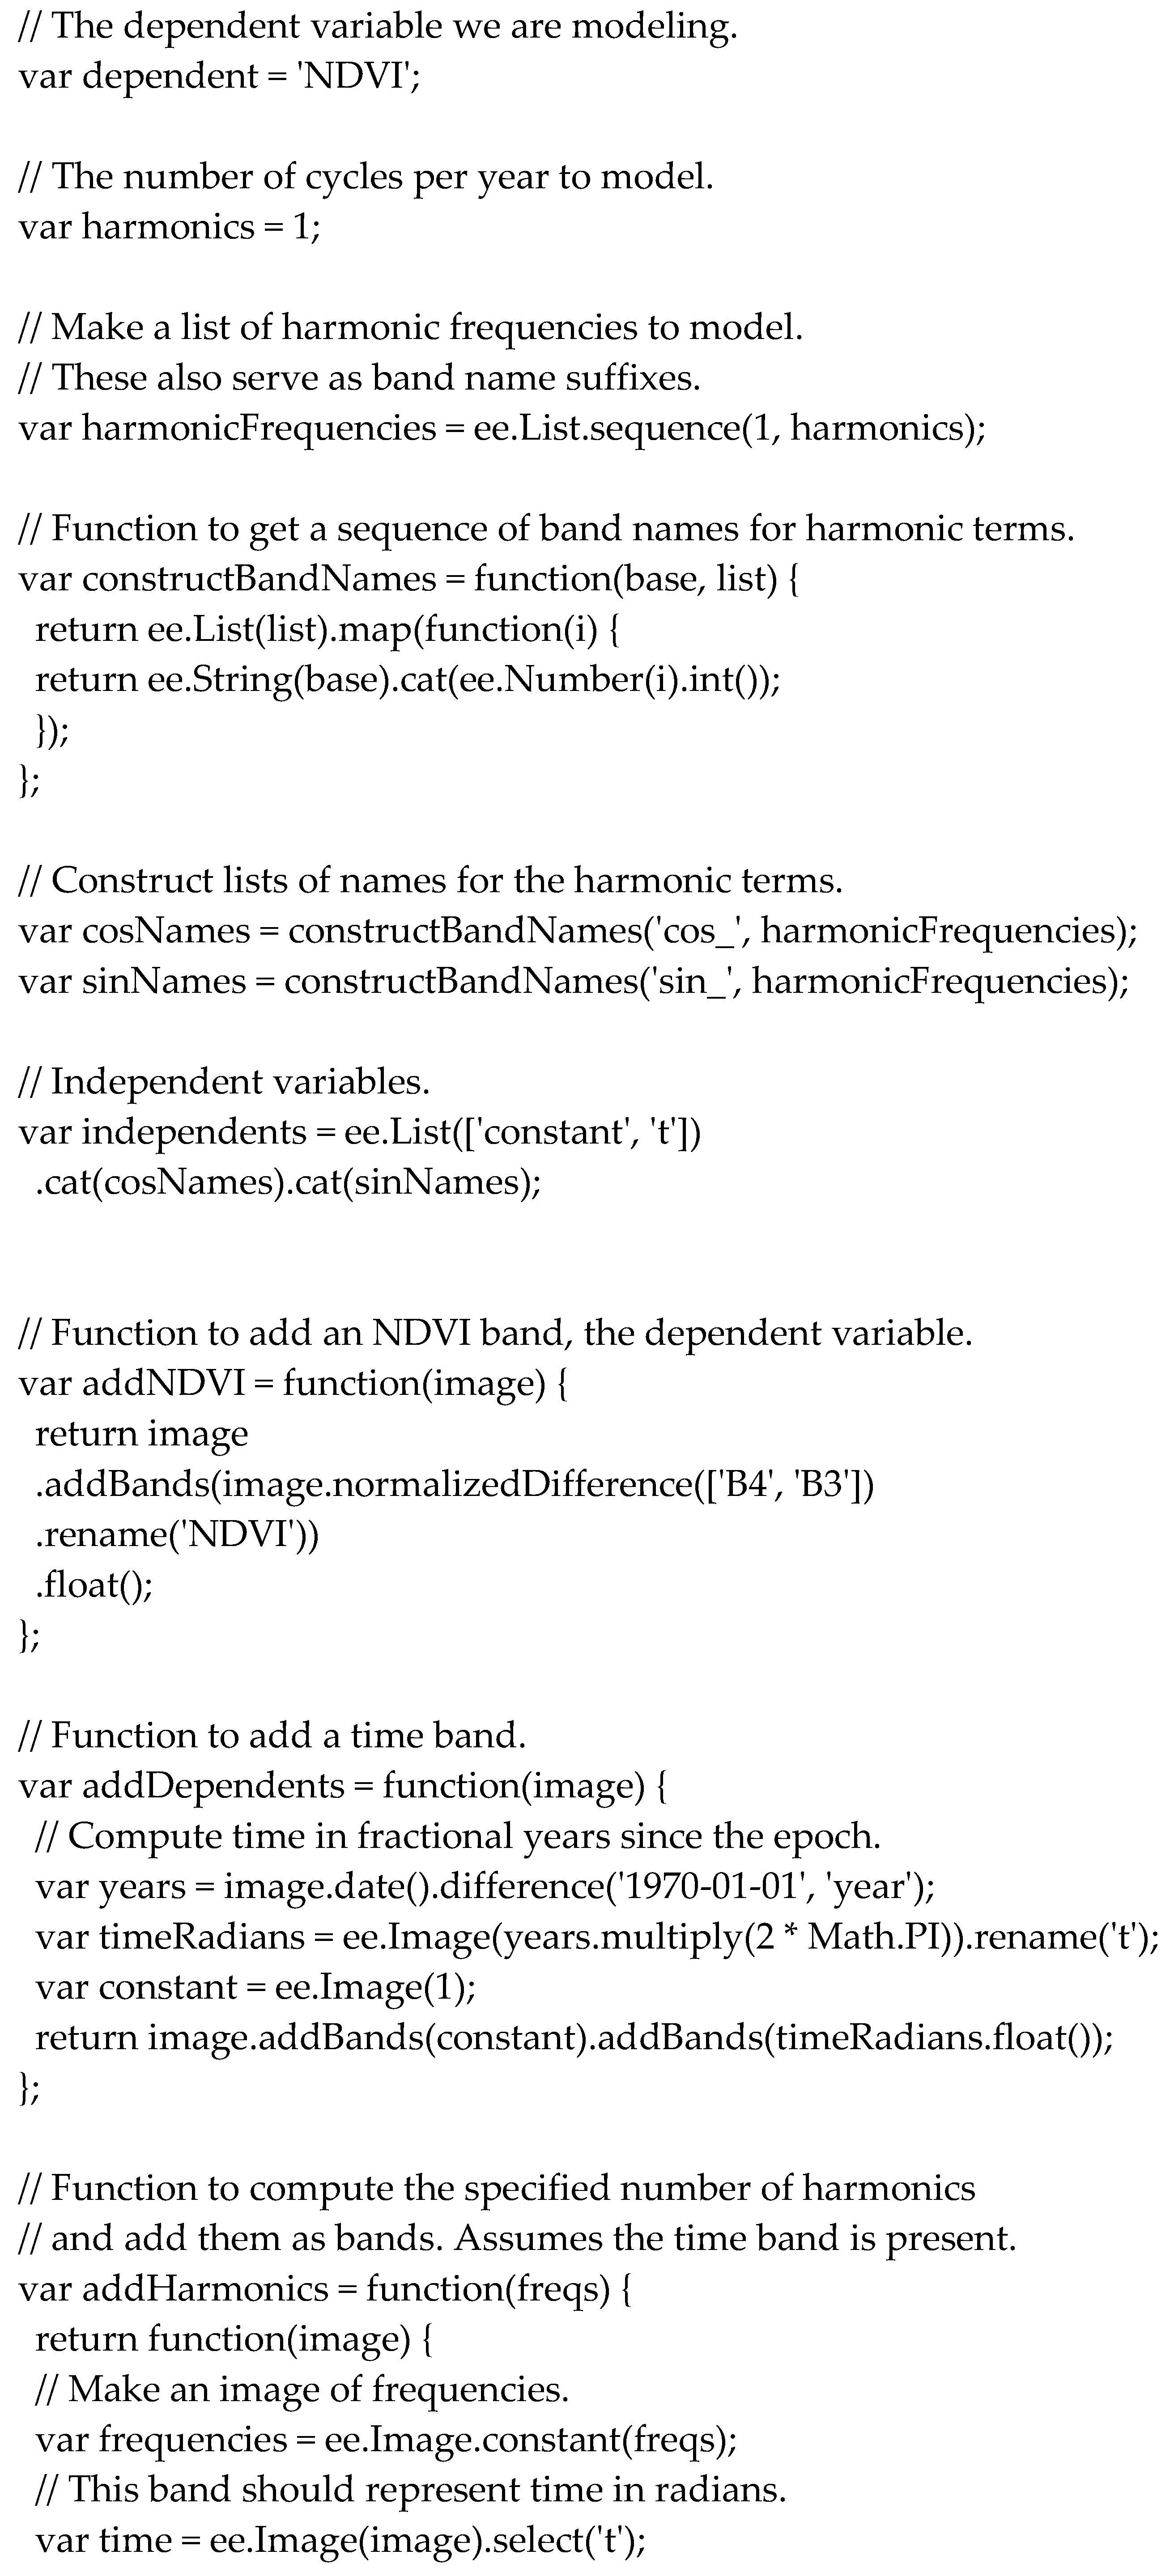
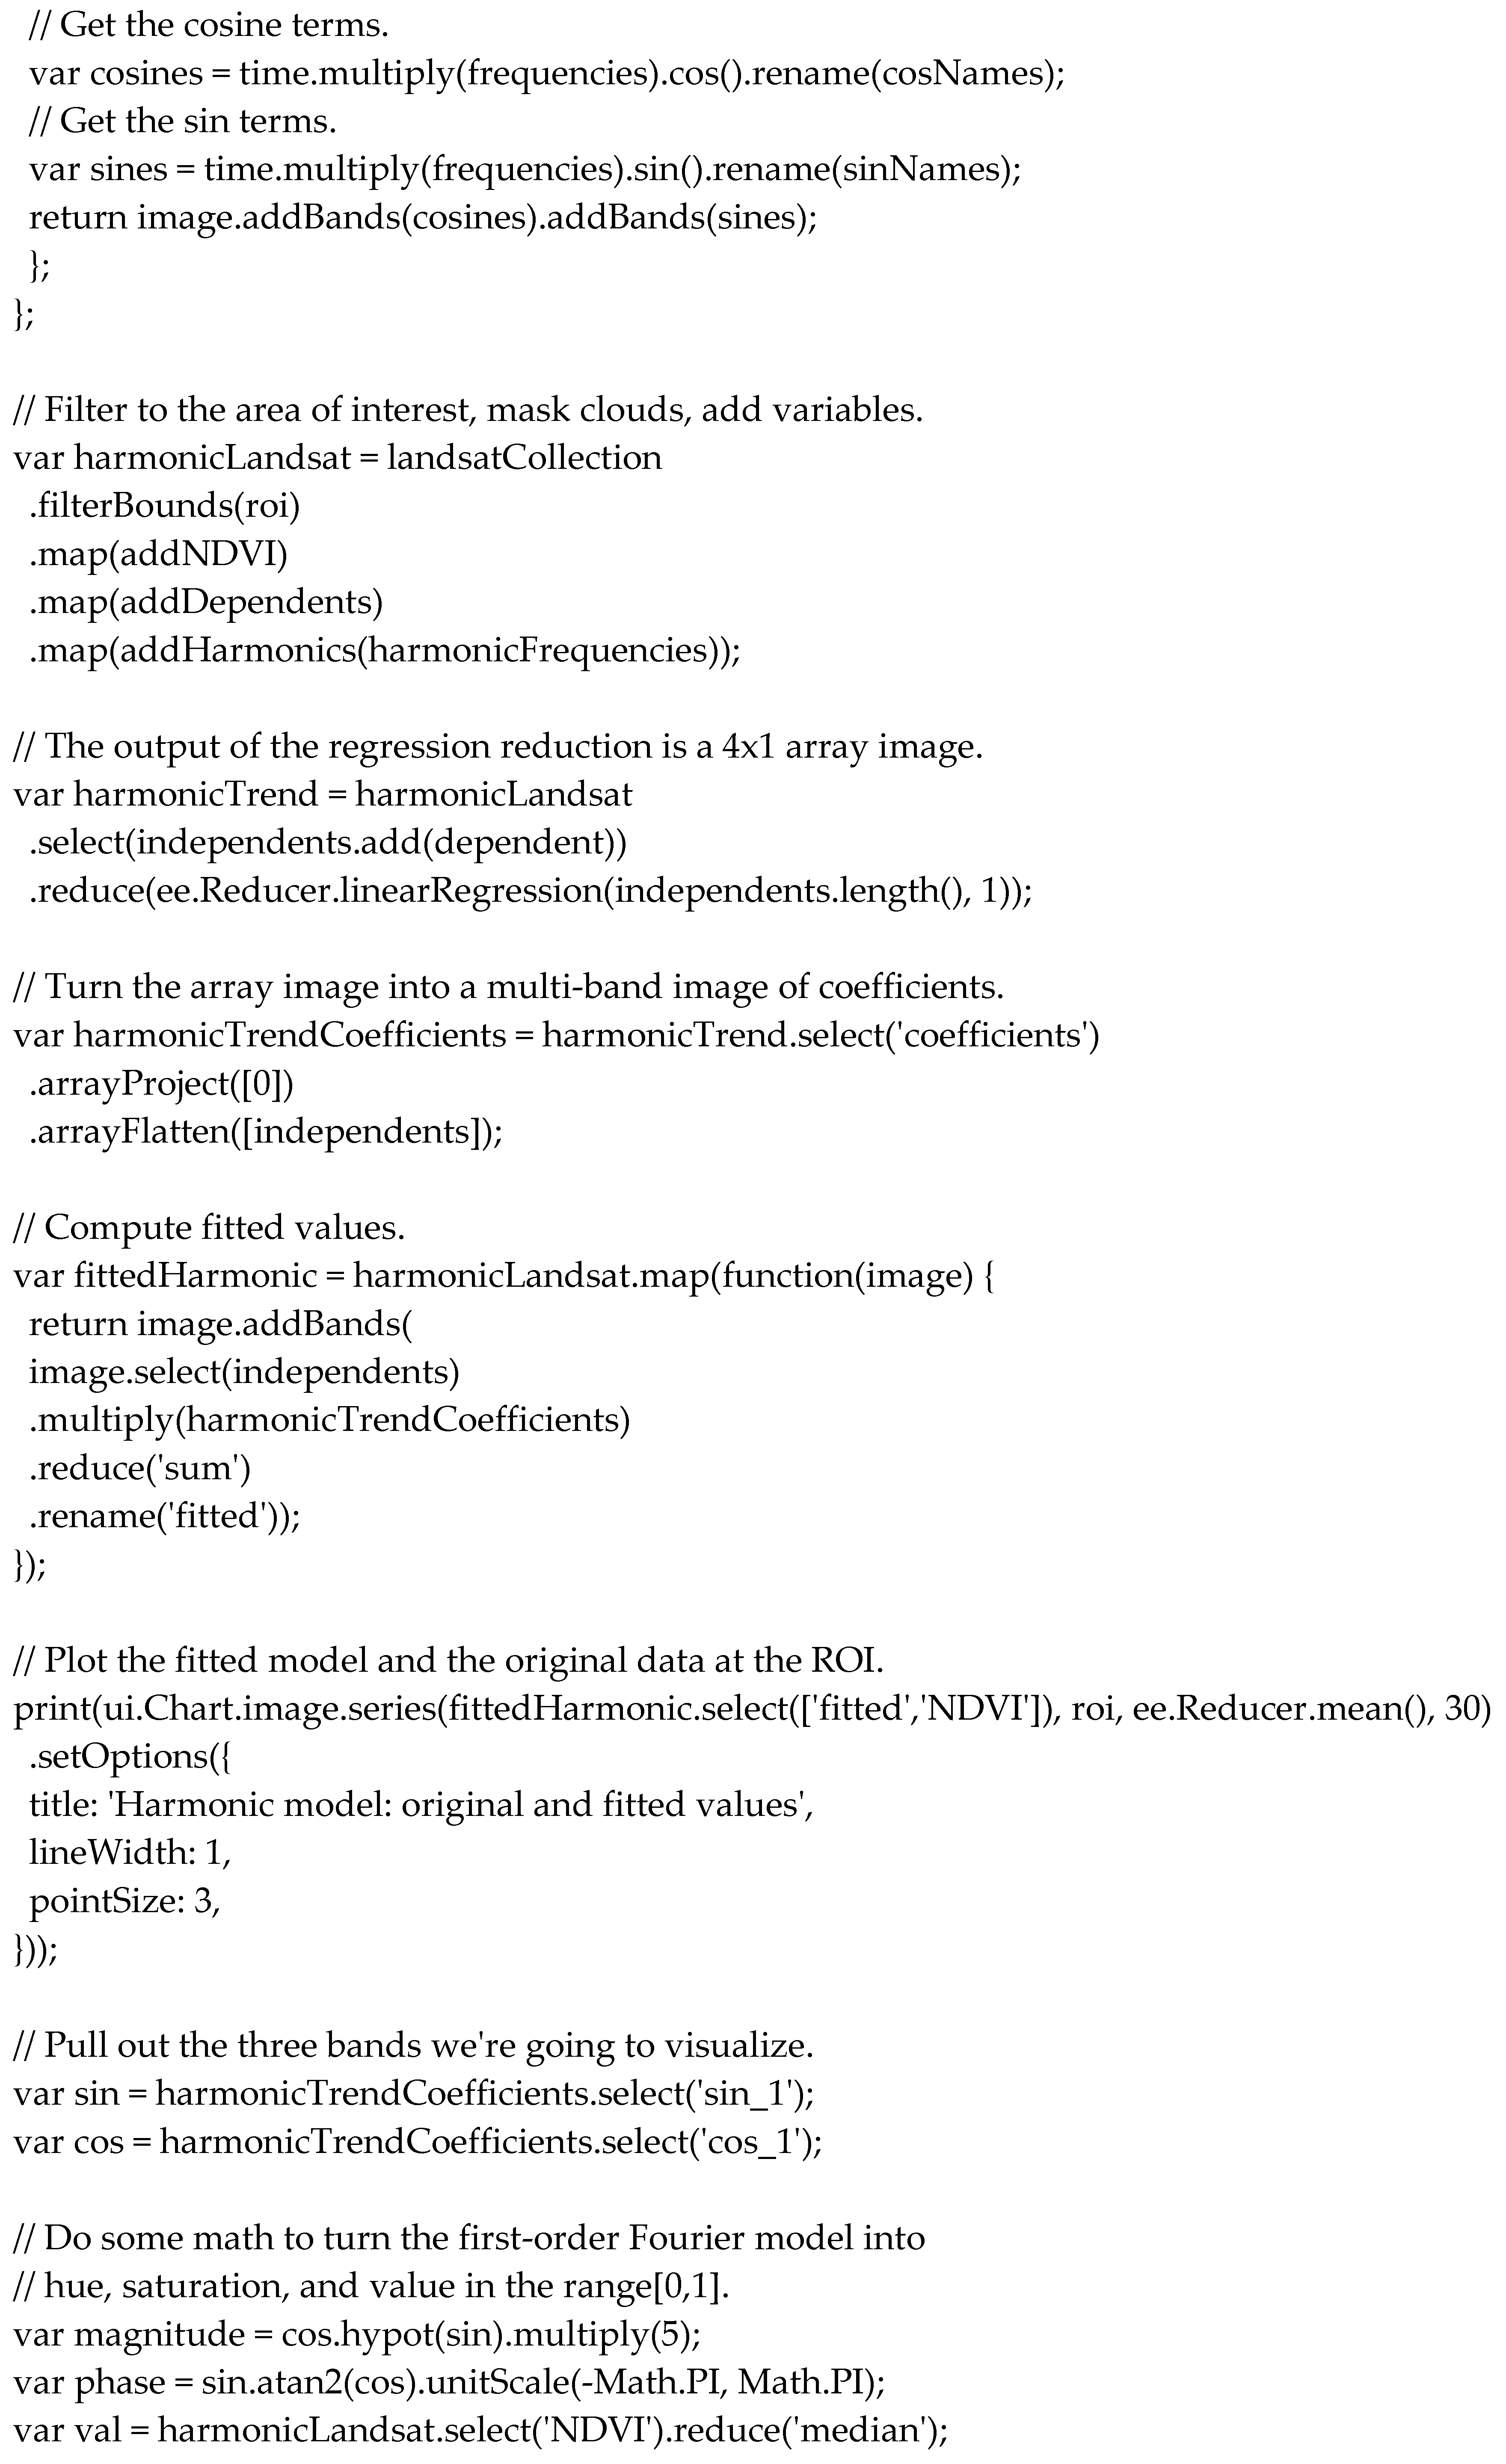
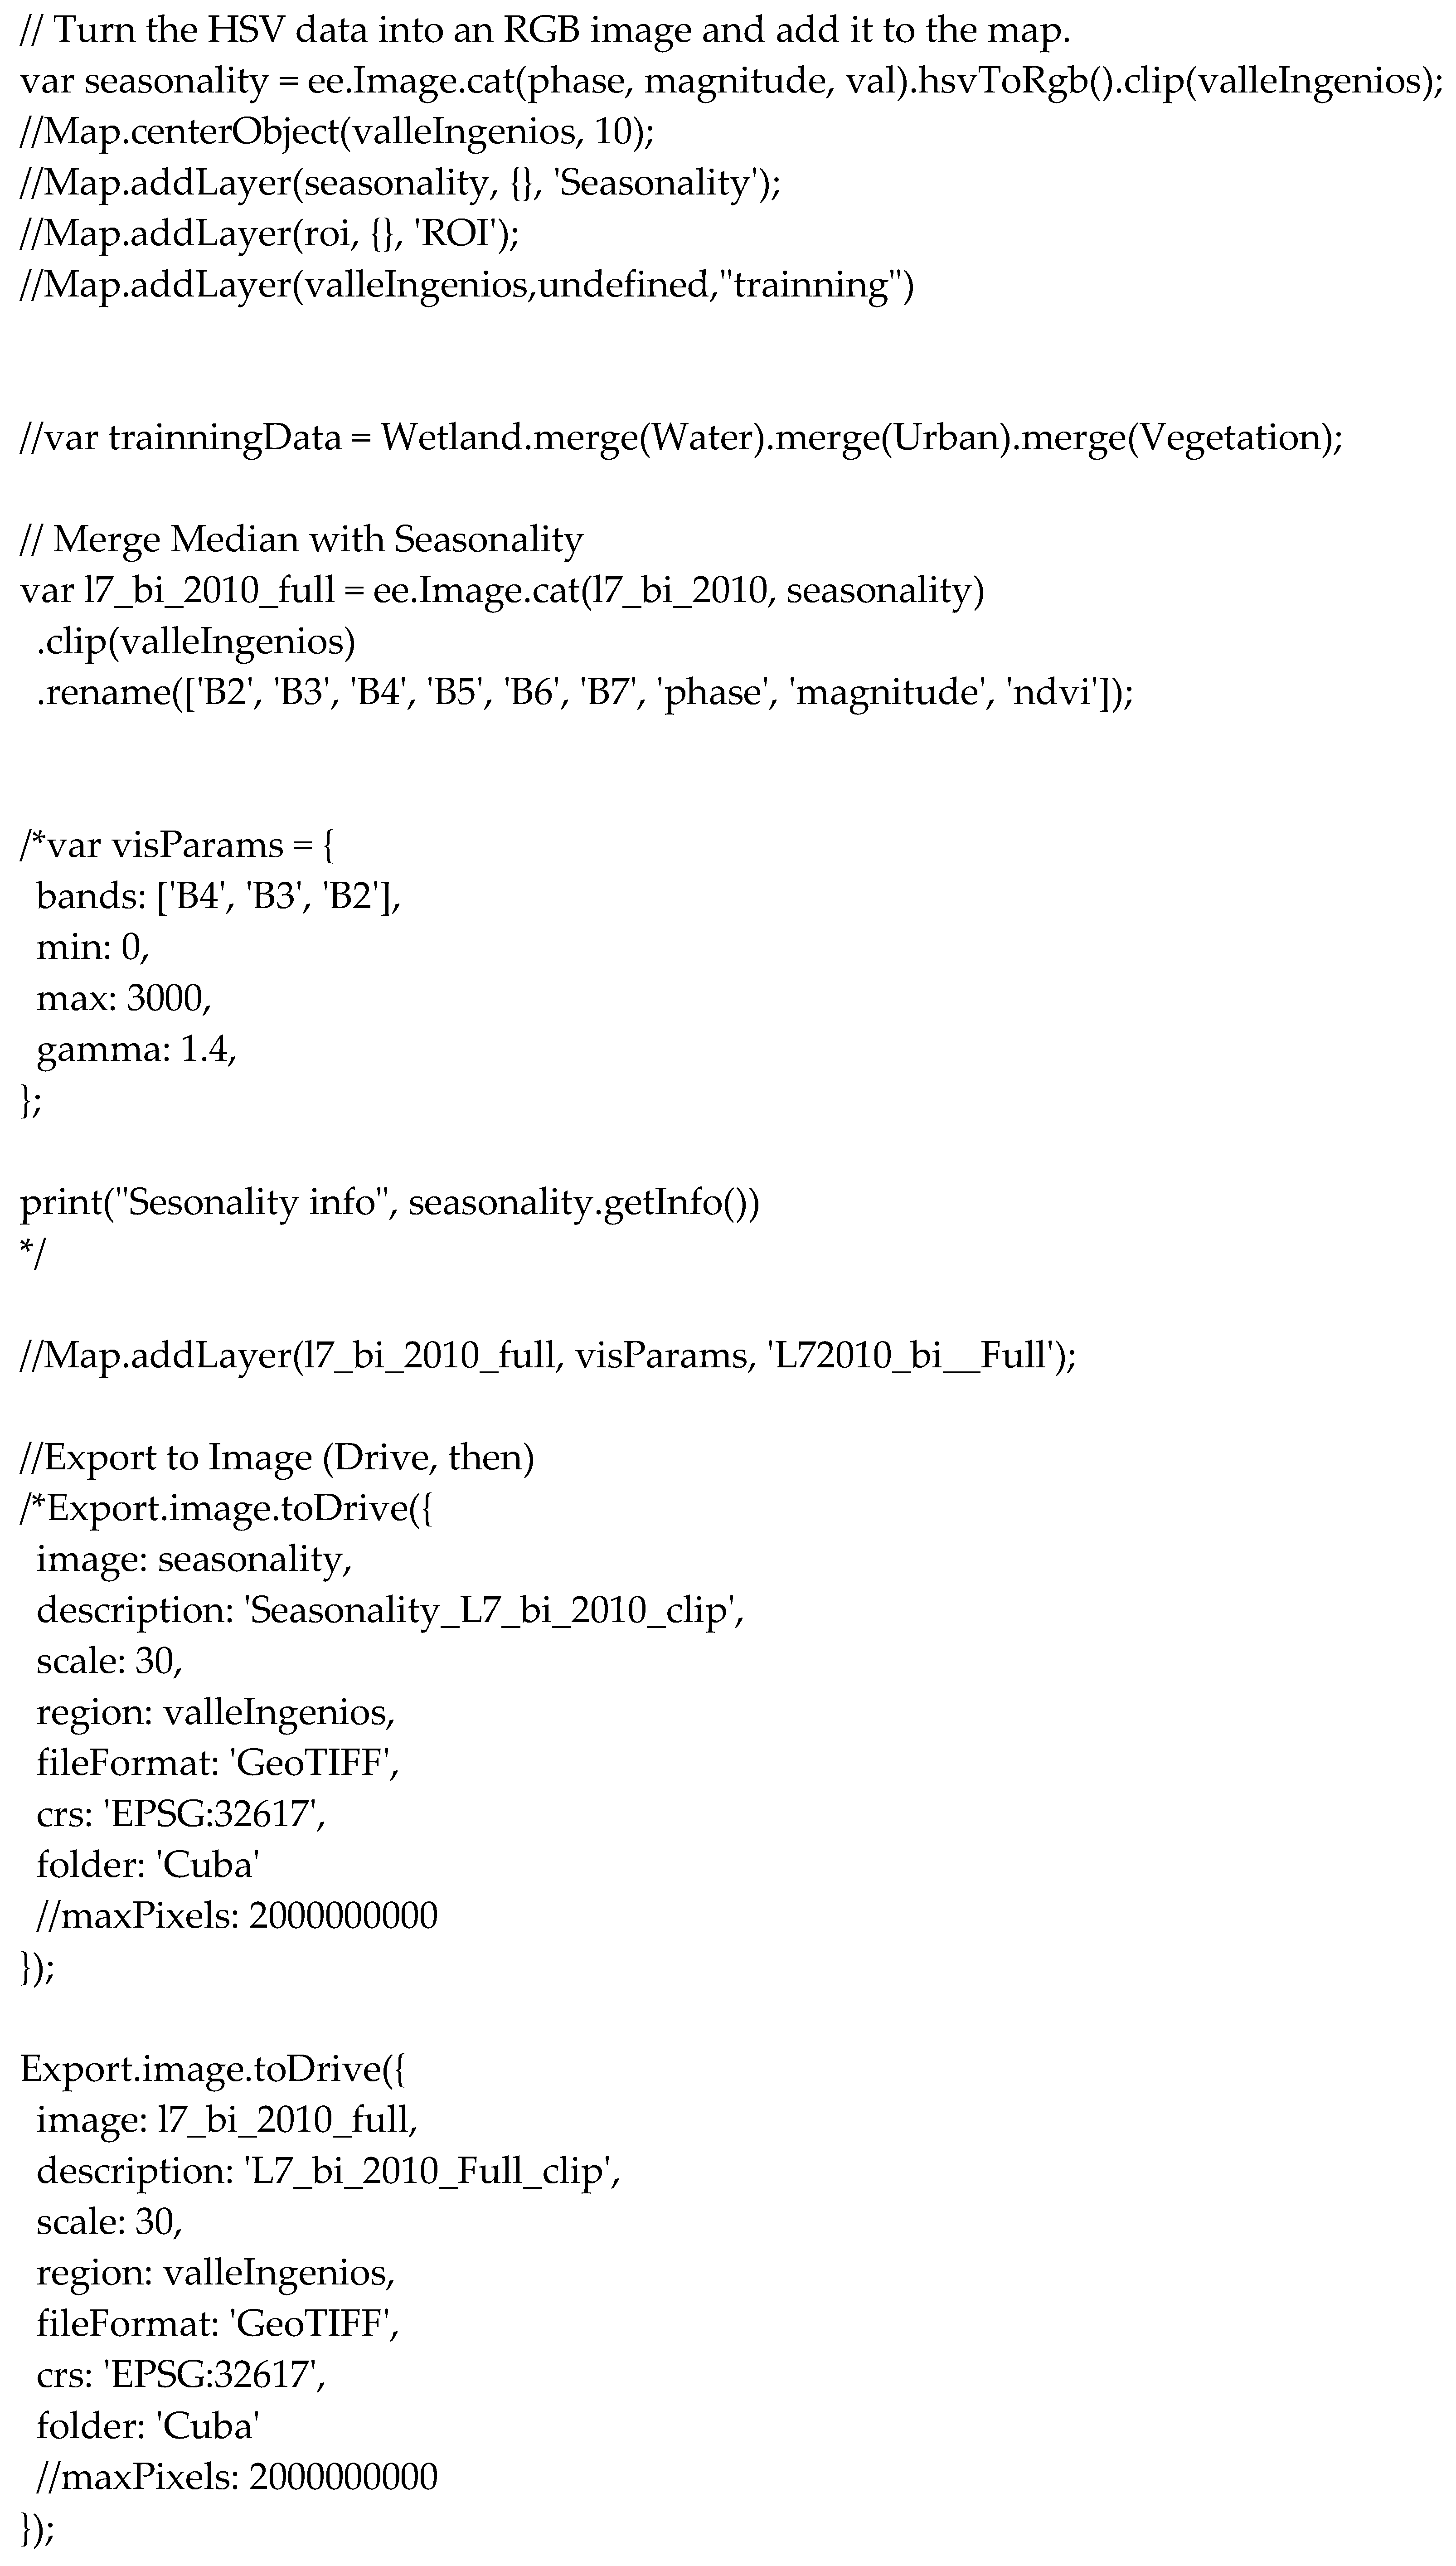
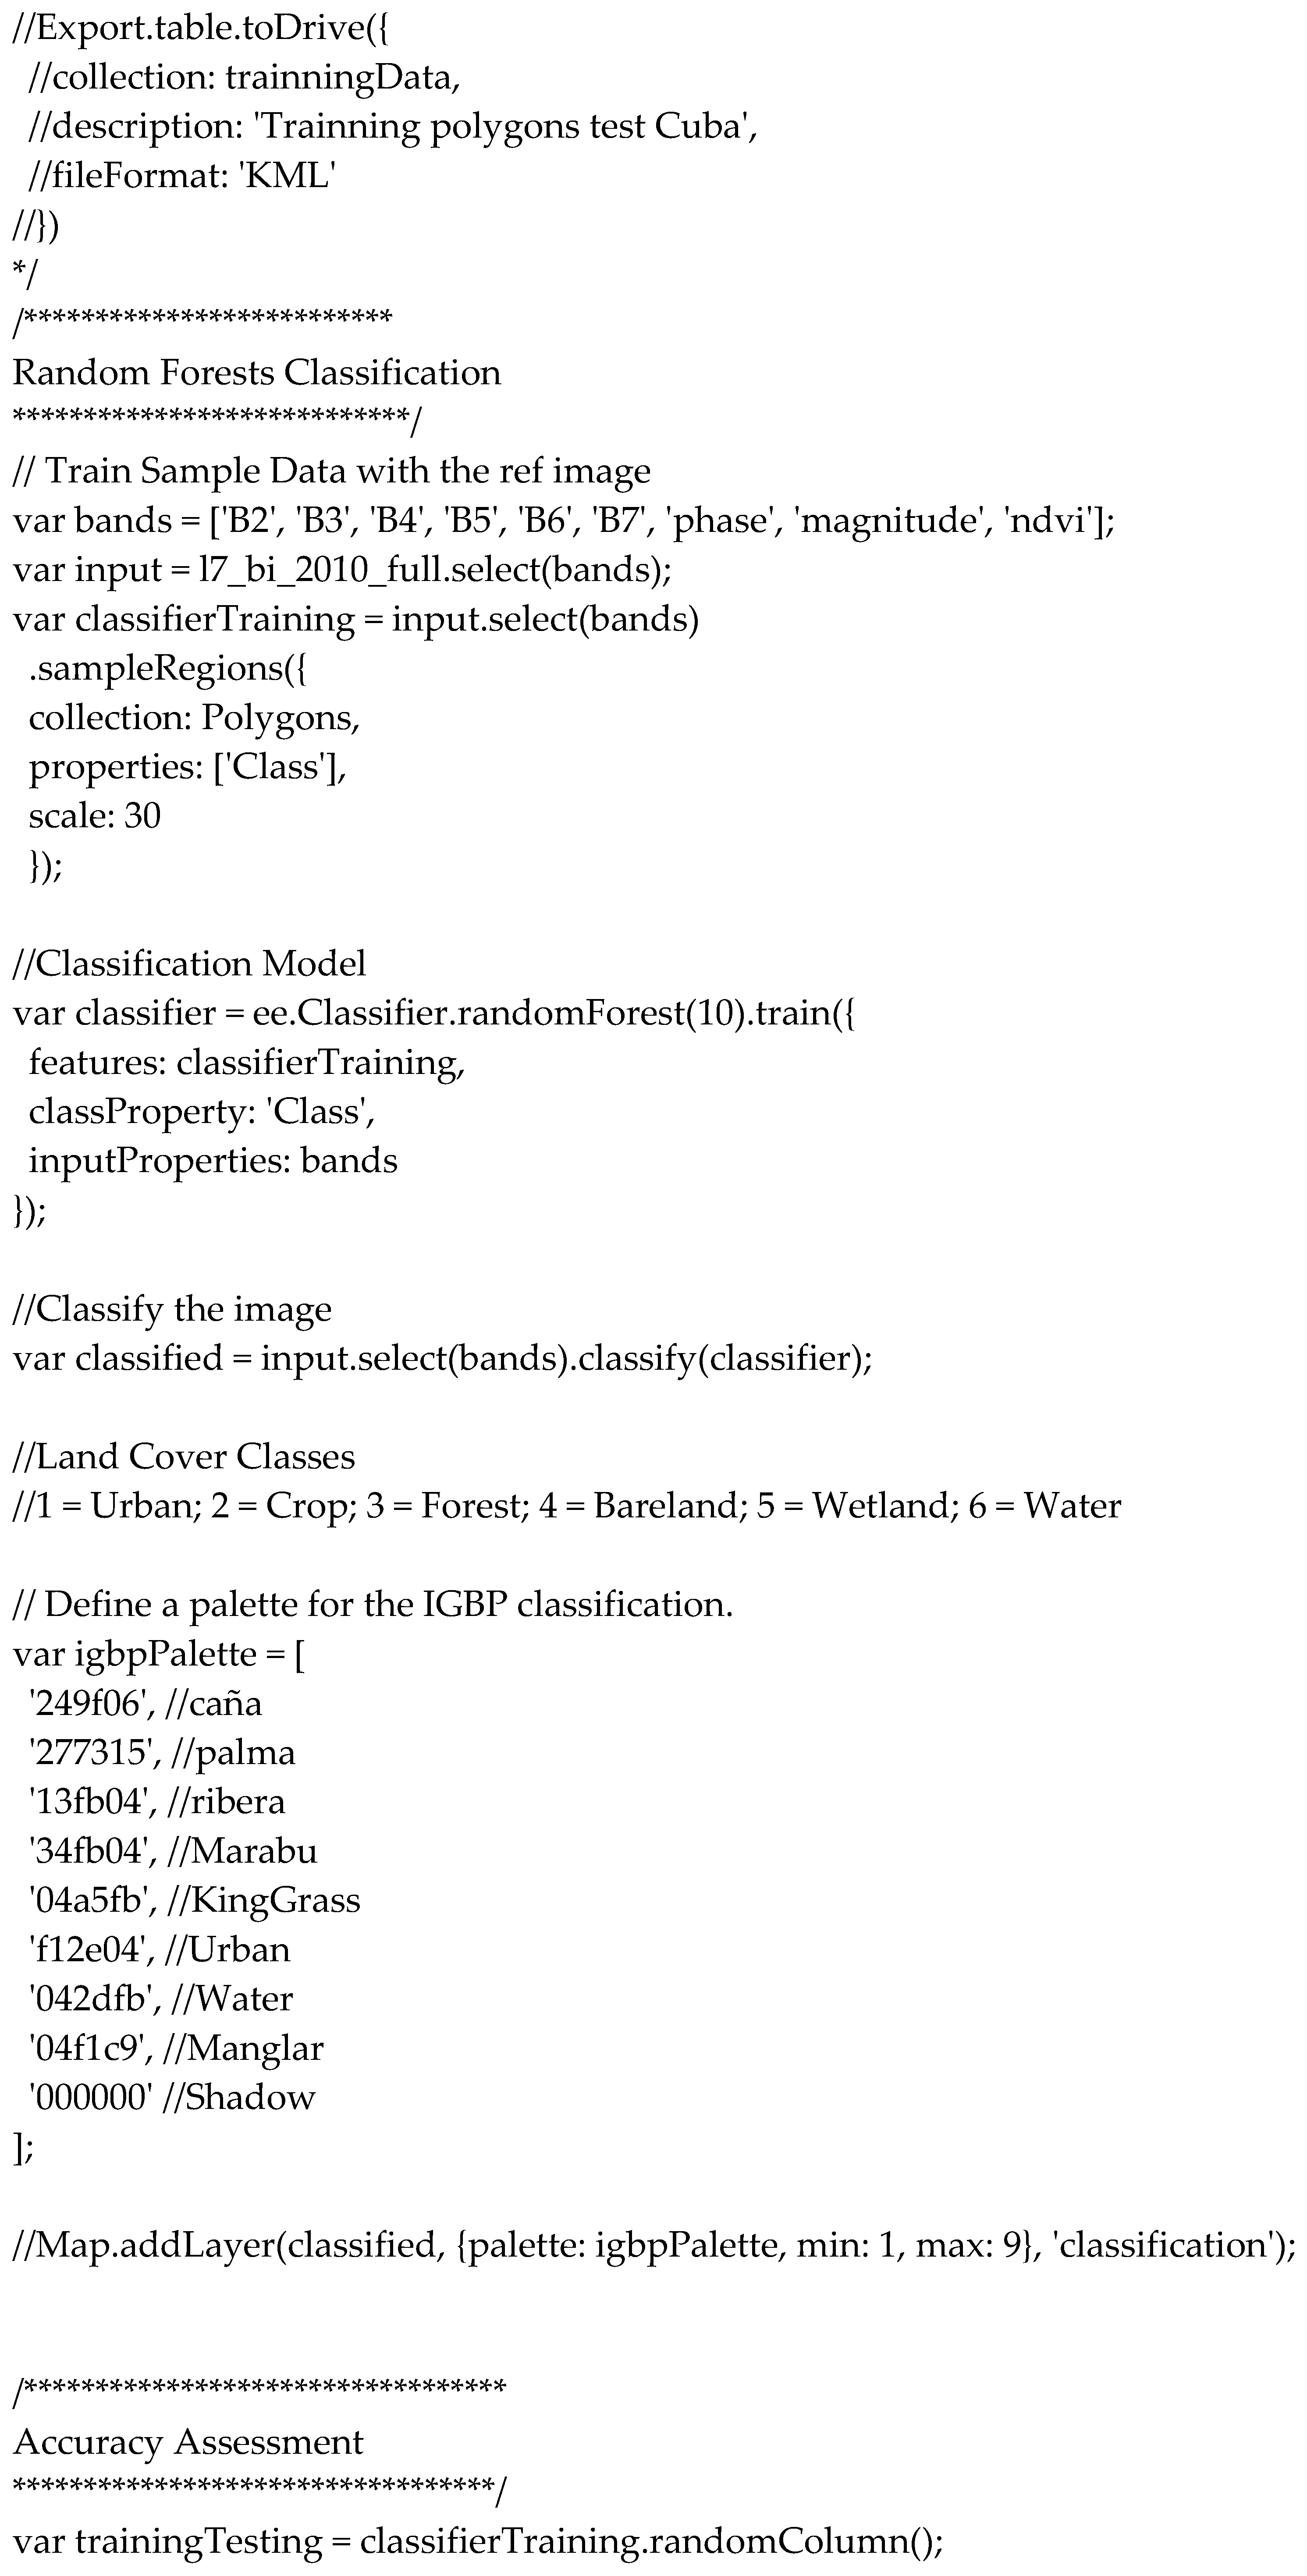
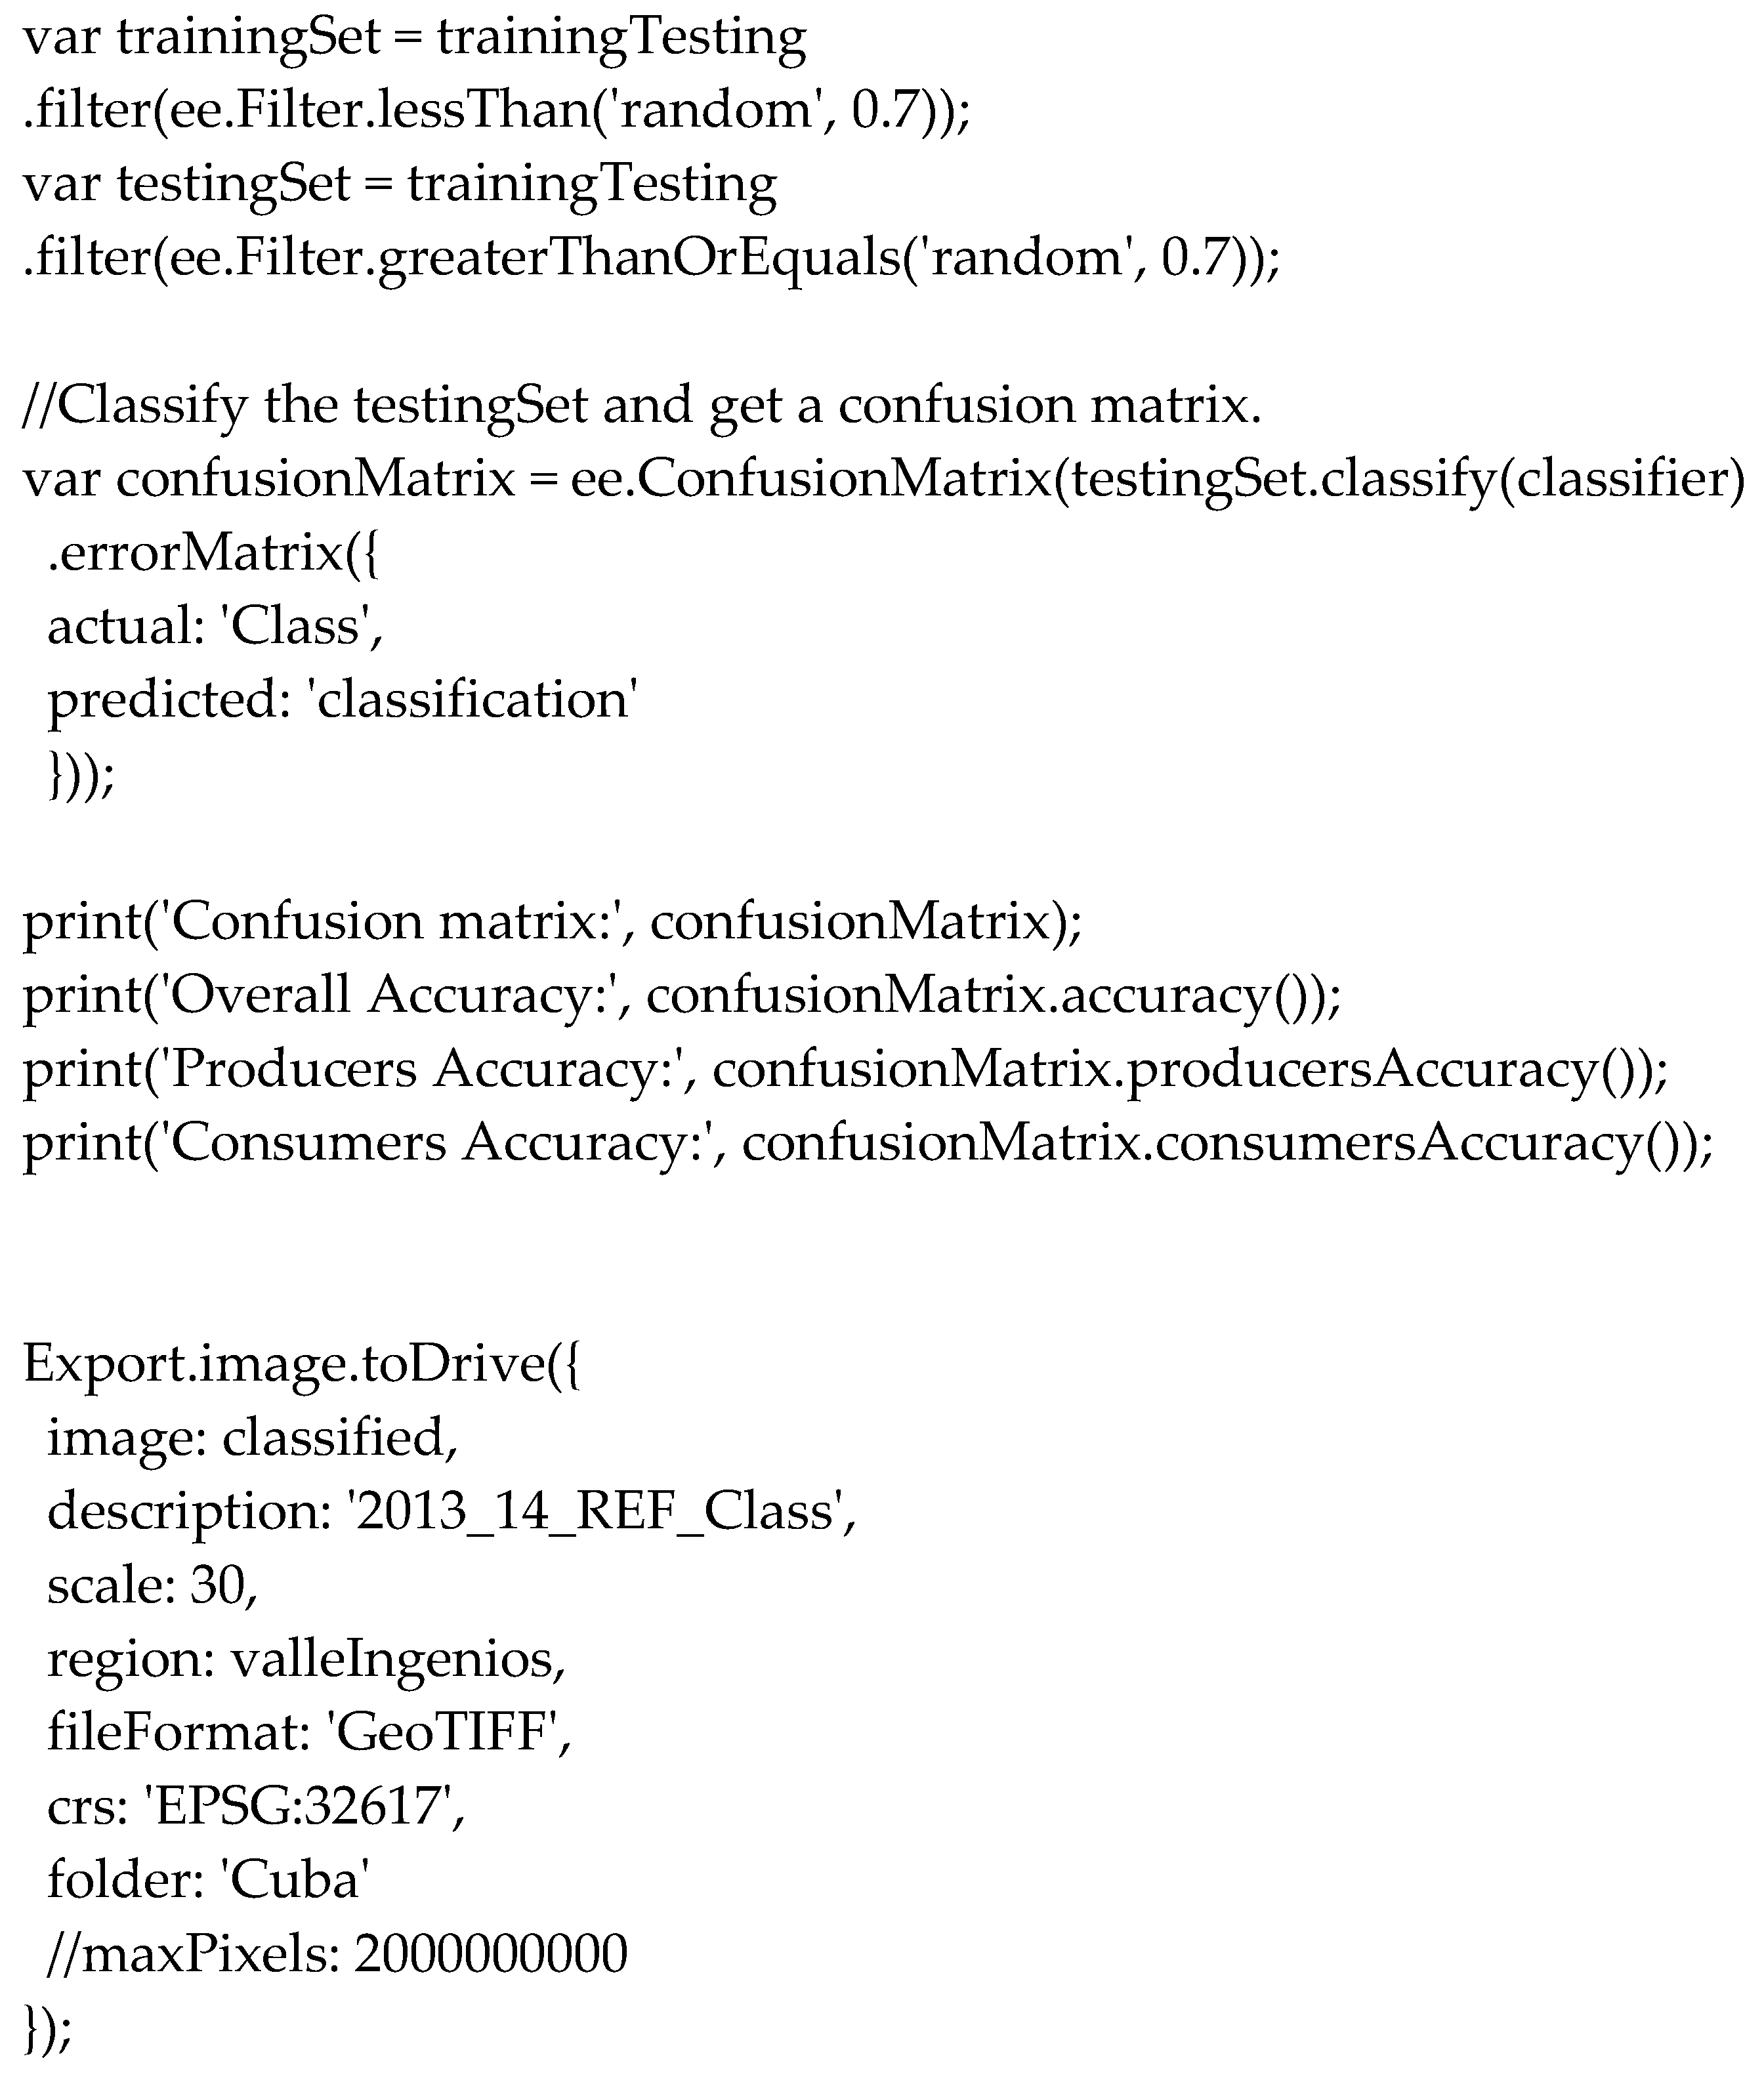
Appendix B. Javascript Code Used in Google Earth Engine Code Editor
The appendix is an optional section that can contain details and data supplemental to the main text—for example, explanations of experimental details that would disrupt the flow of the main text but nonetheless remain crucial to understanding and reproducing the research shown; figures of replicates for experiments of which representative data is shown in the main text can be added here if brief, or as Supplementary data. Mathematical proofs of results not central to the paper can be added as an appendix.
Appendix C
Figure A1.
Marabou year 2002.
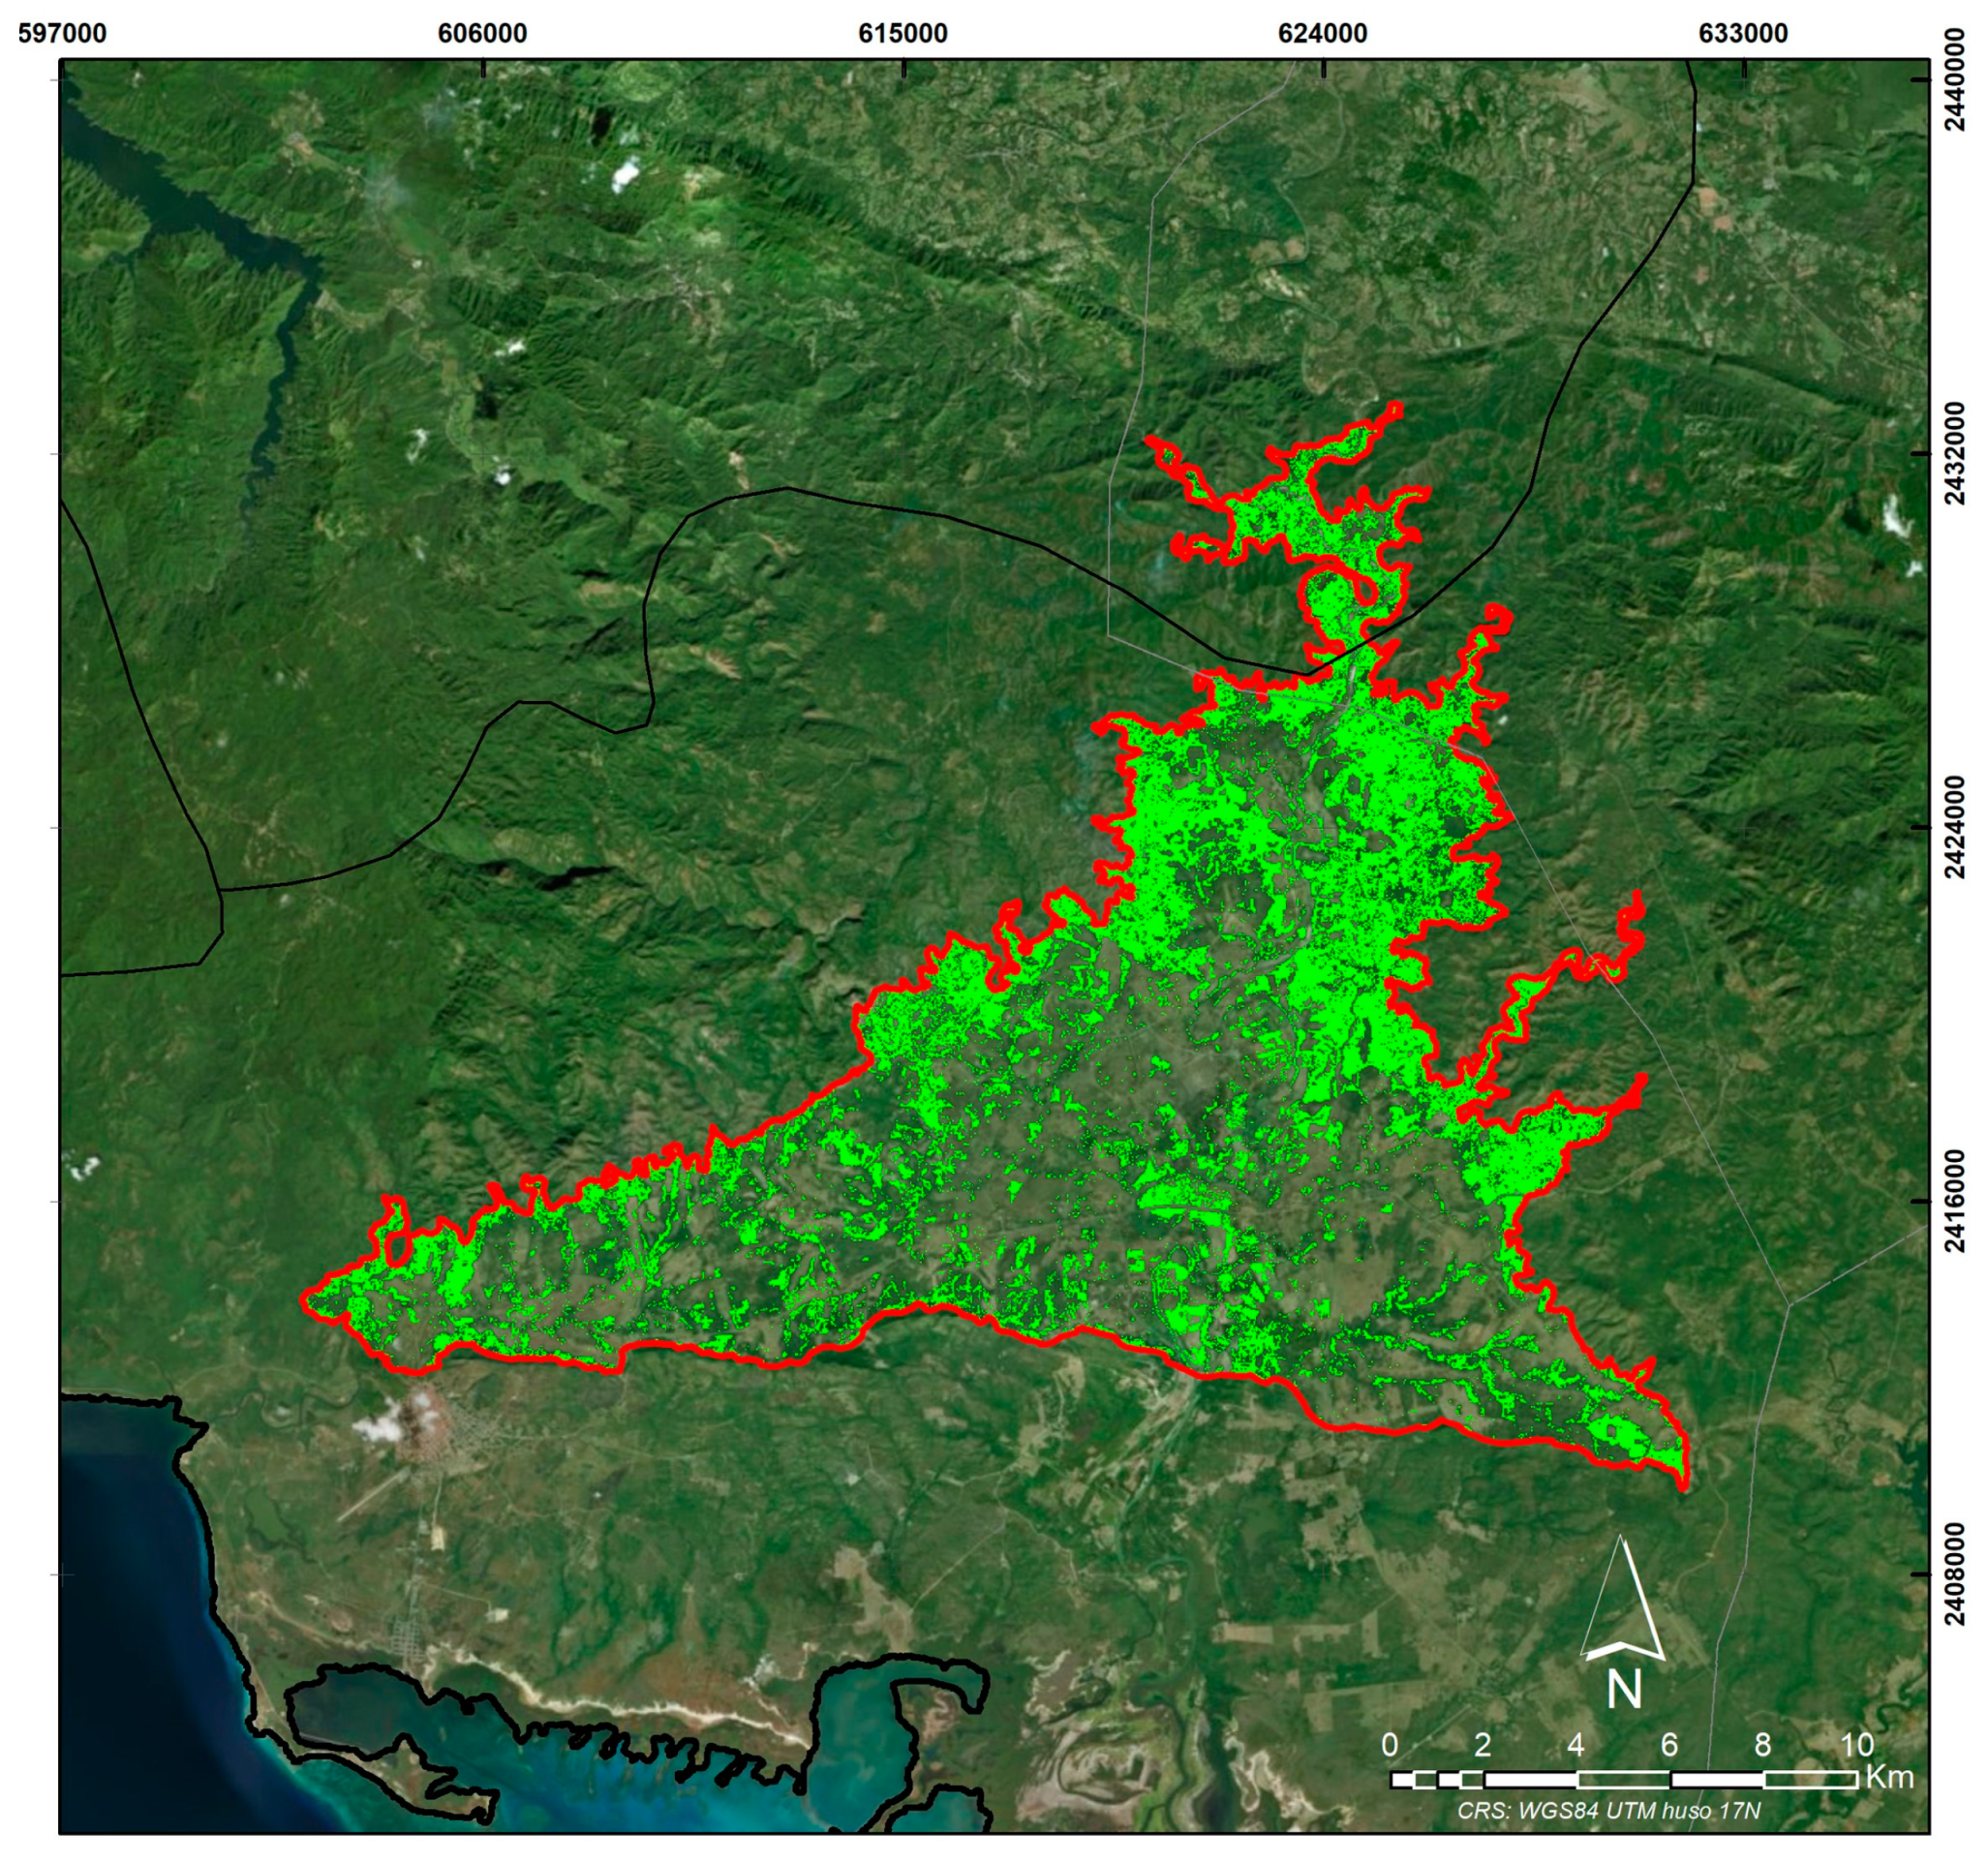
Figure A2.
Marabou year 2004.
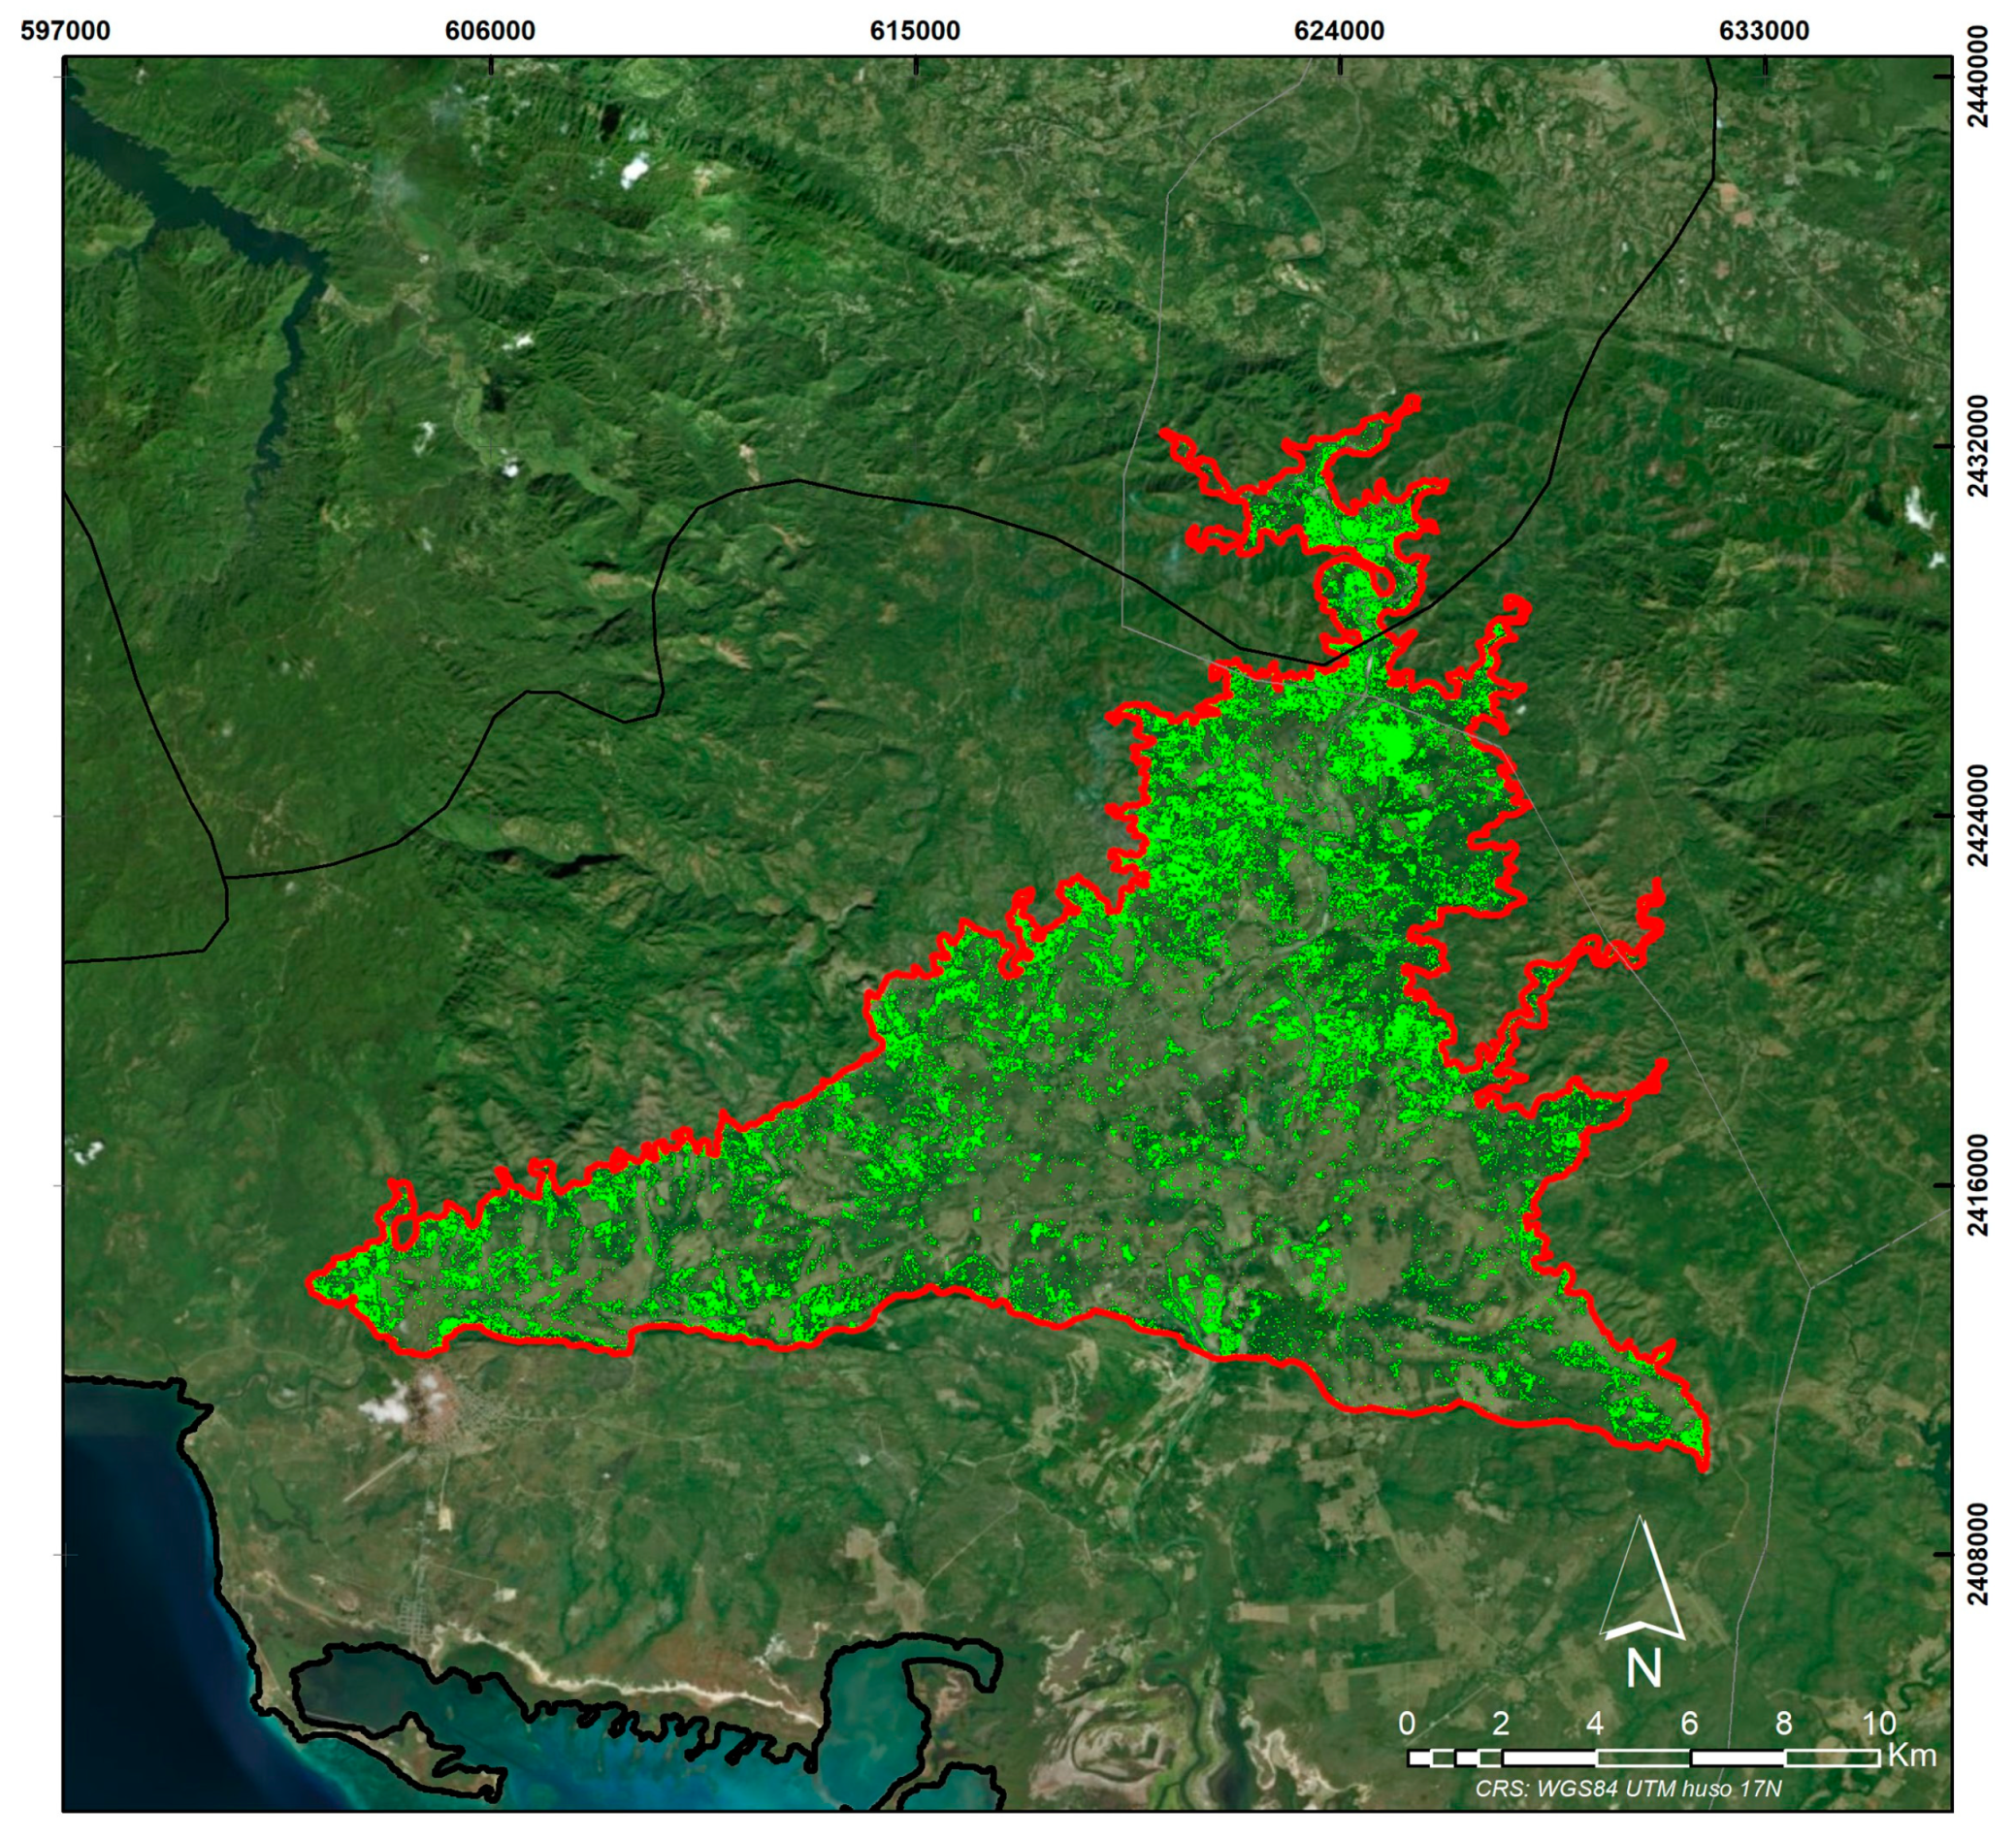
Figure A3.
Marabou year 2006.
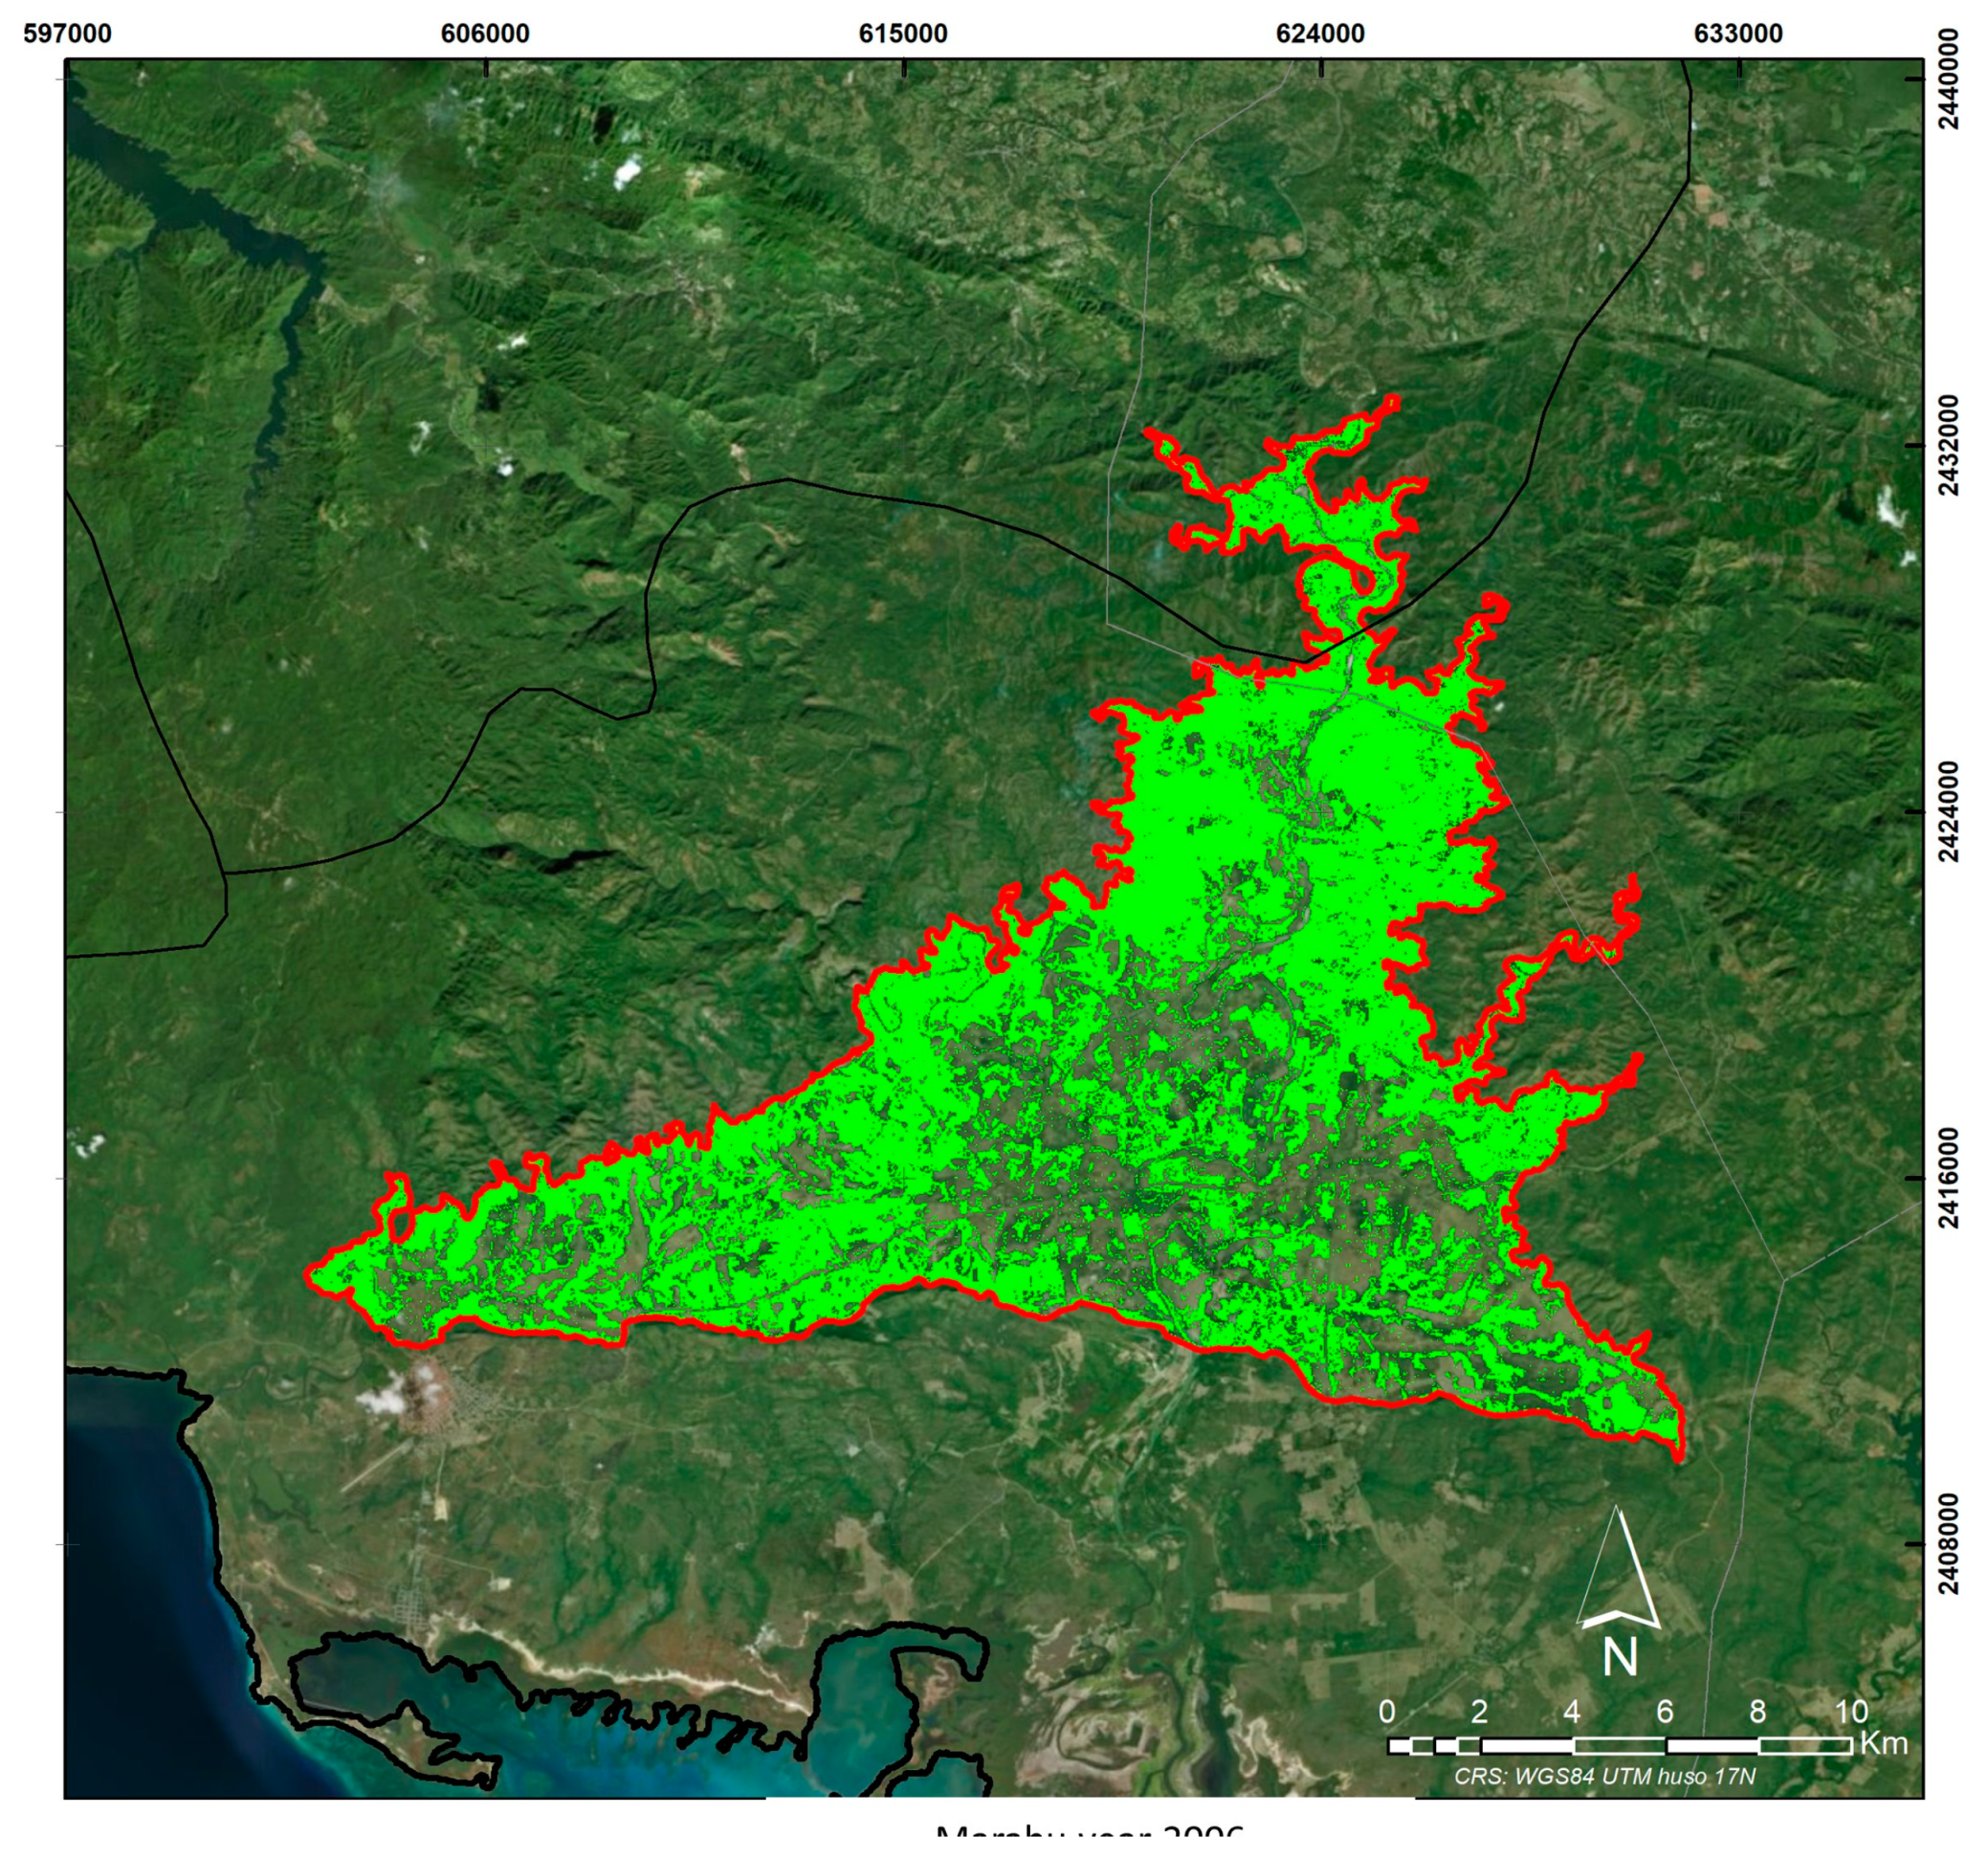
Figure A4.
Marabou year 2008.
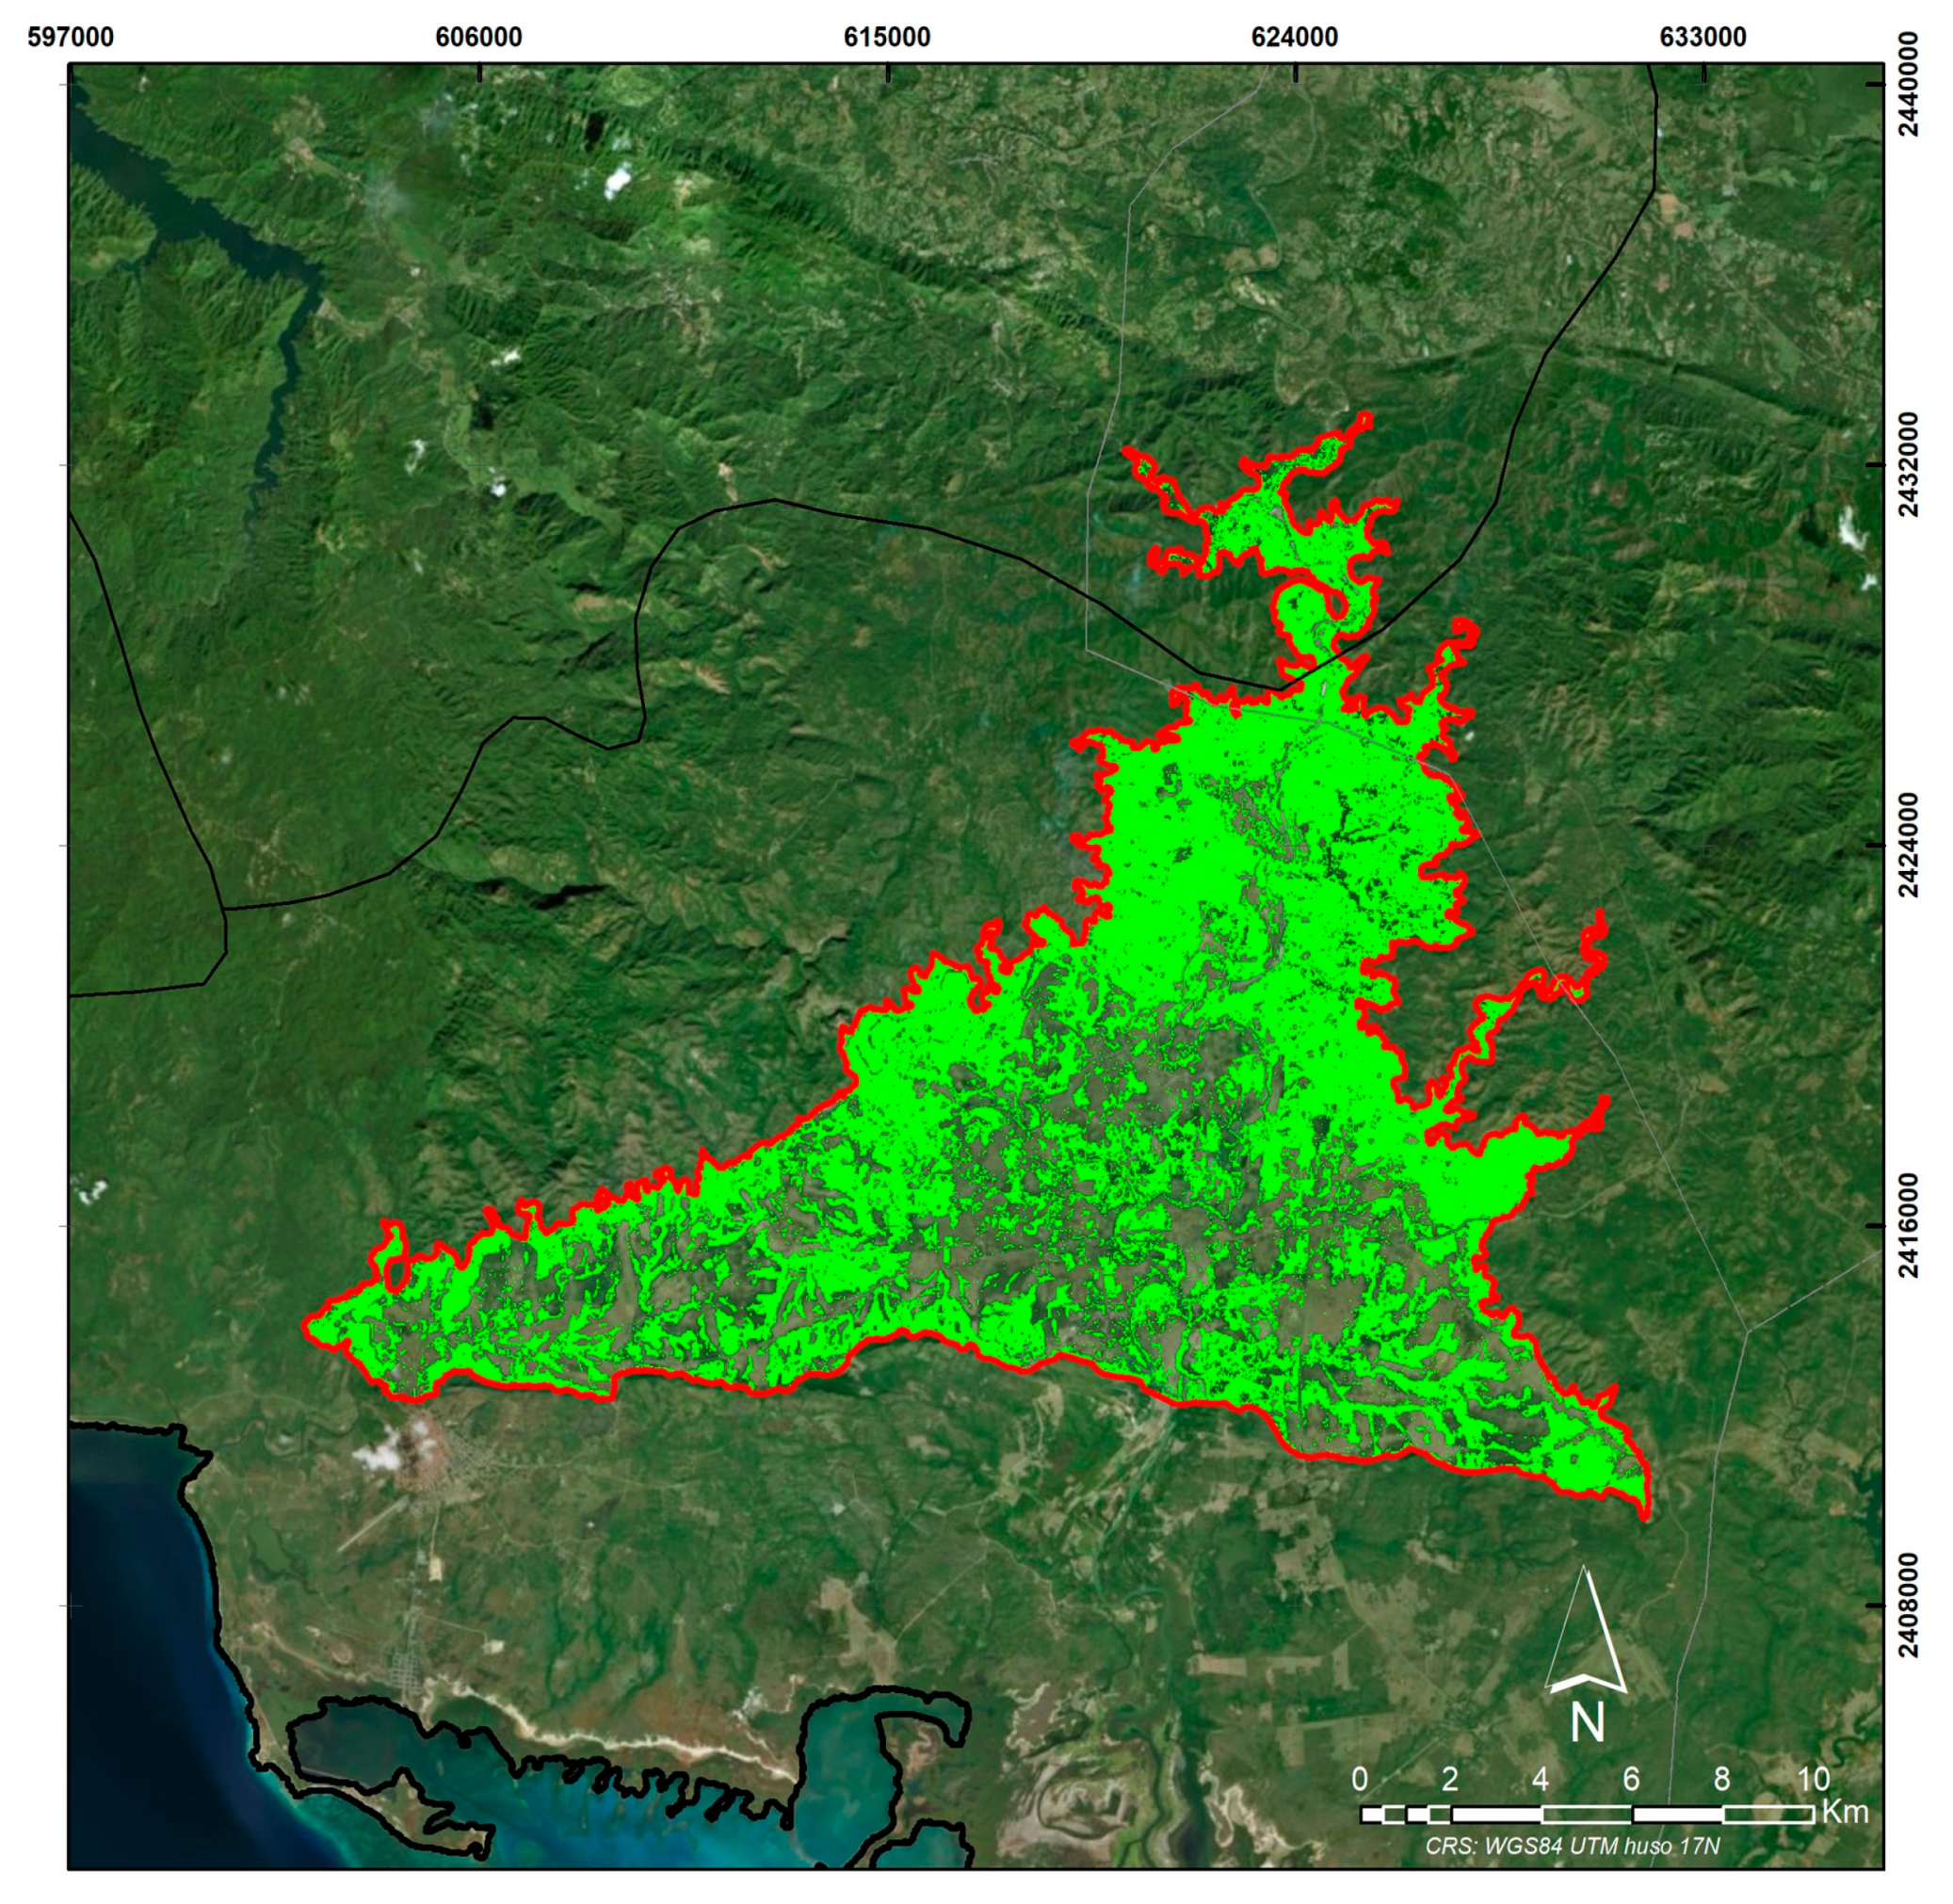
Figure A5.
Marabou year 2010.
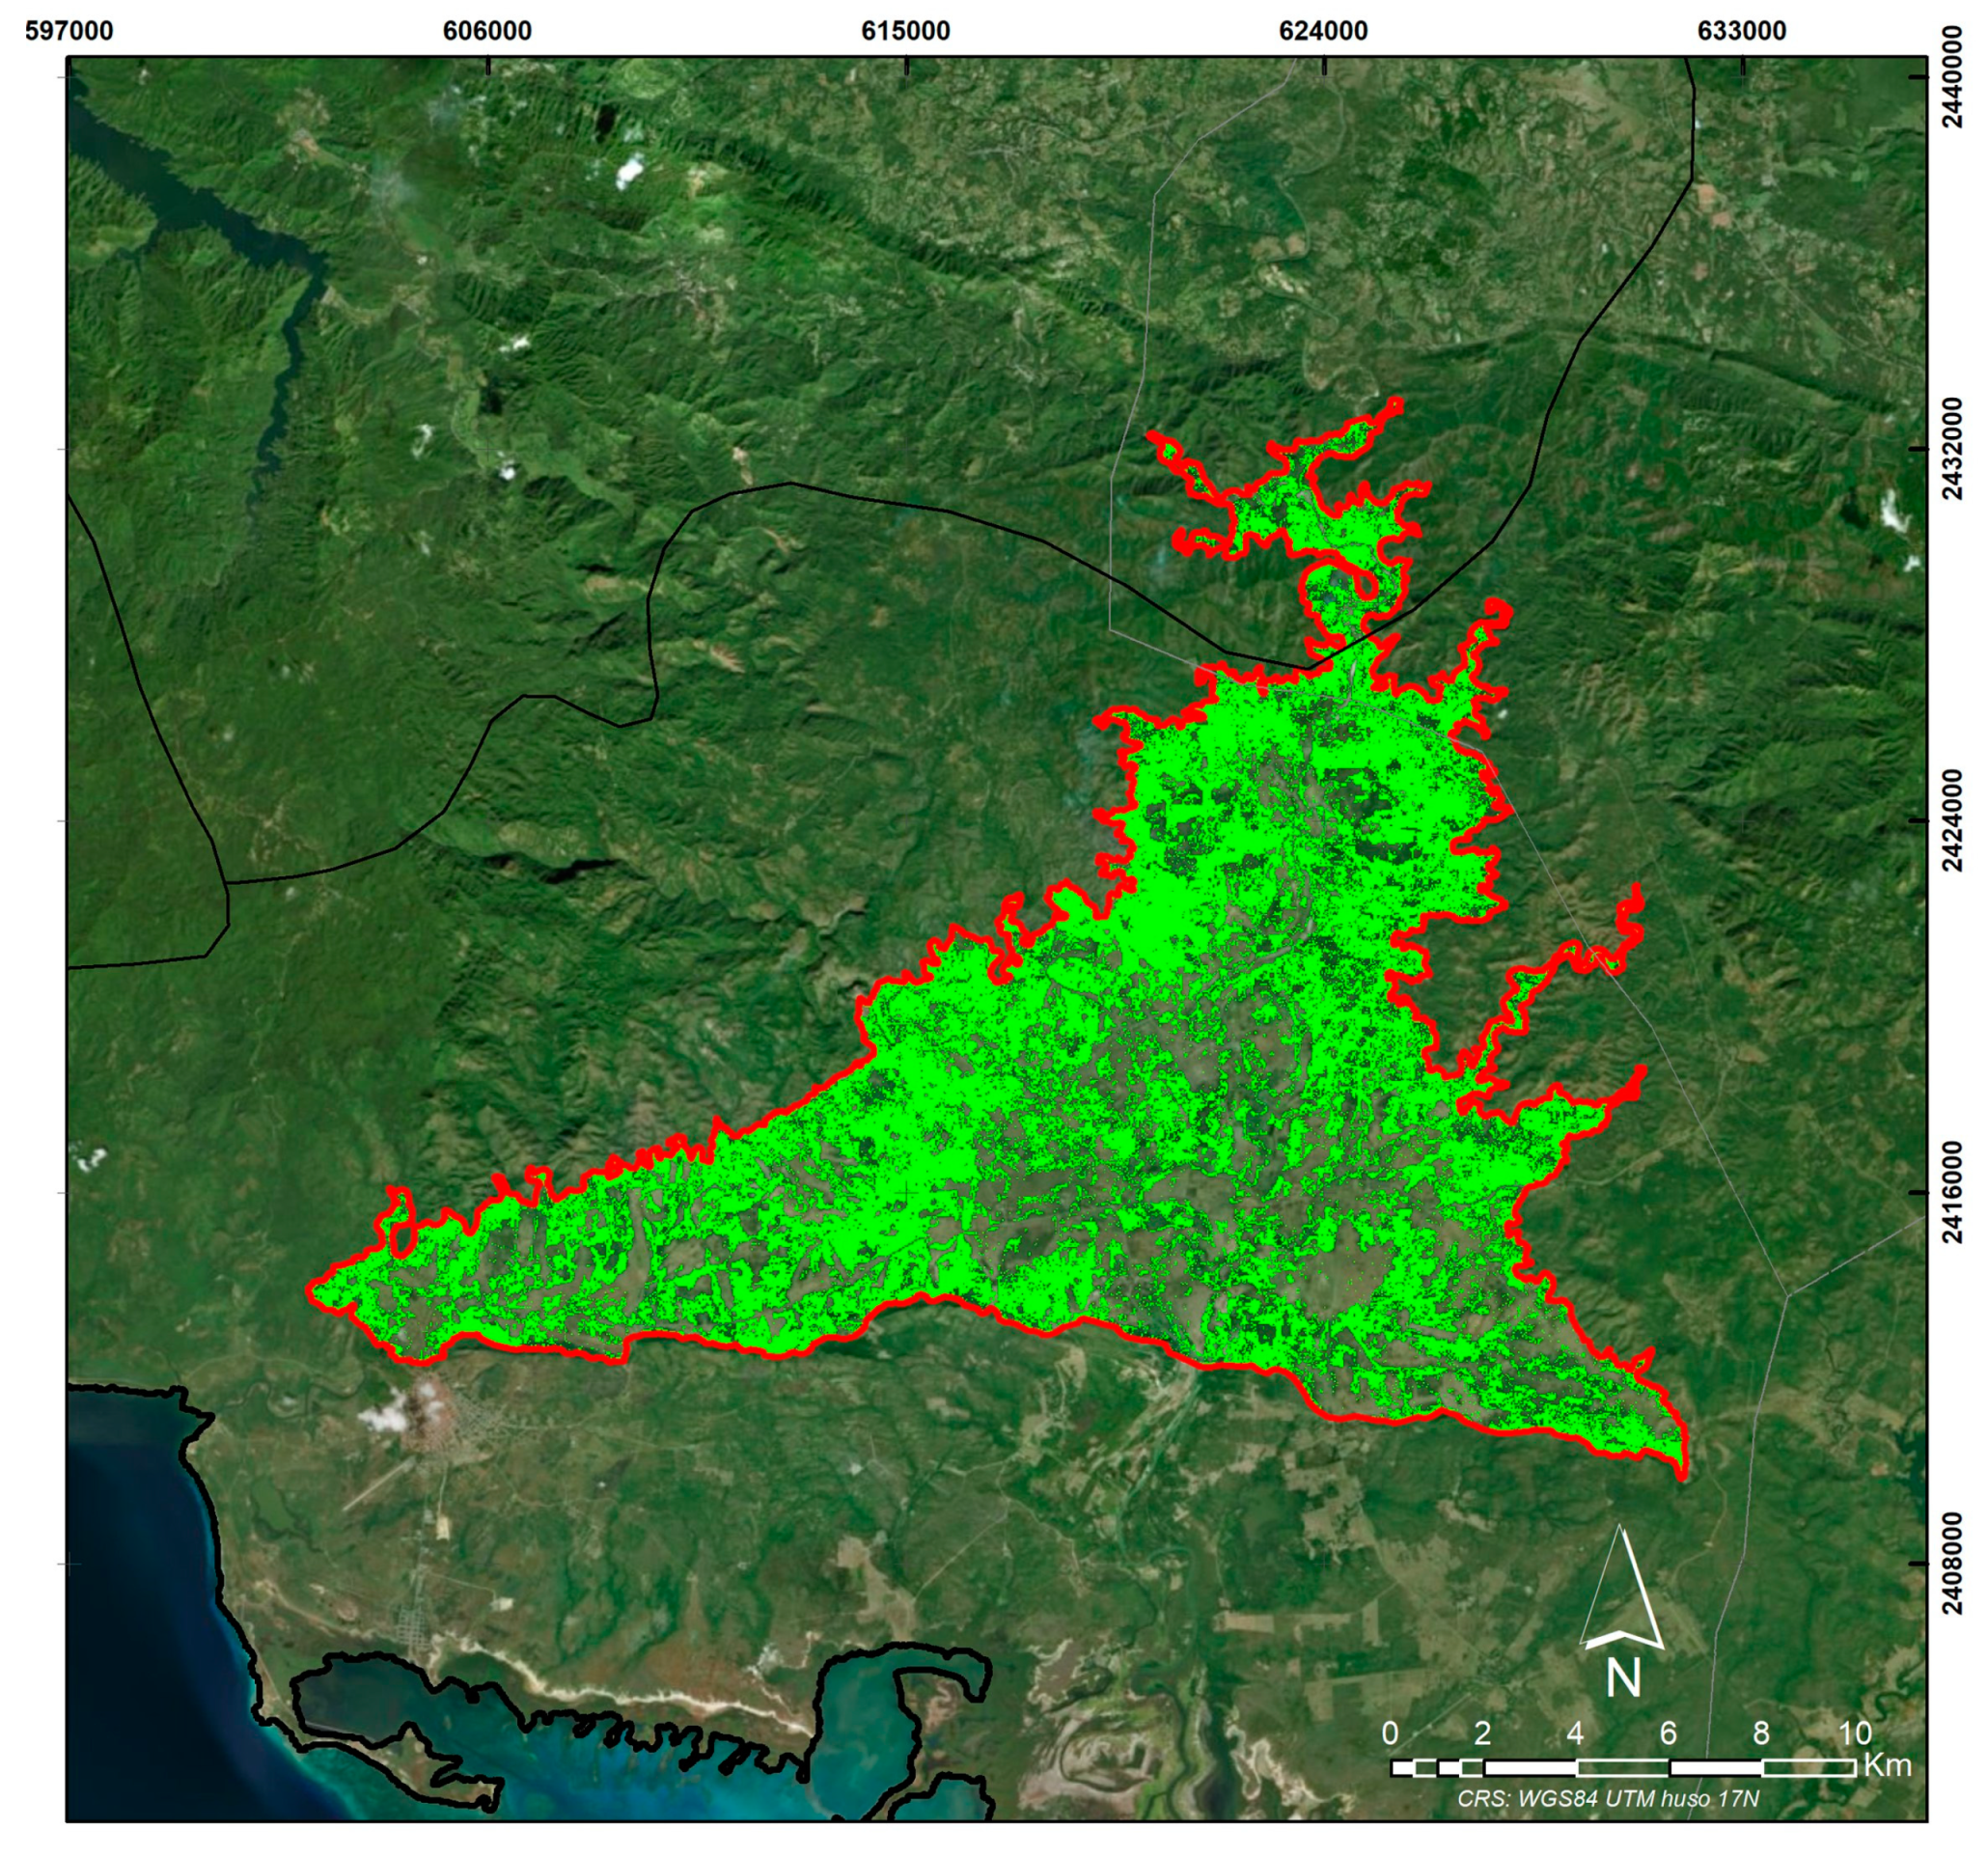
Figure A6.
Marabou year 2012.
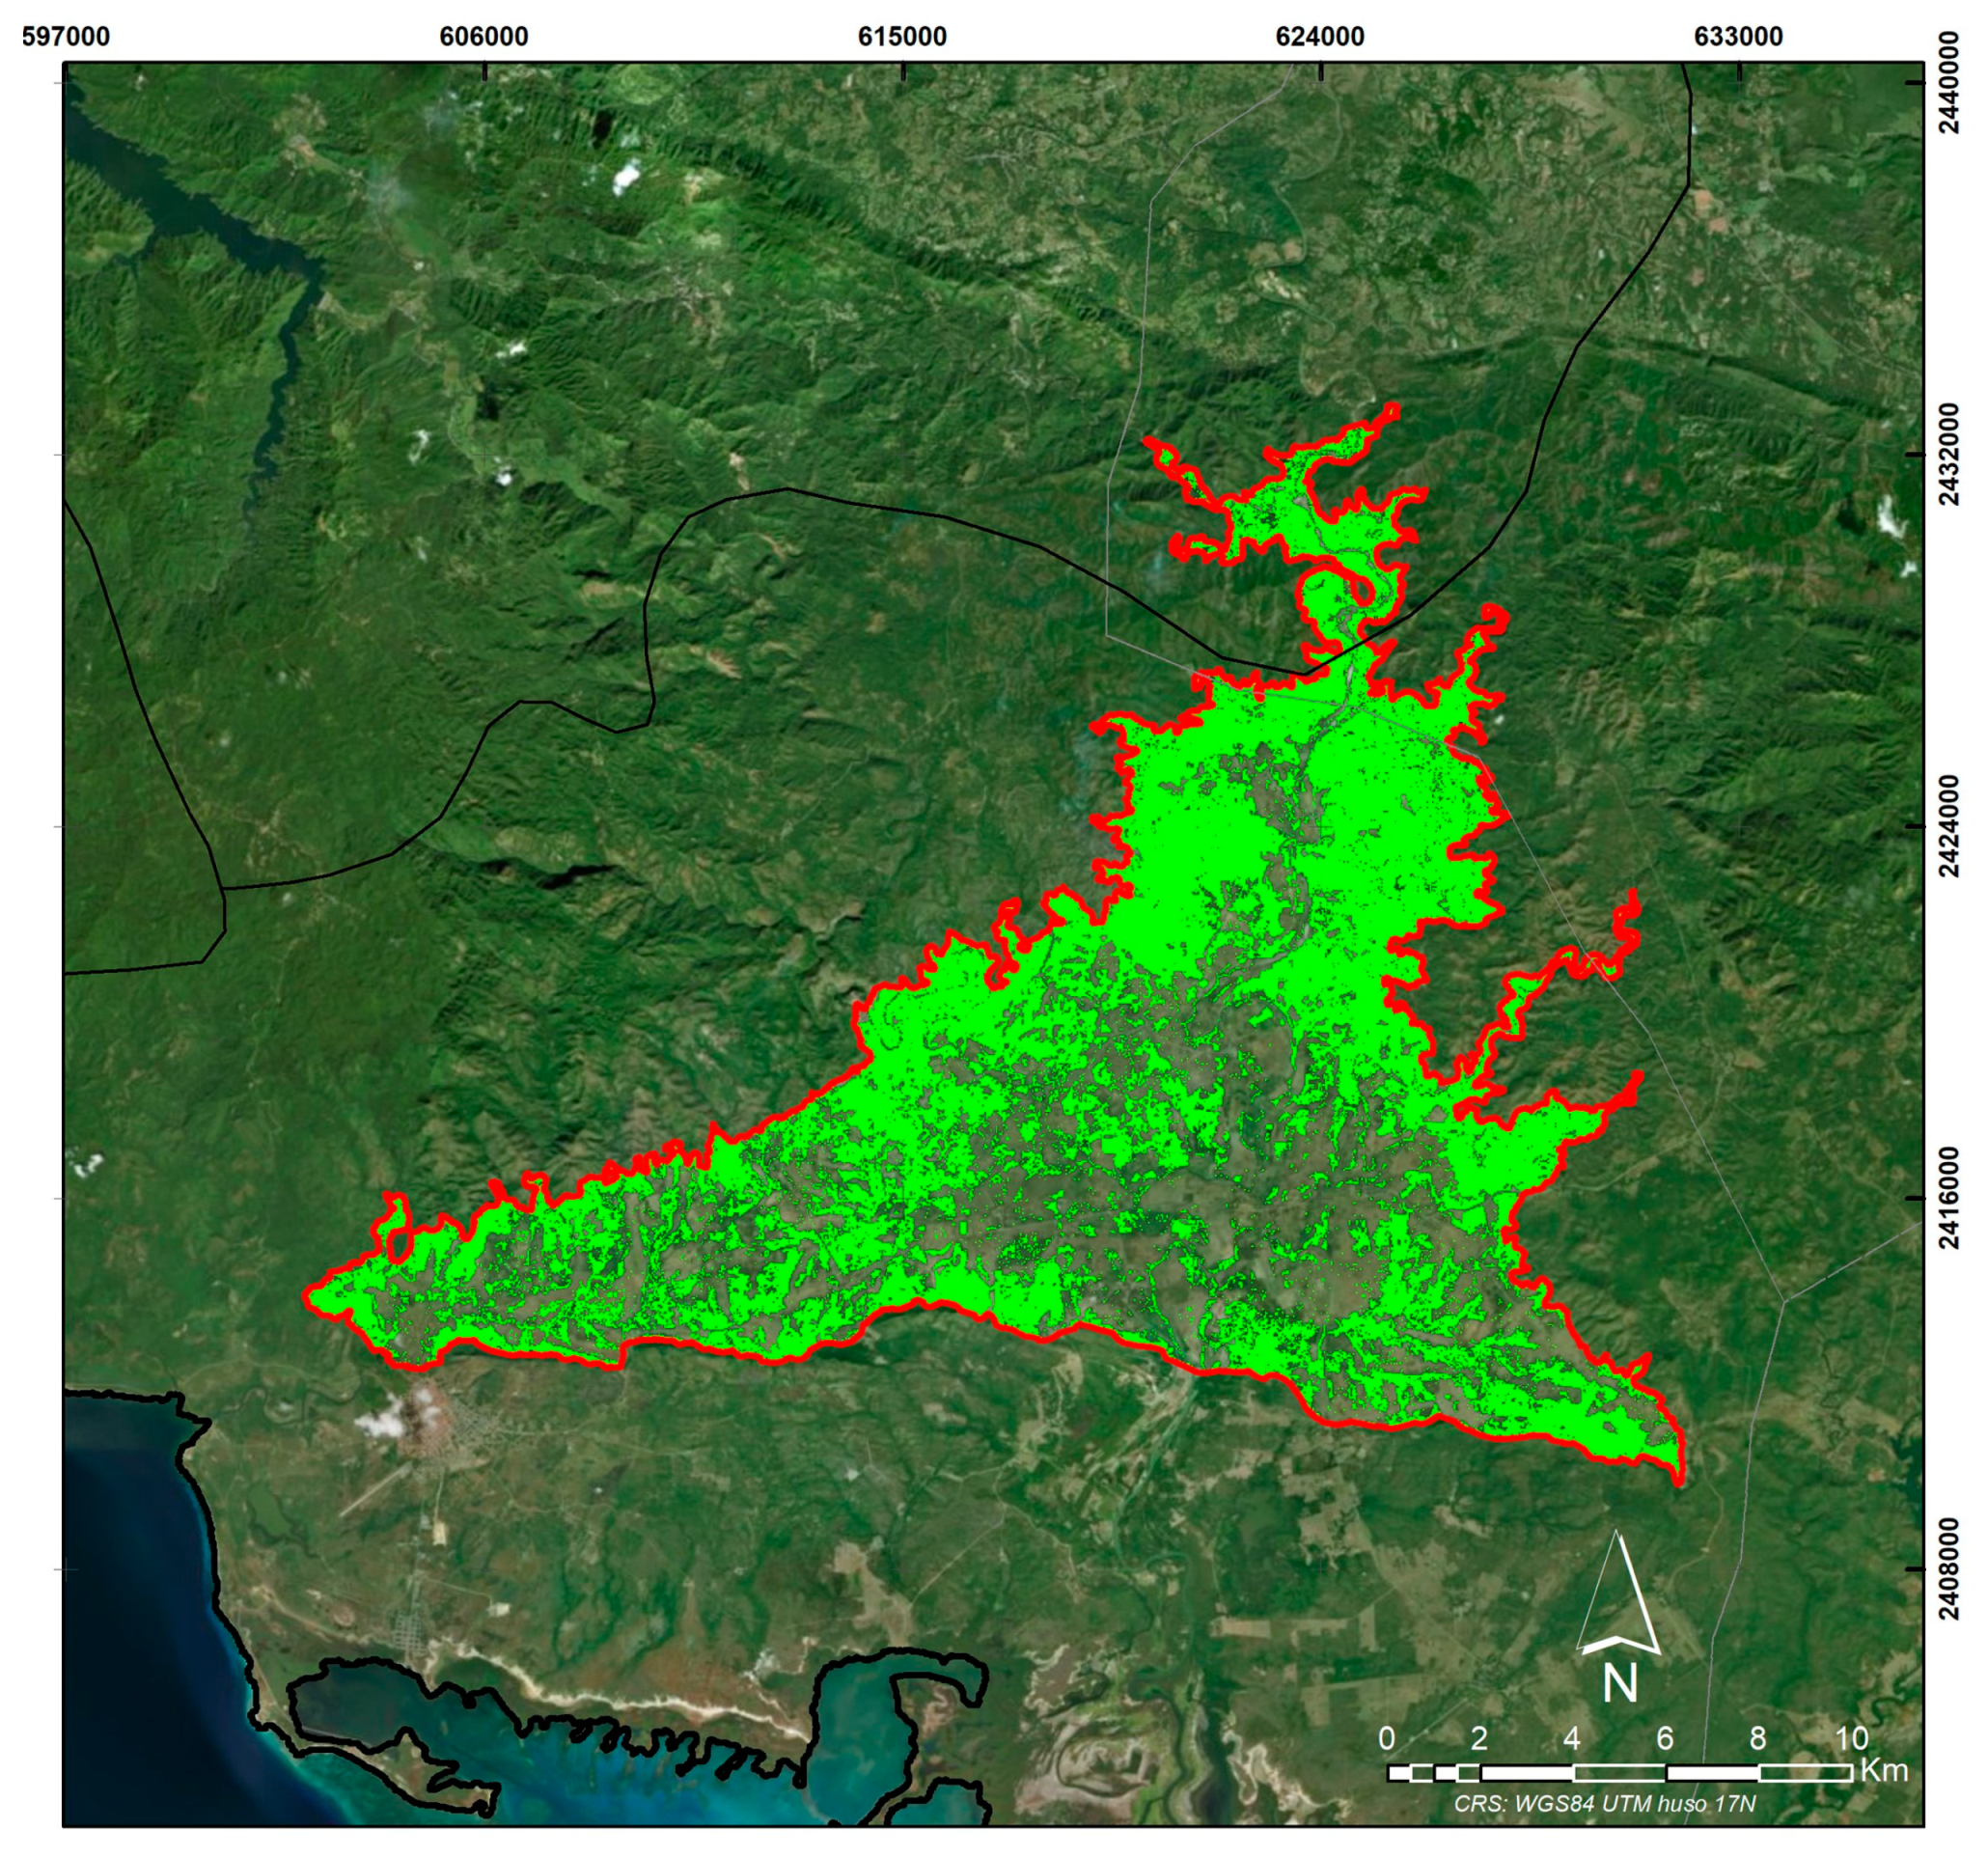
Figure A7.
Marabou year 2014.
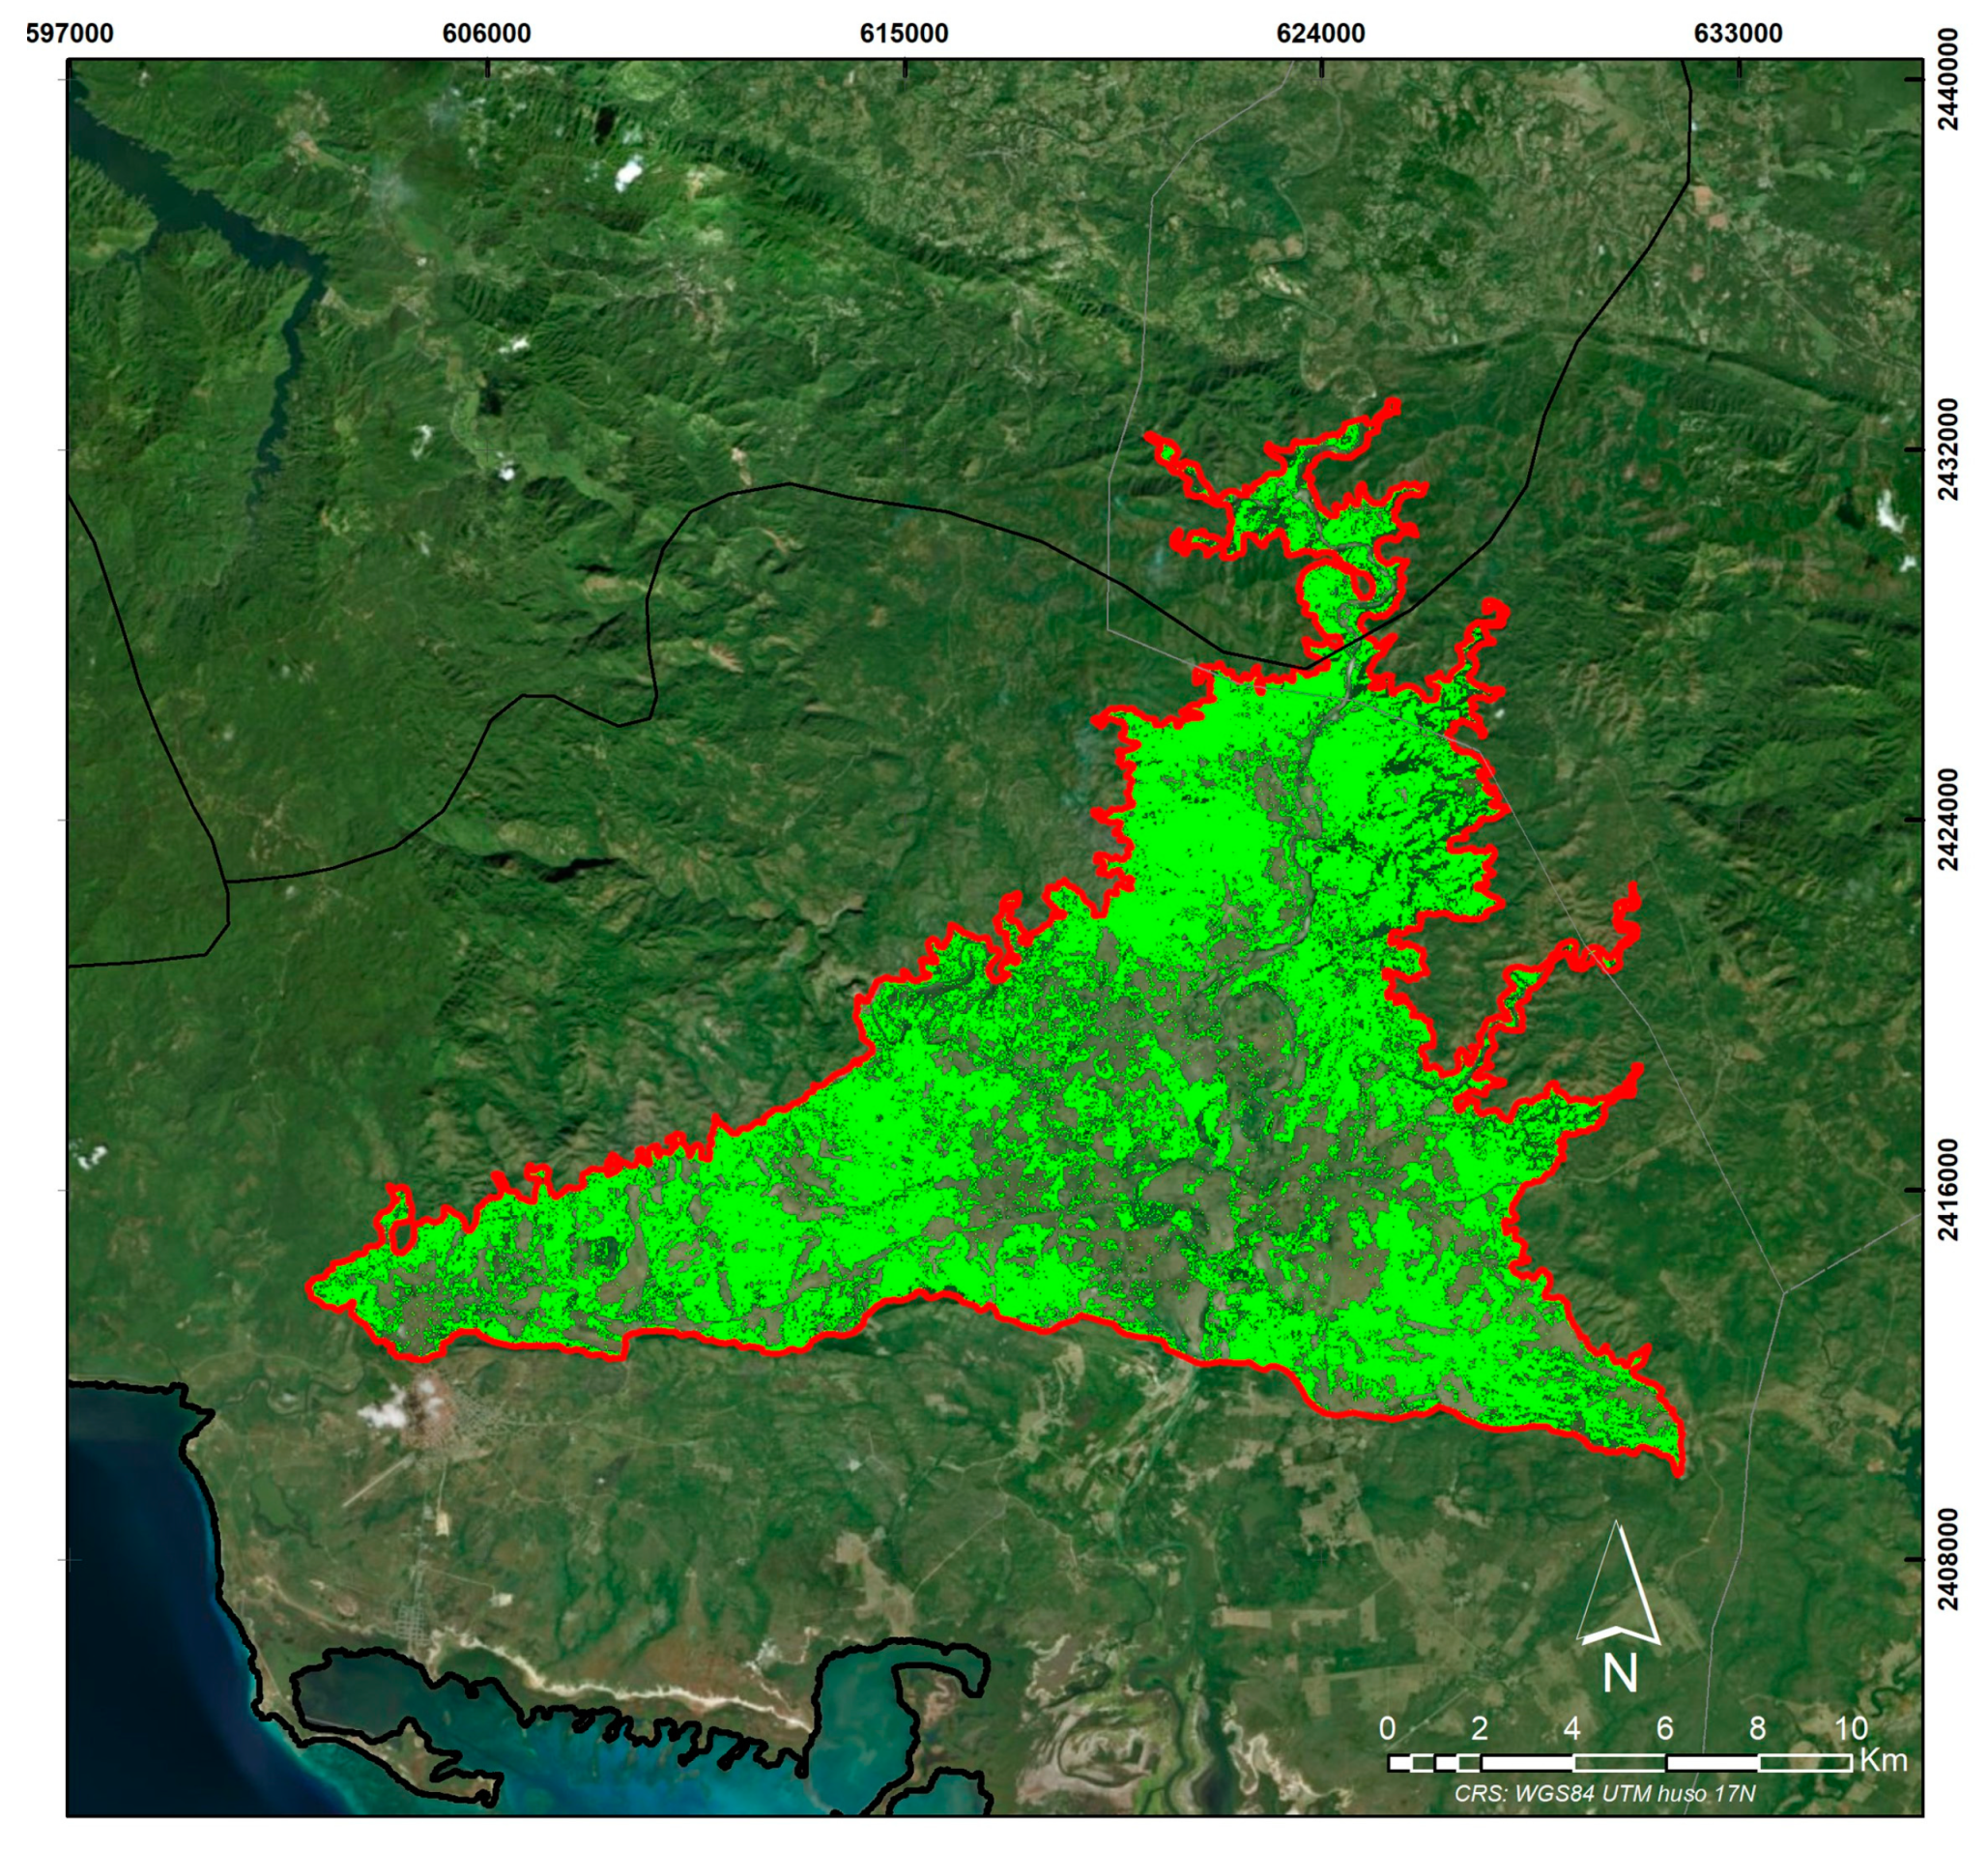
Figure A8.
Marabou year 2015.
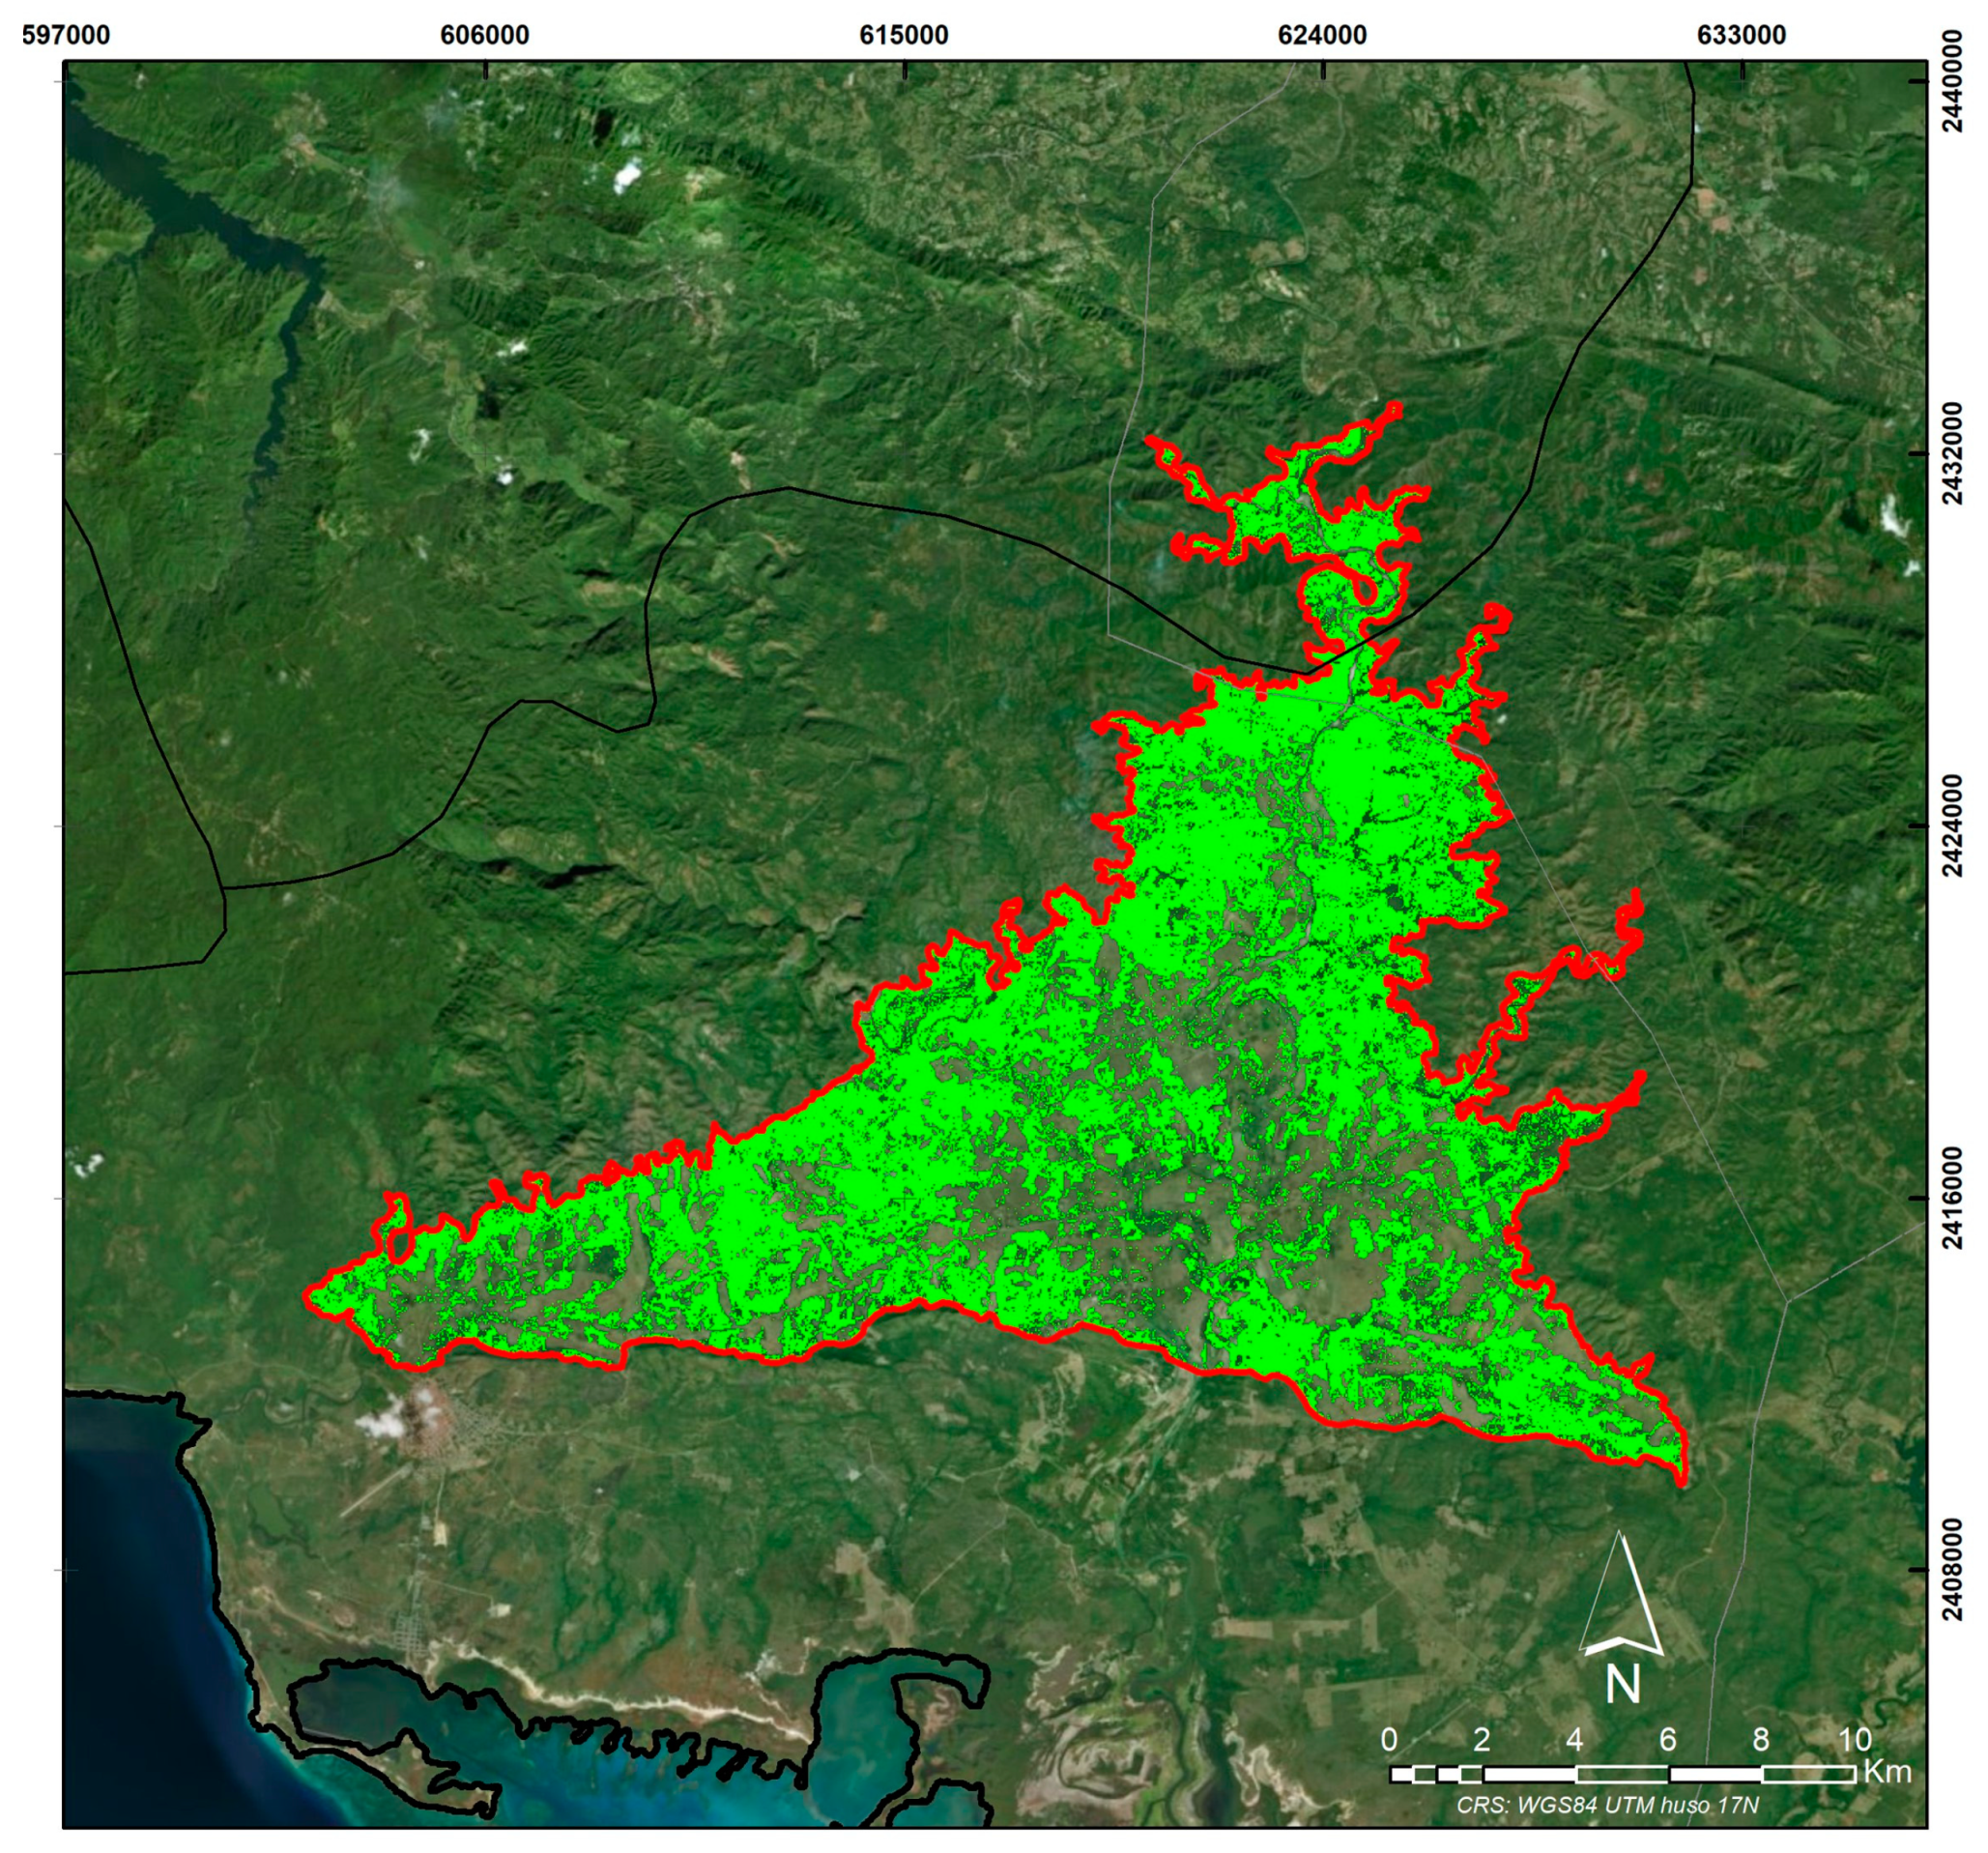
Figure A9.
Marabou year 2016.
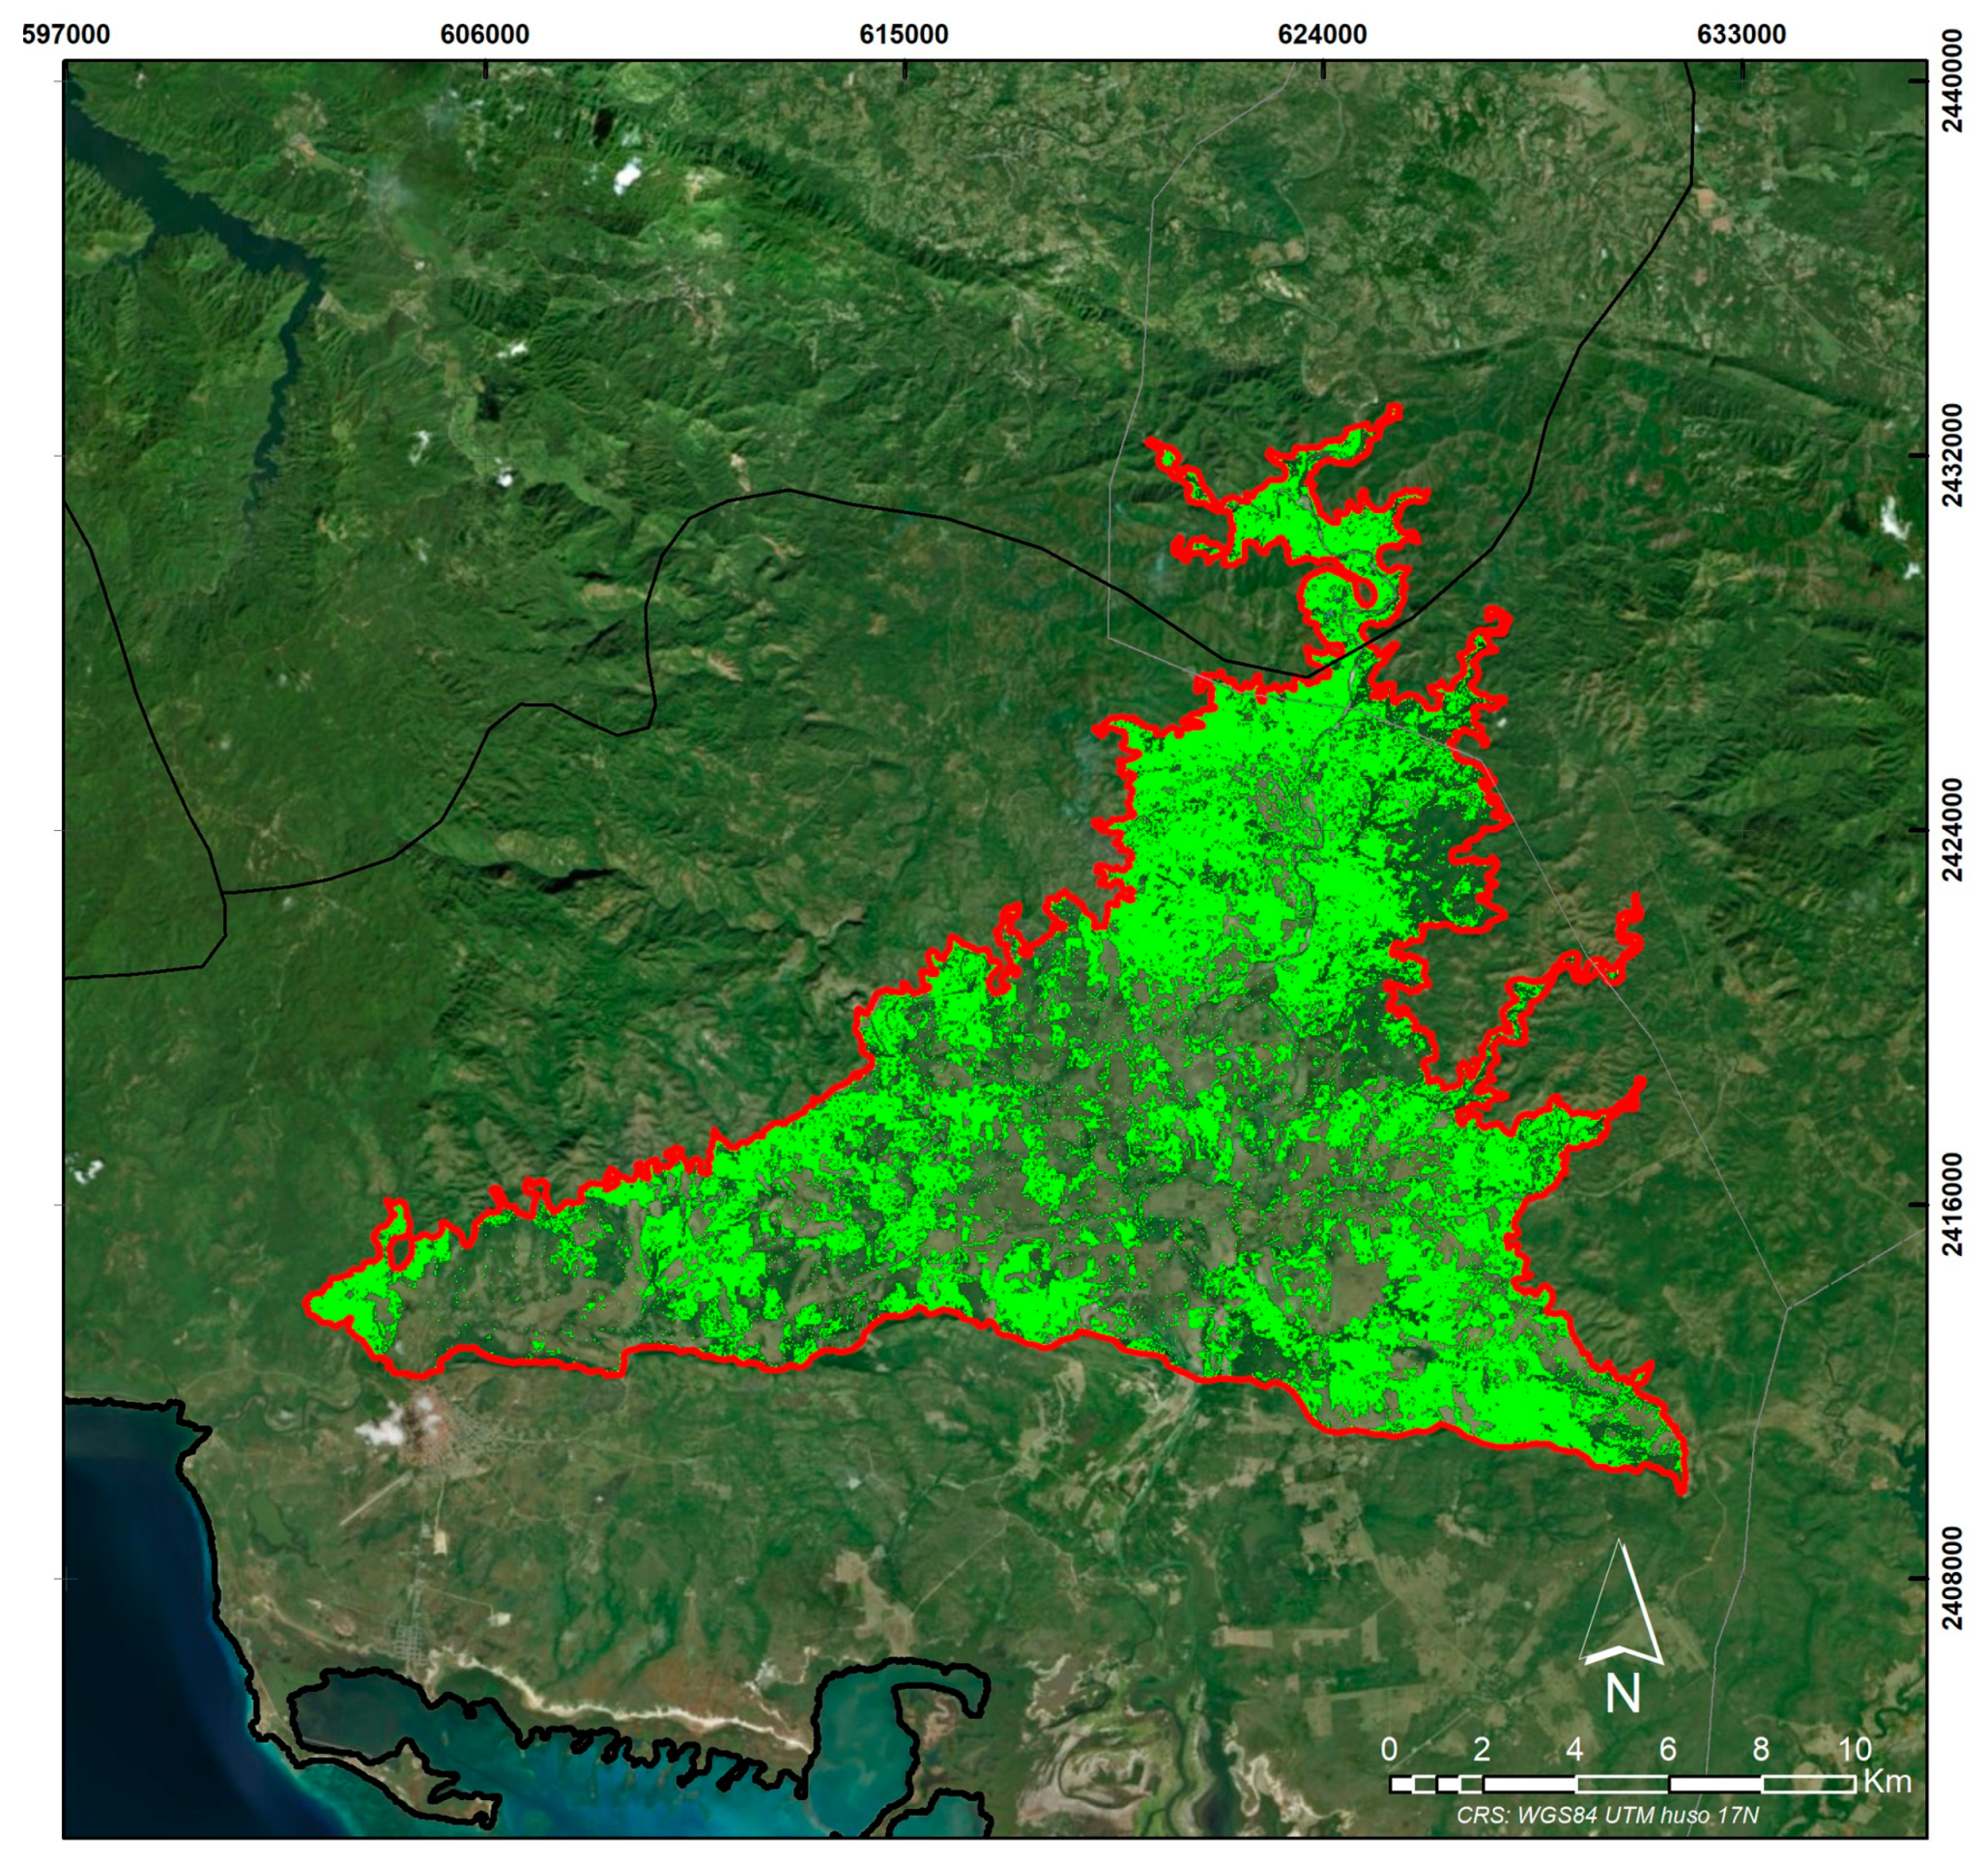
Figure A10.
Marabou year 2017.
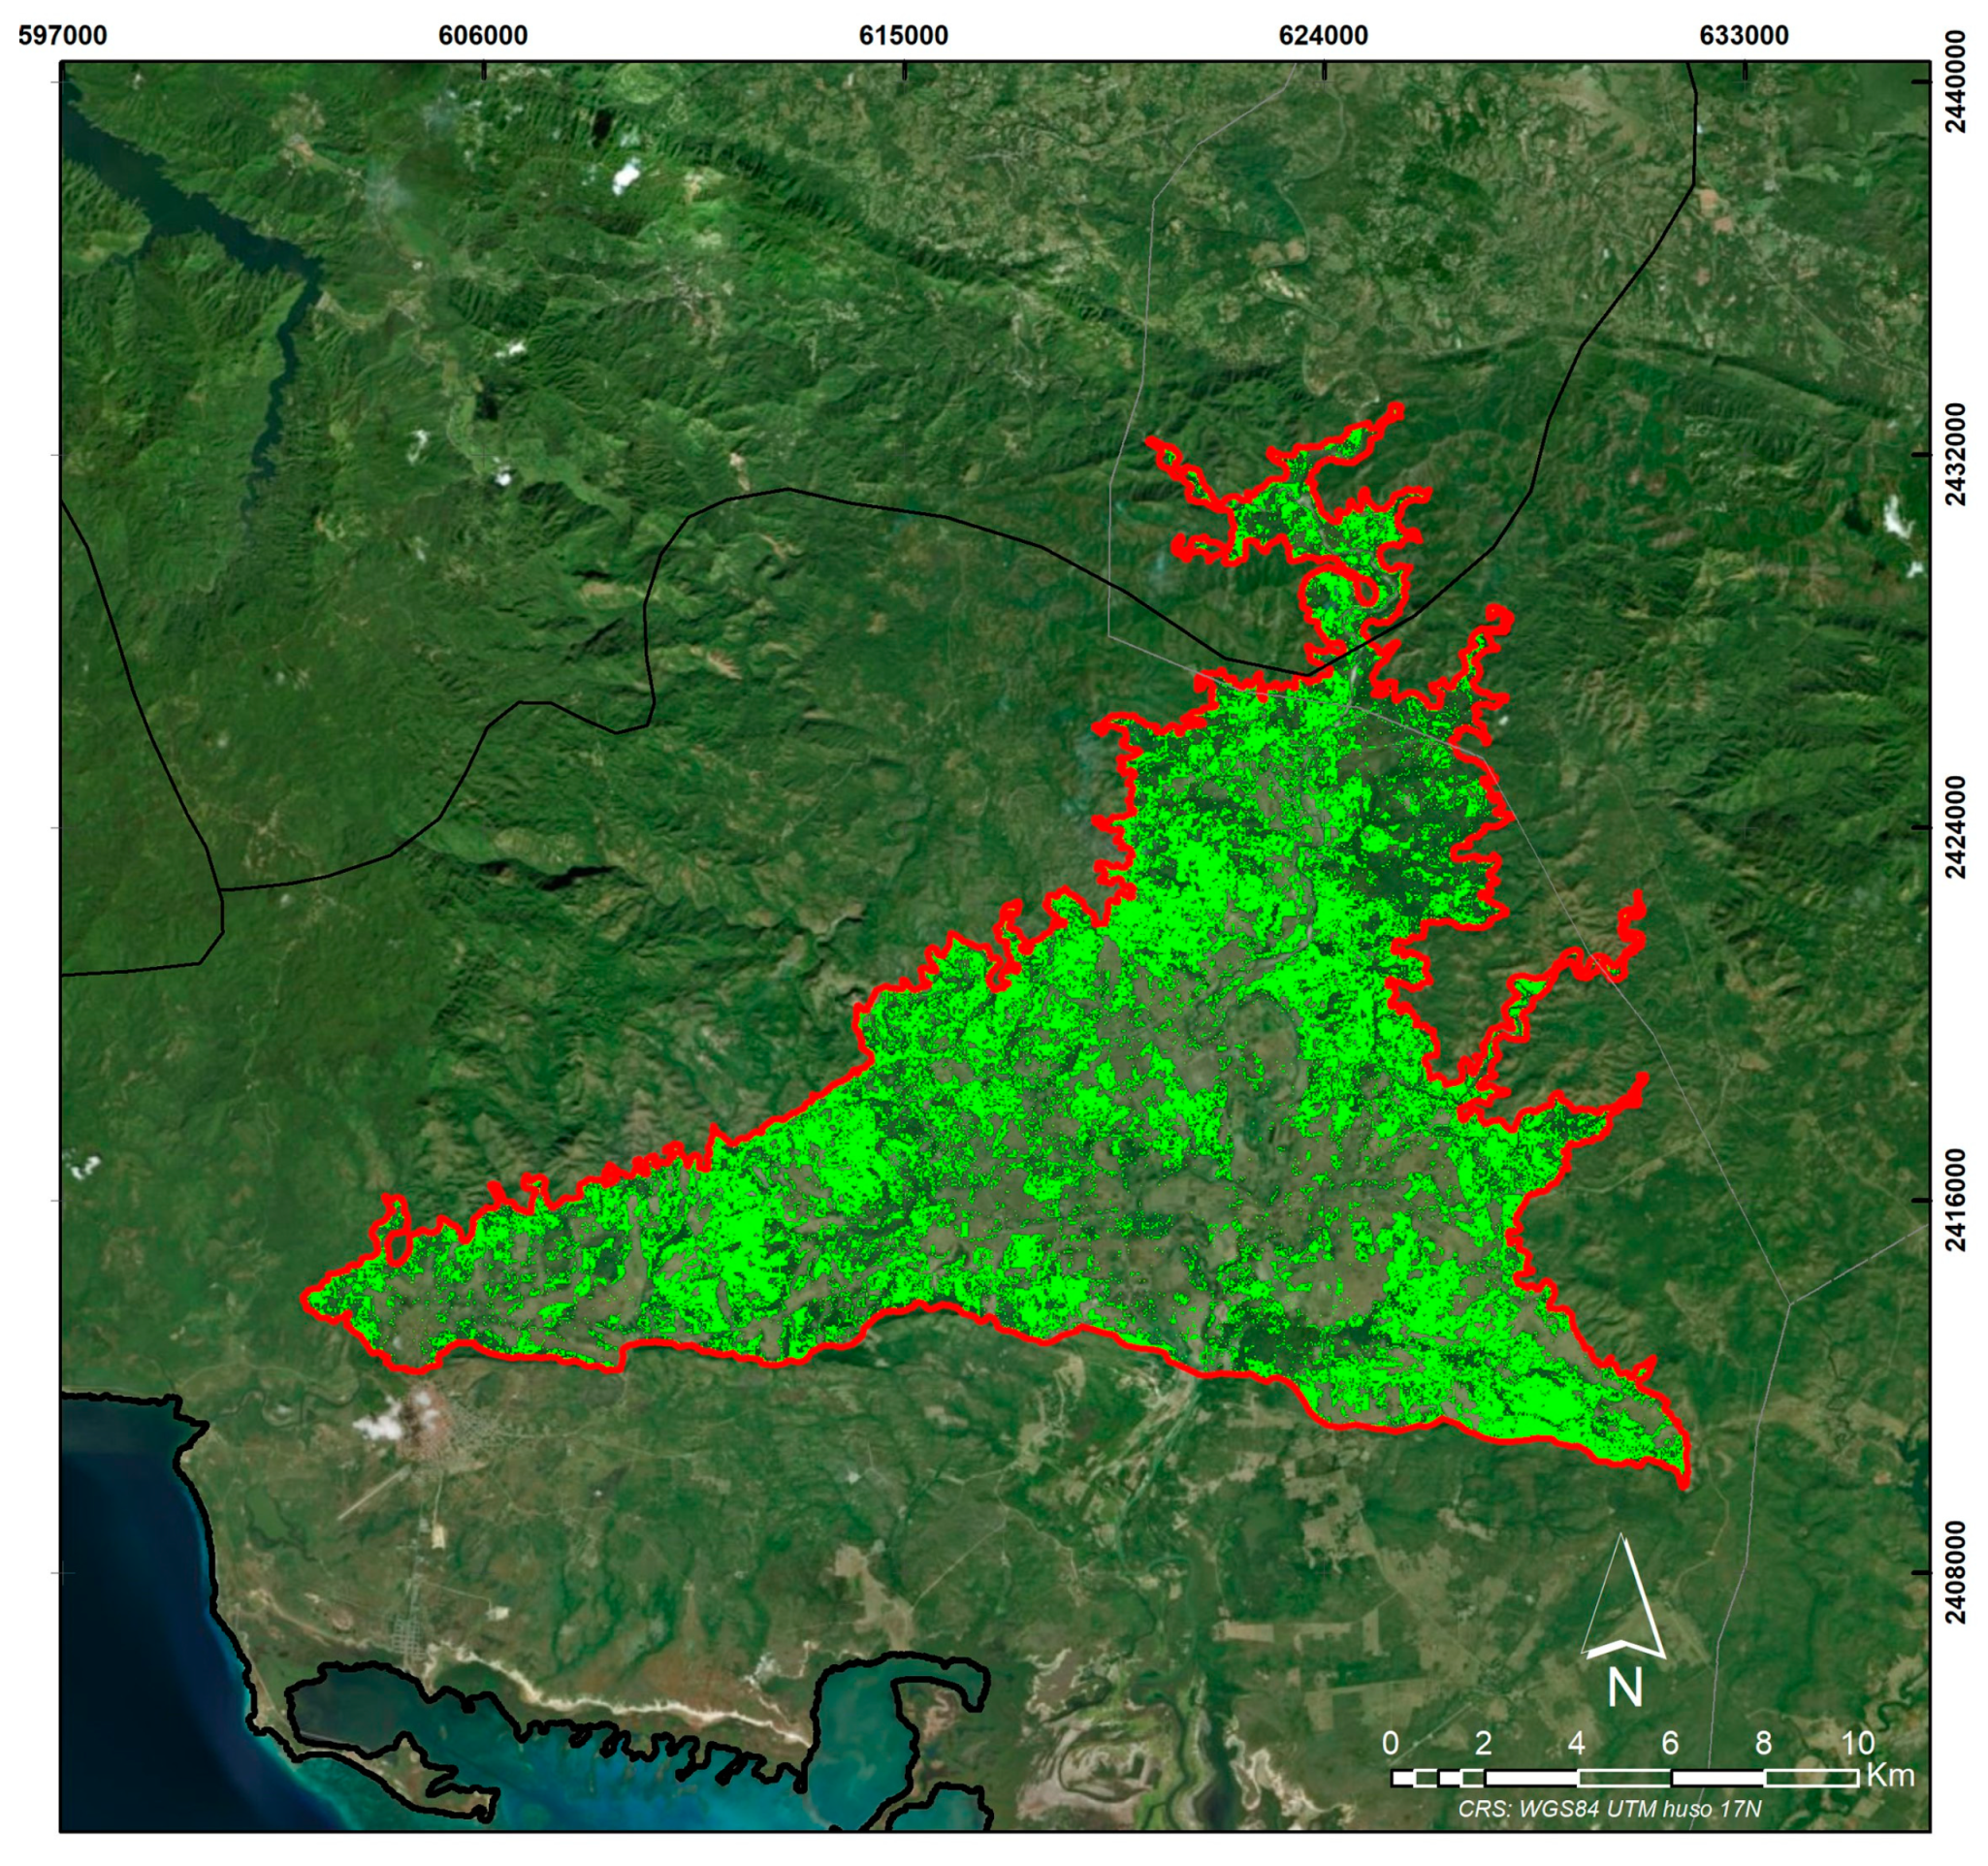
Figure A11.
Marabou year 2018.
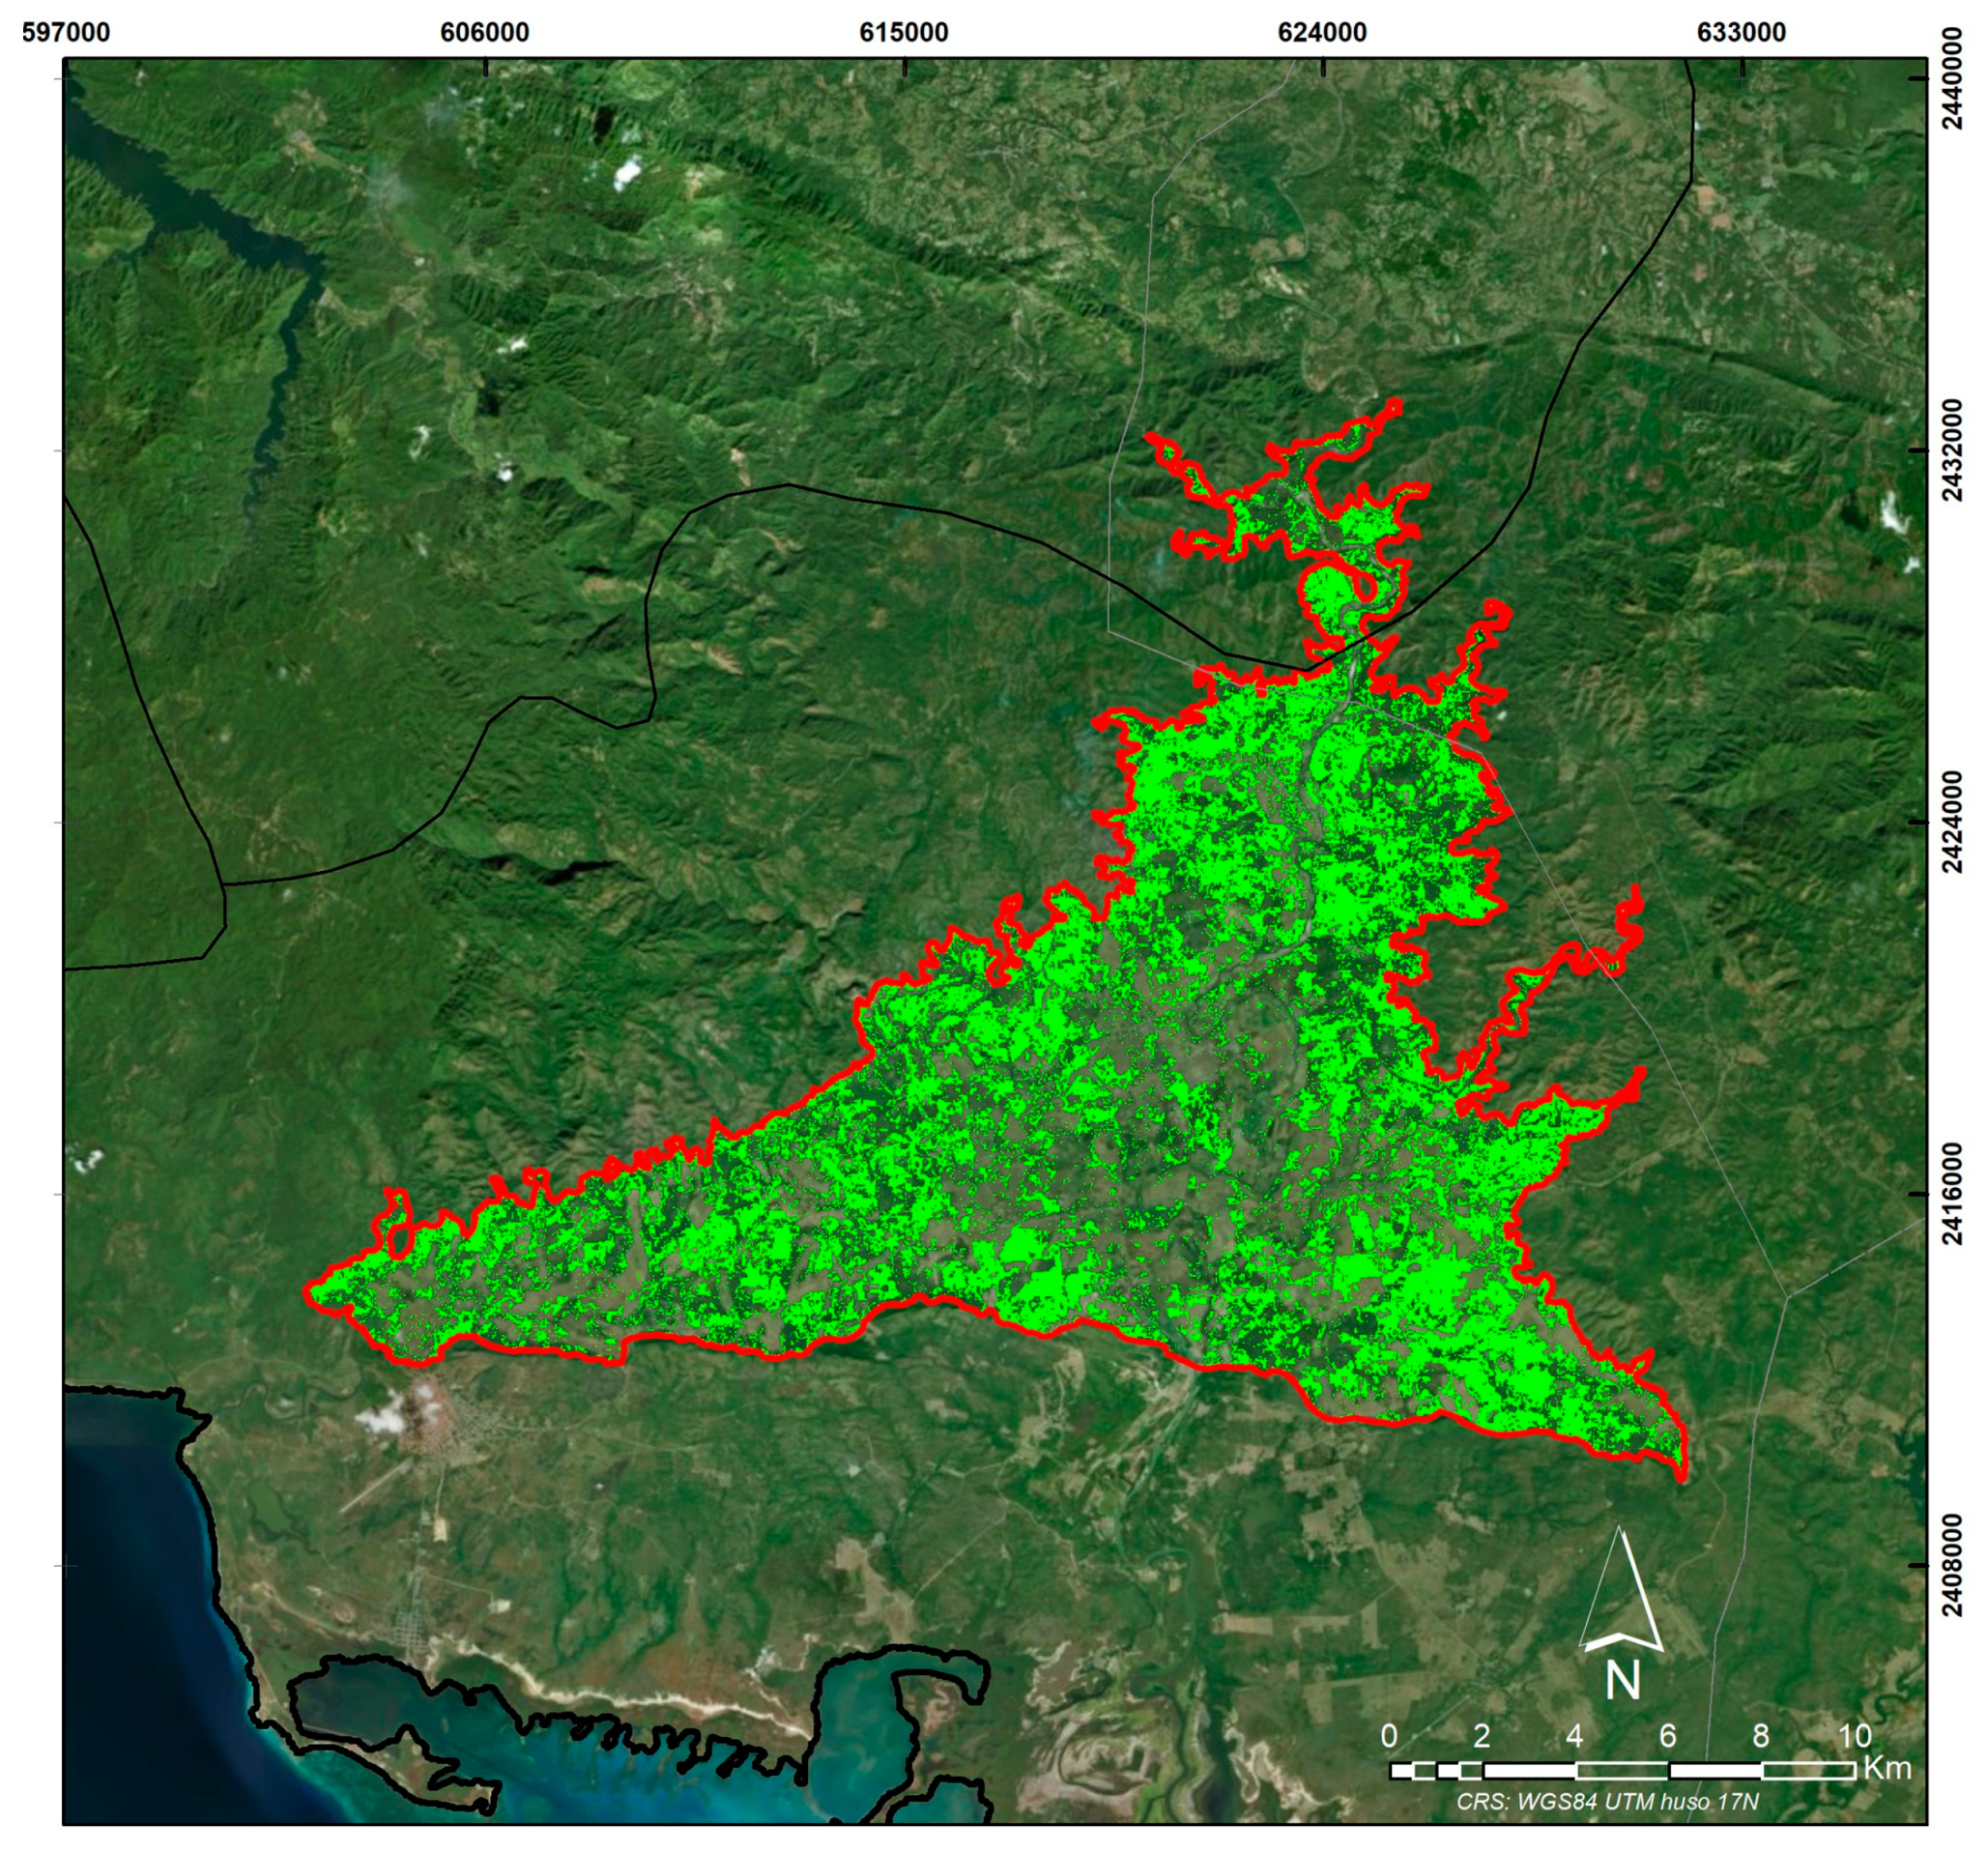
Figure A12.
Marabou year 2019.
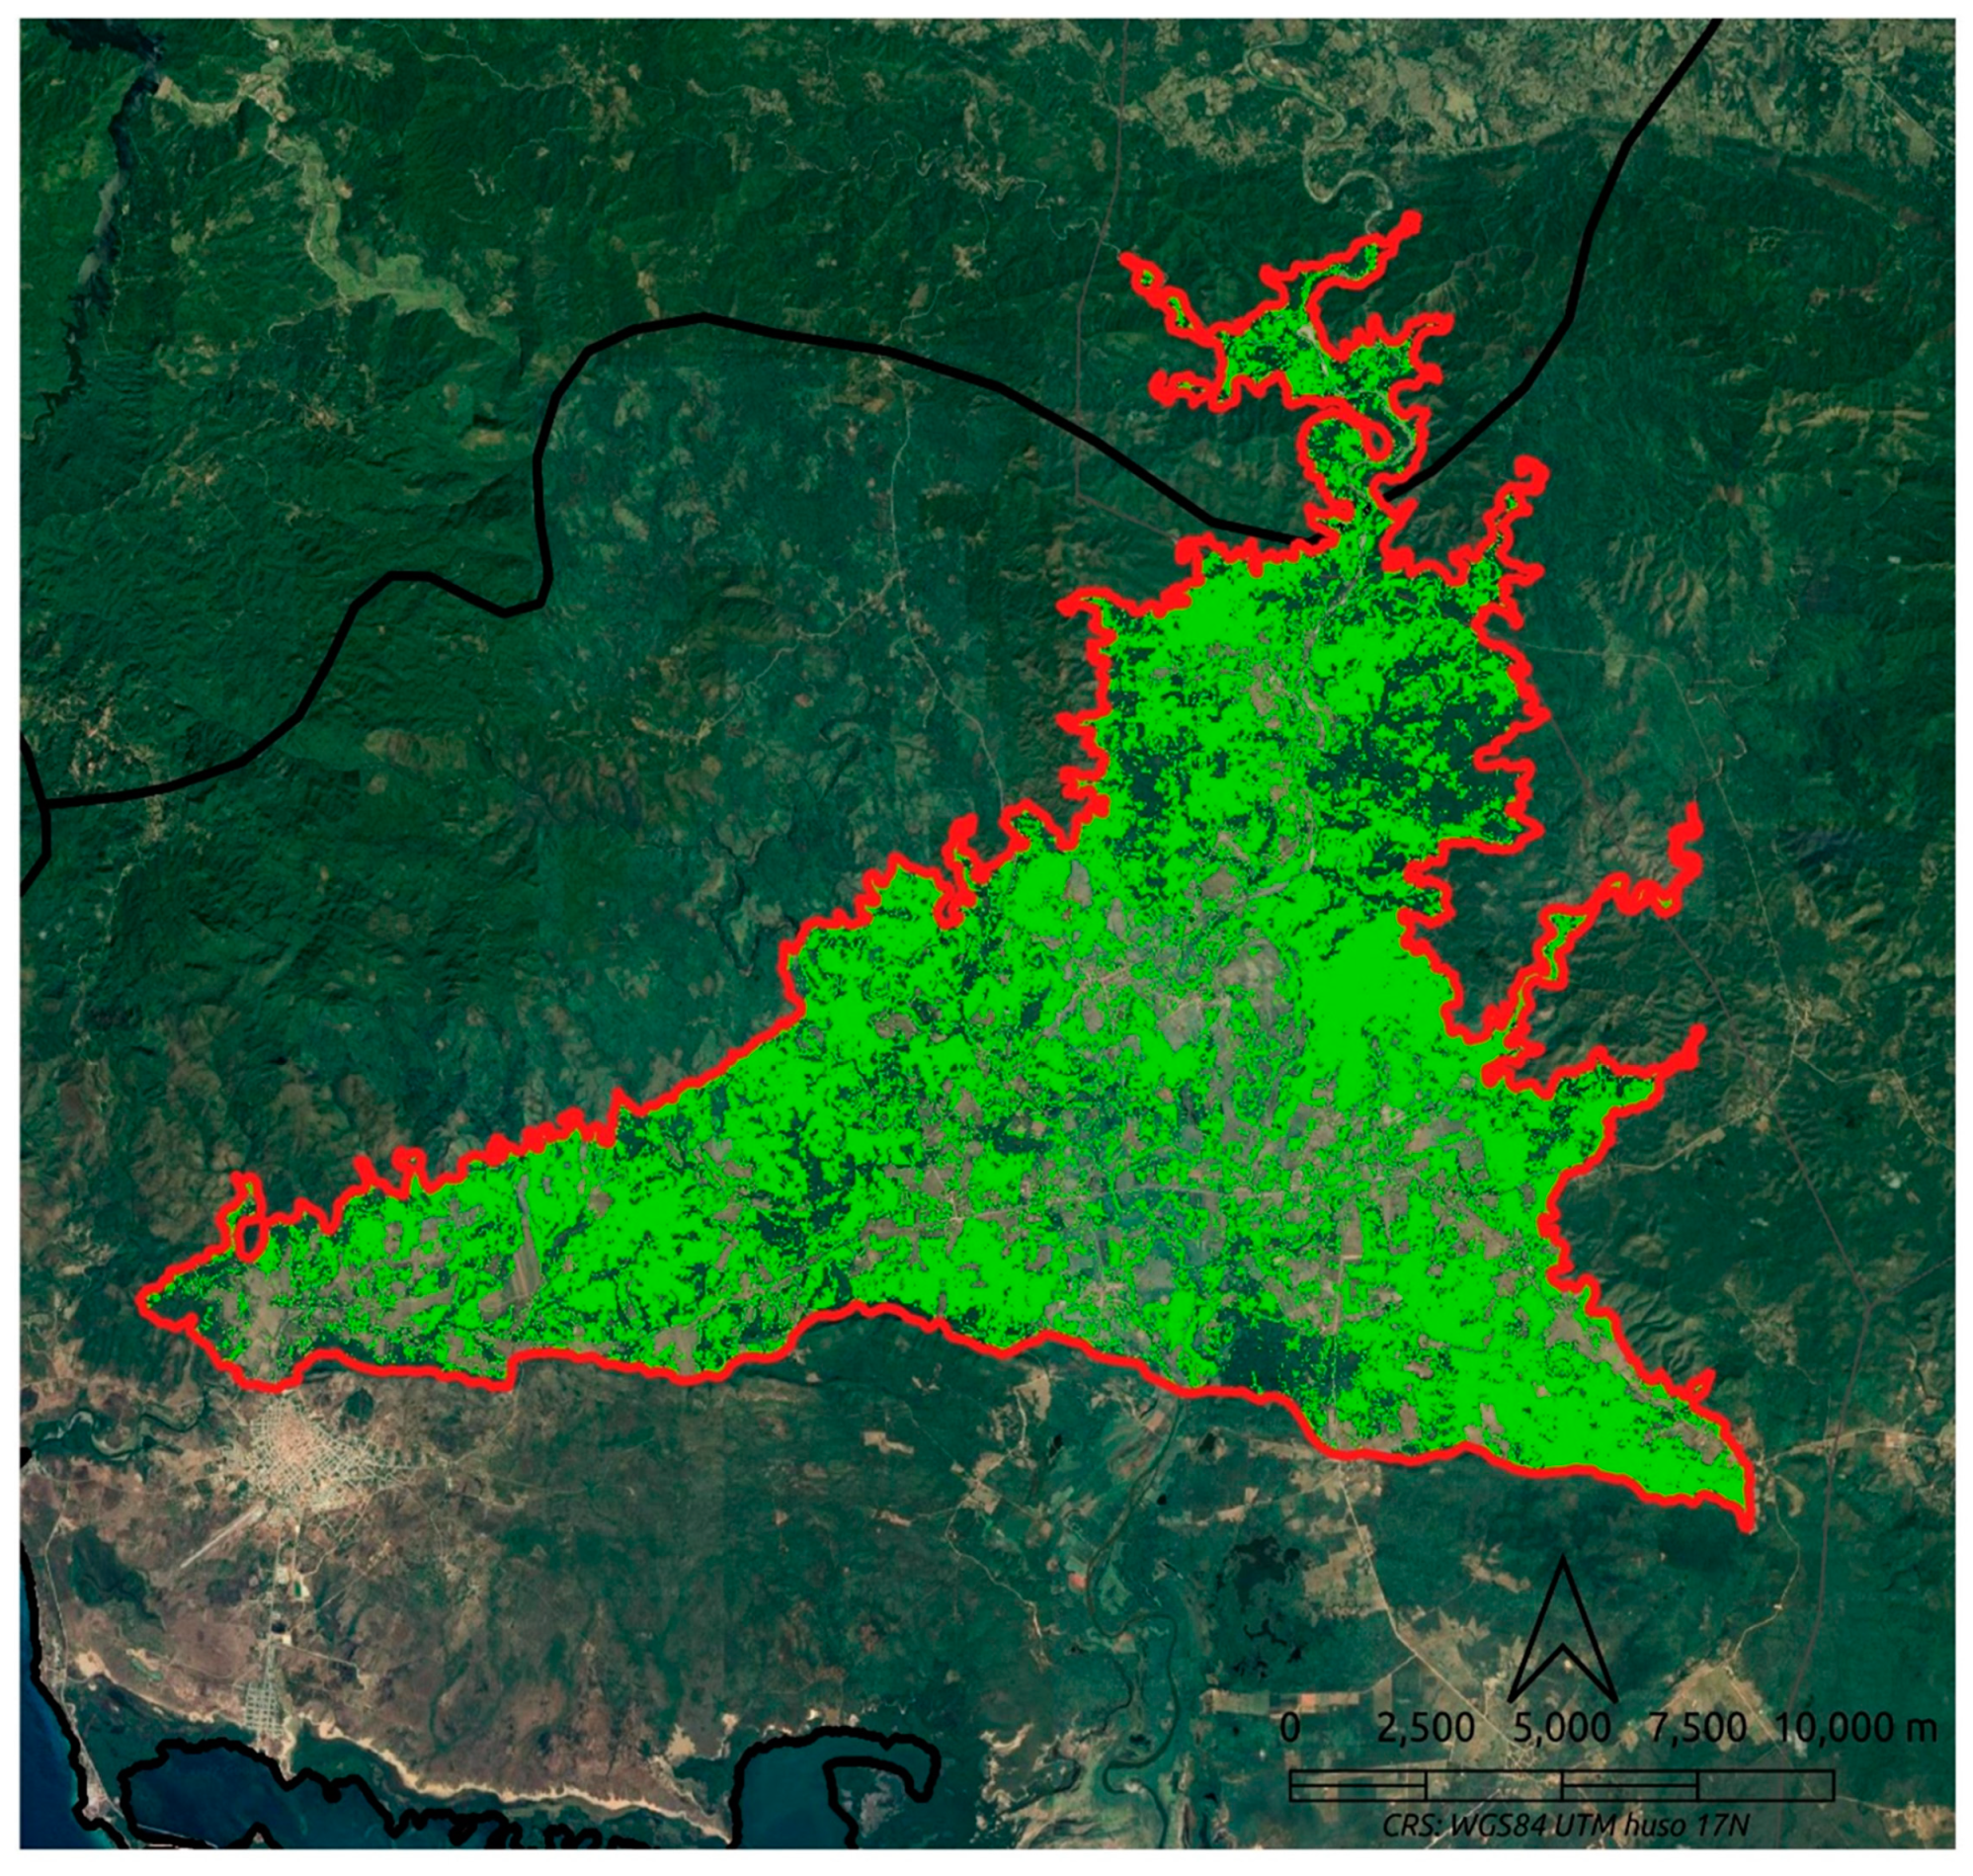
Figure A13.
Marabou year 2020.
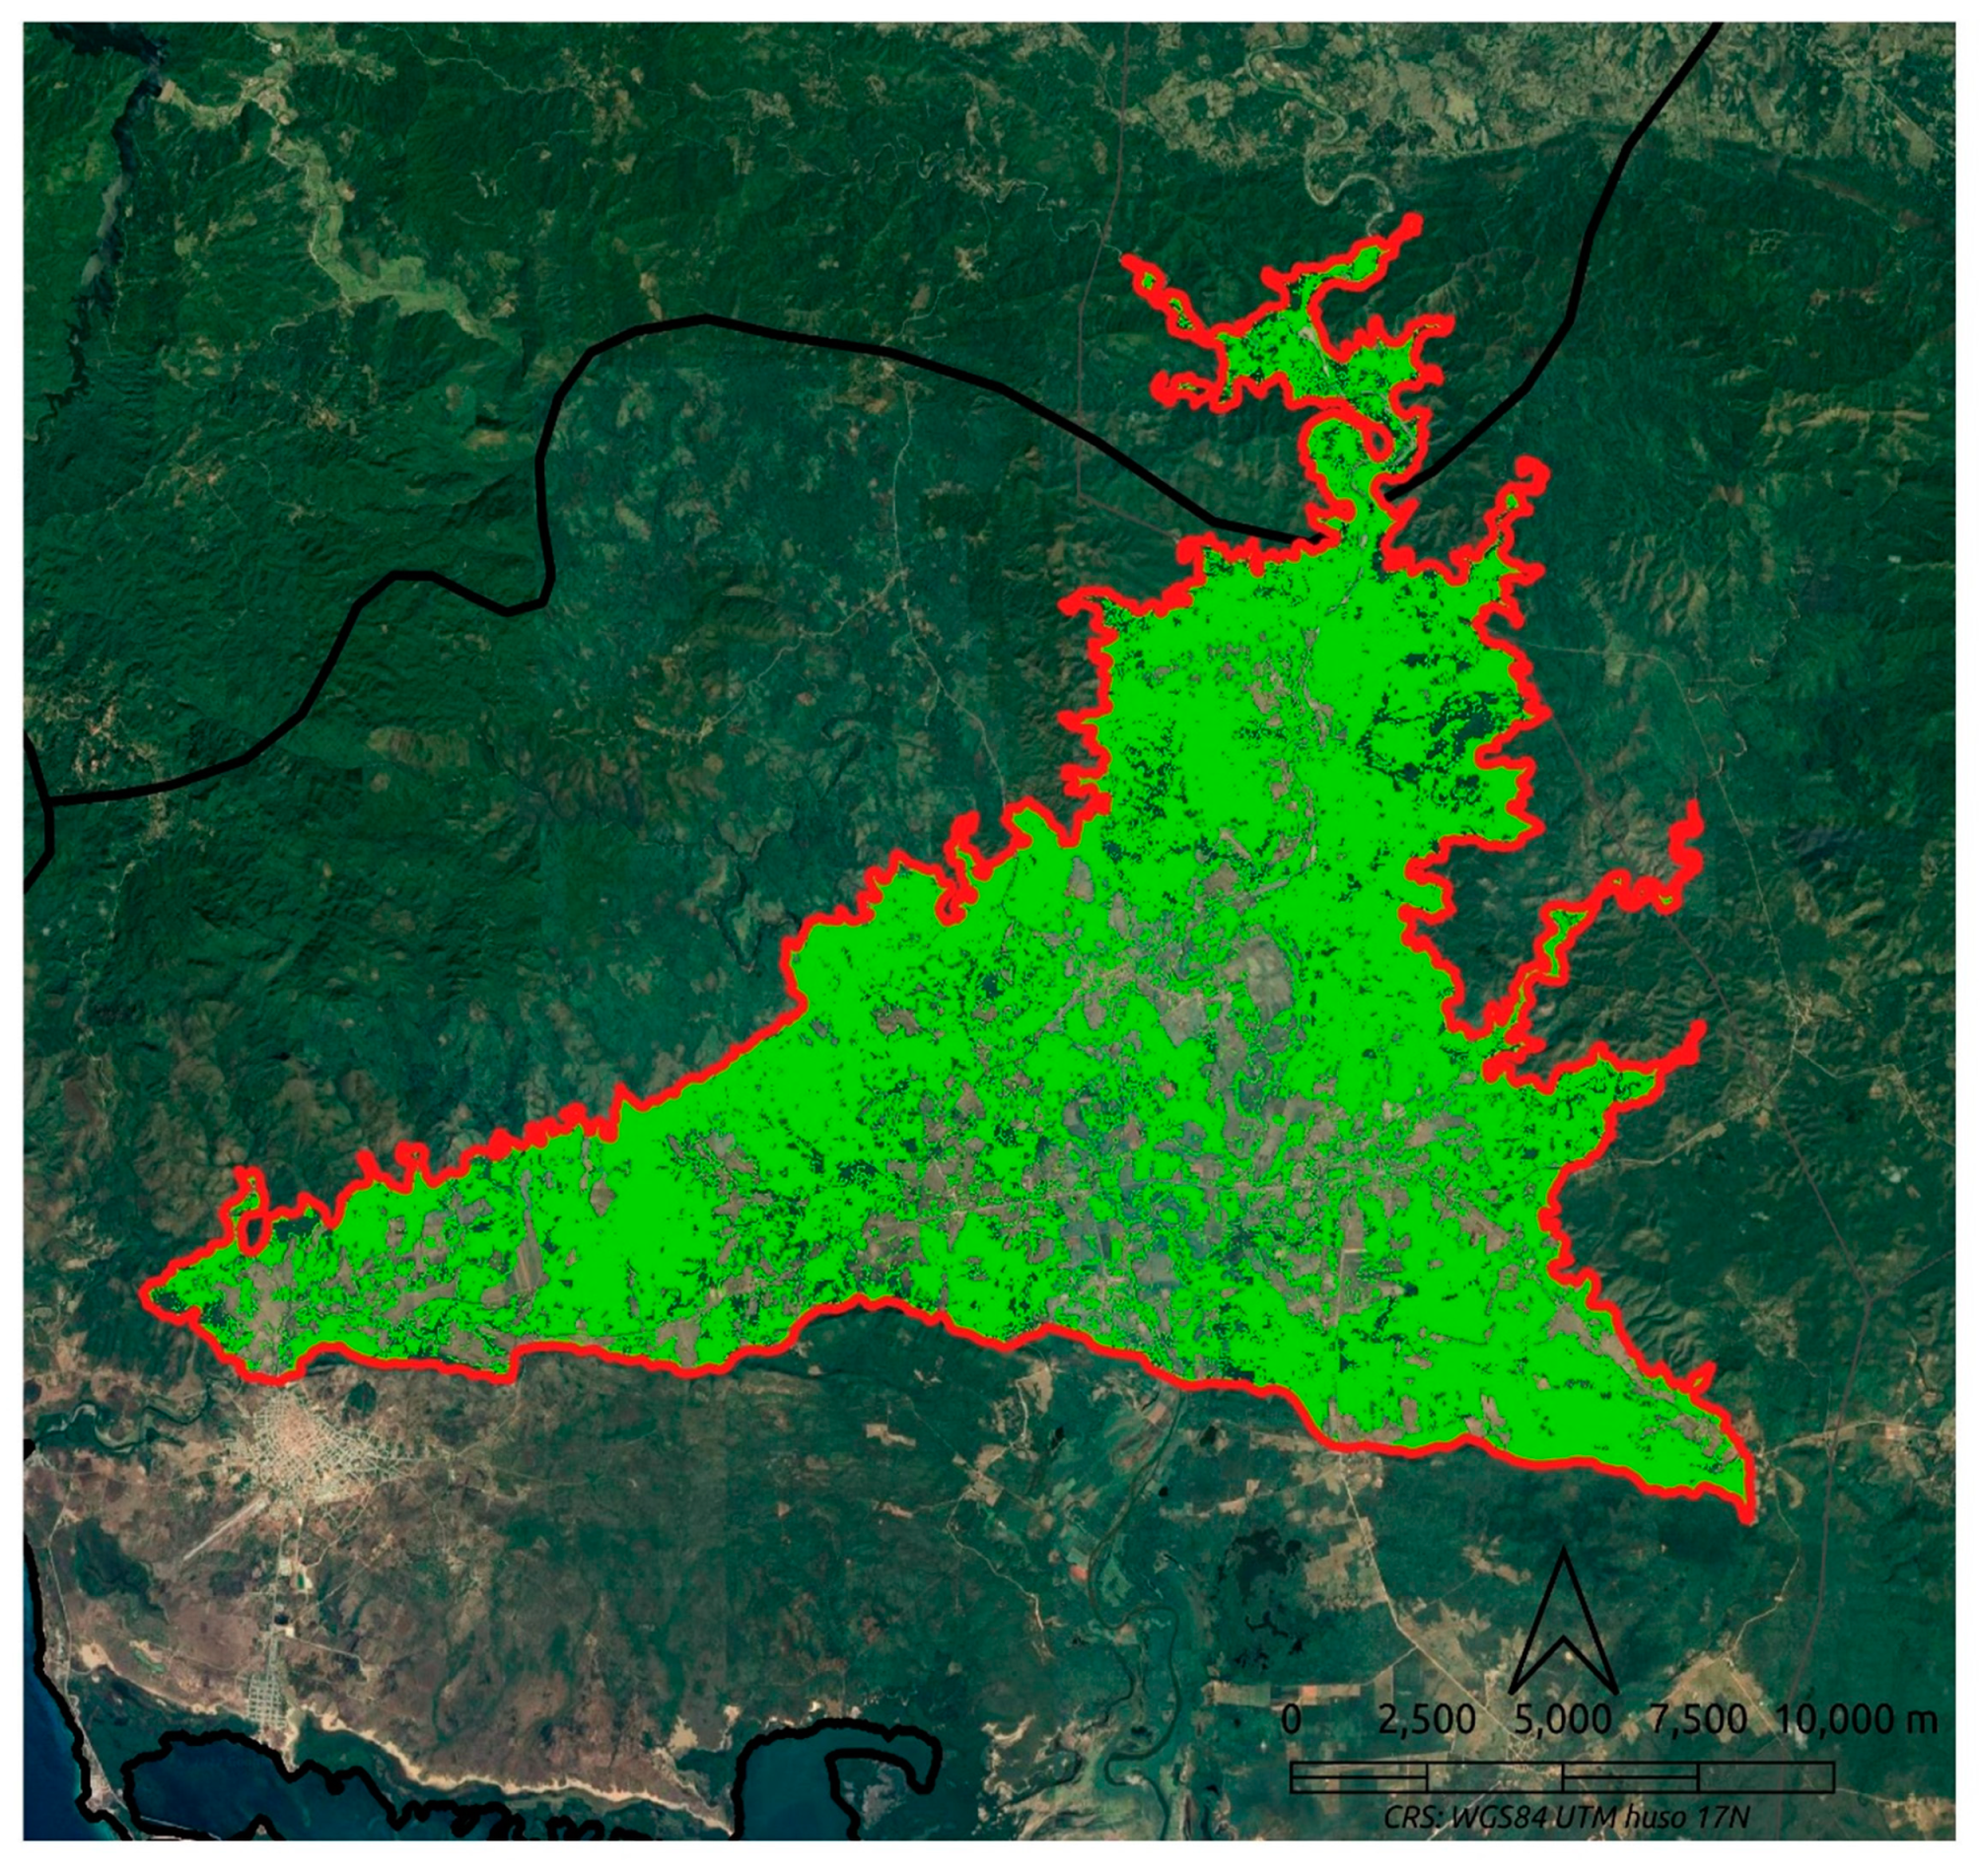
Figure A14.
Marabou year 2021.
References
- Kumar Rai, P.; Singh, J.S. Invasive Alien Plant Species: Their Impact on Environment, Ecosystem Services and Human Health. Ecol. Indic. 2020, 111, 106020. [CrossRef]
- Roy, H.; Pauchard, A.; Stoett, P. Summary for Policymakers of the Thematic Assessment of Invasive Alien Species and Their Control of the Intergovernmental Platform on Biodiversity and Ecosystem Services. 2023. [CrossRef]
- Sharma, G.P.; Raghubanshi, A.S.; Singh, J.S. Lantana Invasion: An Overview. Weed Biol. Manag. 2005, 5, 157–165. [CrossRef]
- Blumenthal, D.M. Interactions between Resource Availability and Enemy Release in Plant Invasion. Ecol. Lett. 2006, 9, 887–895. [CrossRef]
- Pyšek, P.; Jarošík, V.; Hulme, P.E.; Pergl, J.; Hejda, M.; Schaffner, U.; Vilà, M. A Global Assessment of Invasive Plant Impacts on Resident Species, Communities and Ecosystems: The Interaction of Impact Measures, Invading Species’ Traits and Environment. Glob. Chang. Biol. 2012, 18, 1725–1737. [CrossRef]
- Kaur, S.; Kaur, R.; Chauhan, B.S. Understanding Crop-Weed-Fertilizer-Water Interactions and Their Implications for Weed Management in Agricultural Systems. Crop Prot. 2018, 103, 65–72. [CrossRef]
- Black, R.; Bartlett, D.M.F. Biosecurity Frameworks for Cross-Border Movement of Invasive Alien Species. Environ. Sci. Policy 2020, 105, 113–119. [CrossRef]
- Pejchar, L.; Mooney, H.A. Invasive Species, Ecosystem Services and Human Well-Being. Trends Ecol. Evol. 2009, 24, 497–504. [CrossRef]
- Colautti, R.I.; Bailey, S.A.; Van Overdijk, C.D.A.; Amundsen, K.; MacIsaac, H.J. Characterised and Projected Costs of Nonindigenous Species in Canada. Biol. Invasions 2006, 8, 45–59. [CrossRef]
- Tataridas, A.; Jabran, K.; Kanatas, P.; Oliveira, R.S.; Freitas, H.; Travlos, I. Early Detection, Herbicide Resistance Screening, and Integrated Management of Invasive Plant Species: A Review. Pest Manag. Sci. 2022, 78, 3957–3972. [CrossRef]
- Pyšek, P.; Richardson, D.M. Invasive Species, Environmental Change and Management, and Health. https://doi.org/10.1146/annurev-environ-033009-095548 2010, 35, 25–55. [CrossRef]
- Germán, H.C.; Montesbravo, E.P.; Paredes Rodríguez, E.; Calas, P.B. Biologia Reproductiva de Dichrostachys Cinerea (L.) Wight & Arn. (Marabú). (I) Evaluación de Reproduccion Por Semillas. FITOSANIDAD 2008, 12, 39–43.
- Hernandez-Enriquez, O.; Alvarez, R.; Morelli, F.; Bastida, F.; Camacho, D.; Menendez, J. Low-Impact Chemical Weed Control Techniques in UNESCO World Heritage Sites of Cuba. Commun. Agric. Appl. Biol. Sci. 2012, 77, 387–393.
- Sinoga, J.D.R.; Noa, R.R.; Perez, D.F. An Analysis of the Spatial Colonization of Scrubland Intrusive Species in the Itabo and Guanabo Watershed, Cuba. Remote Sens. 2010, 2, 740–757. [CrossRef]
- Moreno, E.; Zabalo, A.; Gonzalez, E.; Alvarez, R.; Jimenez, V.M.; Menendez, J. Affordable Use of Satellite Imagery in Agriculture and Development Projects: Assessing the Spatial Distribution of Invasive Weeds in the UNESCO-Protected Areas of Cuba. Agric. 2021, Vol. 11, Page 1057 2021, 11, 1057. [CrossRef]
- Xie, Y.; Sha, Z.; Yu, M. Remote Sensing Imagery in Vegetation Mapping: A Review. J. Plant Ecol. 2008, 1, 9–23. [CrossRef]
- Chen, B.; Jin, Y.; Brown, P. Automatic Mapping of Planting Year for Tree Crops with Landsat Satellite Time Series Stacks. ISPRS J. Photogramm. Remote Sens. 2019, 151, 176–188. [CrossRef]
- Abburu, S.; Babu Golla, S. Satellite Image Classification Methods and Techniques: A Review. Int. J. Comput. Appl. 2015, 119, 20–25. [CrossRef]
- Paul M. Mather, M.K. Computer Processing of Remotely-Sensed Images: An Introduction; 2011;
- Chen, B.; Tu, Y.; Song, Y.; Theobald, D.M.; Zhang, T.; Ren, Z.; Li, X.; Yang, J.; Wang, J.; Wang, X.; et al. Mapping Essential Urban Land Use Categories with Open Big Data: Results for Five Metropolitan Areas in the United States of America. ISPRS J. Photogramm. Remote Sens. 2021, 178, 203–218. [CrossRef]
- Hasmadi, I. Evaluating Supervised and Unsupervised Techniques for Land Cover Mapping Using Remote Sensing Data. Malaysia nJournal Soc. Sp. 2009, 5, 1–10.
- Müllerová, J.; Brundu, G.; Große-Stoltenberg, A.; Kattenborn, T.; Richardson, D.M.; Müllerová, J.; Brundu, G.; Große-Stoltenberg, A.; Kattenborn, T.; Richardson, D.M. Pattern to Process, Research to Practice: Remote Sensing of Plant Invasions. Biol. Invasions 2023 2512 2023, 25, 3651–3676. [CrossRef]
- Panda, S.S.; Terrill, T.H.; Mahapatra, A.K.; Kelly, B.; Morgan, E.R.; Wyk, J.A. van Site-Specific Forage Management of Sericea Lespedeza: Geospatial Technology-Based Forage Quality and Yield Enhancement Model Development. Agric. 2020, Vol. 10, Page 419 2020, 10, 419. [CrossRef]
- Wiens, J.A. Spatial Scaling in Ecology. Funct. Ecol. 1989, 3, 385. [CrossRef]
- Blaschke, T.; Hay, G.J.; Kelly, M.; Lang, S.; Hofmann, P.; Addink, E.; Queiroz Feitosa, R.; van der Meer, F.; van der Werff, H.; van Coillie, F.; et al. Geographic Object-Based Image Analysis - Towards a New Paradigm. ISPRS J. Photogramm. Remote Sens. 2014, 87, 180–191. [CrossRef]
- Valjarević, A.; Milanović, M.; Valjarević, D.; Basarin, B.; Gribb, W.; Lukić, T. Geographical Information Systems and Remote Sensing Methods in the Estimation of Potential Dew Volume and Its Utilization in the United Arab Emirates. Arab. J. Geosci. 2021 1415 2021, 14, 1–15. [CrossRef]
- Clark, M.L. Comparison of Multi-Seasonal Landsat 8, Sentinel-2 and Hyperspectral Images for Mapping Forest Alliances in Northern California. ISPRS J. Photogramm. Remote Sens. 2020, 159, 26–40. [CrossRef]
- Oreti, L.; Giuliarelli, D.; Tomao, A.; Barbati, A. Object Oriented Classification for Mapping Mixed and Pure Forest Stands Using Very-High Resolution Imagery. Remote Sens. 2021, Vol. 13, Page 2508 2021, 13, 2508. [CrossRef]
- Escambray Newspaper Available online: https://www.escambray.cu/especiales/valle/.
- Escambray Newspaper Available online: https://www.escambray.cu/2013/metamorfosis-del-valle-de-san-luis-en-trinidad/.
- GADM Available online: https://gadm.org/ (accessed on 10 April 2022).
- Datasets Available online: https://developers.google.com/earth-engine/datasets/catalog/LANDSAT_LC08_C01_T1_SR.
- Zhu, Z.; Woodcock, C.E. Object-Based Cloud and Cloud Shadow Detection in Landsat Imagery. Remote Sens. Environ. 2012, 118, 83–94. [CrossRef]
- Nicolau, A.P.; Dyson, K.; Bhandari, B.; Saah, D.; Clinton, N. Fitting Functions to Time Series. Cloud-Based Remote Sens. with Google Earth Engine 2024, 331–351. [CrossRef]
- Carreño-Conde, F.; Sipols, A.E.; Simón, C.; Mostaza-Colado, D. A Forecast Model Applied to Monitor Crops Dynamics Using Vegetation Indices (NDVI). Appl. Sci. 2021, Vol. 11, Page 1859 2021, 11, 1859. [CrossRef]
- Berveglieri, A.; Imai, N.N.; Christovam, L.E.; Galo, M.L.B.T.; Tommaselli, A.M.G.; Honkavaara, E. Analysis of Trends and Changes in the Successional Trajectories of Tropical Forest Using the Landsat NDVI Time Series. Remote Sens. Appl. Soc. Environ. 2021, 24, 100622. [CrossRef]
- Bai, B.X.; Tan, Y.M.; Wu, P. THE SPATIAL AND TEMPORAL AVAILABILITY DIFFERENCES OF CLOUD-FREE LANDSAT IMAGES OVER THREE GORGES RESERVOIR AREA. Int. Arch. Photogramm. Remote Sens. Spat. Inf. Sci. 2019, XLII-3-W9, 1–8. [CrossRef]
- Li, H.; Jia, M.; Zhang, R.; Ren, Y.; Wen, X. Incorporating the Plant Phenological Trajectory into Mangrove Species Mapping with Dense Time Series Sentinel-2 Imagery and the Google Earth Engine Platform. [CrossRef]
- Liu, X.; Liu, H.; Datta, P.; Frey, J.; Koch, B. Mapping an Invasive Plant Spartina Alterniflora by Combining an Ensemble One-Class Classification Algorithm with a Phenological NDVI Time-Series Analysis Approach in Middle Coast of Jiangsu, China. Remote Sens. 2020, Vol. 12, Page 4010 2020, 12, 4010. [CrossRef]
- Boscutti, F.; Sigura, M.; De Simone, S.; Marini, L. Exotic Plant Invasion in Agricultural Landscapes: A Matter of Dispersal Mode and Disturbance Intensity. Appl. Veg. Sci. 2018, 21, 250–257. [CrossRef]
- Paini, D.R.; Sheppard, A.W.; Cook, D.C.; De Barro, P.J.; Worner, S.P.; Thomas, M.B. Global Threat to Agriculture from Invasive Species. Proc. Natl. Acad. Sci. U. S. A. 2016, 113, 7575–7579. [CrossRef]
- Pimentel, D.; Zuniga, R.; Morrison, D. Update on the Environmental and Economic Costs Associated with Alien-Invasive Species in the United States. Ecol. Econ. 2005, 52, 273–288. [CrossRef]
- Labonté, J.; Drolet, G.; Sylvain, J.D.; Thiffault, N.; Hébert, F.; Girard, F. Phenology-Based Mapping of an Alien Invasive Species Using Time Series of Multispectral Satellite Data: A Case-Study with Glossy Buckthorn in Québec, Canada. Remote Sens. 2020, Vol. 12, Page 922 2020, 12, 922. [CrossRef]
- César De Sá, N.; Carvalho, S.; Castro, P.; Marchante, E.; Marchante, H. Using Landsat Time Series to Understand How Management and Disturbances Influence the Expansion of an Invasive Tree. IEEE J. Sel. Top. Appl. Earth Obs. Remote Sens. 2017, 10, 3243–3253. [CrossRef]
- Evangelista, P.H.; Stohlgren, T.J.; Morisette, J.T.; Kumar, S. Mapping Invasive Tamarisk (Tamarix): A Comparison of Single-Scene and Time-Series Analyses of Remotely Sensed Data. Remote Sens. 2009, Vol. 1, Pages 519-533 2009, 1, 519–533. [CrossRef]
Figure 1.
Cartographic sources provided by the University of Sancti Spiritus (Cuba).
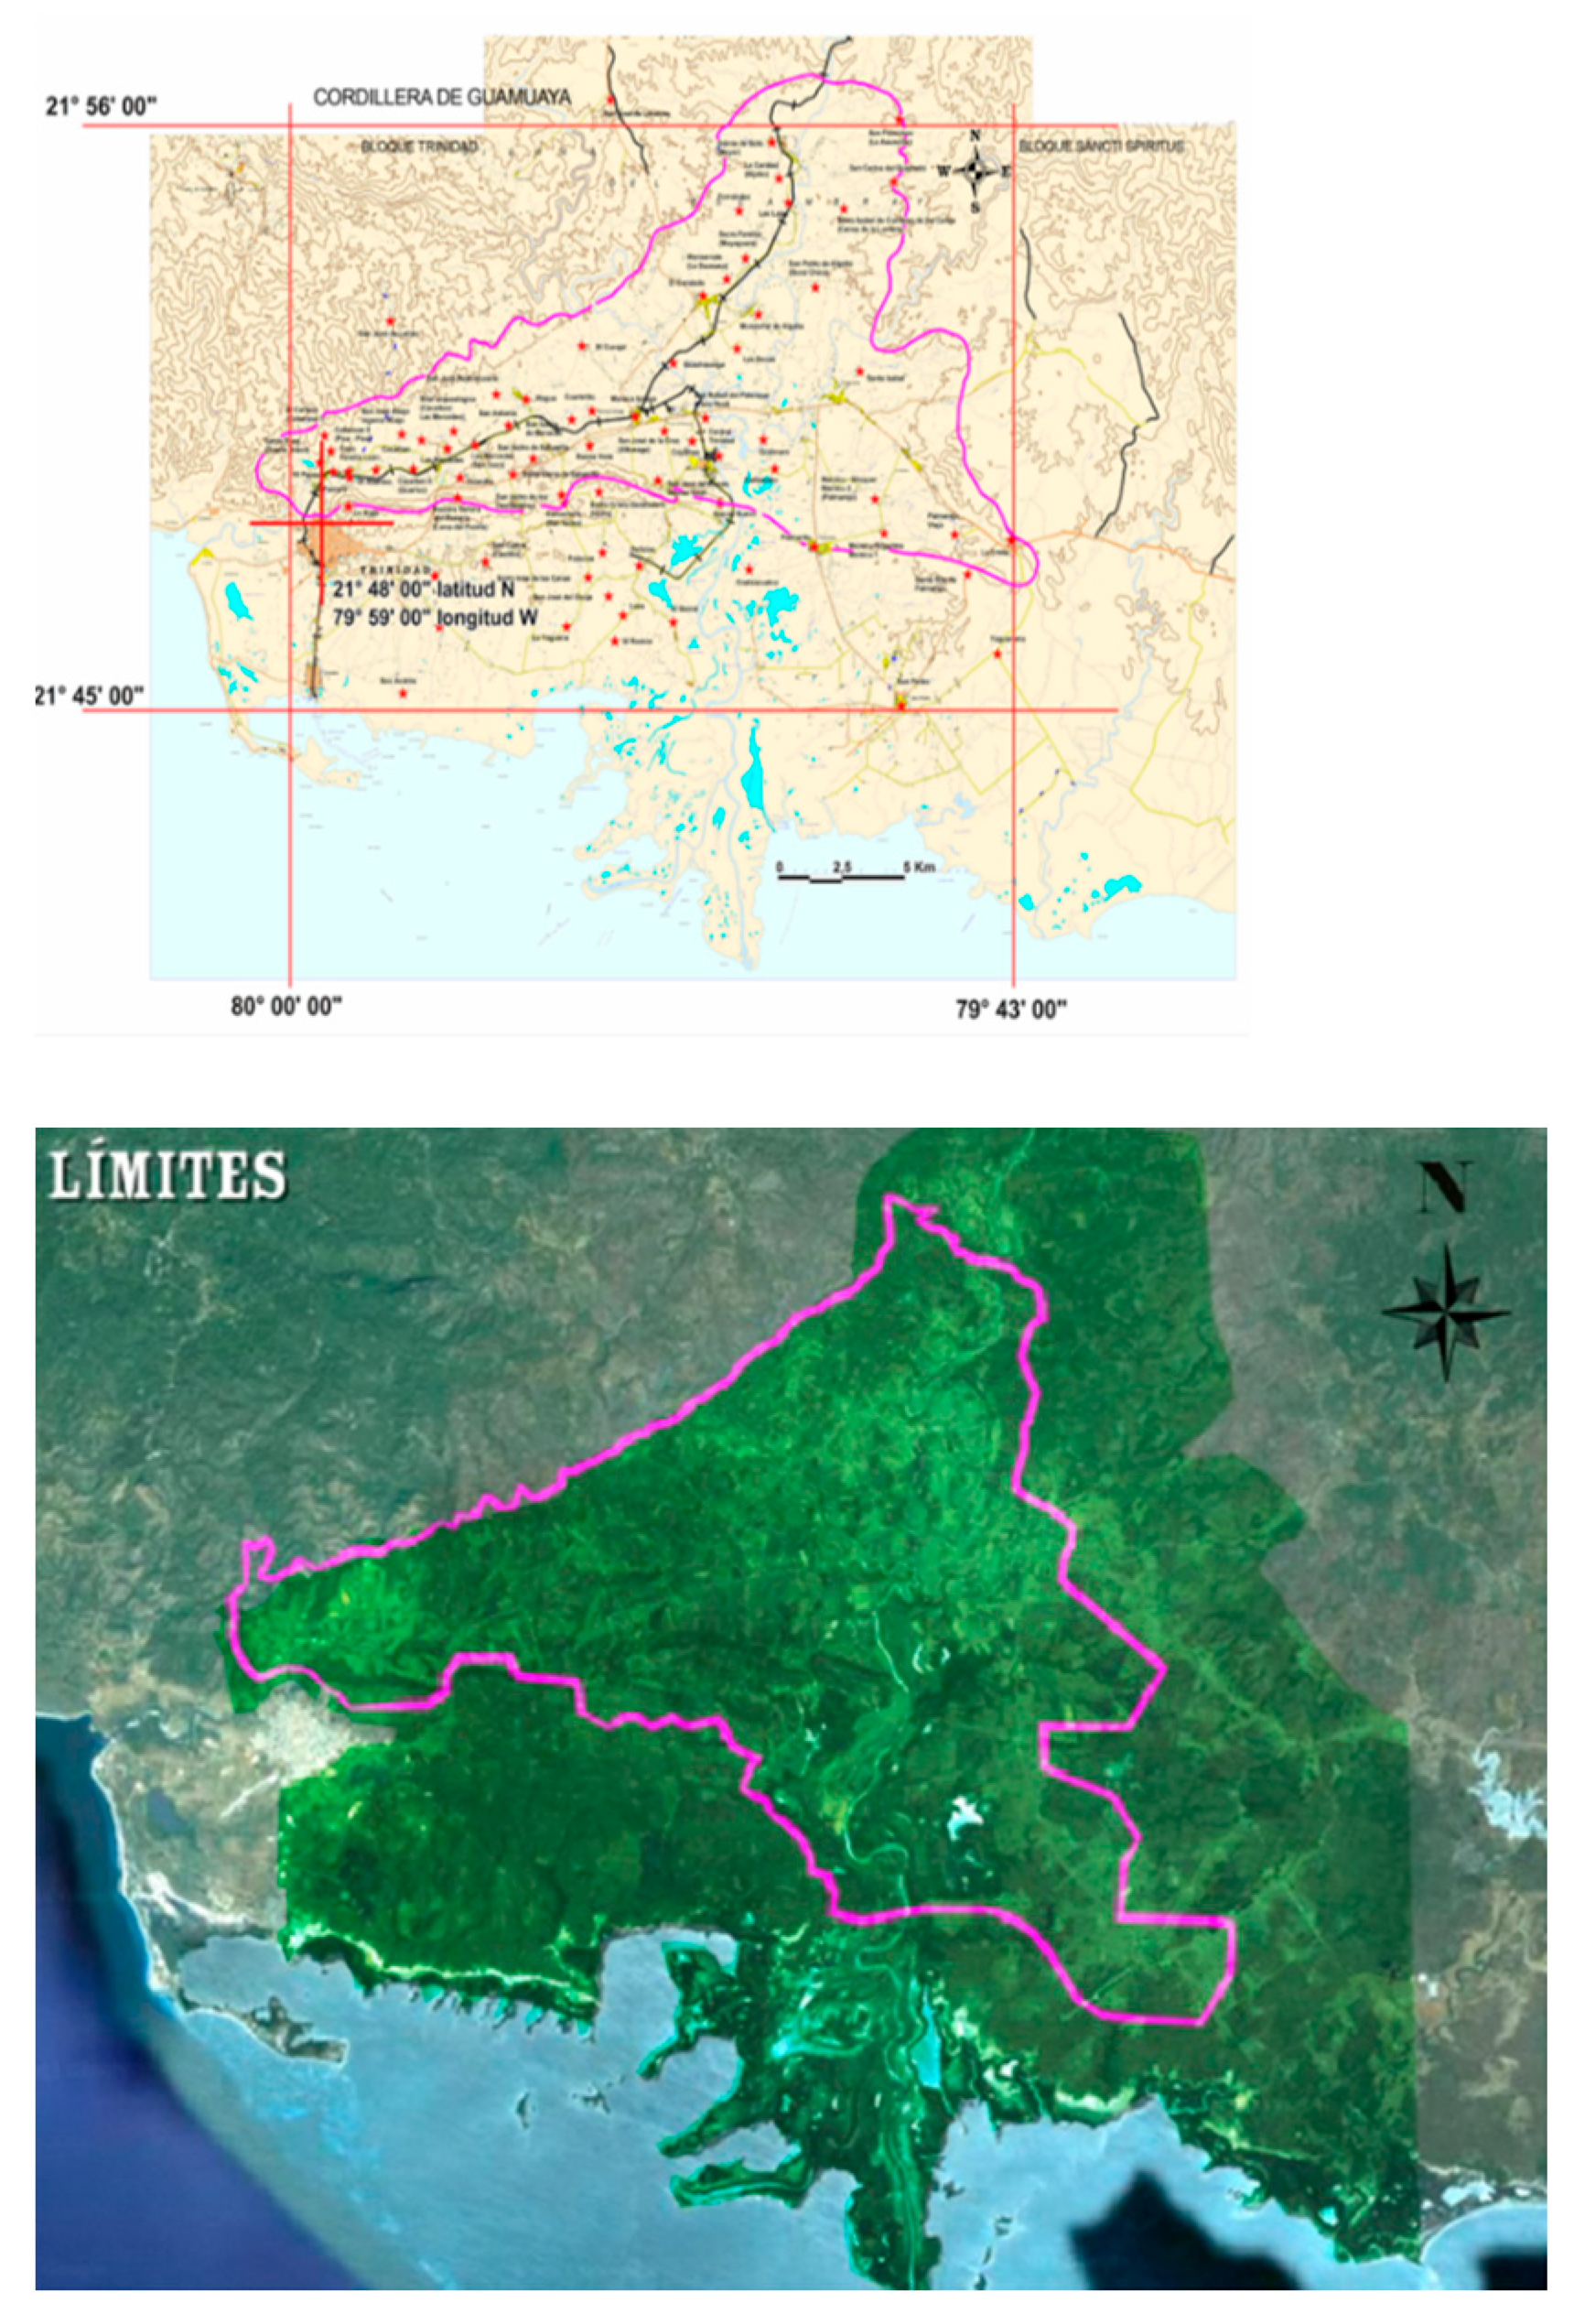
Figure 2.
Work flowchart.
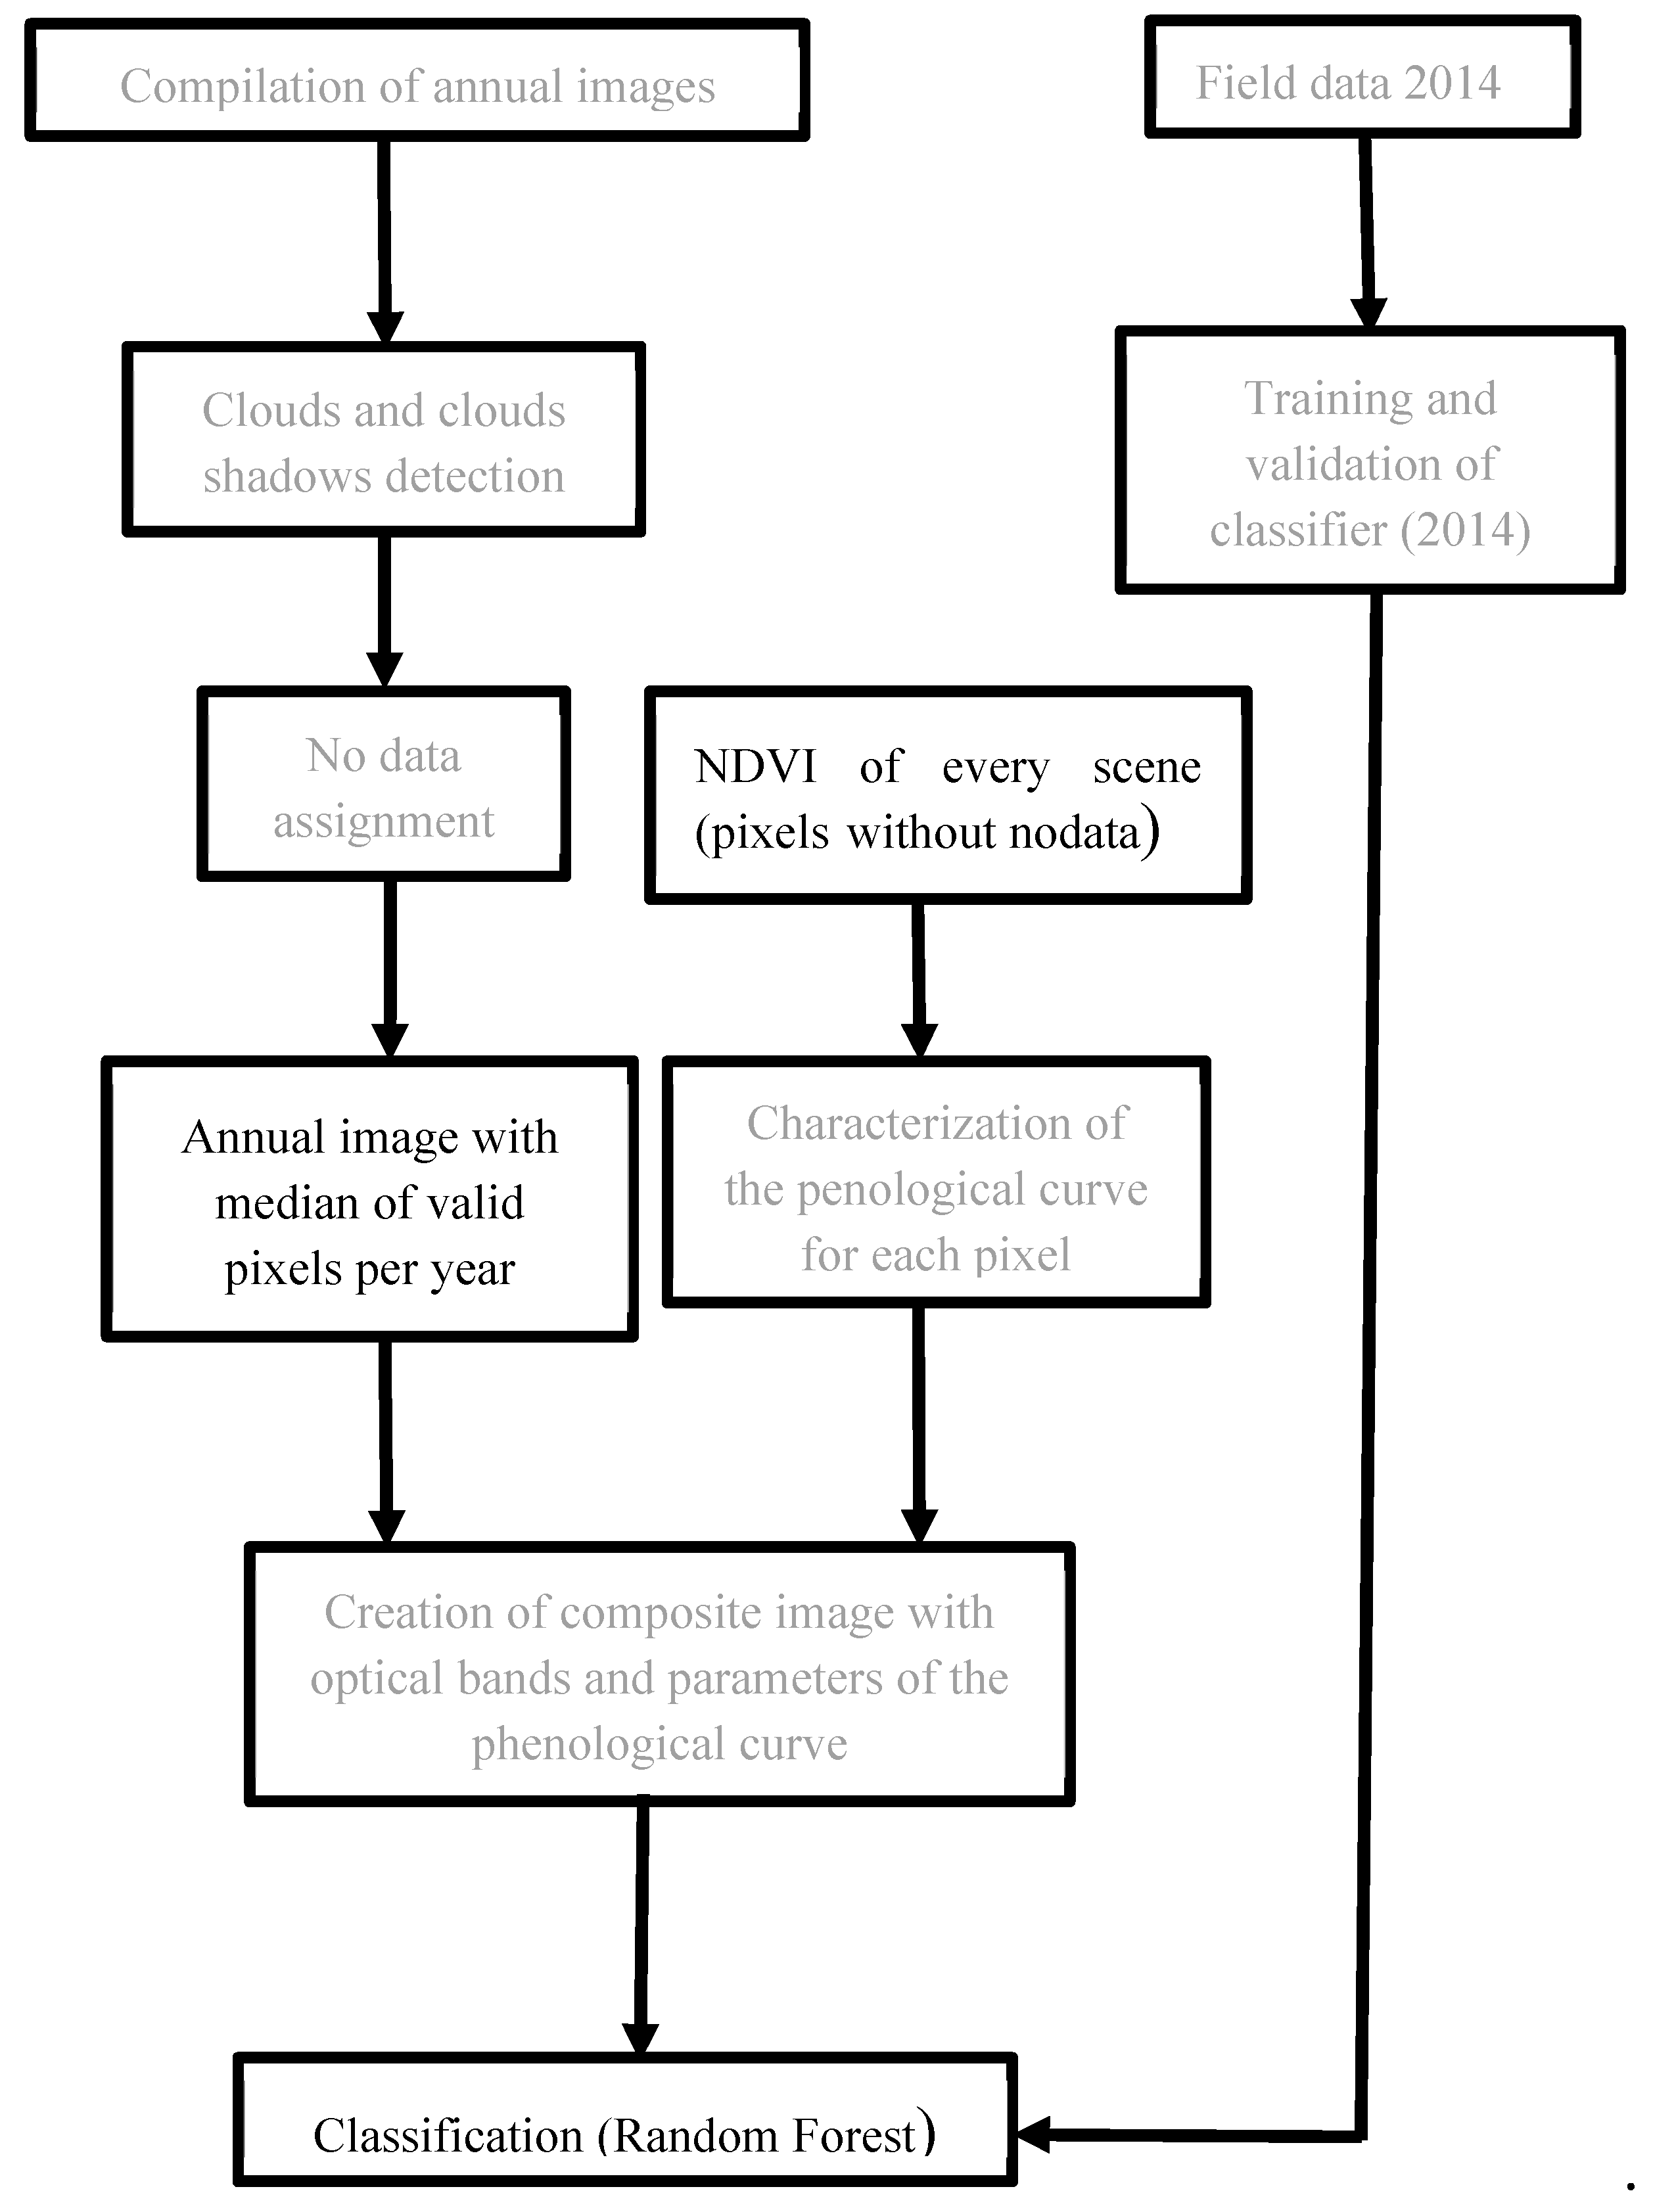
Figure 3.
Final delimitation of the Valle de los Ingenios.
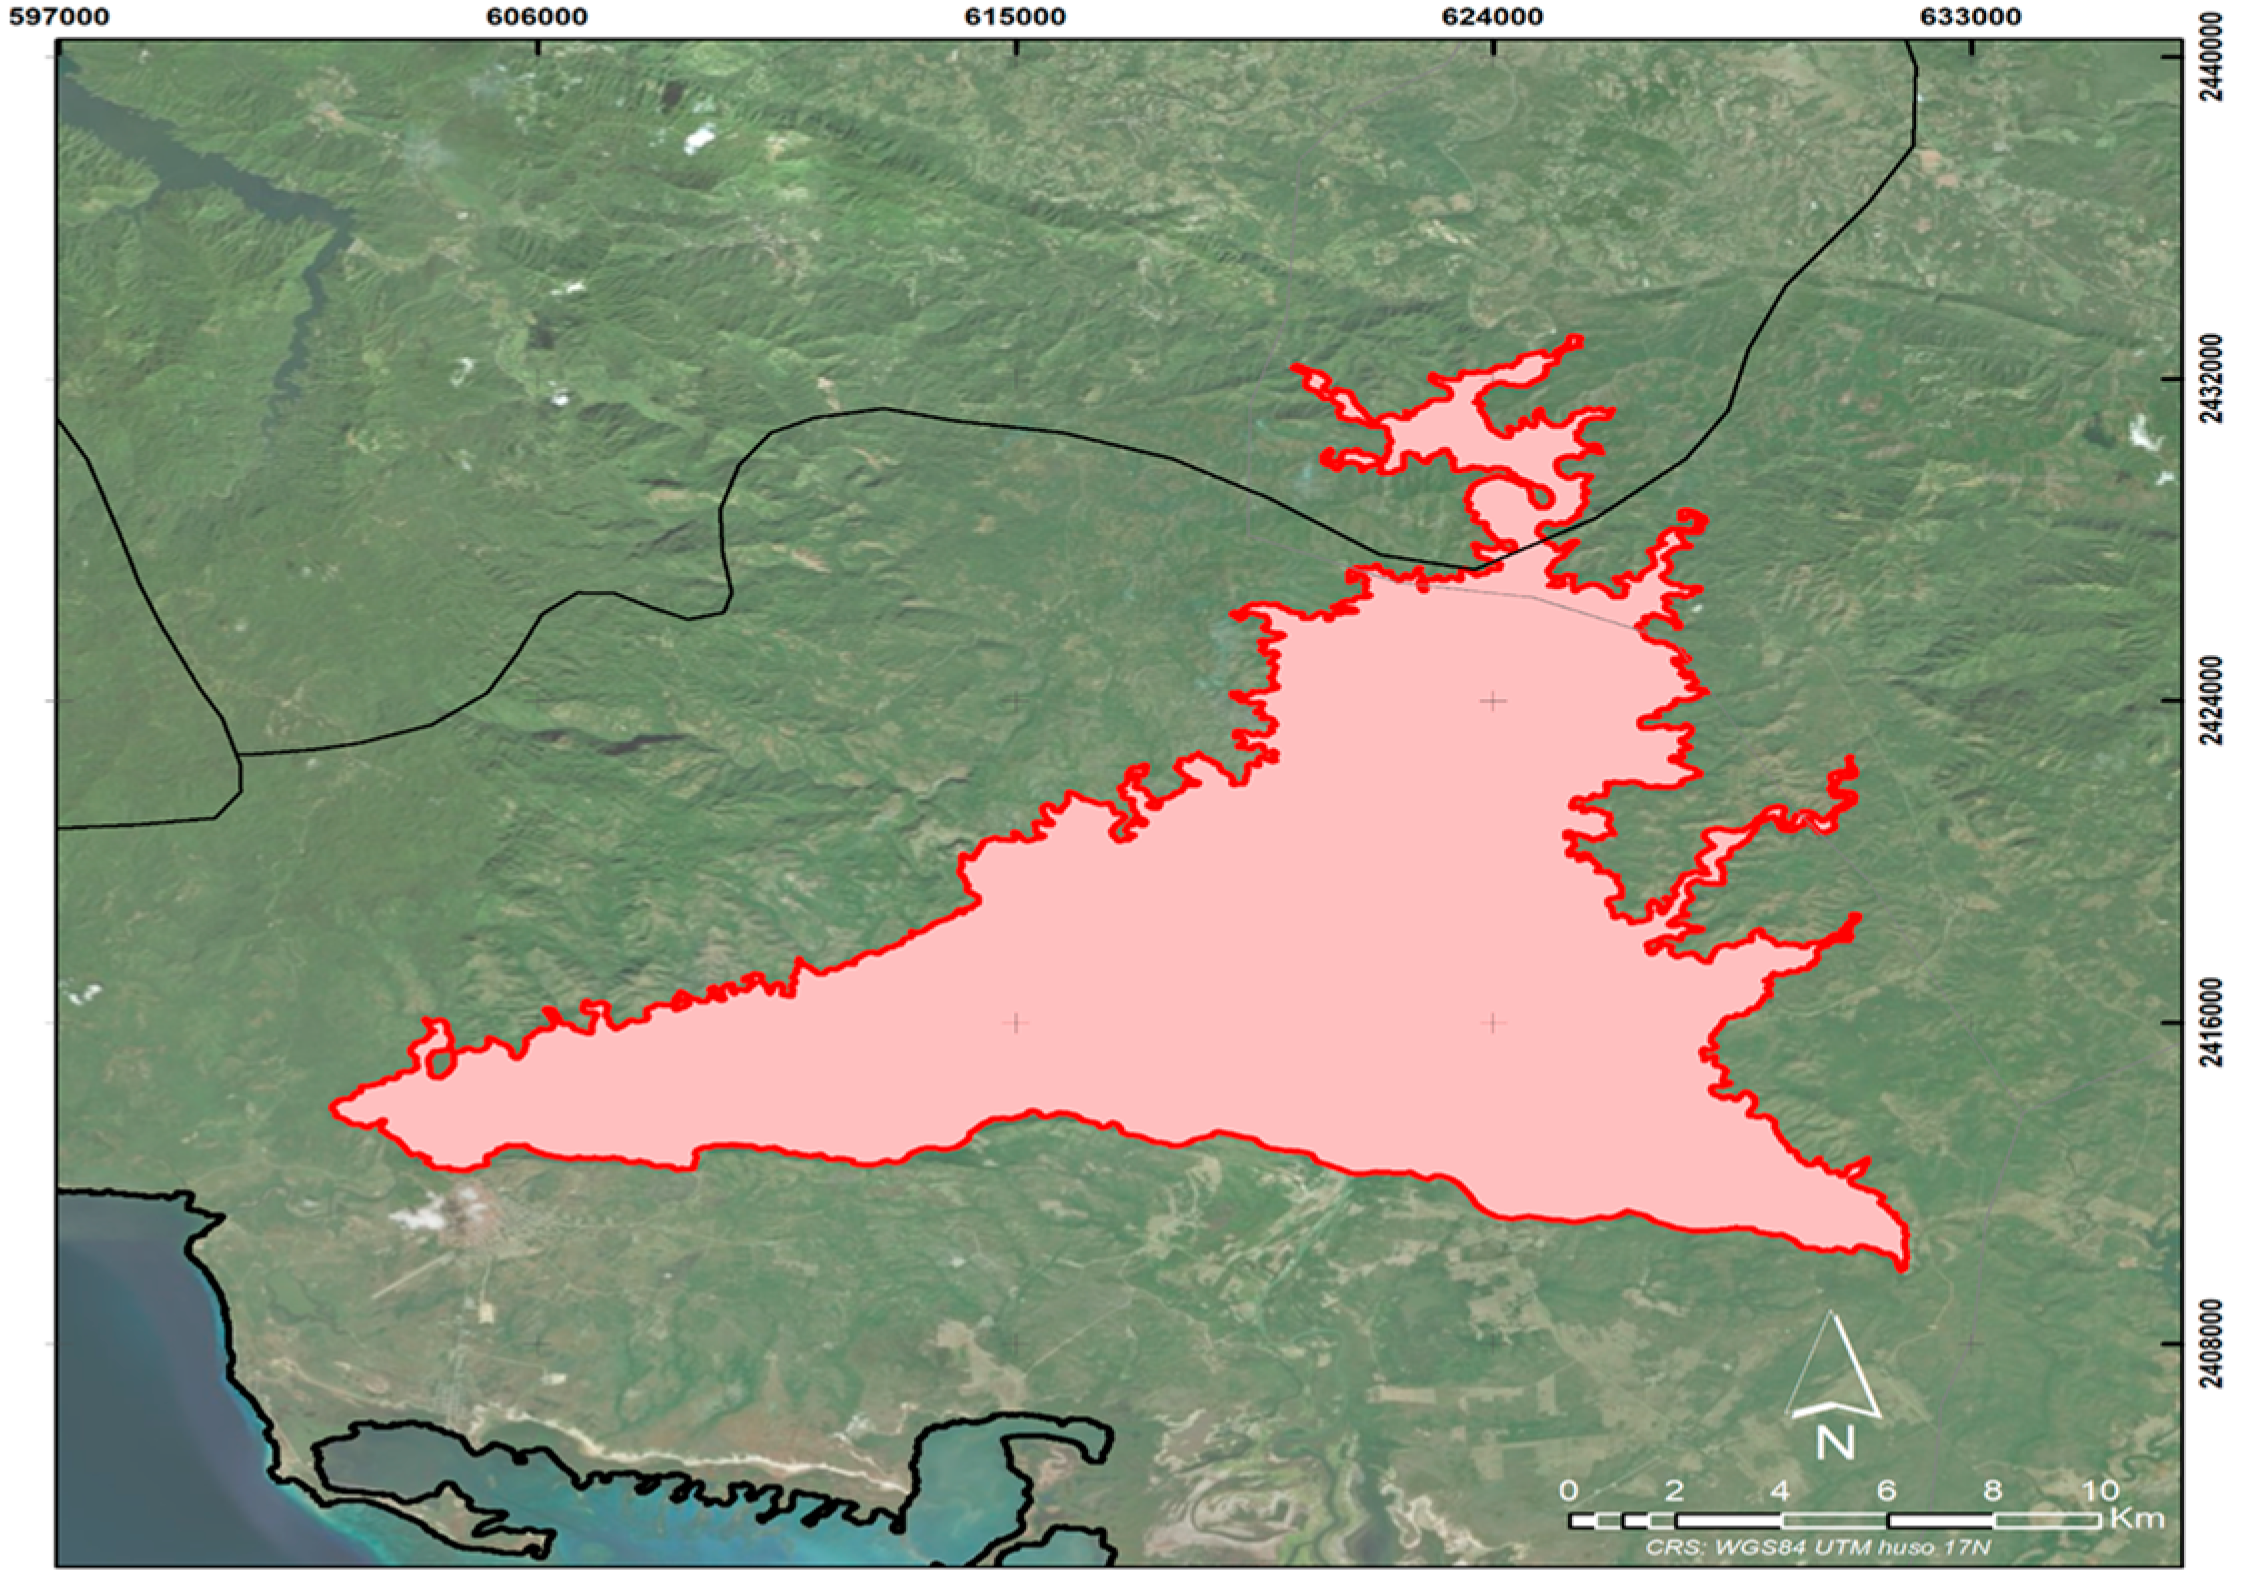
Figure 4.
(a) Landsat 8 NDVI time series. (b) Harmonic model.
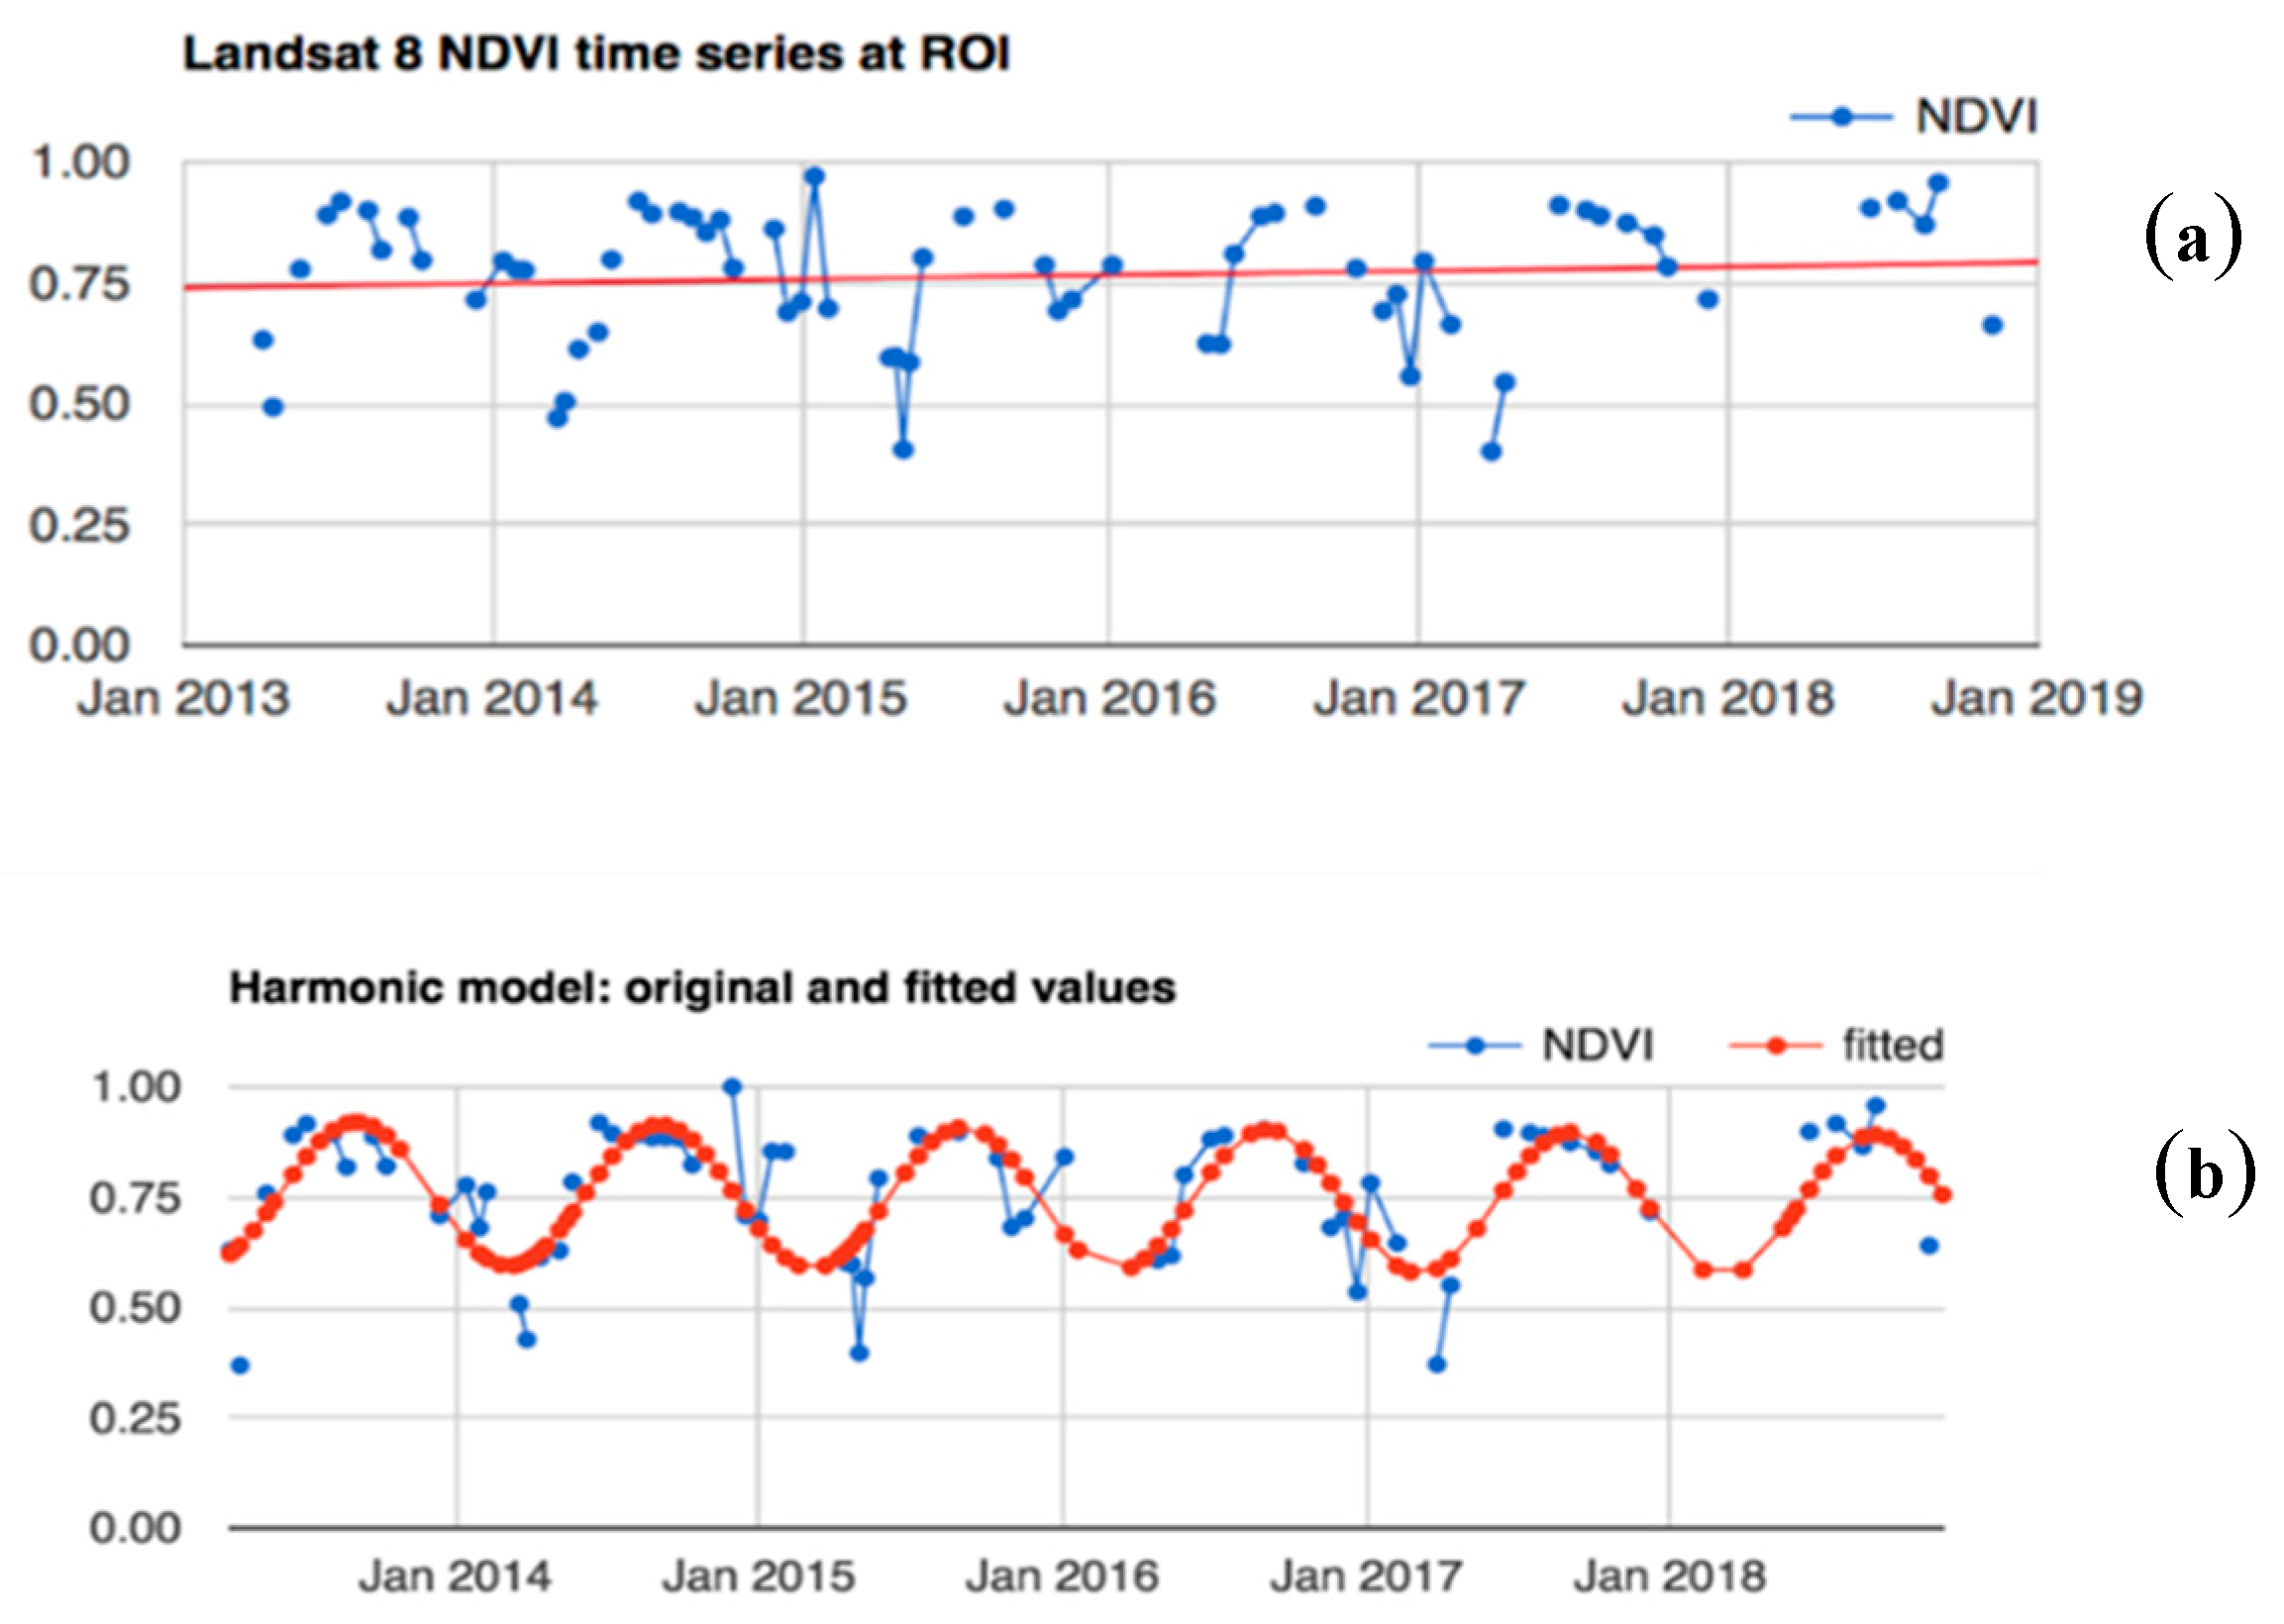
Figure 5.
Example of Landsat 8 original and harmonic model fitted values (year 2014).
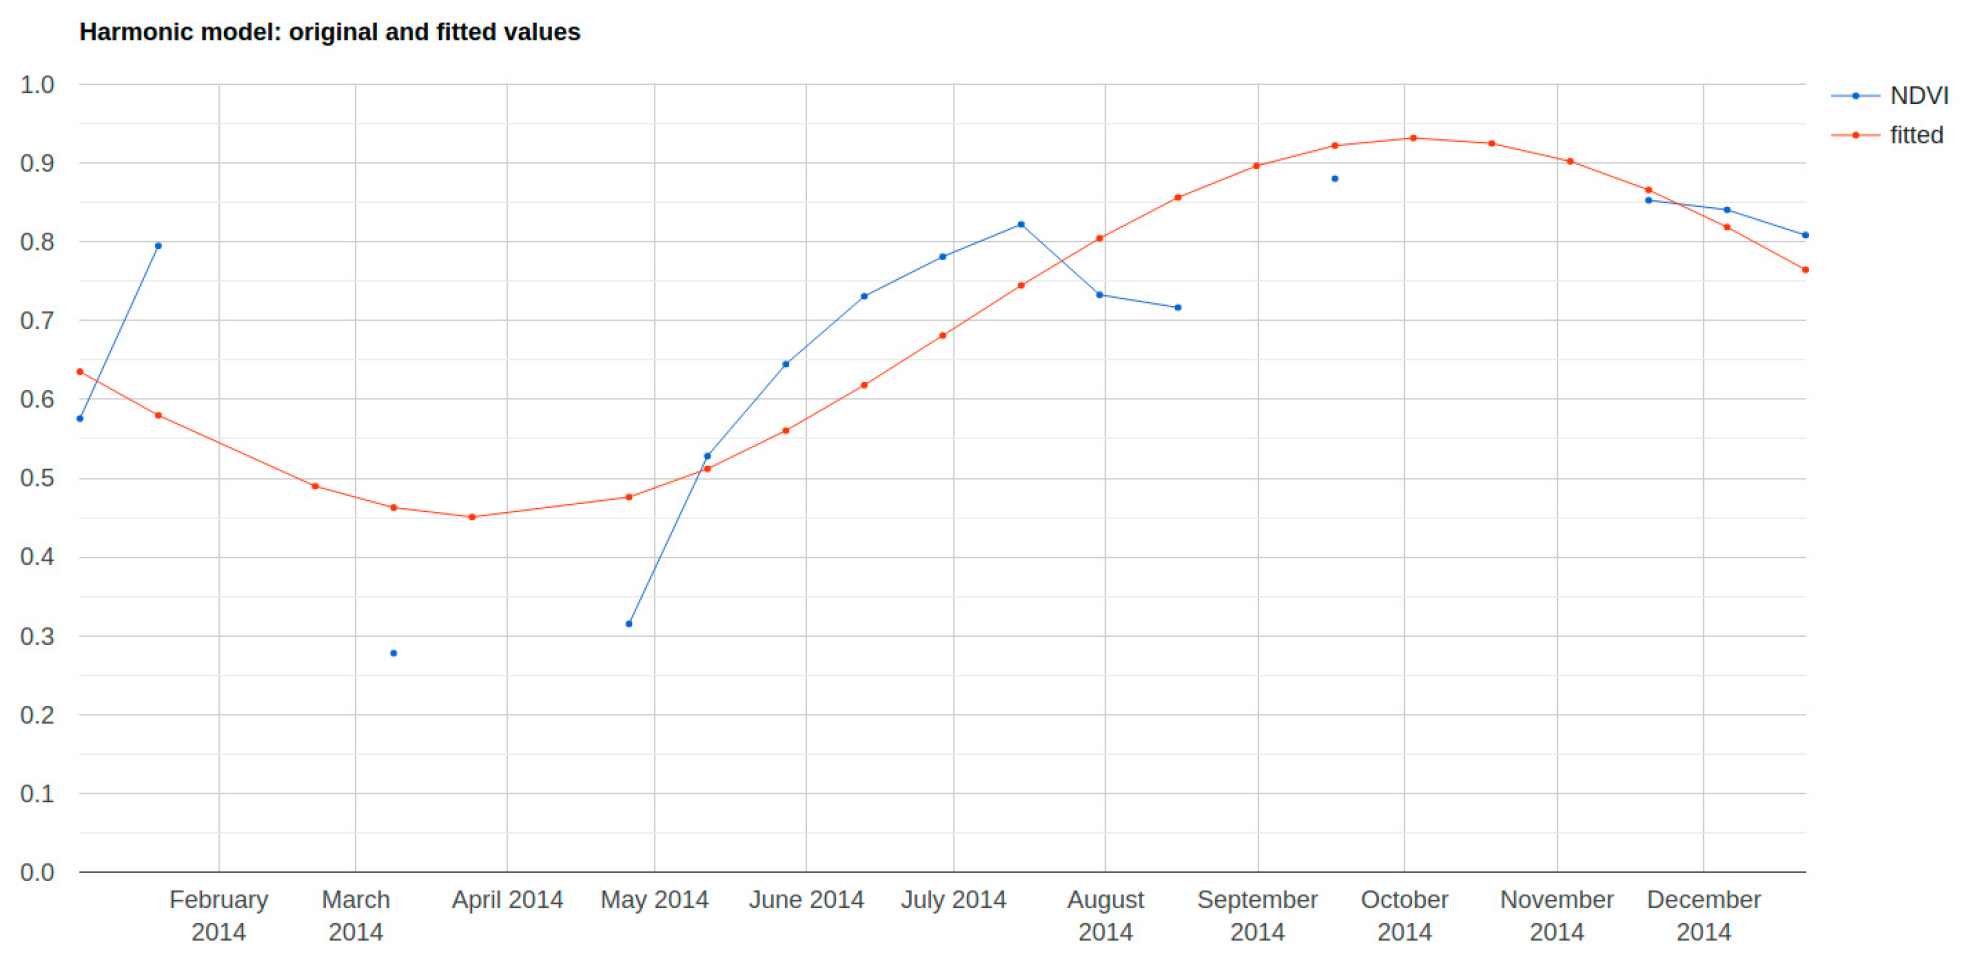
Figure 6.
Marabou distribution maps from years 2004 (a), 2006 (b), 2016 (c), and 2021 (d).
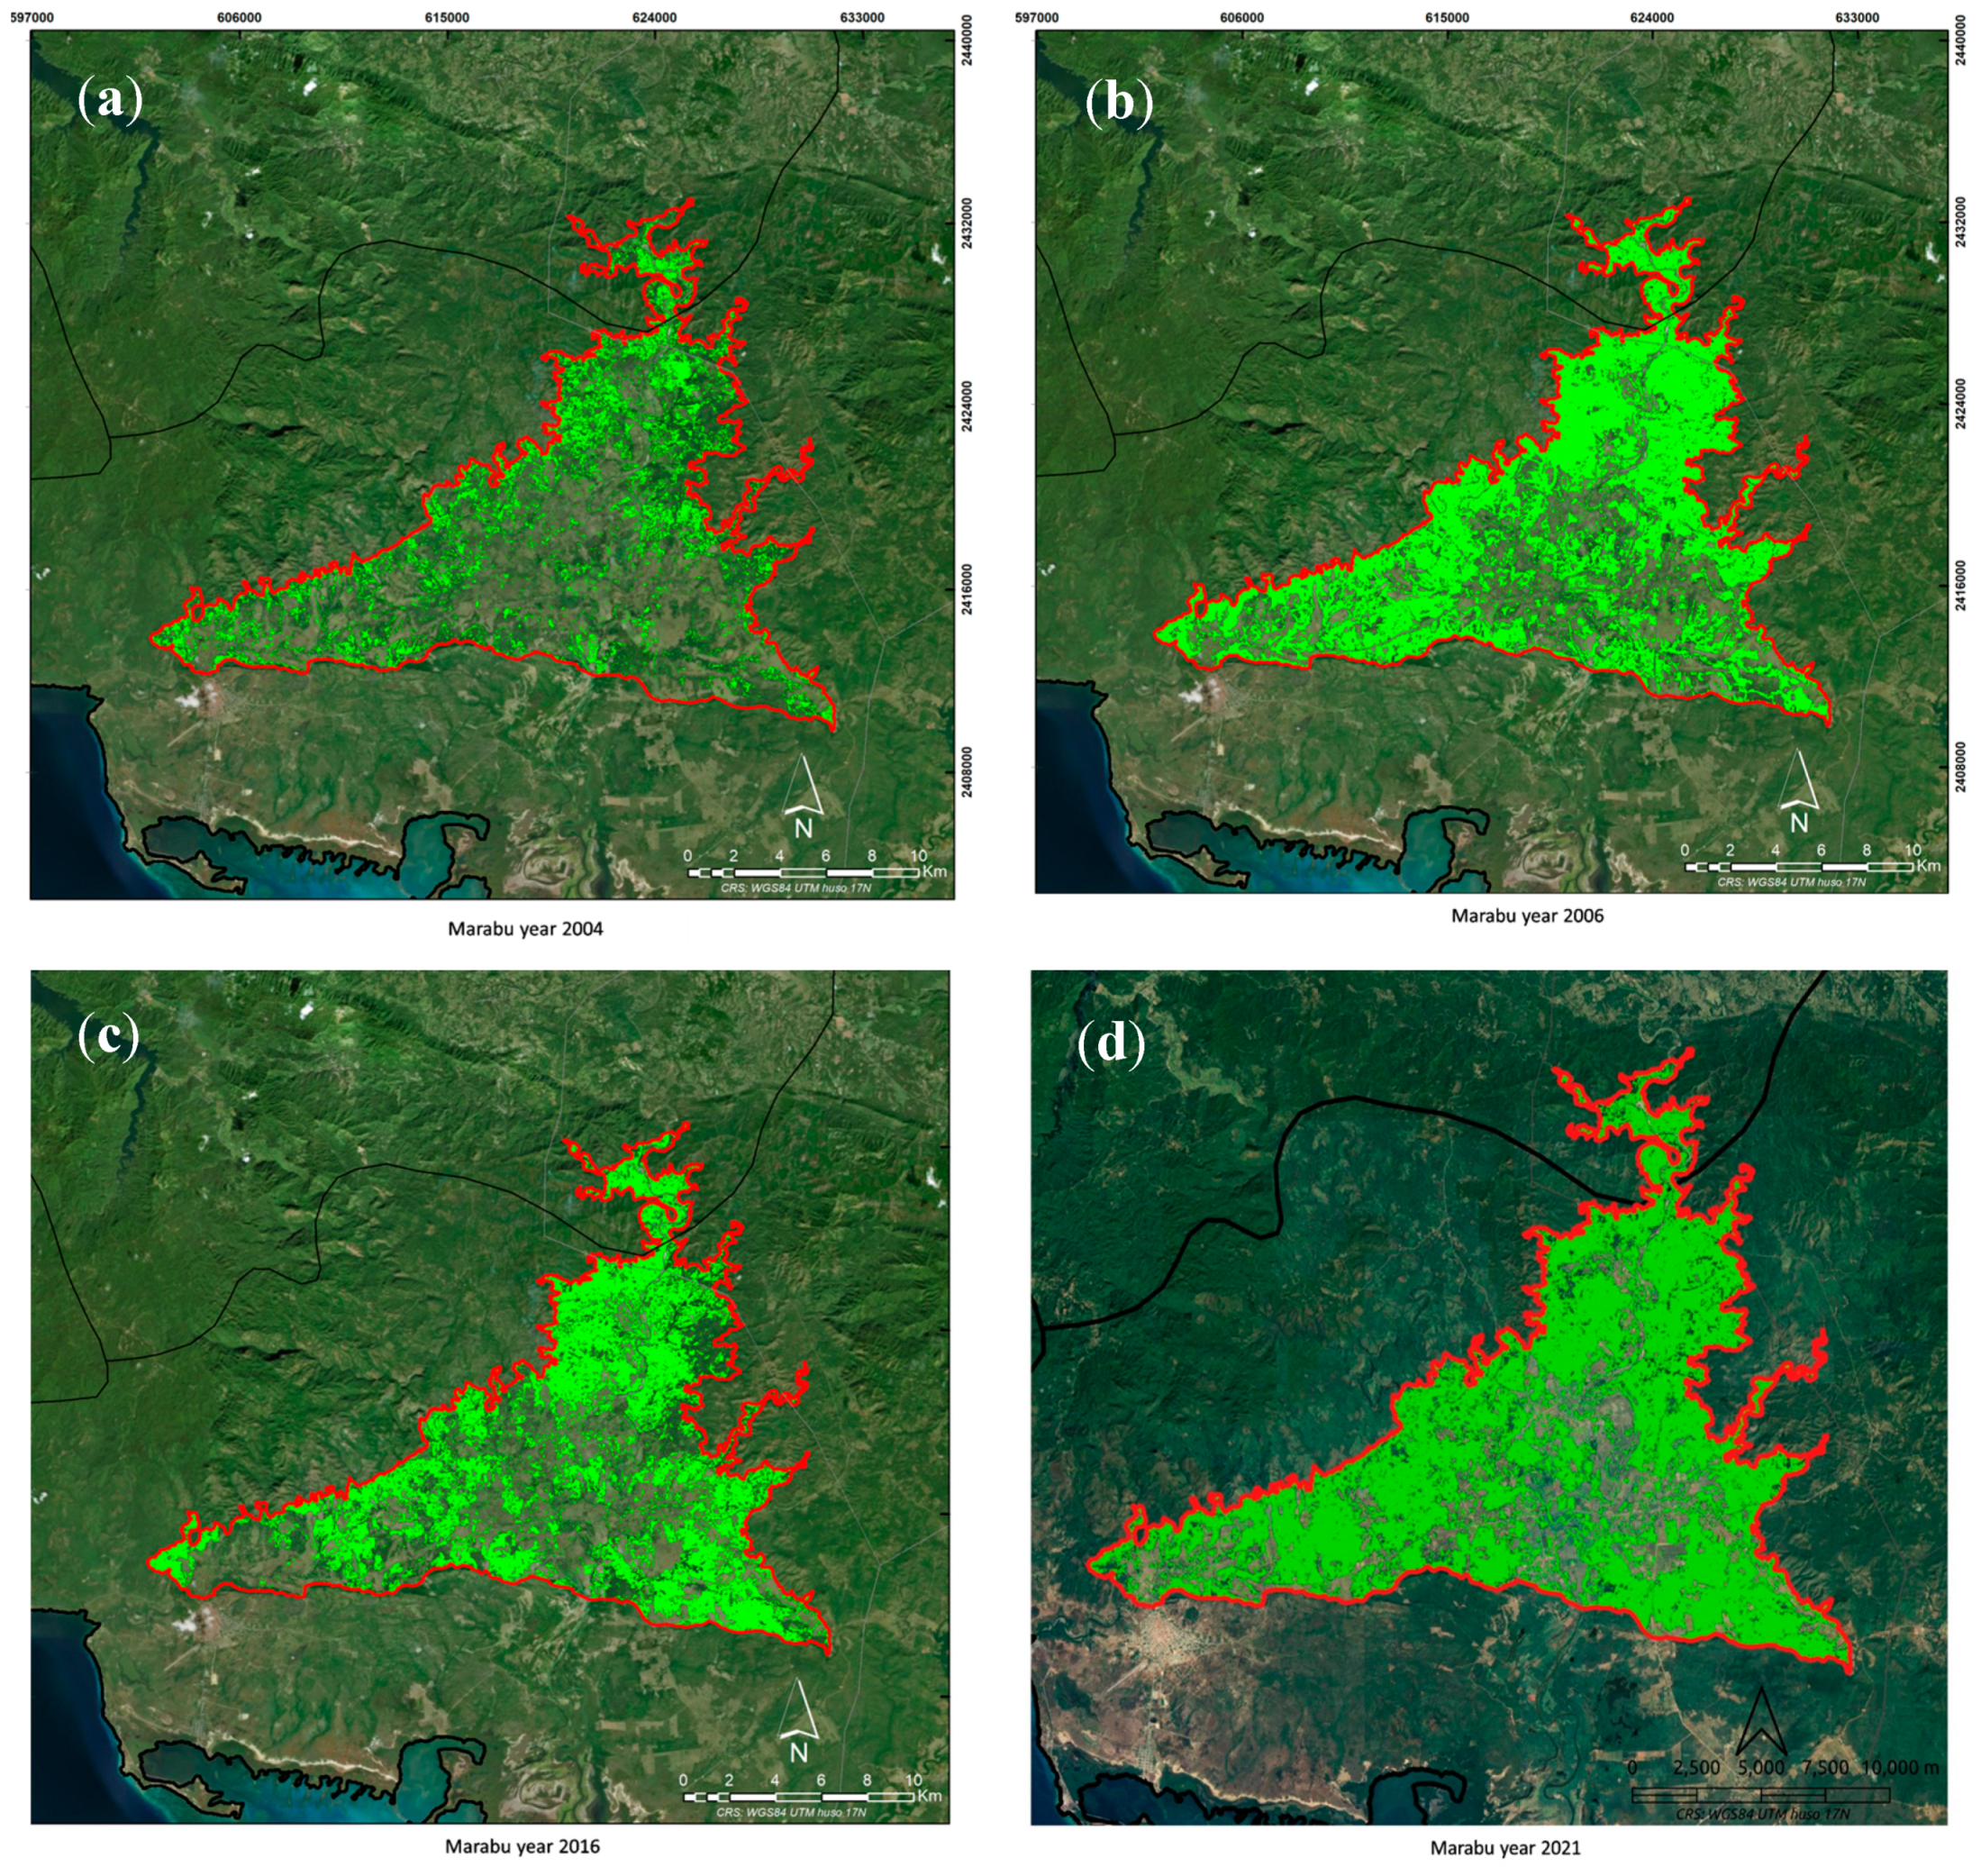

Table 1.
Sampling plots.
| Parcel number | UTM coordinate (m) WGS_1984_17_N |
Area (m2) | Vegetation |
|---|---|---|---|
| 1 | X: 604902 Y: 2413342 | 1800 | Sugarcane |
| 2 | X: 605243 Y: 2413431 | 900 | Cassava |
| 3 | X: 605129 Y: 2413855 | 1350 | Pasture, aroma and marabou |
| 4 | X: 604902 Y: 2413342 | 1800 | Sugarcane |
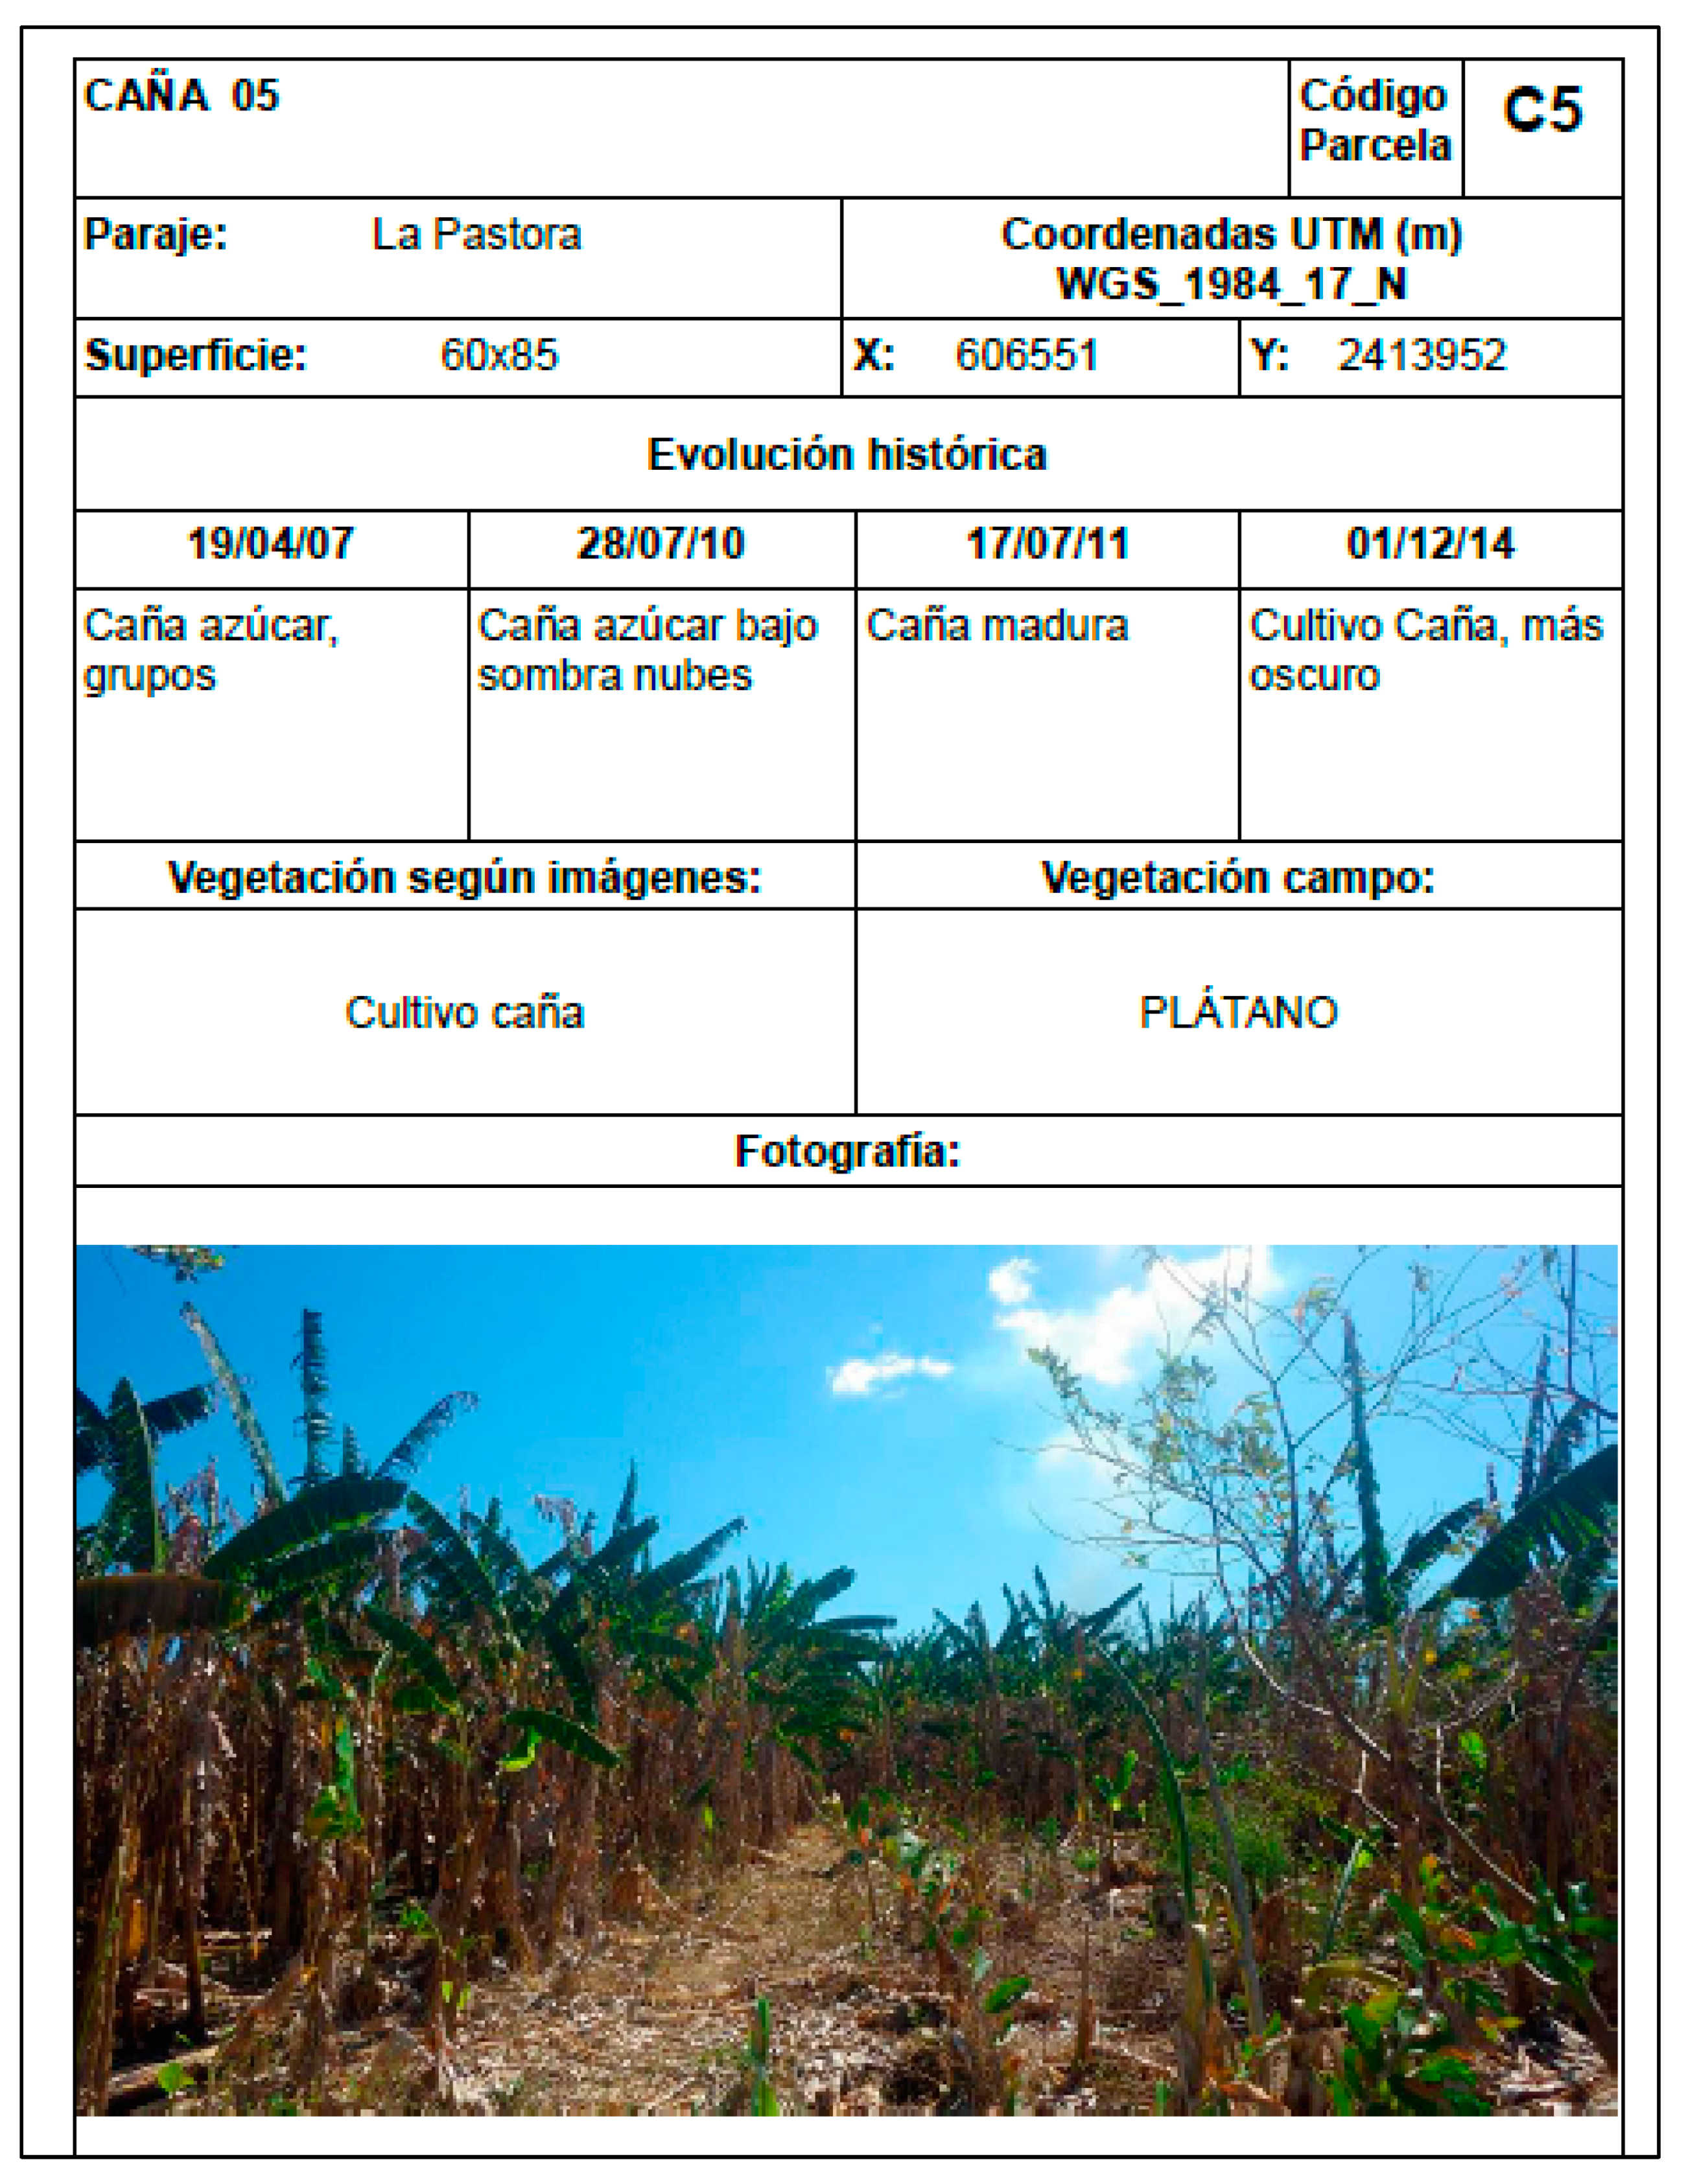
| 5 | X: 606551 Y: 2413952 | 5100 | Banana |
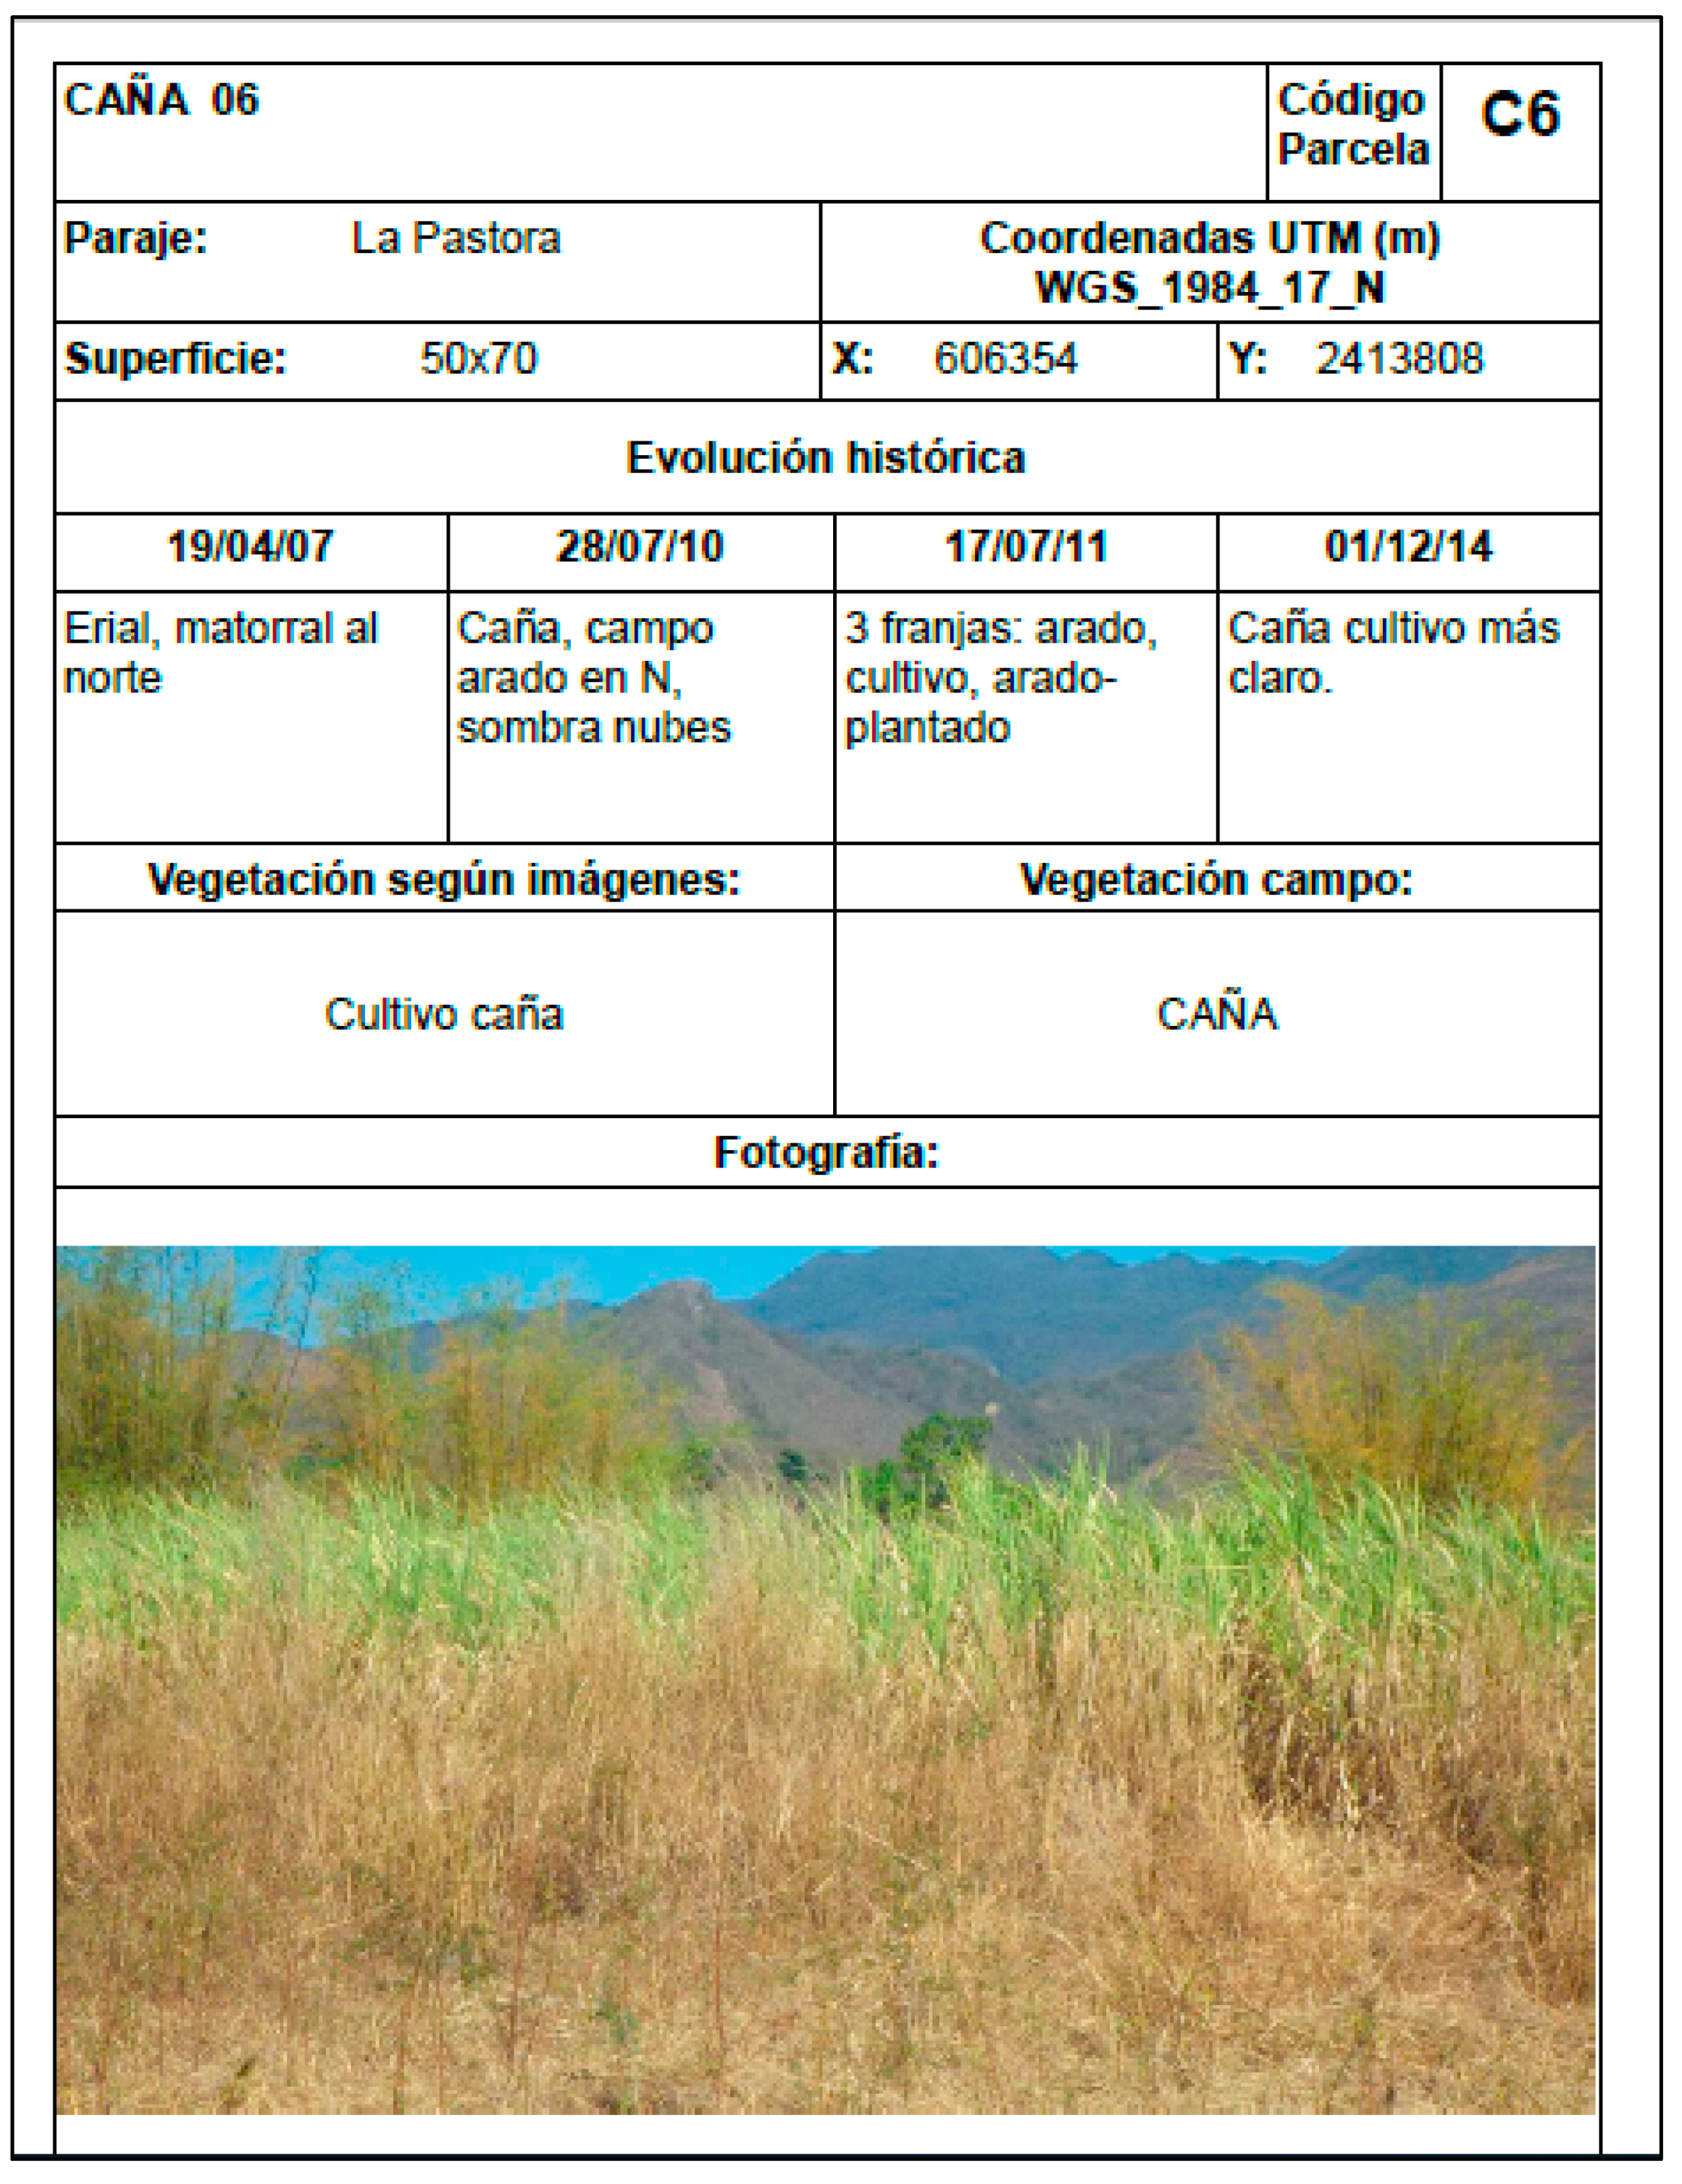
| 6 | X: 606354 Y: 2413808 | 3500 | Sugarcane |
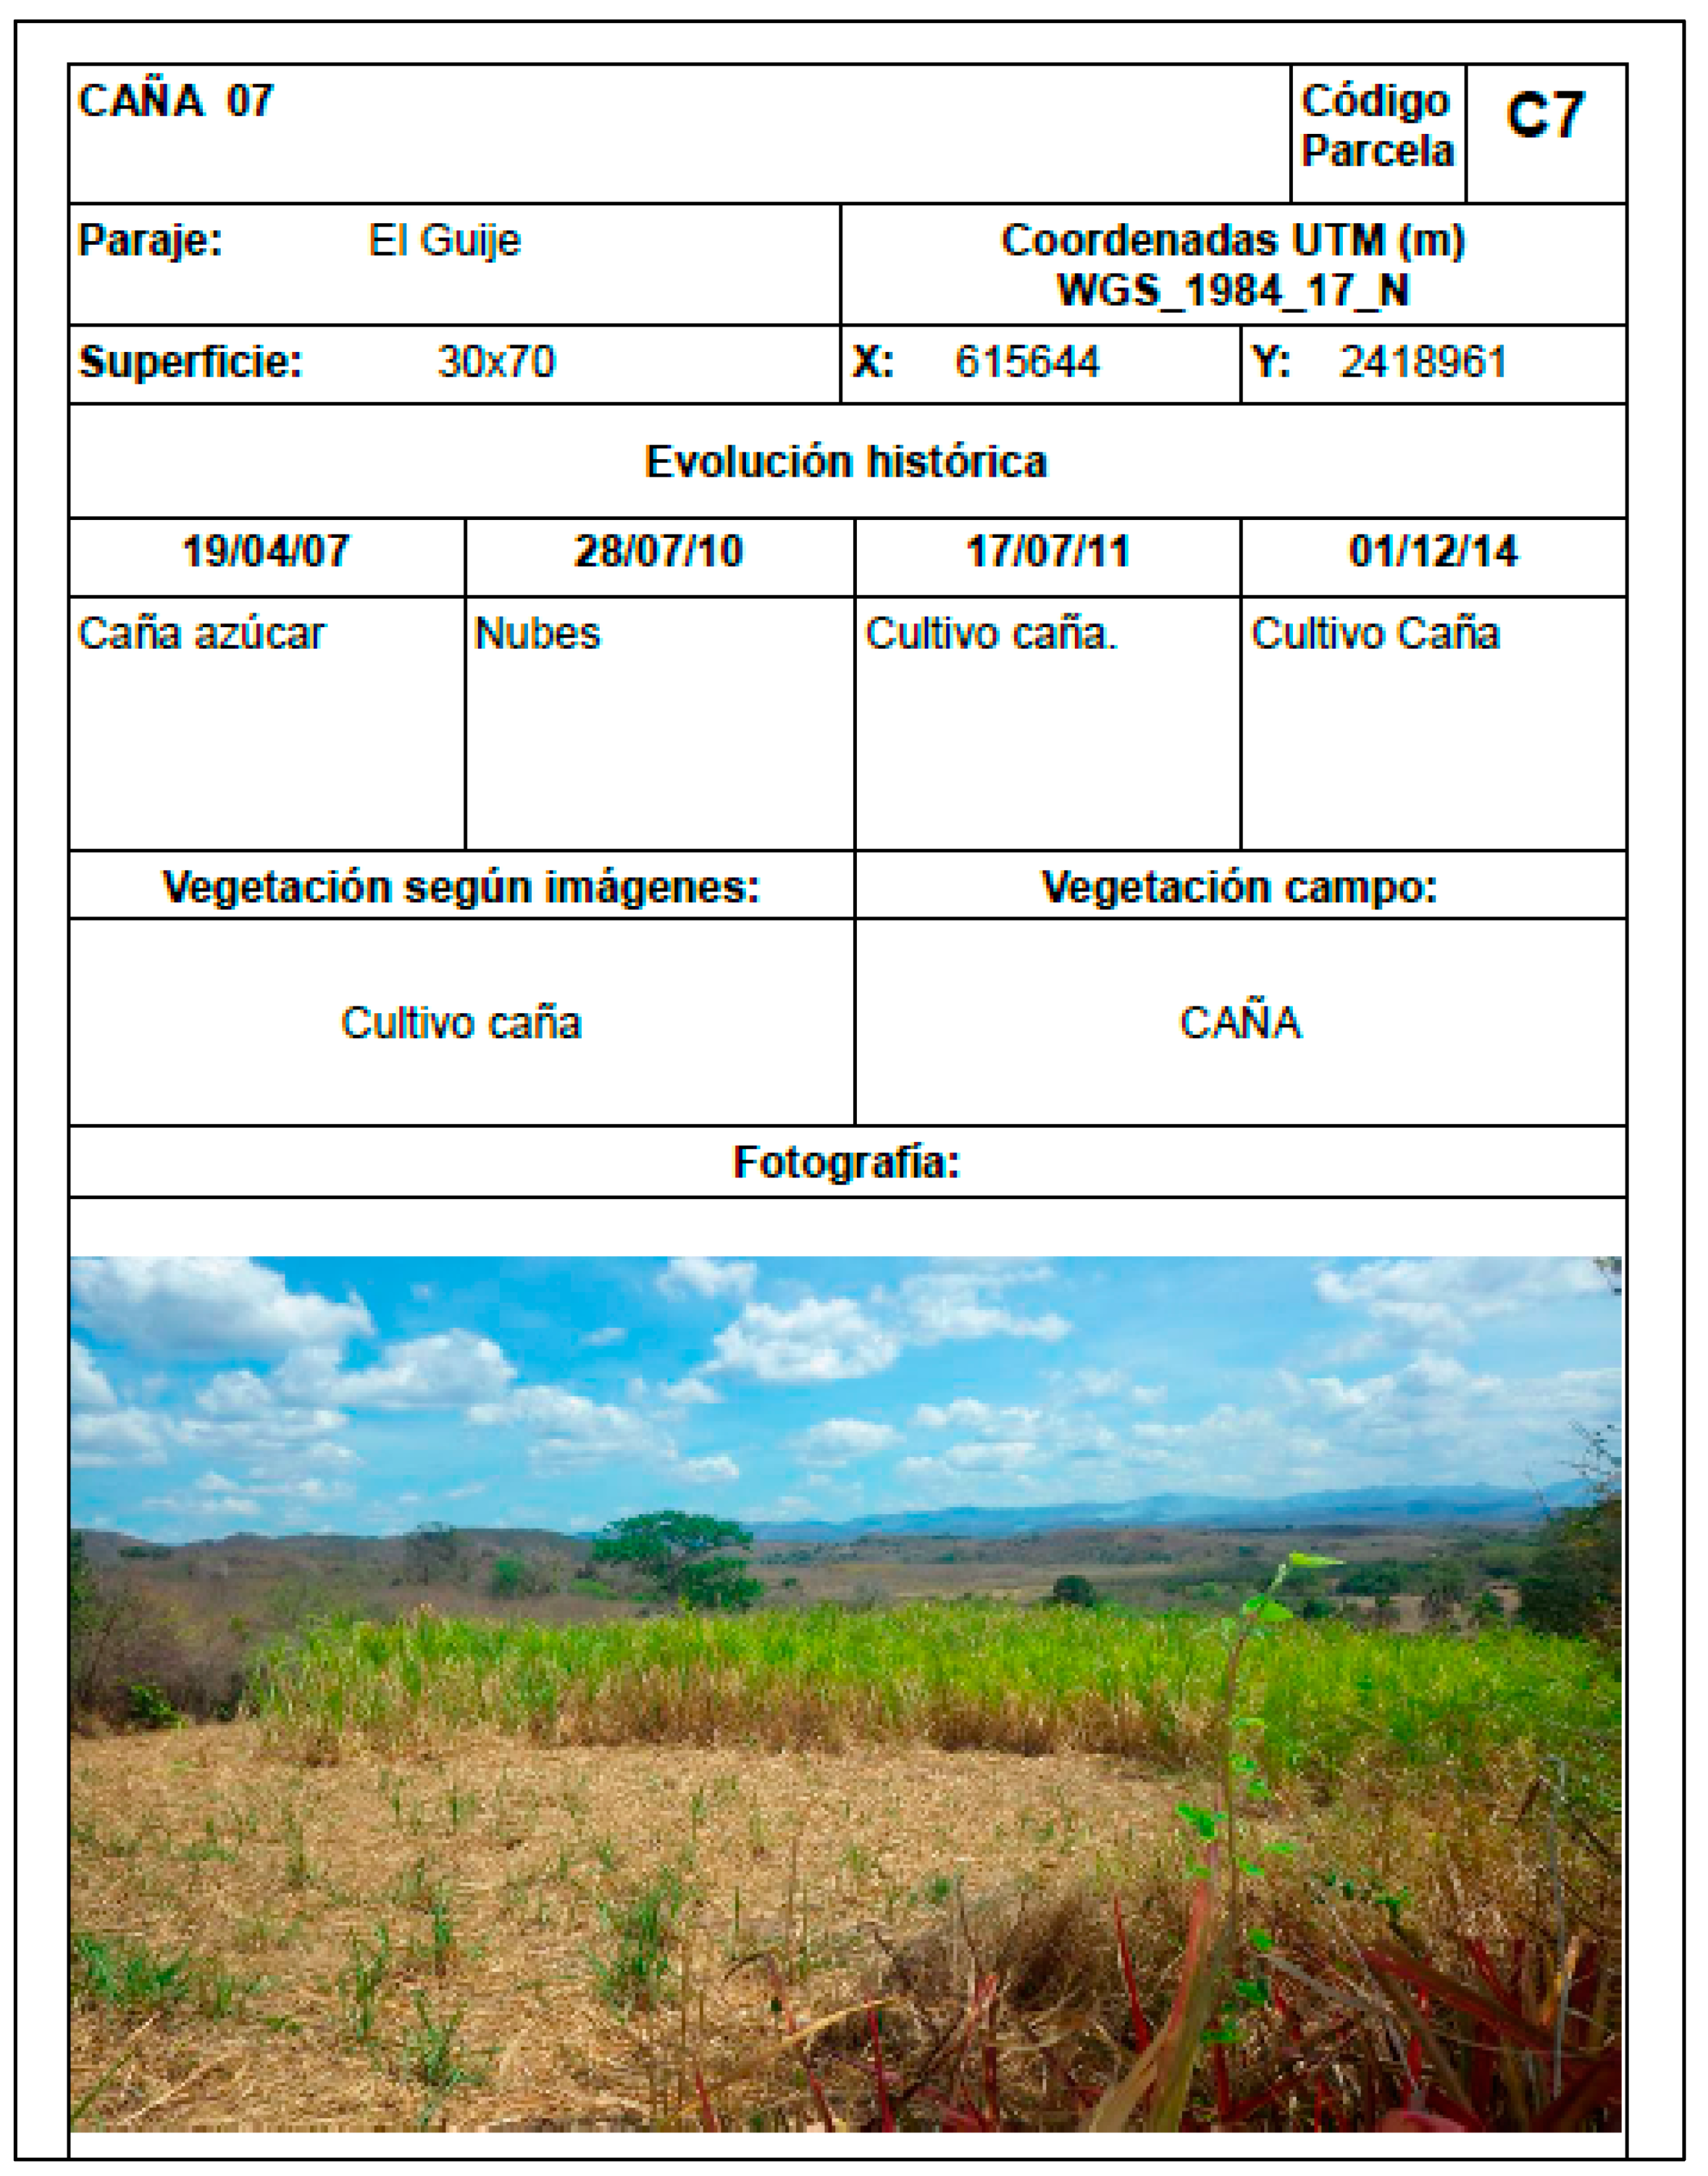
| 7 | X: 615644 Y: 2418961 | 2100 | Sugarcane |
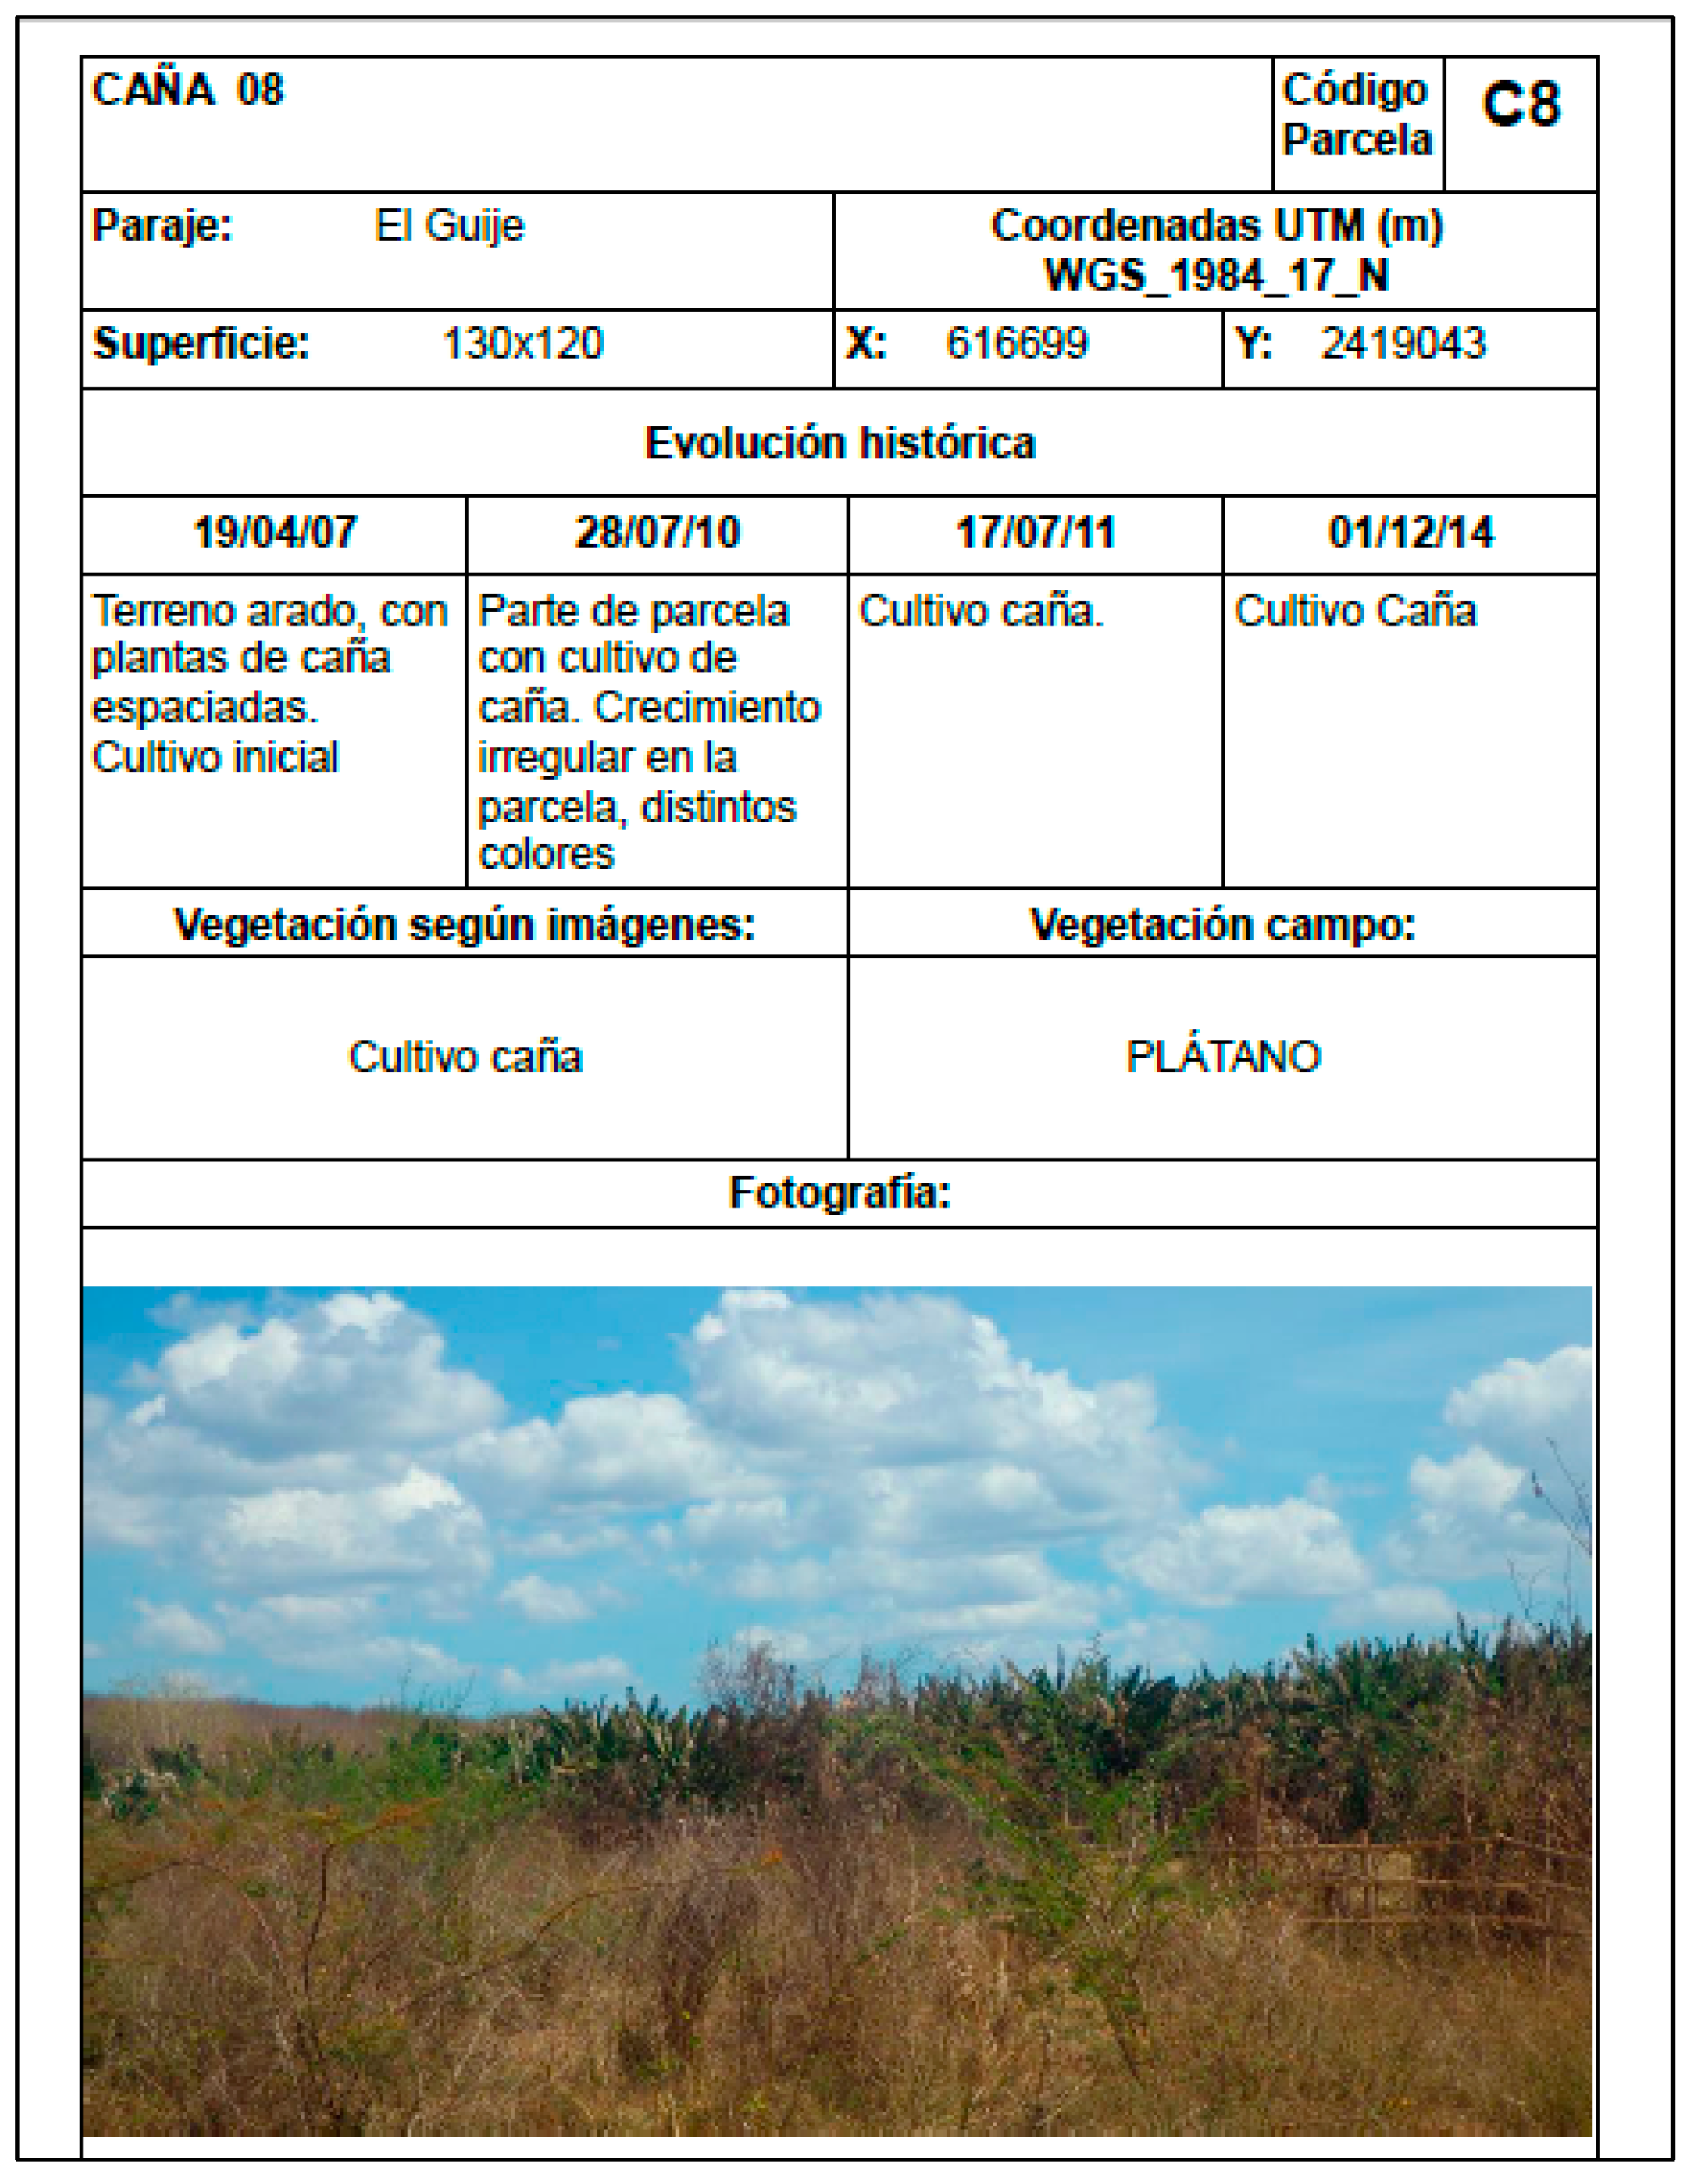
| 8 | X: 616699 Y: 2419043 | 15600 | Banana |
| 9 | X: 616812 Y: 2418537 | 39000 | Banana |
| 10 | X: 617175 Y: 2417453 | 5250 | Albizia and marabou |
| 11 | X: 615644 Y: 2418961 | 2100 | Guava and mango |
| 12 | X: 615581 Y: 2417194 | 7200 | King grass |
| 13 | X: 614521 Y: 2414653 | 10000 | King grass |
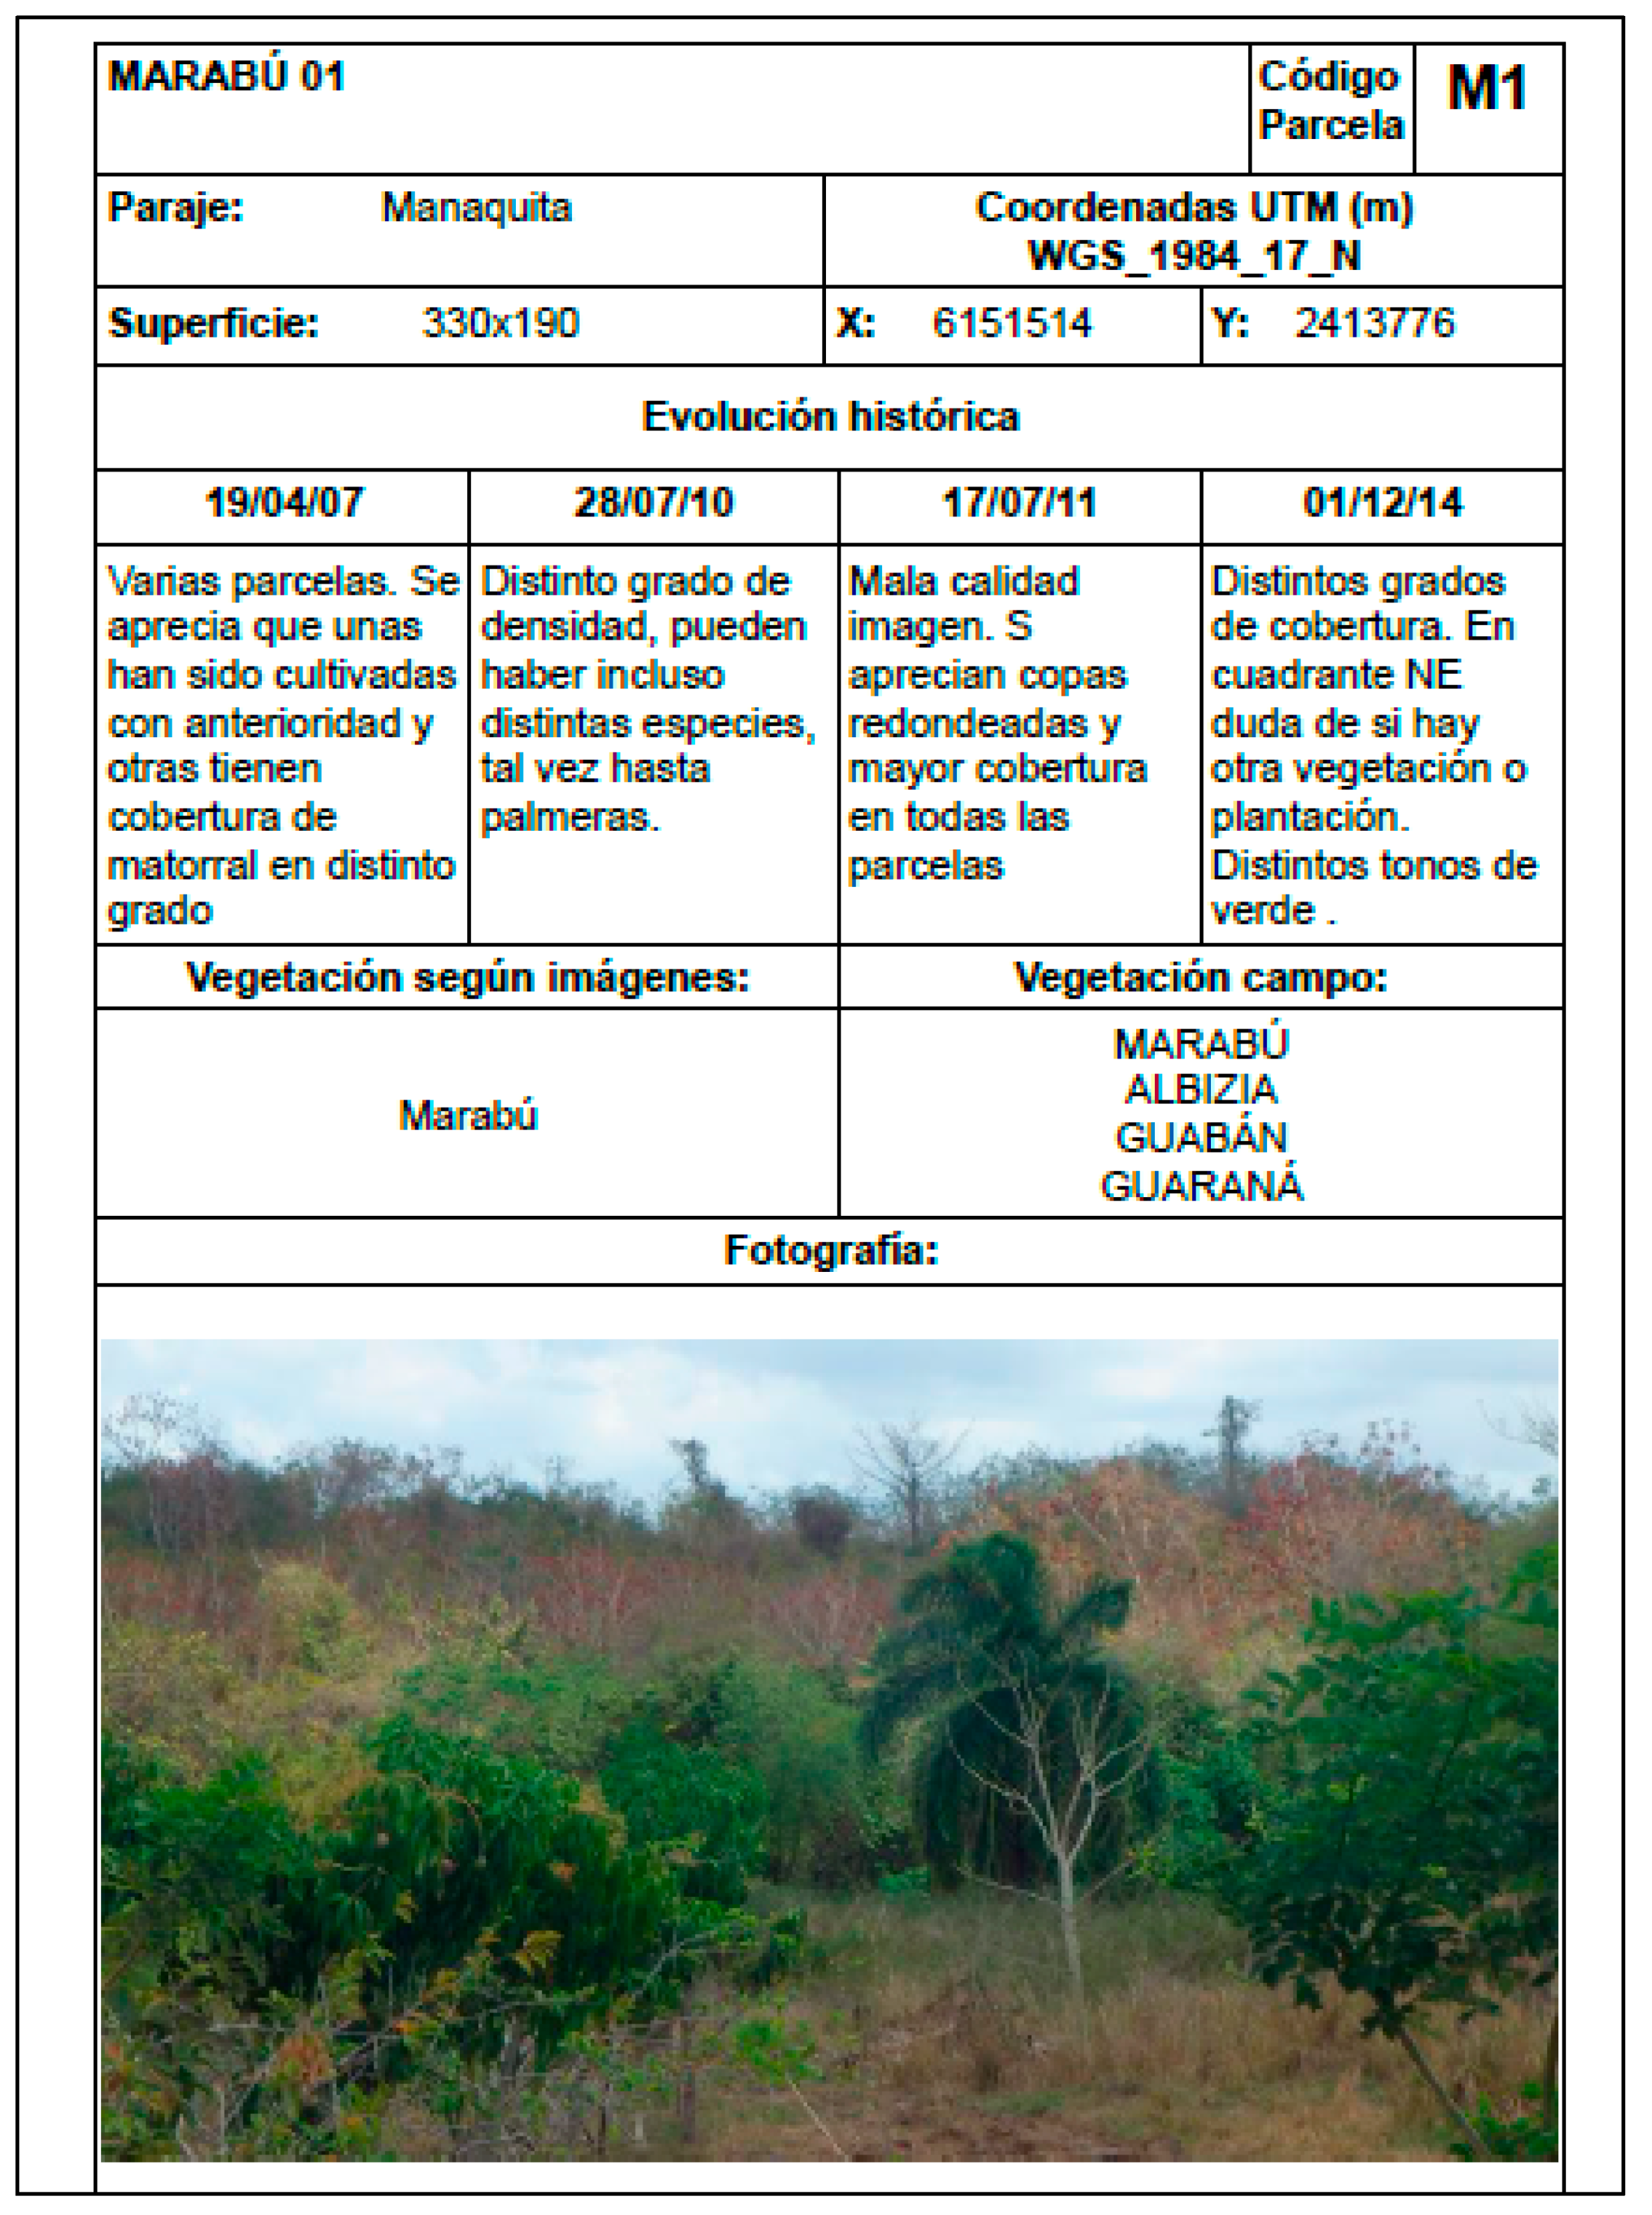
| 14 | X: 615151 Y: 2413776 | 62700 | Marabou, albizia, guaban, guarana |
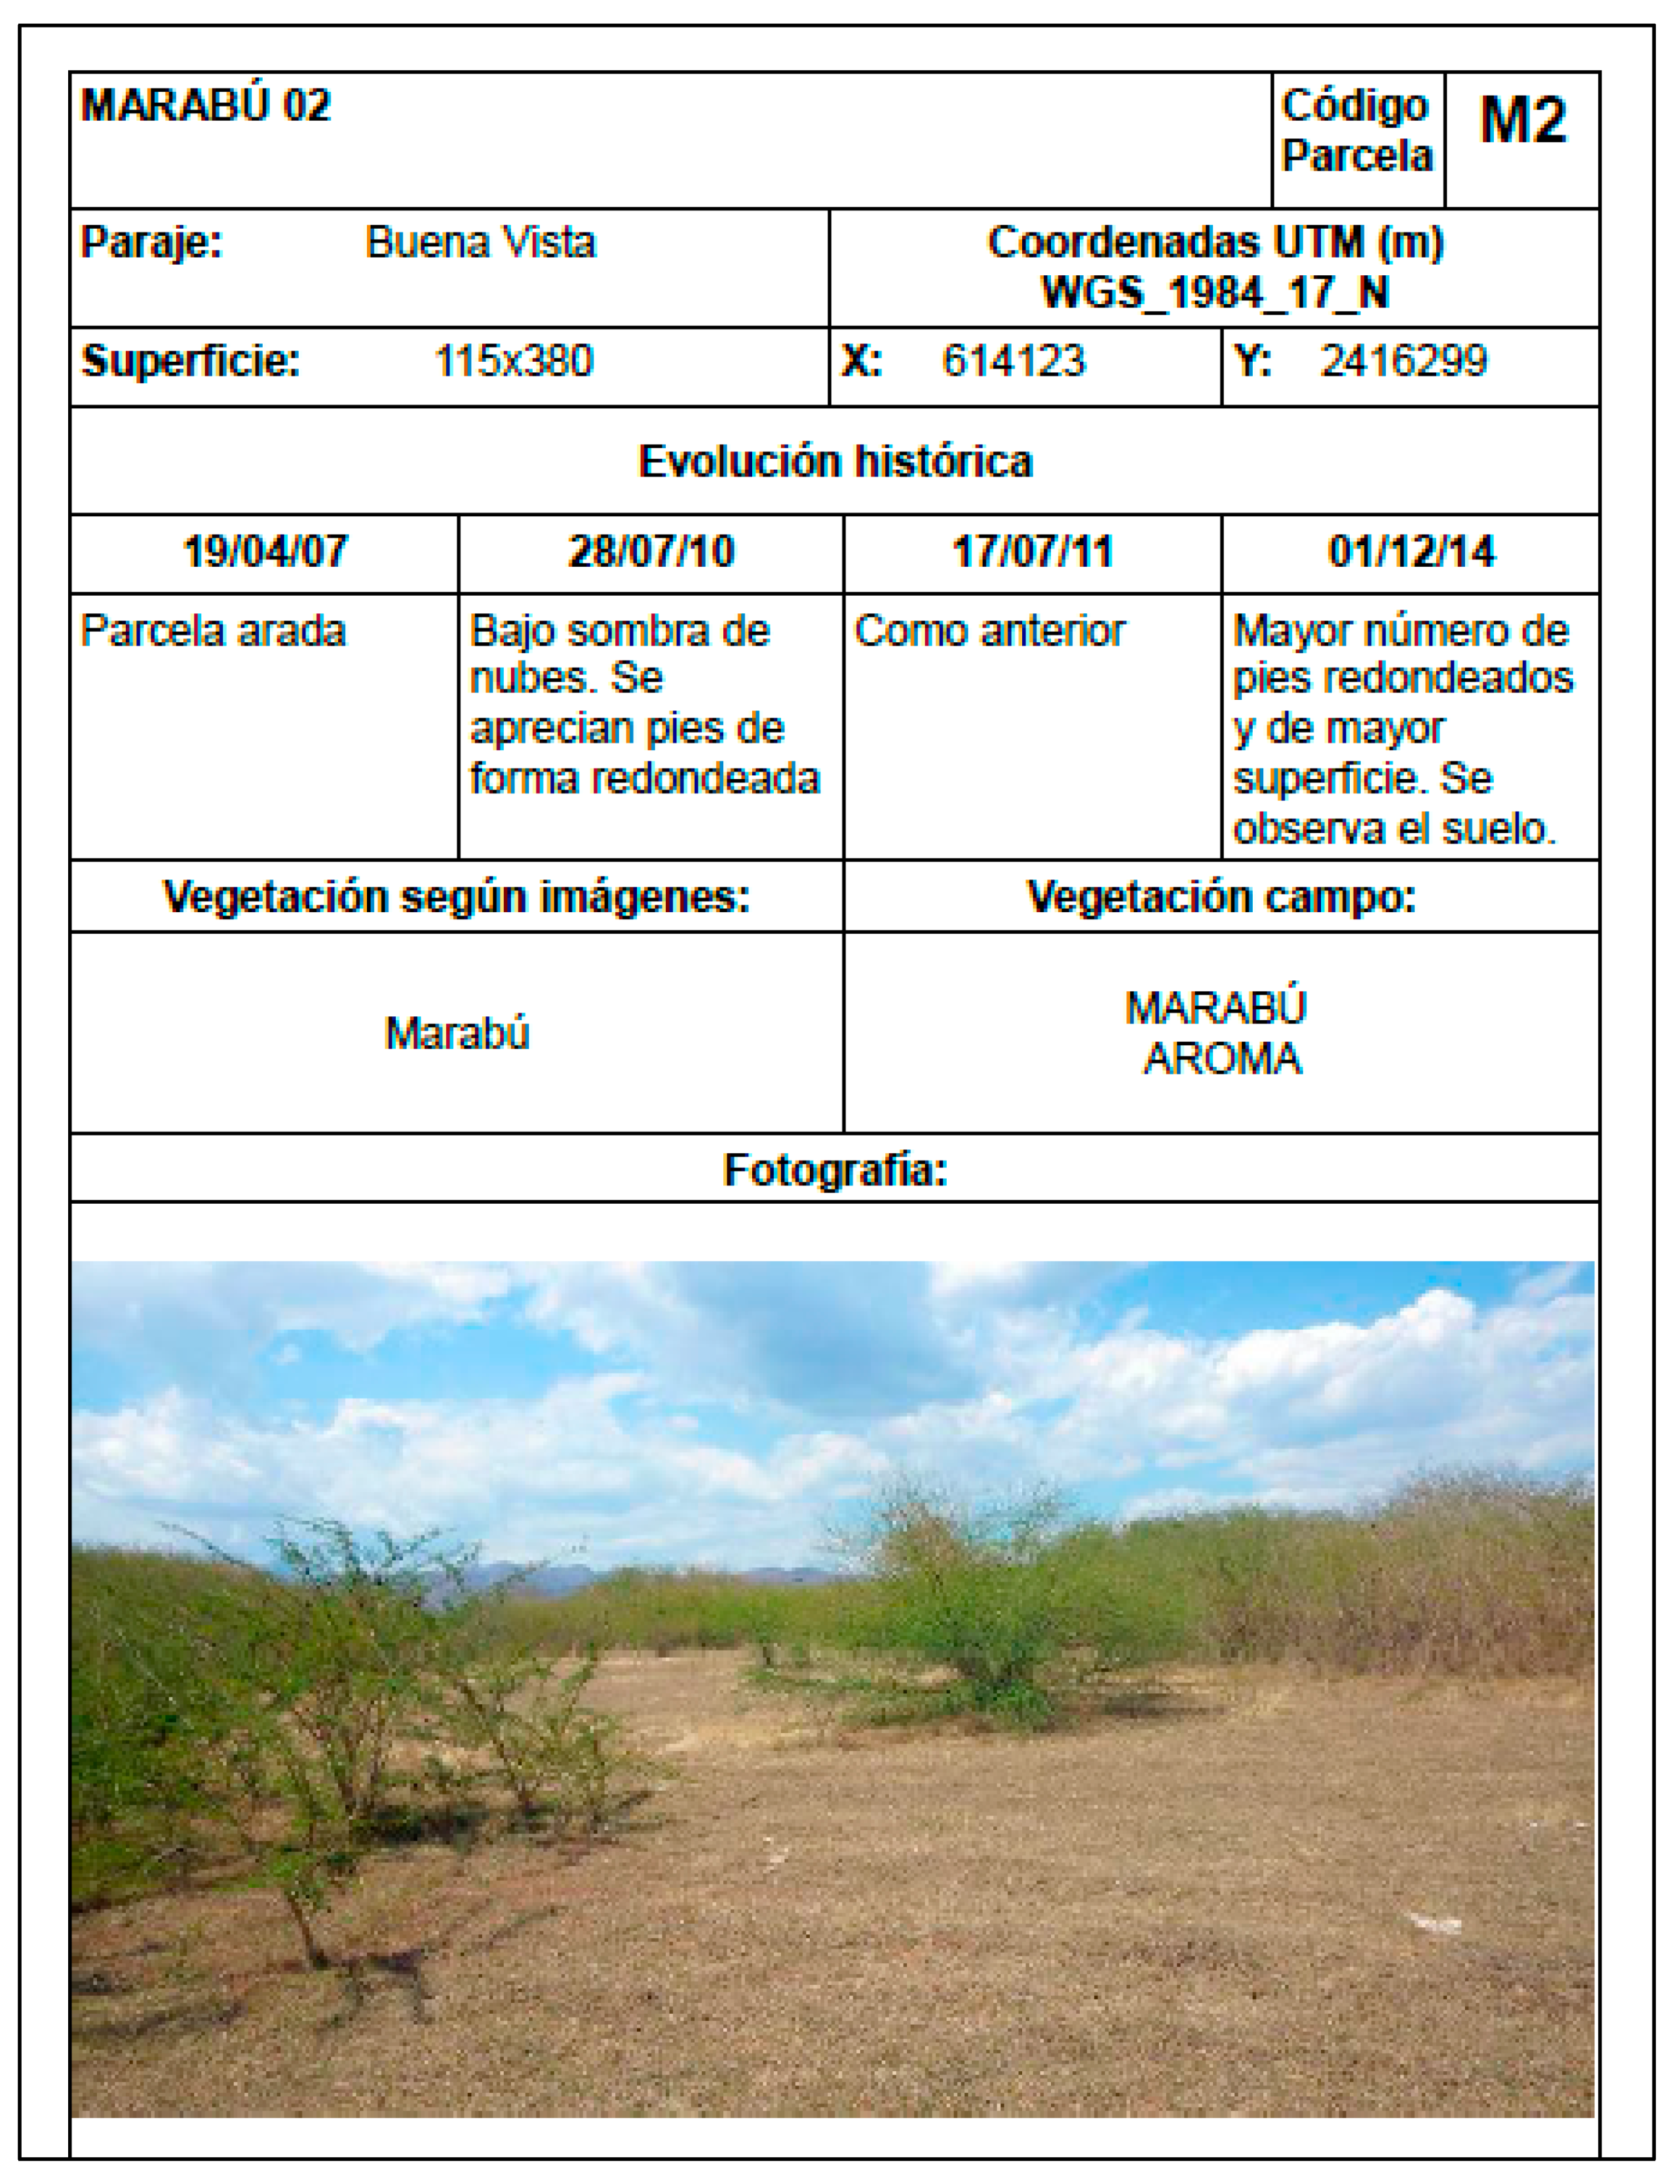
| 15 | X: 614123 Y: 2416299 | 43700 | Marabou, aroma |
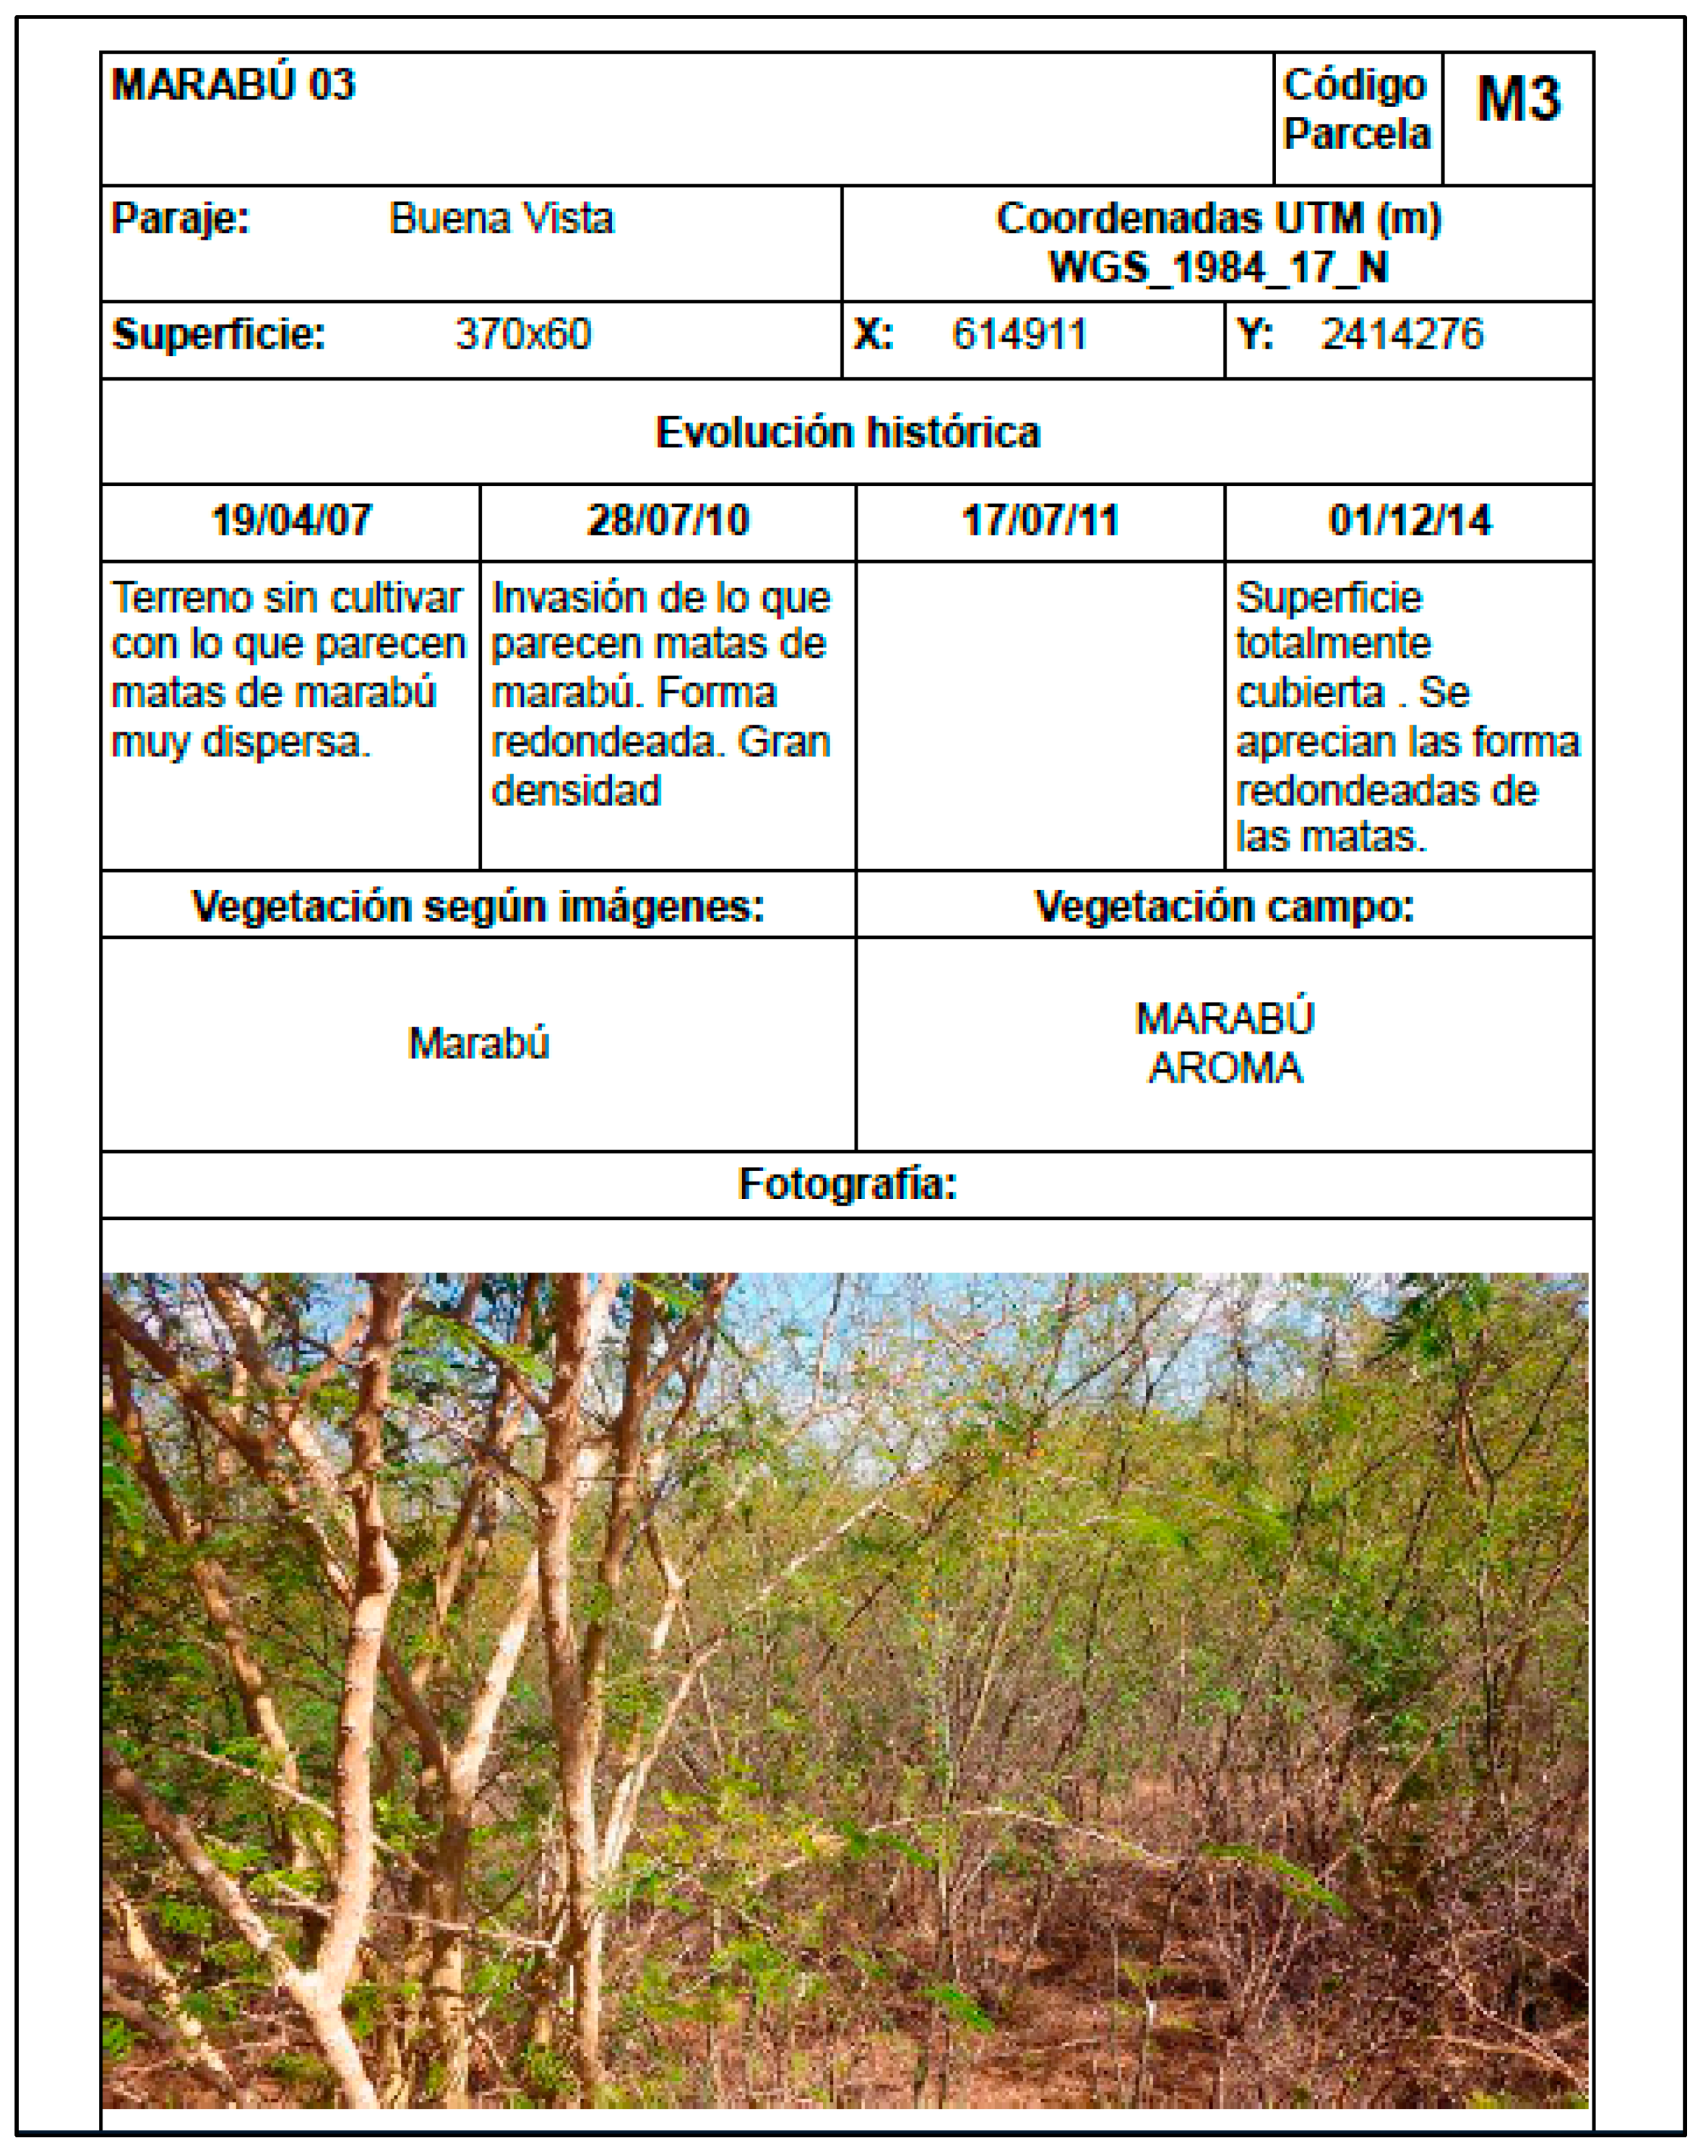
| 16 | X: 614911 Y: 2414276 | 22200 | Marabou, aroma |
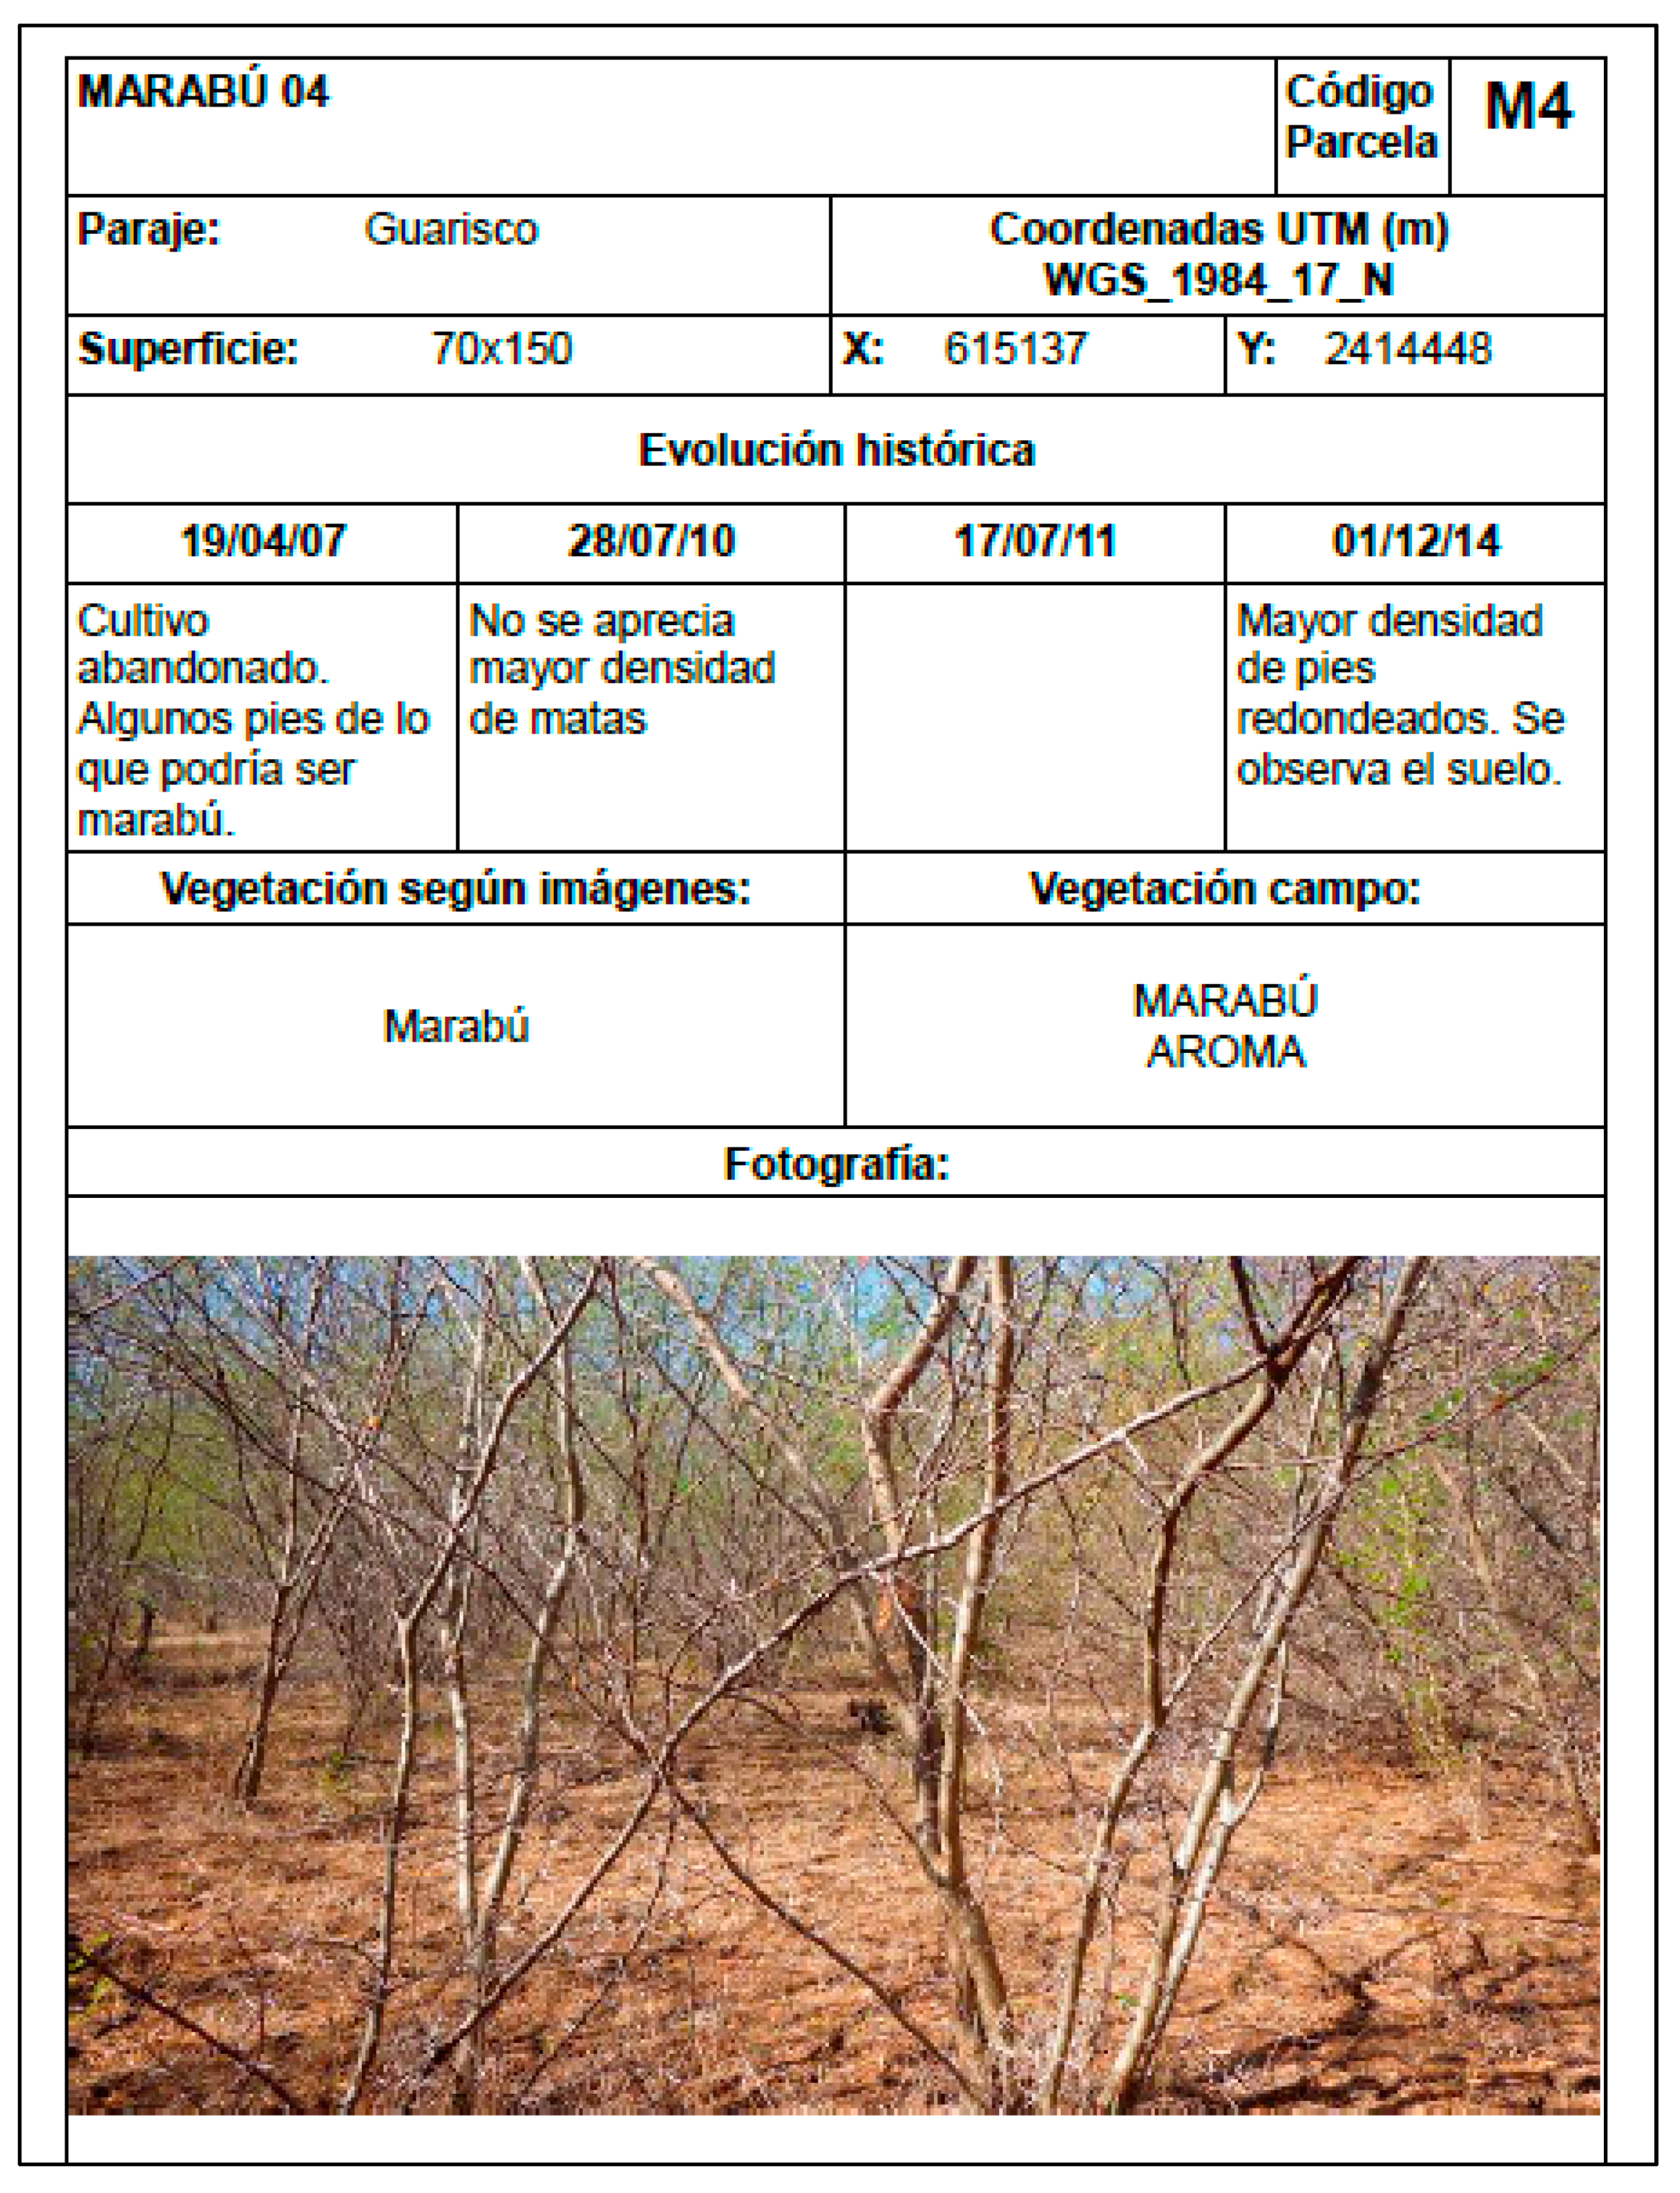
| 17 | X: 615137 Y: 2414448 | 10500 | Marabou, aroma |
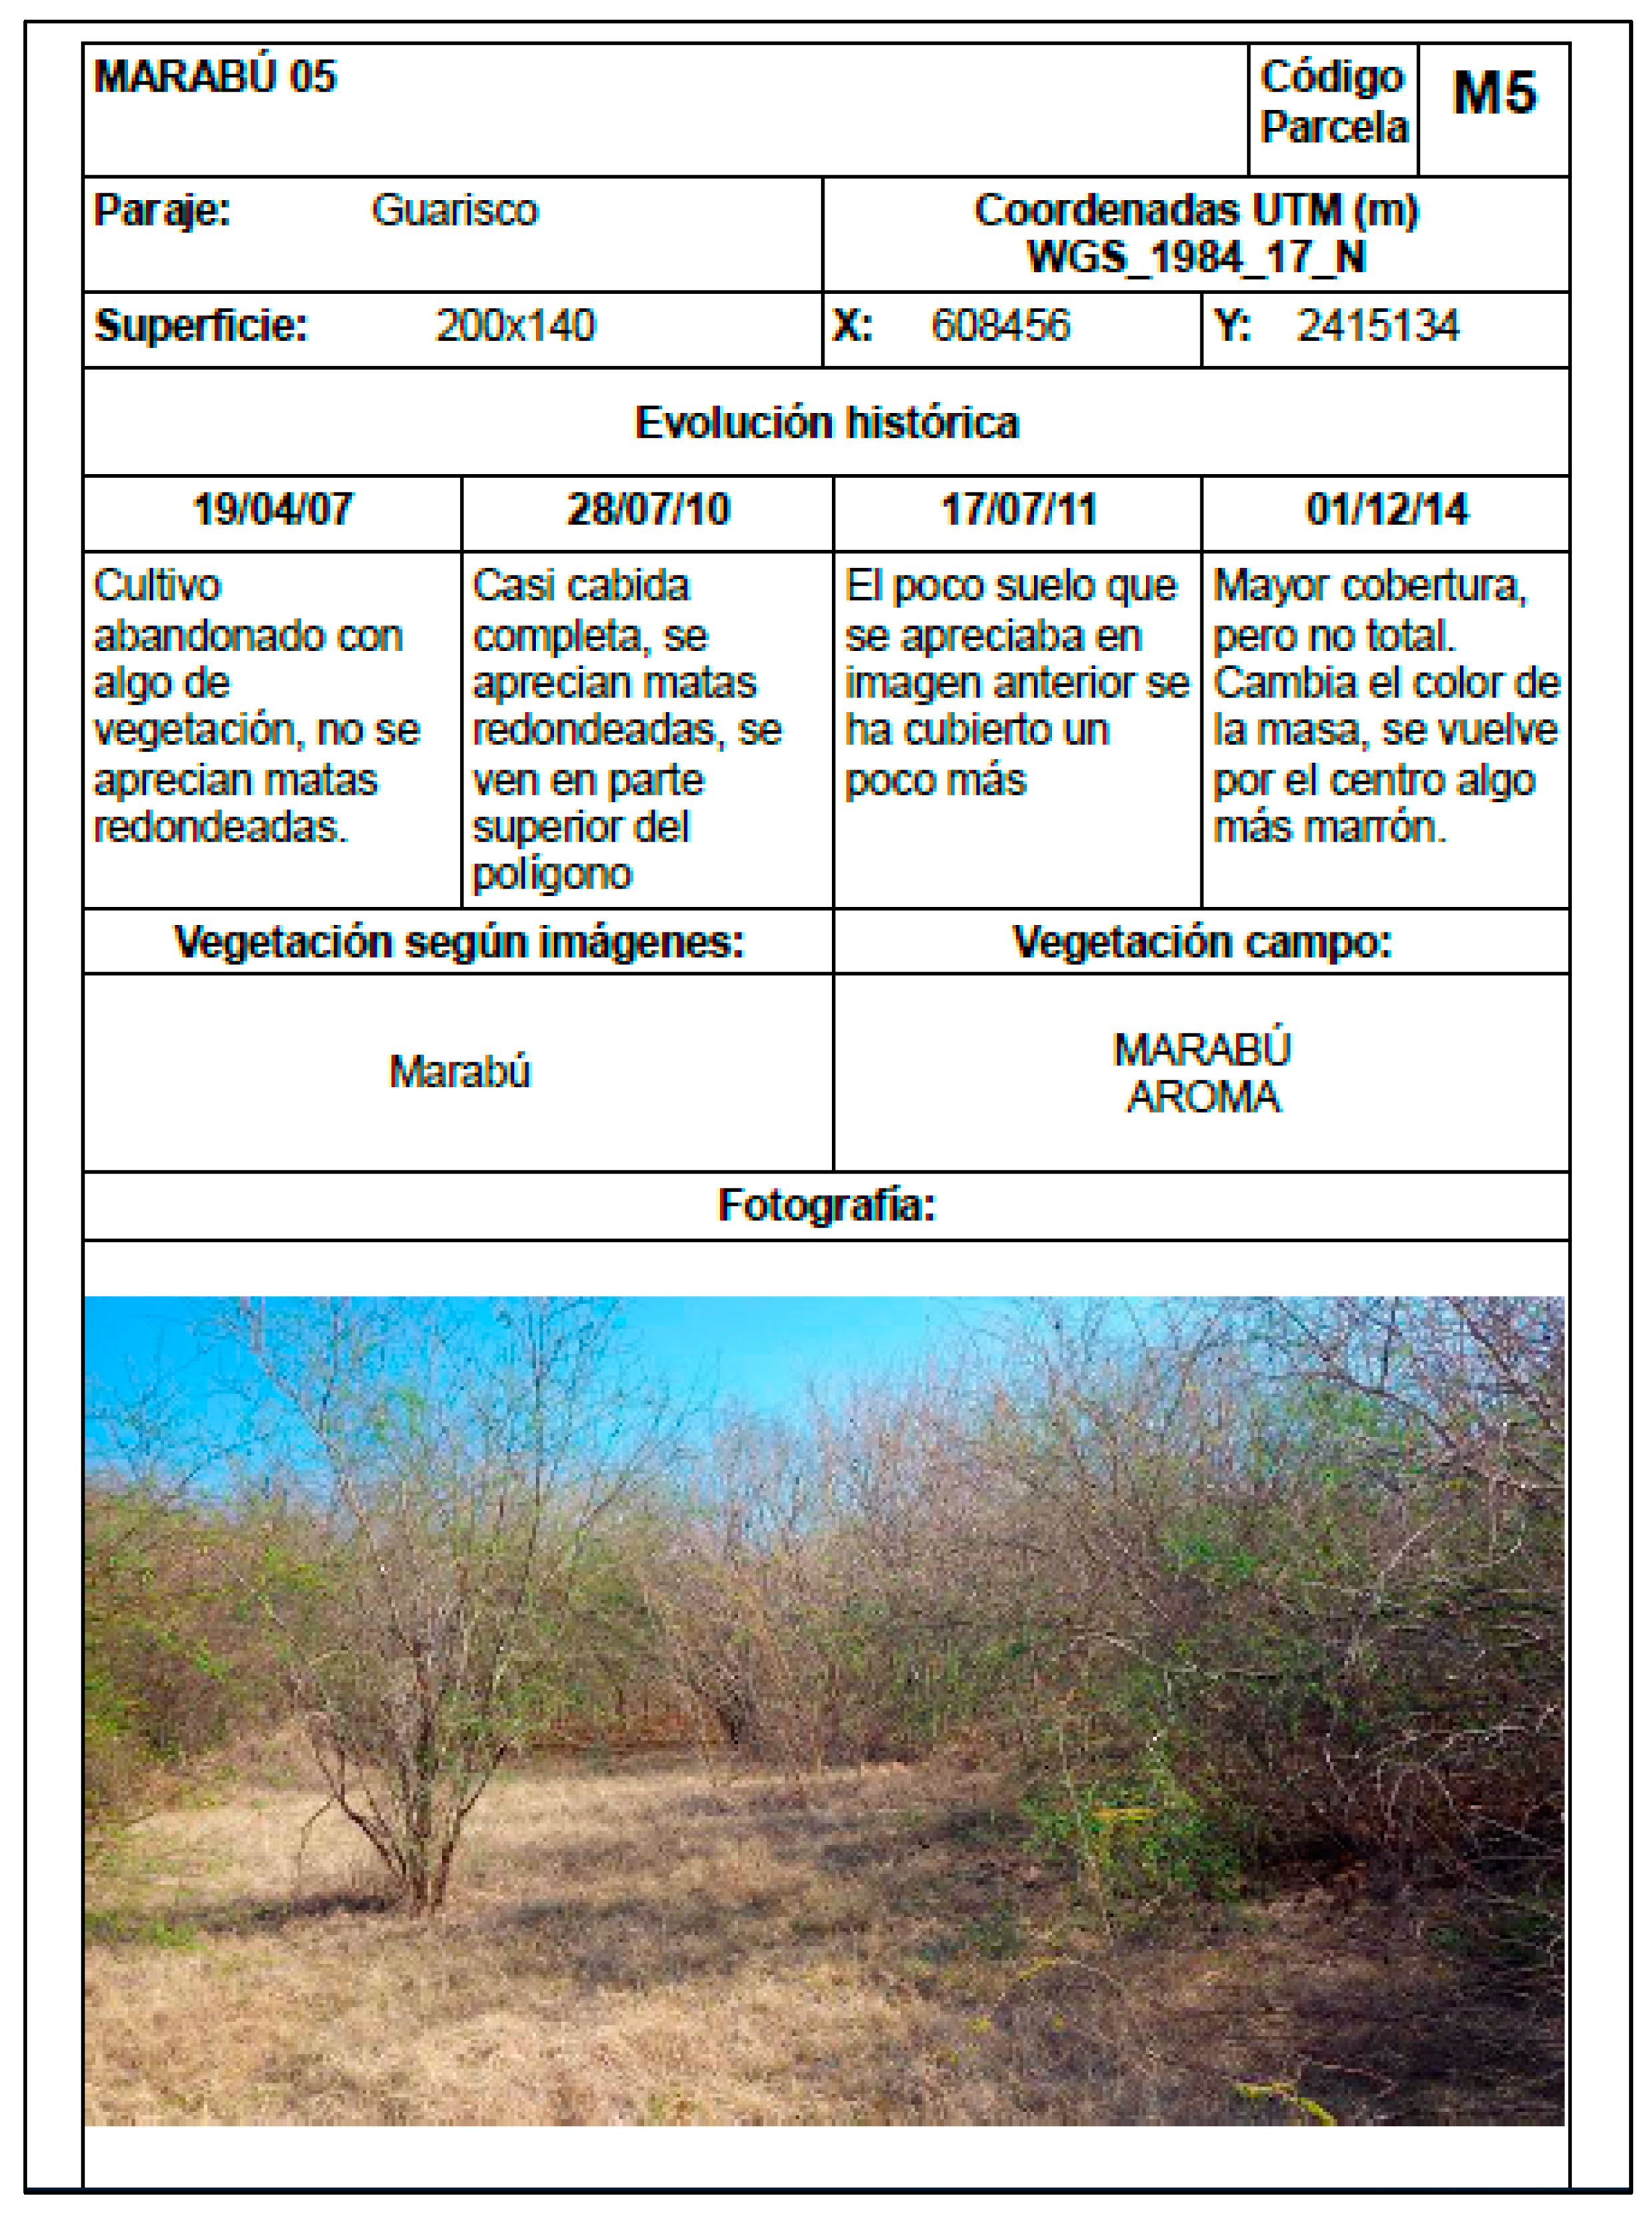
| 18 | X: 608456 Y: 2415134 | 28000 | Marabou, aroma |
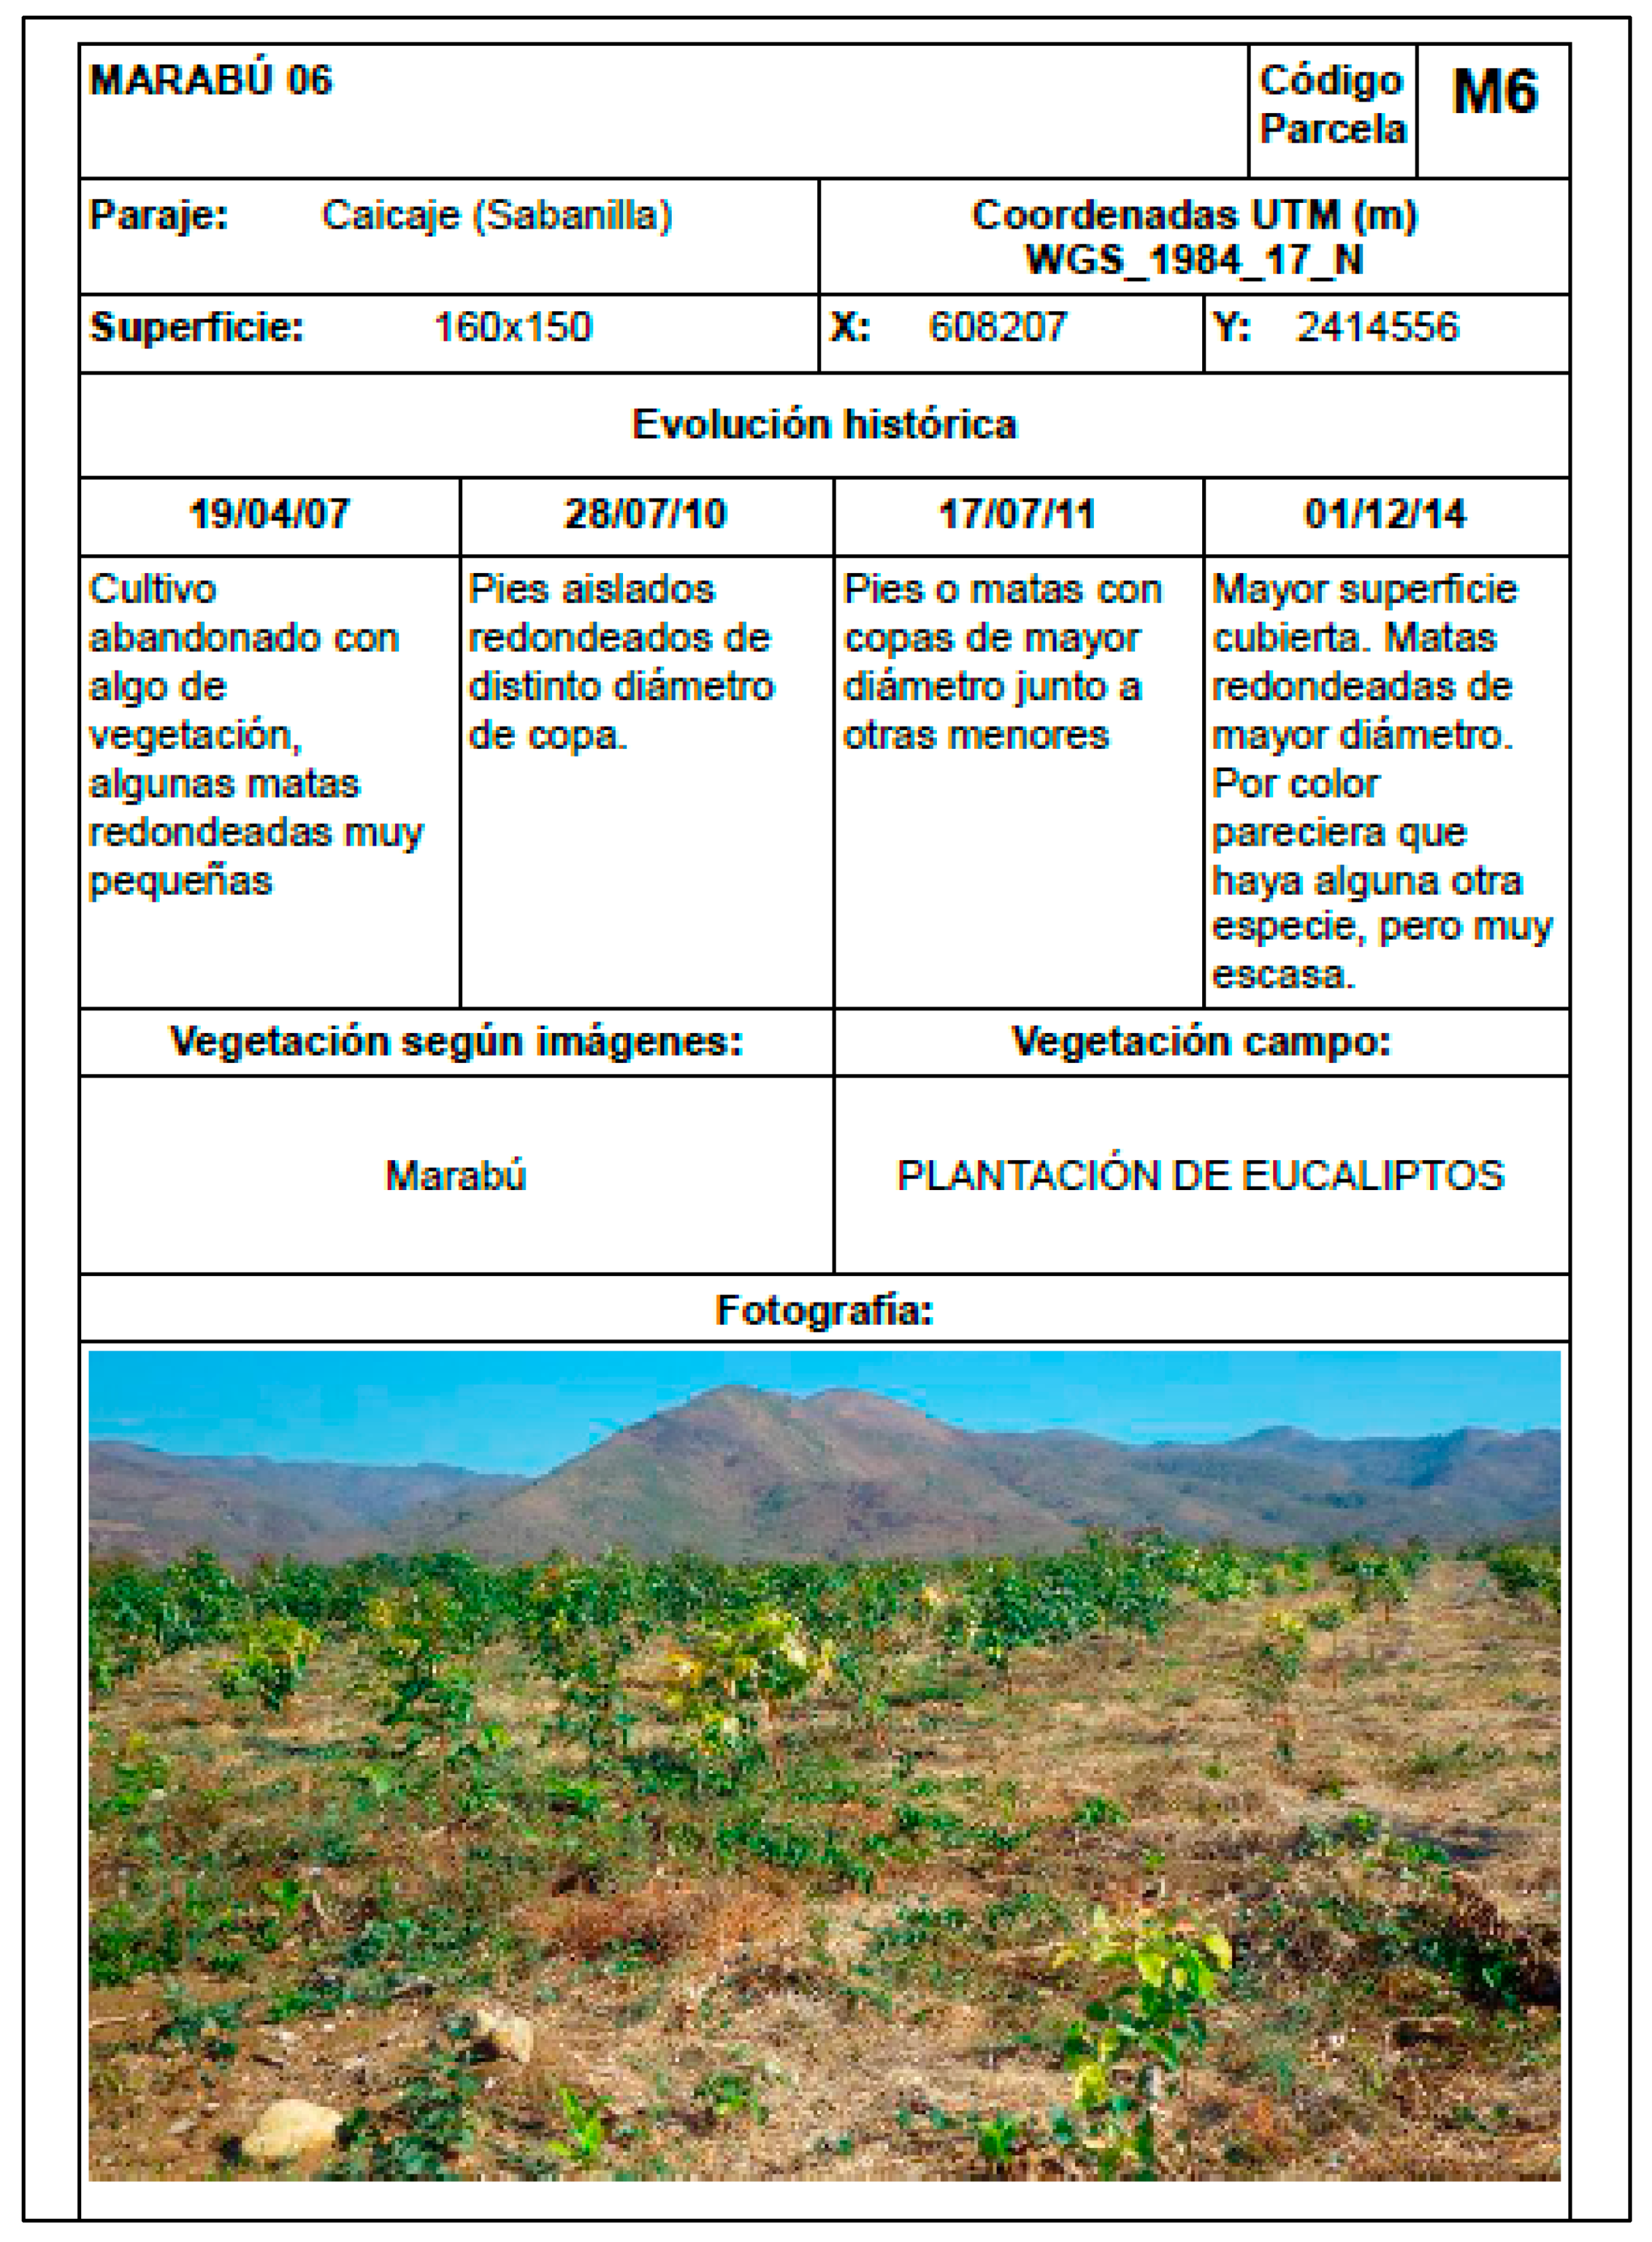
| 19 | X: 608207 Y: 2414556 | 24000 | Eucalyptus |
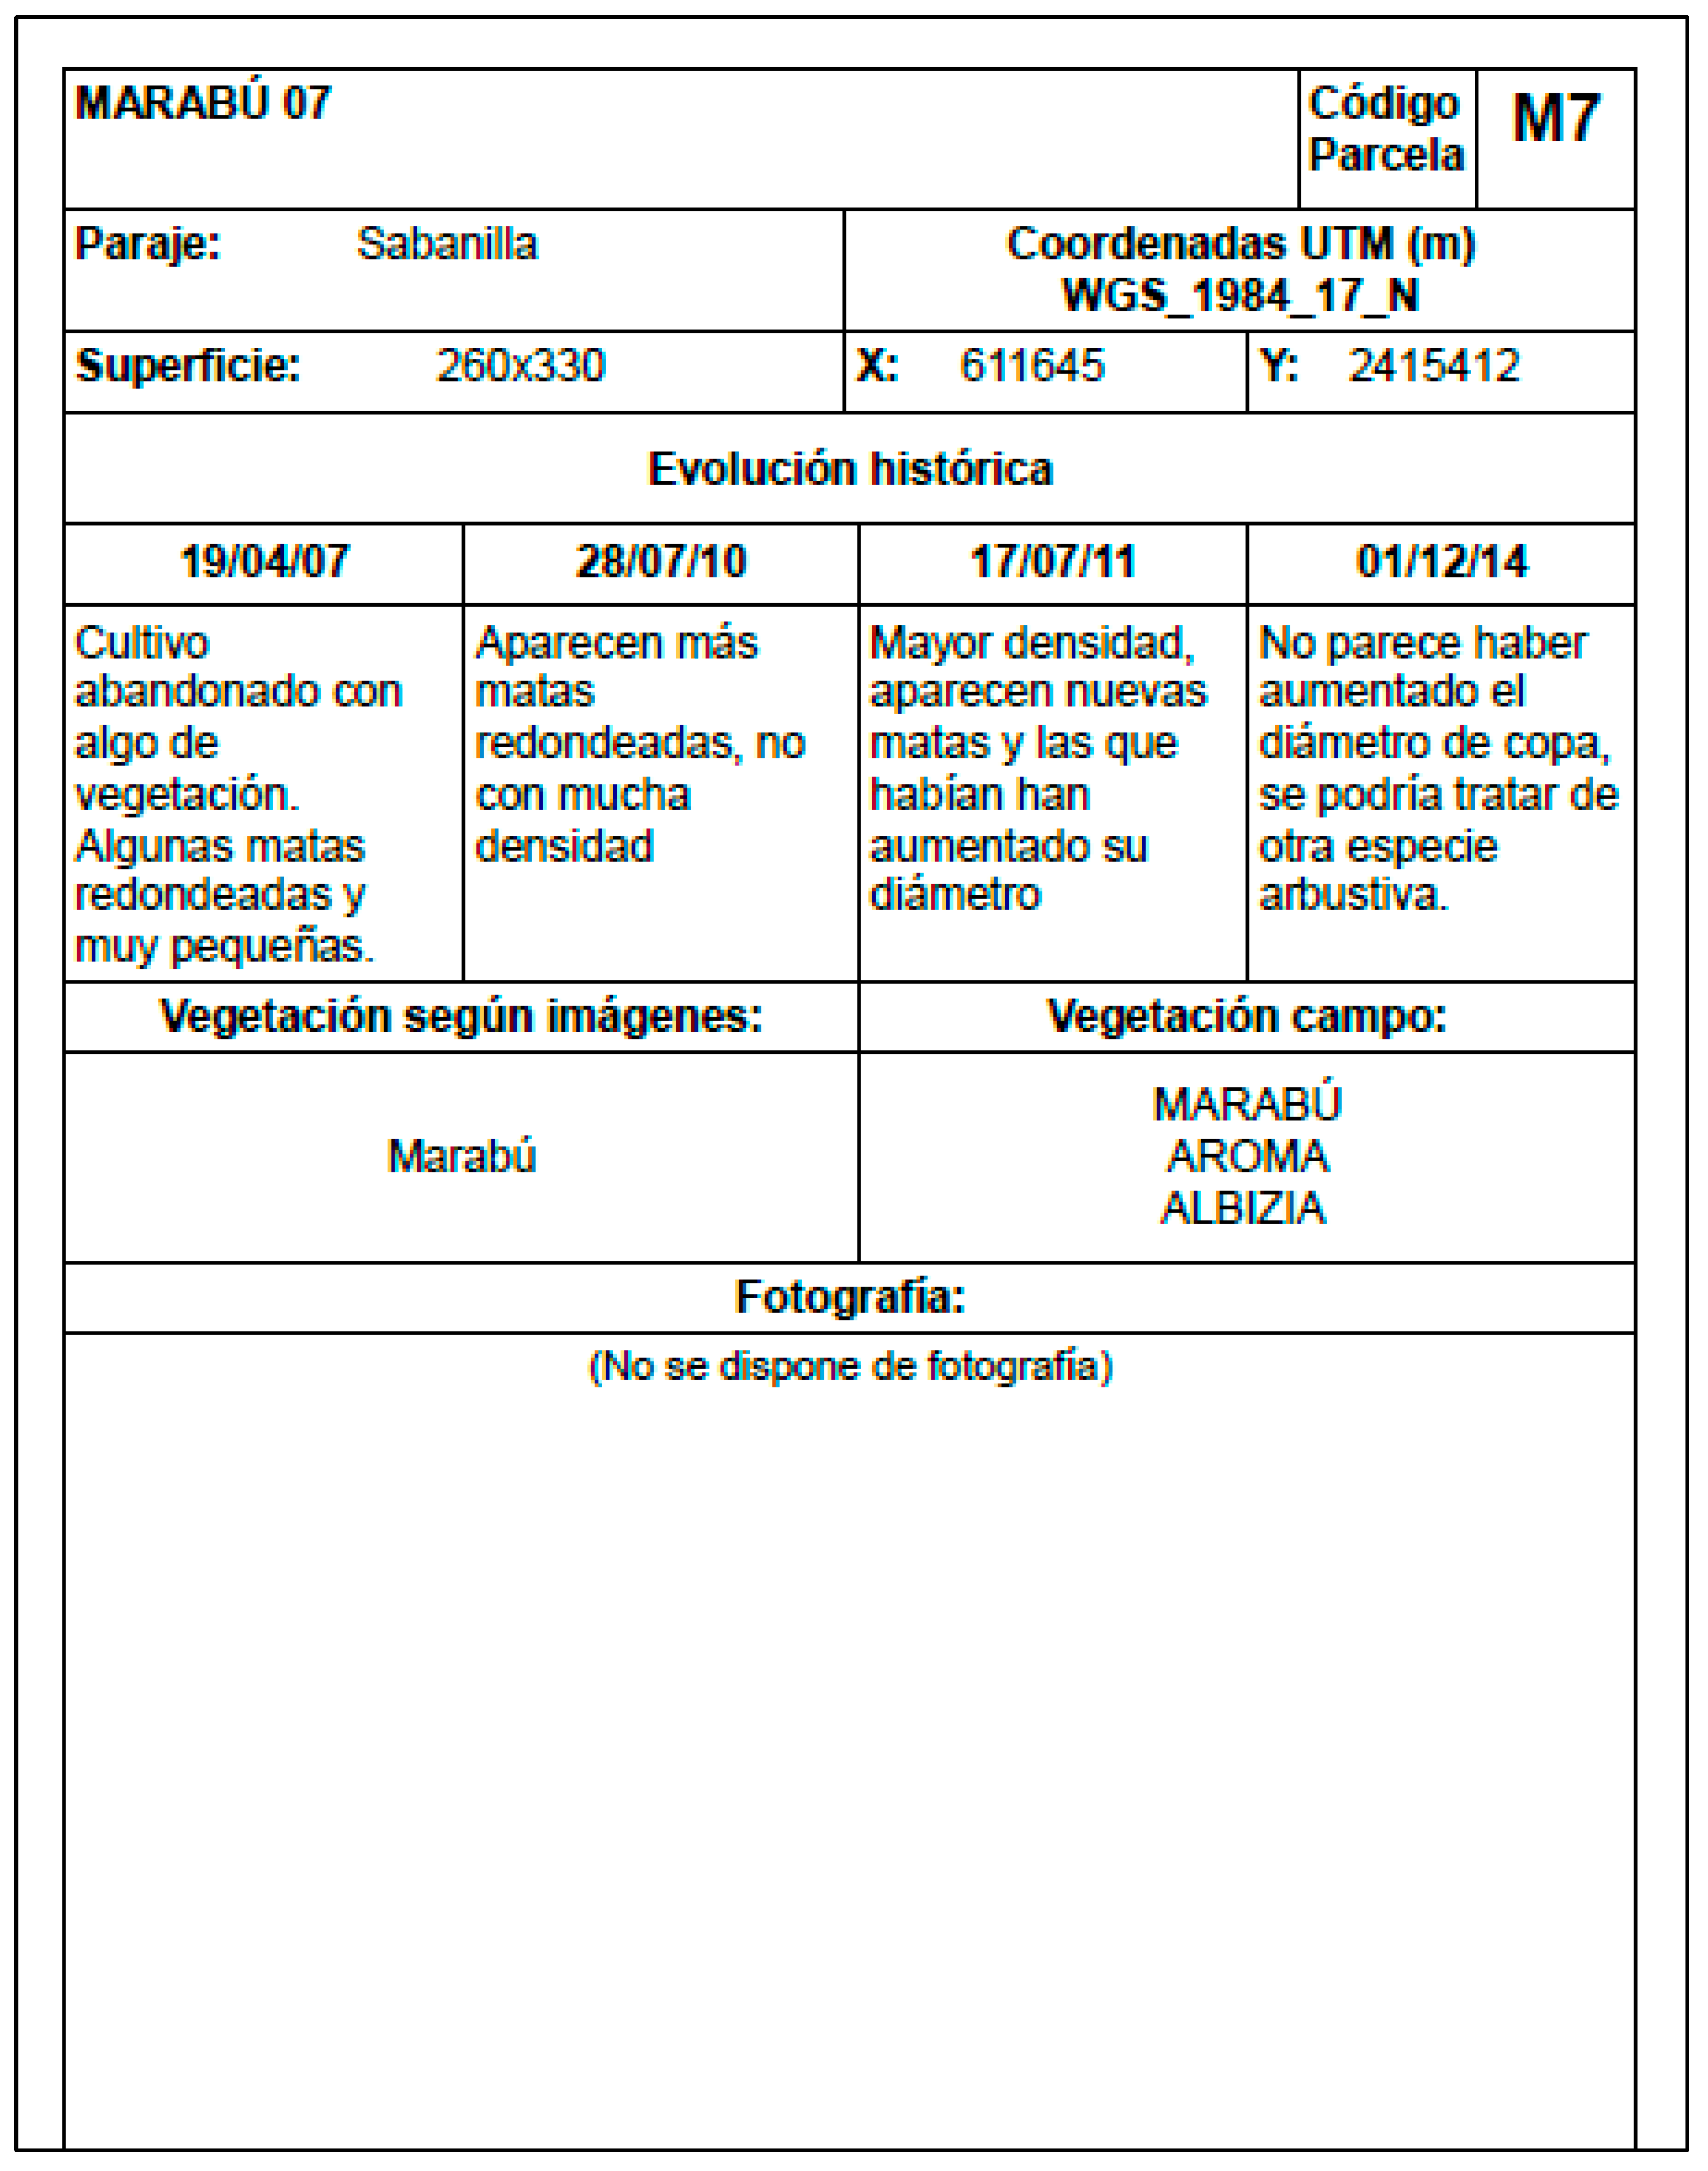
| 20 | X: 611645 Y: 2415412 | 85800 | Marabou, albizia, aroma |
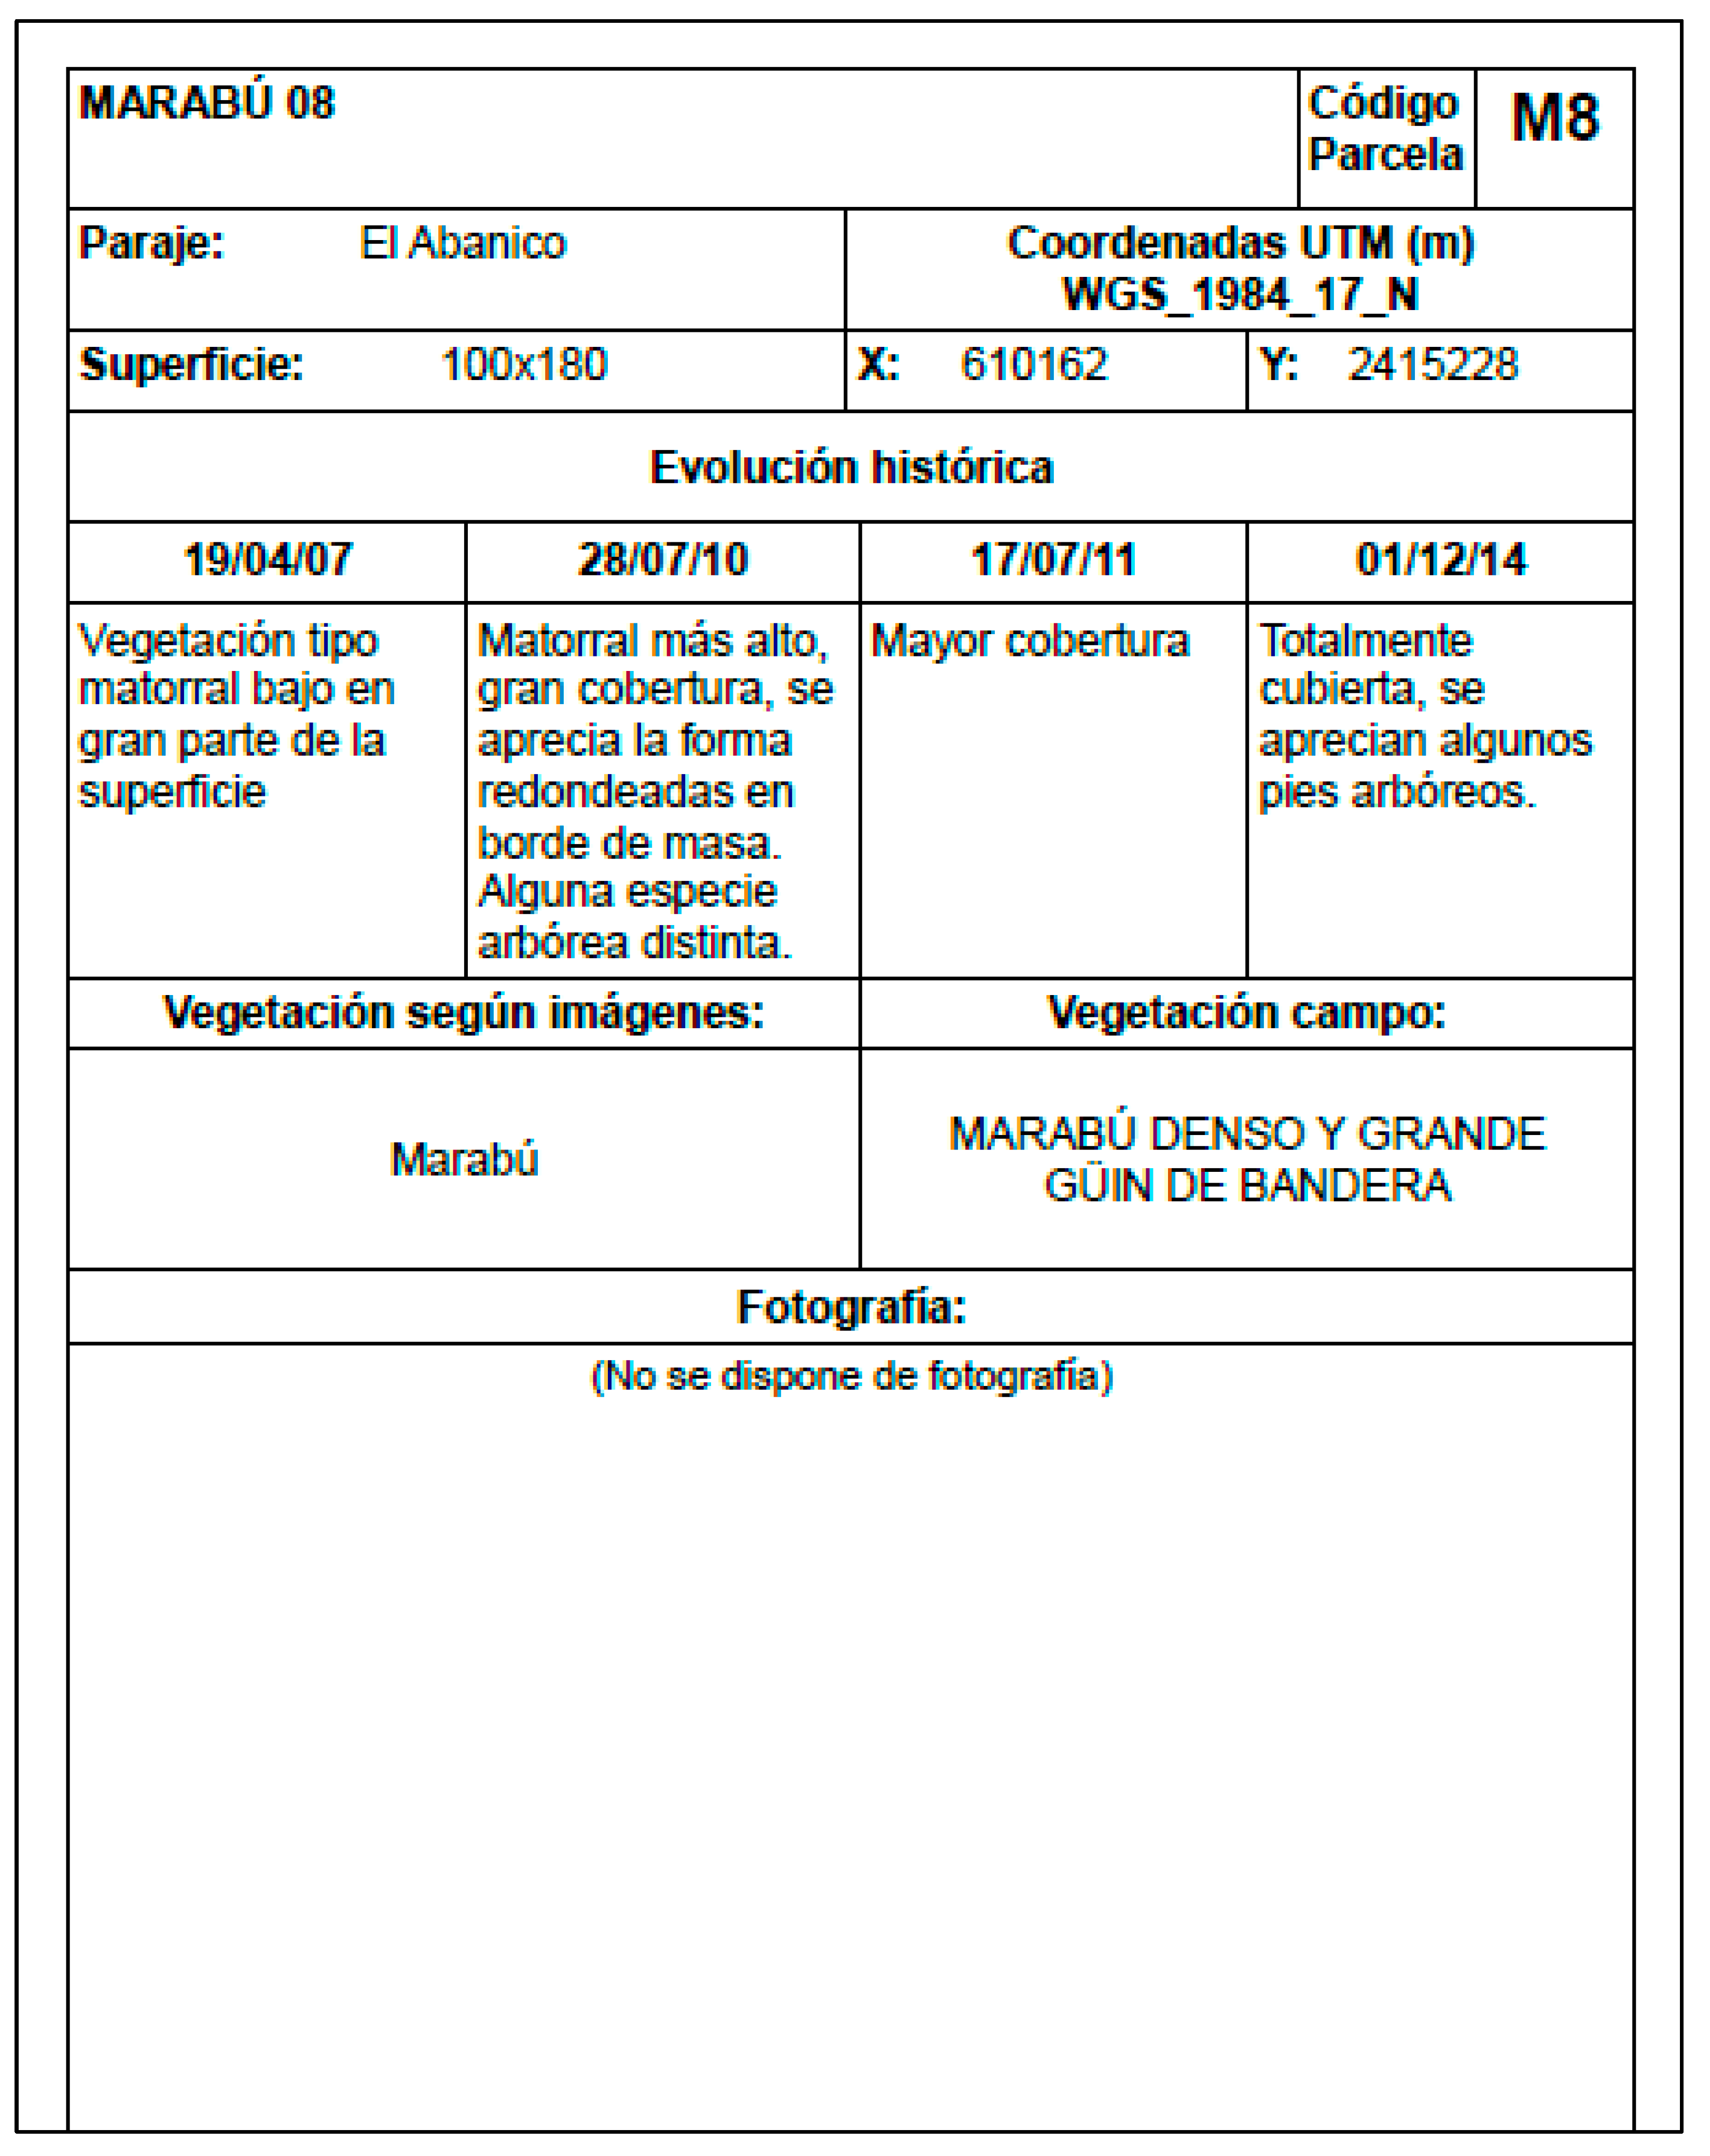
| 21 | X: 610162 Y: 2415228 | 18000 | Marabou, guin de bandera |
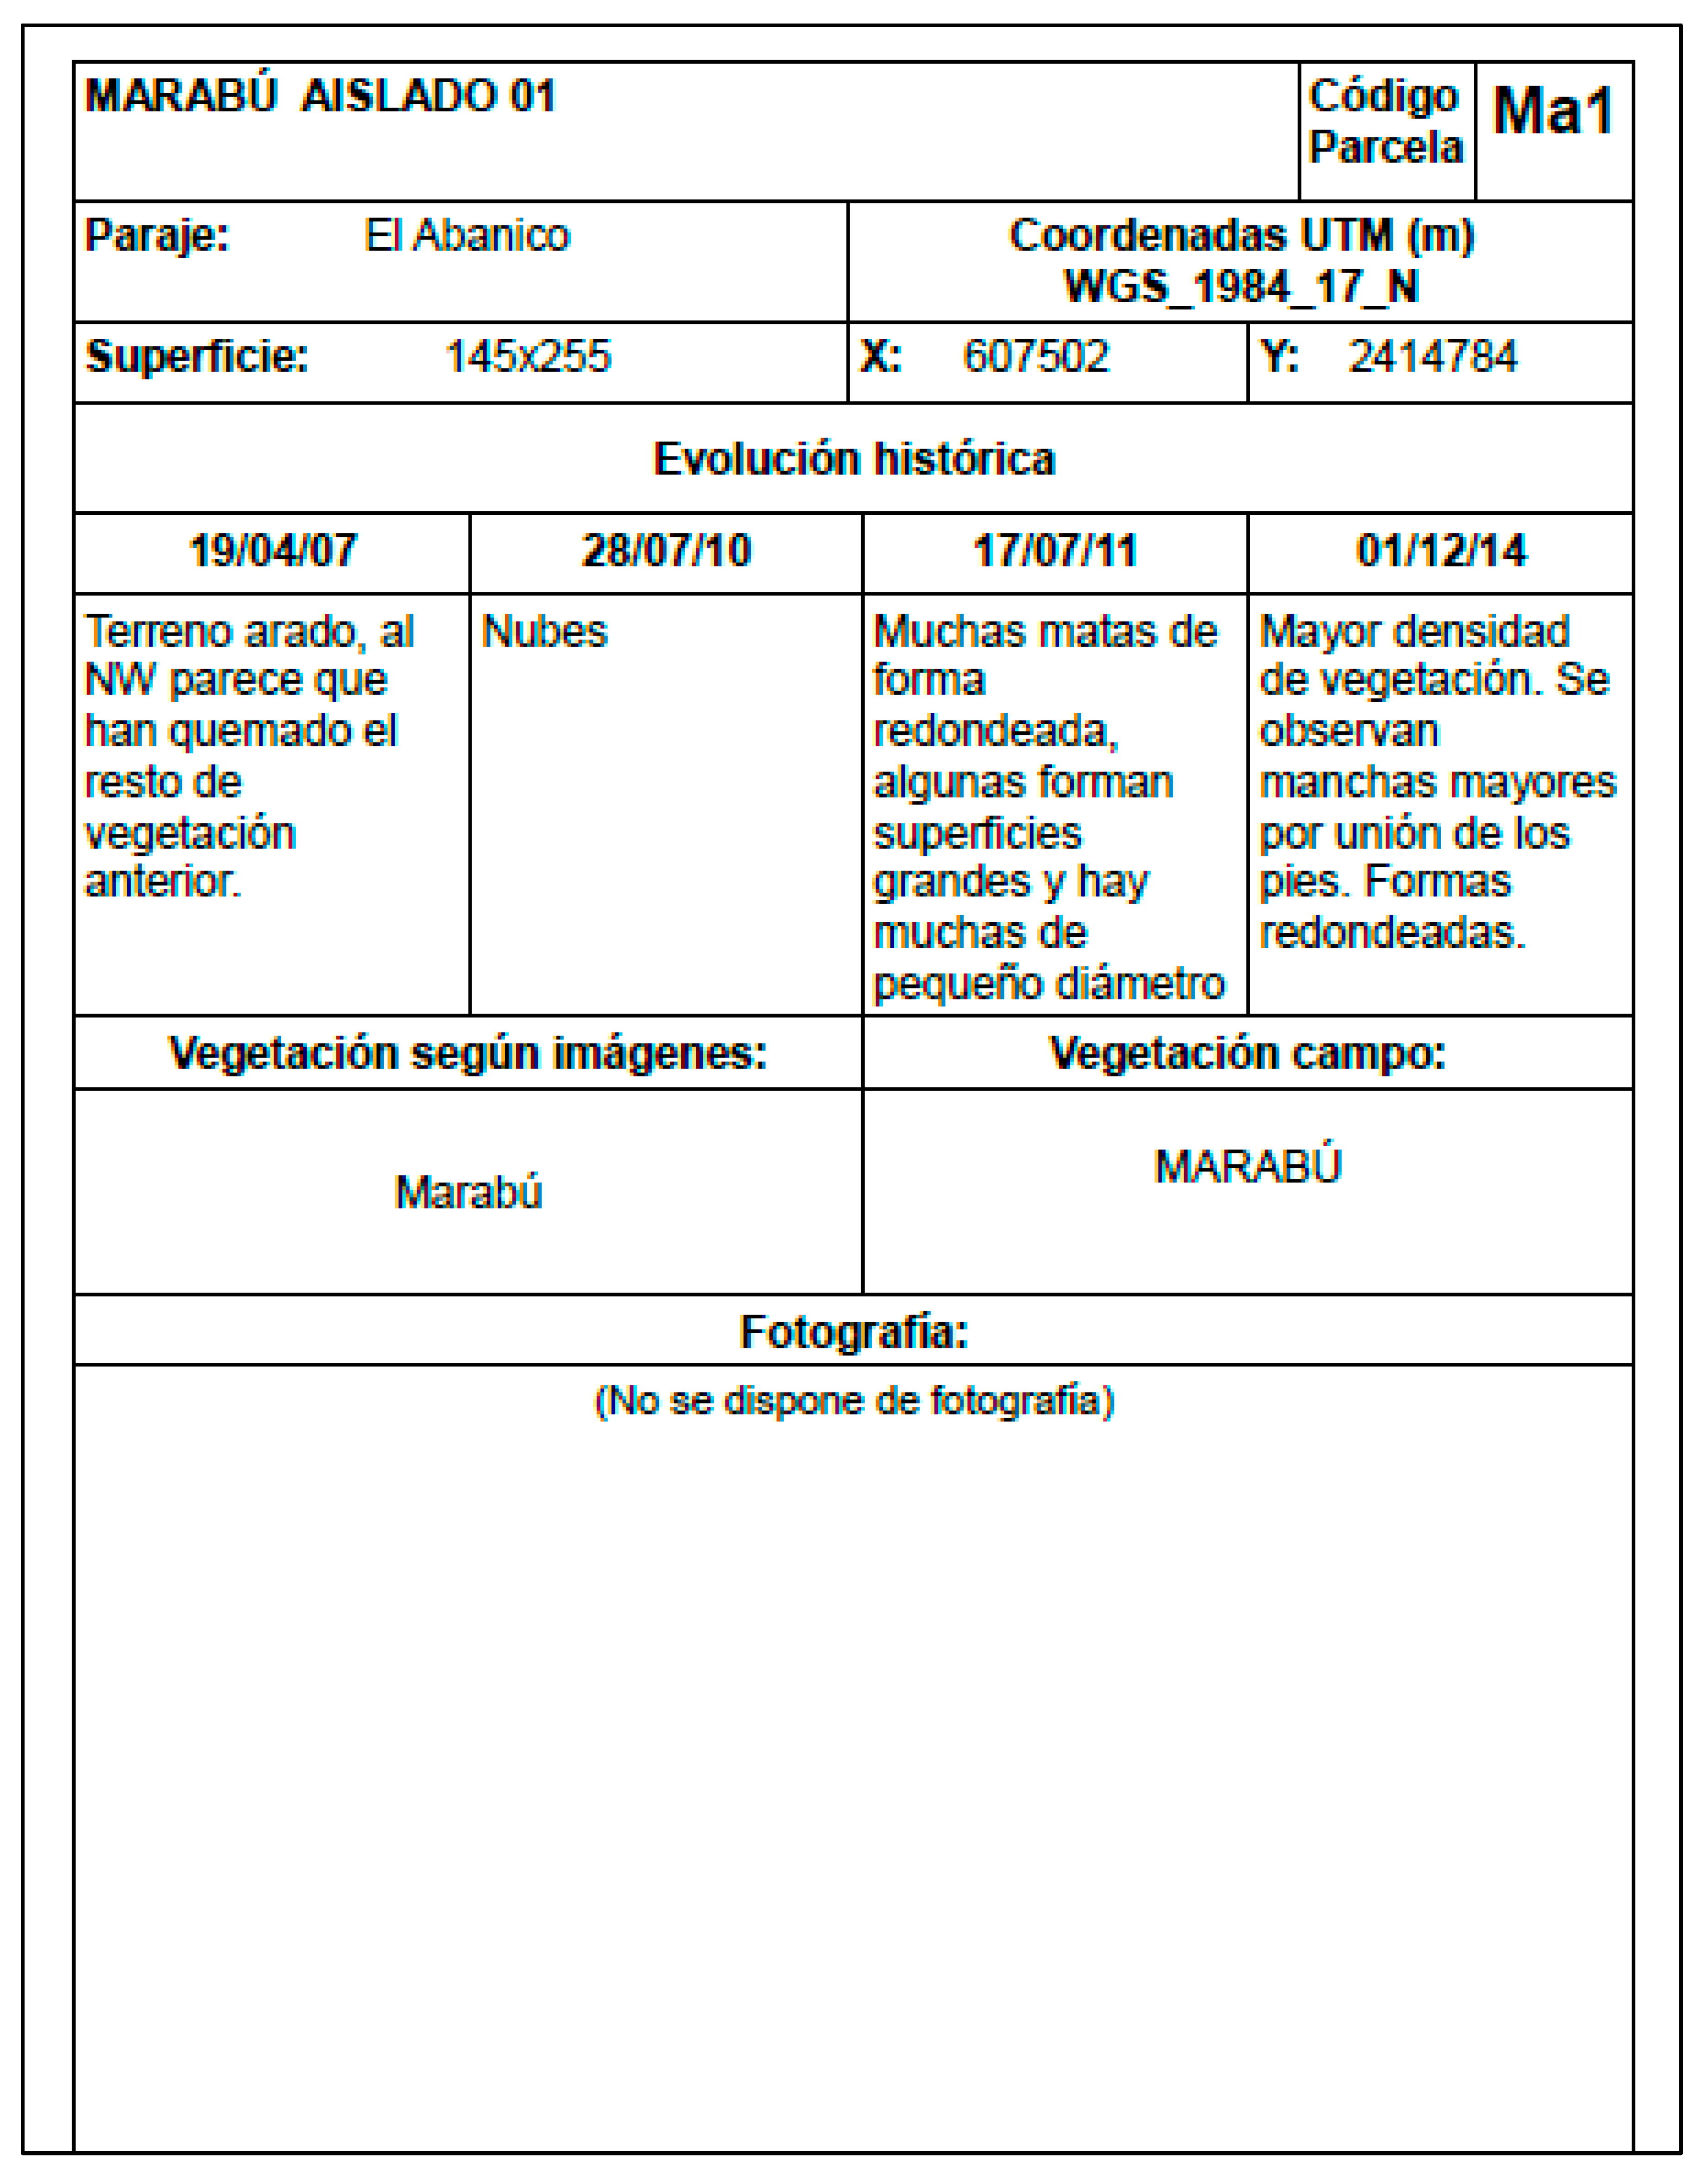
| 22 | X: 607502 Y: 2414784 | 36975 | Marabou |
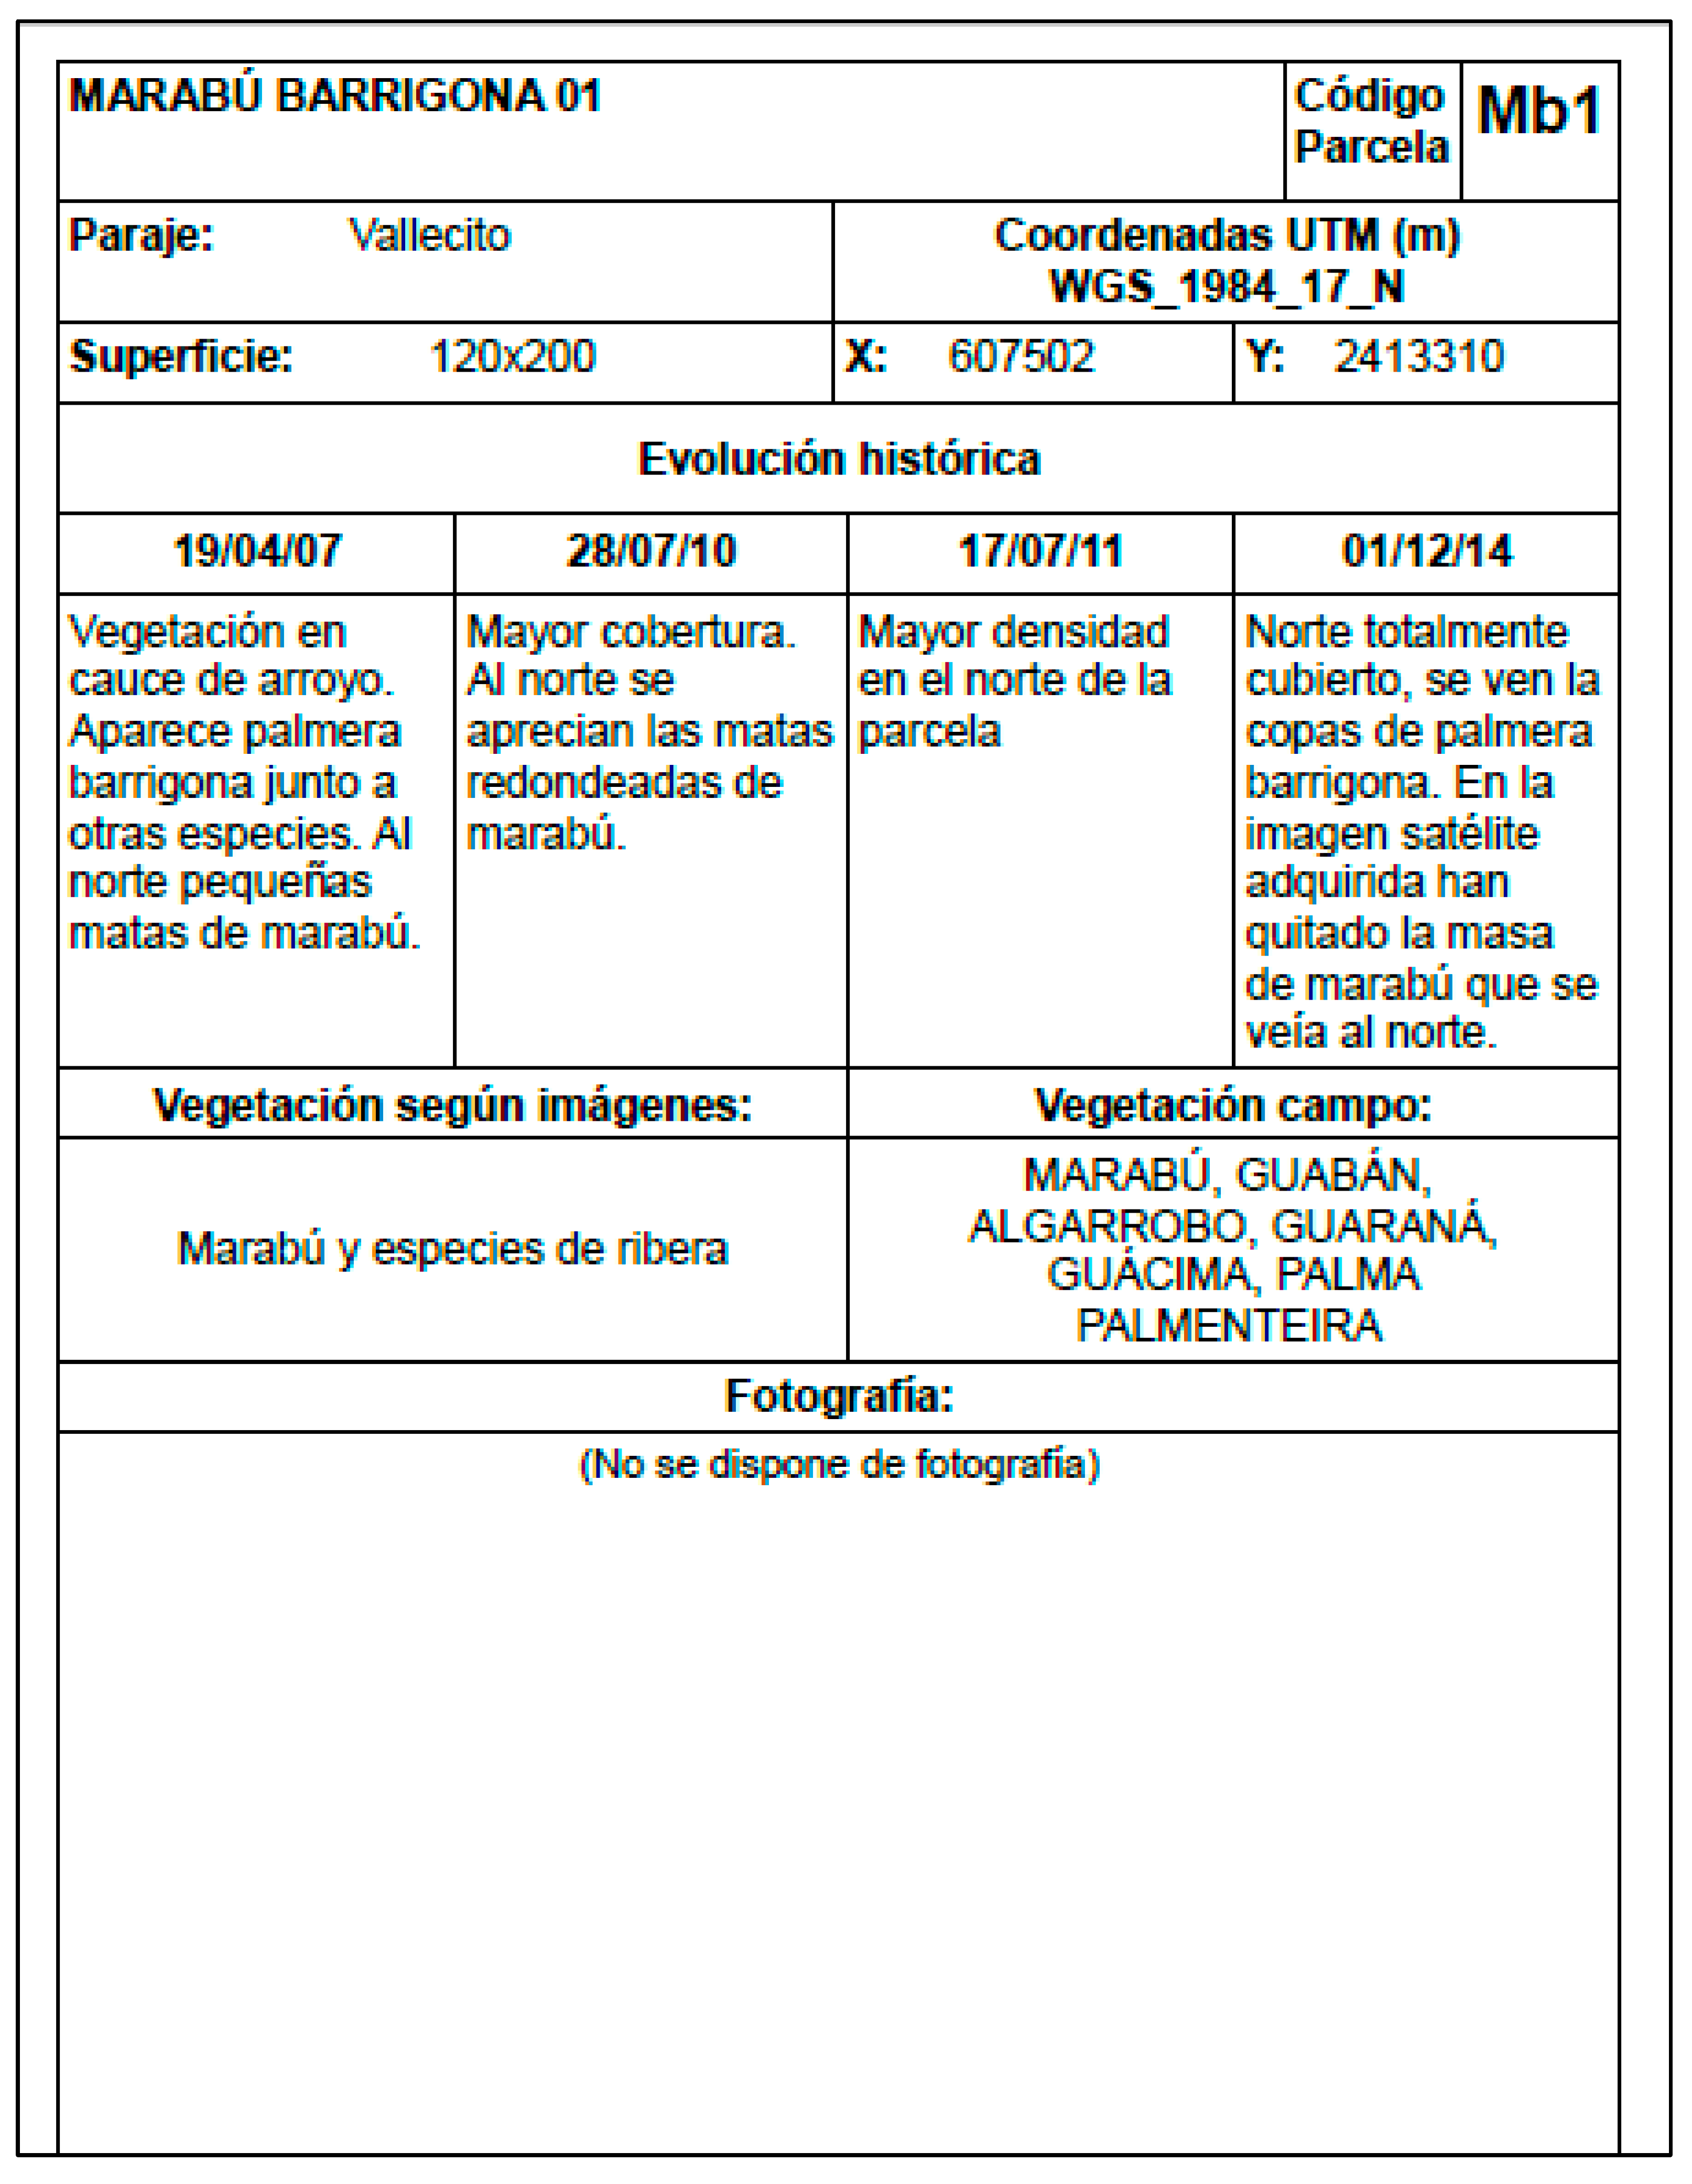
| 23 | X: 607502 Y: 2413310 | 24000 | Marabou and riparian species |
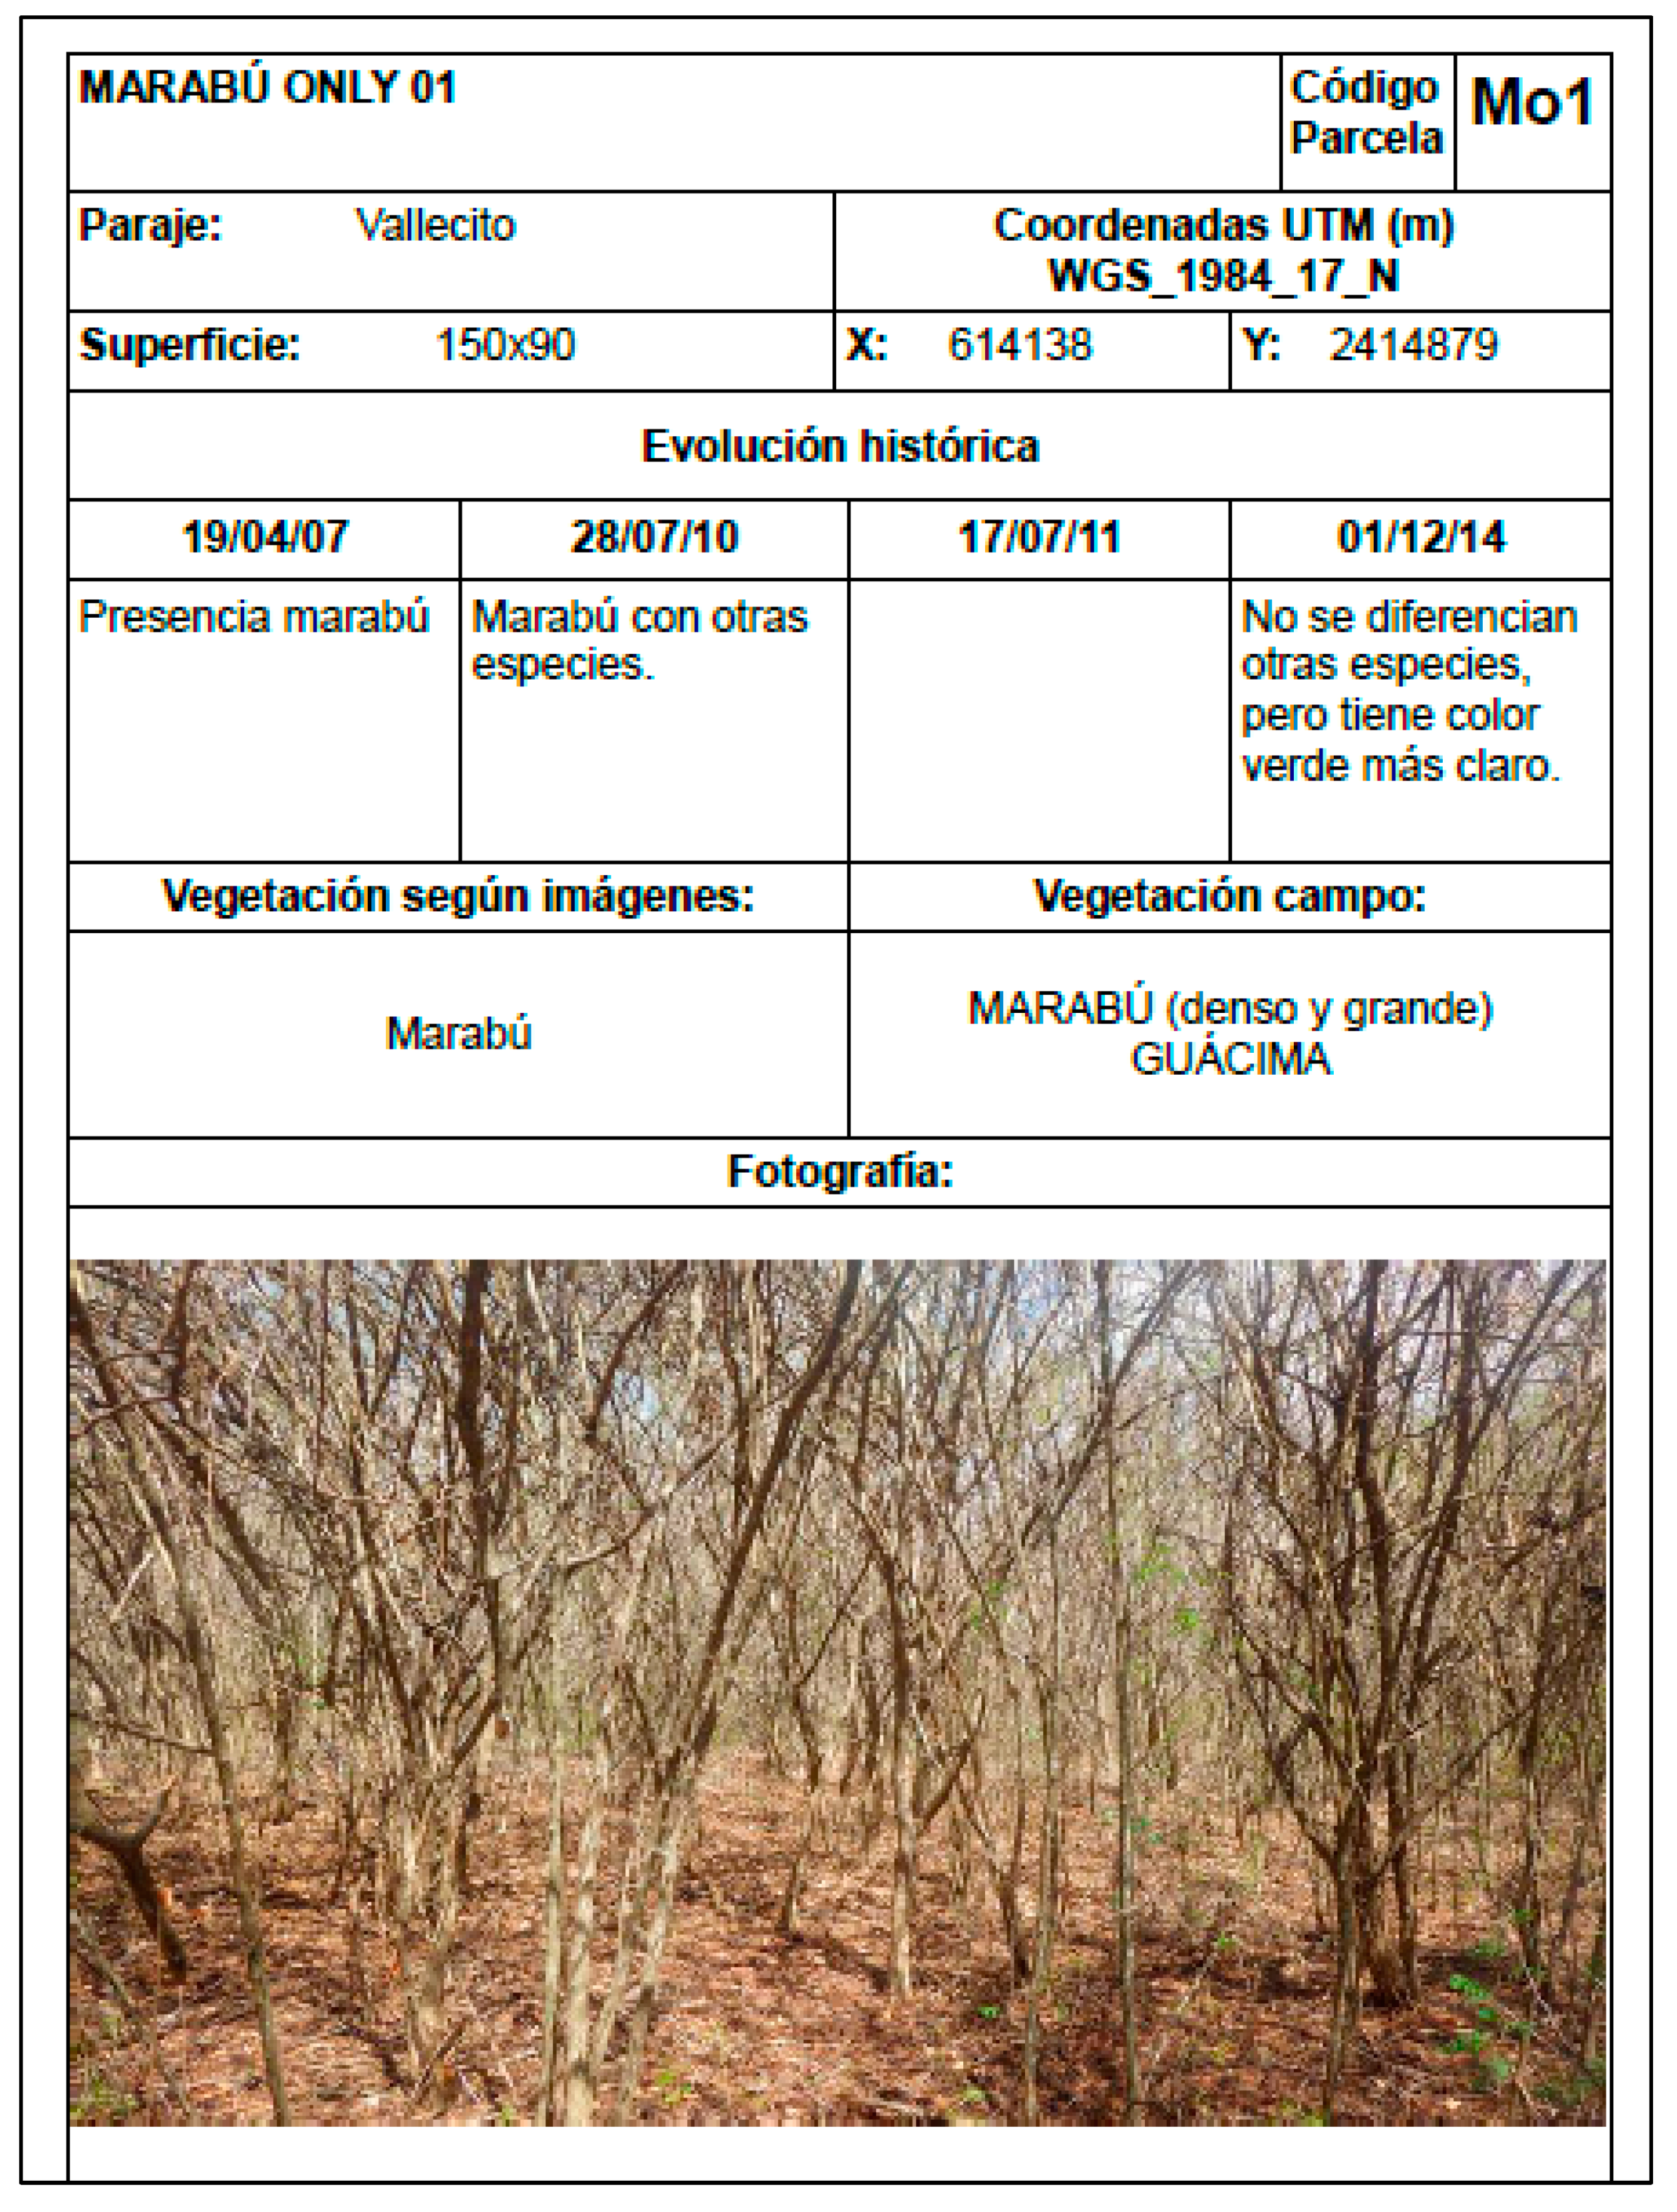
| 24 | X: 614138 Y: 2414879 | 13500 | Marabou, guacima |
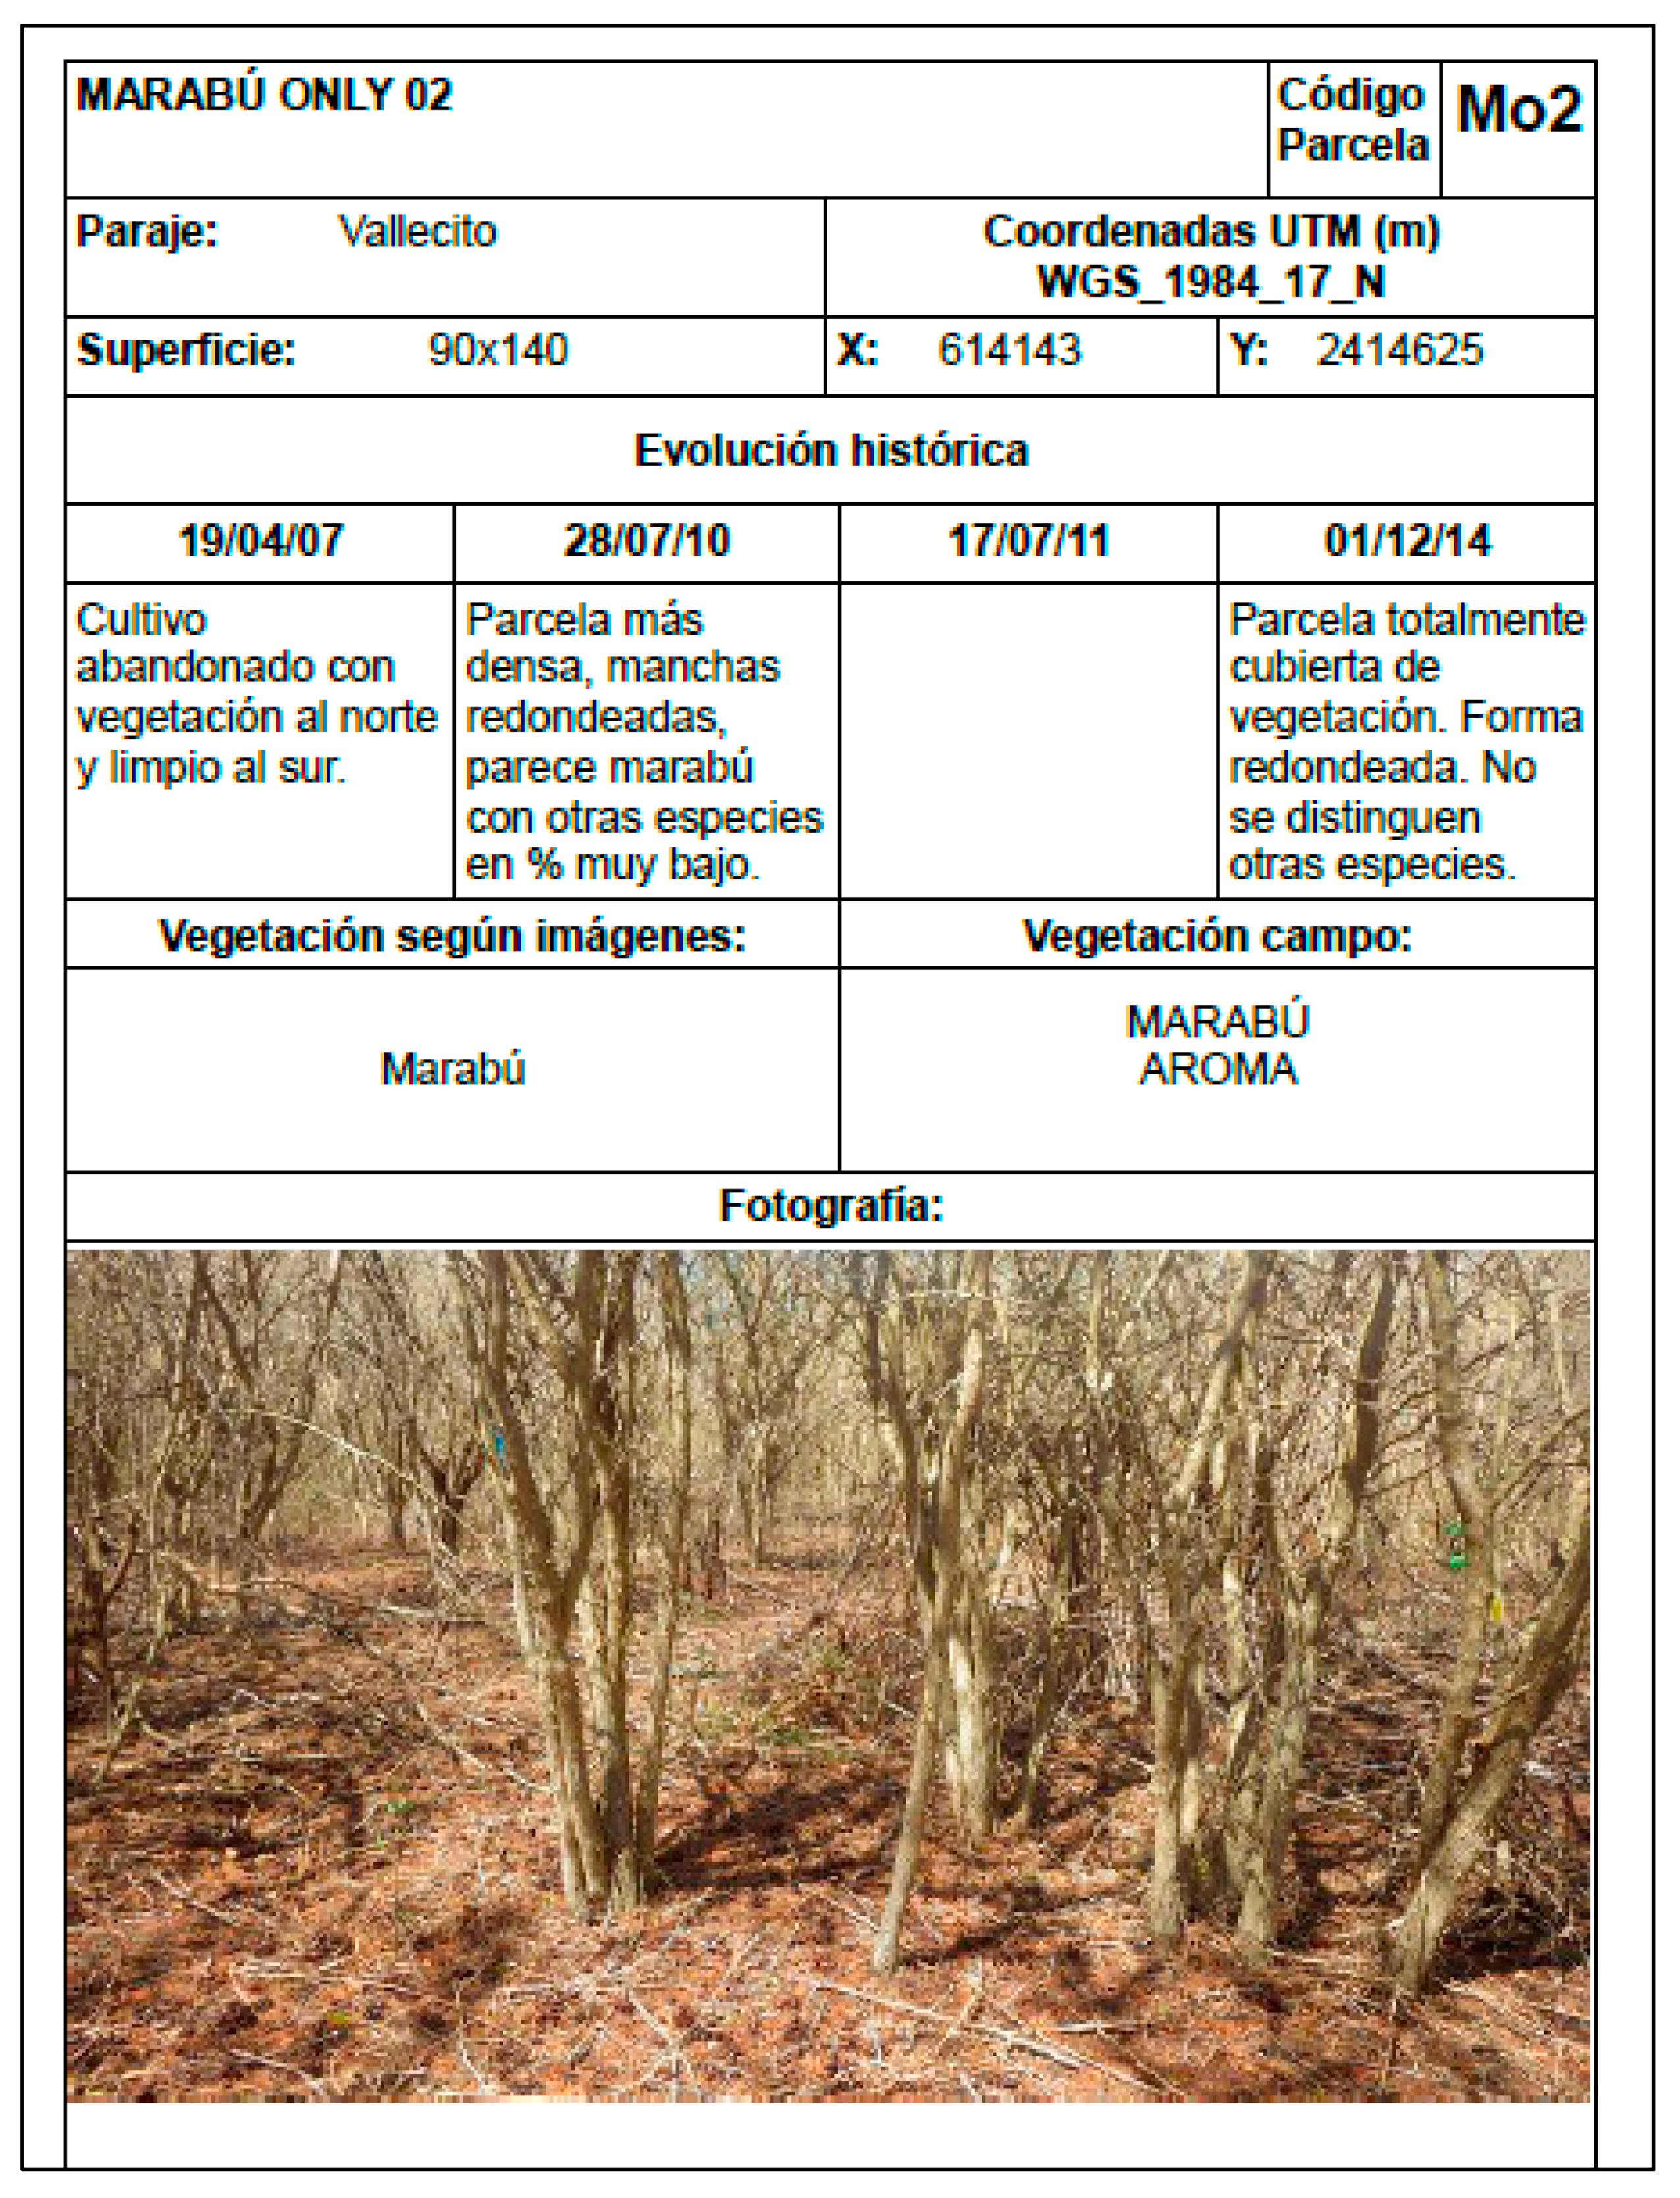
| 25 | X: 614143 Y: 2414625 | 12600 | Marabou, aroma |
| 26 | X: 613737 Y: 2415050 | 56700 | Marabou |
| 27 | X: 607813 Y: 2415031 | 9000 | Riparian vegetation with some marabou along the edges |
| 28 | X: 607833 Y: 2413688 | 18000 | Marabou, aroma, guarana,palma |
| 29 | X: 606533 Y: 2412695 | 2750 | Palm, almacigo, yagruma and guacima |
Table 2.
Confusion matrix from the 2014 Random Forest classification.
| Class | Mar | Pal | Rib | Cane | King | Urb | Water | Mang | Sum |
|---|---|---|---|---|---|---|---|---|---|
| Mar | 56 | 0 | 0 | 0 | 1 | 0 | 0 | 0 | 57 |
| Pal | 0 | 9 | 0 | 0 | 1 | 0 | 0 | 0 | 10 |
| Rib | 0 | 0 | 2 | 0 | 0 | 0 | 0 | 1 | 3 |
| Cane | 0 | 0 | 1 | 17 | 0 | 0 | 0 | 1 | 19 |
| King | 1 | 1 | 0 | 0 | 3 | 0 | 0 | 0 | 5 |
| Urb | 0 | 0 | 0 | 0 | 0 | 34 | 0 | 2 | 36 |
| Water | 0 | 0 | 0 | 0 | 0 | 0 | 4 | 1 | 5 |
| Mang | 0 | 0 | 0 | 0 | 0 | 0 | 0 | 1 | 1 |
| Sum | 57 | 10 | 3 | 17 | 5 | 34 | 4 | 6 | 136 |
OA 0.9265. Kappa 0.8996.
Table 3.
Evolution of marabou infestation in the Valle de los Ingenios area between 2002 and 2021 year.
Table 3.
Evolution of marabou infestation in the Valle de los Ingenios area between 2002 and 2021 year.
| Year | Hectares |
|---|---|
| 2002 | 7908.1 |
| 2004 | 5067.5 |
| 2006 | 14376.8 |
| 2008 | 14132.2 |
| 2010 | 12326.2 |
| 2012 | 12945.2 |
| 2014 | 12670.7 |
| 2015 | 12796.1 |
| 2016 | 10330.2 |
| 2017 | 8772.5 |
| 2018 | 9329.7 |
| 2019 | 12675.0 |
| 2020 | 15657.0 |
| 2021 | 15640.0 |
Disclaimer/Publisher’s Note: The statements, opinions and data contained in all publications are solely those of the individual author(s) and contributor(s) and not of MDPI and/or the editor(s). MDPI and/or the editor(s) disclaim responsibility for any injury to people or property resulting from any ideas, methods, instructions or products referred to in the content. |
© 2024 by the authors. Licensee MDPI, Basel, Switzerland. This article is an open access article distributed under the terms and conditions of the Creative Commons Attribution (CC BY) license (http://creativecommons.org/licenses/by/4.0/).
Copyright: This open access article is published under a Creative Commons CC BY 4.0 license, which permit the free download, distribution, and reuse, provided that the author and preprint are cited in any reuse.


