Submitted:
22 January 2024
Posted:
22 January 2024
You are already at the latest version
Abstract
Ethoxyquin (EQ) is used as a synthetic antioxidant mainly in animal food, but it has also been reported to have neuroprotective properties by diminishing the peripheral neuropa-thy resulting from anti-cancer chemotherapy in animal models. However, EQ has not been thoroughly evaluated in humans and its use is under debate. The objective of this work was to examine the effect of EQ on primary fibroblasts derived from controls and patients with confirmed mitochondrial dysfunction. To this end, we incubated primary fibroblasts from patients with mitochondrial respiratory chain complex 1 (C1) deficiency, cyto-chrome-c-oxidase (COX) deficiency and genetic form of Parkinson’s disease (PD). Alt-hough EQ did not alter ATP production it significantly increased oxygen consumption and improved energy status in C1 and COX cells while decreasing ROS production in COX, PD and control cells and maintaining mitochondrial content. These effects could possibly be attributed to the antioxidant and chaperone-modulating properties of EQ and to induced SOD2 expression in some cells. Our results indicate that EQ has the potential to improve some mitochondrial functions. Still, caution should be exerted since overdose of this com-pound affected cell growth.
Keywords:
ethoxyquin
; mitochondria
; mitochondrial respiratory chain
; mitochondrial diseases
; Parkinson's
1. Introduction
Ethoxyquin (1,2-dihydro-6-ethoxy-2,2,4, trimethylqyuinoline, EQ) has been used for many years as a synthetic antioxidant for the protection of polyunsaturated fatty acids mainly in fish meal for animal food. Small amounts of EQ1 are present in certain human food products. EQ compound has not been thoroughly evaluated in humans despite its potential toxicity and this is also a subject of debate [1)]. Nevertheless, Zhu et. al. in 2013 identified EQ as a potential neuroprotective compound in a drug screen searching for compounds that ameliorate the side effect of cancer chemotherapy. They showed that EQ and several derivatives prevented paclitaxel-induced peripheral neuropathy without blocking paclitaxel’s ability to kill tumor cells. The neuroprotective effects of ethoxyquin were assessed in vitro by measuring various cellular and molecular parameters, including neurite integrity, cell viability, and apoptosis, and examining for the presence of peripheral neuropathy in vivo. Additional mechanistic studies have demonstrated that EQ acts by modulating the chaperone activity of heat shock protein 90 (Hsp90) by blocking the binding of two of its client proteins, ataxin-2 and SF3B2. EQ-induced reduction in the levels of both proteins prevented axonal degeneration caused by paclitaxel and cisplatin and concomitantly elevated the ATP content. The authors suggested that EQ could be a potential pharmacological drug to prevent chemotherapy-induced axonal degeneration, not only due to its antioxidant properties, but also by modulating chaperone function [2)]. Recently, the same group developed and examined a novel EQ analogue, EQ-6, which prevented axonal degeneration in primary dorsal root ganglions with preserved levels of NAD. EQ6 also prevented loss of epidermal nerve fibers in a mouse model of paclitaxel- induced peripheral neuropathy. They also confirmed reduced tissue levels of SF3B2 protein, which is an RNA-binding protein that plays a role upstream of Sarm1, a key enzyme that degrades nicotinamide adenine dinucleotide (NAD) and initiates axonal degeneration. [3,4]. Yet Another study, investigated the effects of another EQ analog, deethylated ethoxyquin (DEEQ), on liver disease in a rat model of acute liver injury induced by carbon tetrachloride. Treatment with DEEQ showed improved liver function and improved liver histopathology with decreased expression of several antioxidant enzymes and transcription factors [5]. In view of its antioxidant and anti-inflammatory properties and its ability to increase ATP content, our aim was to investigate the effects of this compound on human primary fibroblasts focusing on mitochondrial function. To this end, we investigated the effect of EQ1, which is commercially available, on fibroblasts derived from patients harboring pathogenic variants known to cause mitochondrial dysfunction, and associated with mitochondrial respiratory chain complex I (C1) defect, cytochrome c oxidase deficiency (COX) and Parkinson’s disease (PD) [6-8].
2. Materials and Methods
2.1. Materials
Mitotracker green (MTG) was obtained from (Molecular Probes, Eugene, Oregon, United States).Tetramethylrhodamine ethyl ester (TMRE) and 2′,7′-Dichlorodihydrofluorescein (DCF) were obtained from (Biotium, Harvard, CA, United States). ATPlite Luminescence Assay System was purchased from PerkinElemer (Perkin Elmer Israel Hod Hasharon Israel). Tissue culture media were obtained from (Biological Industries, Supleco, Kibbutz Beit Haemek, Israel). The Seahorse XF CellMito Stress Test Kit and medium were purchased from AgilentTechnologies (Wokingham United Kingdom). The DNeasy Blood & Tissue Kit was obtained from QIAGEN (Venlo,Netherlands) and Sybrgreen, qPCRBIO SybrGreen Blue MixHi-ROX was obtained from PCRBIOSTSTEMS (London,United Kingdom). Improm II, was purchased from Israel. Muse Count & Viability Reagent was from Merck-Millipore (USA). Other chemicals including EQ1 were purchased from Sigma-Aldrich-Merck (Rehovot, Israel) in the purest form available
2.2. Methods
2.2.1. Cell cultures
Patients primary skin fibroblast cell lines included in this study were from patients harboring pathogenic mutations in nuclear genes NDUFAF4 (C1) [6] COX4I1 (COX)[7] PRKN (PD-P) [8] and 3 normal controls. Written informed consent to participate in this study was provided by the participant/ participants' legal guardian and the study was approved by the local institutional review board (0485-09-HMO, 0393–17-HMO). The cells were maintained in permissive glucose containing (GLU) DMEM-high glucose medium supplemented with supplemented with 15% fetal calf serum,50 μg/ml uridine, 110 μg/ml pyruvate and 2mM glutamine at 37 °C in 5% CO2. Cells were counted after trypsinization with the Muse Count & Viability Reagent (Merck-Millipore USA) using the GuavaMuseCell Analyzer (Luminex, Austin, TX USA)
2.2.2. Assessment of Mitochondrial Function in Microtiter Wells
Evaluation of the effect of each compound on baseline parameters of cellular and mitochondrial function in microtiter wells, was carried out essentially as we have previously described [9,10] briefly; 3x10³ cells per well were seeded in triplicates on identical 96-well cell culture plates and incubated for 24 hours at 37°C, 5% CO2. The following day the medium was replaced with fresh GLU medium or restrictive medium, glucose-free DMEM with 5 mM galactose and 5% (FCS) and 2mM Glutamine, (GAL)in the presence of 1µM EQ1 (from a 1mM stock solution in dimethyl sulfoxide (DMSO) or vehicle DMSO. Cells were incubated for 72 hours at 37°C, 5% CO2. Subsequently, cell content, ROS production, ATP production, mitochondrial content and mitochondrial membrane potential (∆Ψm) were assayed. Cell content in GLU or GAL medium was measured by spectrophotometry after fixation and methylene blue (MB) stain. Mitochondrial ATP production in GLU medium was measured for in permeabilized cells after incubation with glutamate and malate in the presence of ADP, analyzed by luciferin–luciferase using the ATPlite Luminescence Assay System and normalized to MB. Reactive oxygen species (ROS) production, mitochondrial content was determined by fluorometry after incubation with DCF and MTG respectively and normalized to MB. Mitochondrial membrane potential was estimated by TMRE stain and normalized to MTG. All spectrophotometric, luminometric and fluorometric measurements were performed on a BioTek Synergy HT microplate reader (AgilentTechnologies ,Wokingham UK).
2.2.3. Oxygen consumption and extracellular acidification rates
Oxygen consumption rates (OCR) and extracellular acidification rates (ECAR) were measured essentially as we have previously described[9,10], briefly; fibroblast were seeded in quadruplicates on XF96-well plates in GLU medium, in the absence or presence of EQ1 or vehicle for 72 h. Prior to the measurement, the medium was changed to Seahorse XF unbuffered DMEM medium supplemented with 1 mM pyruvate, 2 mM glutamine and 10 mM glucose and OCR and ECAR were measured by the Agilent Seahorse XF Cell Mito Stress Test according to the manufacturer’s instructions, using the Seahorse XF Extracellular 96-well Flux Analyzer (Agilent Technologies, Wokingham, UK). The rates were normalized to cell content as measured by MB.
2.2.4. Mitochondrial DNA content
Mitochondrial DNA (mtDNA content) was measured by quantitative PCR. Total DNA was isolated from the fibroblasts grown in GLU medium using the the QIAGEN DNeasy Blood & Tissue kit and mtDNA was quantified. MtDNAcontent was determined by real-time quantitative PCR (qPCR) with SyGreen Blue Mix Hi-ROX, using the same conditions and primers specific for the mitochondrial t-RNA leucine gene (MT-TL1) the nuclear β-2-microglobulin (β2M) gene as described Venegas et al. [11]. The reaction and analysis were performed on a Step OnePlus RealTime-PCR system (ThermoFisher Scientific, Waltham, MA, United States). The relative mtDNA content was calculated using the delta-delta Ct method formula comparing all resultst to untreated control mean
2.2.5. SOD2 mRNA Expression
RNA was extracted from fibroblasts grown in GLU, with 1ml Tri Reagent according to the manufacturer’s instructions, washed in 70% ethanol, dried and resuspended in RNase-free water. RNA concentration and purity were measured using the Nanodrop 2000 (Themo Fisher Scientific) cDNA from poly(A)+mRNA was generated using Improm II and Real-time, quantitative PCR for the quantification of NRF1, NRF2, TFAM, SOD2 Fast SYBR GreenMaster Mix and the ABI PRISM7900HT sequence detection system (Applied Biosystems, Foster City, CA, USA). All RNA data are expressed relative to TATA-binding protein (TBP), which was stable across all time points and conditions and the relative expression was calculated using the delta-delta Ct method formula comparing the results to untreated control mean. Primer sequences for all genes were according to Islam et. Al. [12]
2.2.6. Statistical analysis
Experiments were performed in triplicates on three or more independent occasions and presented as mean ± SEM. Statistical significance p<0.05 was calculated by one way ANOVA by followed by Dunnett multiple comparison test or Bonferroni's multiple comparisons test
3. Results
We investigated the effect of EQ on primary fibroblasts from patients with diseases characterized by mitochondrial dysfunction and, therefore, concentrated on relevant parameters that could be measured in relatively small amounts of cells. We opted for the EQ1 analog as this compound is commercially available. In preliminary experiments with control cells (Supplementary Figure S1), we evaluated various concentrations of EQ on growth and ROS production. Growth was not affected by concentrations up to 1µM while concentrations above decreased growth. At 4µM and above, a negative effect of the vehicle DMSO also became evident. Under 1 µM EQ, ROS production was largely unaffected or moderately decreased whereas above 2µM, both the vehicle and EQ had a negative effect by increasing ROS. Thus, we conducted the subsequent experiments on patients’ cells with the EQ concentration of 1µM
3.1. The Effect of EQ on mitochondrial parameters
We investigatied the effect of EQ on parameters related to mitochondrial function (Figure 1) including growth in restrictive medium, (Figure 1A) , mitochondrial ATP production (Figure 1B) and mitcochondrial memebrane potential (Figure 1C) in primary skin fibroblasts from two patients with primary mitochondrial diseases affecting respiratory chain complex I (C1) and cytochrome c oxidase (COX), and from a patient with a genetic form of Parkinson’s disease (PD-P) and compared these to controls (CONT) The results in were also normalized to cell content measured by methylene blue based on the staining of basophilic cellular compounds, (MB). Notably, tetrazolium and ATP based methodologies rely on mitochondrial function and content, and are thus not suitable in this context. In this respect, have previously shown a direct correlation between cell growth and viable count by trypan blue[13].
Cell growth on GAL relative to GLU was partially but significantly decreased (20%) in the C1 deficient cells. This is expected as growt on GAL medium is highly dependent on OXPHOS [14]. Supplementation with EQ improved growth (11%) but this improvement was not statistically significant. Otherwhise EQ had no significant effect on the other cells (Figure 1A). Mitochondrial ATP production (Figure 1B) in permeabilized cells, was markedly decreased (54%) in C1 deficient cells, and was only mildly decreased in COX and PD-P cells but only significanlty in PD-P. EQ did not show any effect on ATP production, nor in patient’s or control cells. Mitochondrial memebrane potential (MMP) was not significantly different in patient’s cells with the exeption of untreated COX cells where the potential was slightly (15%) elevated. EQ showed a tendency to decrease MMP in C1 and COX cells but this decrease (13%) was only significant in C1 cells. In general we did not observe any statistically significant effect of EQ on the measured parameters otherwhise than decreased MMP in CI deficient cells.
3.2. The Effect of EQ on bioenergetics
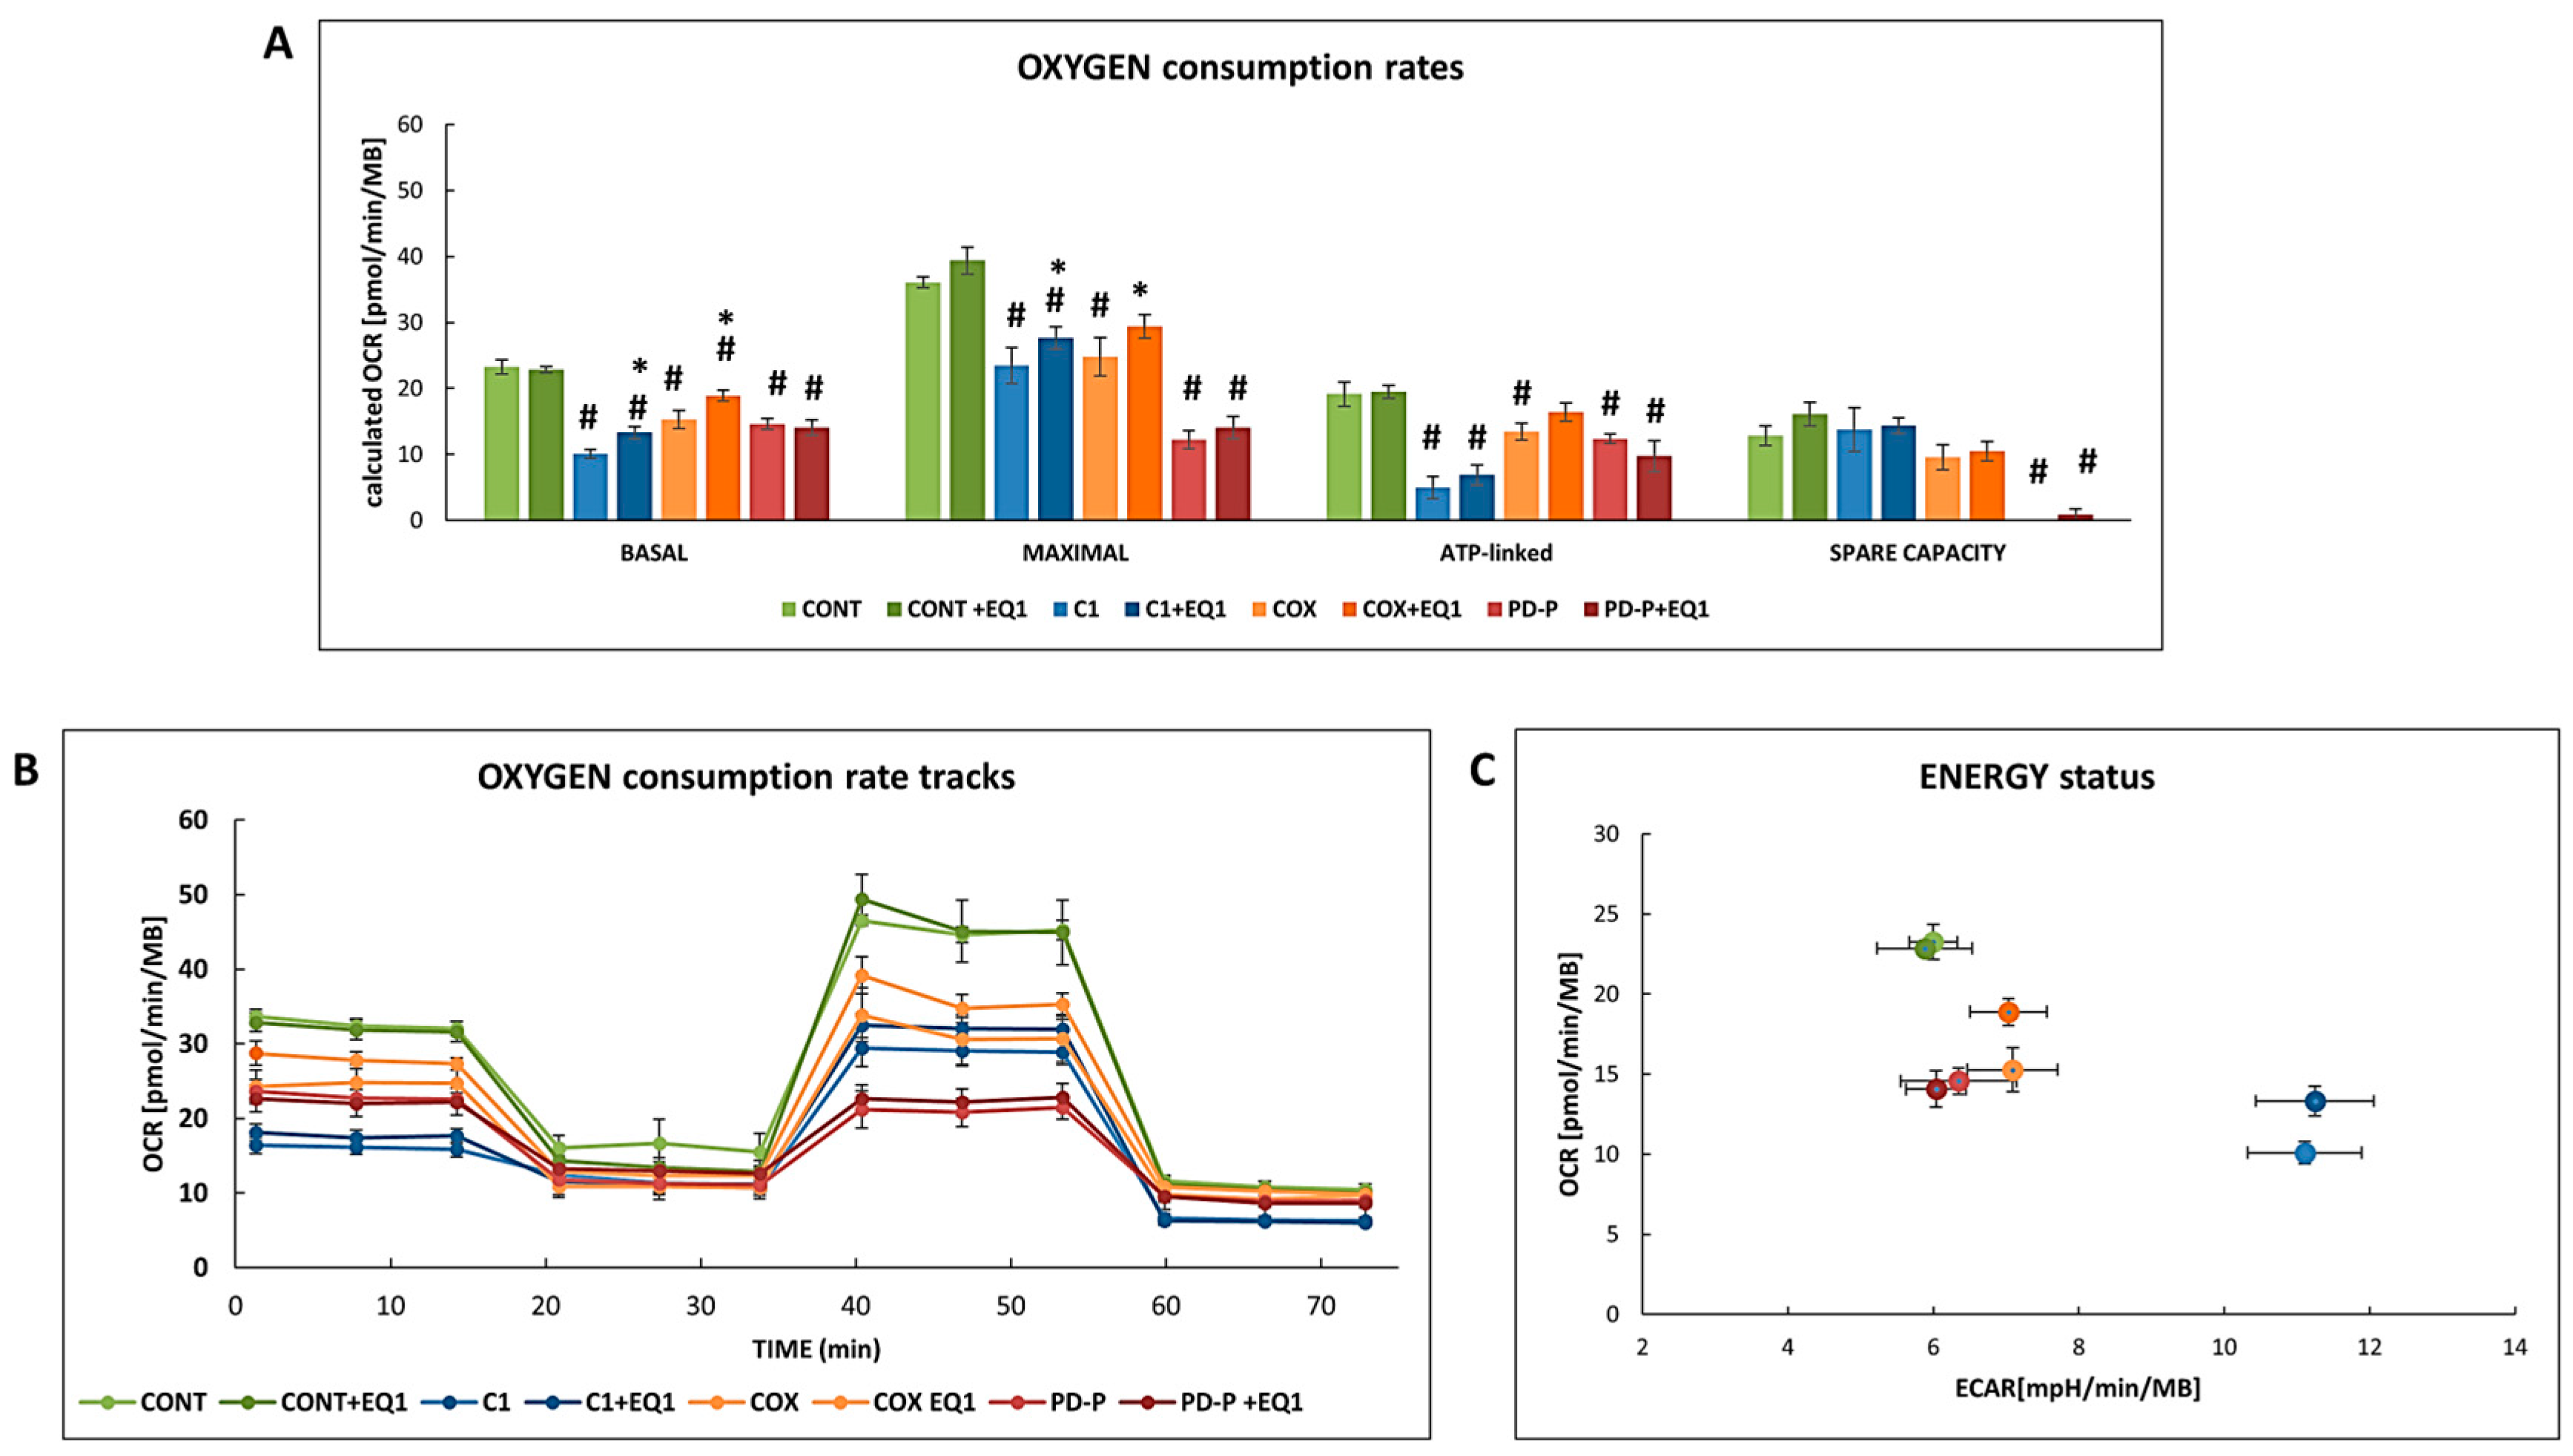
Assessment of the bioengetic status of the cells was done by comparing oxygen consumtion (OCR) and extracellular acidification (ECAR) rates in cells grown in the presence of EQ1 (Figure 2) Basal OCR was measured as OCR without any addition, ATP linked OCR was calculated after subtraction in the presence of oligomycin (an ATPsynthase inhibitor), maximal OCR was calculated following addition of protonophore carbonyl cyanide-p-trifluoromethoxyphenylhydrazone (FCCP) and the spare capacity was calculated as basal capacity substracted from the maximal capacity (Figure 2A). Non mitochondrial OCR in the presense of rotenone and antimycin (inhibitors of CI and CIII) and was subtracted from all measurements. A representative OCR track is depicted in Figure 2B. ECAR, glycolytic marker was measured simultaneously under basal conditions and plotted vs basal OCR (Figure 2C). This plot represent the bioenergetic/metabolic status of the cells i.e OXPHOS vs glycolysis.
Basal and maximal OCR were both decreased (67%-25%) in all patients’ cells. A ATP-linked OCR (60%-30%) was decreased as well. PD-P cells had near to none spare capacity which is indicative of constant maximal OXPHOS activity. A partial but significant elevation (17%-30%) of basal and maximal OCR with EQ was observed in C1and COX deficient cells. ATP dependent OCR was not affected by EQ (Figure 2A,B). Increased ECAR in the C1 and COX patient cells combined with the decreased OCR indicate a decreased energetic state with a shift towards glycolytic metabolism. The energetic atatus improved with EQ in these cells. The energetic status in controls and PD-P cells was not affected by EQ (Figure 2C).
3.3. The Effect of EQ on cellular ROS production and mitochondrial content
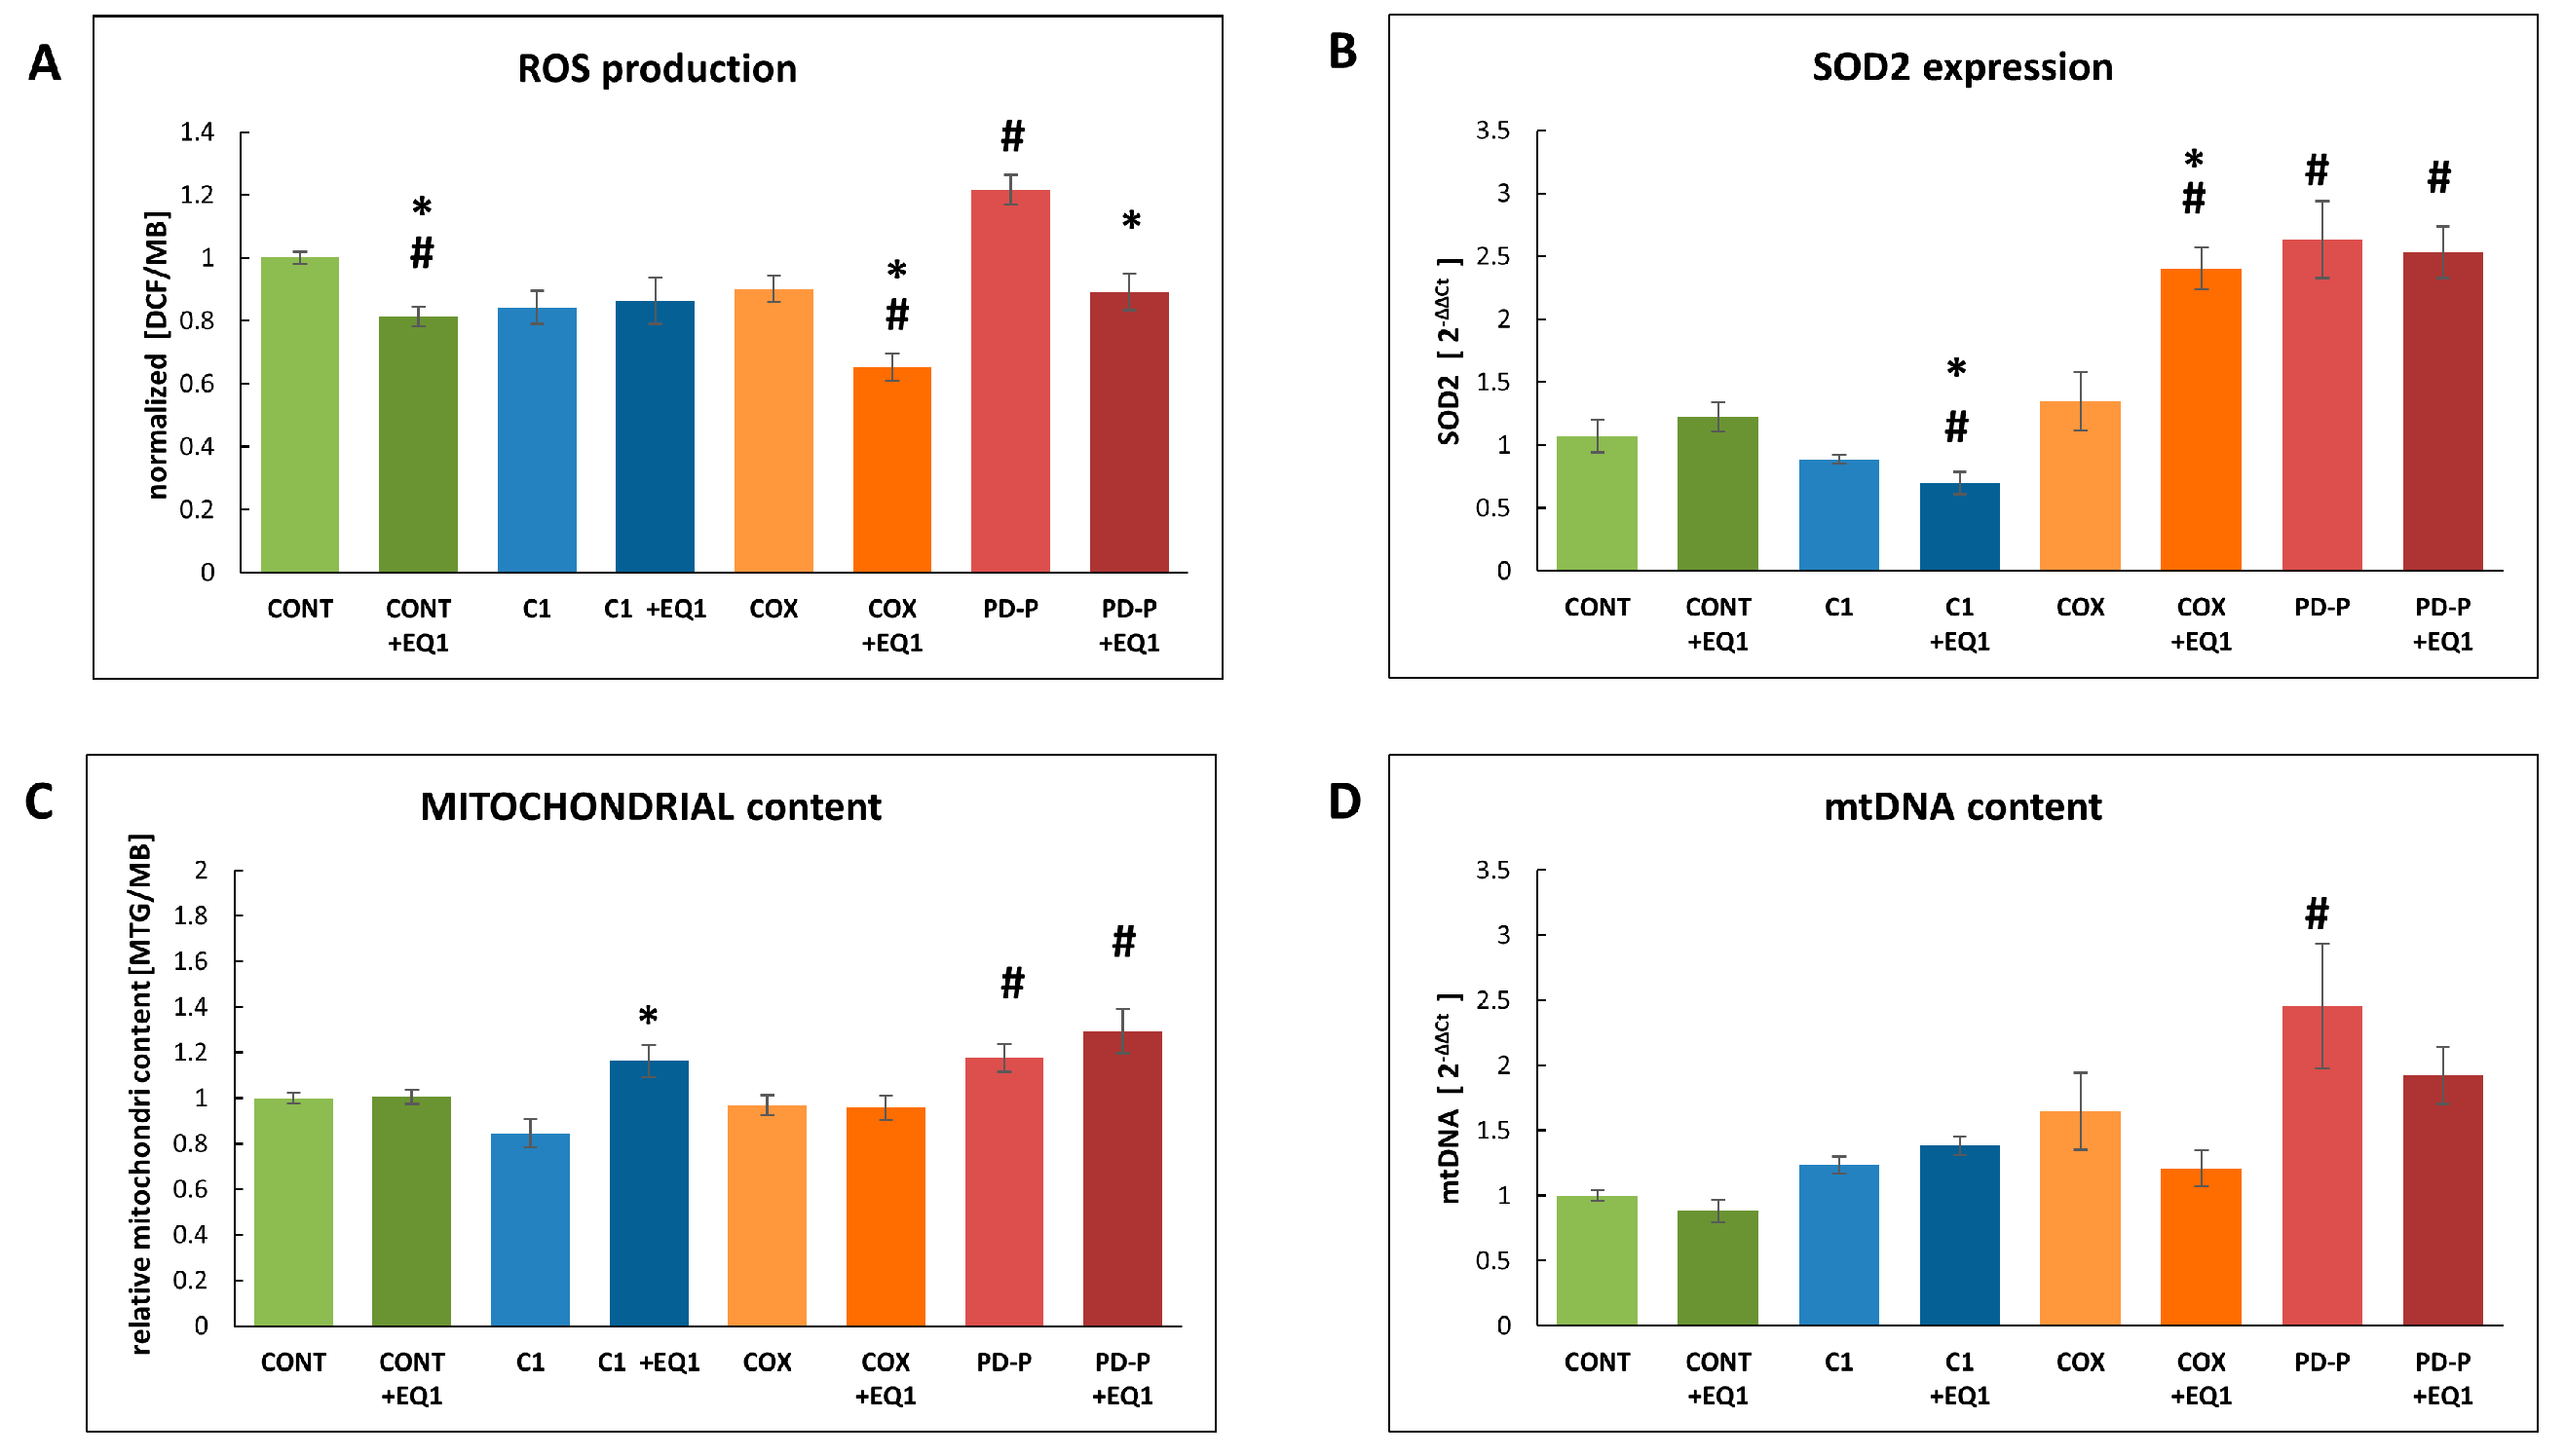
We measured cellular ROS production (Figure 2A) which is a byproduct of the mitochondrial respiratory chain and is also indicative of oxidative stress. Elevated ROS production is also a frequent consequence of mitochondrial dysfunction depending on the nature of the defect [15]. We observed that the significanly (20%) a priori elevated ROS production in PD-P was normalized by EQ. Decreased (25% and 19%) ROS production with EQ was also observed in COX deficient cells control fibroblasts respectively . We speculated that this decrease could be a consequence of upregulated mitochondrial antioxidant defence and therfored measured mRNA expression of SOD2, the gene encoding the mitochondrial manganese-dependent superoxide dismutase (Figure 2B). EQ treated COX deficient cells showed a marked increase (x1.8) in SOD2 expression which could explain the decreased ROS production but not control and PD-P cells where SOD2 expression was a priori elevated. On the contrary, SOD2 expression was negativley affected by EQ in C1 cells. Another cause of decreased ROS procuction could also stem from decreased mitochondrial content. Thus we measured mitochondrial content by two methodologies, namely mitoctracker green (MTF) (Figure 2C) and mtDNA content (Figure 2D) in the absence and presence of EQ in the growth medium. The results where somewhat conflicting as mitochondria content increased (36%) in C1 cells in the presence of EQ as measued by MTG but not by mtDNA. PD-P cells showed an apriori elevated mitochondrial content measured by MTG but only untreated PDP-P measured by mtDNA. These dicrepacies might originate from the fact that increased mitochondrial mass does not nessecarily mean increased mtDNA content. Nevertheless the decreased ROS production observed in controlsm COX and PD-P cells incubated with EQ does not seem to be a consequence of decreased mitochondrial content.
Figure 3.
The effect of Ethoxyquin (EQ1) on cellular ROS production, SOD 2 expression, mitochondrial content and mtDNA content. Equal amount of control cells (CONT) cells with mitochondrial C1 (C1), COX (COX) deficiency, PD with mutated PRKN (PD-P), were seeded in microtiter wells , incubated in ther presence or absence of 1μM Ethoxyquin (EQ1) for 72h where after the following parameters were measured; (A) ROS production measured by DCF and normalized to MB; (C ) Mitochondrial content was measured by MTG, RFU and normalized to MB. (B) RNA was isolated and c-DNA was generated from control cells (CONT) cells with mitochondrial C1 (C1), COX (COX) deficiency, and cells with mutated PRKN (PD-P)grown in the absence or presence of ethoxyquin (EQ1) for 72h. The mRNA expression of SOD2 was measured by RT-PCR, normalized to the TBP and calculated as fold expression relative to untreated control mean. (D) mtDNA content was measured by qPCR of MT-TL1 and normalized to the nuclear β2M. Results are presented as mean ± SEM relative to controls (n=3). #p<0.05 compared to untreated control mean, *p<0.05 compared to the individual cell without additive.
4. Discussion
In this study, we examined the effect of EQ on normal human fibroblasts and fibroblasts derived from patients with genetic disease known to affect mitochondrial function. Our working hypothesis was that EQ could have a beneficial effect on mitochondrial energy production and lessen oxidative stress as previously shown in vitro and in vivo in animal models [2-5]. Additionally, there is ongoing controversy on the safety of EQ as an antioxidant preservative with the data on consumer safety and its environmental impact remaining inconclusive. [16]. Thus, this study could also contribute to a better understanding of these unanswered questions. We opted to study primary fibroblasts rather than immortalized, pluripotent or reprogrammed cells, as fibroblasts are relatively easy to obtain and maintain, while still recapitulating several features of the disease phenotypes. Nevertheless, the number of cells and passages are restricted and thus limited the number and nature of our experiments. We focused on the EQ parent compound, EQ1 as this derivative is commercially available. Initially, we investigated the effect of various concentrations on normal fibroblasts. Above 2µM (0.434 mg/l), minor, but still significant, negative effects on growth was observed. In comparison, 11-50mg/kg was considered to be safe in animal food as EQ itself is not considered to be genotoxic or carcinogenic, but the oxidation products are of concern [16]. Based on our preliminary findings, we continued with the lowest effective concentration, which was 1µM EQ, to evaluate the effect patient-derived fibroblasts. We supplemented the cells with EQ for 72h, as according to our experience this is the most suitable time for detecting the effect of respiratory chain function on restrictive medium [14]. The effect was variable, depending on the patient cells and on the assays and the extent of mitochondrial dysfunction in the patients’ cells. Notably C1 cells originated from a severely affected infant with markedly decreased OXPHOS activity while COX and PD-P cells were obtained from patients will less severe phenotype with relatively mild impact on mitochondrial function [6-8]. To our disappointment and in contrast of what previously reported Cetinkaya-Fisgin et al [3], we did not detect any effect of EQ on mitochondrial ATP production of ATP linked oxygen consumption. Nevertheless, EQ significantly increased oxygen consumption and improved energy status in C1 and COX deficient cells (Figure 2). This increase was not accompanied as expected with elevated ROS and not a result of decreased mitochondrial content [15,17]. On the contrary, ROS production was decreased by EQ. The positive effect on ROS production in COX cells could be attributed the to the increased expression of SOD2. While the decreased ROS production in control and PD-P cells could be linked to the antioxidative and chaperone-modulation properties EQ [1-5].
5. Conclusions
Taken together, our results indicate that EQ has the potential to ameliorate ROS production concomitantly with increasing energy status in some cells with mitochondrial dysfunction. These effects are most probably a combination of antioxidative and additional properties. Still, caution should be exerted since overdose of this compound could cause negative effects.
Supplementary Materials
The following supporting information can be downloaded at the website of this paper posted on Preprints.org, Figure S1 Determination of the suitable EQ concentration on control cells: Equal amount of control cells (CONT) was seeded in microtiter wells, incubated without Ethoxyquin (EQ1) and with DMSO and different concentrations of Ethoxyquin (EQ1) for 72h in permissive (GLU) where after cell growth was measured by MB staining and reactive oxygen species by DCF normalized to MB. Results are presented as mean of triplicate ± SEM.
Author Contributions
Conceptualization, A.S, A.H., P.Y-W-M and DA. methodology, M.Z , A.L,C.M and A.S. investigation, M.Z,AL, CM AS .; writing—original draft preparation, A.L and A.S.; writing—M.Z, A.L., C.M., A.H, P.Y-W-M., D.A.,A.S.; supervision A.S.; project administration, ,A. S .; funding acquisition, A.S All authors have read and agreed to the published version of the manuscript.
Funding
This research was funded by the Israel Science Foundation ISF, grant number 1059/19 to A.S. The APC was funded by A.S. P.Y-W-M is supported by an Advanced Fellowship Award (NIHR301696) from the UK National Institute of Health Research (NIHR). P.Y-W-M also receives funding from Fight for Sight (UK), the Isaac Newton Trust (UK), Moorfields Eye Charity (GR001376), the Addenbrooke’s Charitable Trust, the National Eye Research Centre (UK), the International Foundation for Optic Nerve Disease (IFOND), the Rosetrees Trust, the NIHR as part of the Rare Diseases Translational Research Collaboration, the NIHR Cambridge Biomedical Research Centre (NIHR203312), and the NIHR Biomedical Research Centre based at Moorfields Eye Hospital NHS Foundation Trust and UCL Institute of Ophthalmology (NIHR203322). The views expressed are those of the author(s) and not necessarily those of the NHS, the NIHR or the Department of Health.
Institutional Review Board Statement
The studies involving human fibroblasts were reviewed and approved by Ethics Committee approved by the Hadassah Medical Center (0485-09-HMO 0393–17HMO ).
Informed Consent Statement
Written informed consent to participate in this study was provided by the participant/ participants' legal guardian. No potentially identifiable human images or data is presented in this study.
Data Availability Statement
Raw data presented in this work are available upon request.
Acknowledgments
Devorah Soiferman-Yefet and Michael Edery are acknowledged for technical assistance with some preliminary results.
Conflicts of Interest
The authors, M.Z, A.L.,C.M.,L.D.,P.Y-W-M.,D.A, and A.S. declare no conflict of interest,. A.H. is a founder, shareholder and chair of scientific advisory board of AxoProtego Therapeutics which has licensed the use of ethoxyquin for peripheral neuropathies from Johns Hopkins University.
References
- de Koning,A.J. (2002). The antioxidants ethoxyquin and its analogues: a review International Journal of Food Properties, 2002,5(2) 451-461. [CrossRef]
- Zhu, J., Chen, W., Mi, R., Zhou, C., Reed, N., & Höke, A. (2013). Ethoxyquin prevents chemotherapy-induced neurotoxicity via Hsp90 modulation. Annals of neurology, 74(6),2013, 893–904. [CrossRef]
- Cetinkaya-Fisgin, A., Zhu, J., Luan, X., Kim, J. S., Oh, B., Brayton, C., Alt, J., Rais, R., Slusher, B., & Höke, A. (2021). Development of EQ-6, a Novel Analogue of Ethoxyquin to Prevent Chemotherapy-Induced Peripheral Neuropathy. Neurotherapeutics: the journal of the American Society for Experimental NeuroTherapeutics, 18(3), 2061–2072. [CrossRef]
- Jeong, Y. E., Rajbhandari, L., Kim, B. W., Venkatesan, A., & Hoke, A. (2023). Downregulation of SF3B2 protects CNS neurons in models of multiple sclerosis. Annals of clinical and translational neurology, 10(2), 246–265. [CrossRef]
- Iskusnykh, I. Y., Kryl'skii, E. D., Brazhnikova, D. A., Popova, T. N., Shikhaliev, K. S., Shulgin, K. K., Matasova, L. V., Popov, S. S., Zhaglin, D. A., Zakharova, A. A., Popova, N. R., & Fattakhov, N. (2021). Novel Antioxidant, Deethylated Ethoxyquin, Protects against Carbon Tetrachloride Induced Hepatotoxicity in Rats by Inhibiting NLRP3 Inflammasome Activation and Apoptosis. Antioxidants (Basel, Switzerland), 10(1), 122. [CrossRef]
- Saada, A., Edvardson, S., Rapoport, M., Shaag, A., Amry, K., Miller, C., Lorberboum-Galski, H., & Elpeleg, O. (2008). C6ORF66 is an assembly factor of mitochondrial complex I. American journal of human genetics, 82(1), 32–38. [CrossRef]
- Abu-Libdeh, B., Douiev, L., Amro, S., Shahrour, M., Ta-Shma, A., Miller, C., Elpeleg, O., & Saada, A. (2017). Mutation in the COX4I1 gene is associated with short stature, poor weight gain and increased chromosomal breaks, simulating Fanconi anemia. European journal of human genetics : EJHG, 25(10), 1142–1146. [CrossRef]
- Mor-Shaked, H., Paz-Ebstein, E., Basal, A., Ben-Haim, S., Grobe, H., Heymann, S., Israel, Z., Namnah, M., Nitzan, A., Rosenbluh, C., Saada, A., Tzur, T., Yanovsky-Dagan, S., Zaidel-Bar, R., Harel, T., & Arkadir, D. (2021). Levodopa-responsive dystonia caused by biallelic PRKN exon inversion invisible to exome sequencing. Brain communications, 3(3), fcab197. [CrossRef]
- Yu-Wai-Man, P., Soiferman, D., Moore, D. G., Burté, F., & Saada, A. (2017). Evaluating the therapeutic potential of idebenone and related quinone analogues in Leber hereditary optic neuropathy. Mitochondrion, 36, 36–42. (. [CrossRef]
- Zighan, M., Arkadir, D., Douiev, L., Keller, G., Miller, C., & Saada, A. (2022). Variable effects of omaveloxolone (RTA408) on primary fibroblasts with mitochondrial defects. Frontiers in molecular biosciences, 9, 890653. (. [CrossRef]
- Venegas, V., Wang, J., Dimmock, D., and Wong, L. J. (2011). Real-time quantitative PCR analysis of mitochondrial DNA content. Curr. Protoc. Hum. Genet. 19. 19.17. [CrossRef]
- Islam, H., Bonafiglia, J. T., Turnbull, P. C., Simpson, C. A., Perry, C. G. R., & Gurd, B. J. (2020). The impact of acute and chronic exercise on Nrf2 expression in relation to markers of mitochondrial biogenesis in human skeletal muscle. European journal of applied physiology, 120(1), 149–160. [CrossRef]
- Golubitzky, A., Dan, P., Weissman, S., Link, G., Wikstrom, J. D., & Saada, A. (2011). Screening for active small molecules in mitochondrial complex I deficient patient's fibroblasts, reveals AICAR as the most beneficial compound. PloS one, 6(10), e26883. [CrossRef]
- Pitkänen, S., Feigenbaum, A., Laframboise, R., & Robinson, B. H. (1996). NADH-coenzyme Q reductase (complex I) deficiency: heterogeneity in phenotype and biochemical findings. Journal of inherited metabolic disease, 19(5), 675–686. [CrossRef]
- Palma, F. R., Gantner, B. N., Sakiyama, M. J., Kayzuka, C., Shukla, S., Lacchini, R., Cunniff, B., & Bonini, M. G. (2023). ROS production by mitochondria: function or dysfunction?. Oncogene. [CrossRef]
- Aquilina et al.(2015) .Safety and efficacy of ethoxyquin (6-ethoxy-1,2-dihydro-2,2,4-trimethylquinoline) for all animal species EFSA Journal;13(11):4272. [CrossRef]
- Murphy M. P. (2009). How mitochondria produce reactive oxygen species. The Biochemical journal, 417(1), 1–13. [CrossRef]
Figure 1.
The effect of Ethoxyquin (EQ1) on cell growth, mitochondrial ATP production, and mitochondrial membrane potential. Equal amount of control cells (CONT) cells with mitochondrial C1 (C1), COX (COX) deficiency and with mutated PRKN (PD-P), were seeded in microtiter wells , incubated in ther presence or absence of 1μM Ethoxyquin (EQ1) for 72h where after the following parameters were measured; (A) Growth ratio GAL vs GLU measured by methylene blue staining (MB); (B) Mitochondrial ATP production in permeavbilized cells in the presense of glutamate,malate and ADP was measured by luciferin-luciferase (RLU) normalized to MB (C) Mitochondrial membrane potential (MMP) was calculating ratio of TMRE to MTG relative fluorescence Results are presented as normalized mean ± SEM relative to controls (n=3). #p<0.05 compared to untreated control mean, *p<0.05 compared to the individual cell without additive.
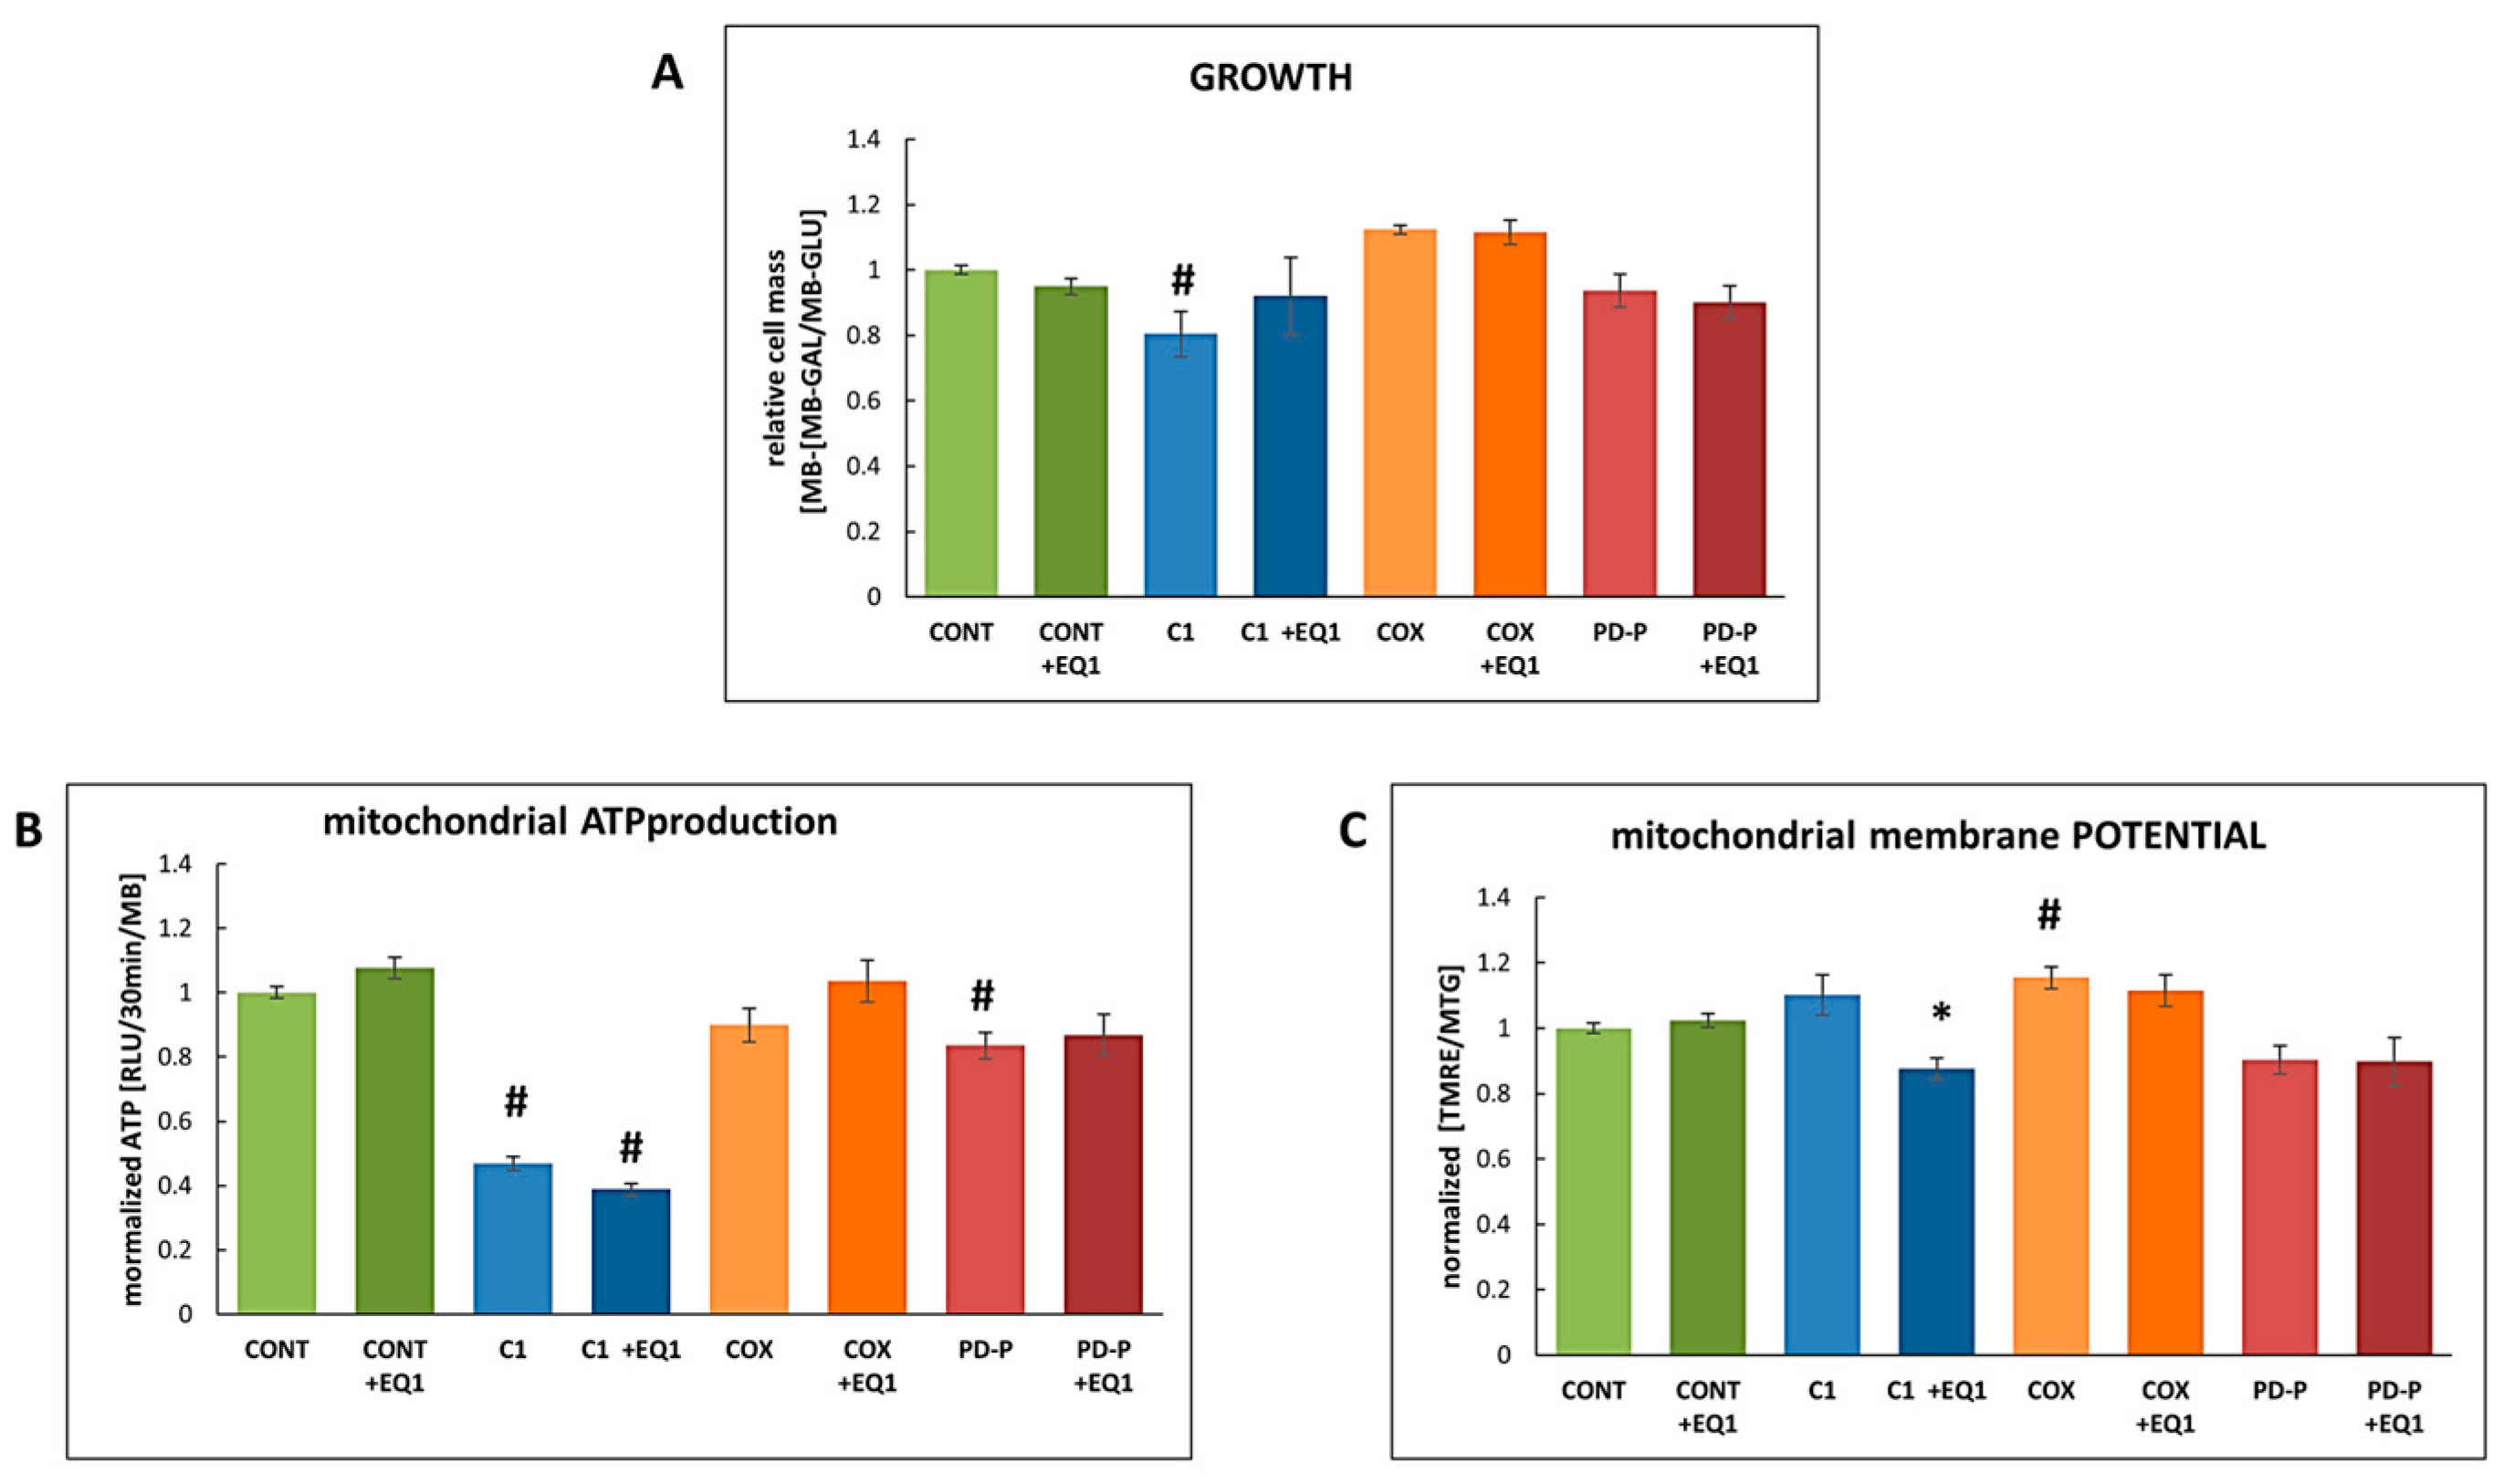
Figure 2.
The effect of Ethoxyquin (EQ1) on Oxygen consumption (OCR) and extracellular acidification (ECAR) rates. Equal amounts of control cells (CONT) cells with mitochondrial C1 (C1), COX (COX) deficiency, and PD with mutated PRKN (PD-P), were seeded on XF96-well, cultivated in the presence or absence of 1μM Ethoxyquin (EQ1) for 72h GLU medium. Subsequently Oxygen consumption (OCR) and extracellular acidification rates (ECAR) was measured in glucose containing XF seahorse medium in an XF Extracellular 96 well Flux Analyzer and normalized to cell content measured by methylene blue (MB).(A) Calculated basal, maximal, ATP-linked OCR and spare capacities. (B) Depictsa reperesntative OCR track with time. (C) Energy map plotted a as basal OCR against the basal extracellular acidification rate. Results are presented as mean ± SEM relative to controls. #p<0.05 compared to untreated control mean, *p<0.05 compared to the individual cell without additive.
Disclaimer/Publisher’s Note: The statements, opinions and data contained in all publications are solely those of the individual author(s) and contributor(s) and not of MDPI and/or the editor(s). MDPI and/or the editor(s) disclaim responsibility for any injury to people or property resulting from any ideas, methods, instructions or products referred to in the content. |
© 2024 by the authors. Licensee MDPI, Basel, Switzerland. This article is an open access article distributed under the terms and conditions of the Creative Commons Attribution (CC BY) license (https://creativecommons.org/licenses/by/4.0/).
Copyright: This open access article is published under a Creative Commons CC BY 4.0 license, which permit the free download, distribution, and reuse, provided that the author and preprint are cited in any reuse.


