

Submitted:
19 January 2024
Posted:
22 January 2024
You are already at the latest version
Abstract
Durum wheat is an important staple food used to obtain several products. At first the wheat is milled to obtain different products: bran, semolina and flour. These products are the base of several artifacts with varying properties both from a nutritional point of view and flavoring characteristics. It is known that most elements concentrate in the outer layers of the wheat seed (pericarp and aleurone) so that the content of the elements vary a lot in the ground products. The present study investigates the characterizing elements of the milled products and the effect of cultivation protocol applied. We measured, by ICP-OES, the concentration of 28 elements in the whole seed and in any grinding products; the results show that only few elements characterize each product. Few elements, but different for each product, permit to disclose the kind of agri-cultural method used: organic or conventional protocol. Five elements: B, Cd, Cu, K, Se, are the most important to distinguish between organic and conventional agriculture by PCA and PLS analysis; these elements also permit some differentiation of products.
Keywords:
cereals
; wheat
; ICP-OES
; spectroscopy
; chemometry
; classification
1. Introduction
Cereals are among the most important staple food crops; they are cheap source of calories, protein and elements for the inhabitants worldwide. Among the cereals, Durum wheat (Triticum durum) is the base of many largely used foods like pasta [1]. Durum wheat production, the tenth most important crop worldwide, has important impact on the economy and the environment, it was assessed [2] that these impacts could improve by organic cultivation practice. The cultivation method affects the final products, but high quality pasta has been obtained from organic wheat, in Southern Italy, using selected varieties of wheat[3]. Foods derived from wheat contribute to the body's need for essential elements, however, when polluted [4], they can contribute significantly to overexposure to some elements. Wheat plants exploit the elements [5] present in the soil for their biological needs but the concentration of these elements and their solubility changes in the different soils making their uptake by the plants more or less favored [6]. The available content of the elements is related to the content of clay [7] as shown for Saskatchewan agricultural soils. Another important source of some elements is both atmospheric [8] and soil pollution [9], furthermore in agricultural practices there is extensive use of substances containing potentially toxic elements for humans. Wheat plants will accumulate the elements, therefore, influenced by the species and based on the different exposure to the aforementioned sources. It is important to understand, since the cereal seeds are used for food purposes, how many and which elements are accumulated in the seeds.
The elemental distribution in the kernel is important because going from the outer to the inner of the seed, during the grinding process, we can obtain bran, semolina and flour that are used for different kind of food products. The knowledge of their elemental affinity can help to produce food of special characteristic or reduce the impact of environmental pollution on the final food products.
The accumulation of the elements in the seed[1] also depends on the plant genotype, the environment, the yearly rain amount.
The correlation between the genotypes of common wheat (Triticum aestivum) cultivated in Cina and the Mineral element concentrations of grain was investigated [10] with the goal of selecting those genotypes having the higher content of Fe and Zn. Brizio et al. studied the correlation of the metals with cereals species in Italy [11] paying attention to micronutrient and toxic elements. A study on French soft-wheat showed a tie between the topsoil characteristics and the content of metals of the common wheat seeds [6]. A comparison of the elements measured in several varieties of bread and durum wheats grown in Turkey [12] showed a high variability of the concentrations.
Geographical traceability of durum wheat was studied combining the elemental analysis with the Sr isotopic ratio in an Italy versus world study [13] and to characterize the Tyrol cereals[14] by 87Sr/86Sr ratio.
Multivariate analysis applies to several food materials in order to easy their authentication and fraud prevention [15], some studies involve cereals for which infrared spectroscopy [16] coupled to calibration methods permit to measure chemical composition (e.g. protein, moisture, oil) but the same spectroscopic techniques combined with pattern recognition and/or discriminant techniques were used for the authentication and traceability of cereals. Some works consider the volatiles substances, chromatographically determined, as the base of the multivariate methods for classification on the base of wheat cultivation area and species [17] or authenticate the Italian pasta [18] or even correlate the characteristics to the cultivation altitude [19]. There are studies in which the chemometric methods are coupled to the measured elemental contents for authentication purpose [20][21].
The present work aims to broaden the knowledge about the content of the elements contained in different products obtained from the milling process of the durum wheat seed. The study includes many varieties cultivated under organic or conventional protocol so we will check if a difference exists, at grinding product level, between these two cultivation protocols. To the goal some chemometric methods will need to analyze the measurements database.
2. Materials and Methods
2.1. The samples
The seeds of different varieties of durum wheat were sampled after their harvesting in July 2022, they were stored in a refrigerator till their grinding. The wheats were cultivated in the experimental fields of the AMAP in Jesi, two fields not far each other devoted one to the organic cultures the other for conventional agricultural procedure. These are clay soils; each field is divided into parcels of 7x1.4 m in each of which a different variety of wheat is grown; every variety is triplicate on three parcels. The seed harvest is carried out by keeping the seeds of each plot divided. The seeds were milled to obtain 4 products of each variety: whole seed, bran, semolina, flour as below detailed. There are some additional samples of seed that were not milled, Table 1 details the samples.
In the following every product sample is coded with the following syntax: CC_ntt where CC is the code indicated in the second column of Table 1, n indicate the agricultural method: 1 means conventional, 2 stands for organic. The two characters tt are absent in codes of seeds while they are: Cr for bran, Se for semolina, Fa for flour.
2.2. Milling
The durum wheat seed samples were conditioned in order to reach 17% humidity by adding water in two stages 16 h and 3 h before grinding. The seeds are then milled with a CD2 Chopin Technologies mill then passed through the Chopin purifier to get three fractions:
flour: ≤ 160 microns
semolina: 160 < semolina ≤ 560 micron
bran: > 560 microns
2.3. Mineralization
The samples of whole seed, bran, semolina and flour were dried in an oven at 60 °C for 24 hours; seeds were washed with ultrapure 18.2 MΩ water from a Milli-Q (Millipore, USA) before drying. About one gram of each dry sample (whole seed, bran, semolina, flour) was added with 8 ml ultrapure HNO3 65% and 2 ml ultrapure HCl 37% then digested by a microwave assisted instrument (ultraWAVE, Milestone Srl, Sorisole (BG), Italy) for 40 minutes. The digested were recovered with ultrapure water and diluted to 50 ml. All the reagents are high purity Merck products for Inductively Coupled Plasma Spectroscopy (ICP).
2.4. ICP analysis
The mineralized solutions were analyzed by a ThermoFisher Scientific iCAP PRO X Duo ICP-OES for the elements in Table 2. Quantification occurred with the use of calibration lines from 0.001 to 10 mg/L, in decadic steps. Calibrations were obtained by means of the Multi Element Standards Ultra Scientific IQC-026 except for P (Sigma Aldrich 207357) and Sn (Merck 43922907). LOD and LOQ were automatically computed from the calibration lines by the instrumental software. Samples outside the calibration range were suitably diluted to fall within the calibration.
Complementary analysis on soil samples were executed as described in the appendix A.
3. Results
Table 2 shows the average, standard deviation and range of each element in the whole of samples (seed, bran, semolina and flour used as a unique set) both considered all together and grouped by cultivation protocol. T-tests were used to compare the mean values of each element in the organic and conventional samples. The elements that test significant are indicated, in the table, with a double asterisk. Similar analysis were performed on each product, the results are summarized in Table 3 for seeds, Table 4 for bran, Table 5 semolina and Table 6 flour.
The elements were measured on four products for each wheat: whole seed, bran, semolina and flour. The Sb has values ≤LOD in 93% of the samples, 97% of them are ≤LOQ. The Tl is not present in semolina and flour (~93% of samples <LOD). Tl has values >LOD in 50% of seed samples and 58% of the bran samples but most of the positive samples have concentration close to LOD. Co was under the detection limit (43%<LOD, 58%<LOQ) especially due to the absence in the most of semolina (96%<LOD) and flour (81%<LOD) samples; most of the organic samples contain a bit less than the conventional ones. Be was not detected on 67% of the whole seed samples but trace of it are present in bran, semolina and flour. B is not detectable in half of the organic semolina (46%<LOD) and in some of the organic flour (~8%<LOD) but it is measurable in organic seeds, bran and even in all conventional samples. Ag, when detectable, has values close to its LOQ; it is present in bran, in some samples of seeds (39% of seeds <LOQ) and in few samples of semolina (43%<LOD) and flour (46%<LOD); this element has no statistically meaningful difference between organic and conventional products. The measurement of V are <LOD in about 15% of bran and semolina samples. All other elements were determined in all the samples. Comparing by a t-test the organic products versus the conventional ones give poor information; most of the elements show no difference, some of them test positively for some product as highlighted in Table 3 to Table 6 where the main parameters are also reported. Ba, Be, Co, Cr, Mn, Ni and Zn that are significantly different in soils (Table A1 in Appendix A) have no difference in the products while V that has significant test in soil has significant difference only in Semolina. The other elements: Al, Cd, Cu, Fe that give significant test for soil have significant difference also in most of the products.
As shown in Table 2 there are low difference between values obtained from organic samples and those from the conventional cultivation. As, in our samples, is a little bit higher than the values reported by Cubadda et other [22]. B content is similar to what measured on Austrian wheats [23] but lower than the measured values on wheat grown in Saskatchewan [7]. The range of values we obtained for Cd, Cu and Zn are similar to those reported for wheats grown in Marche [24].
Table 7, shows the correlation existing between elements within the products. Strong correlations are evaluated for Zn, Mg, Mn, P, K and other elements some of which connected to one or more products.
The comparisons of the content of the various elements reported in Table 2 to Table 6 show that some difference exists between grains grown with conventional or organic cultivation methods. However, the difference of the amount of the elements, also if present, confound with the high variability of the values so that univariate analysis of the data does not permit a clear differentiation both of the materials: seed, bran, semolina and flour neither of the cultivation method: organic and conventional. A multivariate approach, therefore, could simplify the interpretation of the results.
To this goal the measured values were log10 transformed because of the high concentration difference among the elements, then autoscaled before applying PCA, some comparison of data treatment without the logarithmic transform was performed that had similar or worst results. Since Sb and Tl are not present in most of the samples, they were not included in the data treatment.
Figure 1.
Scores projection of the first two components computed on log10 transformed and autoscaled data.
Figure 1.
Scores projection of the first two components computed on log10 transformed and autoscaled data.
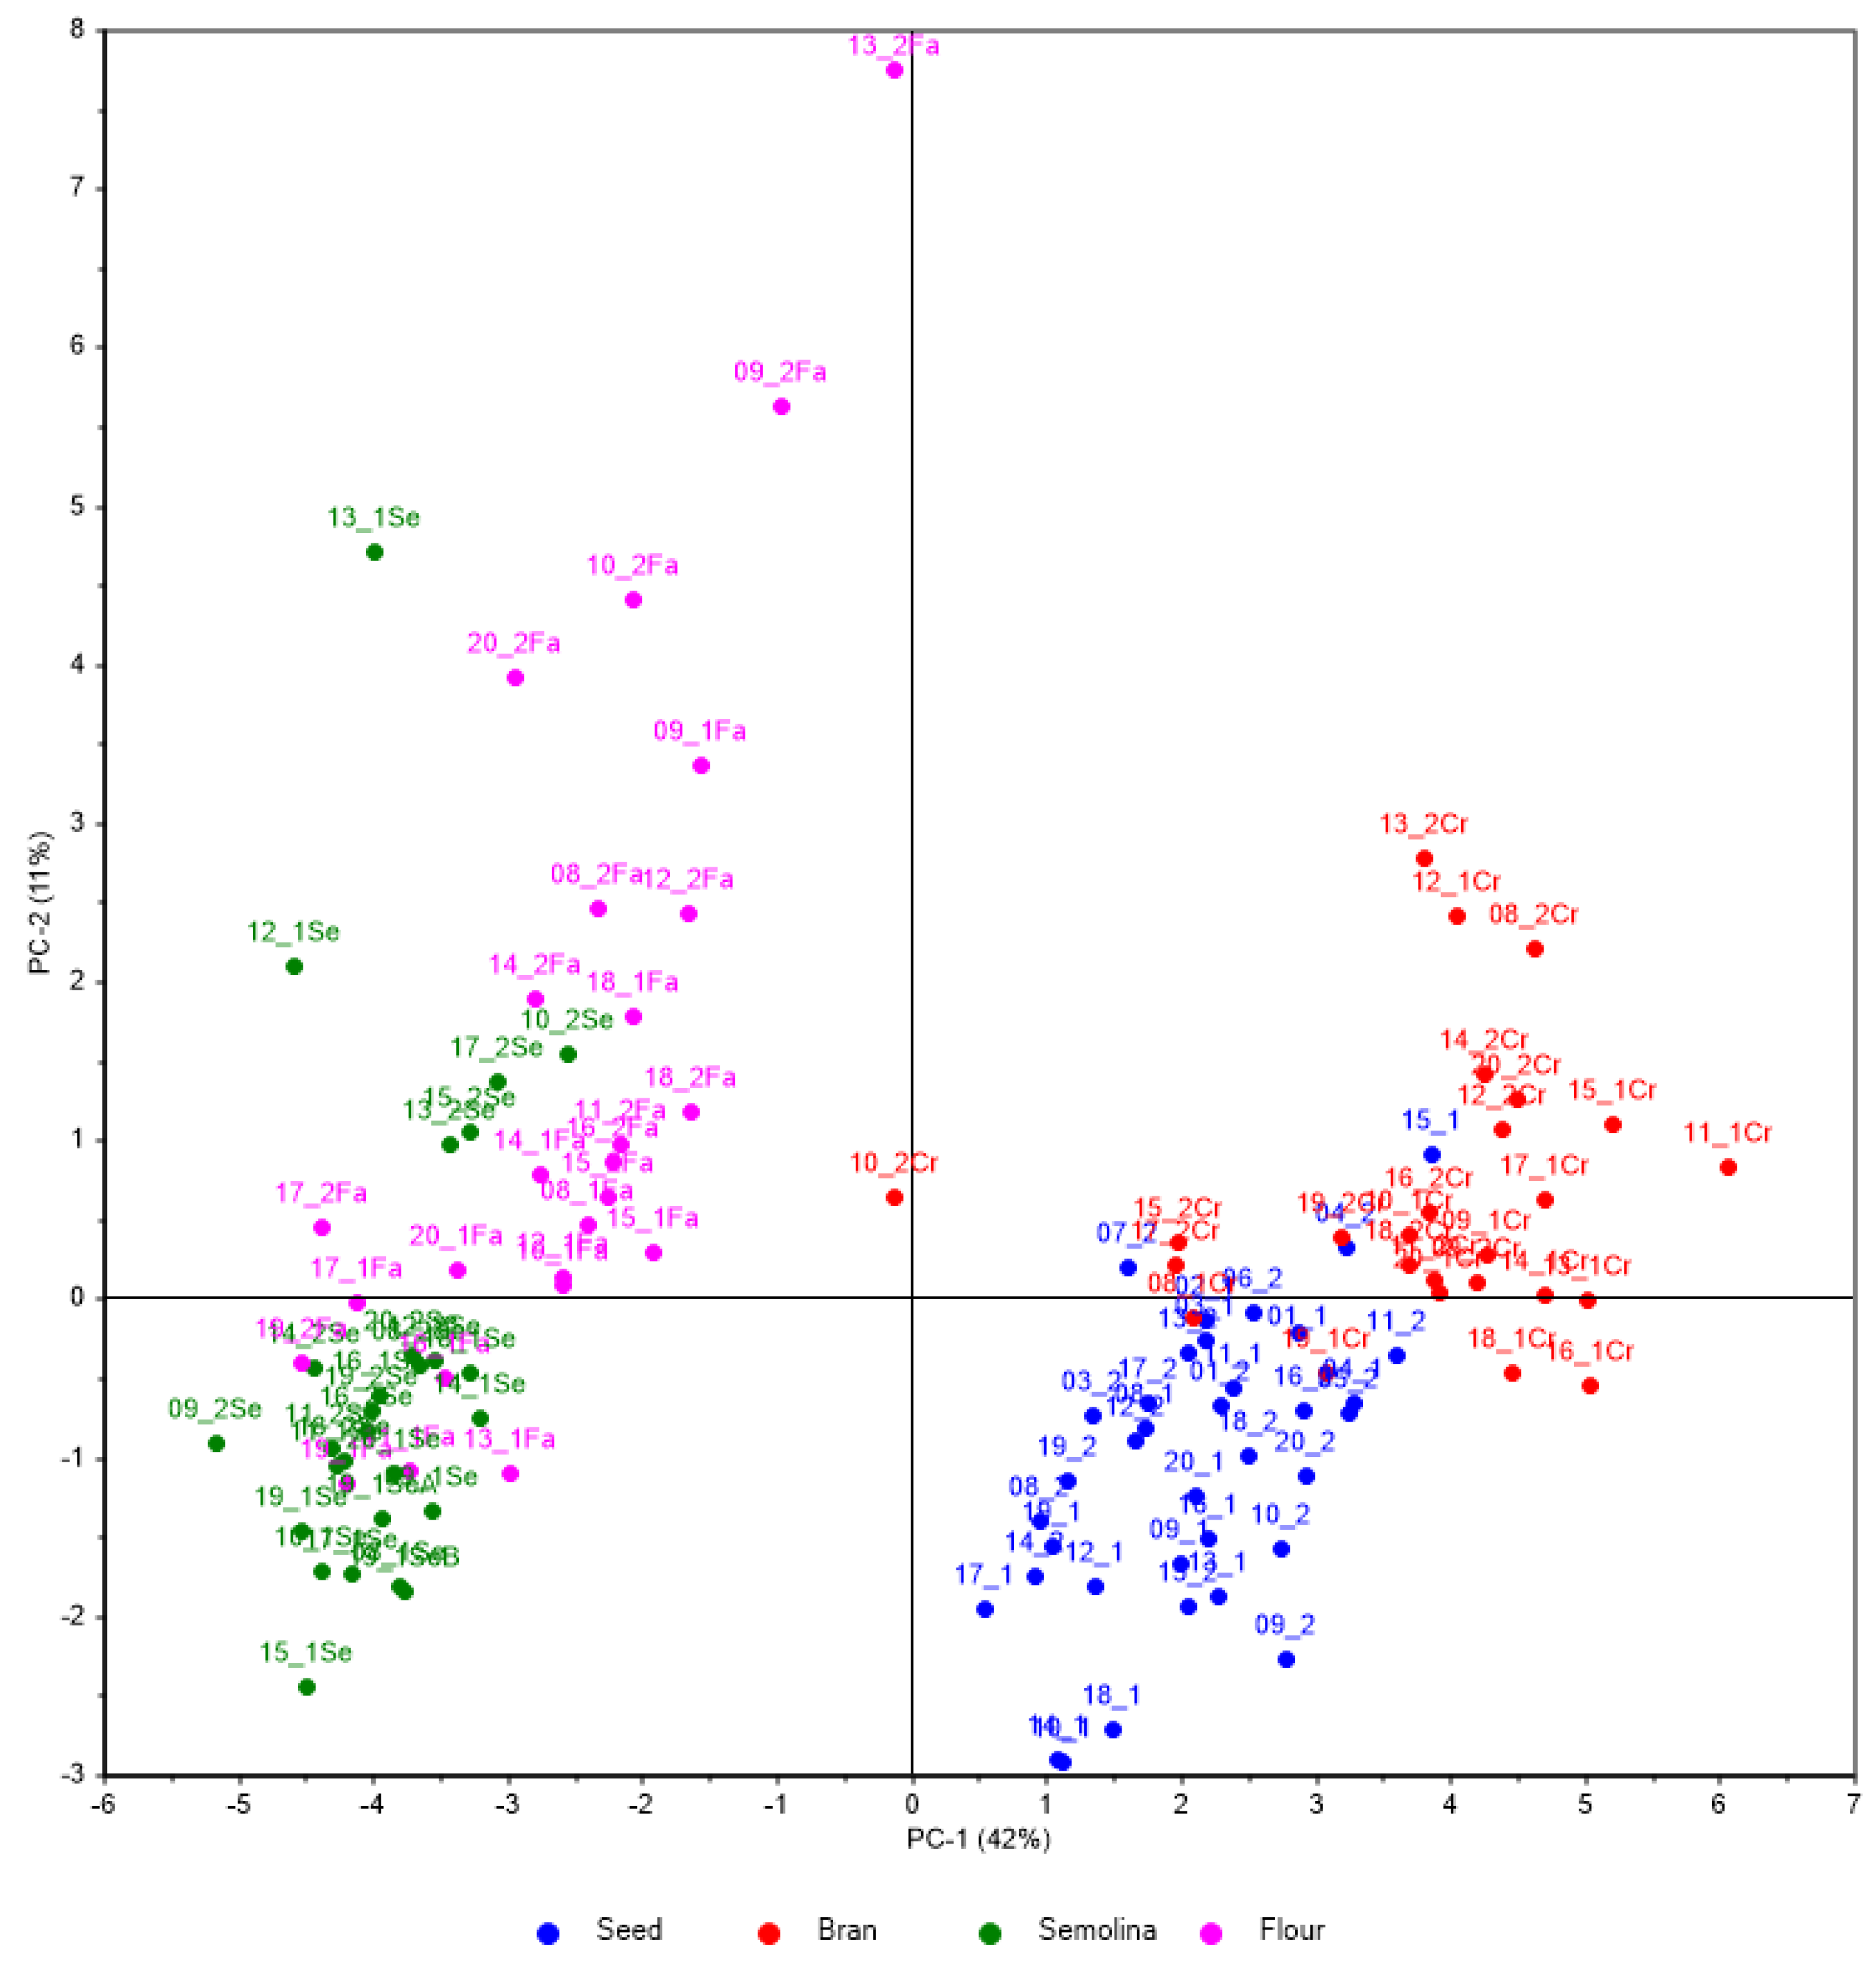
The PCA analysis on the obtained values, even if these are very similar, highlight on the first component the partitioning of two groups due to seed and bran at high values of PC1 and another one for semolina and flour with low values in PC1. With the help of the second PC seed and bran are separated while the distance between semolina and flour is low. We can expect these results because semolina and flour both come from the kernel of the seed and are mainly starch. Bran is the outer layer of the seed where we expect a different elemental content because of the differences in composition with the seed kernel [1]. The PCA evidence that most of the elemental content in bran is very similar to that of the whole seeds, the accumulation of most elements in the bran is widely documented [1].
Figure 2 highlights the cultivation protocol on the same PCA projection of Figure 1. The figure shows that it exists a difference between samples from organic agricultural protocol and those from the conventional method of cultivation. It seems that the difference is more evident in the milled portions: bran, semolina, flour and less evident in the whole seed.
The Unscrambler® X software (version 10.2, CAMO Software, Oslo, Norway), Matlab® (version R2023a, The MathWorks inc.) and Microsoft Office® Excel softwares were used for data treatment.
Classification methods were used to verify the possibility of discriminating between products from conventional and organic cultivations. The trials consider all the product samples as a whole at the beginning and then we analyzed every single product. For each analysis we optimized the variable selection, Table 8 shows the percentage of variance explained (R2) by the PLS model and the analogous value predicted (Q2) with 5 groups cross-validation moreover an X, in the corresponding row of Table 3, marks the selected elements in each dataset necessary to obtain the optimized classification. The accuracy and precision values are evaluated with the classification toolbox for Matlab [25]. The dependent variables, for PLS-DA, are two dummy variables coded, 0 and 1 as usual, to indicate the belonging or not of the samples to the class associated to the focused dummy variable [26]. The analyses used the data matrix where every column contains the concentration values of a different element, every row the concentrations of the elements in a sample. The PLS-DA analysis uses the log transformed and autoscaled values of the element as predictors, but very good results are obtained also with the measured values simply autoscaled.
Analysing the data by PLS-DA we were able to classify well enough the products with respect to the cultivation methods as shown in Table 8.
We performed the selection of the variables with The Unscrambler [27], that apply the Martens’s uncertainty test [28]. Table 8 shows the results of the analysis with the optimized number of variables.
Table 8 highlights that the worst dataset for the classification is that of seeds, especially because it seems to give a less stable model, on the contrary Bran, Semolina and Flour show good differentiation between organic and non; semolina is excellent with its R2 0.91 and Q2 0.89. Both bran and semolina have 100% accuracy and precision while in flour the accuracy in prediction in 96%; in this last case the use of the data without log transform has a worst classification ability. Considering all the samples together an average result is obtained anyway good. Most data treatments need one latent variable for the classification model; only some needs two or more. Comparable discrimination results take place using other discriminant methods. Few elements contribute to the discrimination, but they vary on the base of the product, only B, Cd and Se were always retained, they are enough to differentiate flour with good accuracy and precision and similarly when all the samples are treated together. Cu is always selected except in flour with log transformation.

Table 8.
Comparison of PLS-DA applied on different sets. Precision and accuracy[29] were evaluated by classification toolbox class_gui. The model Row details the pretreatment applied and the elements used in the model. Precision and accuracy were always reported for the two groups, that of conventional samples and that of organic samples. Prediction parameters were estimated by cross-validation.
Table 8.
Comparison of PLS-DA applied on different sets. Precision and accuracy[29] were evaluated by classification toolbox class_gui. The model Row details the pretreatment applied and the elements used in the model. Precision and accuracy were always reported for the two groups, that of conventional samples and that of organic samples. Prediction parameters were estimated by cross-validation.
| All samples together | All samples together | Seed | Seed | Bran | Bran | Semolina | Semolina | Flour | Flour | Flour | Flour | |
| model | Log10 transform, autoscaled Elements: B, Cd, Cu, Fe, Se |
autoscaled Elements: B, Cd, Cu, Se, Si |
Log10 transform, autoscaled Elements: B, Cd, Cu, Fe, Mg, Se |
autoscaled Elements: B, Cd, Cu, Fe, Mg, Se |
Log10 transform, autoscaled Elements: B, Cd, Co, Cu, Fe, K, Na, Pb, Se, Sn |
autoscaled Elements: B, Cd, Co, Cu, Fe, K, Mo, Na, P, Pb, Se, Si, Sn |
Log10 transform, autoscaled Elements: Ag, B, Cd, Cu, K, Se, Si |
autoscaled Elements: Ag, B, Cd, Cu, K, Se |
Log10 transform, autoscaled Elements: B, K, Se |
Log10 transform, autoscaled Elements: Al, B, Cd, Cr, Fe, K, Se, Si, V |
autoscaled Elements: B, K, Se |
autoscaled Elements: Al, B, Cd, Co, Cr, Cu, Fe, K, Na, Se, Si, V |
| Number of elements | 5 | 5 | 6 | 6 | 10 | 13 | 7 | 6 | 3 | 9 | 3 | 12 |
| Number of LV (computed; optimal) | 4; 4 | 3; 2 | 2; 1 | 6; 1 | 3; 2 | 2; 2 | 2; 1 | 2; 1 | 3; 1 | 3; 2 | 3; 1 | 12; 1 |
| R2 | 0.78 | 0.74 | 0.62 | 0.63 | 0.89 | 0.91 | 0.91 | 0.89 | 0.80 | 0.84 | 0.81 | 0.79 |
| Q2 | 0.76 | 0.72 | 0.59 | 0.59 | 0.83 | 0.86 | 0.89 | 0.87 | 0.73 | 0.71 | 0.75 | 0.75 |
| Precision (conve; org) | 0.98; 0.97 | 0.93; 0.93 | 1;0.95 | 1; 0.95 | 1; 1 | 1; 1 | 1; 1 | 1; 1 | 0.92; 0.92 | 1; 1 | 0.92; 0.92 | 1; 1 |
| Accuracy | 0.97 | 0.93 | 0.97 | 0.97 | 1 | 1 | 1 | 1 | 0.92 | 1 | 0.92 | 1 |
| Pred. Precision (Conv; org) | 0.96; 0.95 | 0.93; 0.92 | 0.88; 0.89 | 0.88; 0.85 | 1; 1 | 1; 1 | 1; 1 | 1; 1 | 0.85; 0.95 | 1; 0.93 | 0.92; 0.92 | 0.93; 1 |
| Pred. accuracy | 096 | 092 | 0.89 | 0.86 | 1 | 1 | 1 | 1 | 0.85 | 0.96 | 0.92 | 0.96 |
| Ag | X | X | ||||||||||
| Al | X | X | X | |||||||||
| B | X | X | X | X | X | X | X | X | X | X | X | X |
| Cd | X | X | X | X | X | X | X | X | X | X | ||
| Co | X | X | X | |||||||||
| Cr | X | X | X | |||||||||
| Cu | X | X | X | X | X | X | X | X | X | |||
| Fe | X | X | X | X | X | X | X | X | ||||
| K | X | X | X | X | X | X | X | X | ||||
| Mg | X | X | ||||||||||
| Mo | X | |||||||||||
| Na | X | X | X | |||||||||
| P | X | |||||||||||
| Pb | X | X | ||||||||||
| Se | X | X | X | X | X | X | X | X | X | X | X | X |
| Si | X | X | X | X | X | |||||||
| Sn | X | X | ||||||||||
| V | X | X | X |
Some elements: As, Ba, Be, Ca, Mn, Ni, Ti and Zn never entered the selected variables, that indicate they are unaffected by the cultivation method, moreover Sb and Tl didn’t take part of the analysis as previously written. Mg is selected only when we analyze the seeds without log transform while V and Al enter the selected variables only with flour if treated without log transform also Si enter the group in this condition, but it is selected even when all the samples untransformed are analyzed. The selection of Ag happens only treating semolina without transform. Co, Na, Pb, Sn are tied to bran with the addition of Mo and P if only autoscaling is applied. K is important in all the grinded products.
Few elements, B, Cd, Cu, K, Se are the most meaningful, permit to differentiate the products on the base of the cultivation protocol. PCA with these five elements also reveal a good grouping on the base of the products. Even if the metals are more abundant in the outer layer (pericarp and aleurone) of the seed [30] some are differently absorbed in the kernel of the seed so that it is possible to discriminate even semolina and flour for the cultivation protocol. The large difference of elemental content due to the phenotypes does not affect the discrimination ability with respect to the kind of cultivation protocol.
4. Discussion
The present study focuses on the possibility to recognize, by means of simple analysis and multivariate treatment, the cultivation protocol used for the wheats under investigation. The study used several varieties of wheats cultivated under controlled conditions in a restricted experimental area, this means that some sources of variability are not considered as the season effect, humidity, soils. The study develops a method for protecting foodstuff, but it needs further validation with wide database including the variability sources here not considered.
5. Conclusions
ICP-OES instrumentation is largely available in the analytical laboratory permitting cheap measurements that, despite the sensitivity of the technique, are useful for advanced data treatment.
This study is devoted to characterize the elemental content of milled products of durum wheats grown in Italy. The elemental measurements are also used to verify the possibility of discriminating the ground product of durum wheat versus the cultivation protocol of the cereal. This work permits to define a data treatment methodology for obtaining the discrimination; the results are very good especially for semolina and bran but even flour can be classified with optimal precision and very high accuracy.
An important result is that the discriminations are due to few elements, three at minimum but even the products that need a few more elements can be classified with a lower number of them if we accept a little bit worse classification; in this context B, Cd, Cu, K and Se are the most effective elements.
Author Contributions
Conceptualization, P. C. and M. B.; methodology, P. C., M. F.; software, P. C.; validation, R. E. R., F. L. and M. F.; formal analysis, P. C. and M. F.; investigation, S. N., C. G., R. E. R., F. L. and M. F.; resources, M. F., P. C.; F. L. and R. E. R.; data curation, P. C., F. L. and M. F.; writing—original draft preparation, P. C.; F. L. and M. F.; writing—review and editing, M. B., S. Z., P. C.,S. N., C. G., R. E. R.; visualization, F. L., P. C.; R. E. R. and M. F.; supervision, M. B.; project administration, S. Z.; funding acquisition, M. B., S. Z. All authors have read and agreed to the published version of the manuscript.
Funding
This research received no external funding.
Data Availability Statement
Data is contained within the article.
Conflicts of Interest
The authors declare no conflicts of interest.
Appendix
Soils were randomly sampled during the year obtaining 40 samples of which 16 from conventional and 24 from organic cultivated parcels. Their pH is about 8.0, table a1 shows the values of the elements measured on these soil samples. The mineralization and quantification procedure adopted was the same as the one previously described.
It is remarkable the very low content, less than LOD, of Ag, Sb and Se in the soil, even Tl is minimally present. Relatively high values of Al, Cr, Fe, Cu can be due to some pollution because of the closeness of the field both to railway tracks and mechanical industrial plants. The basic pH can prevent the high amount of Al and Mn from carrying out their toxic effect on wheat plants [31][32]. Comparison, by means of monovariate t-test, of organic and conventional soils shows meaningful difference, at 0.05 significance level, for: Ba, Be, Cd, Cr, Cu, Fe, Mn, Ni, V and Zn.
Table A1.
soil elemental content. (**) indicates the elements that give a significant t-test comparison (α=0.05) between the average values of soil samples for organic cultivation and those for conventional cultivation.
Table A1.
soil elemental content. (**) indicates the elements that give a significant t-test comparison (α=0.05) between the average values of soil samples for organic cultivation and those for conventional cultivation.
| All soil samples | Soils from organic cultivation | Soils from conventional cultivation | ||||||
|---|---|---|---|---|---|---|---|---|
| LOD mg/Kg | LOQ mg/Kg | min-max mg/Kg | Median ± std mg/Kg | min-max mg/Kg | median+std mg/Kg | min-max mg/Kg | median+std mg/Kg | |
| Ag | 4E-4 | 0.001 | LOQ - LOQ | LOQ ± 0.000 | LOQ - LOQ | LOQ ± 0.000 | LOQ - LOQ | LOQ ± 0.000 |
| Al (**) | 0.001 | 0.003 | 1488.550 - 4140.450 | 1888.480 ± 670.361 | 1488.550 - 4140.450 | 1937.785 ± 778.174 | 0.0 - 3189.510 | 1841.800 ± 466.345 |
| As | 0.001 | 0.004 | 1.000 - 3.343 | 2.363 ± 0.612 | 1.366 - 3.073 | 2.337 ± 0.536 | 0.0 - 3.343 | 2.483 ± 0.701 |
| B | 0.830 | 2.767 | 66.027 - 144.156 | 88.371 ± 18.454 | 66.027 - 125.625 | 82.289 ± 17.341 | 0.0 - 144.156 | 93.565 ± 18.515 |
| Ba (**) | 8E-5 | 3E-4 | 140.287 - 233.653 | 190.821 ± 21.746 | 140.287 - 228.053 | 180.543 ± 22.576 | 0.0 - 233.653 | 195.709 ± 17.175 |
| Be (**) | 3E-5 | 1E-4 | 1.249 - 2.093 | 1.728 ± 0.236 | 1.249 - 2.003 | 1.500 ± 0.198 | 0.0 - 2.093 | 1.898 ± 0.144 |
| Ca | 0.009 | 0.029 | 2231.142 - 2993.378 | 2390.573 ± 176.779 | 2231.142 - 2993.378 | 2402.166 ± 185.982 | 0.0 - 2840.278 | 2375.122 ± 167.641 |
| Cd(**) | 2E-4 | 6E-4 | 0.132 - 0.304 | 0.224 ± 0.041 | 0.167 - 0.304 | 0.228 ± 0.033 | 0.0 - 0.291 | 0.205 ± 0.047 |
| Cr(**) | 4E-4 | 0.001 | 53.245 - 96.209 | 77.855 ± 11.511 | 53.245 - 93.176 | 67.709 ± 10.415 | 0.0 - 96.209 | 86.225 ± 6.785 |
| Cu(**) | 4E-4 | 0.001 | 26.933 - 48.164 | 35.741 ± 4.645 | 26.933 - 41.021 | 33.282 ± 3.543 | 0.0 - 48.164 | 39.052 ± 4.470 |
| Fe(**) | 2E-4 | 6E-4 | 13698.050 - 21144.190 | 17175.520 ± 2128.555 | 13698.050 - 20820.220 | 16656.250 ± 1924.222 | 0.0 - 21144.190 | 18653.635 ± 1596.296 |
| K | 2E-4 | 8E-4 | 755.832 - 1222.931 | 952.072 ± 85.755 | 755.832 - 1118.040 | 946.518 ± 67.215 | 0.0 - 1222.931 | 982.099 ± 105.488 |
| Mg | 0.001 | 0.005 | 1990.411 - 2677.165 | 2234.520 ± 175.033 | 1990.411 - 2612.228 | 2191.945 ± 175.439 | 0.0 - 2677.165 | 2255.959 ± 170.404 |
| Mn (**) | 5E-5 | 2E-4 | 693.361 - 1277.959 | 906.261 ± 147.022 | 693.361 - 1277.959 | 829.216 ± 162.902 | 0.0 - 1147.556 | 1010.177 ± 84.972 |
| Mo | 6E-4 | 0.002 | 0.660 - 5.678 | 0.932 ± 1.012 | 0.660 - 5.678 | 0.882 ± 1.058 | 0.0 - 4.693 | 1.036 ± 0.968 |
| Na | 0.001 | 0.004 | 334.815 - 802.104 | 517.985 ± 95.093 | 456.723 - 712.040 | 506.350 ± 74.249 | 0.0 - 802.104 | 538.205 ± 121.713 |
| Ni (**) | 5E-4 | 0.002 | 39.274 - 76.972 | 52.226 ± 10.004 | 39.274 - 76.972 | 46.123 ± 9.669 | 0.0 - 74.643 | 59.991 ± 6.668 |
| P | 0.004 | 0.012 | 98.932 - 871.575 | 711.963 ± 159.183 | 103.282 - 871.575 | 735.635 ± 146.974 | 0.0 - 786.637 | 664.361 ± 167.303 |
| Pb | 7E-4 | 0.002 | 13.623 - 43.143 | 18.716 ± 4.417 | 13.623 - 43.143 | 17.615 ± 5.504 | 0.0 - 23.817 | 19.788 ± 1.959 |
| Sb | 0.003 | 0.010 | LOQ - LOQ | LOQ ± 0.001 | LOQ - LOQ | LOQ ± 0.001 | LOQ - LOQ | LOQ ± 0.001 |
| Se | 0.003 | 0.010 | LOQ - LOQ | LOQ ± 0.001 | LOQ - LOQ | LOQ ± 0.001 | LOQ - LOQ | LOQ ± 0.001 |
| Si | 0.018 | 0.060 | 197.230 - 2826.853 | 606.368 ± 830.102 | 218.109 - 2588.145 | 611.525 ± 796.059 | 0.0 - 2826.853 | 606.368 ± 902.656 |
| Sn | 0.007 | 0.023 | 0.962 - 655.190 | 2.133 ± 136.265 | 1.161 - 655.190 | 2.133 ± 133.045 | 0.0 - 584.401 | 2.365 ± 145.189 |
| Tl | 0.001 | 0.003 | LOQ - 1.239 | 0.529 ± 0.338 | LOQ - 1.239 | 0.488 ± 0.361 | LOQ - 0.890 | 0.600 ± 0.307 |
| V(**) | 2E-4 | 5E-4 | 42.138 - 76.322 | 58.994 ± 6.575 | 42.138 - 63.256 | 54.908 ± 5.130 | 0.0 - 76.322 | 62.949 ± 5.165 |
| Zn(**) | 7E-5 | 2E-4 | 64.296 - 96.585 | 79.922 ± 9.031 | 64.296 - 94.897 | 75.560 ± 8.185 | 0.0 - 96.585 | 86.713 ± 6.163 |
References
- Durum Wheat Chemistry and Technology; Sissons, M., Abecassis, J., Marchylo, B., Carcea, M., Eds.; second.; AACC International, 2012; ISBN 978-1-891127-65-6.
- Bux, C.; Lombardi, M.; Varese, E.; Amicarelli, V. Economic and Environmental Assessment of Conventional versus Organic Durum Wheat Production in Southern Italy. Sustainability (Switzerland) 2022, 14. [Google Scholar] [CrossRef]
- Fagnano, M.; Fiorentino, N.; D’Egidio, M.G.; Quaranta, F.; Ritieni, A.; Ferracane, R.; Raimondi, G. Durum Wheat in Conventional and Organic Farming: Yield Amount and Pasta Quality in Southern Italy. The Scientific World Journal 2012, 2012. [Google Scholar] [CrossRef]
- Vergine, M.; Aprile, A.; Sabella, E.; Genga, A.; Siciliano, M.; Rampino, P.; Lenucci, M.S.; Luvisi, A.; Bellis, L. De Cadmium Concentration in Grains of Durum Wheat ( Triticum Turgidum L. Subsp. Durum ). J Agric Food Chem 2017, 65, 6240–6246. [Google Scholar] [CrossRef] [PubMed]
- Kovarikova, M.; Tomaskova, I.; Soudek, P. Rare Earth Elements in Plants. Biol Plant 2019, 63, 20–32. [Google Scholar] [CrossRef]
- Baize, D.; Bellanger, L.; Tomassone, R. Relationships between Concentrations of Trace Metals in Wheat Grains and Soil. Agron Sustain Dev 2009, 29, 297–312. [Google Scholar] [CrossRef]
- Mermut, A.R.; Jain, J.C.; Song, L.; Kerrich, R.; Kozak, L.; Jana, S. Trace Element Concentrations of Selected Soils and Fertilizers in Saskatchewan, Canada. J Environ Qual 1996, 25, 845–853. [Google Scholar] [CrossRef]
- Ma, C.; Liu, F.; Jin, K.; Hu, B.; Wei, M.; Zhao, J.; Zhang, H.; Zhang, K. Effects of Atmospheric Fallout on Lead Contamination of Wheat Tissues Based on Stable Isotope Ratios. Bull Environ Contam Toxicol 2019, 103, 676–682. [Google Scholar] [CrossRef] [PubMed]
- Rai, P.K.; Lee, S.S.; Zhang, M.; Tsang, Y.F.; Kim, K.-H. Heavy Metals in Food Crops: Health Risks, Fate, Mechanisms, and Management. Environ Int 2019, 125, 365–385. [Google Scholar] [CrossRef] [PubMed]
- Zhang, Y.; Song, Q.; Yan, J.; Tang, J.; Zhao, R.; Zhang, Y.; He, Z.; Zou, C.; Ortiz-Monasterio, I. Mineral Element Concentrations in Grains of Chinese Wheat Cultivars. Euphytica 2010, 174, 303–313. [Google Scholar] [CrossRef]
- Brizio, P.; Benedetto, A.; Squadrone, S.; Curcio, A.; Pellegrino, M.; Ferrero, M.; Abete, M.C. Heavy Metals and Essential Elements in Italian Cereals. Food Additives & Contaminants: Part B 2016, 9, 261–267. [Google Scholar] [CrossRef]
- Harmankaya, M.; Özcan, M.M.; Gezgin, S. Variation of Heavy Metal and Micro and Macro Element Concentrations of Bread and Durum Wheats and Their Relationship in Grain of Turkish Wheat Cultivars. Environ Monit Assess 2012, 184, 5511–5521. [Google Scholar] [CrossRef] [PubMed]
- Monti, C.; Cavanna, D.; Rodushkin, I.; Monti, A.; Leporati, A.; Suman, M. Determining the Geographical Origin of Durum Wheat Samples by Combining Strontium Isotope Ratio and Multielemental Analyses. Cereal Chem 2023, 100. [Google Scholar] [CrossRef]
- Bacher, F.; Aguzzoni, A.; Chizzali, S.; Pignotti, E.; Puntscher, H.; Zignale, P.; Voto, G.; Tagliavini, M.; Tirler, W.; Robatscher, P. Geographic Tracing of Cereals from South Tyrol (Italy) and Neighboring Regions via 87Sr/86Sr Isotope Analysis. Food Chem 2023, 405, 134890. [Google Scholar] [CrossRef] [PubMed]
- Chemometrics in Food Chemistry; Marini, F., Ed.; 1st Edition.; Elsevier: AMSTERDAM • BOSTON • HEIDELBERG • LONDON • NEW YORK • OXFORD PARIS • SAN DIEGO • SAN FRANCISCO • SYDNEY • TOKYO, 2013; Vol. 28; ISBN 978-0-444-59528-7.
- Cozzolino, D. An Overview of the Use of Infrared Spectroscopy and Chemometrics in Authenticity and Traceability of Cereals. Food Research International 2014, 60, 262–265. [Google Scholar] [CrossRef]
- De Flaviis, R.; Sacchetti, G.; Mastrocola, D. Wheat Classification According to Its Origin by an Implemented Volatile Organic Compounds Analysis. Food Chem 2021, 341, 128217. [Google Scholar] [CrossRef] [PubMed]
- Cervellieri, S.; Lippolis, V.; Mancini, E.; Pascale, M.; Logrieco, A.F.; De Girolamo, A. Mass Spectrometry-Based Electronic Nose to Authenticate 100% Italian Durum Wheat Pasta and Characterization of Volatile Compounds. Food Chem 2022, 383, 132548. [Google Scholar] [CrossRef]
- De Flaviis, R.; Mutarutwa, D.; Sacchetti, G.; Mastrocola, D. Quantitatively Unravelling the Effect of Altitude of Cultivation on the Volatiles Fingerprint of Wheat by a Chemometric Approach. Food Chem 2022, 370, 131296. [Google Scholar] [CrossRef]
- Giorgia Potortì, A.; Francesco Mottese, A.; Rita Fede, M.; Sabatino, G.; Dugo, G.; Lo Turco, V.; Costa, R.; Caridi, F.; Di Bella, M.; Di Bella, G. Multielement and Chemometric Analysis for the Traceability of the Pachino Protected Geographical Indication (PGI) Cherry Tomatoes. Food Chem 2022, 386, 132746. [Google Scholar] [CrossRef]
- Ruggiero, L.; Fontanella, M.C.; Amalfitano, C.; Beone, G.M.; Adamo, P. Provenance Discrimination of Sorrento Lemon with Protected Geographical Indication (PGI) by Multi-Elemental Fingerprinting. Food Chem 2021, 362, 130168. [Google Scholar] [CrossRef]
- Cubadda, F.; Baldini, M.; Carcea, M.; Pasqui, L.A.; Raggi, A.; Stacchini, P. Influence of Laboratory Homogenization Procedures on Trace Element Content of Food Samples: An ICP-MS Study on Soft and Durum Wheat. Food Addit Contam 2001, 18, 778–787. [Google Scholar] [CrossRef]
- Spiegel, H.; Sager, M.; Oberforster, M.; Mechtler, K.; Stüger, H.P.; Baumgarten, A. Nutritionally Relevant Elements in Staple Foods: Influence of Arable Site versus Choice of Variety. Environ Geochem Health 2009, 31, 549–560. [Google Scholar] [CrossRef] [PubMed]
- Conti, M.E.; Cubadda, F.; Carcea, M. Trace Metals in Soft and Durum Wheat from Italy. Food Addit Contam 2000, 17, 45–53. [Google Scholar] [CrossRef] [PubMed]
- Ballabio, D.; Consonni, V. Classification Tools in Chemistry. Part 1: Linear Models. PLS-DA. Analytical Methods 2013, 5, 3790. [Google Scholar] [CrossRef]
- Stocchero, M.; De Nardi, M.; Scarpa, B. PLS for Classification. Chemometrics and Intelligent Laboratory Systems 2021, 216, 104374. [Google Scholar] [CrossRef]
- CAMO Software Unscrambler® X.
- Martens, H.; Martens, M. Modified Jack-Knife Estimation of Parameter Uncertainty in Bilinear Modelling by Partial Least Squares Regression (PLSR). Food Qual Prefer 2000, 11, 5–16. [Google Scholar] [CrossRef]
- Ballabio, D.; Grisoni, F.; Todeschini, R. Multivariate Comparison of Classification Performance Measures. Chemometrics and Intelligent Laboratory Systems 2018, 174, 33–44. [Google Scholar] [CrossRef]
- Ficco, D.B.M.; Beleggia, R.; Pecorella, I.; Giovanniello, V.; Frenda, A.S.; Vita, P. De Relationship between Seed Morphological Traits and Ash and Mineral Distribution along the Kernel Using Debranning in Durum Wheats from Different Geographic Sites. Foods 2020, 9, 1523. [Google Scholar] [CrossRef]
- Foy, C.D. Physiological Effects of Hydrogen, Aluminum, and Manganese Toxicities in Acid Soil. In Agronomy Monographs; American Society of Agronomy, Crop Science Society of America, Soil Science Society of America, 2015; pp. 57–97.
- Khabaz-Saberi, H.; Rengel, Z. Aluminum, Manganese, and Iron Tolerance Improves Performance of Wheat Genotypes in Waterlogged Acidic Soils. Journal of Plant Nutrition and Soil Science 2010, 173, 461–468. [Google Scholar] [CrossRef]
Figure 2.
Scores projection of the first two components computed on log10 transformed and autoscaled data, colors highlight the cultivation methods.
Figure 2.
Scores projection of the first two components computed on log10 transformed and autoscaled data, colors highlight the cultivation methods.
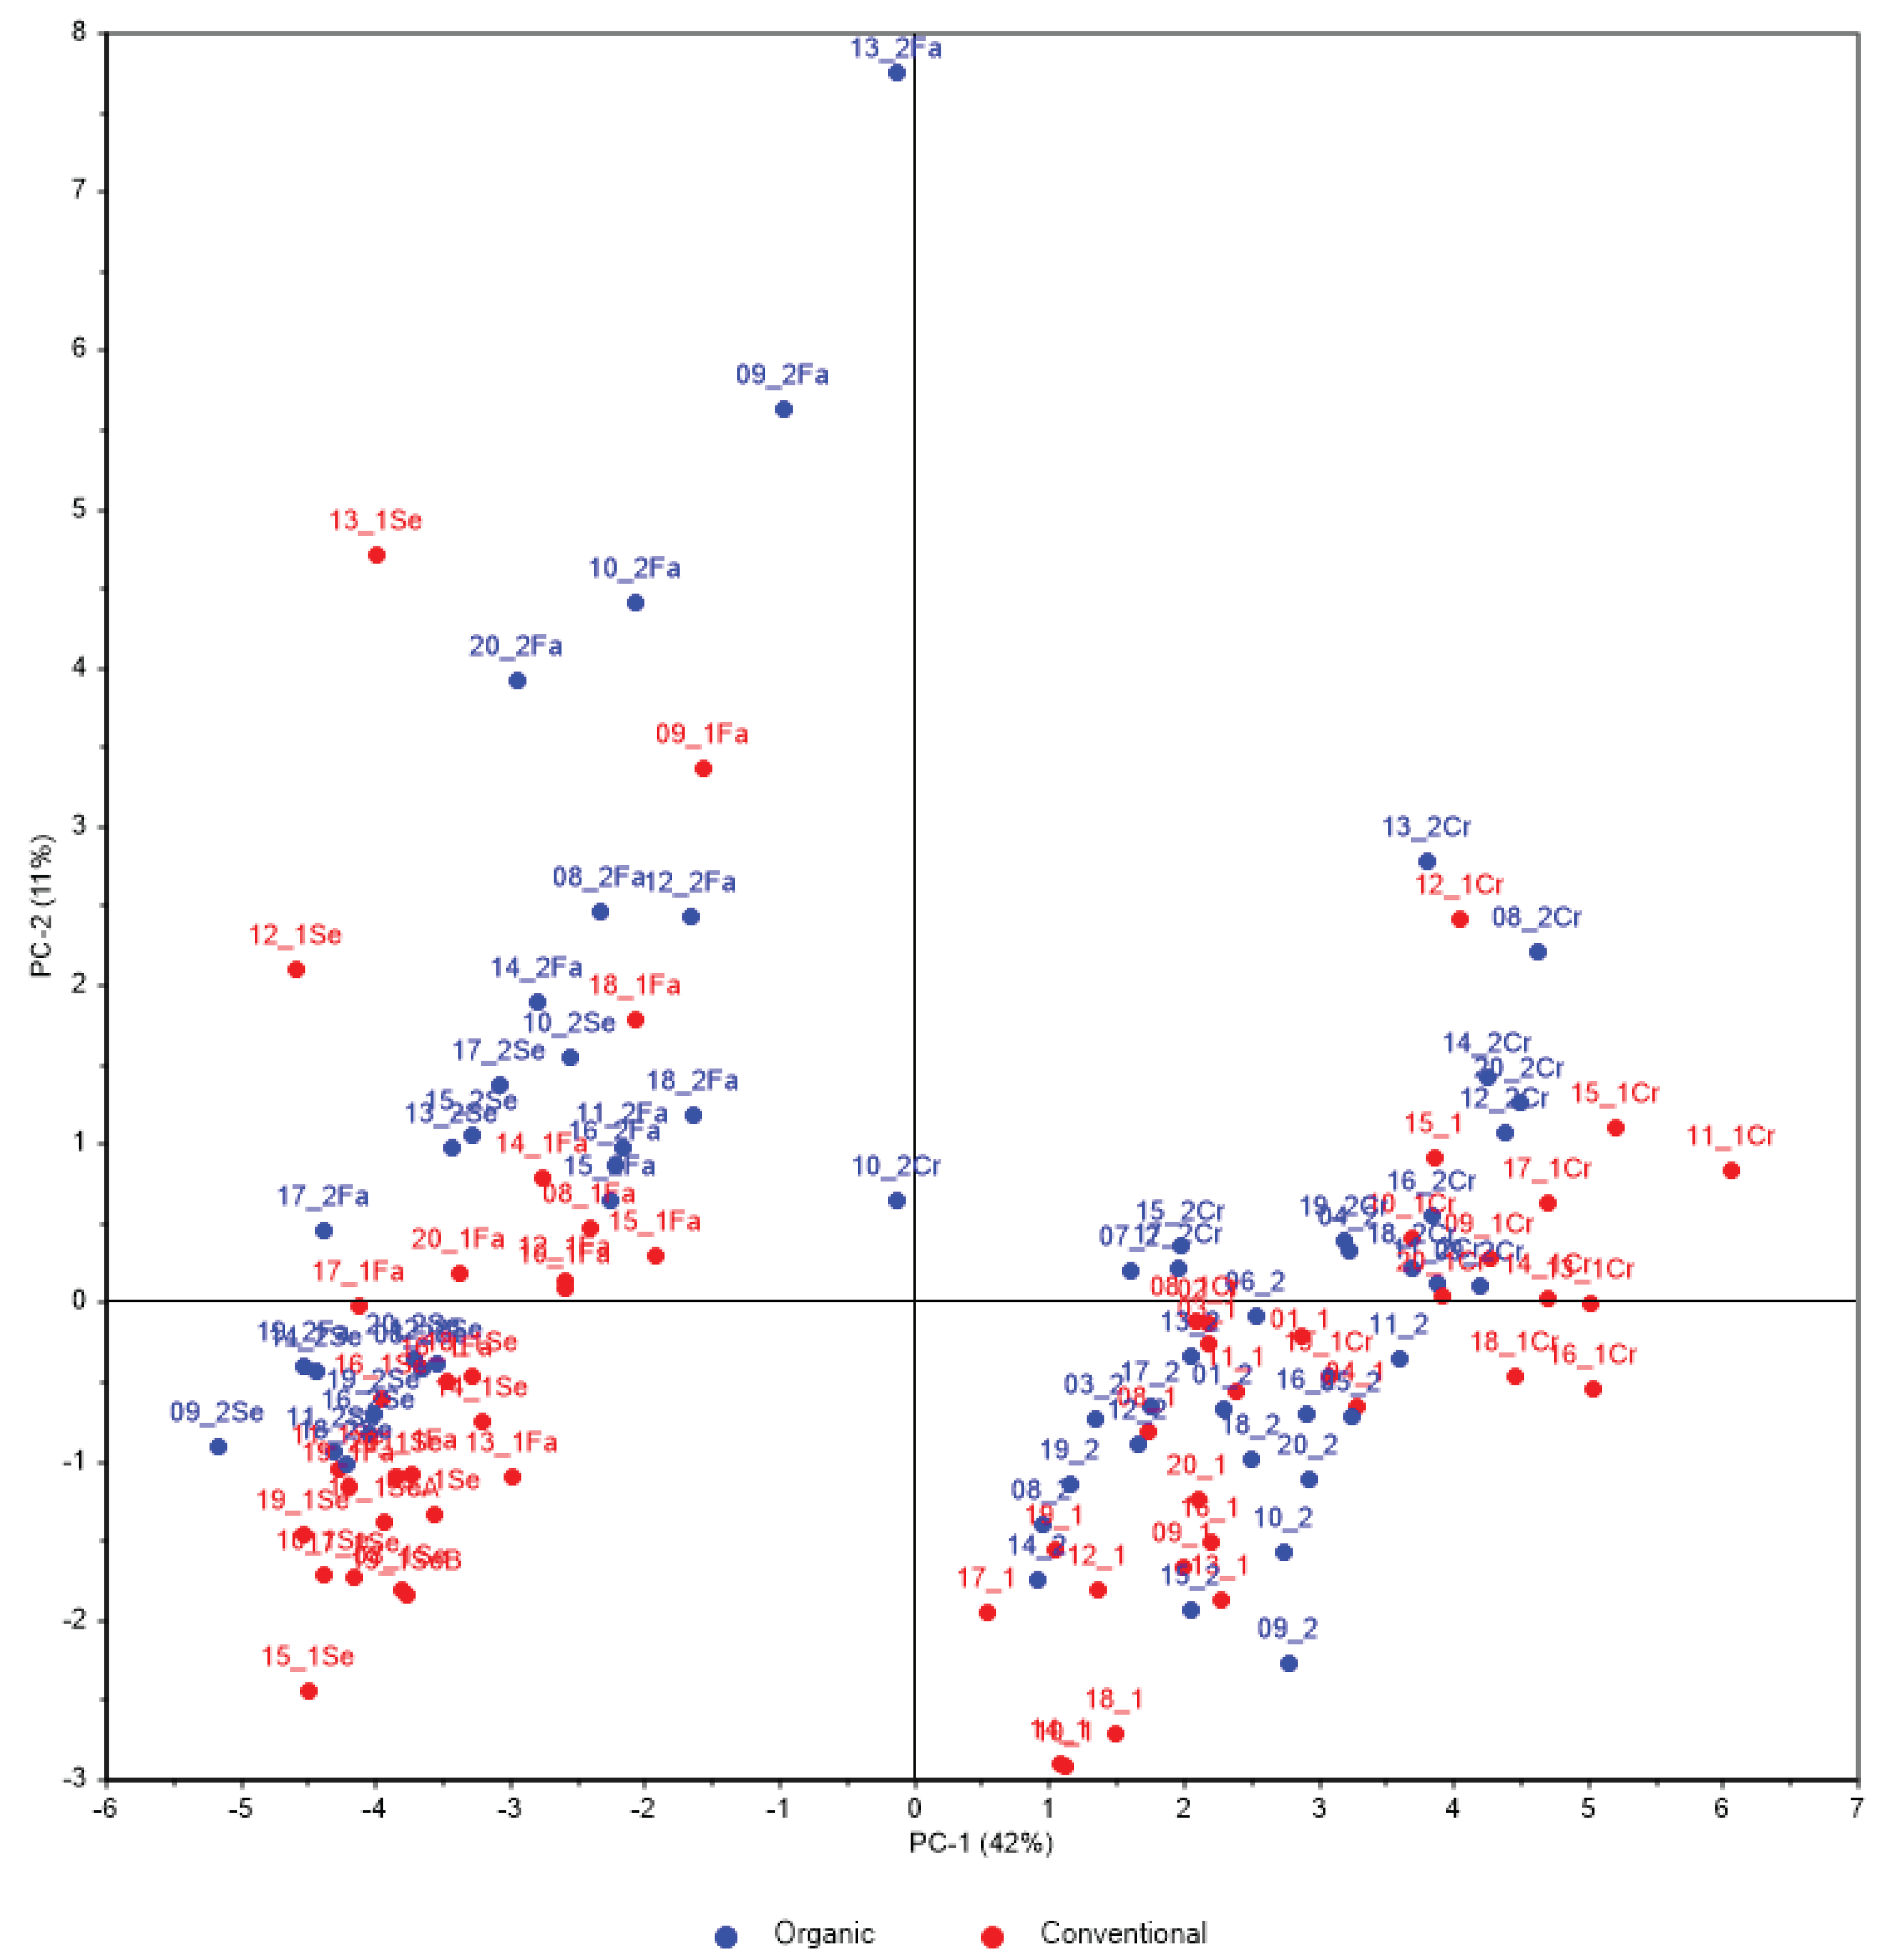
Table 1.
Details of the samples.
| Wheat variety | Code of the variety | Code of the Organic samples | Code of the Conventional samples | seed | bran | semolina | Flour |
|---|---|---|---|---|---|---|---|
| Saragolla new | 01 | 01_2 | 01_1 | Yes | NO | NO | NO |
| San Carlo | 02 | NO | 02_1 | Yes | NO | NO | NO |
| Fuego grown in a large plot | 03 | 03_2 | 03_1 | Yes | NO | NO | NO |
| EVOLDUR evolutionary population harvest 2021 | 04 | 04_2 | NO | Yes | NO | NO | NO |
| Evoldur grown in a large plot | 04 | NO | 04_1 | Yes | NO | NO | NO |
| Senatore Cappelli | 05 | 05_2 | NO | Yes | NO | NO | NO |
| Saragolla old | 06 | 06_2 | NO | Yes | NO | NO | NO |
| Fuego grown in the edge near the railway. | 07 | 07_2 | NO | Yes | NO | NO | NO |
| Antalis | 08 | 08_2 | 08_1 | Yes | Yes | Yes | Yes |
| Bering | 09 | 09_2 | 09_1 | Yes | Yes | Yes | Yes |
| Casteldoux | 10 | 10_2 | 10_1 | Yes | Yes | Yes | Yes |
| Claudio | 11 | 11_2 | 11_1 | Yes | Yes | Yes | Yes |
| Fuego | 12 | 12_2 | 12_1 | Yes | Yes | Yes | Yes |
| Idefix | 13 | 13_2 | 13_1 | Yes | Yes | Yes | Yes |
| Iride | 14 | 14_2 | 14_1 | Yes | Yes | Yes | Yes |
| Marakas | 15 | 15_2 | 15_1 | Yes | Yes | Yes | Yes |
| Marco Aurelio | 16 | 16_2 | 16_1 | Yes | Yes | Yes | Yes |
| Monastir | 17 | 17_2 | 17_1 | Yes | Yes | Yes | Yes |
| Platone | 18 | 18_2 | 18_1 | Yes | Yes | Yes | Yes |
| RGT Natur | 19 | 19_2 | 19_1 | Yes | Yes | Yes | Yes |
| Tito Flavio | 20 | 20_2 | 20_1 | Yes | Yes | Yes | Yes |
Table 2.
Elements determined and wavelengths used for their quantification. The parameters are computed on all the product samples as a whole: seed, bran, semolina and flour in a unique set. (**) indicates the elements, whose means, give a significant t-test comparison (α=0.05) between organic products and the conventional ones.
Table 2.
Elements determined and wavelengths used for their quantification. The parameters are computed on all the product samples as a whole: seed, bran, semolina and flour in a unique set. (**) indicates the elements, whose means, give a significant t-test comparison (α=0.05) between organic products and the conventional ones.
| All together | Organic | Conventional | ||||||||||
|---|---|---|---|---|---|---|---|---|---|---|---|---|
| Element | Wavelength (nm) | LOD (mg/Kg) | LOQ (mg/Kg) | Mean±StdDev | Median | Min - Max | Mean±StdDev | Median | Min - Max | Mean±StdDev | Median | Min - Max |
| Ag (**) | 328.068 | 7E-4 | 0.002 | 0.003 ± 0.003 | 0.003 | LOD - 0.013 | 0.003 ± 0.002 | LOQ | LOD - 0.007 | 0.004 ± 0.003 | 0.003 | LOD - 0.013 |
| Al (**) | 396.152 | 3E-4 | 0.001 | 5.514 ± 4.505 | 4.701 | 1.447 - 44.802 | 6.940 ± 5.875 | 5.311 | 1.788 - 44.802 | 4.089 ± 1.517 | 4.117 | 1.447 - 7.705 |
| As | 189.042 | 0.002 | 0.007 | 0.078 ± 0.051 | 0.066 | 0.020 - 0.363 | 0.069 ± 0.029 | 0.067 | 0.021 - 0.182 | 0.086 ± 0.066 | 0.065 | 0.020 - 0.363 |
| B (**) | 249.773 | 8E-4 | 0.003 | 1.538 ± 0.845 | 1.589 | LOD - 3.185 | 1.182 ± 0.890 | 1.250 | LOD - 2.502 | 1.894 ± 0.624 | 1.844 | 1.109 - 3.185 |
| Ba | 493.409 | 3E-5 | 1E-4 | 0.718 ± 0.385 | 0.600 | 0.266 - 2.057 | 0.748 ± 0.367 | 0.626 | 0.285 - 1.953 | 0.688 ± 0.403 | 0.584 | 0.266 - 2.057 |
| Be | 313.042 | 2E-5 | 6E-5 | 0.001 ± 0.001 | 0.001 | LOD - 0.006 | 0.001 ± 0.001 | 0.001 | LOD - 0.006 | 0.001 ± 0.001 | 0.001 | LOD - 0.003 |
| Ca | 393.366 | 0.007 | 0.024 | 458.658 ± 34.798 | 459.547 | 372.960 - 531.502 | 460.897 ± 31.085 | 460.871 | 391.647 - 519.332 | 456.418 ± 38.296 | 457.874 | 372.960 - 531.502 |
| Cd (**) | 214.438 | 1E-4 | 4E-4 | 0.021 ± 0.010 | 0.019 | 0.008 - 0.053 | 0.024 ± 0.011 | 0.021 | 0.010 - 0.053 | 0.018 ± 0.008 | 0.017 | 0.008 - 0.036 |
| Co | 228.616 | 0.001 | 0.003 | LOQ ± 0.003 | LOQ | LOD - 0.012 | LOQ ± 0.003 | LOQ | LOD - 0.011 | LOQ ± 0.003 | LOQ | LOD - 0.012 |
| Cr | 267.716 | 7E-4 | 0.002 | 0.086 ± 0.067 | 0.076 | 0.024 - 0.615 | 0.090 ± 0.054 | 0.083 | 0.034 - 0.382 | 0.081 ± 0.077 | 0.072 | 0.024 - 0.615 |
| Cu (**) | 327.396 | 8E-4 | 0.003 | 3.822 ± 1.335 | 3.604 | 2.000 - 7.457 | 3.579 ± 1.131 | 3.535 | 2.000 - 5.848 | 4.065 ± 1.481 | 3.964 | 2.138 - 7.457 |
| Fe | 259.940 | 4E-4 | 0.001 | 23.056 ± 10.306 | 24.206 | 7.844 - 48.132 | 24.698 ± 10.022 | 25.202 | 9.983 - 48.132 | 21.413 ± 10.410 | 22.031 | 7.844 - 41.784 |
| K | 769.896 | 0.003 | 0.011 | 2756.460 ± 926.361 | 3009.755 | 1377.052 - 4540.521 | 2679.148 ± 882.771 | 2968.295 | 1377.052 - 4242.568 | 2833.772 ± 969.482 | 3072.834 | 1623.165 - 4540.521 |
| Mg | 279.553 | 1E-4 | 4E-4 | 458.369 ± 93.674 | 494.552 | 300.566 - 603.480 | 463.610 ± 91.025 | 504.347 | 300.566 - 603.480 | 453.129 ± 96.758 | 488.754 | 314.100 - 603.324 |
| Mn | 259.373 | 1E-4 | 3E-4 | 26.592 ± 18.062 | 28.919 | 6.734 - 73.585 | 26.278 ± 16.906 | 29.341 | 6.734 - 61.671 | 26.906 ± 19.292 | 28.613 | 7.456 - 73.585 |
| Mo | 202.030 | 7E-4 | 0.002 | 0.974 ± 0.398 | 0.889 | 0.539 - 4.341 | 0.953 ± 0.502 | 0.852 | 0.539 - 4.341 | 0.994 ± 0.260 | 0.935 | 0.659 - 1.644 |
| Na (**) | 588.995 | 0.001 | 0.004 | 32.454 ± 19.676 | 25.360 | 15.214 - 141.929 | 28.037 ± 10.448 | 25.428 | 16.225 - 74.832 | 36.871 ± 25.143 | 25.317 | 15.214 - 141.929 |
| Ni | 231.604 | 0.001 | 0.004 | 0.161 ± 0.119 | 0.141 | 0.027 - 0.920 | 0.161 ± 0.138 | 0.139 | 0.027 - 0.920 | 0.161 ± 0.098 | 0.143 | 0.041 - 0.580 |
| P | 177.495 | 0.001 | 0.004 | 2764.478 ± 1136.910 | 3082.185 | 1286.050 - 4985.480 | 2725.118 ± 1078.984 | 3082.185 | 1286.050 - 4748.610 | 2803.837 ± 1200.185 | 3065.615 | 1337.920 - 4985.480 |
| Pb | 220.353 | 0.004 | 0.012 | 0.073 ± 0.032 | 0.067 | 0.026 - 0.263 | 0.076 ± 0.027 | 0.072 | 0.036 - 0.148 | 0.070 ± 0.036 | 0.066 | 0.026 - 0.263 |
| Sb | 217.581 | 0.005 | 0.015 | LOD ± 0.003 | LOD | LOD - 0.020 | LOD ± 0.004 | LOD | LOD - 0.019 | LOD ± 0.003 | LOD | LOD - 0.020 |
| Se (**) | 196.090 | 0.001 | 0.005 | 0.182 ± 0.051 | 0.182 | 0.077 - 0.290 | 0.217 ± 0.038 | 0.217 | 0.151 - 0.290 | 0.148 ± 0.039 | 0.155 | 0.077 - 0.222 |
| Si | 251.611 | 8E-5 | 3E-4 | 21.539 ± 13.823 | 18.368 | 4.997 - 85.435 | 23.961 ± 14.109 | 21.451 | 6.314 - 85.435 | 19.116 ± 13.210 | 15.465 | 4.997 - 69.089 |
| Sn | 189.989 | 3E-4 | 9E-4 | 0.008 ± 0.007 | 0.006 | 0.002 - 0.059 | 0.007 ± 0.003 | 0.006 | 0.003 - 0.016 | 0.008 ± 0.010 | 0.005 | 0.002 - 0.059 |
| Ti (**) | 323.452 | 4E-4 | 0.001 | 0.041 ± 0.051 | 0.028 | 0.007 - 0.484 | 0.051 ± 0.068 | 0.032 | 0.007 - 0.484 | 0.031 ± 0.019 | 0.025 | 0.007 - 0.099 |
| Tl | 190.856 | 5E-4 | 0.002 | 0.004 ± 0.008 | LOD | LOD - 0.043 | 0.003 ± 0.007 | LOD | LOD - 0.033 | 0.004 ± 0.009 | LOD | LOD - 0.043 |
| V (**) | 292.402 | 6E-4 | 0.002 | 0.023 ± 0.058 | 0.010 | LOQ - 0.520 | 0.012 ± 0.011 | 0.010 | LOQ - 0.075 | 0.035 ± 0.080 | 0.010 | LOQ - 0.520 |
| Zn | 202.548 | 6E-4 | 0.002 | 23.597 ± 12.000 | 24.810 | 8.952 - 47.971 | 23.564 ± 11.829 | 25.262 | 8.952 - 45.948 | 23.629 ± 12.273 | 24.680 | 9.035 - 47.971 |
Table 3.
Comparison of seeds. (**) indicates the elements, whose means, give a significant t-test comparison (α=0.05) between the organic product and the conventional one.
Table 3.
Comparison of seeds. (**) indicates the elements, whose means, give a significant t-test comparison (α=0.05) between the organic product and the conventional one.
| All seeds | Organic seeds | Conventional seeds | |||||||
|---|---|---|---|---|---|---|---|---|---|
| Element | Mean±StdDev | Median | Min - Max | Mean±StdDev | Median | Min - Max | Mean±StdDev | Median | Min - Max |
| Ag | 0.003 ± 0.002 | 0.003 | LOD - 0.009 | 0.003 ± 0.002 | 0.003 | LOD - 0.006 | 0.003 ± 0.002 | 0.003 | LOD - 0.009 |
| Al | 4.530 ± 1.711 | 5.164 | 1.533 - 6.741 | 4.811 ± 1.522 | 5.235 | 1.788 - 6.583 | 4.216 ± 1.897 | 4.824 | 1.533 - 6.741 |
| As | 0.074 ± 0.037 | 0.070 | 0.020 - 0.218 | 0.073 ± 0.031 | 0.068 | 0.024 - 0.156 | 0.075 ± 0.043 | 0.071 | 0.020 - 0.218 |
| B (**) | 2.381 ± 0.514 | 2.285 | 0.526 - 3.185 | 2.107 ± 0.405 | 2.179 | 0.526 - 2.502 | 2.686 ± 0.453 | 2.916 | 1.999 - 3.185 |
| Ba | 0.801 ± 0.322 | 0.714 | 0.358 - 1.631 | 0.842 ± 0.357 | 0.790 | 0.358 - 1.631 | 0.756 ± 0.282 | 0.699 | 0.394 - 1.359 |
| Be | 0.000 ± 0.000 | LOD | LOD - 0.001 | 0.000 ± 0.001 | LOD | LOD - 0.001 | 0.000 ± 0.000 | LOD | LOD - 0.001 |
| Ca | 478.232 ± 30.116 | 480.896 | 392.386 - 531.502 | 482.951 ± 23.743 | 489.331 | 432.194 - 519.332 | 472.957 ± 35.970 | 469.289 | 392.386 - 531.502 |
| Cd (**) | 0.026 ± 0.009 | 0.023 | 0.013 - 0.045 | 0.029 ± 0.010 | 0.028 | 0.016 - 0.045 | 0.022 ± 0.007 | 0.022 | 0.013 - 0.036 |
| Co | 0.005 ± 0.003 | 0.005 | LOD - 0.011 | 0.005 ± 0.003 | 0.005 | LOD - 0.011 | 0.005 ± 0.003 | 0.005 | LOQ - 0.009 |
| Cr | 0.096 ± 0.090 | 0.081 | 0.064 - 0.615 | 0.084 ± 0.010 | 0.083 | 0.072 - 0.115 | 0.109 ± 0.131 | 0.075 | 0.064 - 0.615 |
| Cu (**) | 4.336 ± 0.590 | 4.212 | 3.433 - 5.814 | 4.091 ± 0.534 | 4.040 | 3.433 - 5.226 | 4.610 ± 0.537 | 4.462 | 3.851 - 5.814 |
| Fe (**) | 26.857 ± 2.758 | 27.006 | 21.324 - 34.350 | 28.111 ± 2.702 | 28.021 | 23.929 - 34.350 | 25.455 ± 2.115 | 25.047 | 21.324 - 29.221 |
| K | 3243.369 ± 170.998 | 3253.807 | 2933.319 - 3697.111 | 3203.997 ± 176.816 | 3149.462 | 2933.319 - 3697.111 | 3287.373 ± 157.776 | 3270.450 | 3046.468 - 3587.377 |
| Mg (**) | 520.287 ± 19.505 | 522.190 | 481.189 - 558.077 | 526.603 ± 18.206 | 526.692 | 481.189 - 558.077 | 513.229 ± 18.949 | 509.408 | 484.819 - 553.452 |
| Mn | 35.138 ± 4.469 | 35.383 | 28.101 - 42.808 | 35.561 ± 4.322 | 35.409 | 28.101 - 42.808 | 34.665 ± 4.715 | 35.357 | 28.301 - 41.289 |
| Mo | 0.963 ± 0.255 | 0.881 | 0.566 - 1.644 | 0.929 ± 0.215 | 0.839 | 0.566 - 1.327 | 1.001 ± 0.296 | 0.903 | 0.659 - 1.644 |
| Na | 26.690 ± 6.451 | 25.109 | 18.349 - 48.180 | 27.683 ± 7.748 | 25.300 | 18.349 - 48.180 | 25.580 ± 4.584 | 24.914 | 20.586 - 37.991 |
| Ni | 0.187 ± 0.086 | 0.158 | 0.105 - 0.580 | 0.177 ± 0.059 | 0.155 | 0.111 - 0.327 | 0.198 ± 0.110 | 0.174 | 0.105 - 0.580 |
| P | 3358.290 ± 254.652 | 3289.515 | 2984.810 - 3903.900 | 3373.664 ± 268.498 | 3301.550 | 2984.810 - 3903.900 | 3341.108 ± 245.271 | 3257.150 | 3001.920 - 3889.520 |
| Pb | 0.056 ± 0.021 | 0.055 | 0.026 - 0.128 | 0.057 ± 0.018 | 0.050 | 0.036 - 0.092 | 0.054 ± 0.025 | 0.055 | 0.026 - 0.128 |
| Sb | LOD ± 0.005 | LOD | LOD - 0.020 | LOQ ± 0.005 | LOD | LOD - 0.019 | LOD ± 0.005 | LOD | LOD - 0.020 |
| Se (**) | 0.210 ± 0.044 | 0.208 | 0.131 - 0.290 | 0.238 ± 0.036 | 0.252 | 0.151 - 0.290 | 0.178 ± 0.029 | 0.165 | 0.131 - 0.222 |
| Si | 22.371 ± 6.684 | 21.451 | 13.517 - 48.981 | 22.694 ± 5.045 | 23.307 | 13.869 - 32.932 | 22.010 ± 8.297 | 20.815 | 13.517 - 48.981 |
| Sn | 0.005 ± 0.002 | 0.004 | 0.002 - 0.011 | 0.005 ± 0.002 | 0.004 | 0.003 - 0.009 | 0.005 ± 0.003 | 0.005 | 0.002 - 0.011 |
| Ti | 0.021 ± 0.012 | 0.019 | 0.007 - 0.064 | 0.021 ± 0.013 | 0.017 | 0.007 - 0.064 | 0.020 ± 0.011 | 0.021 | 0.007 - 0.039 |
| Tl | 0.007 ± 0.010 | LOQ | LOD - 0.043 | 0.004 ± 0.007 | LOD | LOD - 0.022 | 0.010 ± 0.013 | 0.005 | LOD - 0.043 |
| V | 0.010 ± 0.002 | 0.010 | 0.006 - 0.015 | 0.009 ± 0.002 | 0.010 | 0.006 - 0.011 | 0.010 ± 0.002 | 0.010 | 0.006 - 0.015 |
| Zn | 29.532 ± 4.976 | 28.053 | 22.541 - 45.556 | 30.130 ± 5.757 | 27.744 | 22.541 - 45.556 | 28.863 ± 3.997 | 28.361 | 24.495 - 40.231 |
Table 4.
Comparison of brans. (**) indicates the elements, whose means, give a significant t-test comparison (α=0.05) between the organic product and the conventional one.
Table 4.
Comparison of brans. (**) indicates the elements, whose means, give a significant t-test comparison (α=0.05) between the organic product and the conventional one.
| All brans | Organic Brans | Conventional Brans | |||||||
|---|---|---|---|---|---|---|---|---|---|
| Element | Mean±StdDev | Median | Min - Max | Mean±StdDev | Median | Min - Max | Mean±StdDev | Median | Min - Max |
| Ag | 0.006 ± 0.003 | 0.006 | LOQ - 0.013 | 0.005 ± 0.002 | 0.005 | LOQ - 0.007 | 0.007 ± 0.003 | 0.007 | LOQ - 0.013 |
| Al (**) | 5.093 ± 2.009 | 4.460 | 2.579 - 12.263 | 5.916 ± 2.512 | 4.884 | 3.784 - 12.263 | 4.270 ± 0.797 | 4.214 | 2.579 - 5.757 |
| As | 0.079 ± 0.041 | 0.073 | 0.021 - 0.236 | 0.070 ± 0.025 | 0.071 | 0.021 - 0.118 | 0.088 ± 0.052 | 0.075 | 0.045 - 0.236 |
| B (**) | 1.712 ± 0.331 | 1.806 | 0.578 - 2.092 | 1.504 ± 0.340 | 1.593 | 0.578 - 1.890 | 1.919 ± 0.139 | 1.900 | 1.561 - 2.092 |
| Ba | 1.137 ± 0.405 | 1.096 | 0.587 - 2.057 | 1.093 ± 0.379 | 1.029 | 0.603 - 1.953 | 1.181 ± 0.440 | 1.172 | 0.587 - 2.057 |
| Be | 0.001 ± 0.000 | 0.001 | 0.001 - 0.003 | 0.001 ± 0 | 0.001 | 0.001 - 0.001 | 0.001 ± 0.001 | 0.001 | 0.001 - 0.003 |
| Ca (**) | 476.057 ± 26.534 | 476.740 | 412.787 - 525.940 | 465.731 ± 23.447 | 466.287 | 412.787 - 490.929 | 486.383 ± 26.193 | 479.765 | 447.286 - 525.940 |
| Cd | 0.028 ± 0.010 | 0.026 | 0.017 - 0.053 | 0.031 ± 0.012 | 0.027 | 0.017 - 0.053 | 0.024 ± 0.007 | 0.021 | 0.017 - 0.035 |
| Co | 0.005 ± 0.003 | 0.004 | LOD - 0.012 | 0.004 ± 0.002 | 0.004 | LOD - 0.008 | 0.006 ± 0.003 | 0.006 | LOQ - 0.012 |
| Cr | 0.108 ± 0.018 | 0.109 | 0.072 - 0.140 | 0.104 ± 0.020 | 0.099 | 0.072 - 0.140 | 0.112 ± 0.015 | 0.113 | 0.087 - 0.137 |
| Cu (**) | 5.546 ± 0.962 | 5.486 | 3.456 - 7.457 | 4.925 ± 0.712 | 4.913 | 3.456 - 5.848 | 6.168 ± 0.763 | 6.012 | 5.078 - 7.457 |
| Fe | 36.678 ± 4.824 | 36.994 | 25.335 - 48.132 | 36.673 ± 6.217 | 37.872 | 25.335 - 48.132 | 36.684 ± 3.136 | 36.834 | 30.115 - 41.784 |
| K (**) | 3954.524 ± 482.432 | 4082.236 | 2561.379 - 4540.521 | 3702.171 ± 516.030 | 3912.625 | 2561.379 - 4242.568 | 4206.877 ± 283.921 | 4260.125 | 3511.909 - 4540.521 |
| Mg | 567.520 ± 28.755 | 571.690 | 462.179 - 603.480 | 558.948 ± 36.235 | 569.114 | 462.179 - 603.480 | 576.091 ± 15.827 | 581.517 | 547.554 - 603.324 |
| Mn | 50.742 ± 10.443 | 50.736 | 24.625 - 73.585 | 46.950 ± 9.574 | 49.176 | 24.625 - 61.671 | 54.534 ± 10.216 | 53.746 | 35.295 - 73.585 |
| Mo (**) | 1.122 ± 0.236 | 1.100 | 0.733 - 1.598 | 0.980 ± 0.166 | 0.898 | 0.733 - 1.258 | 1.264 ± 0.213 | 1.283 | 0.973 - 1.598 |
| Na (**) | 42.709 ± 16.512 | 39.489 | 24.952 - 97.760 | 35.491 ± 9.294 | 32.918 | 24.952 - 61.069 | 49.927 ± 19.203 | 41.321 | 34.075 - 97.760 |
| Ni | 0.232 ± 0.076 | 0.232 | 0.086 - 0.419 | 0.223 ± 0.090 | 0.218 | 0.086 - 0.419 | 0.241 ± 0.063 | 0.233 | 0.147 - 0.343 |
| P (**) | 4247.483 ± 558.857 | 4335.040 | 2544.200 - 4985.480 | 3974.312 ± 596.423 | 4099.390 | 2544.200 - 4748.610 | 4520.654 ± 365.057 | 4438.640 | 3664.670 - 4985.480 |
| Pb (**) | 0.089 ± 0.025 | 0.090 | 0.055 - 0.135 | 0.100 ± 0.027 | 0.108 | 0.055 - 0.135 | 0.077 ± 0.016 | 0.072 | 0.055 - 0.106 |
| Sb | LOD ± 0.001 | LOD | LOD - LOD | LOD ± 0.001 | LOD | LOD - LOD | LOD ± 0.001 | LOD | LOD - LOD |
| Se (**) | 0.204 ± 0.044 | 0.193 | 0.141 - 0.275 | 0.242 ± 0.024 | 0.247 | 0.188 - 0.275 | 0.166 ± 0.015 | 0.164 | 0.141 - 0.195 |
| Si | 34.462 ± 13.098 | 32.302 | 14.746 - 69.089 | 33.757 ± 12.361 | 33.056 | 14.746 - 56.431 | 35.167 ± 14.267 | 32.148 | 19.242 - 69.089 |
| Sn (**) | 0.006 ± 0.003 | 0.005 | 0.003 - 0.016 | 0.007 ± 0.003 | 0.006 | 0.004 - 0.016 | 0.005 ± 0.001 | 0.005 | 0.003 - 0.009 |
| Ti | 0.053 ± 0.032 | 0.045 | 0.019 - 0.153 | 0.061 ± 0.040 | 0.048 | 0.019 - 0.153 | 0.046 ± 0.021 | 0.042 | 0.023 - 0.099 |
| Tl | 0.007 ± 0.009 | 0.004 | LOD - 0.033 | 0.007 ± 0.010 | LOQ | LOD - 0.033 | 0.007 ± 0.007 | 0.005 | LOD - 0.021 |
| V | 0.008 ± 0.006 | 0.007 | LOQ - 0.021 | 0.009 ± 0.006 | 0.008 | LOQ - 0.021 | 0.008 ± 0.006 | 0.005 | LOQ - 0.018 |
| Zn | 39.233 ± 5.628 | 40.157 | 22.804 - 47.971 | 37.297 ± 6.372 | 38.188 | 22.804 - 45.948 | 41.169 ± 4.154 | 41.491 | 33.005 - 47.971 |
Table 5.
Comparison of Semolina. (**) indicates the elements, whose means, give a significant t-test comparison (α=0.05) between the organic product and the conventional one.
Table 5.
Comparison of Semolina. (**) indicates the elements, whose means, give a significant t-test comparison (α=0.05) between the organic product and the conventional one.
| All Semolina | Organic Semolina | Conventional Semolina | |||||||
|---|---|---|---|---|---|---|---|---|---|
| Element | Mean±StdDev | Median | Min - Max | Mean±StdDev | Median | Min - Max | Mean±StdDev | Median | Min - Max |
| Ag | LOQ ± 0.002 | LOQ | LOD - 0.007 | LOQ ± 0.001 | LOQ | LOD - 0.005 | 0.003 ± 0.002 | LOQ | LOD - 0.007 |
| Al (**) | 4.816 ± 2.592 | 4.343 | 1.447 - 13.392 | 6.147 ± 2.871 | 4.771 | 3.461 - 13.392 | 3.662 ± 1.678 | 3.821 | 1.447 - 7.705 |
| As | 0.077 ± 0.064 | 0.058 | 0.024 - 0.363 | 0.070 ± 0.038 | 0.059 | 0.027 - 0.182 | 0.083 ± 0.081 | 0.056 | 0.024 - 0.363 |
| B (**) | 0.855 ± 0.624 | 1.133 | LOD - 1.851 | 0.288 ± 0.432 | 0.013 | LOD - 0.951 | 1.346 ± 0.188 | 1.325 | 1.109 - 1.851 |
| Ba | 0.435 ± 0.123 | 0.412 | 0.279 - 0.767 | 0.482 ± 0.125 | 0.479 | 0.321 - 0.767 | 0.395 ± 0.109 | 0.359 | 0.279 - 0.635 |
| Be | 0.001 ± 0.000 | 0.001 | 0.001 - 0.002 | 0.001 ± 0 | 0.001 | 0.001 - 0.001 | 0.001 ± 0.000 | 0.001 | 0.001 - 0.002 |
| Ca | 434.047 ± 29.811 | 429.169 | 390.838 - 486.215 | 437.659 ± 28.502 | 425.796 | 404.677 - 486.215 | 430.917 ± 31.543 | 432.541 | 390.838 - 479.139 |
| Cd (**) | 0.014 ± 0.005 | 0.013 | 0.008 - 0.031 | 0.017 ± 0.006 | 0.015 | 0.010 - 0.031 | 0.012 ± 0.004 | 0.011 | 0.008 - 0.018 |
| Co | LOD ± 0.002 | LOD | LOD - 0.009 | LOD ± 0.002 | LOD | LOD - 0.009 | LOD ± 0.000 | LOD | LOD - LOD |
| Cr | 0.049 ± 0.036 | 0.040 | 0.024 - 0.226 | 0.057 ± 0.051 | 0.041 | 0.034 - 0.226 | 0.042 ± 0.009 | 0.039 | 0.024 - 0.061 |
| Cu (**) | 2.487 ± 0.288 | 2.466 | 2.034 - 3.228 | 2.341 ± 0.226 | 2.297 | 2.034 - 2.745 | 2.614 ± 0.281 | 2.591 | 2.138 - 3.228 |
| Fe (**) | 11.859 ± 2.504 | 10.928 | 7.844 - 19.124 | 13.298 ± 2.761 | 12.756 | 9.983 - 19.124 | 10.612 ± 1.404 | 10.546 | 7.844 - 13.894 |
| K (**) | 1738.047 ± 142.878 | 1760.645 | 1377.052 - 2009.210 | 1657.293 ± 134.168 | 1655.897 | 1377.052 - 1864.274 | 1808.033 ± 112.416 | 1801.074 | 1623.165 - 2009.210 |
| Mg | 345.022 ± 19.921 | 345.146 | 300.566 - 383.394 | 349.486 ± 24.248 | 348.558 | 300.566 - 383.394 | 341.154 ± 15.061 | 342.398 | 314.100 - 365.416 |
| Mn | 9.156 ± 1.174 | 8.988 | 7.173 - 11.745 | 8.885 ± 0.868 | 8.853 | 7.173 - 10.532 | 9.391 ± 1.373 | 9.666 | 7.456 - 11.745 |
| Mo | 0.834 ± 0.170 | 0.818 | 0.539 - 1.249 | 0.810 ± 0.210 | 0.813 | 0.539 - 1.249 | 0.855 ± 0.131 | 0.862 | 0.702 - 1.101 |
| Na | 26.765 ± 17.695 | 20.731 | 15.214 - 95.377 | 21.091 ± 4.336 | 20.374 | 16.225 - 32.199 | 31.682 ± 23.065 | 21.728 | 15.214 - 95.377 |
| Ni | 0.082 ± 0.085 | 0.056 | 0.027 - 0.411 | 0.074 ± 0.102 | 0.049 | 0.027 - 0.411 | 0.088 ± 0.071 | 0.062 | 0.041 - 0.330 |
| P | 1544.900 ± 131.448 | 1583.585 | 1286.050 - 1710.380 | 1506.895 ± 135.215 | 1528.190 | 1286.050 - 1710.380 | 1577.838 ± 123.078 | 1623.870 | 1337.920 - 1710.160 |
| Pb | 0.073 ± 0.040 | 0.062 | 0.038 - 0.263 | 0.069 ± 0.014 | 0.063 | 0.054 - 0.102 | 0.077 ± 0.054 | 0.061 | 0.038 - 0.263 |
| Sb | LOD ± 0.002 | LOD | LOD - LOQ | LOD ± 0.001 | LOD | LOD - LOD | LOD ± 0.002 | LOD | LOD - LOQ |
| Se (**) | 0.152 ± 0.047 | 0.156 | 0.077 - 0.240 | 0.191 ± 0.025 | 0.188 | 0.155 - 0.240 | 0.118 ± 0.032 | 0.114 | 0.077 - 0.212 |
| Si (**) | 8.985 ± 3.597 | 7.457 | 4.997 - 19.054 | 11.120 ± 3.979 | 10.245 | 6.314 - 19.054 | 7.135 ± 1.866 | 6.526 | 4.997 - 11.171 |
| Sn | 0.008 ± 0.010 | 0.006 | 0.004 - 0.059 | 0.007 ± 0.002 | 0.006 | 0.005 - 0.010 | 0.010 ± 0.014 | 0.005 | 0.004 - 0.059 |
| Ti | 0.030 ± 0.018 | 0.022 | 0.008 - 0.077 | 0.033 ± 0.018 | 0.024 | 0.016 - 0.077 | 0.028 ± 0.018 | 0.021 | 0.008 - 0.077 |
| Tl | LOD ± 0.001 | LOD | LOD - 0.003 | LOD ± 0.000 | LOD | LOD - LOD | LOQ ± 0.001 | LOD | LOD - 0.003 |
| V | 0.028 ± 0.097 | 0.007 | LOQ - 0.520 | 0.008 ± 0.006 | 0.006 | LOQ - 0.020 | 0.046 ± 0.132 | 0.007 | LOQ - 0.520 |
| Zn | 11.213 ± 1.042 | 11.374 | 8.952 - 12.972 | 10.907 ± 0.955 | 11.075 | 8.952 - 12.198 | 11.478 ± 1.072 | 11.556 | 9.035 - 12.972 |
Table 6.
Comparison of flour. (**) indicates the elements, whose means, give a significant t-test comparison (α=0.05) between the organic product and the conventional one.
Table 6.
Comparison of flour. (**) indicates the elements, whose means, give a significant t-test comparison (α=0.05) between the organic product and the conventional one.
| All flour samples | Organic flours | Conventional flours | |||||||
|---|---|---|---|---|---|---|---|---|---|
| Element | Mean±StdDev | Median | Min - Max | Mean±StdDev | Median | Min - Max | Mean±StdDev | Median | Min - Max |
| Ag | LOQ ± 0.002 | LOQ | LOD - 0.007 | LOQ ± 0.002 | LOD | LOD - 0.006 | LOQ ± 0.003 | LOQ | LOD - 0.007 |
| Al (**) | 8.051 ± 8.316 | 5.605 | 2.295 - 44.802 | 11.869 ± 10.517 | 7.930 | 5.225 - 44.802 | 4.233 ± 1.379 | 4.141 | 2.295 - 7.391 |
| As | 0.083 ± 0.063 | 0.062 | 0.036 - 0.305 | 0.063 ± 0.020 | 0.061 | 0.036 - 0.095 | 0.103 ± 0.084 | 0.065 | 0.036 - 0.305 |
| B (**) | 0.932 ± 0.651 | 1.149 | LOD - 2.030 | 0.400 ± 0.467 | 0.071 | LOD - 1.106 | 1.464 ± 0.230 | 1.381 | 1.192 - 2.030 |
| Ba | 0.488 ± 0.138 | 0.479 | 0.266 - 0.784 | 0.530 ± 0.142 | 0.531 | 0.285 - 0.784 | 0.446 ± 0.126 | 0.461 | 0.266 - 0.641 |
| Be | 0.001 ± 0.001 | 0.001 | 0.001 - 0.006 | 0.002 ± 0.001 | 0.001 | 0.001 - 0.006 | 0.001 ± Non un numero reale | 0.001 | 0.001 - 0.001 |
| Ca | 440.659 ± 27.472 | 443.842 | 372.960 - 486.933 | 447.069 ± 28.188 | 452.268 | 391.647 - 486.933 | 434.249 ± 26.244 | 437.667 | 372.960 - 480.070 |
| Cd | 0.015 ± 0.005 | 0.014 | 0.008 - 0.030 | 0.017 ± 0.006 | 0.016 | 0.010 - 0.030 | 0.013 ± 0.004 | 0.012 | 0.008 - 0.020 |
| Co | LOD ± 0.002 | LOD | LOD - 0.010 | LOQ ± 0.003 | LOD | LOD - 0.010 | LOD ± 0.001 | LOD | LOD - 0.004 |
| Cr | 0.089 ± 0.073 | 0.063 | 0.037 - 0.382 | 0.117 ± 0.092 | 0.080 | 0.046 - 0.382 | 0.061 ± 0.029 | 0.051 | 0.037 - 0.149 |
| Cu | 2.824 ± 0.431 | 2.778 | 2.000 - 3.861 | 2.724 ± 0.509 | 2.739 | 2.000 - 3.861 | 2.924 ± 0.326 | 2.937 | 2.401 - 3.426 |
| Fe (**) | 16.227 ± 6.721 | 14.701 | 10.950 - 45.423 | 19.134 ± 8.469 | 17.476 | 11.067 - 45.423 | 13.320 ± 2.018 | 12.975 | 10.950 - 17.896 |
| K (**) | 1980.966 ± 174.635 | 1970.042 | 1664.408 - 2303.912 | 1910.892 ± 172.820 | 1879.192 | 1664.408 - 2246.599 | 2051.040 ± 151.758 | 2020.542 | 1832.890 - 2303.912 |
| Mg | 385.553 ± 27.592 | 389.810 | 329.942 - 426.213 | 390.328 ± 30.020 | 395.837 | 329.942 - 424.400 | 380.778 ± 25.209 | 376.573 | 343.350 - 426.213 |
| Mn | 9.388 ± 1.475 | 8.989 | 6.734 - 12.084 | 9.434 ± 1.645 | 8.885 | 6.734 - 11.814 | 9.343 ± 1.349 | 9.092 | 7.660 - 12.084 |
| Mo | 0.990 ± 0.712 | 0.832 | 0.551 - 4.341 | 1.105 ± 1.003 | 0.816 | 0.551 - 4.341 | 0.875 ± 0.144 | 0.873 | 0.666 - 1.180 |
| Na | 36.308 ± 30.047 | 24.581 | 17.774 - 141.929 | 28.049 ± 14.513 | 24.313 | 17.849 - 74.832 | 44.567 ± 39.018 | 24.848 | 17.774 - 141.929 |
| Ni | 0.139 ± 0.167 | 0.098 | 0.039 - 0.920 | 0.161 ± 0.234 | 0.092 | 0.039 - 0.920 | 0.117 ± 0.047 | 0.104 | 0.062 - 0.229 |
| P | 1772.662 ± 200.208 | 1791.390 | 1335.880 - 2159.440 | 1746.273 ± 213.606 | 1787.770 | 1335.880 - 2115.440 | 1799.051 ± 190.710 | 1795.010 | 1517.020 - 2159.440 |
| Pb | 0.081 ± 0.032 | 0.074 | 0.036 - 0.186 | 0.088 ± 0.025 | 0.081 | 0.062 - 0.148 | 0.074 ± 0.037 | 0.067 | 0.036 - 0.186 |
| Sb | LOD ± 0.001 | LOD | LOD - LOD | LOD ± 0.001 | LOD | LOD - LOD | LOD ± 0.001 | LOD | LOD - LOD |
| Se (**) | 0.156 ± 0.042 | 0.164 | 0.091 - 0.230 | 0.186 ± 0.023 | 0.181 | 0.158 - 0.230 | 0.127 ± 0.036 | 0.108 | 0.091 - 0.200 |
| Si (**) | 20.982 ± 16.716 | 15.869 | 10.116 - 85.435 | 28.860 ± 20.680 | 18.165 | 15.683 - 85.435 | 13.105 ± 4.473 | 11.285 | 10.116 - 27.071 |
| Sn | 0.013 ± 0.008 | 0.011 | 0.005 - 0.035 | 0.011 ± 0.003 | 0.011 | 0.005 - 0.016 | 0.015 ± 0.011 | 0.010 | 0.006 - 0.035 |
| Ti | 0.069 ± 0.093 | 0.044 | 0.018 - 0.484 | 0.104 ± 0.122 | 0.063 | 0.027 - 0.484 | 0.034 ± 0.018 | 0.025 | 0.018 - 0.080 |
| Tl | LOQ ± 0.004 | LOD | LOD - 0.019 | 0.002 ± 0.005 | LOD | LOD - 0.019 | LOD ± 0.000 | LOD | LOD - LOQ |
| V (**) | 0.051 ± 0.064 | 0.021 | 0.003 - 0.235 | 0.021 ± 0.018 | 0.018 | 0.003 - 0.075 | 0.082 ± 0.079 | 0.045 | 0.007 - 0.235 |
| Zn | 13.078 ± 1.762 | 12.731 | 9.403 - 16.102 | 12.892 ± 1.982 | 12.796 | 9.403 - 16.102 | 13.264 ± 1.569 | 12.666 | 11.396 - 15.950 |
Table 7.
Correlation coefficient of the elements in the different products used without distinction between organic and non-organic products. Letters close to the number stand for a=all samples together, s= Seeds, b=Brans, m=Semolina, f=Flours.
Table 7.
Correlation coefficient of the elements in the different products used without distinction between organic and non-organic products. Letters close to the number stand for a=all samples together, s= Seeds, b=Brans, m=Semolina, f=Flours.
| Ag | Al | As | B | Ba | Be | Ca | Cd | Co | Cr | Cu | Fe | K | Mg | Mn | Mo | Na | Ni | P | Pb | Sb | Se | Si | Sn | Ti | Tl | V | Zn | |
| Ag | 1a; 1s; 1b; 1m; 1f | |||||||||||||||||||||||||||
| Al | 1a; 1s; 1b; 1m; 1f | 0.74f | 0.91f | 0.75m | 0.89a;0.78b;0.97f | 0.68b | ||||||||||||||||||||||
| As | 1a; 1s; 1b; 1m; 1f | 0.88m | 0.63a;0.65s;0.89m | 0.87m | ||||||||||||||||||||||||
| B | 1a; 1s; 1b; 1m; 1f | 0.67b | 0.63a;0.71b | 0.61a;0.62b | 0.71b | 0.64b | ||||||||||||||||||||||
| Ba | 1a; 1s; 1b; 1m; 1f | 0.64a | 0.65a | 0.71a | 0.68a | 0.68a | 0.7a | 0.71a | ||||||||||||||||||||
| Be | 0.88m | 1a; 1s; 1b; 1m; 1f | 0.66s | 0.68b | 0.9f | 0.67s | 0.96m | 1m | 0.66s | |||||||||||||||||||
| Ca | 1a; 1s; 1b; 1m; 1f | 0.65a;0.61s | 0.6a | |||||||||||||||||||||||||
| Cd | 1a; 1s; 1b; 1m; 1f | 0.64a | 0.64a | 0.61a | 0.65a | |||||||||||||||||||||||
| Co | 0.74f | 1a; 1s; 1b; 1m; 1f | 0.98m | 0.67a;0.68b | 0.69a;0.73f | 0.67a | 0.68a | 0.69a;0.62b | 0.8m | 0.68a | 0.79f | 0.68a | ||||||||||||||||
| Cr | 0.98m | 1a; 1s; 1b; 1m; 1f | 0.61b | 0.79b | 0.71b | 0.72b | 0.7b | 0.82s;0.81m | 0.74b | 0.7b | 0.81b | |||||||||||||||||
| Cu | 0.67b | 0.64a | 0.67a;0.68b | 0.61b | 1a; 1s; 1b; 1m; 1f | 0.87a | 0.94a;0.8b | 0.9a;0.67b;0.64f | 0.93a;0.73b;0.7m;0.73f | 0.94a;0.8b;0.68f | 0.93a;0.79b;0.63m;0.73f | |||||||||||||||||
| Fe | 0.91f | 0.65a | 0.69a;0.73f | 0.79b | 0.87a | 1a; 1s; 1b; 1m; 1f | 0.9a;0.64b | 0.92a;0.76b | 0.91a;0.71b | 0.92a;0.74b | 0.63m | 0.7a;0.61b | 0.93f | 0.91a;0.84b | ||||||||||||||
| K | 0.63a;0.71b | 0.71a | 0.67a | 0.71b | 0.94a;0.8b | 0.9a;0.64b | 1a; 1s; 1b; 1m; 1f | 0.96a;0.86b;0.64f | 0.97a;0.8b | 0.99a;0.96b;0.73f | 0.6b | 0.96a;0.84b | ||||||||||||||||
| Mg | 0.61a;0.62b | 0.68a | 0.66s | 0.65a;0.61s | 0.64a | 0.68a | 0.72b | 0.9a;0.67b;0.64f | 0.92a;0.76b | 0.96a;0.86b;0.64f | 1a; 1s; 1b; 1m; 1f | 0.95a;0.64s;0.77b;0.82f | 0.97a;0.86b;0.73m;0.86f | 0.96a;0.64s;0.83b;0.81f | ||||||||||||||
| Mn | 0.68a | 0.64a | 0.69a;0.62b | 0.7b | 0.93a;0.73b;0.7m;0.73f | 0.91a;0.71b | 0.97a;0.8b | 0.95a;0.64s;0.77b;0.82f | 1a; 1s; 1b; 1m; 1f | 0.98a;0.73s;0.86b;0.84f | 0.97a;0.66s;0.87b;0.84f | |||||||||||||||||
| Mo | 1a; 1s; 1b; 1m; 1f | 0.77f | ||||||||||||||||||||||||||
| Na | 0.68b | 1a; 1s; 1b; 1m; 1f | 0.73m | |||||||||||||||||||||||||
| Ni | 0.9f | 0.8m | 0.82s;0.81m | 1a; 1s; 1b; 1m; 1f | ||||||||||||||||||||||||
| P | 0.71b | 0.7a | 0.67s | 0.6a | 0.61a | 0.68a | 0.74b | 0.94a;0.8b;0.68f | 0.92a;0.74b | 0.99a;0.96b;0.73f | 0.97a;0.86b;0.73m;0.86f | 0.98a;0.73s;0.86b;0.84f | 1a; 1s; 1b; 1m; 1f | 0.62b | 0.98a;0.87s;0.92b;0.85f | |||||||||||||
| Pb | 0.73m | 1a; 1s; 1b; 1m; 1f | ||||||||||||||||||||||||||
| Sb | 1a; 1s; 1b; 1m; 1f | |||||||||||||||||||||||||||
| Se | 0.63m | 1a; 1s; 1b; 1m; 1f | ||||||||||||||||||||||||||
| Si | 0.75m | 0.7b | 0.7a;0.61b | 0.6b | 0.77f | 0.62b | 1a; 1s; 1b; 1m; 1f | |||||||||||||||||||||
| Sn | 0.63a;0.65s;0.89m | 0.96m | 1a; 1s; 1b; 1m; 1f | 0.8a;0.96m | ||||||||||||||||||||||||
| Ti | 0.89a;0.78b;0.97f | 0.79f | 0.93f | 1a; 1s; 1b; 1m; 1f | ||||||||||||||||||||||||
| Tl | 1a; 1s; 1b; 1m; 1f | |||||||||||||||||||||||||||
| V | 0.68b | 0.87m | 1m | 0.8a;0.96m | 1a; 1s; 1b; 1m; 1f | |||||||||||||||||||||||
| Zn | 0.64b | 0.71a | 0.66s | 0.65a | 0.68a | 0.81b | 0.93a;0.79b;0.63m;0.73f | 0.91a;0.84b | 0.96a;0.84b | 0.96a;0.64s;0.83b;0.81f | 0.97a;0.66s;0.87b;0.84f | 0.98a;0.87s;0.92b;0.85f | 1a; 1s; 1b; 1m; 1f |
Disclaimer/Publisher’s Note: The statements, opinions and data contained in all publications are solely those of the individual author(s) and contributor(s) and not of MDPI and/or the editor(s). MDPI and/or the editor(s) disclaim responsibility for any injury to people or property resulting from any ideas, methods, instructions or products referred to in the content. |
© 2024 by the authors. Licensee MDPI, Basel, Switzerland. This article is an open access article distributed under the terms and conditions of the Creative Commons Attribution (CC BY) license (http://creativecommons.org/licenses/by/4.0/).
Copyright: This open access article is published under a Creative Commons CC BY 4.0 license, which permit the free download, distribution, and reuse, provided that the author and preprint are cited in any reuse.