Submitted:
17 January 2024
Posted:
17 January 2024
You are already at the latest version
Abstract
Obesity is invariably accompanied by autonomic dysfunction, although data in pediatric populations are conflicting. We conducted a systematic review and meta-analysis of 12 studies (totaling 1102 participants) comparing obese and normal-weight subjects (5-18 years of age), defined as body mass index >95th or <85th percentile, respectively. Using a random-effects model, we report the standardized mean differences (SMD) of sympathetic and vagal indices, calculated by heart rate variability. Autonomic dysfunction was present in the obese group, based on the average SMD in the standard deviation of sinus intervals (at -0.5340), and on the ratio of low (LF) to high (HF) frequency spectra (at 0.5735). There was no difference in sympathetic activity, but the heterogeneity among the relevant studies weakens this result. SMD in HF (at 0.5876), in the root mean square of successive differences between intervals (at -0.6333), and in the number of times successive intervals exceeded 50ms divided by the total number of intervals (at -0.5867) indicated lower vagal activity in the obesity group. Thus, autonomic dysfunction is present in obese children and adolescents, attributed to lower vagal activity. Further studies on autonomic function are needed in various pediatric cohorts, placing emphasis on sympathetic activity.
Keywords:
obesity
; heart rate variability
; autonomic nervous system
; sympathetic activity
; vagal activity
; children
; adolescents
1. Introduction
Obesity is an important health-related problem worldwide. It is closely related to established risk factors of atherosclerosis, such as dyslipidemia, hypertension, and diabetes, and plays a key role in its development [1]. Atherosclerosis, associated with high morbidity and mortality rates, affects medium-sized and large arteries, leading to coronary, carotid and peripheral vascular disease. Driven by the high worldwide prevalence of obesity, ongoing research aims at providing further insights into the underlying pathophysiology.
Autonomic dysfunction has been long identified in obese subjects [2], consistently found in subsequent studies examining various cohorts [3]. Moreover, a recent meta-analysis of studies examining weight changes revealed higher sympathetic and lower vagal activity accompanying weight gain, which were reversed after weight loss [4]. These observations carry pathophysiologic and therapeutic implications, as alterations in both autonomic arms have been linked with the progression of atherosclerosis in adult populations [5,6]. However, it remains unclear whether this process is active during the early stages of atheromatous plaque formation. To this end, autopsy studies have provided evidence of asymptomatic plaques in the intima of the aorta, carotid and coronary arteries as early as in the second decade of life [7].
Early-life obesity has emerged as a substantial public health concern, with 30% of the global children and adolescent population classified as overweight [8]. More importantly, childhood obesity often continues during adulthood, implying a continuum in the pathogenesis of atherosclerosis [9,10]. Like in adult populations, autonomic dysfunction has been reported in obese children and adolescents, but the relative contribution of each autonomic arm is uncertain, due to diverse results in hitherto published reports [11,12]. Therefore, the aim of the present work was to further investigate the precise changes underlying autonomic function in obese pediatric populations. For this purpose, we conducted a systematic review and meta-analysis of studies comparing sympathetic and vagal indices between obese and normal-weight children and adolescents.
2. Materials and Methods
The methodology followed in the present work adhered to the PRISMA (Preferred Reporting Items for Systematic Reviews and Meta-Analyses) guidelines [13]; the completed PRISMA statement is provided as Supplementary File 1. The study protocol was prospectively registered in the international prospective register of systematic reviews (PROSPERO, National Institute for Health and Care Research, UK) with registration number CRD42023432583.
2.1. Search Terms
We searched the PubMed (National Institute of Health, USA) and Scopus (Elsevier BV, Amsterdam, The Netherlands) databases for relevant studies published in English language throughout December 2023. The search terms included: "cardiac autonomic dysfunction" OR "autonomic nervous system dysfunction" OR "autonomic dysfunction" OR "heart rate variability" OR "sympathetic nervous system" OR "parasympathetic nervous system" OR “sympathetic activity” OR “vagal activity” OR "heart rate variability"; AND "obesity" OR "overweight" OR "excess weight" OR "adiposity" OR "body mass index" OR "BMI"; AND "children" OR "pediatric" OR "child" OR "adolescents" OR "teenage" OR "youth"; AND "obesity" OR "overweight" OR "excess weight" OR "body mass index" OR "BMI".
2.2. Search strategy and inclusion criteria
We screened observational, cross-sectional studies and registries of children and adolescents, 5-18 years of age, reporting autonomic indices derived from heart rate variability (HRV) analysis of electrocardiographic Holter recordings. Further to animal studies, we excluded systematic reviews, meta-analyses, case reports, and editorials. After examining the full text of pertinent articles, their references were checked for additional suitable studies. Those comparing sympathetic and vagal indices, as well as their balance, between normal-weight and obese subjects were considered eligible for inclusion in our meta-ana lysis. For purposes of the present work, normal weight was defined as body mass index (BMI) below the 85th percentile of the distribution, whereas obesity was defined as BMI above the 95th percentile, in accordance with present guides [14].
2.3. Autonomic variables
Data extraction and evaluation were conducted independently by two authors (G.E.P. and F.B.), with ensuing differences adjudicated after discussions among all. In addition to autonomic data, we extracted information on study design and clinical characteristics. Based on current consensus [15], we extracted variables depicting autonomic balance, as well as sympathetic and vagal activity separately. As no single variable depicts autonomic conditions accurately, we opted their combined use. Specifically, as describing sympatho-vagal balance we selected (a) the standard deviation of the inter-beat interval between normal sinus beats (SDNN) after time-domain HRV analysis, with lower values indicating sympathetic dominance; and (b) the ratio of low (LF, 0.04–0.15 Hz) to high (HF, 0.15–0.4 Hz) frequency spectra after frequency-domain analysis of HRV, with lower values indicating vagal dominance. The peak LF and HF spectra were selected for the description of sympathetic and vagal activity, respectively. As additional variables describing vagal activity, we extracted the root mean square of successive differences between normal heartbeats (RMSSD), and the number of times successive intervals exceeding 50ms, divided by the total number of intervals (PNN50).
2.4. Evaluation of the studies
The search results were evaluated using the previously validated Newcastle-Ottawa quality scale for observational studies [16], a collaborative project between the University of Newcastle, Australia, and the University of Ottawa, Canada. In this tool, a score is given on eight items, facilitating quick visual assessment.
2.5. Heterogeneity
The degree of heterogeneity was estimated using the restricted maximum-likelihood estimator, expressed as τ2, coupled by two additional tests, namely the Q-test and the I2 statistic, as previously described [17]. In cases of heterogeneity, we provide a prediction interval for the true outcomes. Studentized residuals were used to assess outliers, based on values greater than the 100(0.95/(2number of studies)th percentile of a standard normal distribution. Likewise, studies with a Cook's distance greater than the median plus six times the interquartile range of the Cook's distances were considered overly influential.
2.6. Standardized mean differences
Aided by the Jamovi software package [18], the analysis of all variables was performed using the standardized mean difference (SMD, i.e., the observed difference divided by the standard deviation) as the outcome measure, with a random-effects model fitted to the data. The corresponding SMD (with 95% confidence intervals, CI) were calculated, followed by the construction of forest and funnel plots, whereas asymmetry of the latter was assessed using the rank correlation and regression tests. Statistical significance was defined at an alpha value of 0.05.
3. Results
After removal of duplicates, 814 results were identified, of which 33 were further assessed for eligibility. Finally, 12 studies [19,20,21,22,23,24,25,26,27,28,29,30] reporting values separately for each autonomic arm or their balance were included in the meta-analysis. These studies were conducted between the years 2001 and 2016, originating from 5 countries, namely Brazil (4 reports), Italy (4 reports), Mexico (1 report), Turkey (1 report), and the USA (2 reports). The duration of recordings ranged from 20 min to 24 hours. Table 1 shows the results of the Newcastle-Ottawa quality scale.
The PRISMA Flow Diagram used for the study selection process is shown in Figure 1.
3.1. Clinical characteristics
The participants’ demographic and clinical characteristics are summarized in Table 2. As per protocol, BMI differed between the two populations, with values at 28.79 ± 4.18 kg/m2 in obese and 17.07 ± 2.36 kg/m2 in normal-weight subjects. The obesity group consisted of 422 subjects with a mean age of 11.6 ± 2.5 years (48.5% males), whereas the normal-weight group consisted of 680 subjects with a mean age of 9.95 ± 2.56 years (53.7% males). Obese children and adolescents had higher blood pressure readings, with respect to systolic and diastolic blood pressure. In addition, this group tended to have an unfavorable lipid profile, mainly concerning plasma triglyceride levels.
3.2. Heterogeneity
The results of all tests used for the evaluation of heterogeneity are summarized in Table 3.
For variables describing sympatho-vagal balance, absence of significant heterogeneity in the true outcomes was present regarding SDNN. There was no indication of outliers in the context of this model, and none of the studies could be considered overly influential. Among studies reporting LF/HF, moderate heterogeneity was present, but without major indication of outliers or overly influential reports.
There was substantial heterogeneity among studies reporting LF (describing sympathetic activity), as shown by all three relevant tests (i.e., τ2, Q-test, and I² statistic). One study [19] had a value of studentized residuals greater than ± 2.6901; thus, it may be regarded as a potential outlier and as overly influential in the context of this model.
For variables describing vagal activity, there was no heterogeneity in the true outcomes regarding HF and PNN50, without any indication of outliers. However, one study [19] could be considered overly influential in the context of the model reporting both, PNN50 and RMSSD. With respect to the latter variable, there was moderate heterogeneity among the relevant studies, with the regression test indicating funnel plot asymmetry. By contrast, the rank correlation and regression tests showed absence of funnel plot asymmetry in HF and PNN50.
The funnel plots of all variables are shown in Figure 2.
3.3. Autonomic (sympatho-vagal) balance
A total of k=12 studies (with a population of 1102 subjects) were included in the ana lysis of SDNN and LF/HF. The observed standardized mean differences of SDNN ranged from -0.9684 to -0.1284, with an estimated average SMD of -0.5340 (95% CI: -0.6996 to -0.3684), which differed from zero (z = -6.3219, p < 0.0001). The 95% prediction interval for the true outcome is given between -0.8352 and -0.2328, which is in the same direction as the estimated average outcome. The forest plot of SDNN is shown in Figure 3.
The observed SMD of LF/HF ranged from 0.0239 to 1.27, with an estimated average SMD of 0.5735 (95% CI: 0.3622 to 0.7848), which differed from zero (z = 5.3186, p < 0.0001). A 95% prediction interval for the true outcomes is given between 0.0524 and 1.0946. Despite considerable heterogeneity, the true outcomes of the studies were generally in the same direction as the estimated average outcome. The forest plot of LF/HF is shown in Figure 4.
3.4. Sympathetic activity
A total of k=7 studies (with a population of 346 subjects) were included in the analysis of LF. The observed SMD ranged from -1.1107 to 0.7393, with 86% of estimates pointing in one direction. The estimated average SMD was 0.2684 (95% CI: -0.1973 to 0.7340), which did not differ significantly from zero (z = 1.12, p = 0.25). Furthermore, the 95% prediction interval for the true outcome was found between -0.8945 and 1.4313, not excluding the possibility of a true outcome in the opposite direction as the estimated average SMD. The forest plot of LF is shown in Figure 5.
3.5. Vagal activity
A total of k=7 studies (with a population of 346 subjects) were included in the ana lysis of HF. The observed SMD ranged from -1.1164 to -0.3264, with an estimated average SMD of -0.5876 (95% CI: -0.8146 to -0.3605), which differed from zero (z = -5.0712, p < 0.0001). The forest plot of HF is shown in Figure 6.
A total of k=11 studies (with a population of 1030 subjects) were included in the ana lysis of RMSSD. The observed SMD ranged from -1.3992 to -0.1450, with an estimated average SMD of -0.6333 (95% CI: -0.8502 to -0.4164), which differed from zero (z = -5.7226, p < 0.0001). A 95% prediction interval for the true outcome was found between -1.1312 and -0.1354. Values were in the same direction as the estimated average outcome, despite the presence of moderate heterogeneity. The forest plot of RMSSD is shown in Figure 7.
A total of k=9 studies (with a population of 493 subjects) were included in the ana lysis of PNN50. The observed SMD ranged from -1.2996 to -0.0361, with an estimated average SMD of -0.5867 (95% CI: -0.8221 to -0.3514), which differed from zero (z = -4.8857, p < 0.0001). A 95% prediction interval for the true outcome was found between -1.0426 and -0.1309; Values were in the same direction as the estimated average outcome, despite some heterogeneity present. The forest plot of PNN50 is shown in Figure 8.
4. Discussion
In addition to its effects on blood pressure, glucose level and lipid profile, obesity is recognized as independently related to atherosclerosis, although the underlying mechanisms for this association remain under investigation. Indeed, adipose tissue can be viewed as an endocrine organ, with activated adipokines/cytokines promoting endothelial dysfunction and hyperpermeability of the vascular intima that result in the formation of atheromatous plaques [31]. Autonomic dysfunction, accompanying systemic tissue inflammation, is thought to play a central role, as previously shown in adult populations [32]. The long course of atherosclerosis development extends the need for exploring this process in pediatric populations [7].
In the present work, we examined autonomic activity in obese children and adolescents, by performing a meta-analysis of 12 published studies evaluating autonomic function in a pooled population of ~1100 subjects. Their mean age was approximately 10.5 years, with gender participation adequately balanced. We noted a small age difference between cohorts, but it was deemed unlikely to have confounded the autonomic status. Overall, the groups were formed appropriately, as reflected in the mean BMI of 28 kg/m2 and 17 kg/m2 in obese and normal-weight subjects, respectively. Like the observations in adults, obese children and adolescents had higher blood pressure readings and a rather unfavorable lipid profile, indicating co-existence of these factors in pediatric populations as well.
4.1. Autonomic balance
The correlation between autonomic dysfunction and body habitus has been demonstrated nearly three decades ago in a population of 600 male military veterans, between 21 to 80 years of age [33]. Our meta-analysis demonstrates that this process is also active early in life, evidenced by a shift in autonomic balance towards sympathetic prevalence in obese children and adolescents. The degree of heterogeneity among relevant studies describing SDNN was satisfactory, with all values pointing in the same direction. This index is favored as a marker of global autonomic activity, calculated by a straightforward methodology, which enhances the comparability across various reports [34]. Additionally, the LF/HF ratio, also widely used, pointed towards the same direction. Nonetheless, moderate degree of heterogeneity was found among relevant studies, which was solely attributed to the LF component, as discussed below.
4.2. Sympathetic activity
Further to autonomic balance, we evaluated each autonomic arm separately, driven by the distinct effects attributed to their function [35]. Regarding sympathetic activity, such information would be of pathophysiologic and clinical relevance, based on recent evidence suggesting a key role of the sympathetic nervous system in enhancing the inflammatory process and, thereby, atherosclerosis [36]. The underlying mechanisms are currently under active investigation, aiming at the advent of new therapeutic options [5].
Our meta-analysis did not reveal a significant difference in sympathetic activity, as the power of the peak LF spectrum (after frequency-domain HRV analysis) was similar in obese and normal-weight children and adolescents. However, the high degree of heterogeneity observed among the relevant studies substantially weakens this result.
It is unclear to which extent the absence of difference in LF values can be attributed to inherent methodological issues, related to frequency domain analysis, that may have conferred to the observed heterogeneity across studies [37]. More importantly, our neutral result may reflect true variation in sympathetic activity in pediatric populations, given the previously demonstrated relation with the duration of obesity [25], a confounding factor that was not addressed here. Of note, variability regarding sympathetic activity is found also in adult series, reporting higher [38], similar [39], or lower [40] sympathetic activity in obese subjects. Lastly, we did not address the amount of physical activity, which also affects autonomic function [41], a point further discussed below. Thus, our work does not permit solid inferences regarding sympathetic activity in obese pediatric subjects. Further studies including larger populations are needed, perhaps examining children and adolescents separately, given their distinct characteristics. Furthermore, incorporating additional HRV methodology (e.g. detrended fluctuation analysis) may be of value in describing sympathetic indices.
4.3. Vagal activity
We report lower vagal activity in obese children and adolescents, as compared to their normal-weight counterparts. This conclusion is based on the consistent results of our meta-analysis involving three variables, namely RMSSD and PNN50 (both derived from time-domain analysis), as well as the power of the peak HF spectrum. We noted the presence of some degree of heterogeneity regarding RMSSD and PNN50, likely attributed to normal fluctuations of these variables [42], which may have confounded recordings of shorter duration in some reports [19,20,21,22,24,28,30]. Nonetheless, the mean values of the variables describing vagal activity were in the same direction among all studies, and, overall, the funnel plot asymmetry tests were satisfactory.
Our findings extend into pediatric populations the observations establishing a link between lower vagal activity and obesity [38]. Such association is thought to be closely intertwined with physical inactivity in childhood and adolescence, documented in earlier studies of television viewing, followed by reports of mobile and gaming devices [43]. It is generally thought that a sedentary lifestyle, with excessive screen-time at these ages, is linked to obesity through exposure to food marketing and mindless eating, whilst displacing the time spent on physical activities. The role of the latter was elegantly shown in a study included in our meta-analysis [19], in which adolescents completing a 36-session resistance-training course displayed marked improvement in vagal activity. Another study [44] compared four groups, namely obese or lean, physically active or inactive, children (a mean of 9.5 years of age); normal autonomic function was found in physically active participants, irrespective of body weight, strongly suggesting that exercise can increase vagal tone in obese children [44].
Further to high sympathetic activity, low vagal tone has been correlated with the severity of coronary artery disease in adult populations [45]. In this regard, the vagus nerve exerts a pathophysiological role in plaque formation in the coronary [46] and carotid [47] arteries, modulating atherosclerosis-related inflammation. In turn, altered baro- and chemoreceptor reflexes in the diseased carotid sinus can be apparent at early stages of atherosclerosis, a timeframe during which the carotid arteries appear as predilection sites [47]. The reduced vagal activity, reported here, provides further support to its role on early atherosclerosis, when viewed in the context of previous ultrasound findings of abnormal intimal-to-medial thickness in the carotid arteries of obese children and adolescents [48,49,50].
4.4. Limitations
Studies of autonomic function in pediatric populations are characterized by marked heterogeneity that precludes solid inferences. In our meta-analysis, we aimed at providing more information on the activity of each arm, utilizing. a random-effects model that ameliorates methodological differences across various reports. However, we feel that bias could not be eliminated, particularly when interpreting the results on sympathetic activity. In addition, several confounding factors, such as physical activity, or the type (central or peripheral) and duration of obesity were not addressed here.
5. Conclusions
Our meta-analysis demonstrates autonomic dysfunction in obese children and adolescents, which is largely attributed to reduced vagal tone. Sympathetic activity seems to vary, with further research required for clinically meaningful conclusions. Further studies are also deemed necessary in the evaluation of vagal activity in pediatric populations, including overweight subjects with a BMI between the 85th and 95th percentile of the distribution. Future work should examine pre-pubertal and pubertal cohorts separately, considering the correlation between metabolic parameters (varying across the periods of development) and HRV [51]. The role of afferent vagal neurons in controlling metabolism merits particular attention, in view of the established relation between vagal afferent signaling and loss of control eating, an observation with recently instituted therapeutic implications in obese adults [52]. Understanding the impact of autonomic dysfunction in obesity may aid in the implementation of simple and effective therapeutic strategies that will mitigate the long-term untoward health consequences.
Supplementary Materials
The following supporting information can be downloaded at: Preprints.org, Table S1: PRISMA statement.
Author Contributions
Conceptualization, T.M.K.; methodology, G.E.P., F.B., X.M.S, D.N.N., V.G. and T.M.K.; validation, G.E.P., F.B., X.M.S., C.T., D.N.N., V.G. and T.M.K.; formal analysis, G.E.P., F.B., V.G. and T.M.K.; data curation, G.E.P., F.B., and T.M.K.; writing—original draft preparation, G.E.P. and T.M.K.; writing—review and editing, G.E.P., F.B., X.M.S., C.T., D.N.N., V.G. and T.M.K; supervision, V.G. and T.M.K.
Funding
This research received no external funding.
Institutional Review Board Statement
Not applicable.
Conflicts of Interest
The authors declare no conflicts of interest.
References
- Katta, N.; Loethen, T.; Lavie, C.J.; Alpert, M.A. Obesity and coronary heart disease: epidemiology, pathology, and coronary artery imaging. Curr Probl Cardiol 2021, 46, 100655. [Google Scholar] [CrossRef] [PubMed]
- Peterson, H.R.; Rothschild, M.; Weinberg, C.R.; Fell, R.D.; McLeish, K.R.; Pfeifer, M.A. Body fat and the activity of the autonomic nervous system. N Engl J Med 1988, 318, 1077–1083. [Google Scholar] [CrossRef] [PubMed]
- Chen, G.Y.; Hsiao, T.J.; Lo, H.M.; Kuo, C.D. Abdominal obesity is associated with autonomic nervous derangement in healthy Asian obese subjects. Clin Nutr 2008, 27, 212–217. [Google Scholar] [CrossRef] [PubMed]
- Costa, J.; Moreira, A.; Moreira, P.; Delgado, L.; Silva, D. Effects of weight changes in the autonomic nervous system: A systematic review and meta-analysis. Clin Nutr 2019, 38, 110–126. [Google Scholar] [CrossRef] [PubMed]
- Wang, Y.; Anesi, J.; Maier, M.C.; Myers, M.A.; Oqueli, E.; Sobey, C.G.; Drummond, G.R.; Denton, K.M. Sympathetic Nervous System and Atherosclerosis. Int J Mol Sci 2023, 24. [Google Scholar] [CrossRef] [PubMed]
- Guarino, D.; Nannipieri, M.; Iervasi, G.; Taddei, S.; Bruno, R.M. The Role of the Autonomic Nervous System in the Pathophysiology of Obesity. Front Physiol 2017, 8, 665. [Google Scholar] [CrossRef] [PubMed]
- Imakita, M.; Yutani, C.; Sakurai, I.; Sumiyoshi, A.; Watanabe, T.; Mitsumata, M.; Kusumi, Y.; Katayama, S.; Mano, M.; Baba, S.; et al. The second nationwide study of atherosclerosis in infants, children, and young adults in Japan. Comparison with the first study carried out 13 years ago. Ann N Y Acad Sci 2000, 902, 364–368. [Google Scholar] [CrossRef] [PubMed]
- Ng, M.; Fleming, T.; Robinson, M.; Thomson, B.; Graetz, N.; Margono, C.; Mullany, E.C.; Biryukov, S.; Abbafati, C.; Abera, S.F.; et al. Global, regional, and national prevalence of overweight and obesity in children and adults during 1980-2013: a systematic analysis for the Global Burden of Disease Study 2013. Lancet 2014, 384, 766–781. [Google Scholar] [CrossRef]
- Brisbois, T.D.; Farmer, A.P.; McCargar, L.J. Early markers of adult obesity: a review. Obes Rev 2012, 13, 347–367. [Google Scholar] [CrossRef]
- Singh, A.S.; Mulder, C.; Twisk, J.W.; van Mechelen, W.; Chinapaw, M.J. Tracking of childhood overweight into adulthood: a systematic review of the literature. Obes Rev 2008, 9, 474–488. [Google Scholar] [CrossRef]
- Rajalakshmi, R.; Veliath, S.; Krishnamurthy, N.; Thenmozhi, M. Comparison of Cardiovascular Parameters and Cardiac Autonomic Activity of Obese and Normal Weight School Children in Puducherry. Indian J Physiol Pharmacol 2016, 60, 247–254. [Google Scholar] [PubMed]
- Qi, Z.; Ding, S. Obesity-associated sympathetic overactivity in children and adolescents: the role of catecholamine resistance in lipid metabolism. J Pediatr Endocrinol Metab 2016, 29, 113–125. [Google Scholar] [CrossRef] [PubMed]
- Liberati, A.; Altman, D.G.; Tetzlaff, J.; Mulrow, C.; Gøtzsche, P.C.; Ioannidis, J.P.; Clarke, M.; Devereaux, P.J.; Kleijnen, J.; Moher, D. The PRISMA statement for reporting systematic reviews and meta-analyses of studies that evaluate health care interventions: explanation and elaboration. PLoS Med 2009, 6, e1000100. [Google Scholar] [CrossRef] [PubMed]
- Hampl, S.E.; Hassink, S.G.; Skinner, A.C.; Armstrong, S.C.; Barlow, S.E.; Bolling, C.F.; Avila Edwards, K.C.; Eneli, I.; Hamre, R.; Joseph, M.M.; et al. Clinical Practice Guideline for the Evaluation and Treatment of Children and Adolescents With Obesity. Pediatrics 2023, 151. [Google Scholar] [CrossRef]
- Task Force Report. Heart rate variability: standards of measurement, physiological interpretation and clinical use. Task Force of the European Society of Cardiology and the North American Society of Pacing and Electrophysiology. Circulation 1996, 93, 1043–1065. [Google Scholar] [CrossRef]
- Deeks, J.J.; Dinnes, J.; D'Amico, R.; Sowden, A.J.; Sakarovitch, C.; Song, F.; Petticrew, M.; Altman, D.G.; International Stroke Trial Collaborative, G.; European Carotid Surgery Trial Collaborative, G. Evaluating non-randomised intervention studies. Health Technol Assess 2003, 7, iii-x, 1-173. [Google Scholar] [CrossRef] [PubMed]
- Viechtbauer, W. Conducting Meta-Analyses in R with the metafor Package. Journal of Statistical Software 2010, 36, 1–48. [Google Scholar] [CrossRef]
- The Jamovi project. Jamovi, 2.4.; 2023. https://www.jamovi.org/.
- Farinatti, P.; Neto, S.R.M.; Dias, I.; Cunha, F.A.; Bouskela, E.; Kraemer-Aguiar, L.G. Short-Term Resistance Training Attenuates Cardiac Autonomic Dysfunction in Obese Adolescents. Pediatric Exercise Science 2016, 28, 374–380. [Google Scholar] [CrossRef]
- Freitas, I.M.; Miranda, J.A.; Mira, P.A.; Lanna, C.M.; Lima, J.R.; Laterza, M.C. Cardiac autonomic dysfunction in obese normotensive children and adolescents. Rev Paul Pediatr 2014, 32, 244–249. [Google Scholar] [CrossRef]
- Guízar, J.M.; Ahuatzin, R.; Amador, N.; Sánchez, G.; Romer, G. Heart autonomic function in overweight adolescents. Indian Pediatr 2005, 42, 464–469. [Google Scholar]
- Kaufman, C.L.; Kaiser, D.R.; Steinberger, J.; Kelly, A.S.; Dengel, D.R. Relationships of cardiac autonomic function with metabolic abnormalities in childhood obesity. Obesity (Silver Spring) 2007, 15, 1164–1171. [Google Scholar] [CrossRef] [PubMed]
- Martini, G.; Riva, P.; Rabbia, F.; Molini, V.; Ferrero, G.B.; Cerutti, F.; Carra, R.; Veglio, F. Heart rate variability in childhood obesity. Clin Auton Res 2001, 11, 87–91. [Google Scholar] [CrossRef] [PubMed]
- Paschoal, M.A.; Trevizan, P.F.; Scodeler, N.F. Heart rate variability, blood lipids and physical capacity of obese and non-obese children. Arq Bras Cardiol 2009, 93, 239–246. [Google Scholar] [CrossRef] [PubMed]
- Rabbia, F.; Silke, B.; Conterno, A.; Grosso, T.; De Vito, B.; Rabbone, I.; Chiandussi, L.; Veglio, F. Assessment of cardiac autonomic modulation during adolescent obesity. Obes Res 2003, 11, 541–548. [Google Scholar] [CrossRef] [PubMed]
- Rabbone, I.; Bobbio, A.; Rabbia, F.; Bertello, M.C.; Ignaccoldo, M.G.; Saglio, E.; Morello, F.; Veglio, F.; Pacini, G.; Cerutti, F. Early cardiovascular autonomic dysfunction, beta cell function and insulin resistance in obese adolescents. Acta Biomed 2009, 80, 29–35. [Google Scholar] [PubMed]
- Riva, P.; Martini, G.; Rabbia, F.; Milan, A.; Paglieri, C.; Chiandussi, L.; Veglio, F. Obesity and autonomic function in adolescence. Clin Exp Hypertens 2001, 23, 57–67. [Google Scholar] [CrossRef] [PubMed]
- Rodríguez-Colón, S.M.; Bixler, E.O.; Li, X.; Vgontzas, A.N.; Liao, D. Obesity is associated with impaired cardiac autonomic modulation in children. Int J Pediatr Obes 2011, 6, 128–134. [Google Scholar] [CrossRef]
- Taşçılar, M.E.; Yokuşoğlu, M.; Boyraz, M.; Baysan, O.; Köz, C.; Dündaröz, R. Cardiac autonomic functions in obese children. J Clin Res Pediatr Endocrinol 2011, 3, 60–64. [Google Scholar] [CrossRef]
- Vanderlei, L.C.; Pastre, C.M.; Freitas Júnior, I.F.; Godoy, M.F. Analysis of cardiac autonomic modulation in obese and eutrophic children. Clinics (Sao Paulo) 2010, 65, 789–792. [Google Scholar] [CrossRef]
- Henning, R.J. Obesity and obesity-induced inflammatory disease contribute to atherosclerosis: a review of the pathophysiology and treatment of obesity. Am J Cardiovasc Dis 2021, 11, 504–529. [Google Scholar]
- Valensi, P. Autonomic nervous system activity changes in patients with hypertension and overweight: role and therapeutic implications. Cardiovasc Diabetol 2021, 20, 170. [Google Scholar] [CrossRef]
- Freeman, R.; Weiss, S.T.; Roberts, M.; Zbikowski, S.M.; Sparrow, D. The relationship between heart rate variability and measures of body habitus. Clin Auton Res 1995, 5, 261–266. [Google Scholar] [CrossRef]
- Heart rate variability: standards of measurement, physiological interpretation and clinical use. Task Force of the European Society of Cardiology and the North American Society of Pacing and Electrophysiology. Circulation 1996, 93, 1043–1065. [CrossRef]
- Indumathy, J.; Pal, G.K.; Pal, P.; Ananthanarayanan, P.H.; Parija, S.C.; Balachander, J.; Dutta, T.K. Association of sympathovagal imbalance with obesity indices, and abnormal metabolic biomarkers and cardiovascular parameters. Obes Res Clin Pract 2015, 9, 55–66. [Google Scholar] [CrossRef] [PubMed]
- Mohanta, S.K.; Peng, L.; Li, Y.; Lu, S.; Sun, T.; Carnevale, L.; Perrotta, M.; Ma, Z.; Forstera, B.; Stanic, K.; et al. Neuroimmune cardiovascular interfaces control atherosclerosis. Nature 2022, 605, 152–159. [Google Scholar] [CrossRef]
- Lu, L.; Zhu, T.; Morelli, D.; Creagh, A.; Liu, Z.; Yang, J.; Liu, F.; Zhang, Y.T.; Clifton, D.A. Uncertainties in the Analysis of Heart Rate Variability: A Systematic Review. IEEE Rev Biomed Eng 2023, PP. [Google Scholar] [CrossRef] [PubMed]
- Zahorska-Markiewicz, B.; Kuagowska, E.; Kucio, C.; Klin, M. Heart rate variability in obesity. Int J Obes Relat Metab Disord 1993, 17, 21–23. [Google Scholar] [PubMed]
- Rossi, M.; Marti, G.; Ricordi, L.; Fornasari, G.; Finardi, G.; Fratino, P.; Bernardi, L. Cardiac autonomic dysfunction in obese subjects. Clin Sci (Lond) 1989, 76, 567–572. [Google Scholar] [CrossRef]
- Laederach-Hofmann, K.; Mussgay, L.; Ruddel, H. Autonomic cardiovascular regulation in obesity. J Endocrinol 2000, 164, 59–66. [Google Scholar] [CrossRef]
- Espinoza-Salinas, A.; Molina-Sotomayor, E.; Cano-Montoya, J.; Gonzalez-Jurado, J.A. Is Active Lifestyle Related to Autonomic Nervous System Function and Lipid Profile in People with Overweight? A Study Pilot. 2021, 13, 2439. [Google Scholar] [CrossRef]
- Shaffer, F.; Ginsberg, J.P. An Overview of Heart Rate Variability Metrics and Norms. Front Public Health 2017, 5, 258. [Google Scholar] [CrossRef] [PubMed]
- Jebeile, H.; Kelly, A.S.; O'Malley, G.; Baur, L.A. Obesity in children and adolescents: epidemiology, causes, assessment, and management. Lancet Diabetes Endocrinol 2022, 10, 351–365. [Google Scholar] [CrossRef] [PubMed]
- Nagai, N.; Moritani, T. Effect of physical activity on autonomic nervous system function in lean and obese children. International Journal of Obesity 2004, 28, 27–33. [Google Scholar] [CrossRef] [PubMed]
- Hayano, J.; Yamada, A.; Mukai, S.; Sakakibara, Y.; Yamada, M.; Ohte, N.; Hashimoto, T.; Fujinami, T.; Takata, K. Severity of coronary atherosclerosis correlates with the respiratory component of heart rate variability. Am Heart J 1991, 121, 1070–1079. [Google Scholar] [CrossRef] [PubMed]
- Gidron, Y.; Kupper, N.; Kwaijtaal, M.; Winter, J.; Denollet, J. Vagus-brain communication in atherosclerosis-related inflammation: a neuroimmunomodulation perspective of CAD. Atherosclerosis 2007, 195, e1–9. [Google Scholar] [CrossRef] [PubMed]
- Rupprecht, S.; Finn, S.; Hoyer, D.; Guenther, A.; Witte, O.W.; Schultze, T.; Schwab, M. Association Between Systemic Inflammation, Carotid Arteriosclerosis, and Autonomic Dysfunction. Transl Stroke Res 2020, 11, 50–59. [Google Scholar] [CrossRef]
- Iannuzzi, A.; Licenziati, M.R.; Acampora, C.; Salvatore, V.; Auriemma, L.; Romano, M.L.; Panico, S.; Rubba, P.; Trevisan, M. Increased Carotid Intima-Media Thickness and Stiffness in Obese Children. Diabetes Care 2004, 27, 2506–2508. [Google Scholar] [CrossRef]
- Reinehr, T.; Kiess, W.; de Sousa, G.; Stoffel-Wagner, B.; Wunsch, R. Intima media thickness in childhood obesity: relations to inflammatory marker, glucose metabolism, and blood pressure. Metabolism 2006, 55, 113–118. [Google Scholar] [CrossRef]
- Woo, K.S.; Chook, P.; Yu, C.W.; Sung, R.Y.; Qiao, M.; Leung, S.S.; Lam, C.W.; Metreweli, C.; Celermajer, D.S. Overweight in children is associated with arterial endothelial dysfunction and intima-media thickening. Int J Obes Relat Metab Disord 2004, 28, 852–857. [Google Scholar] [CrossRef]
- El-Ayash, H.; Puyau, M.; Bacha, F. Hyperglycemia: A determinant of cardiac autonomic dysfunction in youth with obesity across the spectrum of glycemic regulation. Pediatr Obes 2023, 18, e13063. [Google Scholar] [CrossRef]
- Godfrey, K.M.; Juarascio, A.; Manasse, S.; Minassian, A.; Risbrough, V.; Afari, N. Heart rate variability and emotion regulation among individuals with obesity and loss of control eating. Physiol Behav 2019, 199, 73–78. [Google Scholar] [CrossRef]
Figure 1.
PRISMA flow diagram; k stands for the number of studies.
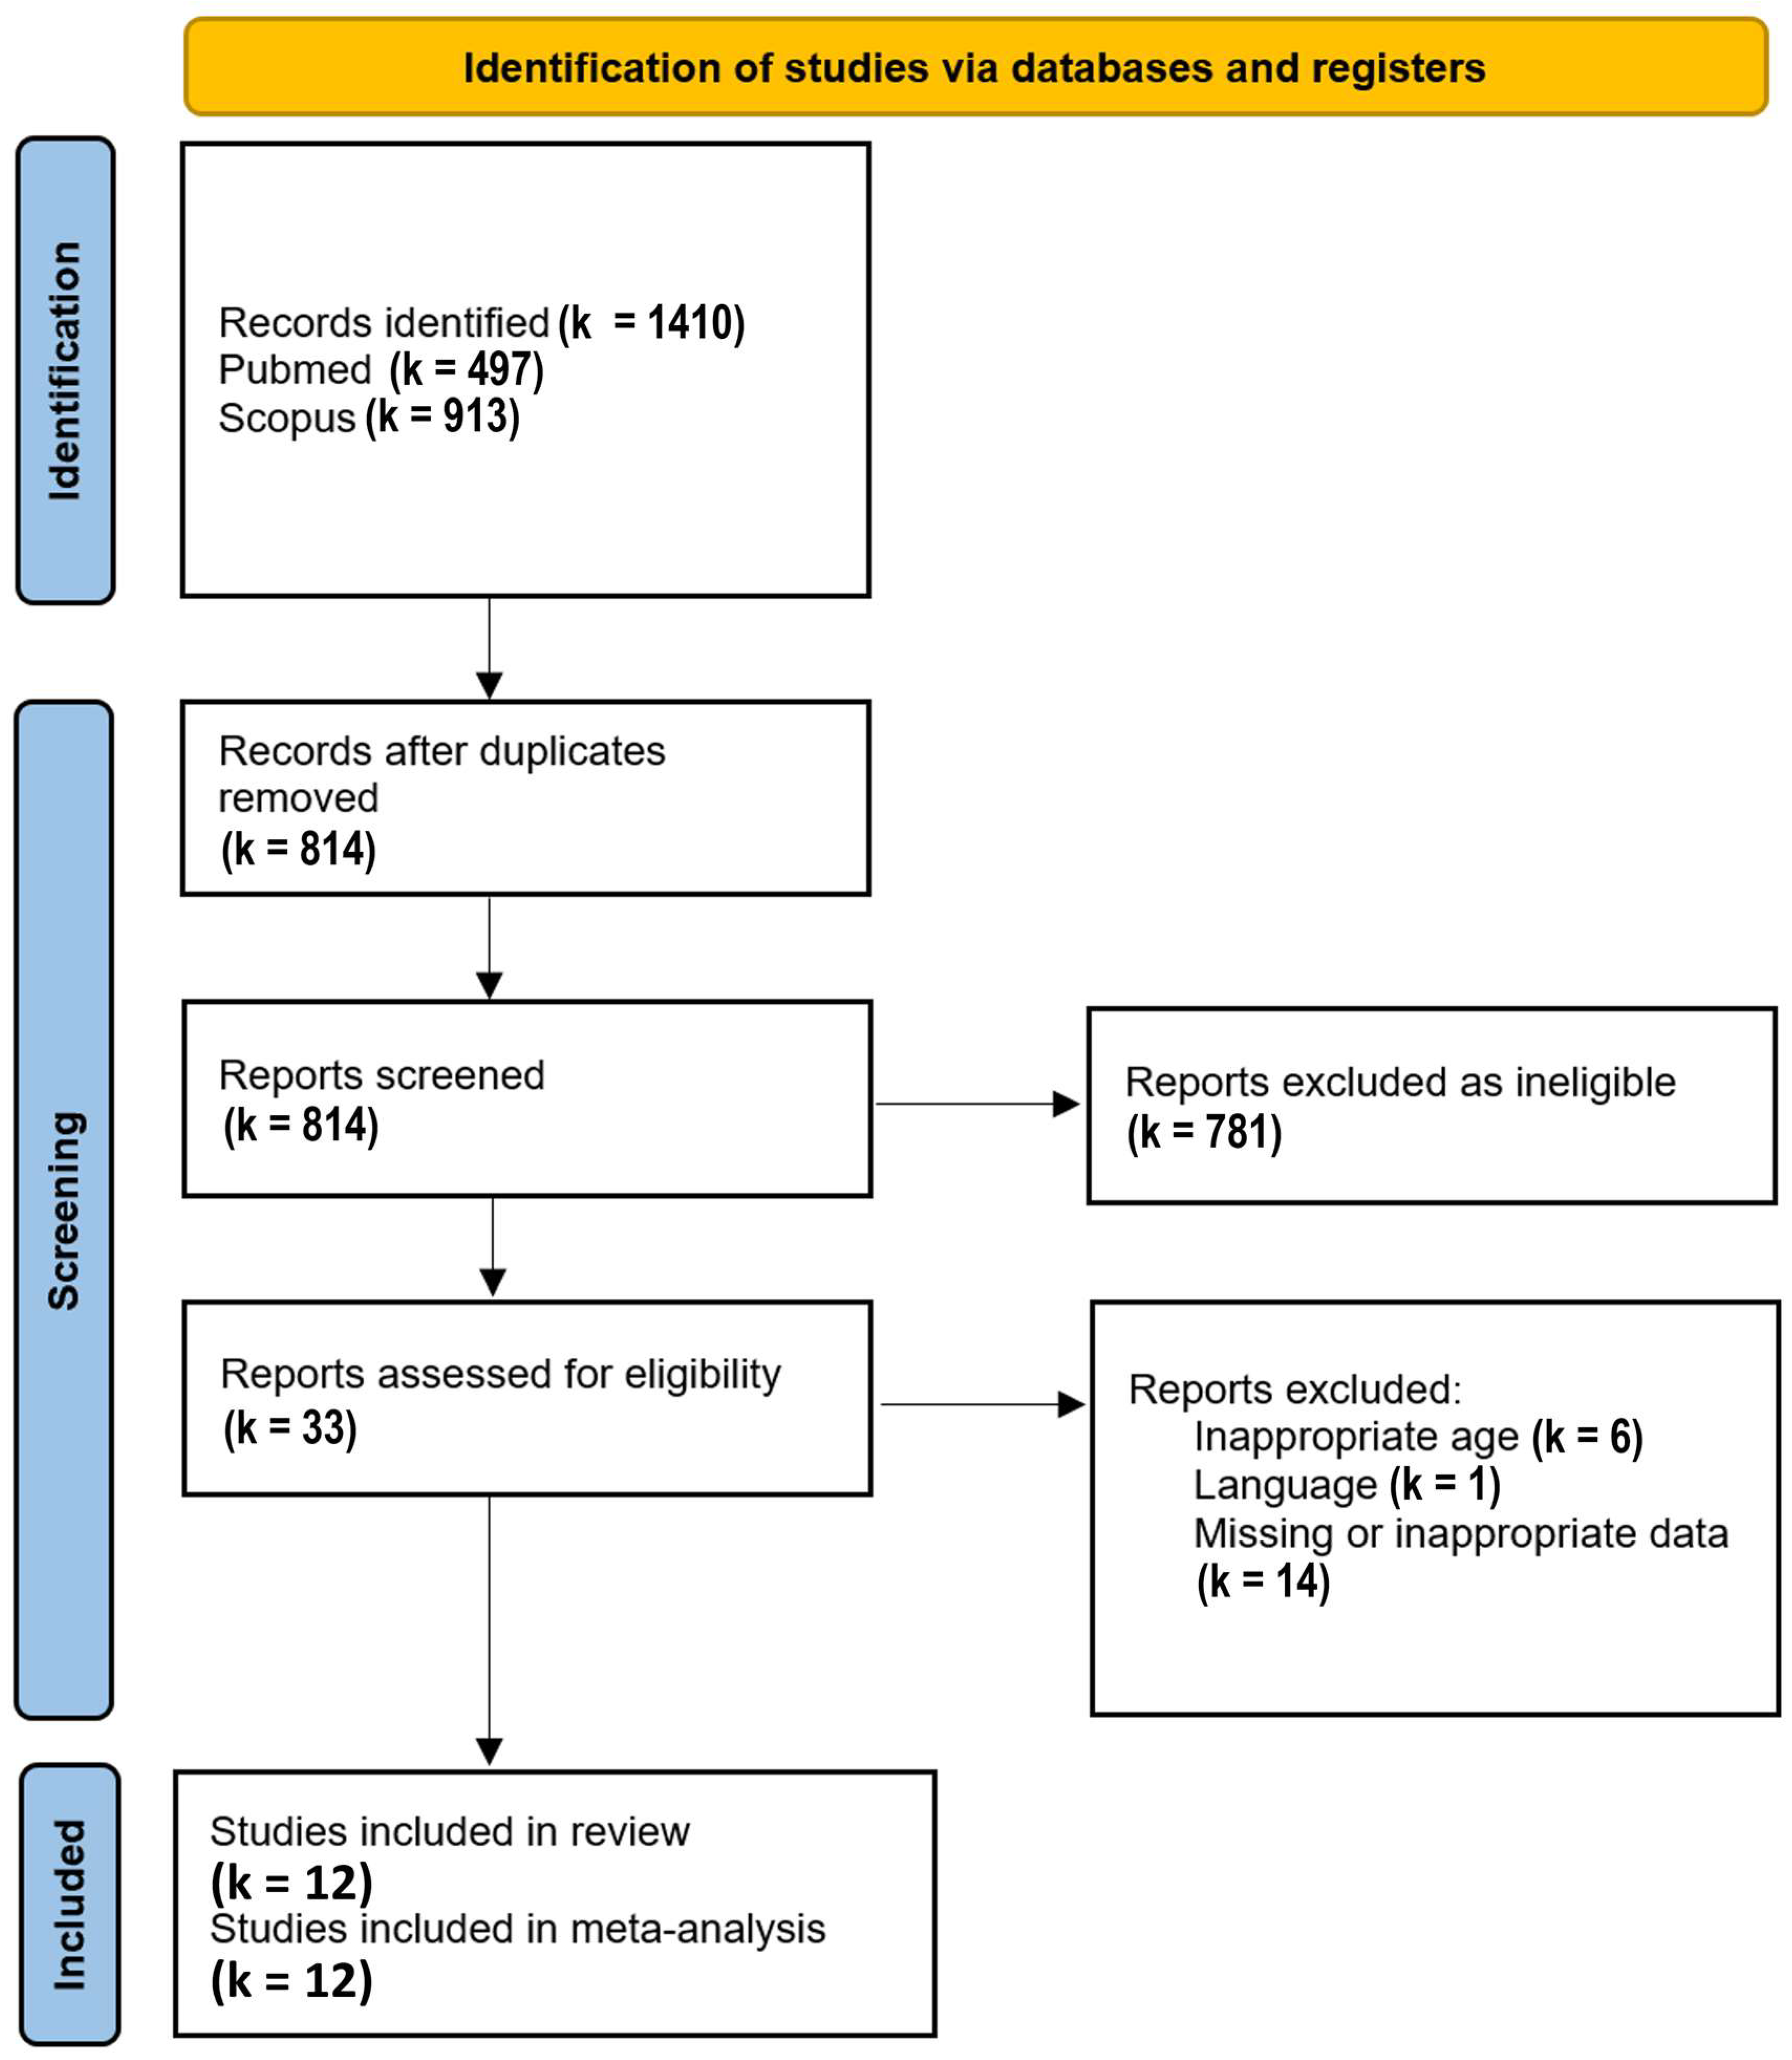
Figure 2.
Funnel plots of all variables. Note the heterogeneity, particularly in the low frequency (LF) spectrum and in the ratio of LF to high frequency (HF) spectra after frequency-domain analysis. SDNN: standard deviation of the inter-beat interval between sinus beats, RMSSD: root mean square of successive differences between normal intervals, PNN50: number of times successive intervals exceed 50ms, divided by the total number of intervals. Red dots depict reports outlying the funnel.
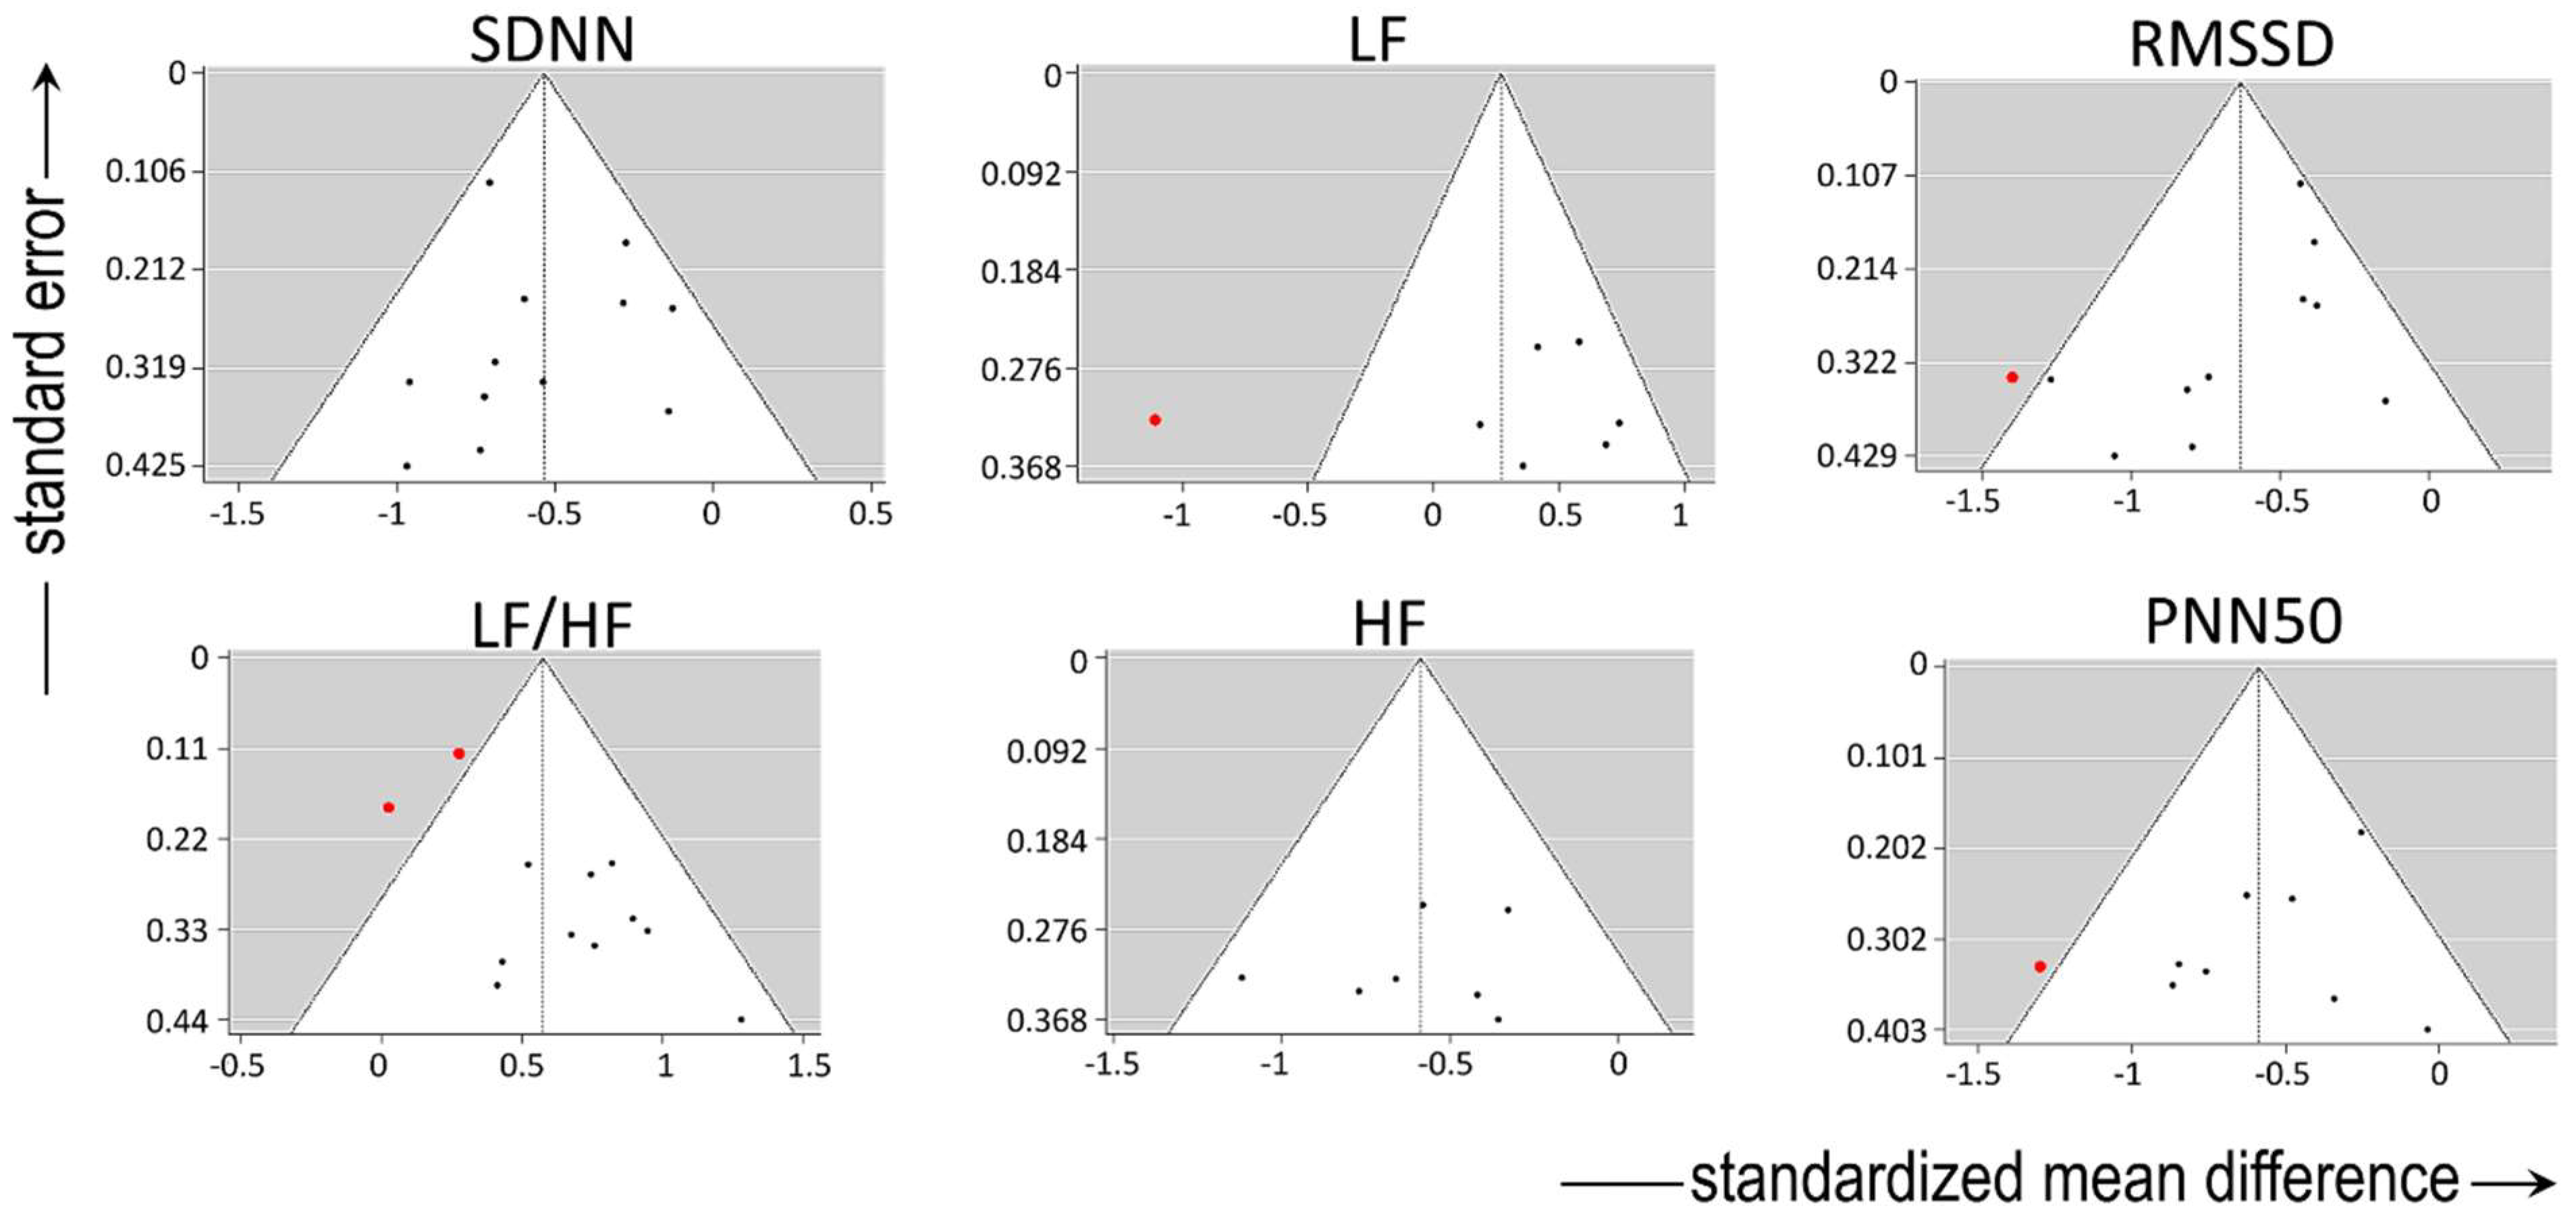
Figure 3.
Forest plot of the standard deviation of the inter-beat interval between sinus beats (SDNN), depicting sympatho-vagal balance. The standardized mean difference (SMD) indicated tilt of autonomic balance towards sympathetic prevalence in the obesity group.
Figure 3.
Forest plot of the standard deviation of the inter-beat interval between sinus beats (SDNN), depicting sympatho-vagal balance. The standardized mean difference (SMD) indicated tilt of autonomic balance towards sympathetic prevalence in the obesity group.
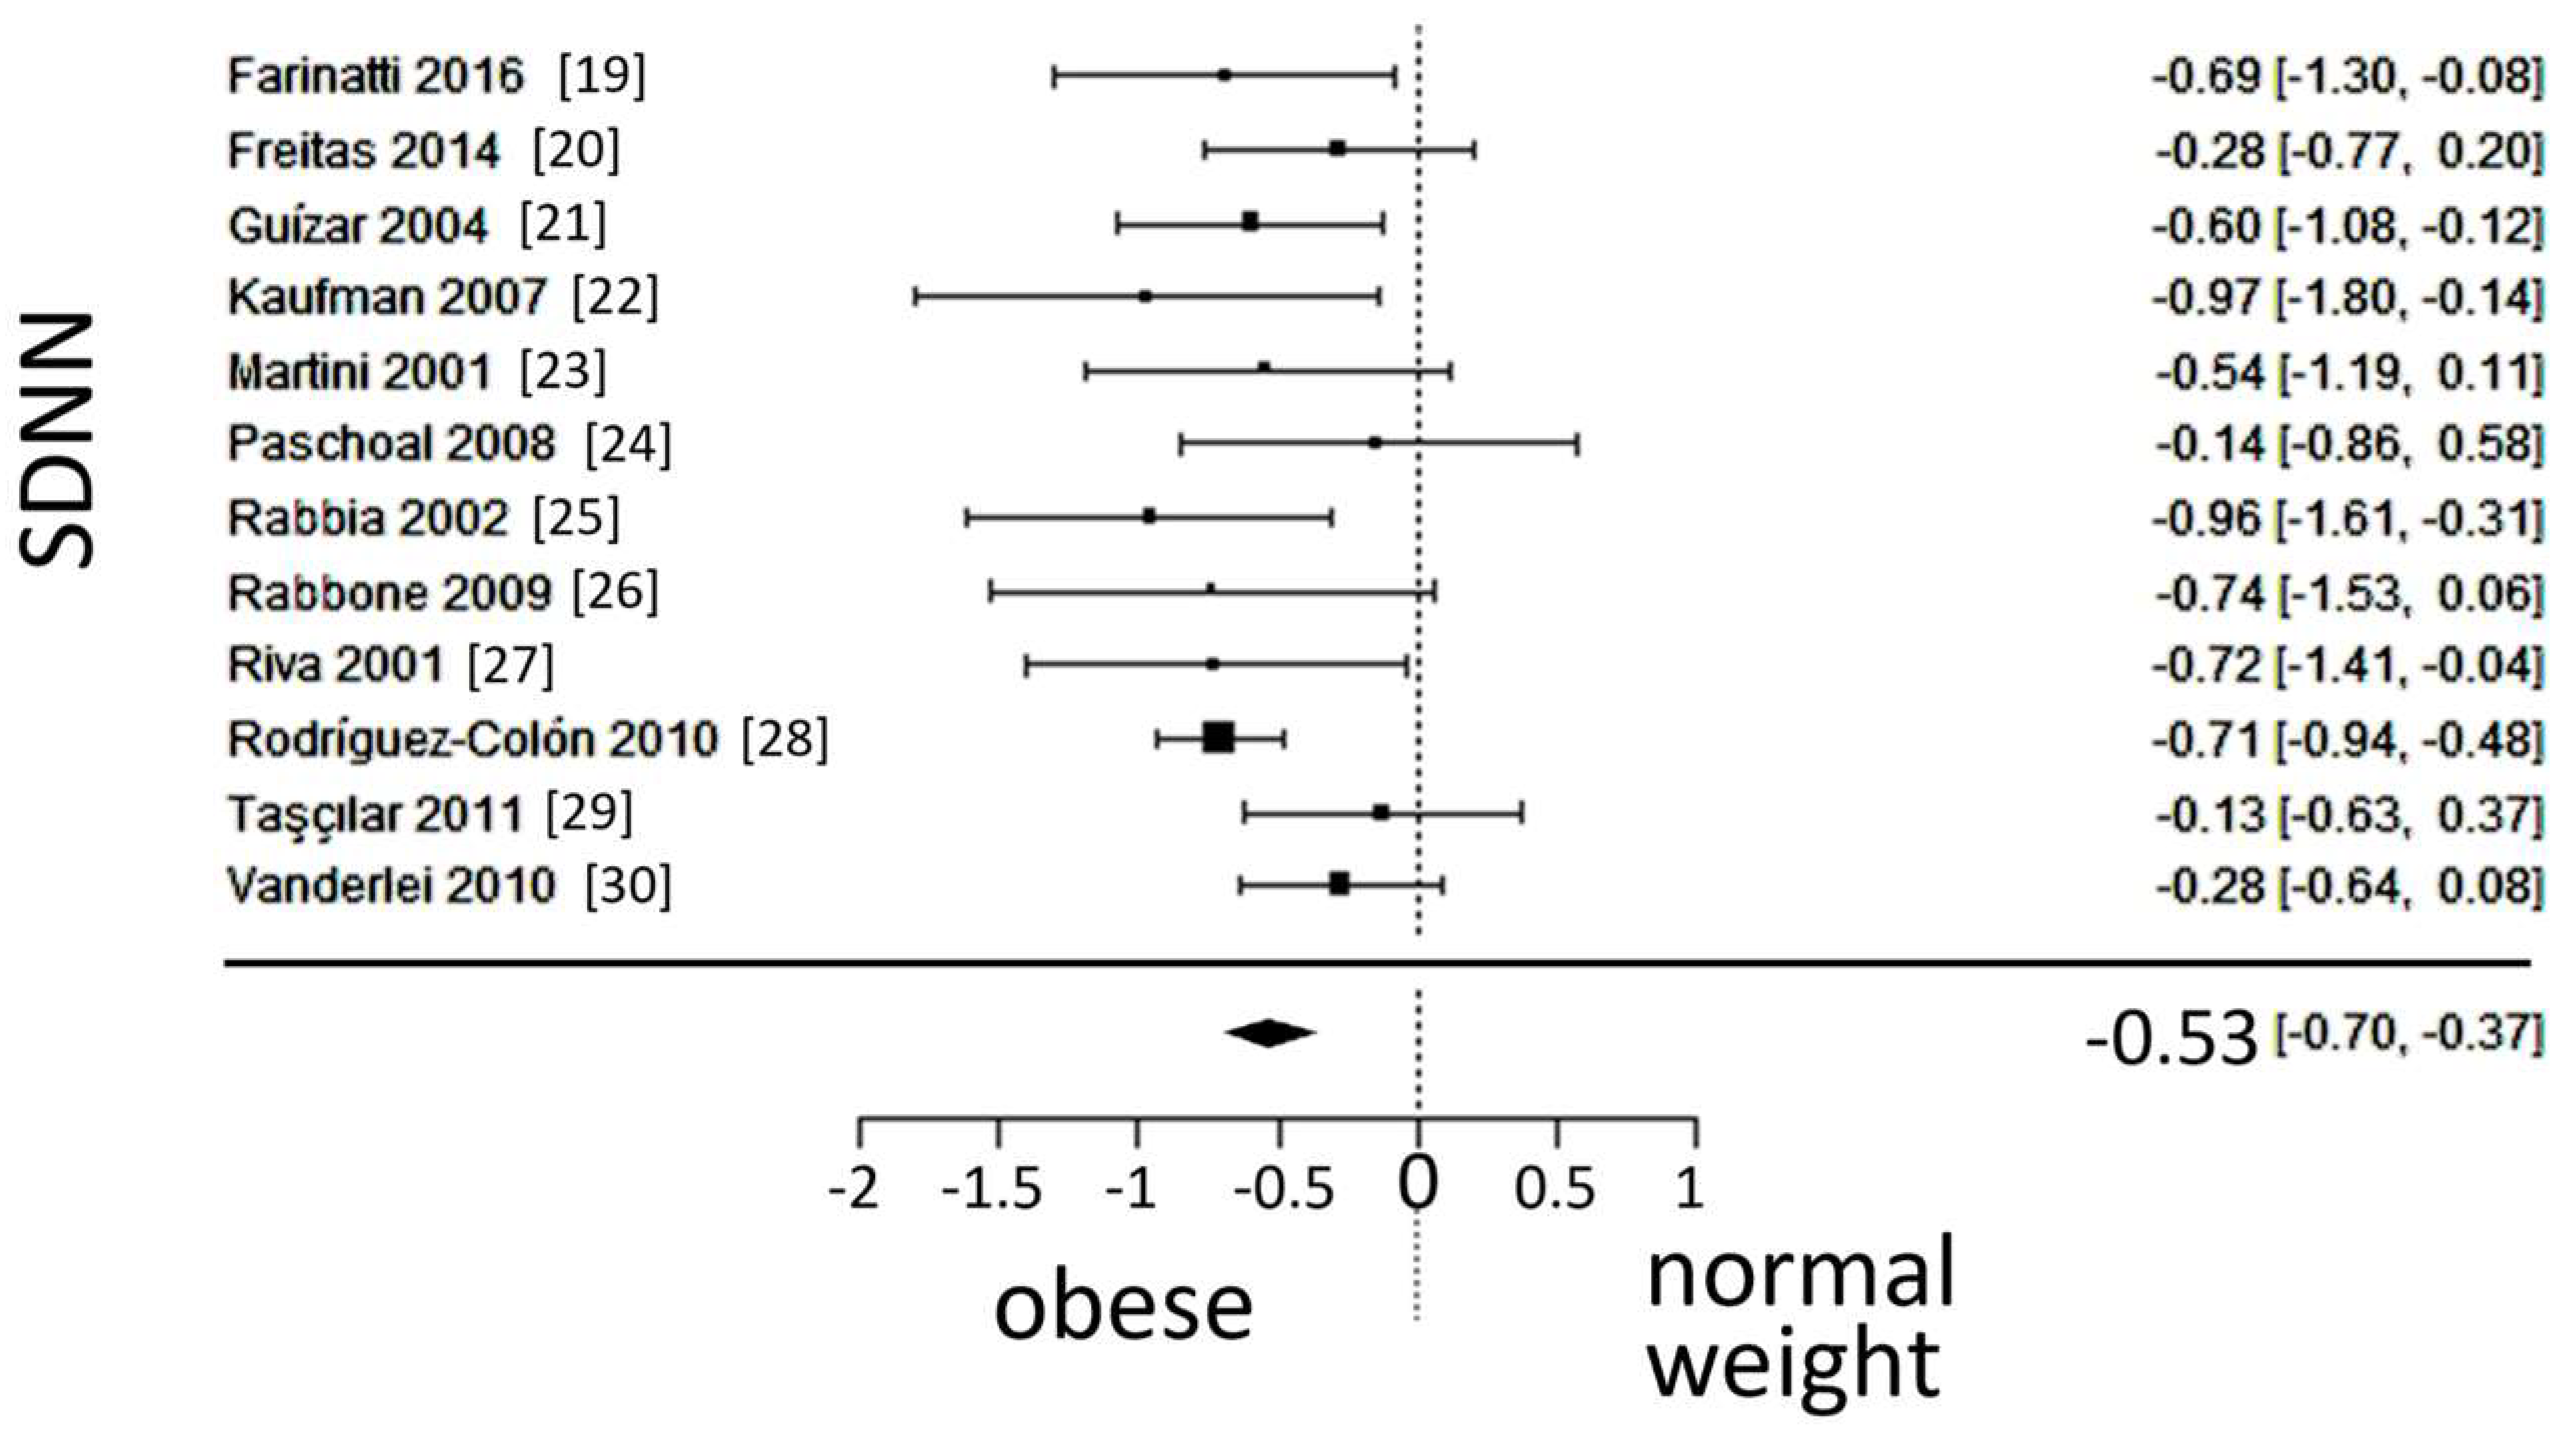
Figure 4.
Forest plot of the in the ratio of low (LF) to high frequency (HF) spectra after frequency-domain analysis. The standardized mean difference (SMD) indicated tilt of autonomic balance towards vagal prevalence in the normal-weight group.
Figure 4.
Forest plot of the in the ratio of low (LF) to high frequency (HF) spectra after frequency-domain analysis. The standardized mean difference (SMD) indicated tilt of autonomic balance towards vagal prevalence in the normal-weight group.
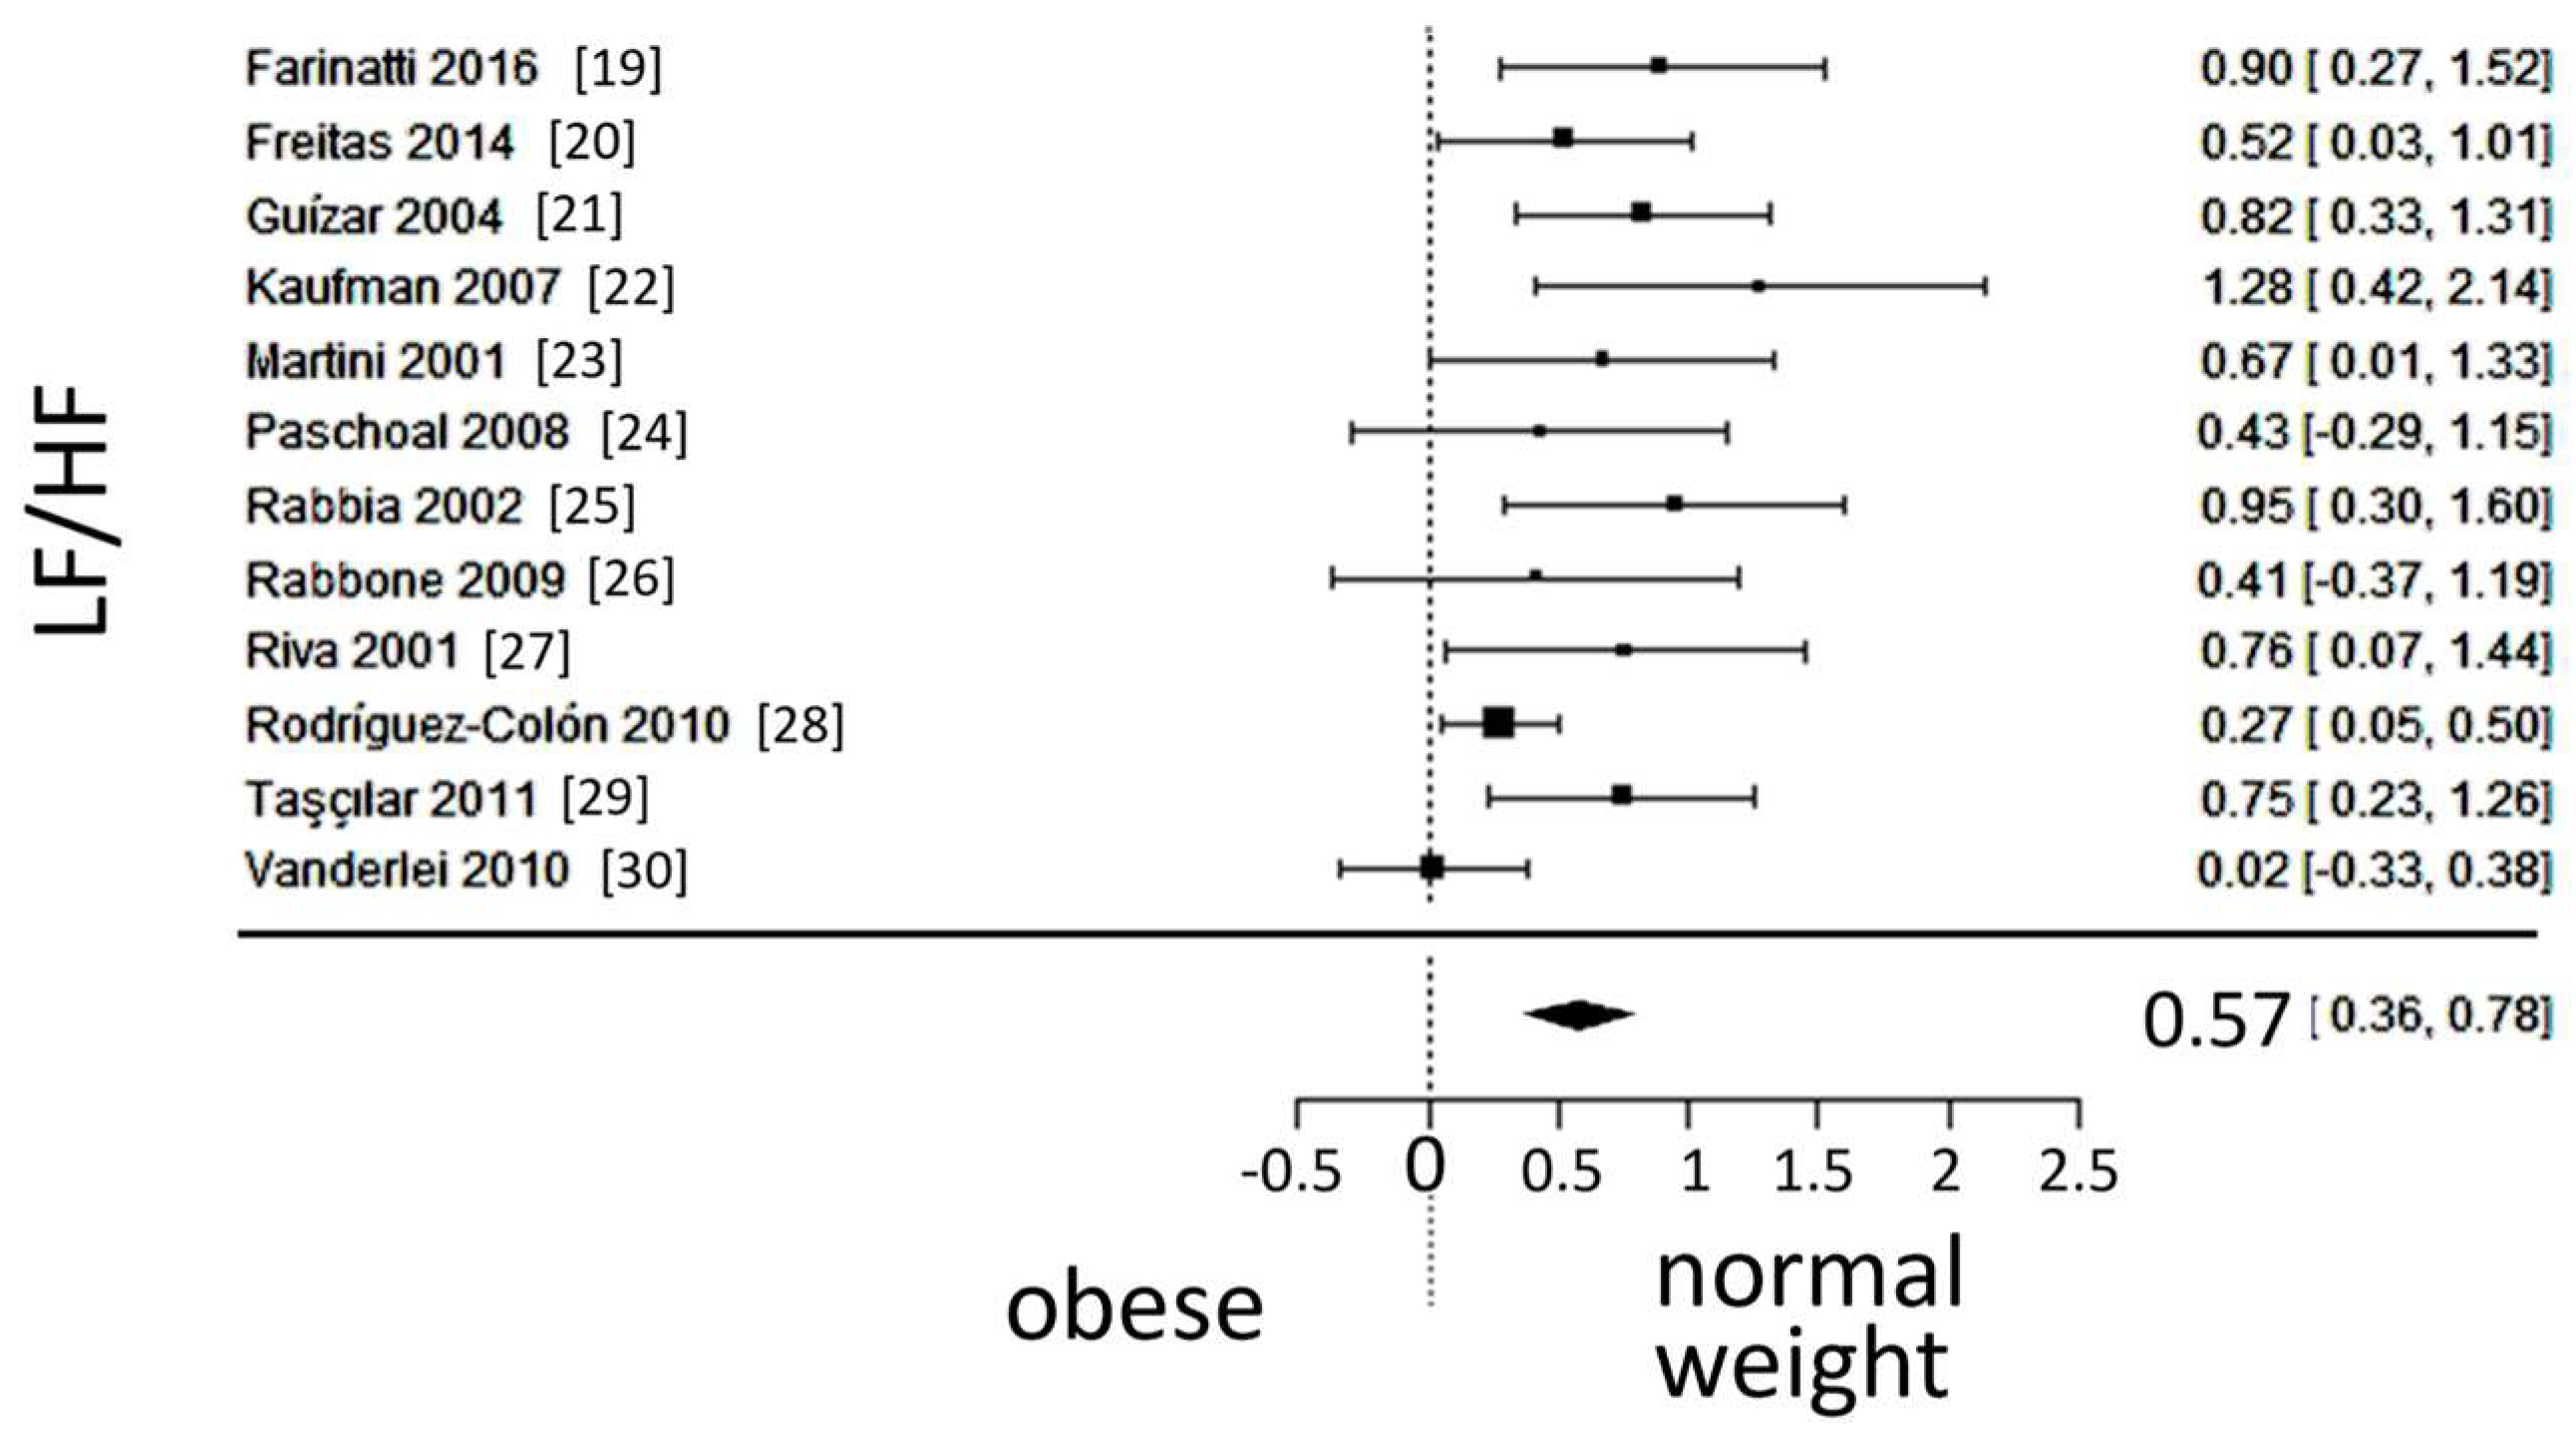
Figure 5.
Forest plot of the in the low frequency (LF) spectrum after frequency-domain analysis, depicting sympathetic activity. The standardized mean difference (SMD) failed to show a difference between the groups.
Figure 5.
Forest plot of the in the low frequency (LF) spectrum after frequency-domain analysis, depicting sympathetic activity. The standardized mean difference (SMD) failed to show a difference between the groups.
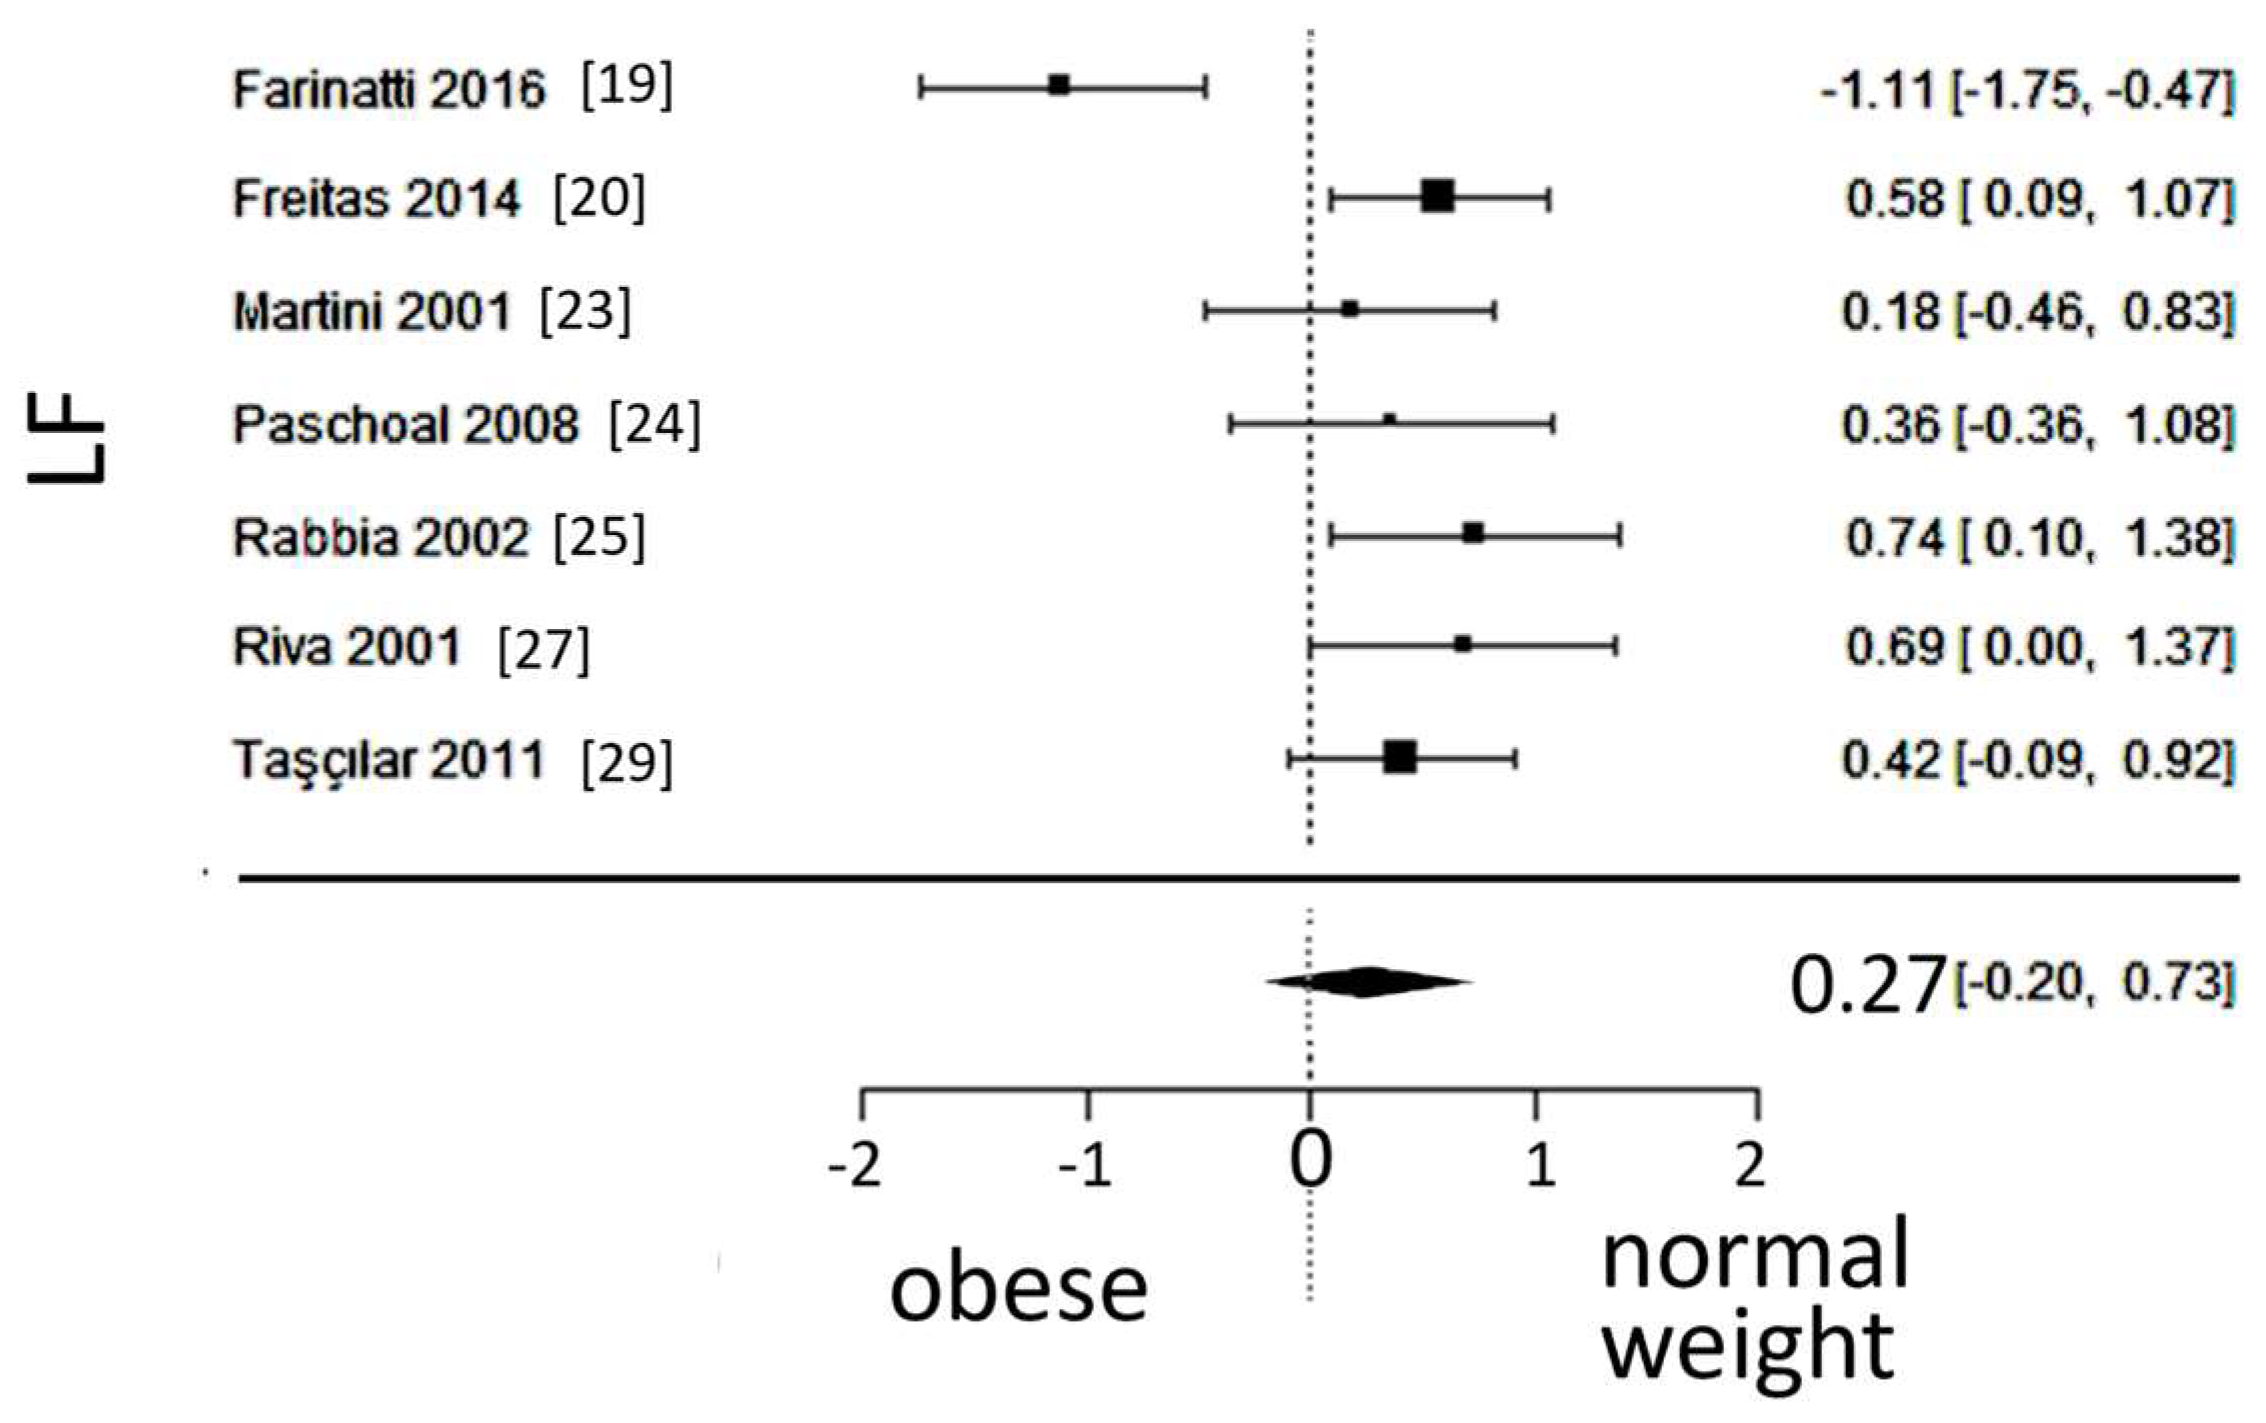
Figure 6.
Forest plot of the in the low frequency (HF) spectrum after frequency-domain ana lysis, depicting vagal activity. The standardized mean difference (SMD) indicated lower vagal activity in the obesity group.
Figure 6.
Forest plot of the in the low frequency (HF) spectrum after frequency-domain ana lysis, depicting vagal activity. The standardized mean difference (SMD) indicated lower vagal activity in the obesity group.
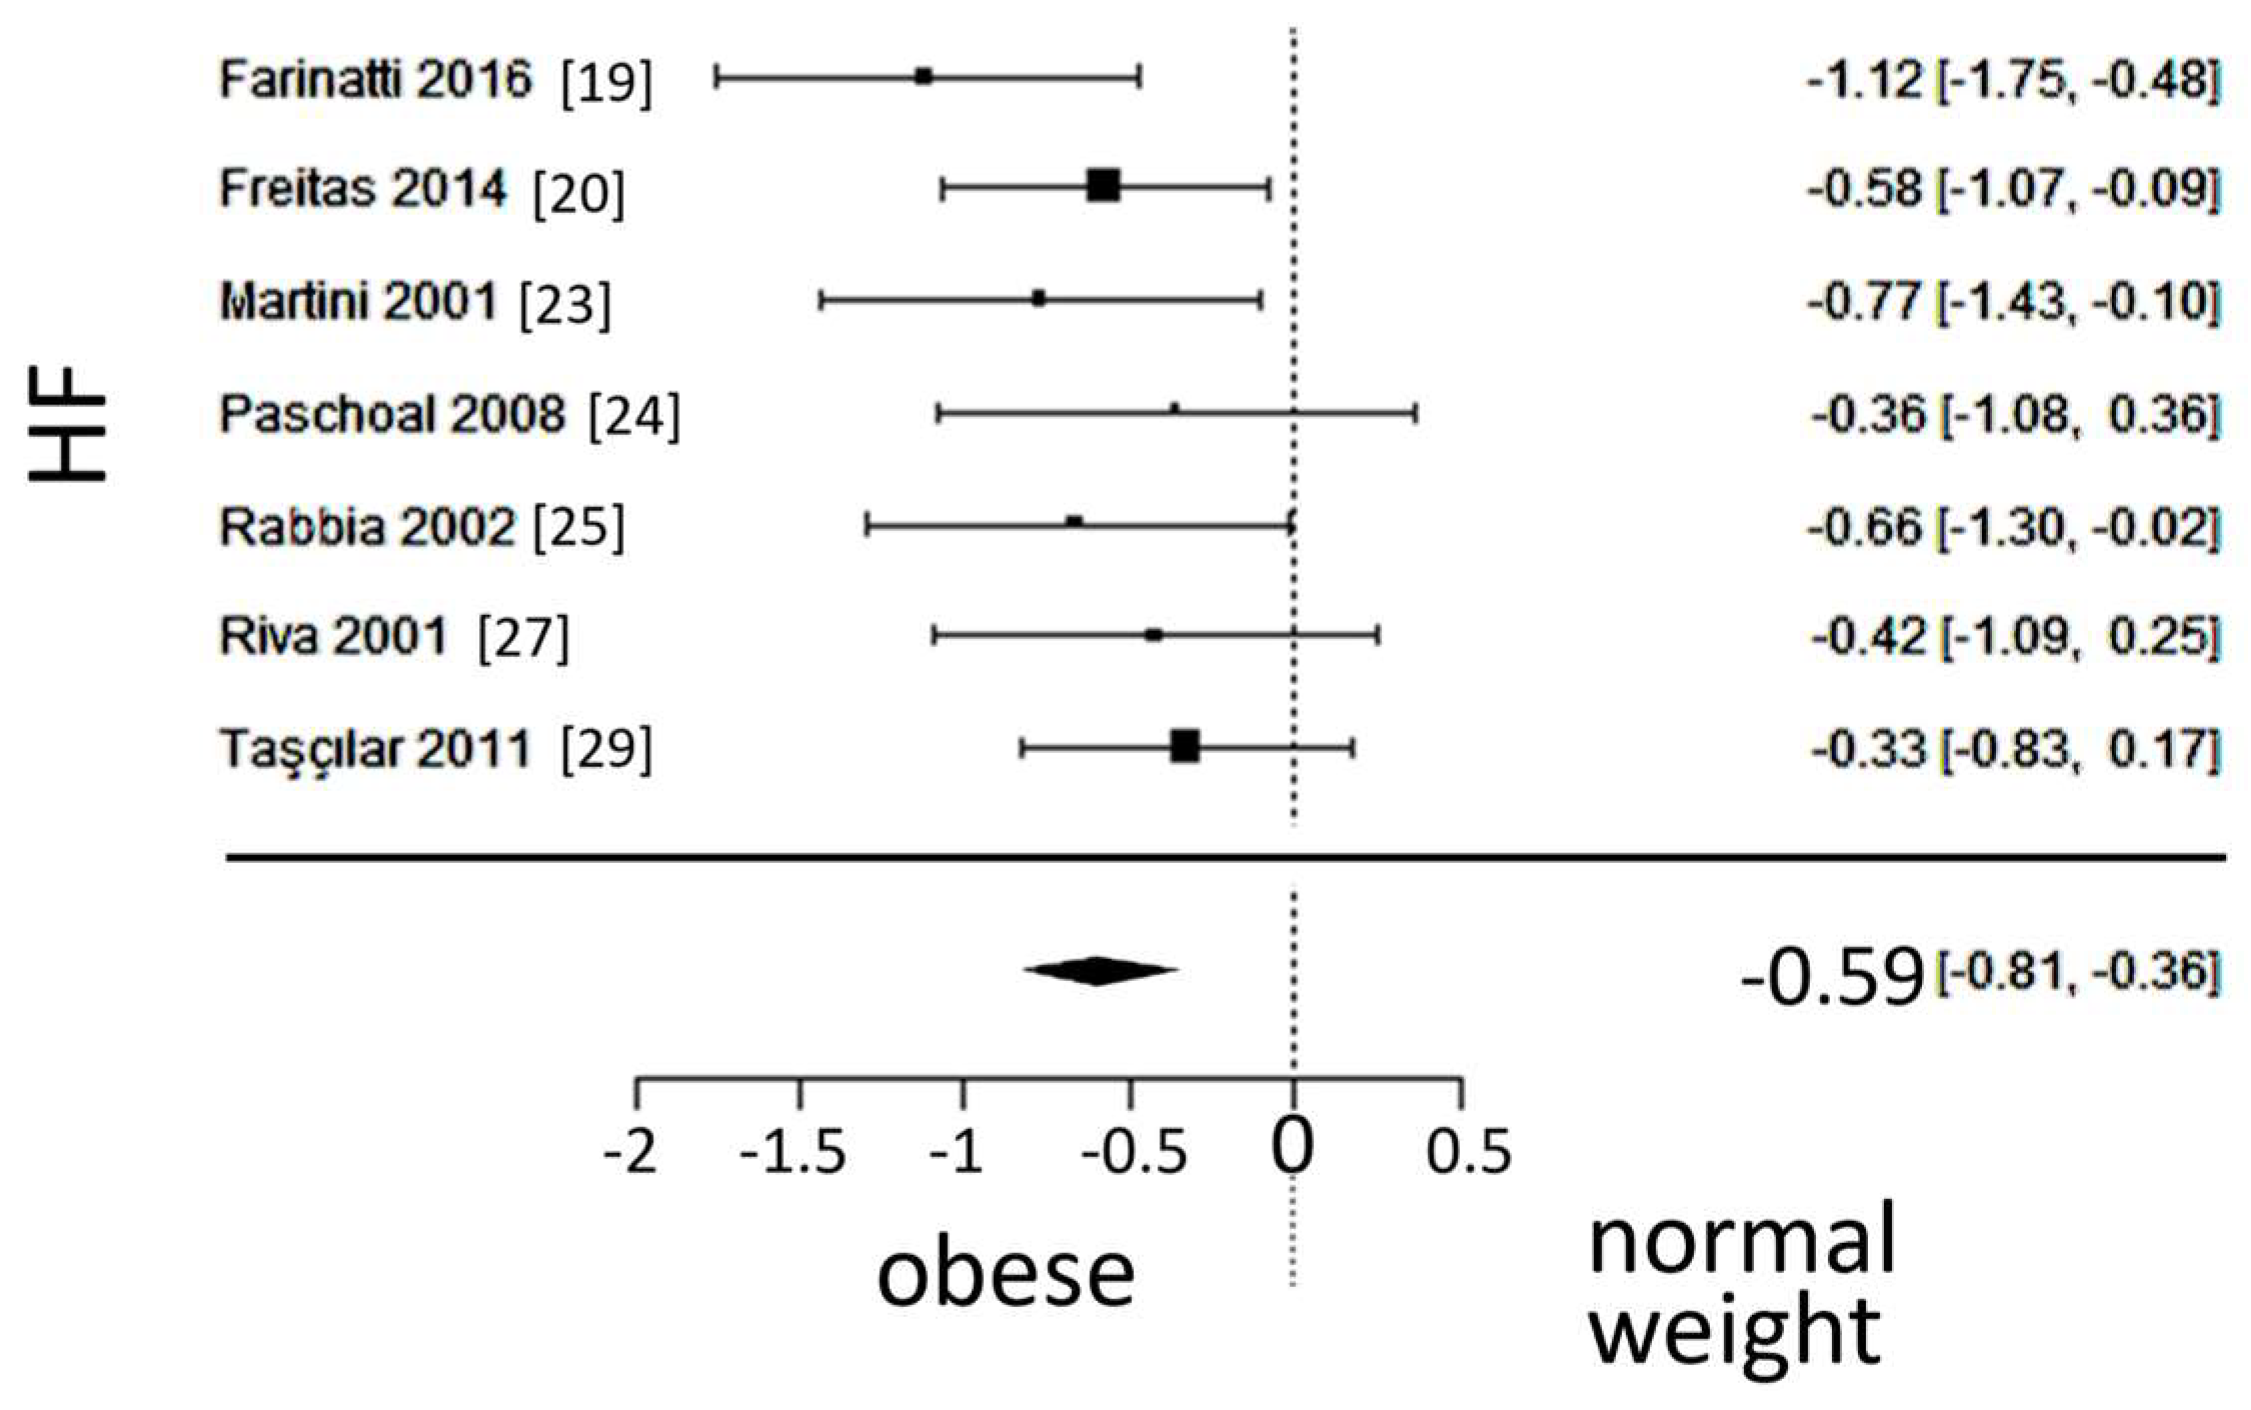
Figure 7.
Forest plot of the root mean square of successive differences between normal heartbeats (RMSSD), depicting vagal activity. The standardized mean difference (SMD) indicated lower vagal activity in the obesity group.
Figure 7.
Forest plot of the root mean square of successive differences between normal heartbeats (RMSSD), depicting vagal activity. The standardized mean difference (SMD) indicated lower vagal activity in the obesity group.
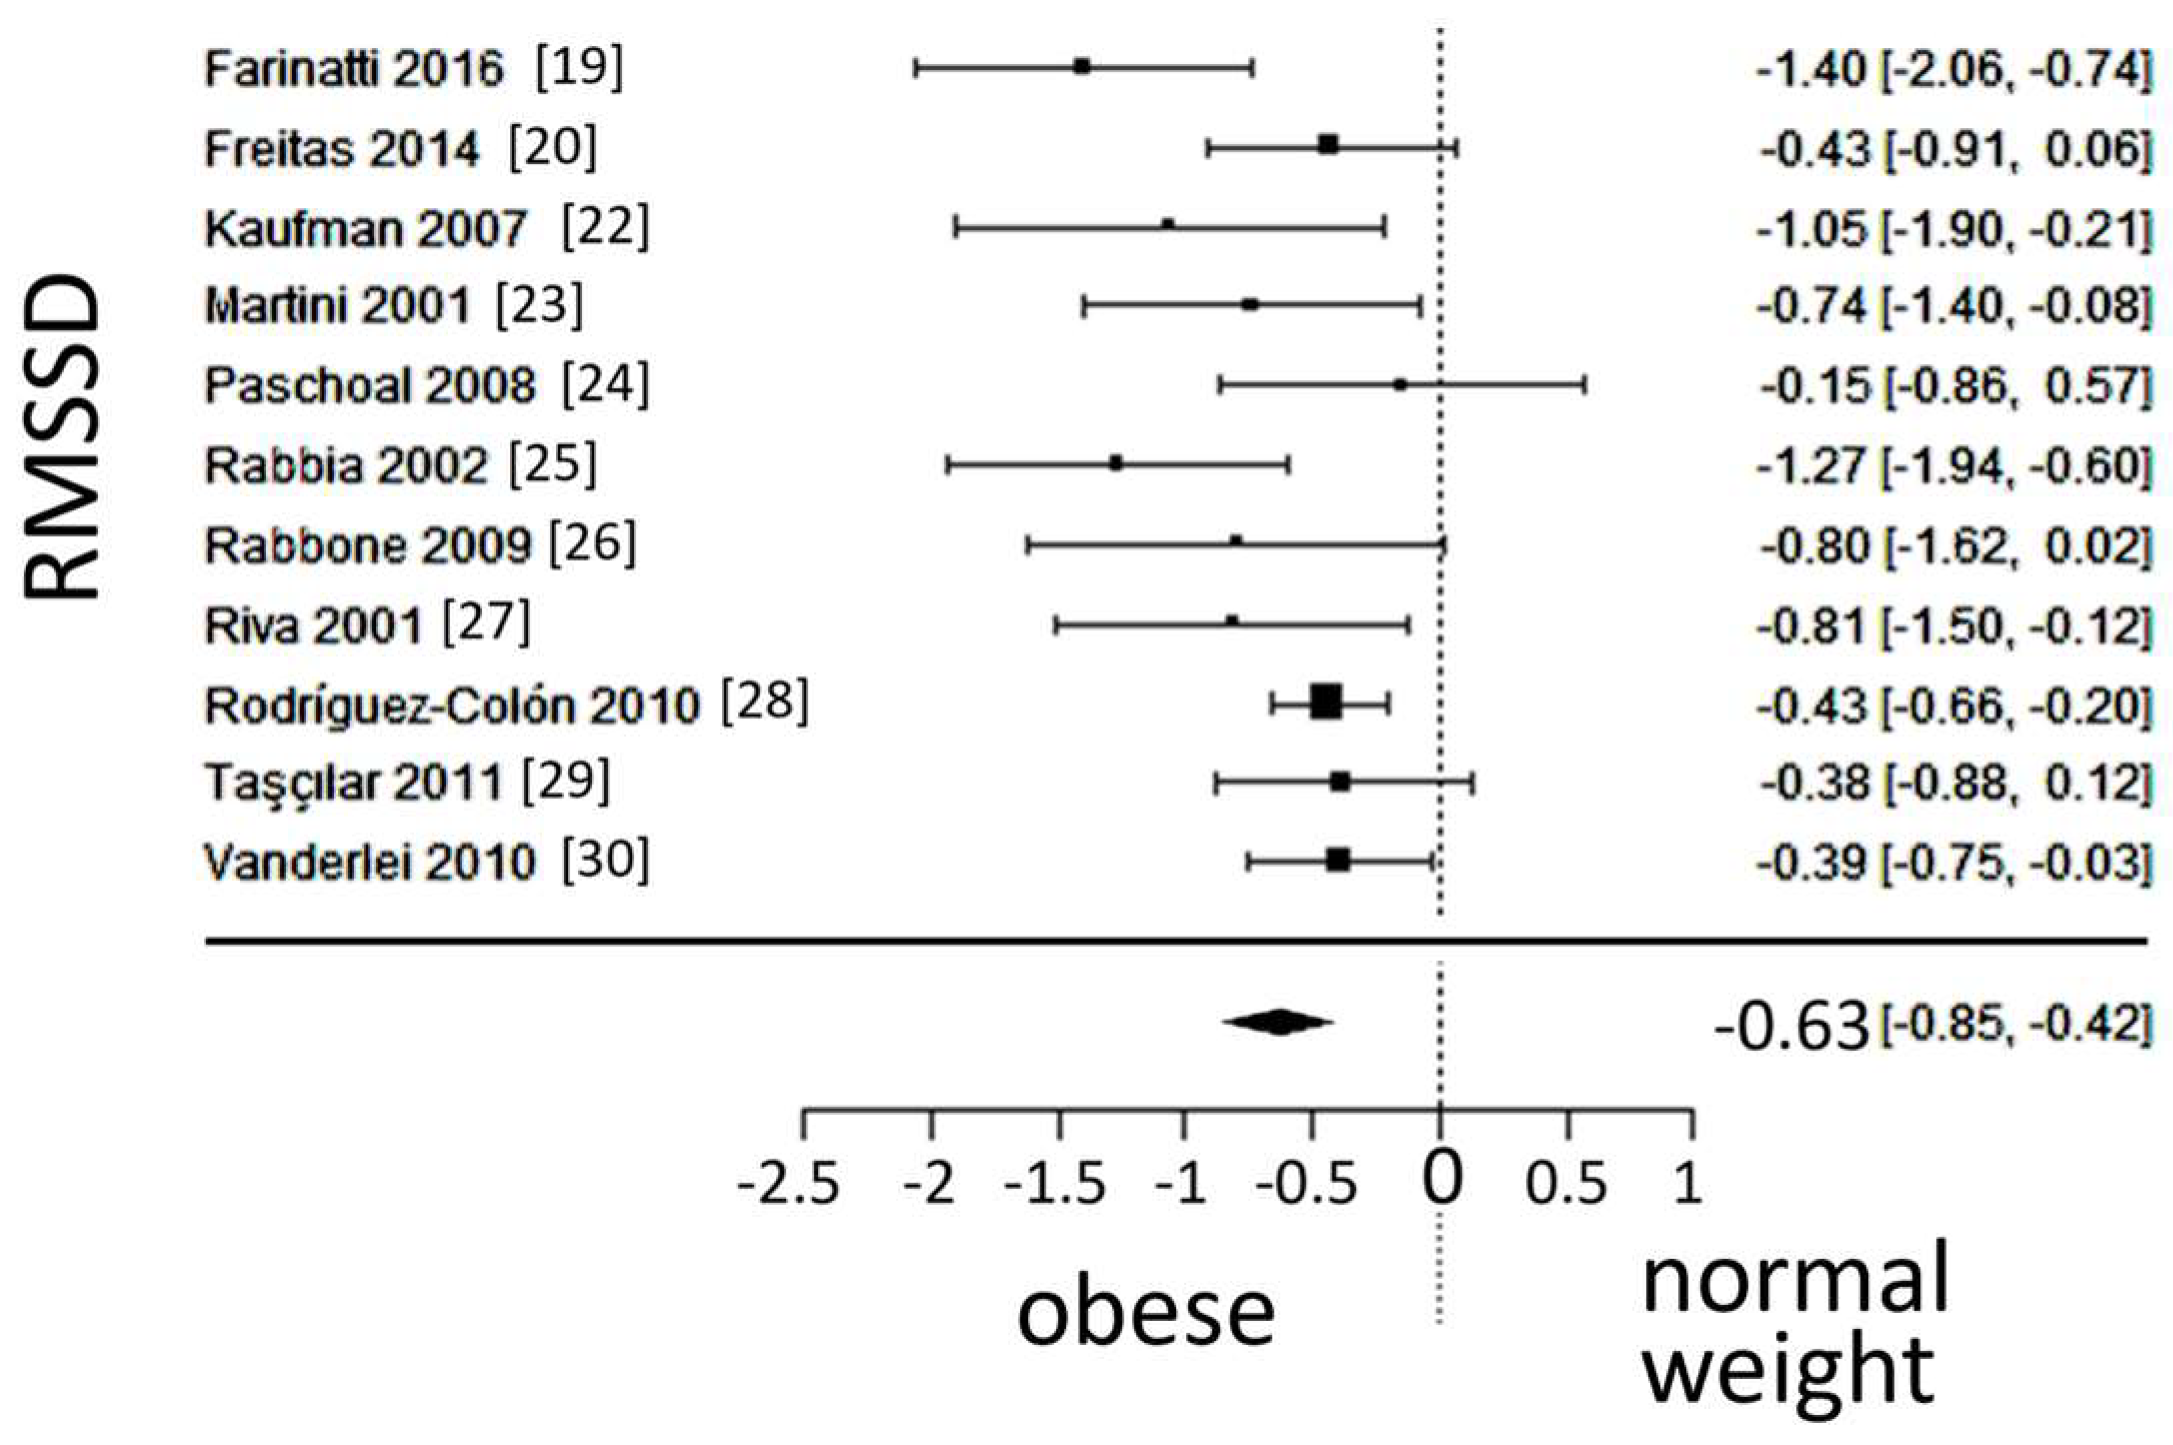
Figure 8.
Forest plot of the number of times successive intervals exceeding 50ms, divided by the total number of intervals (PNN50), depicting vagal activity. The standardized mean difference (SMD) indicated lower vagal activity in the obesity group.
Figure 8.
Forest plot of the number of times successive intervals exceeding 50ms, divided by the total number of intervals (PNN50), depicting vagal activity. The standardized mean difference (SMD) indicated lower vagal activity in the obesity group.
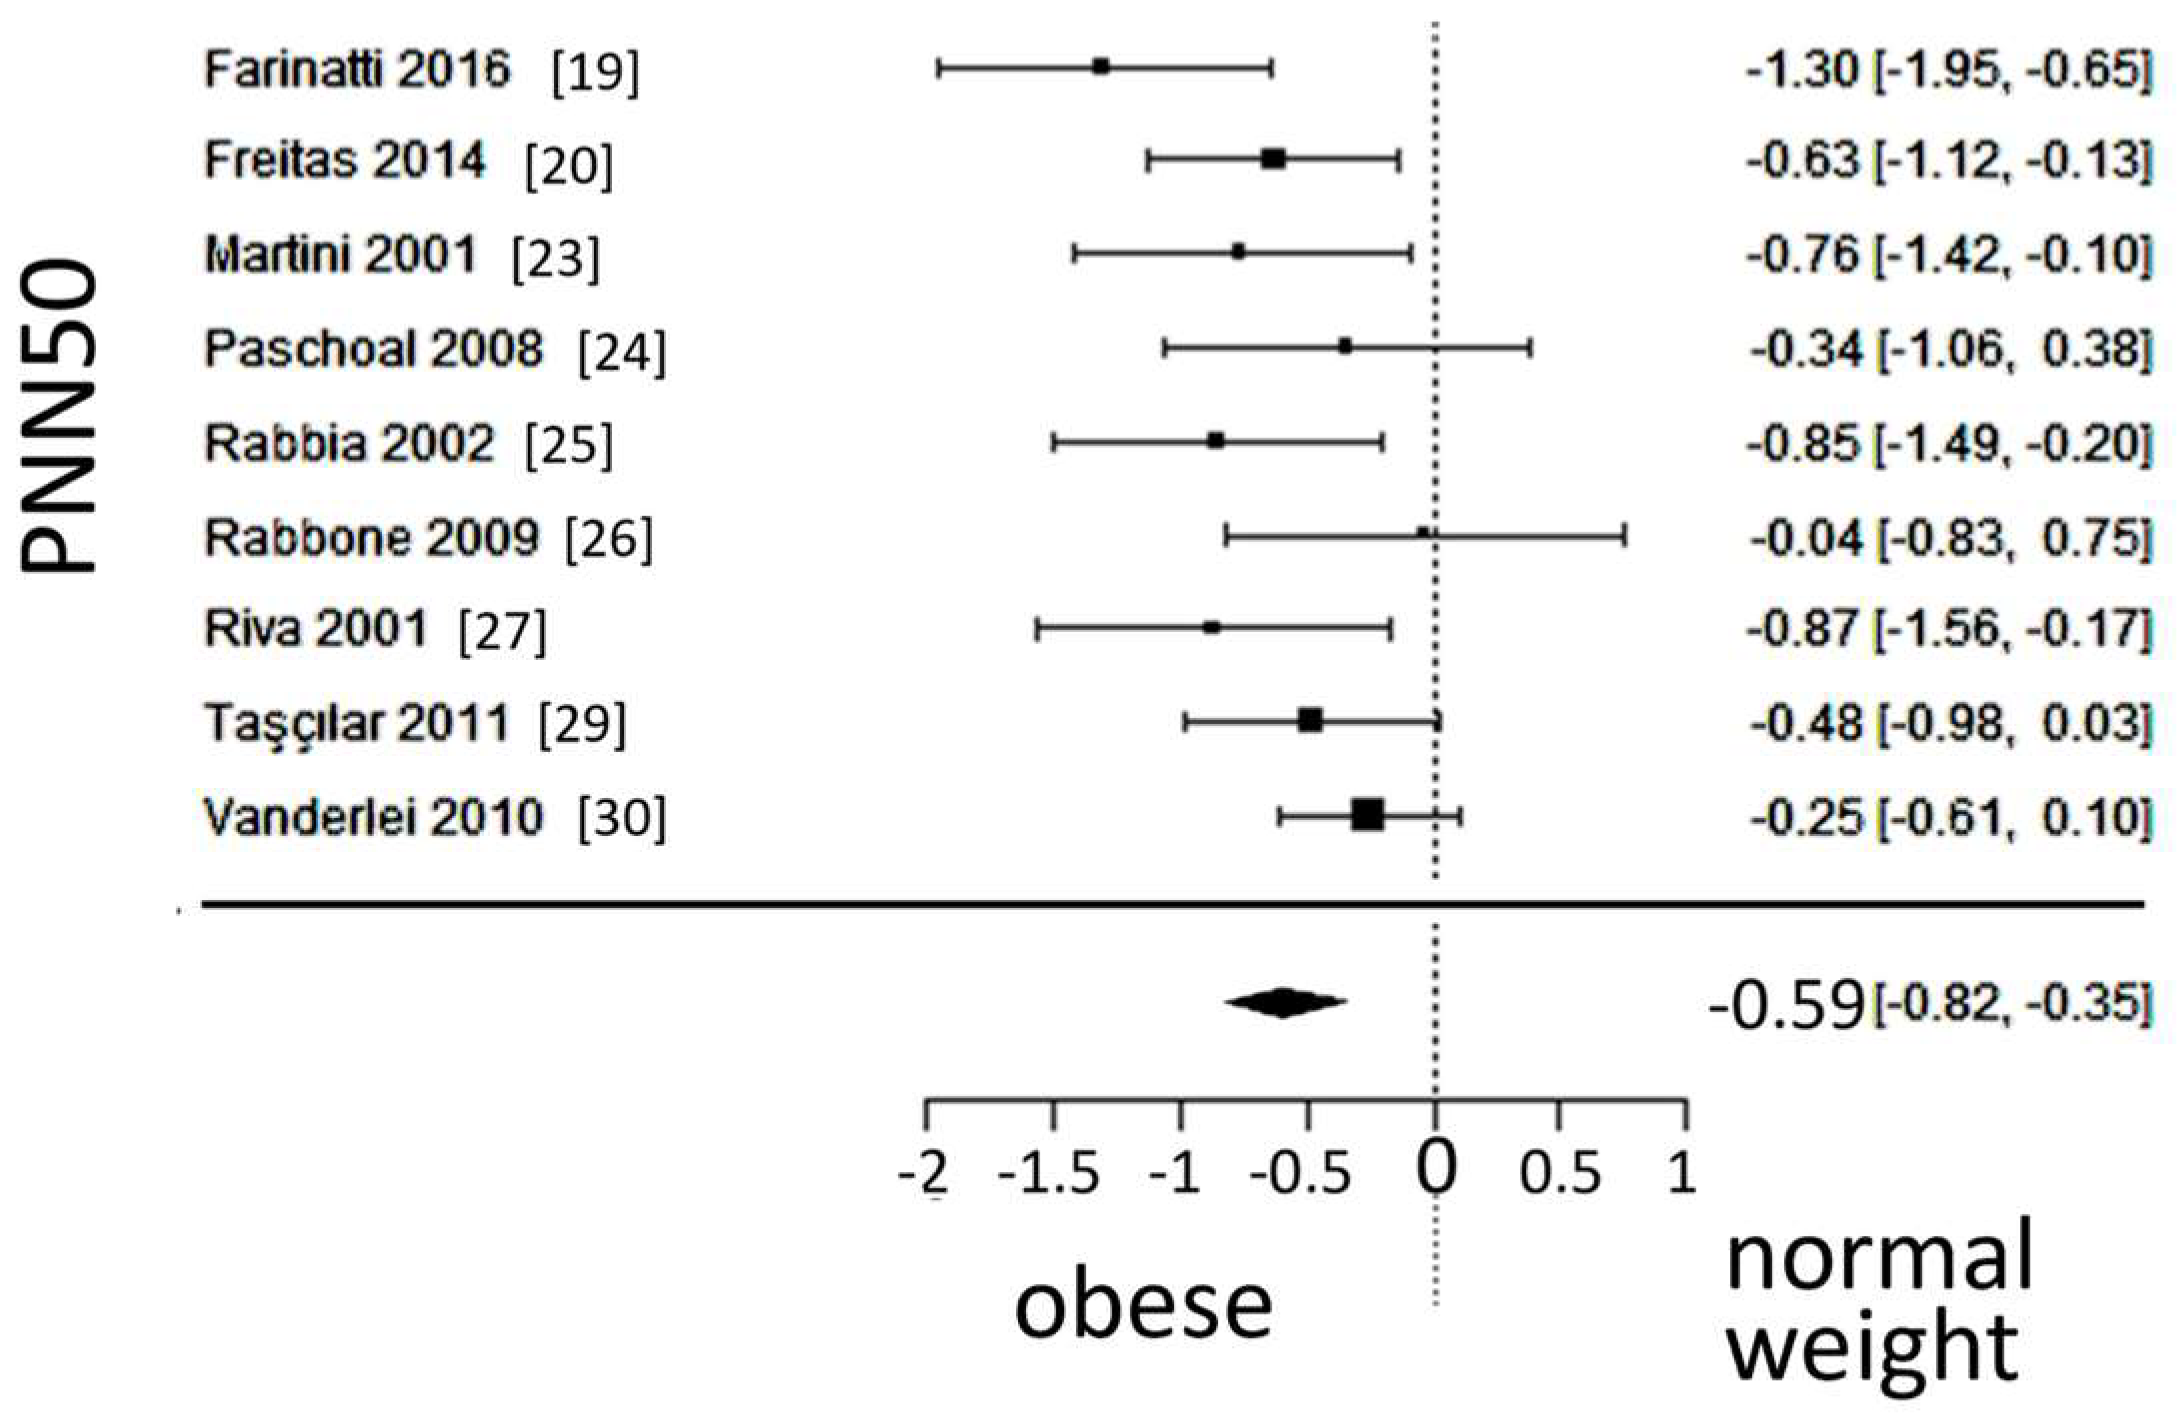

Table 1.
Newcastle-Ottawa quality scale for the included studies.
| Reference number | [19] | [20] | [21] | [22] | [23] | [24] | [25] | [26] | [27] | [28] | [29] | [30] |
| representativeness1 | 1 | 1 | 1 | 1 | 1 | 1 | 1 | 1 | 1 | 1 | 1 | 1 |
| selection2 | 1 | 1 | 1 | 1 | 1 | 1 | 1 | 1 | 1 | 1 | 1 | 1 |
| exposure3 | 1 | 1 | 1 | 1 | 1 | 1 | 1 | 1 | 1 | 1 | 1 | 1 |
| baseline4 | 1 | 1 | 1 | 1 | 1 | 1 | 1 | 1 | 1 | 1 | 1 | 1 |
| comparability5 | 1 | 1 | 1 | 1 | 1 | 1 | 1 | 1 | 1 | 1 | 1 | 1 |
| outcome6 | 0 | 0 | 0 | 0 | 1 | 0 | 1 | 1 | 1 | 0 | 1 | 0 |
| follow-up (1)7 | N/A9 | N/A9 | N/A9 | N/A9 | N/A9 | N/A9 | N/A9 | N/A9 | N/A9 | N/A9 | N/A9 | N/A9 |
| follow-up (2)8 | N/A9 | N/A9 | N/A9 | N/A9 | N/A9 | N/A9 | N/A9 | N/A9 | N/A9 | N/A9 | N/A9 | N/A9 |
| Score | 5 | 5 | 5 | 5 | 6 | 5 | 6 | 6 | 6 | 5 | 6 | 5 |
1Representativeness of the exposed cohort, 2Selection of the non-exposed cohort, 3Ascertainment of exposure, 4Baseline assessment, 5Comparability of cohorts on the basis of the design or analysis, 6Assessment of outcome, 7Was follow-up long enough for outcomes to occur, 8Adequacy of follow-up. 9 Non-applicable (N/A), as none of the studies included follow-up.
Table 2.
Characteristics of participants. Values are given as mean ± standard deviation.
|
normal-weight (n = 680) |
Obese (n = 422) |
|
| Age, years | 9.95 ± 2.56 | 11.6 ± 2.5 |
| Sex male, % | 53.7 | 48.5 |
| BMI, kg/m2 | 17.07 ± 2.36 | 28.79 ± 4.18 |
| SBP, mmHg | 109.27 ± 11.16 | 121 ± 12 |
| DBP, mmHg | 65.5 ± 8.7 | 74 ± 11 |
| TC, mg/dL | 152.56 ± 26.47 | 163.33 ± 29.59 |
| HDL, mg/dL | 46.43 ± 11.57 | 47.09 ± 9.57 |
| LDL, mg/dL | 95.41 ± 19.83 | 91.61 ± 22.42 |
| TGs mg/dL | 82.96 ± 32.10 | 95.12 ± 33.45 |
| FPG, mmol/L | 84.88 ± 4.73 | 87.86 ± 5.62 |
Abbreviations: BMI: body mass index, SBP: systolic blood pressure, DBP: diastolic blood pressure, TC: total cholesterol, HDL: high density lipoprotein, LDL: low density lipoprotein, TGs: triglycerides, FPG: fasting plasma glucose.
Table 3.
Heterogeneity statistics.
| Variable | k | τ | τ² (SE) | I² | H² | d.f. | Q | p |
|---|---|---|---|---|---|---|---|---|
| SDNN | 12 | 0.128 | 0.0165 (0.0329) | 20.34% | 1.255 | 11 | 12.405 | 0.334 |
| LF/HF | 12 | 0.243 | 0.0591 (0.0569) | 47.54% | 1.906 | 11 | 20.272 | 0.0421 |
| LF | 7 | 0.544 | 0.2956 (0.2279) | 75.62% | 4.102 | 6 | 23.420 | < .0011 |
| HF | 7 | 0 | 0 (0.0532) | 0% | 1 | 6 | 4.649 | 0.590 |
| RMSSD | 11 | 0.229 | 0.0523 (0.0571) | 43.79% | 1.779 | 10 | 17.077 | 0.073 |
| PNN50 | 9 | 0.199 | 0.0397 (0.063) | 31.53% | 1.460 | 8 | 11.767 | 0.162 |
1 Significant heterogeneity detected. Abbreviations: SDNN: standard deviation of the inter-beat interval between normal sinus beats; LF: low (0.04–0.15 Hz) frequency spectrum; HF: high (0.15–0.4 Hz) frequency spectrum; RMSSD: root mean square of successive differences between sinus intervals; PNN50: number of times successive intervals exceed 50ms divided by the total number of intervals.
Disclaimer/Publisher’s Note: The statements, opinions and data contained in all publications are solely those of the individual author(s) and contributor(s) and not of MDPI and/or the editor(s). MDPI and/or the editor(s) disclaim responsibility for any injury to people or property resulting from any ideas, methods, instructions or products referred to in the content. |
© 2024 by the authors. Licensee MDPI, Basel, Switzerland. This article is an open access article distributed under the terms and conditions of the Creative Commons Attribution (CC BY) license (http://creativecommons.org/licenses/by/4.0/).
Copyright: This open access article is published under a Creative Commons CC BY 4.0 license, which permit the free download, distribution, and reuse, provided that the author and preprint are cited in any reuse.


