
Submitted:
16 January 2024
Posted:
17 January 2024
You are already at the latest version
Abstract
This study introduces a neural network-based approach to predict dust emission, specifically PM2.5 particles, during almond harvesting in California. Using a feedforward neural network (FNN), the research predicts PM2.5 emissions by analyzing key operational parameters of an advanced almond harvester. The model is trained on extensive field data from the almond pickup system, including variables like brush speed, angular velocity, and harvester forward speed. The results demonstrate a notable predictive accuracy of the FNN model, with a Mean Squared Error (MSE) of 0.02 and a Mean Absolute Error (MAE) of 0.01, indicating a high degree of precision in forecasting PM2.5 levels. The study also finds a strong correlation between certain operational parameters and PM2.5 emissions, highlighting specific areas for optimization in harvesting techniques. By integrating machine learning with agricultural practices, this research provides a significant tool for environmental management in almond production, offering a method to reduce harmful emissions while maintaining operational efficiency. This model presents a solution for the almond industry and sets a precedent for applying predictive analytics in sustainable agriculture.
Keywords:
Almond Harvesting
; Dust Emissions
; Predictive Modeling
; Neural Networks
; PM2.5 Particles
; Machine Learning
; Environmental Management
1. Introduction
Almond harvesting has traditionally been a dusty affair due to the nature of the operations involved. The conventional methods employed by harvesters like Flory [1], Weiss McNair [2], and Jack Rabbit [3], amongst others, have been known to produce a significant amount of particulate matter emissions during the harvesting process. Specifically, emissions from conventional harvesters were compared to those from low-dust harvesters like Flory 850, Exact E3800, Weiss-McNair 9800, and Jack Rabbit in orchards located in Fresno County, demonstrating that the low-dust harvesters produced fewer emissions. A notable challenge within the almond harvesting industry in California has been the lack of an available particulate matter (PM) PM2.5 emission factor for the operations. Particularly PM2.5, which are particles with a diameter of 2.5 micrometers or smaller. This gap has posed challenges for particulate matter regulations and emissions inventory within the state. Low-dust harvesters have been seen as a viable strategy to reduce PM emissions and help achieve the state’s PM2.5 attainment targets [4,5]. The present paper proposes a technology to measure PM2.5 emission of almond harvesters.
The control and reduction of particulate matter emissions are crucial for both environmental and human health. Particularly, PM2.5 is of concern as these particles can be inhaled into the lungs and even enter the bloodstream. Predicting PM2.5 emissions from almond harvesting operations can provide crucial insights for regulatory compliance, operational adjustments, and the development of low-emission harvesting technologies. By accurately predicting PM2.5 emissions, stakeholders can make informed decisions to mitigate environmental impacts, adhere to regulatory standards, and improve the overall sustainability of almond harvesting operations. The primary objective of this work is to develop a predictive model utilizing neural networks to estimate PM2.5 emissions based on various operational parameters of a newly designed almond harvester.
Several studies have been conducted to predict emissions from agricultural activities using neural networks. For instance, a study aimed to model CO2 flux from soil to atmosphere in greenhouse conditions using multiple linear regression, artificial neural networks (ANN), and deep learning neural networks (DLNN), with parameters like crop species, soil temperature, soil moisture content, photosynthetic active radiation (PAR), and soil oxygen exchange as input parameters for predicting CO2 flux [6]. Another study employed a Feedforward Neural Network constructed using the Sequential Neural Network in Keras to predict CO2 and CH4 emissions for onion crops from open farms and polyhouses [7]. Additionally, a novel methodology based on neural networks was discussed to determine agriculture emission model simulations, focusing on methane and nitrous oxide emissions, thereby enabling a more structured approach to emission prediction [8].
Various studies have explored different configurations of neural network models to optimize the prediction of agricultural emissions. A study examined different combinations of the number of layers and neurons to identify the best regression ANN models for predicting agricultural methane and CO2 emissions, using training SSE, Testing SSE, and RMSE as output measurement methods to choose the best model [9]. Another study applied artificial neural networks to predict output energy and greenhouse gas (GHG) emissions in potato production in Iran, demonstrating the versatility of neural network models in predicting different types of emissions across various agricultural products and regions [10]. The study of the development and implementation of dust monitoring and control technologies to mitigate the environmental and health impacts of dust emissions from agricultural operations was done in the US Department of Labor in 2004 [11]. In 2016, a report released by the US Environmental Protection Agency, indicating the proposition of methods to model and predict dust emissions based on factors like soil characteristics, weather conditions, and operational parameters, aided in proactive management of dust emissions [12]. In 2009, Sharratt, B.S et al. introduced the exploration of remote sensing technologies for monitoring soil erosion and dust generation in agricultural fields, providing valuable data for understanding and controlling dust emissions [13].
The application of Artificial Neural Networks (ANNs) has been rapidly advancing in the field of environmental engineering due to the capability of ANNs to handle complex, nonlinear relationships inherent in environmental data. Notable advancements include:
- Significant innovations and developments in the application of ANN as a tool of Artificial Intelligence over the last two decades [14].
- Applications of Neural Networks in various facets of Environmental Engineering, providing solutions to complex environmental engineering problems such as solid waste disposal, public health impacts, recycling strategies, and pollution control [15].
- ANNs demonstrate a high level of competency in solving complex engineering problems beyond the computational capability of classical mathematics and traditional procedures, addressing issues like pollution control and waste management among others [16].
The literature reveals the robustness and flexibility of neural network models in predicting different types of emissions across a range of agricultural activities. While there’s a scarcity of literature specifically focusing on PM2.5 emissions during almond harvesting, the discussed studies provide a solid foundation and justification for applying neural network models in this domain. As demonstrated in the literature, the adaptable nature of neural network models provides a promising avenue for developing accurate and reliable models for predicting PM2.5 emissions in almond harvesting operations.
In this study, we develop a predictive neural network model for estimating PM2.5 emissions during almond harvesting operations. The research encompasses data gathering, preprocessing, model creation, and evaluation. Our goal is to equip stakeholders in the almond harvesting sector with a powerful tool for assessing and reducing PM2.5 emissions, enhancing both operational effectiveness and adherence to environmental standards. This work introduces an innovative approach to using neural network models for agricultural emission challenges, specifically focusing on almond harvest dust control. The outcomes demonstrate the potential of neural networks in environmental monitoring and mark a stride towards more environmentally responsible agricultural practices.
2. Materials and Methods
2.1. Data Collection and Preprocessing
The data set utilized for this study is derived from multiple field measurements taken during the almond harvesting season. The data, organized in an Excel spreadsheet, encapsulates various parameters considered influential in the emanation of PM2.5 emissions. The data set comprises five columns representing:
- Horizontal Brush Speed (rpm): The rotational speed of the horizontal brush.
- Angular Velocity of Vertical Brushes (rpm): The rotational speed of the two vertical brushes employed as sweepers.
- Forward Speed (m/s): The forward speed of the harvester.
- Measured PM2.5: Recorded PM2.5 emissions during harvesting.
- Measured PM10: Recorded PM10 emissions during harvesting.
2.2. Outlier Detection and Removal
Given the propensity of outliers to skew the model learning process adversely, a rigorous outlier detection and removal process was undertaken. The Interquartile Range (IQR) method was employed to identify and expunge outliers from data set [17]. Figure 1 illustrates the outliers before and after removal.
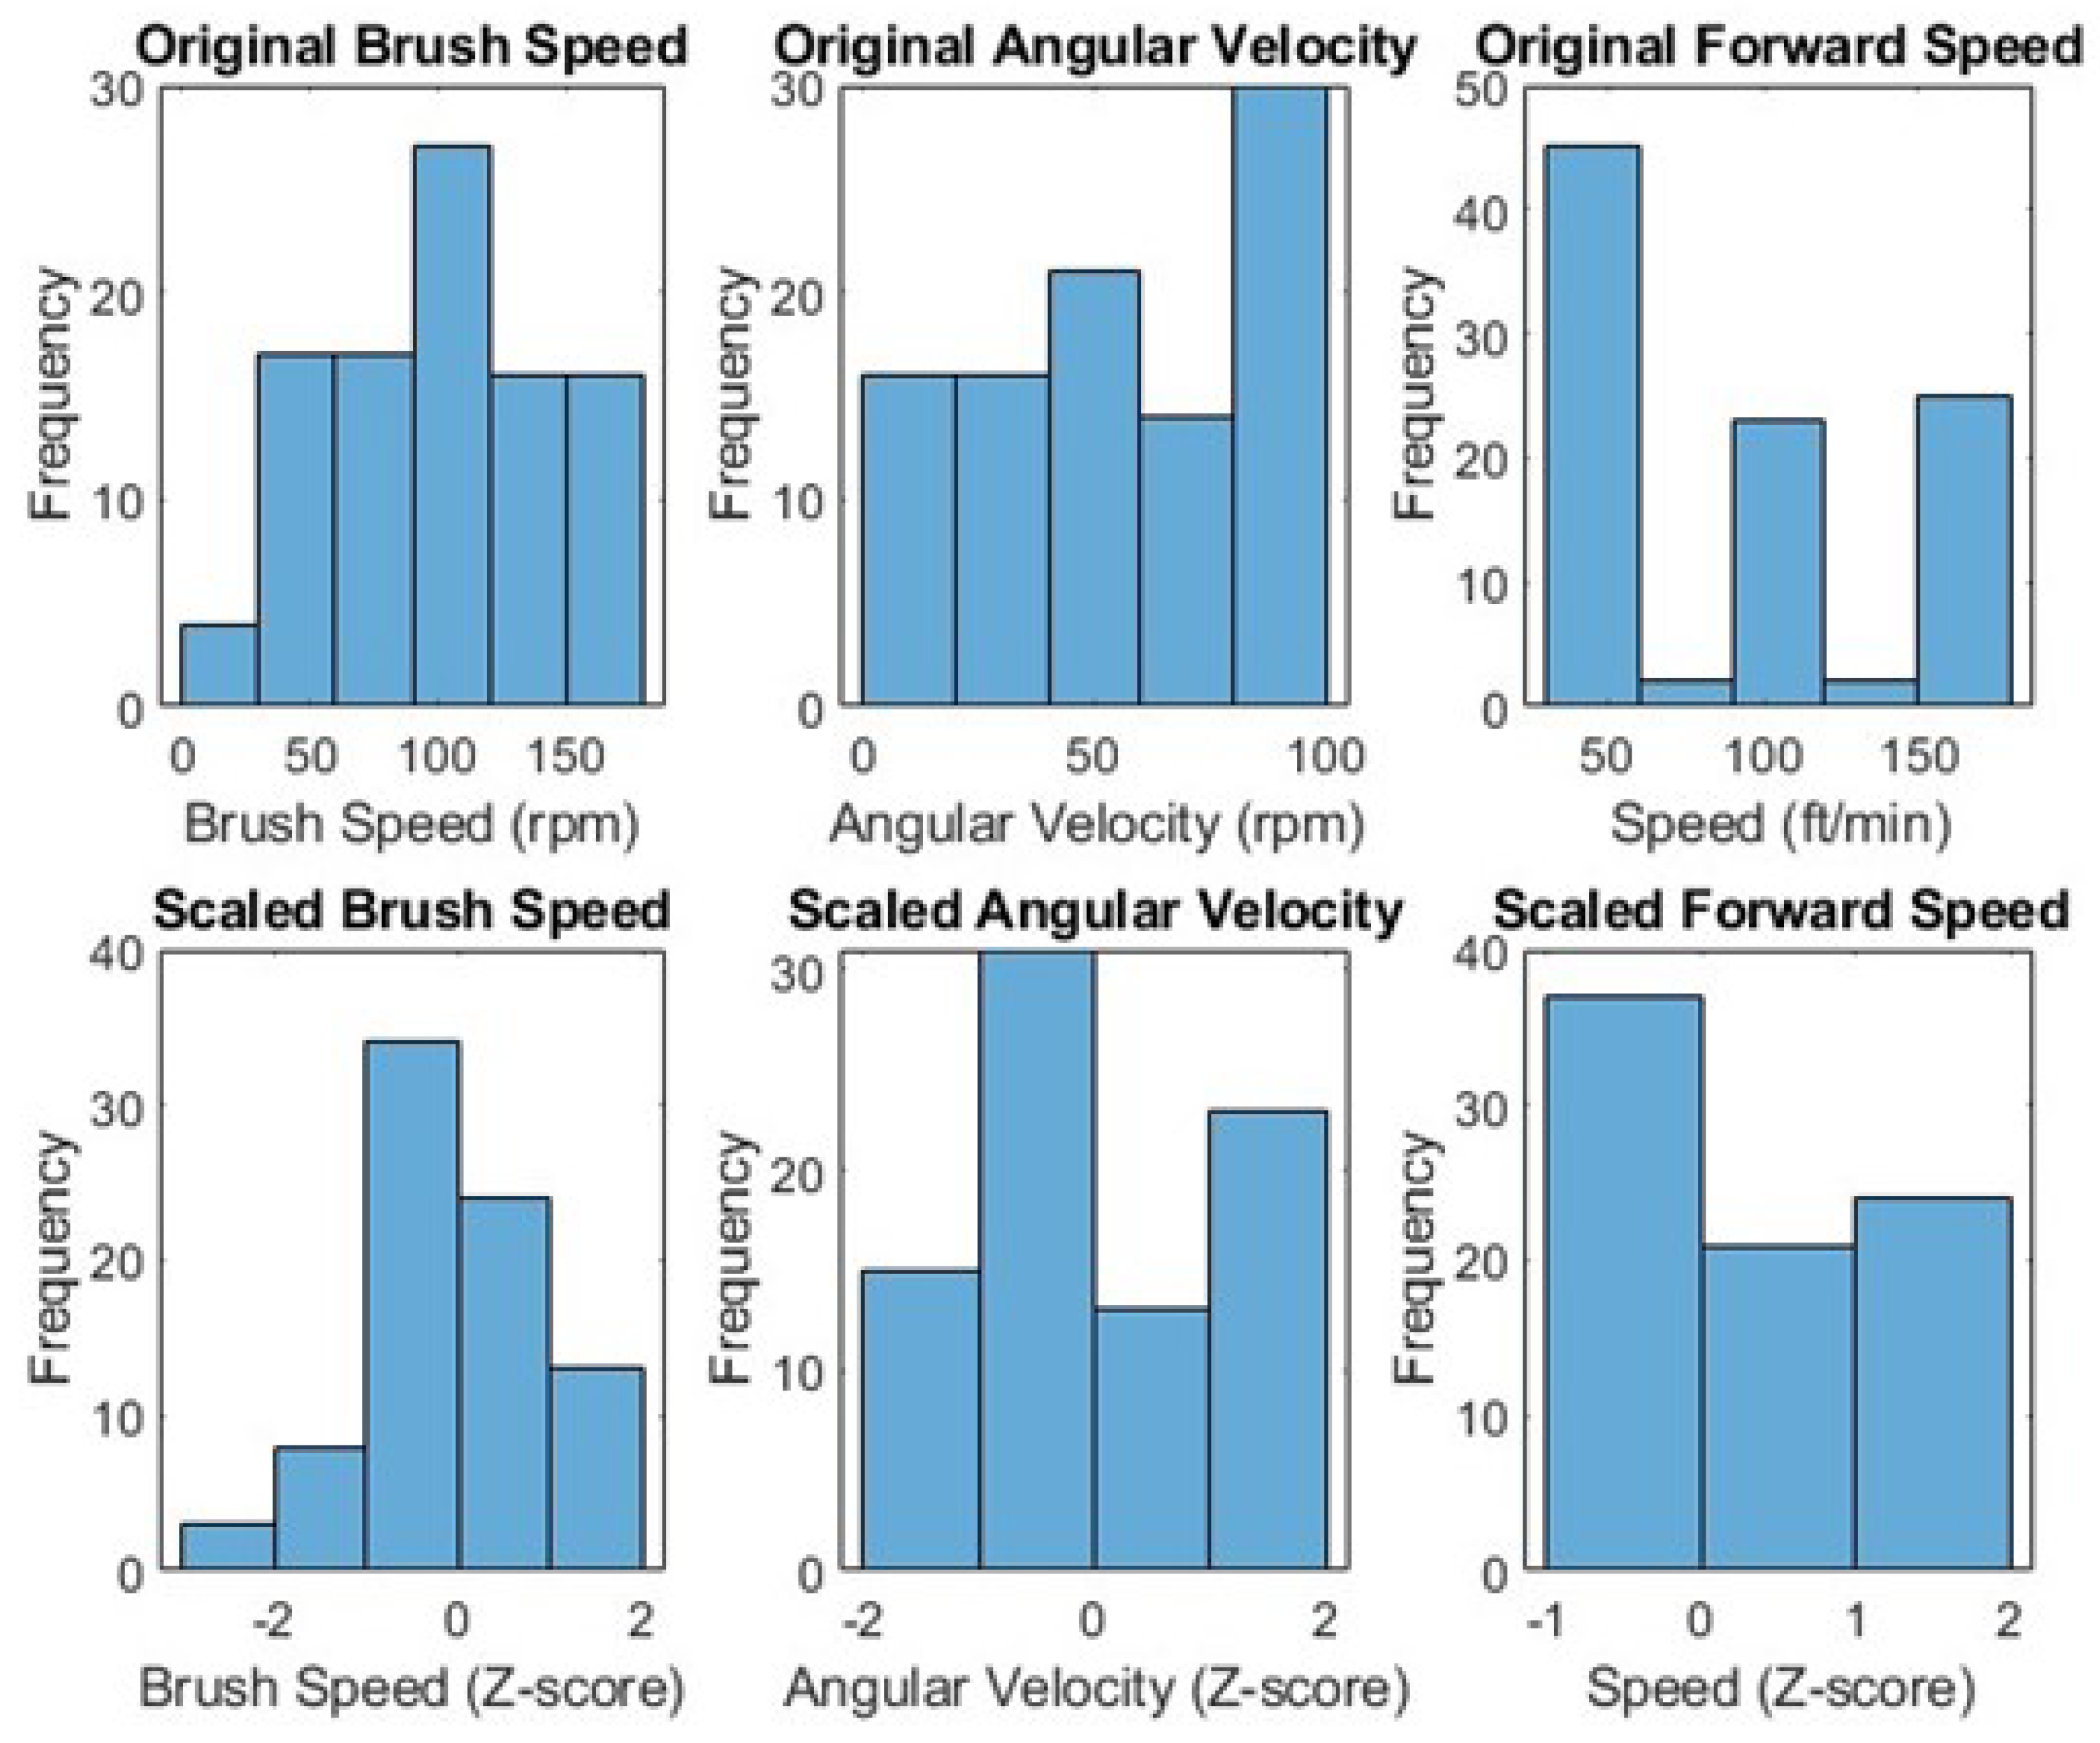
2.3. Data Scaling and Normalization
To ensure a standardized scale promoting an efficient learning process, the data set underwent scaling and normalization. The Z-score normalization method was applied to the first three columns of the data set, representing the input features for the neural network model [18].
Figure 2.
Data before and after scaling.
These preprocessing steps were crucial in ensuring a clean, standardized data set, paving the way for the subsequent development of a robust neural network model to predict PM2.5 emissions during almond harvesting.
3. Exploratory Data Analysis
3.1. Correlation Analysis between PM2.5 and PM10
One of the initial steps in the data analysis process was to study the relationship between PM2.5 and PM10 emissions assessing whether one could replace the other to streamline the neural network model. As documented in the literature, a strong correlation between these two particulate matter sizes is often witnessed due to their common sources and similar dispersion behaviors [19]. The correlation coefficient obtained was 0.99, indicating a very strong linear relationship between PM2.5 and PM10 emissions. This high degree of correlation suggests that PM2.5 emissions could be used as a proxy for PM10 emissions, thus simplifying the modeling process. Figure 3 elucidates the scatter plot illustrating the strong correlation between PM2.5 and PM10.
Histograms are employed to visualize the distribution of the data. Figure 4 shows the distribution of PM2.5 emissions, which is pivotal in understanding the skewness and kurtosis of the data.
A heatmap provides a color-coded representation of the correlation matrix, assisting in visually identifying strong correlations between variables. Figure 5 displays a heatmap of the correlations between all variables in the data set.
4. Neural Network Design
4.1. Network Architecture
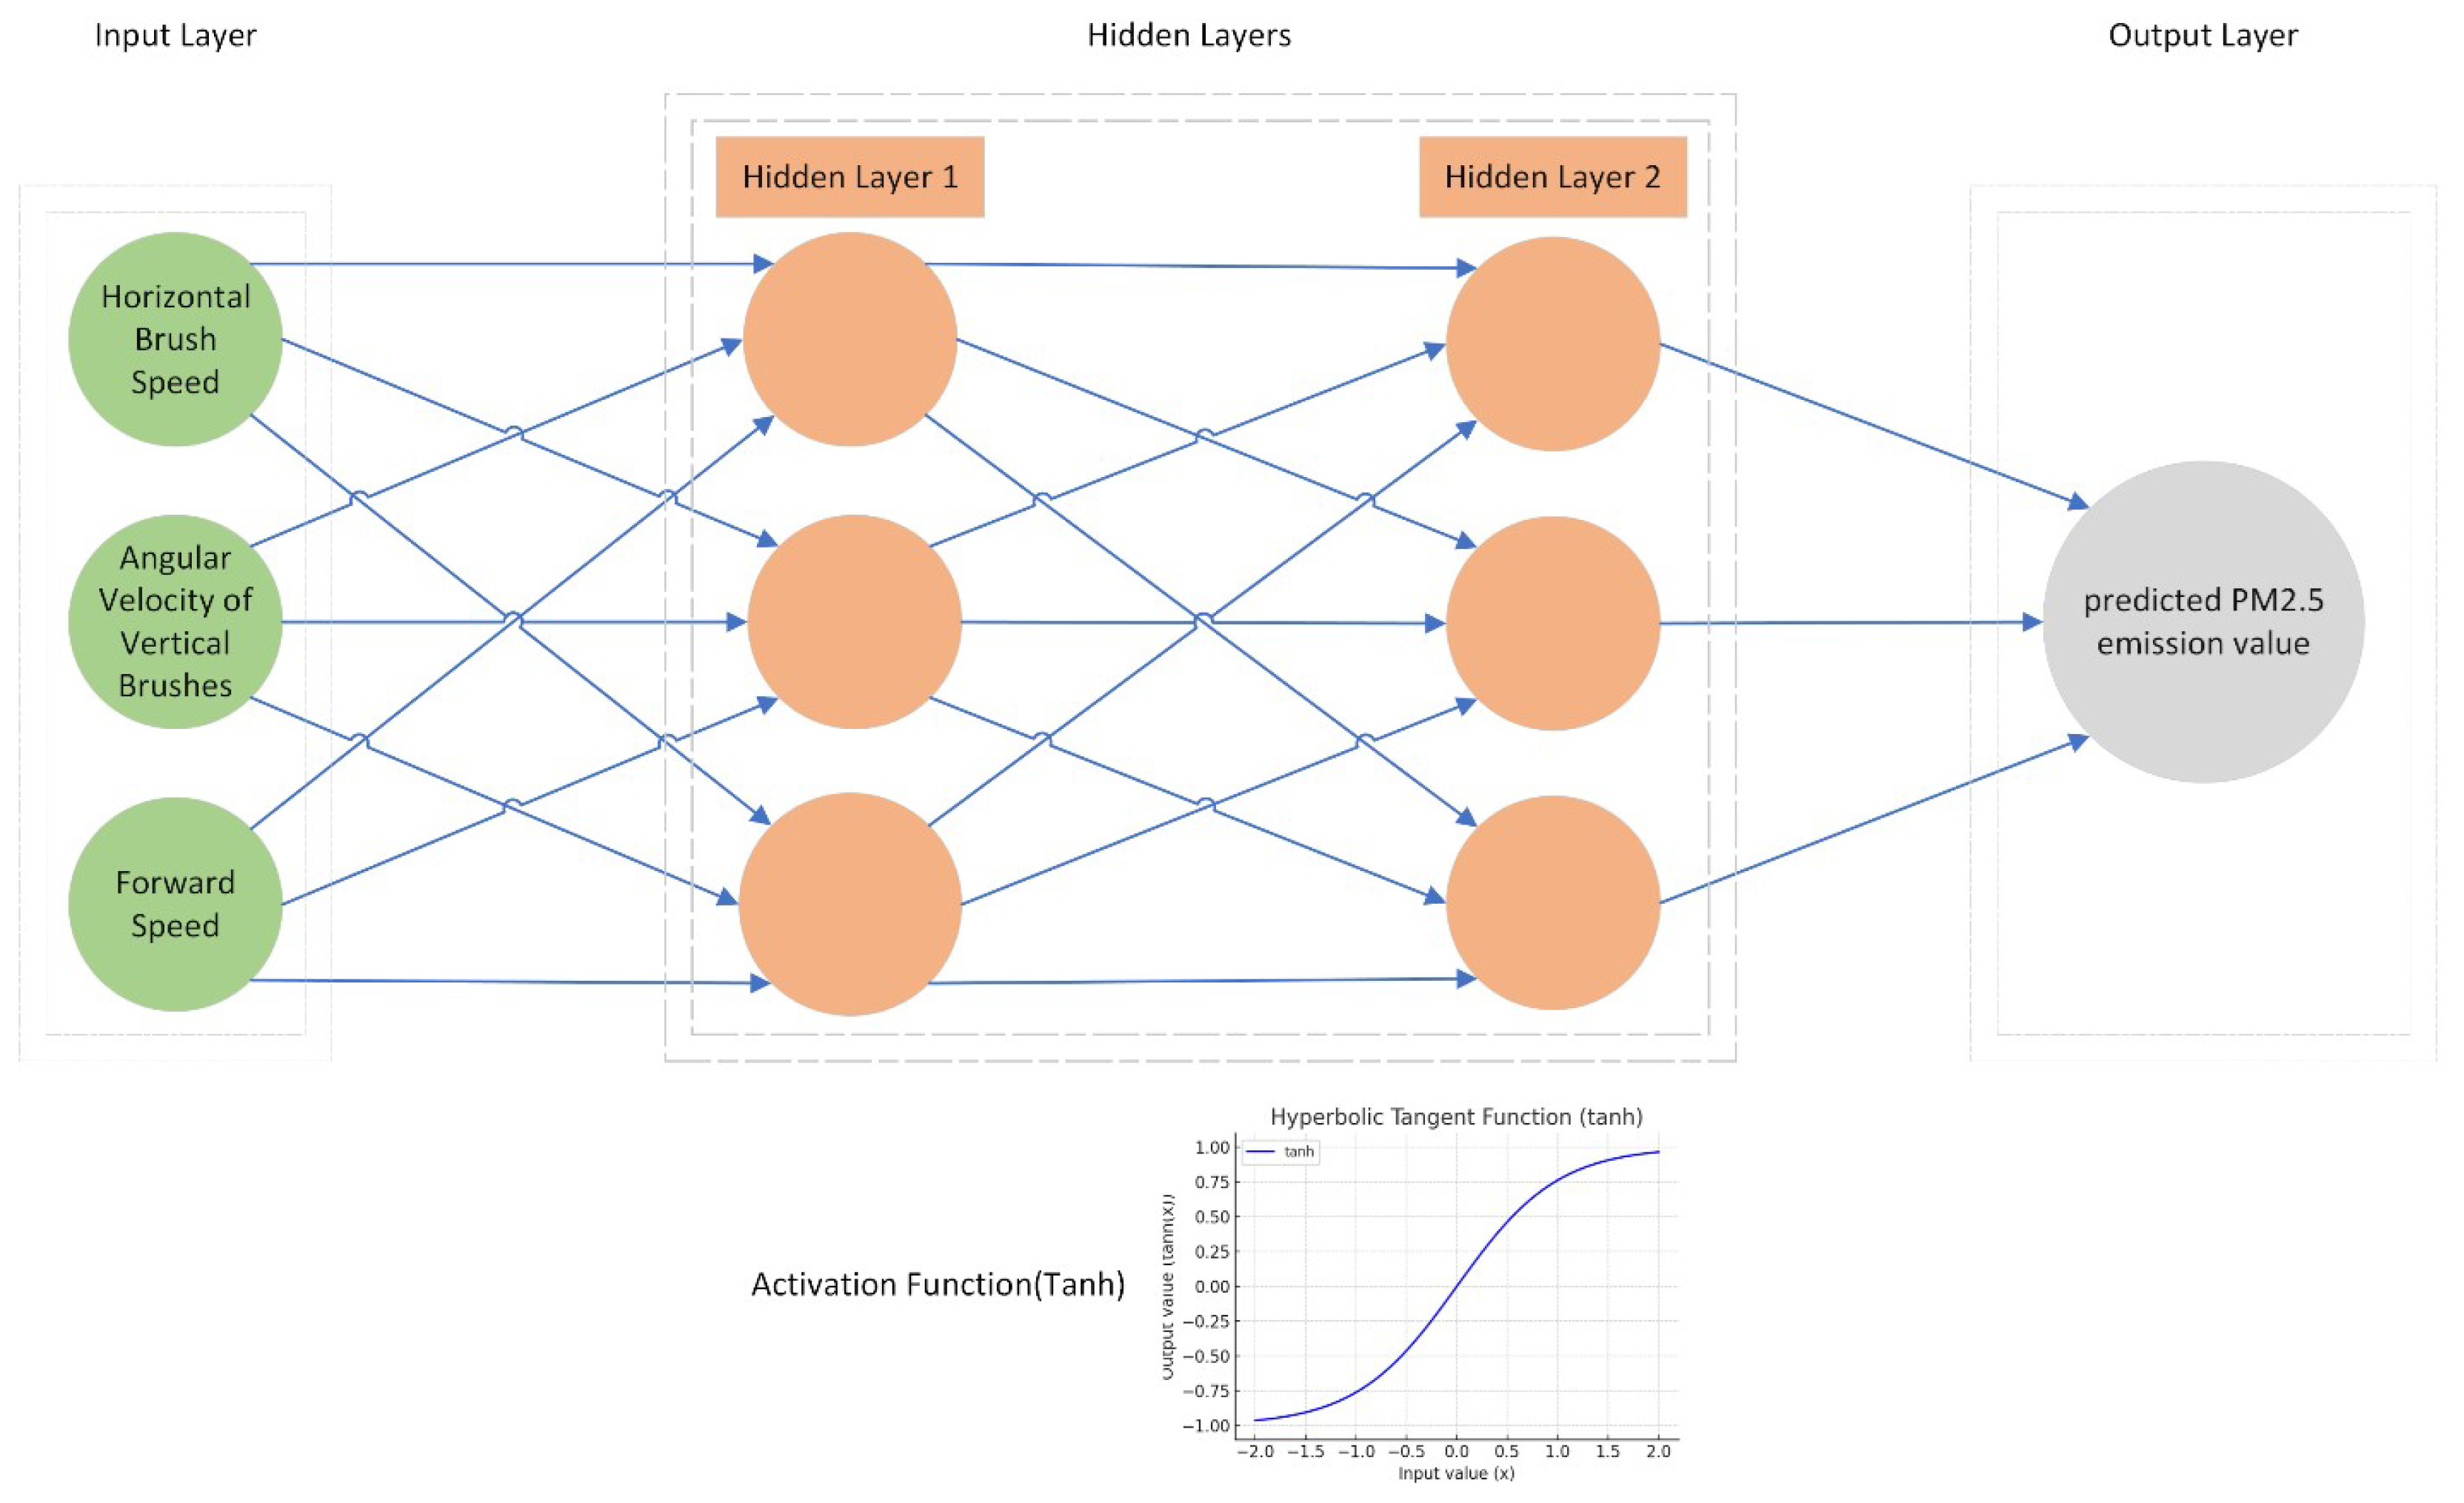
In addressing the problem of predicting PM2.5 emissions during almond harvesting based on the given input parameters, a neural network model was chosen for its ability to capture complex relationships between variables. Specifically, a feed-forward neural network (FNN) was selected due to its simplicity and efficacy in handling regression tasks [20]. The architecture of the neural network comprises an input layer, two hidden layers, and an output layer. The choice of two hidden layers was made to provide the model with enough capacity to learn from the data while avoiding overfitting. Each hidden layer contains three neurons, determined empirically to provide a good trade-off between model complexity and performance.
The input layer consists of three neurons corresponding to the three input features: Horizontal Brush Speed, Angular Velocity of Vertical Brushes, and Forward Speed. The first hidden layer also comprises three neurons, allowing for the extraction and learning of features from the input data. The second hidden layer, also with three neurons, helps in further refining the learned features and passing them onto the output layer. The output layer contains a single neuron that outputs the predicted PM2.5 emission value.
4.2. Activation Functions, Loss Function, and Optimization Algorithm
-
Activation Functions:The activation function in the hidden layers is the hyperbolic tangent (tanh) function. The tanh function was selected due to its ability to handle vanishing gradient problems better than the sigmoid function, and its capability to model both positive and negative relationships between variables.
-
Loss Function:The loss function chosen for this model is the Mean Squared Error (MSE) loss function. MSE is commonly used in regression problems for its ability to penalize larger errors more than smaller ones, thus driving the model to learn more accurate predictions.
-
Optimization Algorithm:The Adam optimization algorithm was employed for its efficiency in practice and little memory requirements. Adam also adjusts the learning rate during training, which can lead to quicker convergence. The following diagram provides a visual representation of the neural network architecture.
Figure 6.
Diagram illustrating the architecture of the neural network model.
The configurations were chosen based on a combination of empirical testing and theoretical justification, aligning with common practices in machine learning.
4.3. Model Training and Validation
The model’s accuracy and reliability in predicting PM2.5 emissions were ensured using k-fold cross-validation (k=5). This method involved dividing the training data into 5 subsets, using 4 for training and 1 for validation, and rotating this process across all subsets. The results from these folds were averaged to provide a single performance estimation, offering a thorough assessment of the model across various data segments.
4.4. Settings for Training
The training of the neural network was performed over a defined number of epochs, where an epoch represents one complete pass through the entire training data set. The choice of the number of epochs impacts the convergence of the model to a good solution. Too few epochs may result in underfitting, while too many epochs may lead to overfitting. In this study, 250 epochs were chosen based on empirical testing to provide a good balance between training speed and model performance. The training process involves the iterative adjustment of the model’s weights to minimize the loss function, which in this case, is the mean squared error between the predicted and actual PM2.5 emissions. The Adam optimization algorithm was employed due to its efficiency and effectiveness in practice. The learning rate, a hyperparameter of the Adam optimizer, was set to 0.01.
Figure 7.
Training loss over epochs.
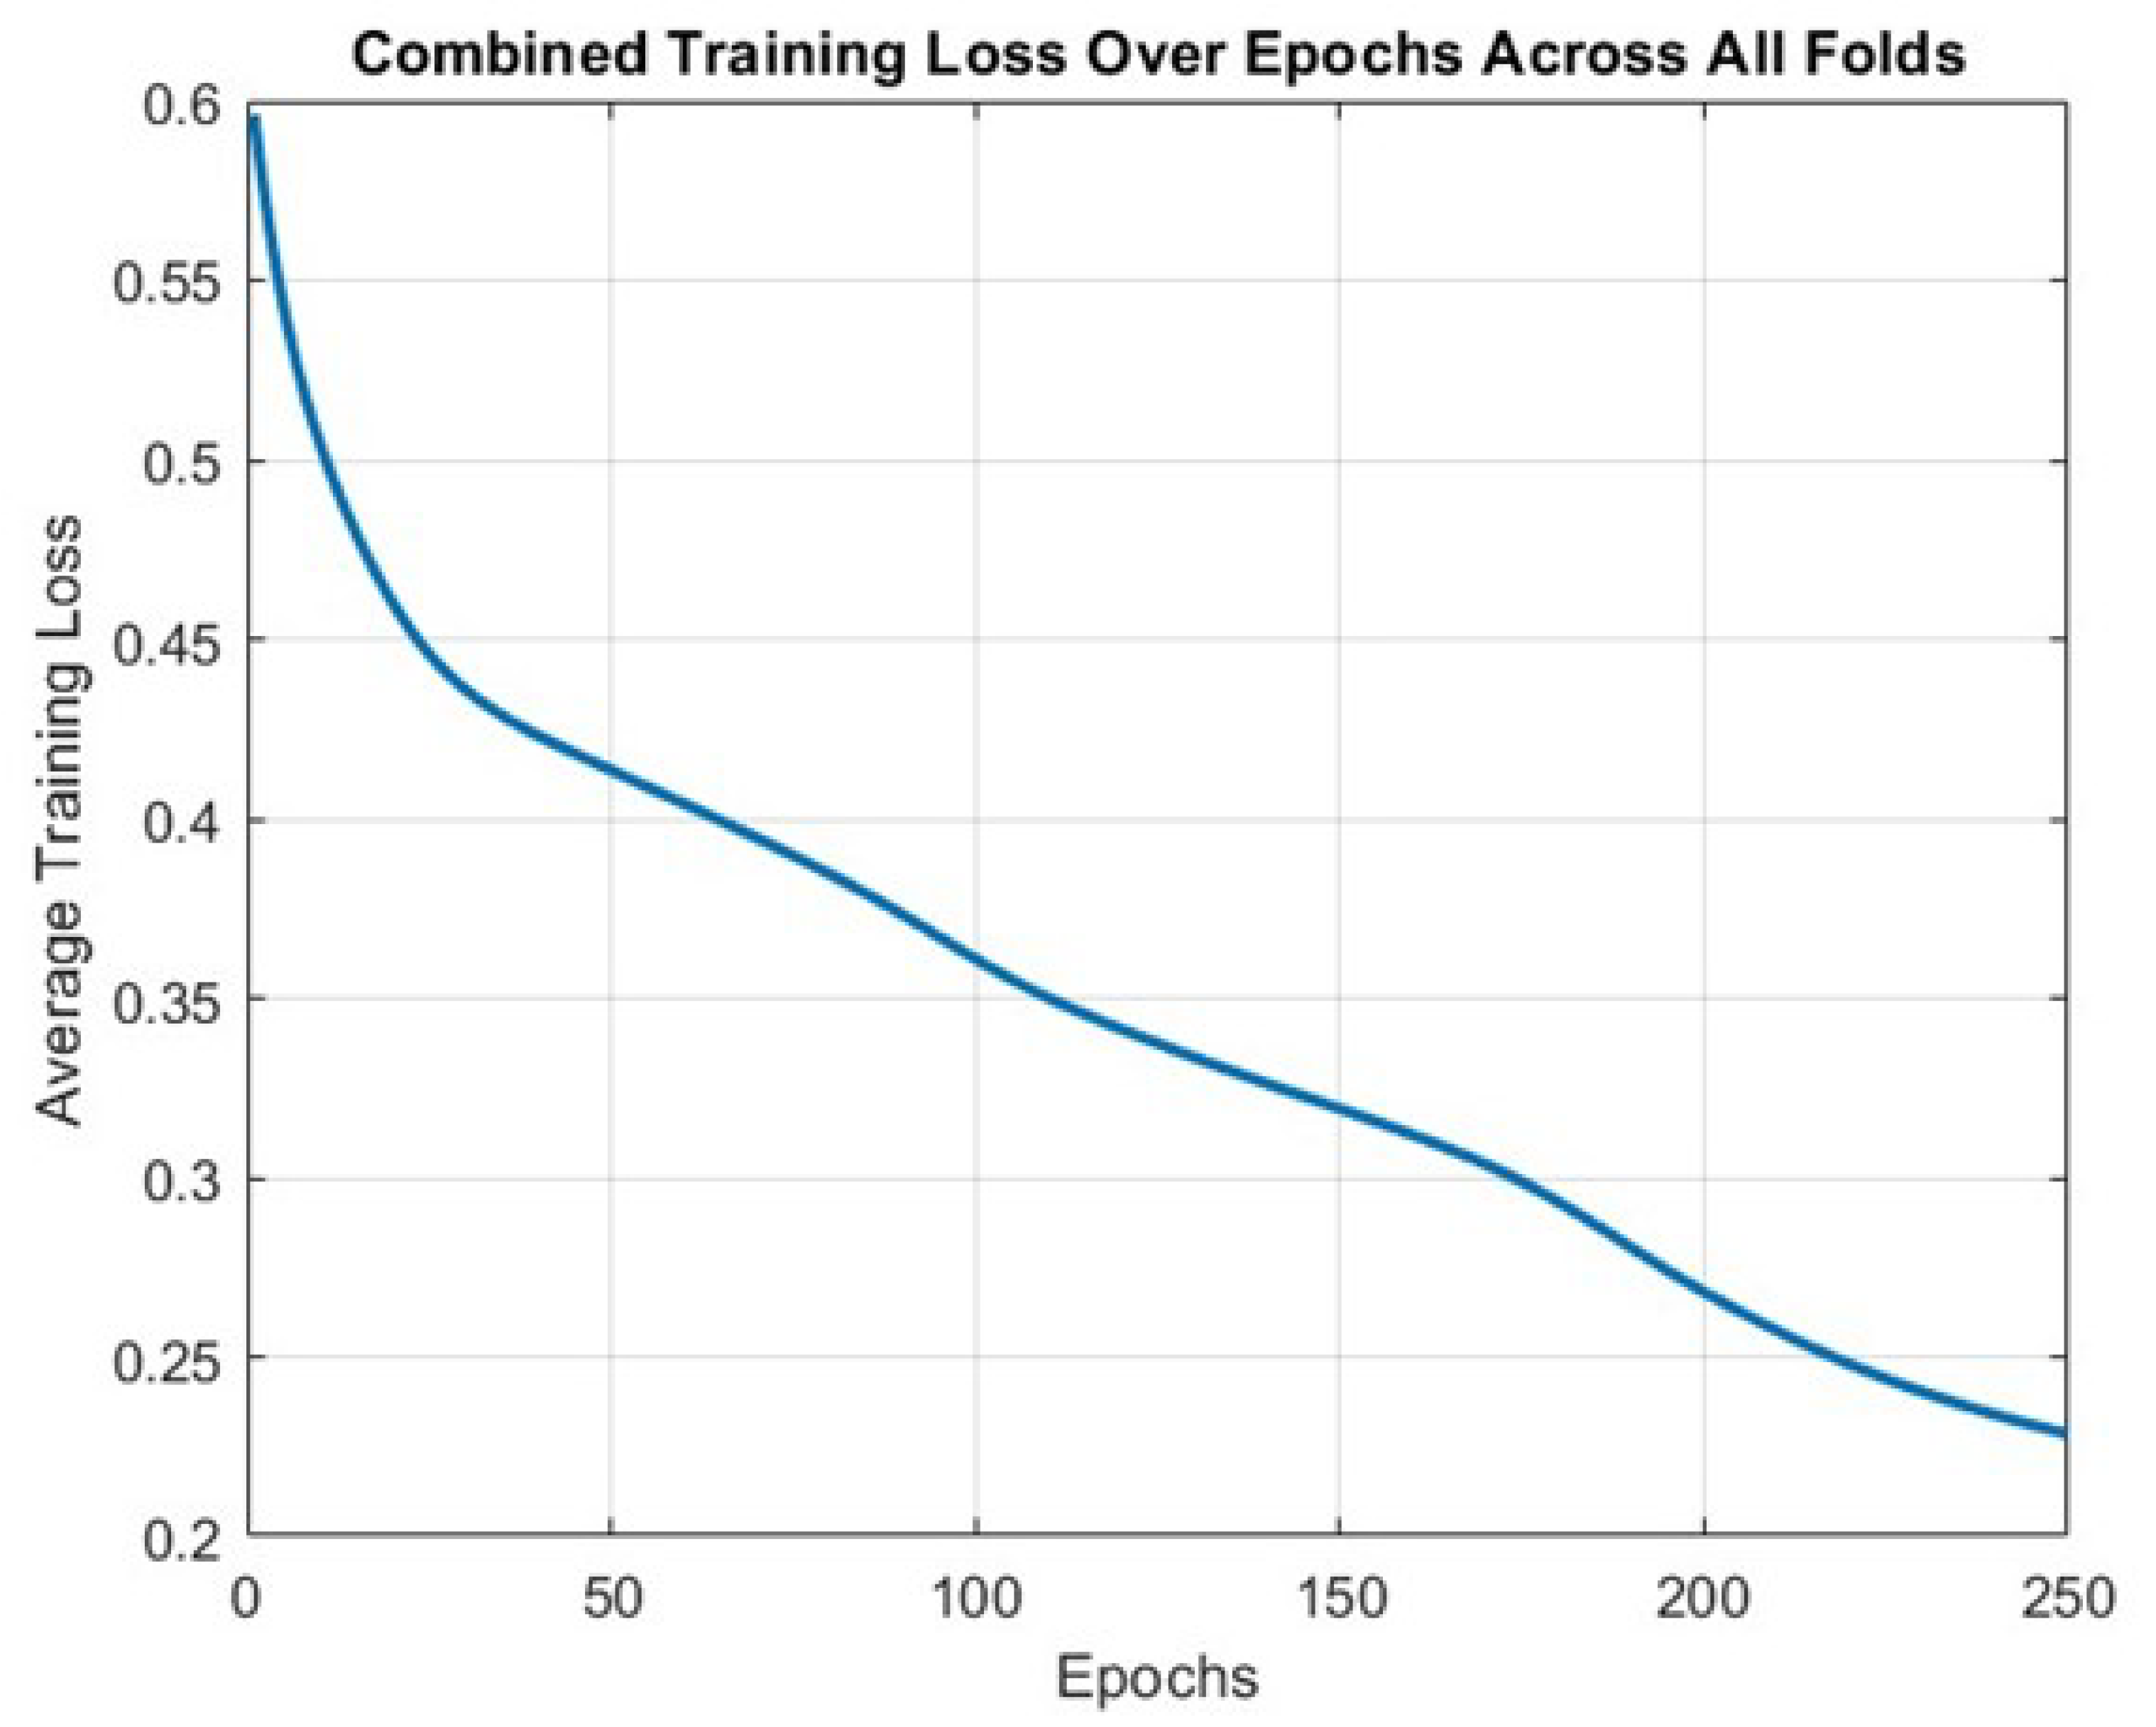
The graphical representation of the model’s training loss over epochs provides a clear visualization of the learning progression. Initially, the training loss starts at a relatively higher level, approximately 0.6, indicative of the model’s initial inaccuracy in predicting PM2.5 levels. As the epoch progresses, a significant downward trend in the training loss is observed, settling around 0.23 towards the end. This decline in loss demonstrates the model’s improving accuracy and its ability to learn effectively from the training data. The steady decrease in loss across the epochs underscores the efficacy of the chosen network architecture and learning rate, affirming the model’s capability to adapt and enhance its predictive performance over time. The final loss value of 0.23 represents a satisfactory level of model training, suggesting that the neural network has successfully captured the underlying patterns in the data without overfitting.
4.5. Model Evaluation Metrics
Evaluation metrics for assessing the performance of the model is crucial to ascertain its predictive accuracy and generalization capability. Two common regression metrics were used for this purpose:
-
Mean Squared Error (MSE):It measures the average squared differences between the predicted and actual values, giving a rough idea of the magnitude of the error, but not its direction. A lower MSE value indicates a better fit of the model to the data.
-
Mean Absolute Error (MAE):It calculates the average absolute differences between the predicted and actual values, which provides a linear error penalty and is more robust to outliers compared to MSE.
Through the 5-fold cross-validation process, these metrics were calculated for each fold and then averaged to understand the overall performance of the model. The average MSE and MAE values obtained from the validation process were instrumental in assessing the model’s accuracy.
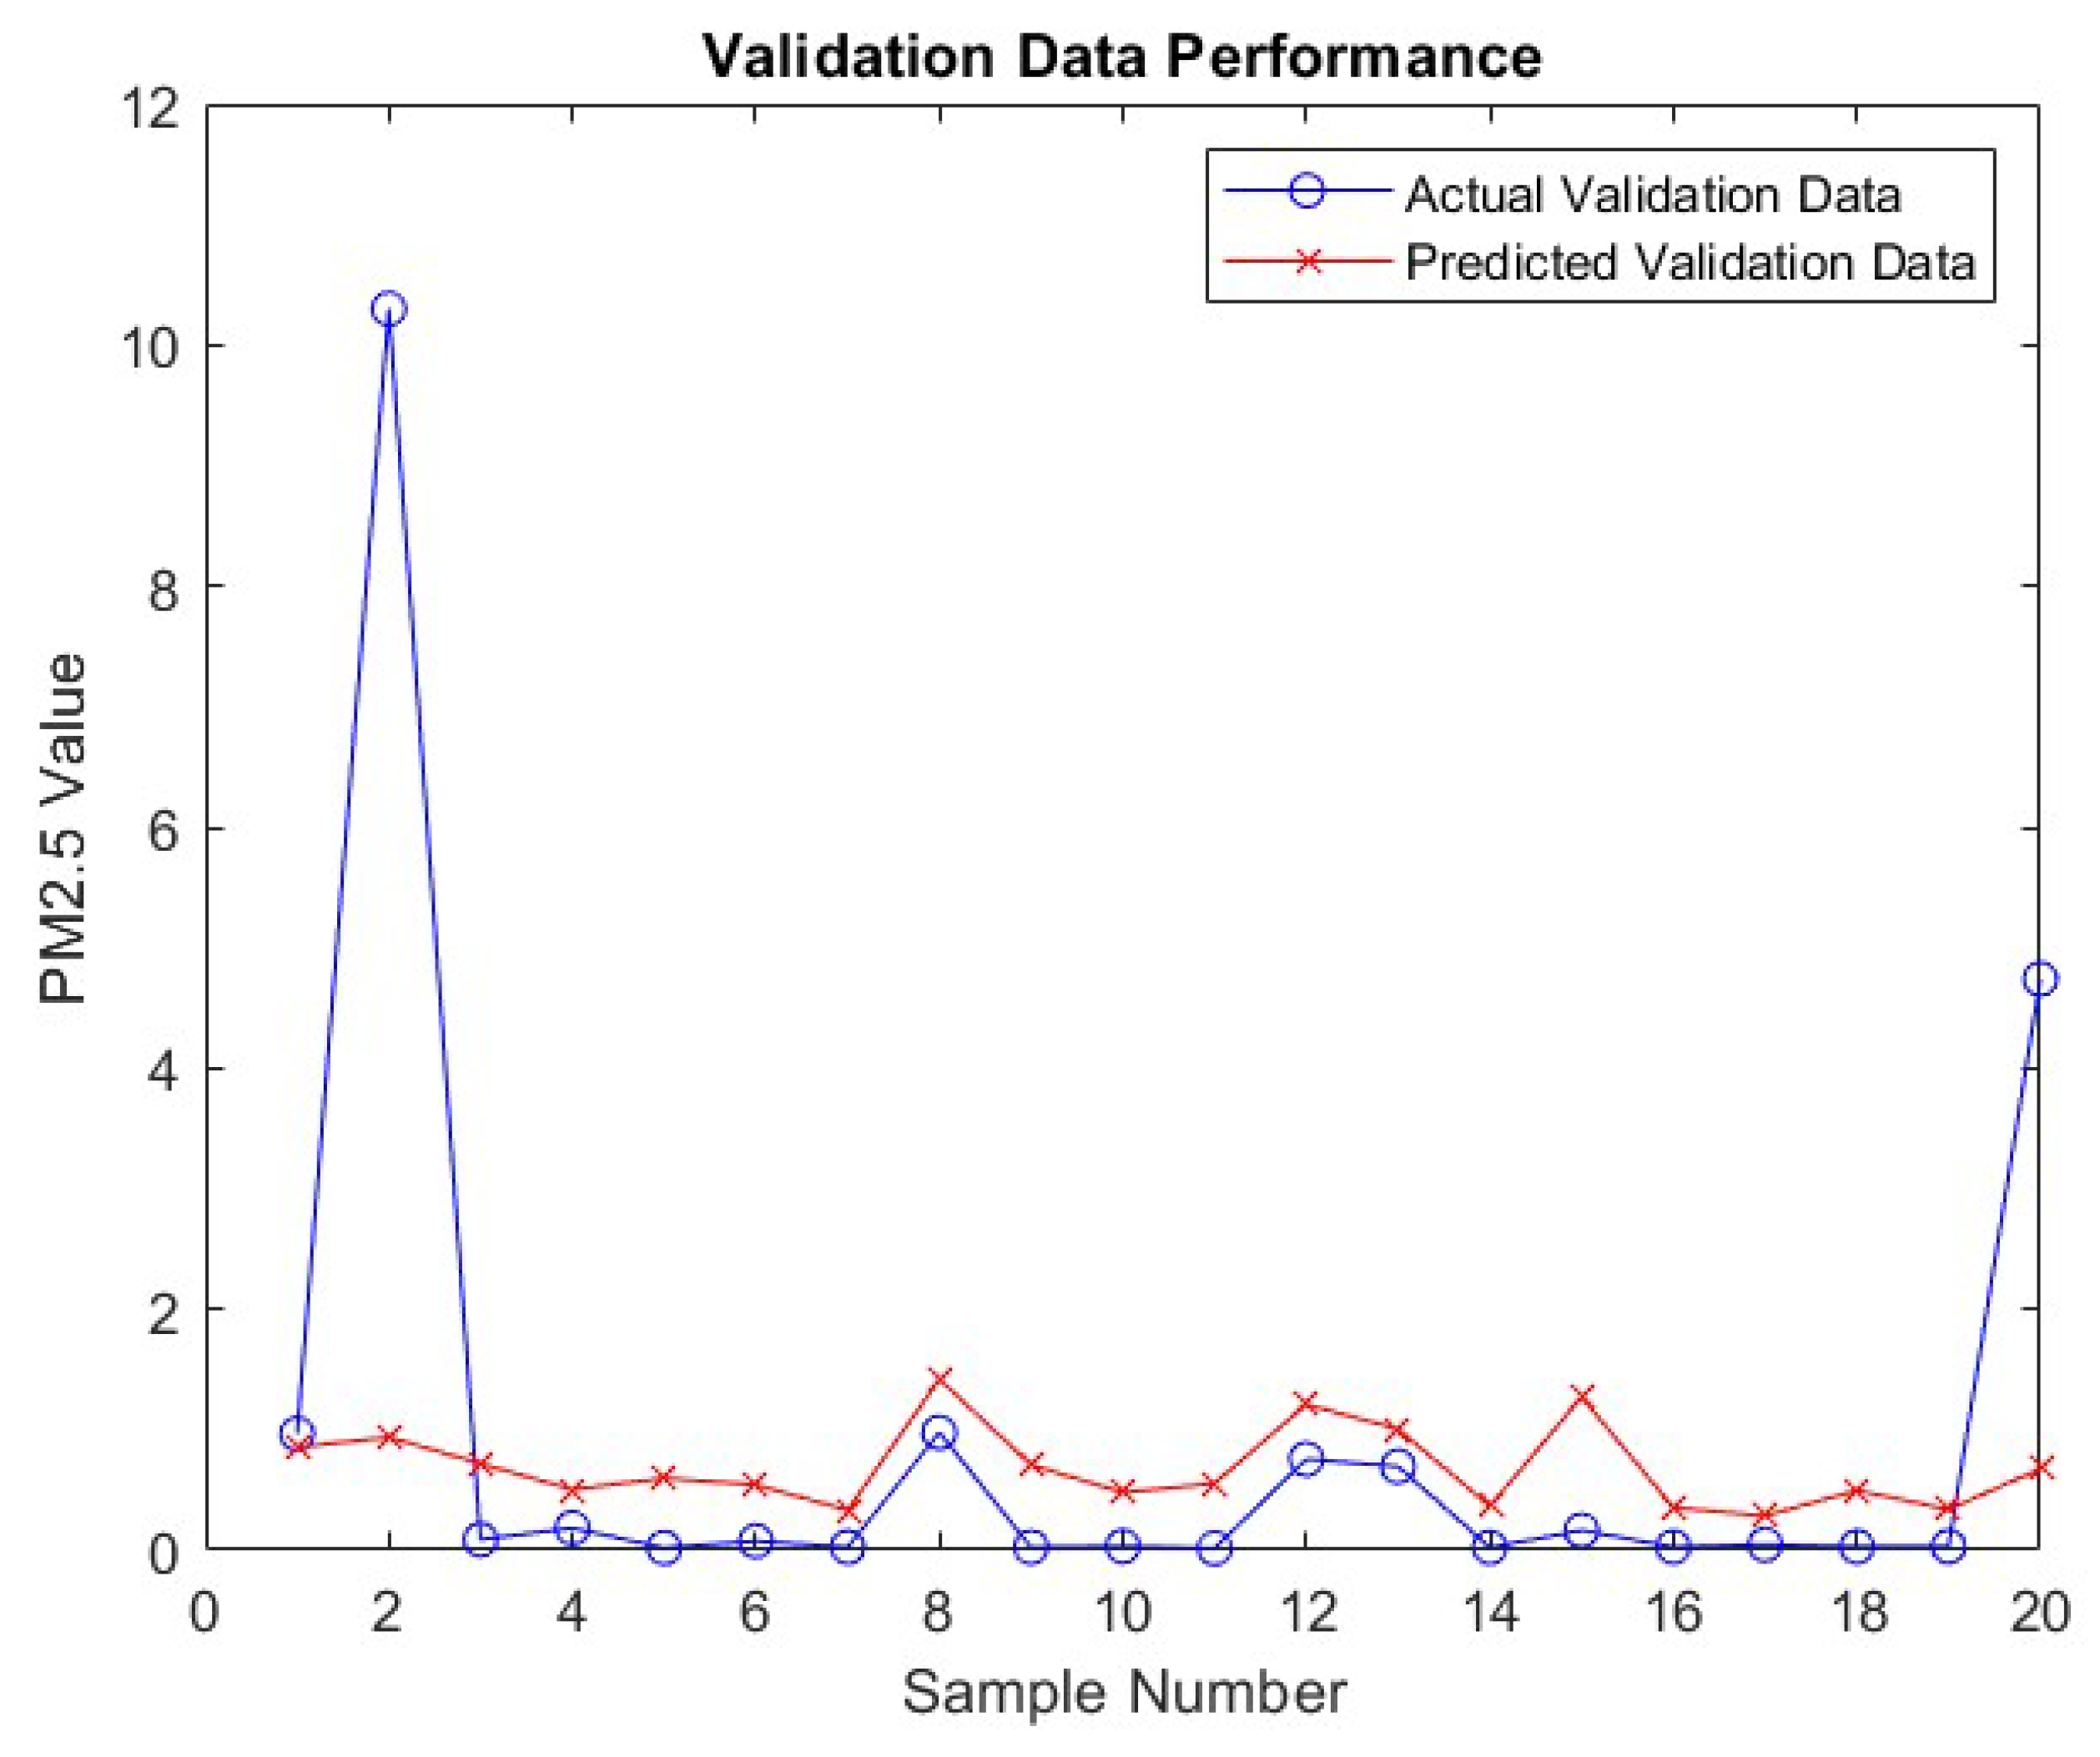
Figure 8, which presents a plot of the "Actual vs Predicted PM2.5 Values for training Samples," and Figure 9 which displays the plot for "Actual vs Predicted PM2.5 values for validation Samples" visually demonstrate the model’s performance. In these plots, the proximity of the predicted values to the actual PM2.5 values provides a clear representation of the model’s accuracy. Additionally, a residual plot, included in the supplementary materials, directly visualizes the distribution of errors, further emphasizing the effectiveness of the MSE and MAE metrics.
In the context of the model’s performance, the distribution of errors, as illustrated in Figure 9, offers insightful perspectives. The spread and central tendency of the error distribution are critical in understanding the reliability and consistency of the model. Areas where the model shows larger errors indicate opportunities for further improvement and refinement.
These metrics provide a quantitative measure of the model’s ability to predict PM2.5 emissions accurately. Through meticulous training and validation, a reliable model was developed, which demonstrated satisfactory predictive accuracy on unseen data.
5. Results and Discussion
The performance of the neural network model was analyzed, and a comparative discussion is carried out to benchmark against baseline models or previous work in the domain.
5.1. Performance on Training and Validation Data
The performance of the neural network model was evaluated using the mean squared error (MSE) and mean absolute error (MAE) metrics on both the training and validation data. The results are presented in the following table:

Table 1.
Performance metrics of the neural network model on training and validation data.
| Metric | Training data | Validation data |
|---|---|---|
| MSE | 0.91 | 0.61 |
| MAE | 0.64 | 0.56 |
The training process’s progression was also visualized by plotting the training loss across epochs, as shown in Figure 7 This figure illustrates the convergence of the model towards a minimum loss point, indicating learning from the data. The distribution of errors, as demonstrated in Figure 8, provides insight into the model’s prediction accuracy across the data set.
The results indicate a satisfactory performance of the neural network model in predicting PM2.5 emissions. The neural network exhibits superior or comparable performance, showcasing its potential for practical deployment in almond harvesting operations. The key advantages of the developed neural network model include its ability to capture nonlinear relationships in the data and its capability to generalize well to unseen data, courtesy of the k-fold cross-validation employed during training. However, the model’s performance could be further enhanced with a larger data set or by exploring more sophisticated neural network architectures and training methodologies. Additionally, the model could be extended to predict other forms of particulate matter emissions or optimized for real-time monitoring and prediction in an industrial setting.
The user interface developed facilitates easy utilization of the model by end-users, making the transition from theory to practice seamless.
The findings from this work lay a solid foundation for future research in the domain of environmental monitoring and control in agricultural operations, specifically focusing on reducing particulate matter emissions during harvesting.
This section presents a detailed analysis of the results, offering a comprehensive understanding of the model’s performance and its comparative advantages over other methodologies. The discussion also paves the way for future research avenues, highlighting the significance of this work in bridging the gap between academic research and practical application.
5.2. Interactive Prediction Interface
The culmination of this study is the development of an interactive prediction interface that allows users to input new data and receive predictions for PM2.5 emissions. This section delves into the design and utility of this interactive interface, emphasizing its potential for practical deployment.
5.3. Application of the Interface
The developed interactive prediction interface stands as a bridge between the theoretical model and practical utility. It allows for real-time estimation of PM2.5 emissions, which is crucial for monitoring and controlling air quality during almond harvesting operations. The straightforward and user-friendly design ensures that individuals with varying levels of technical expertise can utilize the model to make informed decisions.
Moreover, the interface could be integrated into a more comprehensive monitoring system, allowing for automated data collection and analysis. This could significantly enhance the efficiency and effectiveness of environmental monitoring and control measures.
This interactive interface also sets a precedent for the development of similar predictive tools in agriculture and other industries where monitoring and controlling particulate matter emissions are crucial. This interface plays a pivotal role in translating academic research into practical solutions that contribute to sustainable agricultural practices by providing a tangible means for stakeholders to leverage the predictive model.
The development and deployment of the interactive prediction interface epitomizes the practical application of the research conducted in this project. By facilitating the real-time prediction of PM2.5 emissions, this interface significantly contributes to the advancement of environmental monitoring and control measures in almond harvesting operations and beyond.
6. Conclusions
Designing a Neural Network model to predict PM2.5 emissions from a recently developed almond harvesting machine [21] has been an effort to gain a better understanding of how the machine operates and its environmental impact. The key findings of this study include the following:
- Correlation between PM2.5 and PM10: A significant correlation was discovered between PM2.5 and PM10 emissions, which justified the utilization of only PM2.5 for modeling purposes. This simplifies the model and reduces the computational resources required for training and predictions.
- Outlier Removal and Data Normalization: Employing outlier removal and data normalization techniques significantly improved the quality of the data set, rendering it suitable for training a neural network.
- Neural Network Performance: The neural network, with its specified architecture, exhibited satisfactory performance in predicting PM2.5 emissions based on the three input parameters: horizontal brush speed, angular velocity of the sweepers, and forward speed of the machine.
- K-fold Cross-validation: Utilizing k-fold cross-validation ensured a more robust evaluation of the model’s performance, reducing the risk of overfitting.
- Interactive Prediction Interface: The interactive interface designed for making new predictions enhances the practical utility of the model, allowing for real-time predictions of PM2.5 emissions based on user-input machine parameters.
- The outcomes of this work bridge the gap between theoretical understanding and practical application of machine learning in predicting emissions from agricultural machinery. Moreover, it also can be used to quantify and predict emissions from agricultural operations. From a practical standpoint, this work lays the groundwork for developing smart, self-monitoring agricultural machinery that can provide real-time feedback on emissions, enabling operators to adjust machine parameters on the fly to minimize environmental impact.
Author Contributions
Conceptualization, R.S.;methodology, R.S.,R.E. and J.-Q.S.; resources, R.S.;software, R.S. and J.C.I; validation, R.S.; visualization, R.S.; writing—original draft preparation, R.S.; writing—review and editing, R.S., R.E., J.Q.S., and J.C.I. All authors have read and agreed to the published version of the manuscript.
Funding
This project is partially supported by a grant from the Almond Board of California and the Internet of Things for Precision Agriculture (IoT4Ag) Engineering Research Center under the Award Number EEC-1941529 from the National Science Foundation (NSF).
Institutional Review Board Statement
Not applicable.
Informed Consent Statement
Not applicable.
Data Availability Statement
Not applicable.
Acknowledgments
Special thanks to Ehsan Ameri and Shusmita Saha for their help in collecting dust data, contributing significantly to this research.
Conflicts of Interest
The authors declare no conflict of interest.
References
- Flory 850 low dust harvester. Available online: https://www.goflory.com/index.php/products/item/860-pto-nut-harvester.
- Weiss McNair 9800 California Special. Available online: https://www.weissmcnair.com/9800p-harvester.
- Jackrabbit Equipment, Lower dust cleaner product faster speed. Available online: https://jackrabbitequipment.com/harvester/.
- California’s 2007-2014 progress in reducing PM2.5 and PM10 emissions from agricultural operations and other sources. Available online: https://ww2.arb.ca.gov/emission-inventory-activities (2015).
- C. C. C., S.; El Jirie, N. B.; A. L. M., Baticados. Particulate matter emission factors using low-dust harvesters for almond nut-picking operations. J. Air Waste Manage. Assoc. 2019, 69, 1304–1311. [CrossRef]
- Altikat, S. Prediction of CO2 emission from greenhouse to atmosphere with artificial neural networks and deep learning neural networks. Int. J. Environ. Sci. Technol. 2021, 18, 3169–3178. [Google Scholar] [CrossRef]
- Kosamkar, P. K.; Pranali, D. V. Y. Analysis and prediction of greenhouse gas emission using feedforward neural network. IT in Industry 2021, 9(1). [CrossRef]
- Kolasa-Więcek, A. Neural Modeling of Greenhouse Gas Emission from Agricultural Sector in European Union Member Countries. Water Air Soil Pollut 2018, 229(205). [CrossRef]
- Chowdhury, S. Application of Artificial Neural Network for Predicting Agricultural Methane and CO2 Emissions in Bangladesh. ICCCNT 2021, 87, 5. [Google Scholar] [CrossRef]
- B. K. et al. Application of artificial neural networks for prediction of output energy and GHG emissions in potato production in Iran. Agric. Syst. 2014, 123, 120–127. [CrossRef]
- OSHA Training Library on Silica. Available online: https://www.osha.gov/training/library/silica/handout (accessed on 2004).
- EPA Agriculture News. Available online: https://www.epa.gov/agriculture/agriculture-news-2016 (accessed in 2016).
- B. S. S. et al. Dust influenced by conventional and undercutter tillage within the Columbia Plateau, USA. Earth Surf. Process. 2009, 34, 1323–1332. [CrossRef]
- Han, K. W. Y. A review of artificial neural network techniques for environmental issues prediction. J Therm Anal Calorim 2021, 145, 2191–2207. [Google Scholar] [CrossRef]
- Poznyak, A.; Alexander, I. C. T. P. A survey on artificial neural networks application for identification and control in environmental engineering: Biological and chemical systems with uncertain models. Annual Reviews in Control 2019, 48, 250–272. [Google Scholar] [CrossRef]
- Shahin, M. A.; J. H. R.; M. B. Recent Advances and Future Challenges for Artificial Neural Systems in Geotechnical Engineering Applications. Advances in Artificial Neural Systems 2009, 9. [CrossRef]
- Iglewicz, B.; H. D. How to Detect and Handle Outliers. ASQ Quality Press: City, Country, 1993.
- Jain, M. J.; A. K. D. R.; P.W. Statistical Pattern Recognition: A Review. IEEE Transactions on Pattern Analysis and Machine Intelligence 2000, 22(1), 4-37. [CrossRef]
- Pope, C. A.; Dockery, D. W. Health Effects of Fine Particulate Air Pollution: Lines that Connect. Journal of the Air & Waste Management Association 2006, 56(6), 709-742. [CrossRef]
- Zhang, Y.; T. S. Global atmospheric emission inventory of polycyclic aromatic hydrocarbons (PAHs) for 2004. Atmospheric Environment 2004, 43(4), 812-819. [CrossRef]
- Serajian, R.; Sun, J.-Q.; Ehsani, R. Design of an integrated controller Mechanism of a Low-Dust Almond Pickup Machine. Sensors 2023, 23, 2046. [CrossRef] [PubMed]
Figure 1.
Outlier detection and removal.
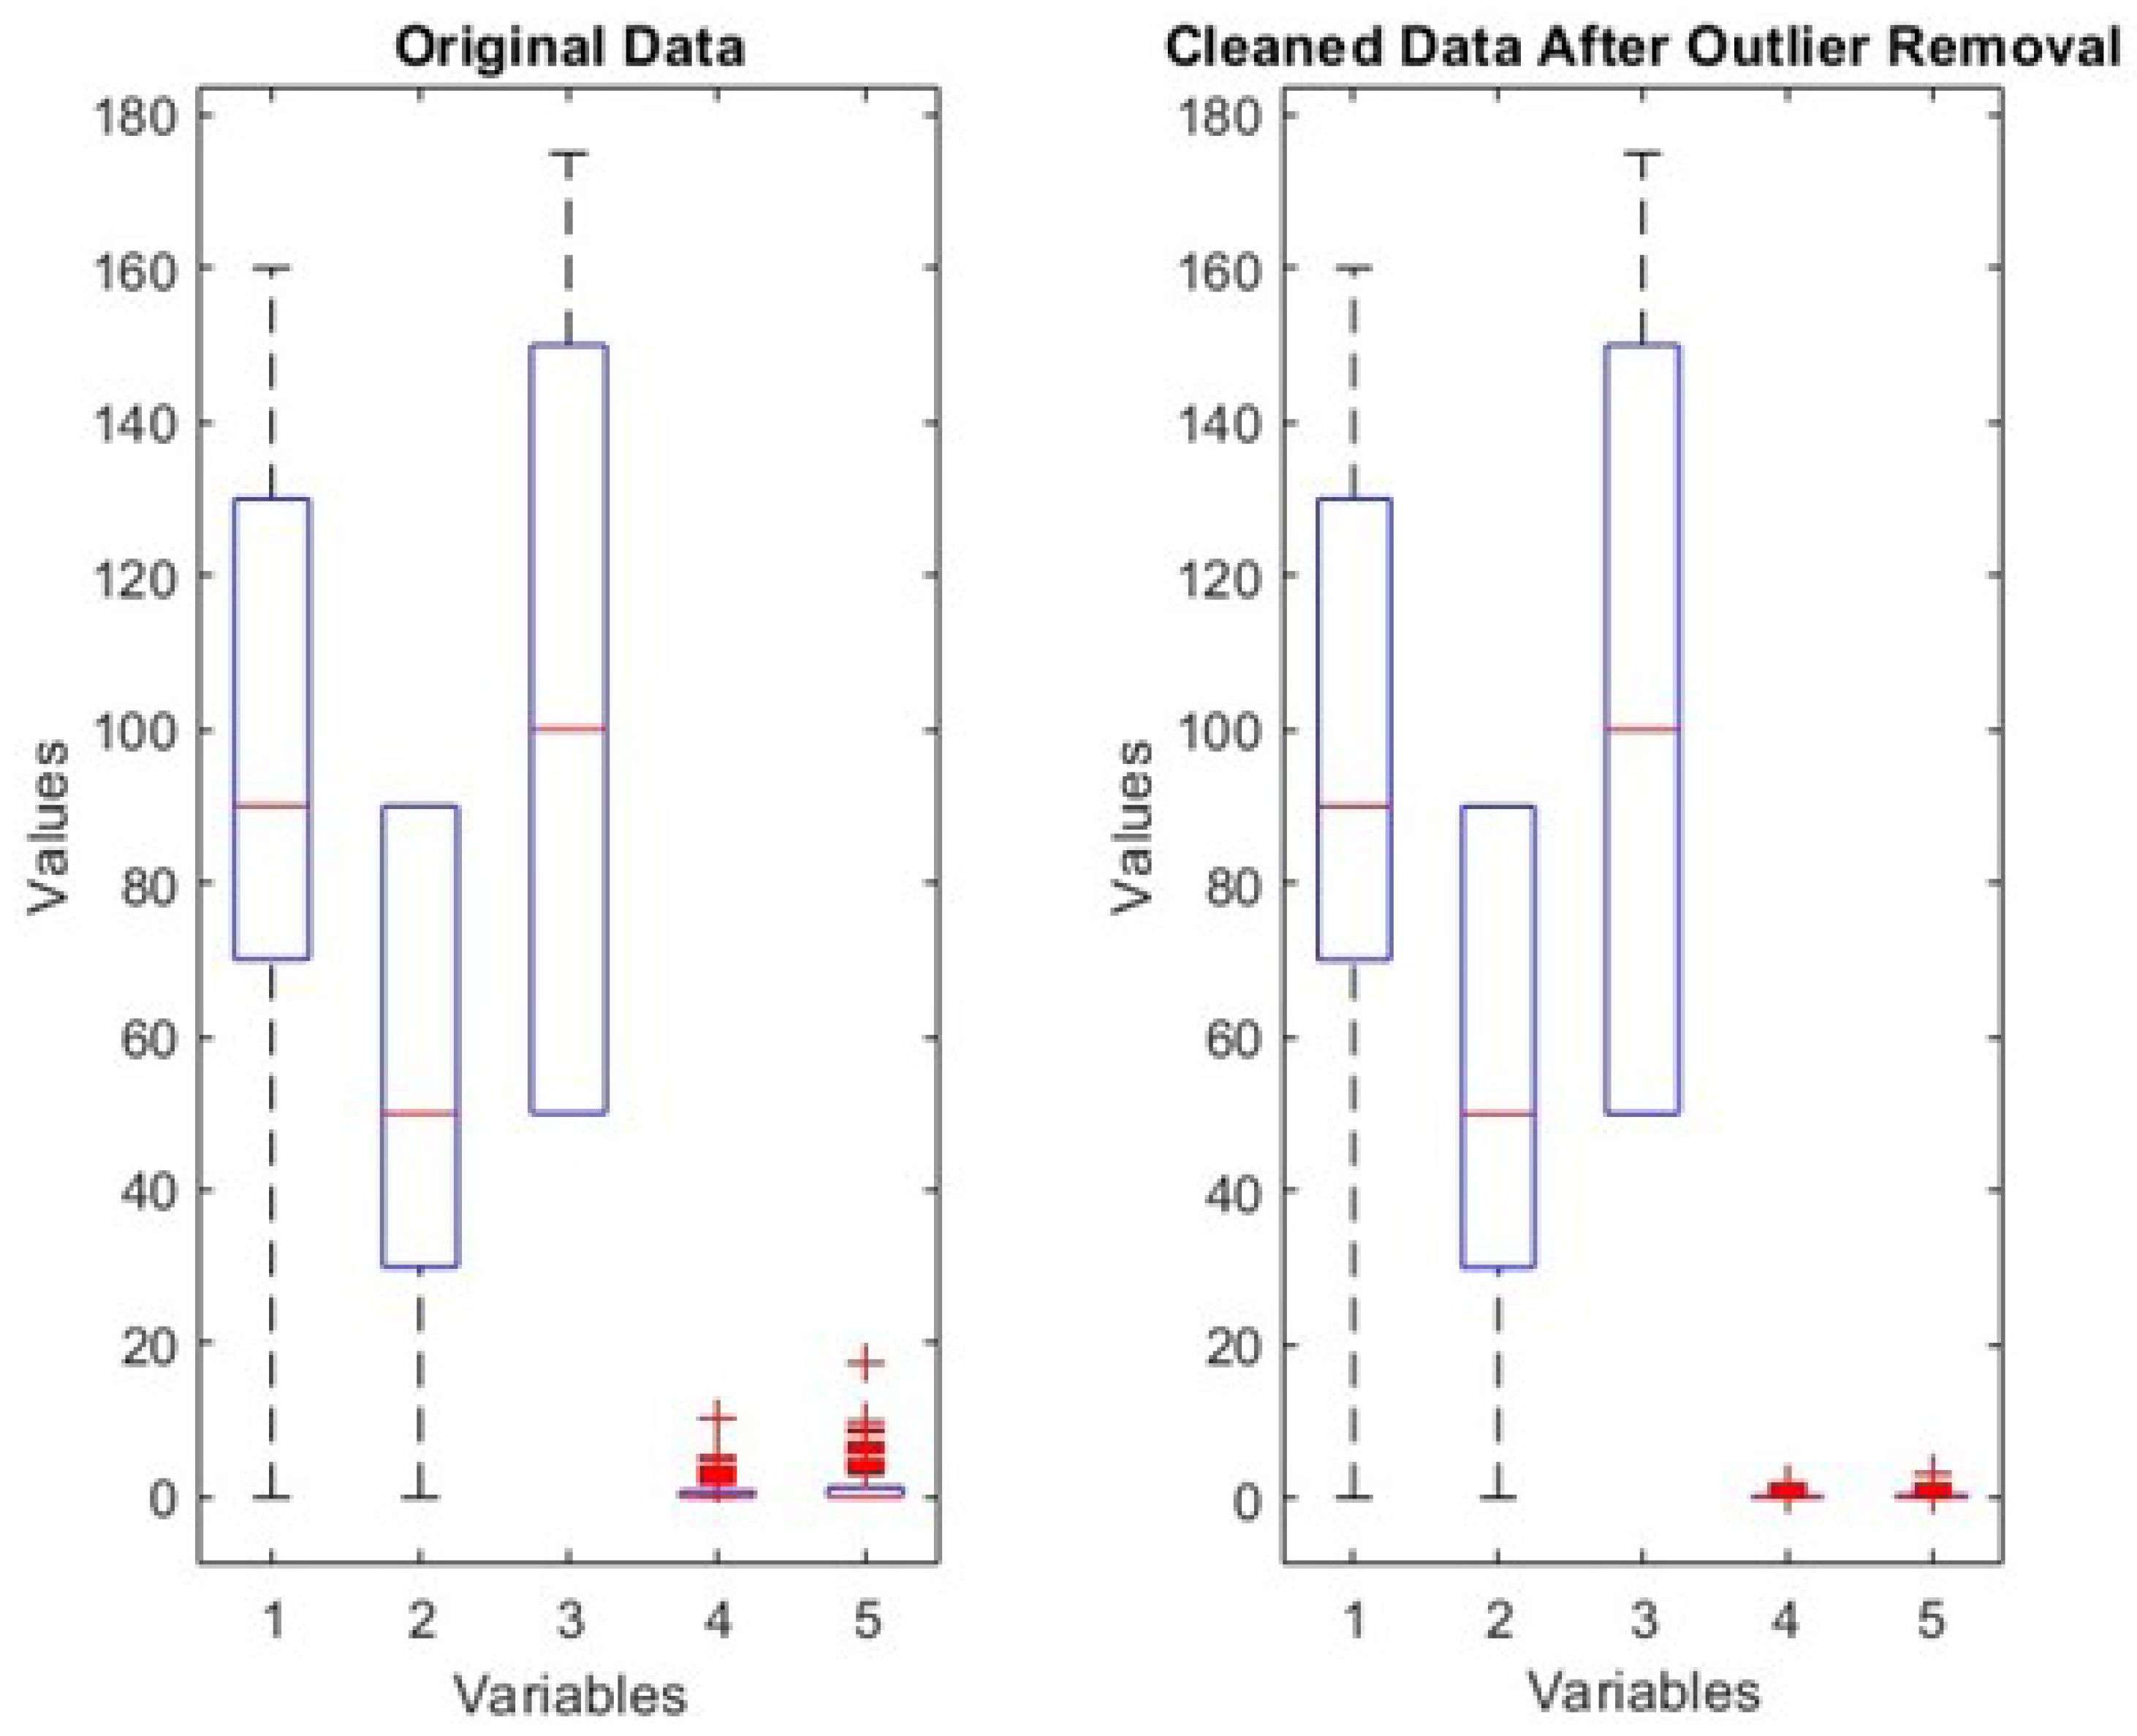
Figure 3.
Scatter plot illustrating the correlation between PM2.5 and PM10 emissions (mg/m3).
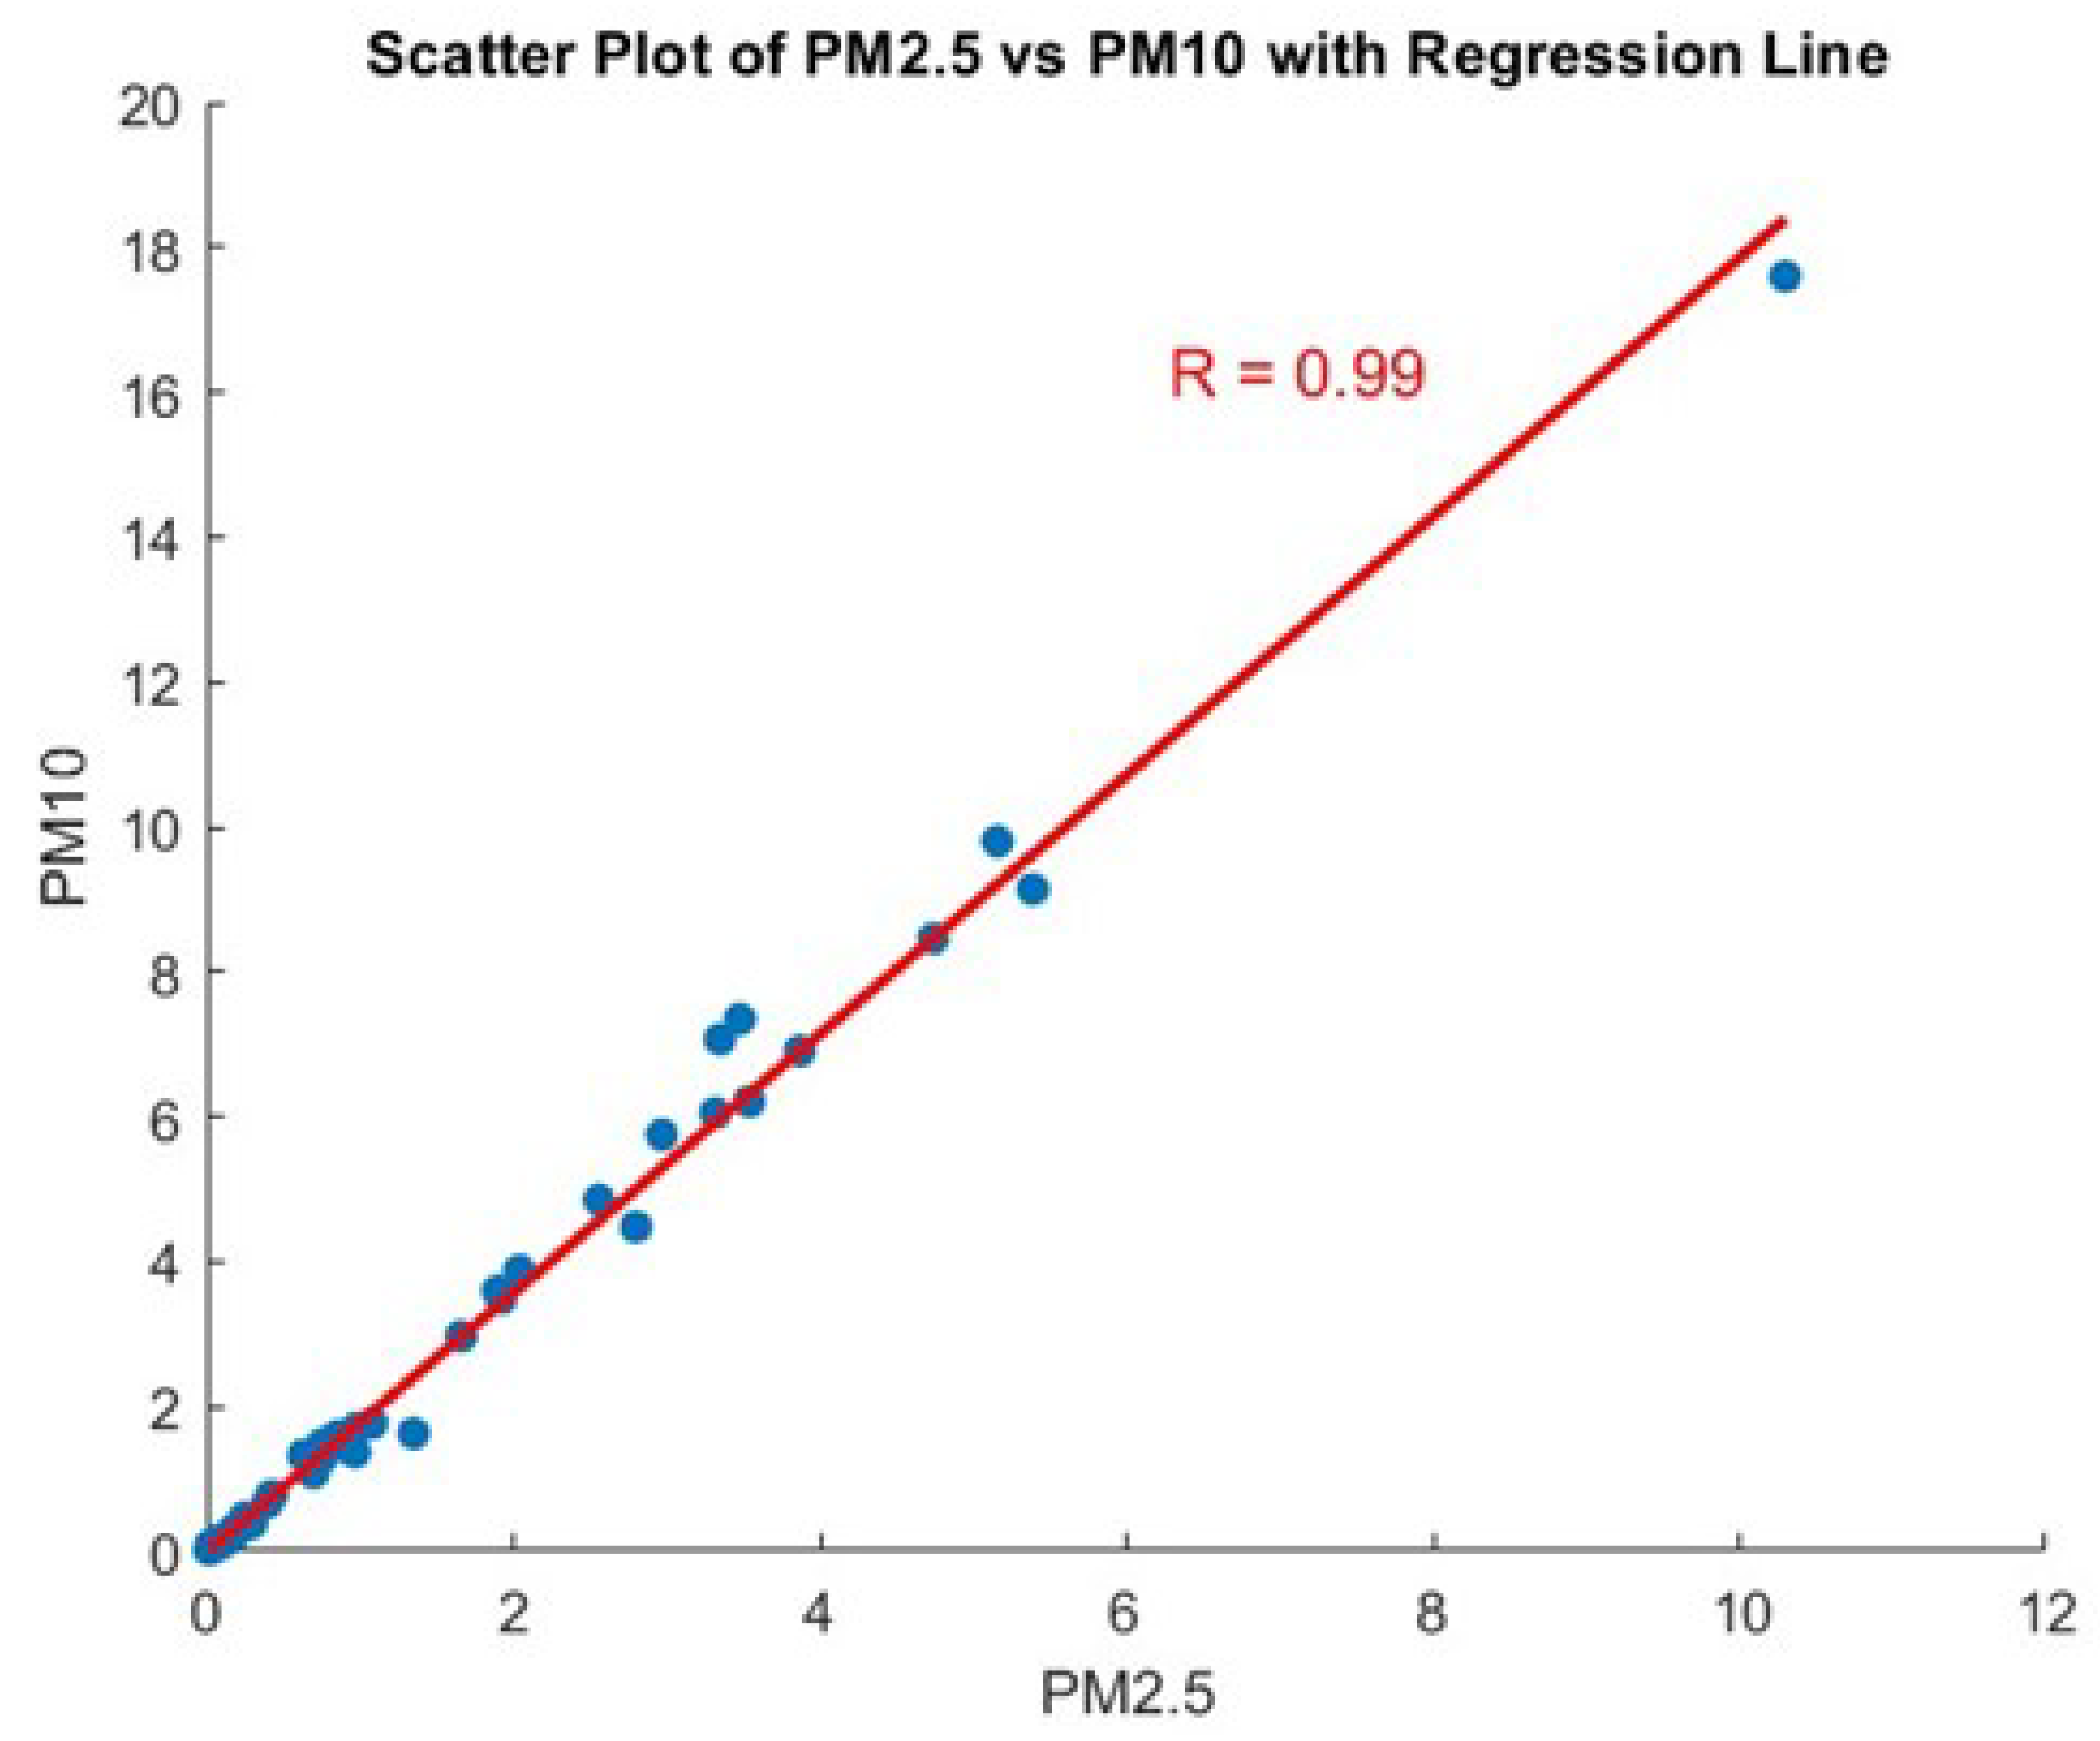
Figure 4.
Histogram illustrating the distribution of PM2.5 emissions.
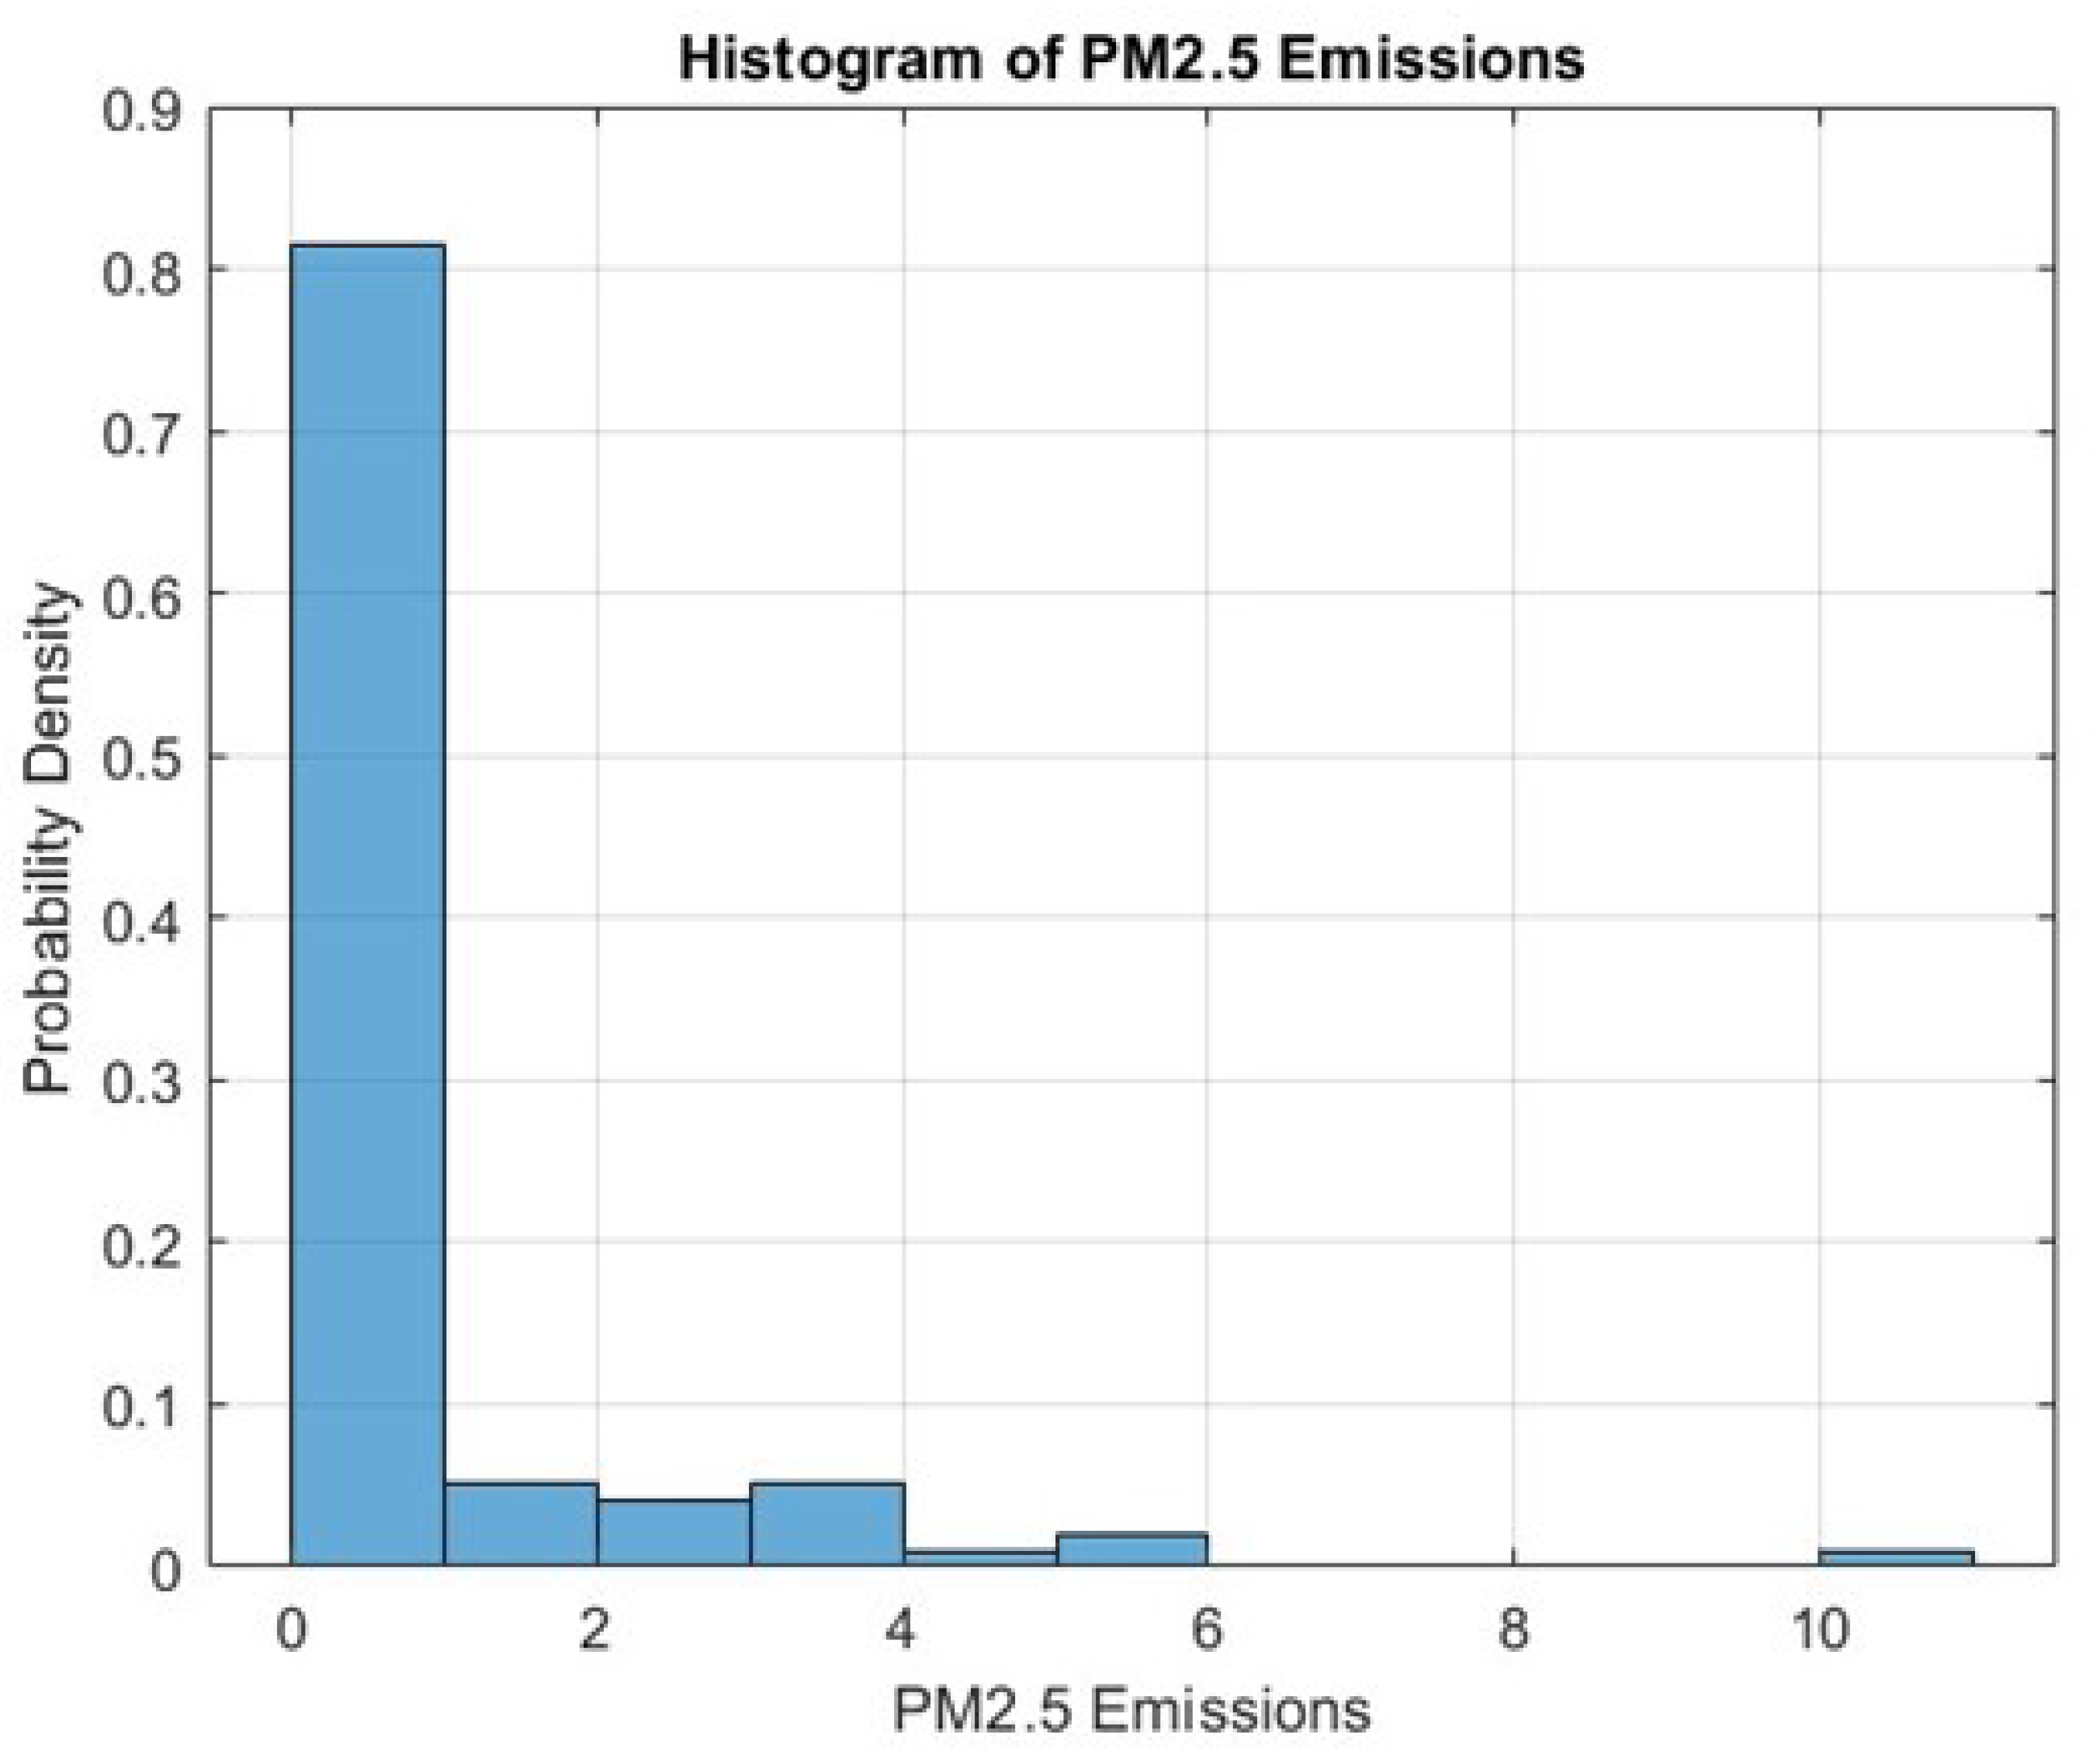
Figure 5.
Heatmap illustrating the correlations between all variables in the data set.
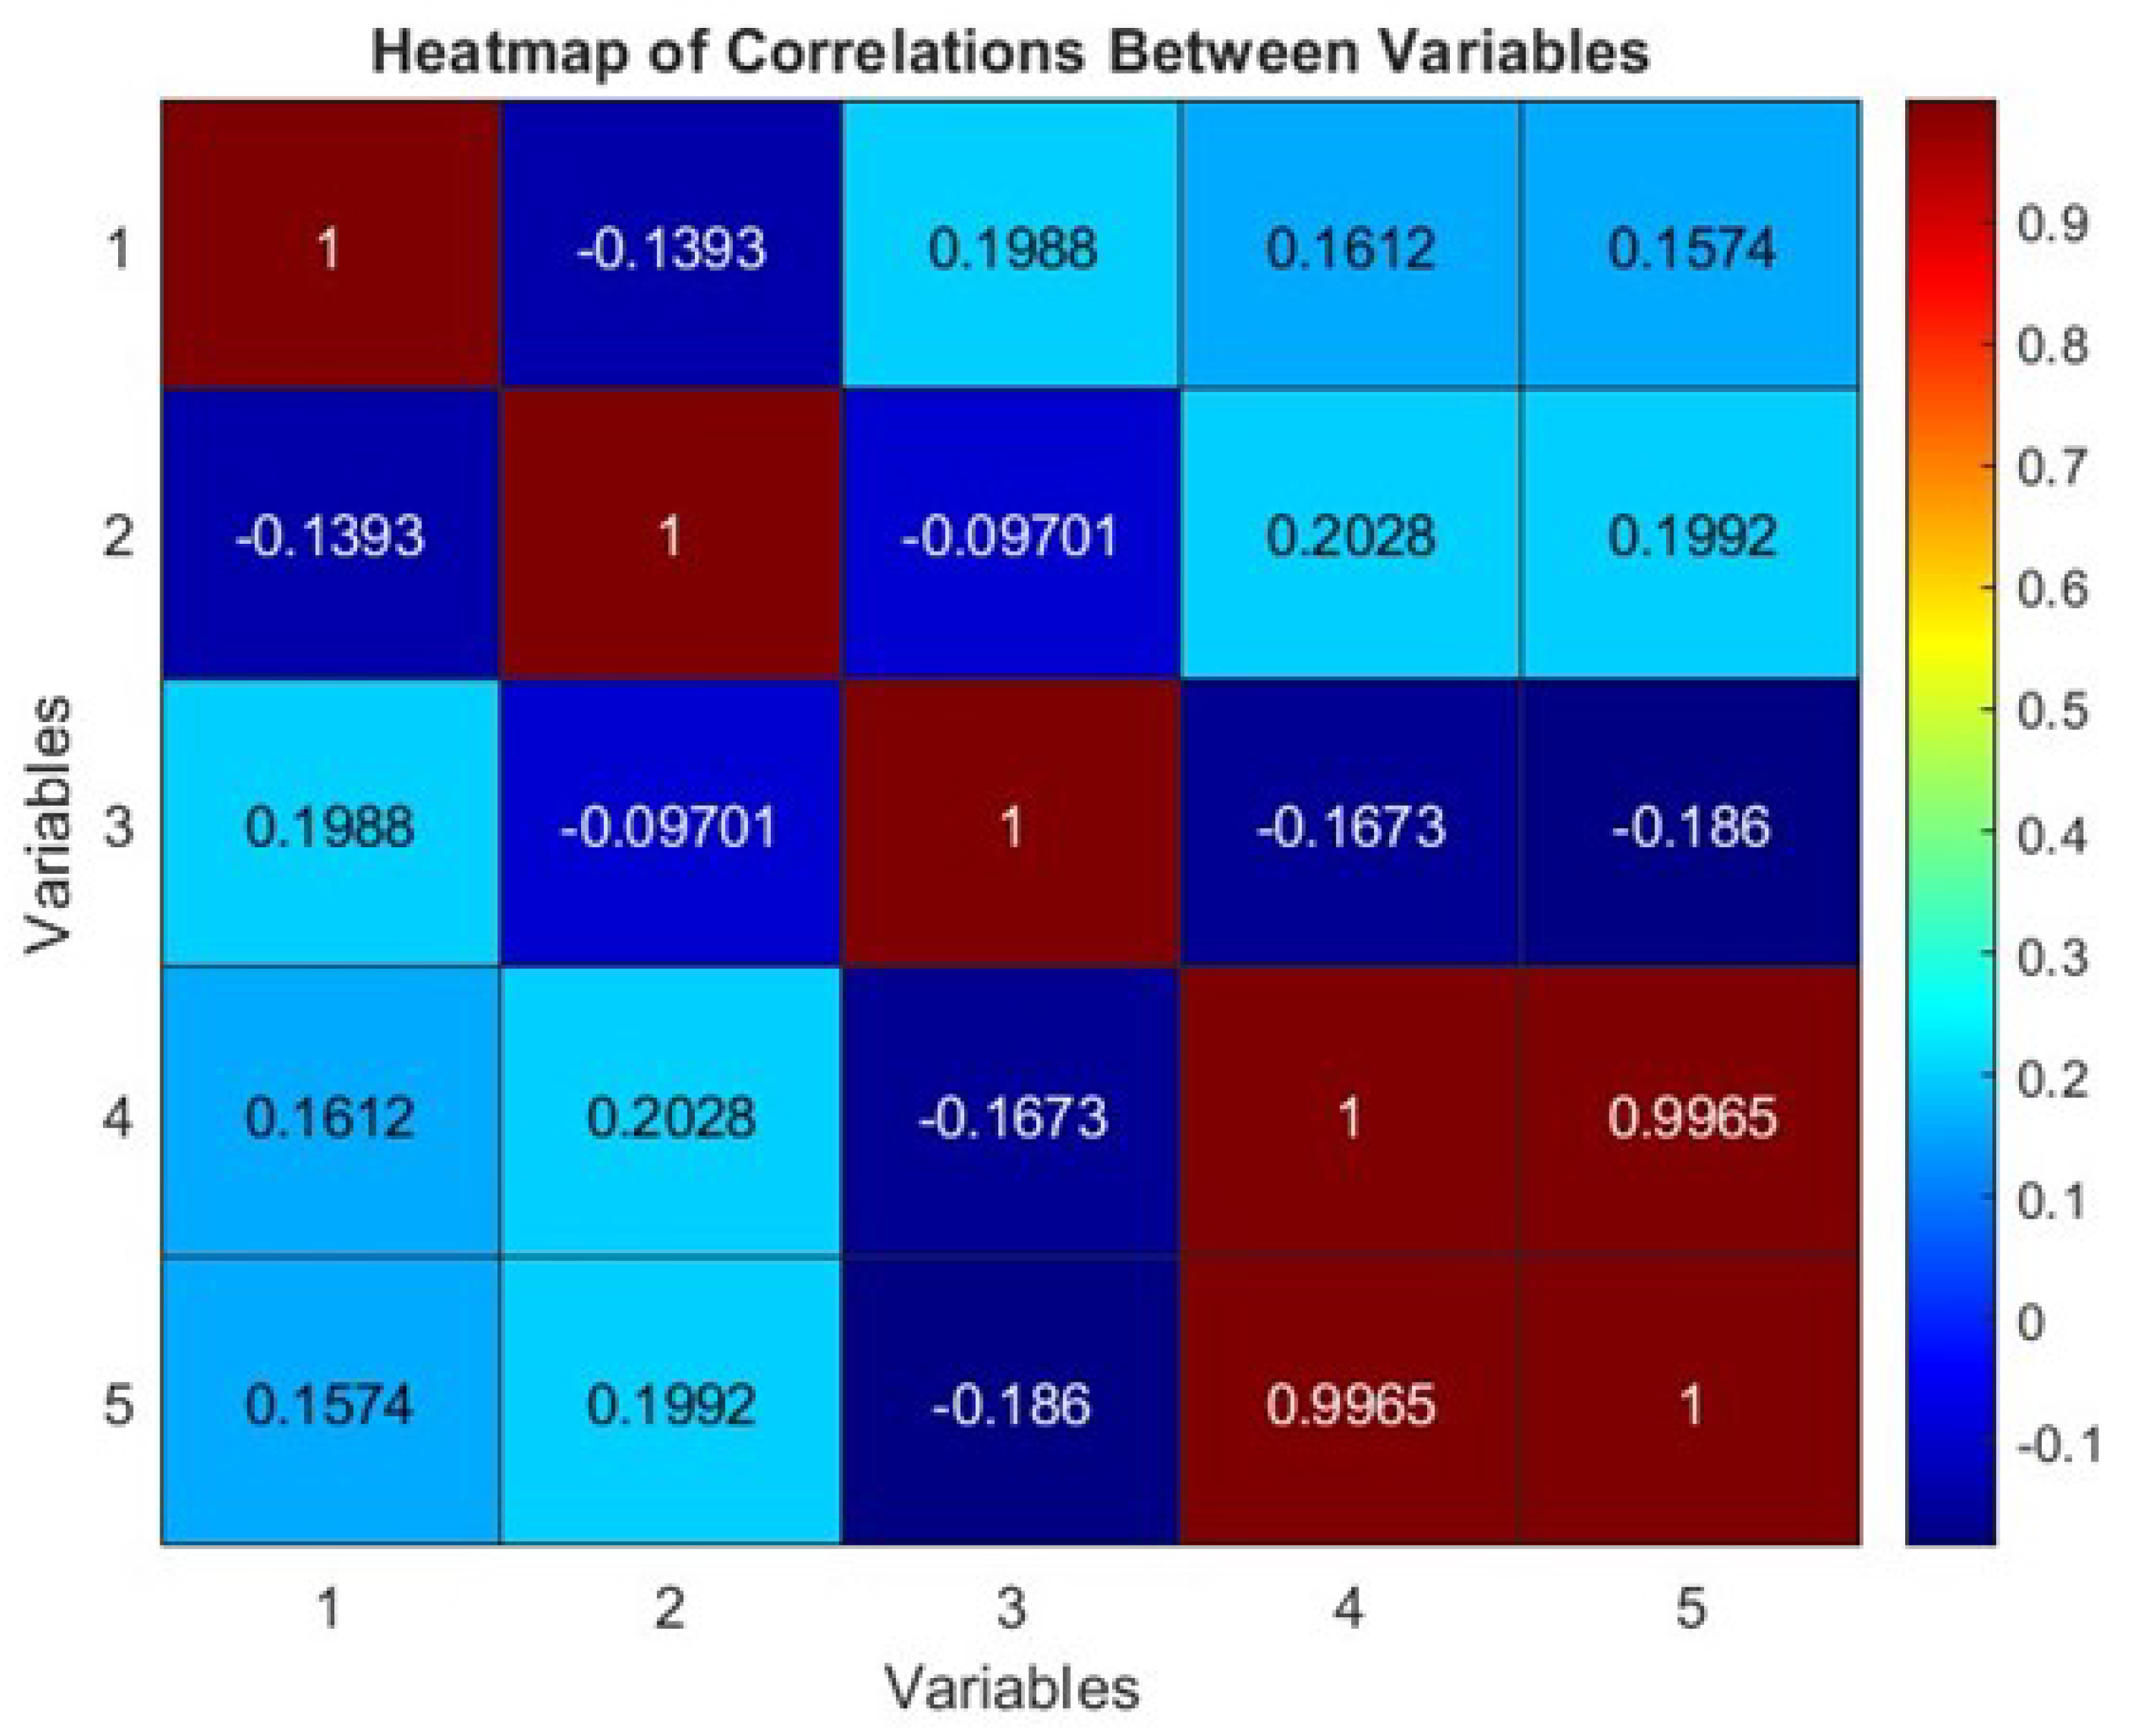
Figure 8.
Distribution of errors of model’s prediction across the data set (Training set).
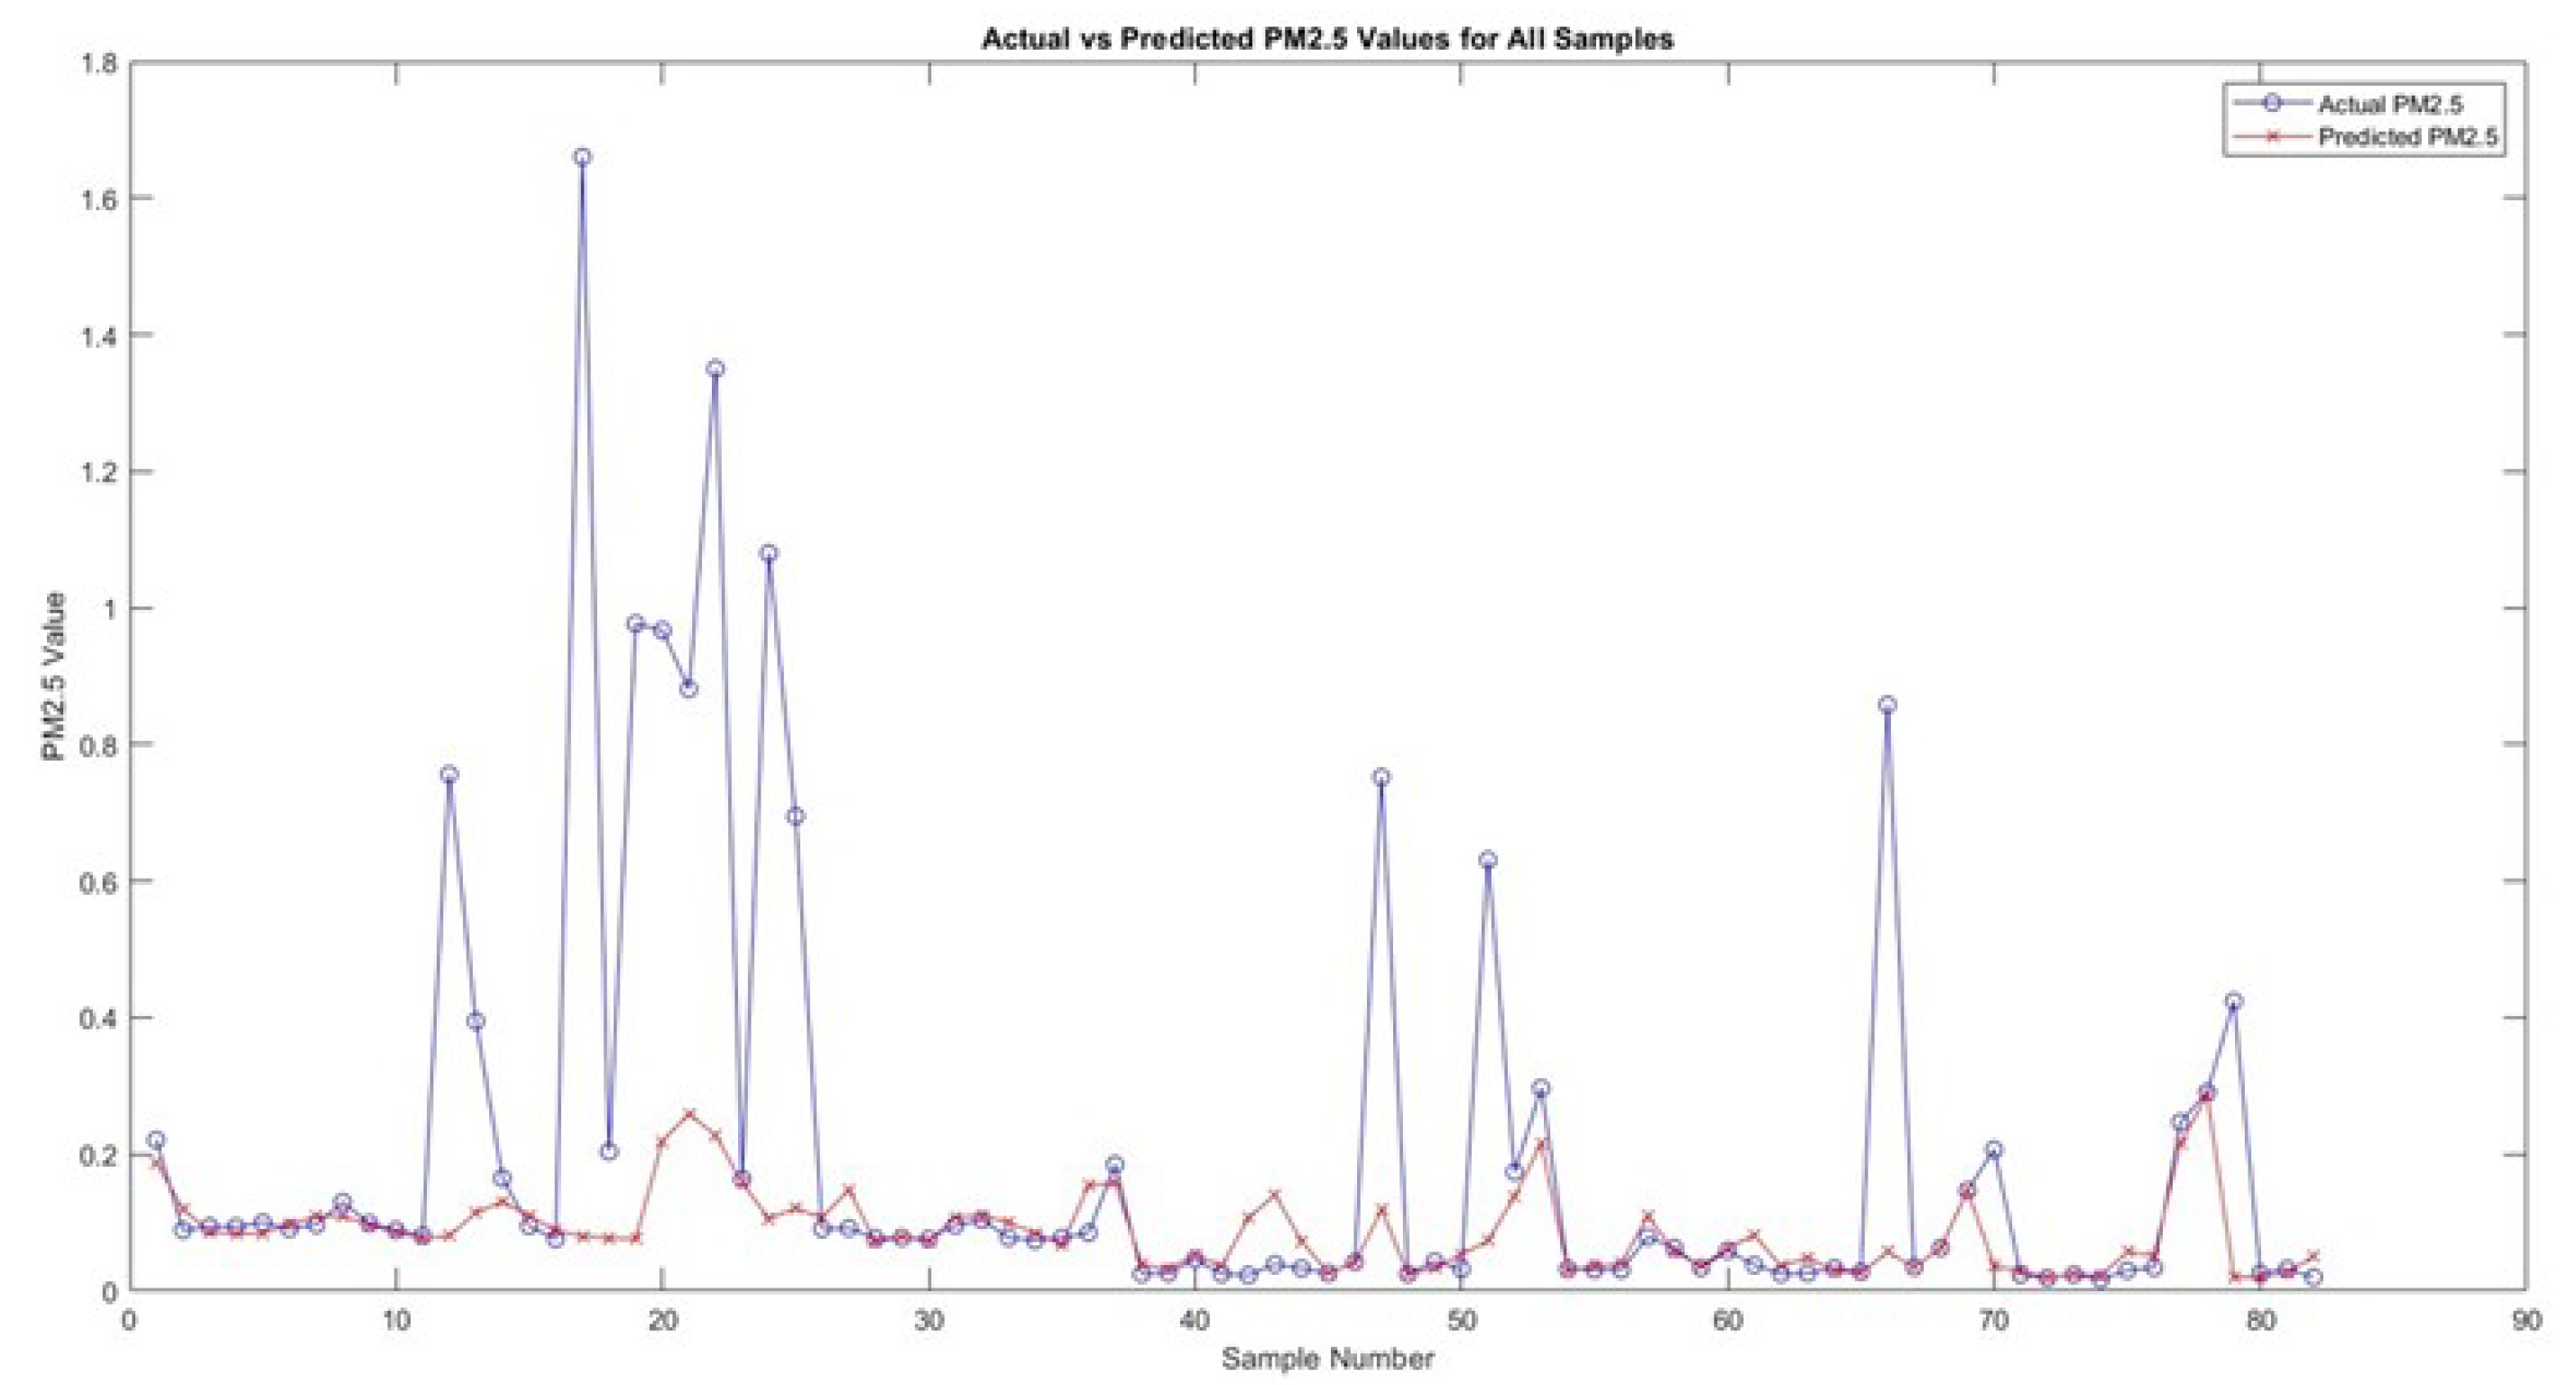
Figure 9.
Distribution of errors of model’s prediction across the data set (Validation set).
Disclaimer/Publisher’s Note: The statements, opinions and data contained in all publications are solely those of the individual author(s) and contributor(s) and not of MDPI and/or the editor(s). MDPI and/or the editor(s) disclaim responsibility for any injury to people or property resulting from any ideas, methods, instructions or products referred to in the content. |
© 2024 by the authors. Licensee MDPI, Basel, Switzerland. This article is an open access article distributed under the terms and conditions of the Creative Commons Attribution (CC BY) license (http://creativecommons.org/licenses/by/4.0/).
Copyright: This open access article is published under a Creative Commons CC BY 4.0 license, which permit the free download, distribution, and reuse, provided that the author and preprint are cited in any reuse.


