Submitted:
10 January 2024
Posted:
11 January 2024
You are already at the latest version
Preprints on COVID-19 and SARS-CoV-2
Abstract
Covid-19 is an airborne disease, with the vast majority of infections occurring indoors. By comparison, little transmission occurs outdoors. Here, we investigate the airborne transmission pathways that differentiate the indoors from outdoors, and conclude that profound differences exist, which help to explain why SARS-CoV-2 transmission is much more prevalent indoors. Near and far-field transmission pathways are discussed along with factors that affect infection risk, with aerosol concentration, air entrainment, thermal plumes, and occupancy duration all identified as being influential. In particular, we present the fundamental equations that underpin the Wells-Riley model, and show the mathematical relationship between inhaled virus particles and quanta of infection. A simple model is also presented for assessing infection risk in spaces with incomplete air mixing. Transmission risk is assessed in terms of aerosol concentration using simple 1D equations, followed by a description of thermal plume-ceiling interactions. With respect to this, we present new experimental results using Schlieren-visualisation and Computational Fluid Dynamics (CFD) based on the Eulerian-Lagrangian approach. Pathways of airborne infection are discussed, with the key differences identified between indoors and outdoors. In particular, the contribution of thermal and exhalation plumes is evaluated, and the presence of near-field/far-field feedback loop postulated, which is absent outdoors.
Keywords:
SARS-CoV-2
; aerosols
; airborne transmission
; infection risk
; thermal plumes
; ceilings
; Wells-Riley
; Schlieren
; Computational Fluid Dynamics
; near and far-field
1. Introduction
One of the most striking features of the recent Covid-19 pandemic was the marked contrast between the risk of acquiring a SARS-CoV-2 infection indoors compared with outdoors, with the odds of contracting a SARS-CoV-2 viral infection indoors estimated to be 18.7 times higher than that outdoors [1]. This suggests that fundamental differences exist between the indoor and outdoor environments, which might help to explain why SARS-CoV-2 is so easily transmitted inside buildings and in other enclosed spaces. Although some differences relate to human behaviour [2,3,4,5,6], contamination of surfaces [7,8], and the action of sunlight [9,10,11,12], many of the reasons why Covid-19 transmission is so much higher indoors appear to be associated with inherent differences that exist in airflow dynamics and aerosol behaviour between the internal and external environments [13]. While some work has been undertaken comparing indoor and outdoor transmission [13,14,15,16], relatively little has focused on the differences that exist between the two environments regarding fluid dynamics and the behaviour of respiratory aerosols, with the result that some important issues have largely been overlooked. More specifically, little attention has been paid to issues such as: the interaction between thermal plumes and ceilings; the age of the inhaled aerosols; the impact of poor air mixing; and the contribution that far-field airborne viral load makes to near-field exposure – all issues that appear to be influential in the transmission of SARS-CoV-2 indoors. Therefore in this analytical review we seek to redress this situation by focusing on some lesser-known fluid related issues that may be influential in the airborne transmission of SARS-CoV-2 indoors. Our aim here is not to provide definitive answers, but rather, to raise awareness of important issues that have been largely overlooked and which are in need of further investigation. In so doing, we aim of better understand the drivers facilitating the airborne spread of Covid-19 indoors. Furthermore, we present a theoretical basis for assessing relative infection risk, which can be used by those modelling the transport of infectious aerosol particles in room spaces.
2. Airborne Transmission
The Covid-19 pandemic has seen major advances in the understanding of how respiratory viral infections, including those caused by coronaviruses, are transmitted [17]. For example, early in 2020 it was thought that Covid-19 was primarily spread either by the contact route (i.e., through contaminated hands and fomites) or by large respiratory droplets >100 µm in diameter. However, while these routes can contribute to the spread of the infection [8], it is now recognised that smaller aerosol particles play a dominant role in the transmission of the SARS-CoV-2 virus [5,17,18,19,20]. These are formed when exhaled respiratory droplets rapidly reduce in diameter due to evaporation to become aerosol particles approximately 20–34% of their initial size [21]. Aerosol particles of this size can easily be inhaled, with those in the size range 2.5 - 19 µm thought to account for 90% of the viral transmission at the nasopharynx [21]. Accordingly, transmission of the SARS-CoV-2 virus is thought to primarily occur when inhaled infectious aerosol particles in this size range come into contact with angiotensin-converting enzyme 2 (ACE2) receptors in the nasopharyngeal region [22].
The respiratory aerosols/droplets exhaled by infectious individuals, many of whom may be asymptomatic or pre-symptomatic [23,24], can range from 0.01 μm to 1000 μm in diameter [25]. However, the larger respiratory droplets >100 µm behave ballistically and tend to fall to the ground within 2 m [26]. Therefore, they are difficult to inhale and their ability to transmit infection is restricted to impaction on the eyes and oral mucosa, as well as the contamination of fomites (i.e., inanimate surfaces). By comparison, respiratory droplets <100 µm diameter, when exhaled, rapidly evaporate to form small aerosol particles, most of which are <20 µm diameter [21]. These can be readily transported by room air convection currents and therefore potentially can be distributed widely. Consequently, a clear demarcation exists between exhaled respiratory droplets >100 µm in diameter that cannot be inhaled and which only have a near-field impact, and those <100 µm which can be inhaled and which have the potential to infect individuals in both a near- and far-fields [17,27,28].
The vast majority of the respiratory droplets exhaled by individuals are smaller than the 100 µm threshold, with an estimated 88.2% and 84.9% of the droplets produced during speaking and coughing respectively <100 μm diameter [29]. These droplets rapidly evaporate to become small aerosol particles. This means that the majority (~>85%) of the respiratory droplets liberated when say speaking or coughing end up as aerosol particles that can potentially be inhaled. Indeed, recent work has shown that median (range) of inhalable aerosol particle emission rates are: 135 (85-691) particles/s for breathing; 270 (120–1380) particles/s for normal talking; 570 (180–1760) particles/s for loud talking; 690 (320–2870) particles/s for normal singing; 980 (390–2870) particles/s for loud singing; and 1480 (500-2820) particles/s for loud singing with exaggerated diction [30]. Other researchers have also observed similar findings [31,32,33]. Collectively, this indicates that in occupied spaces, large numbers of respiratory aerosol particles are continually being liberated into the air, with numbers greatly increasing with the type of vocalisation and the volume of the vocal activity. Likewise, increased physical activity has also been shown to increase the number of inhalable aerosol particles produced [34].
The average SARS-CoV-2 viral load in the respiratory fluid of Covid-19 patients has been shown to be in the region 106 RNA copies per mL, rising to a maximum of 109 copies per mL [35]. This means that large amounts of viral RNA may be liberated in to a room space simply by breathing or talking. For example, it has been estimated that if an infectious individual with an average sputum viral load of 7.00 × 10⁶ copies per mL [35] speaks in a loud voice for one minute, they will generate >1000 virion-containing aerosol particles [20]. As such, this helps to explain why transmission during the Covid-19 pandemic often involved individuals with no obvious signs of disease [36,37,38], with infected persons without symptoms, including both presymptomatic and asymptomatic persons, thought to account for more than 40% of all SARS-CoV-2 transmission [36]. Furthermore, it has been shown that high viral loads in respiratory fluids are not that exceptional, with Kleiboeker et al [39] finding 15.3% of the Covid-19 patients to have samples containing >108 copies per mL, more than 100 times the average. Therefore, in theory, a super-shedder emitting a 100-fold higher viral load than the average could exhale >100,000 virions per minute when speaking [40]. Indeed, it has been calculated that under steady state conditions, the airborne viral load may reach as high as 1248 RNA copies/m3 in a poorly ventilated room, simply due to the breathing of a super-emitter who may be present in the space [41]. As such, spending appreciable amounts of time in an enclosed space with an asymptomatic shedder can render a susceptible individual at considerable risk of acquiring an infection, particularly if the infector is talking loudly or singing. Given this, it is perhaps not surprising that substantial Covid-19 outbreaks have been reported in: night clubs [6]; religious gatherings [2,42]; choirs and singing events [5,43]; and weddings [44], all settings which involve large numbers of people grouped together in confined spaces for considerable periods of time, with most involving singing or talking loudly (and often intimately) in order to be heard above the background noise.
Given the large numbers of respiratory aerosols generated within occupied spaces, it is perhaps unsurprising that during the pandemic numerous studies have recovered SARS-CoV-2 RNA from the air in hospitals [45,46,47,48,49,50,51,52,53,54]. Indeed, a comprehensive systematic review by Birgand et al. [52] concluded that air, both close to and distant from patients with Covid-19, is frequently contaminated with SARS-CoV-2 RNA, with 17.4% of air samples taken close to patients and 33.3% from public areas testing positive for SARS-CoV-2 RNA. They also found that median RNA concentrations varied from 1000 copies/m3 in clinical areas to 9700 copies/m3 in the air of toilets or bathrooms. However, the extent to which this genetic material can cause infection is unclear, as only a few of these samples contained viruses that could be cultured [52]. This suggests that although genetic material might be present, the viability of the virus may be compromised. When aerosolised, SARS-CoV-2 has been shown to lose viability over time [7,55,56,57,58], although there is uncertainty about the rate at which degradation occurs, with some commentators reporting a half-life lasting a few minutes [56,58], whereas others report times in excess of one hour [7,55,57].
2.1. Near-Field and Far-Field Indoor Aerosol Transmission
In rooms and other enclosed spaces, the infectious aerosol mentioned above pose both a ‘near-field’ and a ‘far-field’ threat, with the near-field being close proximity to the infector (i.e., 1 – 2 m) and the far-field generally considered >2 m away. The near-field transmission risk occurs due to the cone-shaped cloud of aerosol particles that are exhaled when speaking, singing, shouting, or breathing (Figure 1) [26], and which has the potential to infect susceptible individuals in close proximity [18,28]. This aerosol cloud is turbulent and expands in volume as it entrains air from the surrounding room space [59,60]. To visualize the fluid dynamics of the exhaled aerosol plume, together with the thermal plume that is associated with human subjects, a sensitive two-pass Schlieren system with a single concave mirror (diameter 609.6 mm and focal length 6096 mm) was used (see Supplementary Material for further details of the Schlieren methodology). The result of visualisation is illustrated in the photograph in Figure 2, taken by ourselves, which shows the turbulent gas cloud exhaled during talking. This gas cloud contains aerosol particles of various sizes, which undergo complex chemical changes as evaporation progresses [56,58]. Although near-field transmission is mainly associated with the inhalation of aerosols, true droplet transmission, involving larger respiratory droplets impacting on the mucosa of the eyes, nose and mouth, can also occur in the near-field if individuals are very close to each other (i.e. <1.5 m).
Importantly, near-field transmission has a directional component with face-to-face interactions generally posing a greater risk compared with side-by-side or back-to-back spatial arrangements. By comparison, the far-field transmission risk arises when the aerosol particles have been dispersed by air currents into the wider room space. It is termed ‘far-field’ because the dispersed aerosols pose a threat to all those who are in the same space but not in close vicinity to an infector [5].
Irrespective of whether the threat is near or far-field, the infection risk ultimately depends on the number of viable viral particles, virions, inhaled by susceptible individuals. As such, contracting a Covid-19 infection appears to be dose-related, a process that can be modelled using the independent action hypothesis (IAH) [20], which states that each virion has an equal, non-zero probability of causing an infection [61]. The dose response in mice for Middle East respiratory syndrome (MERS), a closely related disease to Covid-19, has also been shown to approximate to the IAH [62]. According to the IAH, viral particles act in a strictly independent manner, with the mean number of infecting virions, λ, computed using [61]:
where: ninoc is the number of virions that the host is inoculated with (i.e. the number of viral particles inhaled); and pinf is the probability that each virion will cause an infection. Typically with viral infections, pinf is very small, and so ninoc is required to be large in order to produce the low number of virions that actually infect an individual [61].
Because it is assumed that each virion acts independently, the probability, pinf, that each inhaled virion will cause an infection is therefore [63]:
where: ninf is the minimum number of virions required to cause an infection (i.e. the minimum infectious dose).
Therefore, λ, can be redefined as the fractional infectious dose:
If each inhaled virion acts independently of all the other virions, then for any given individual, the number of infecting virus particles will have a Poisson distribution with a mean of λ [64]. Given this, the probability of an individual contracting an infection, P, after inhaling some viral particles can be expressed as:
When, the inoculation dose, ninoc, is equal to the minimum infectious dose, ninf, then λ = 1, under which circumstances:
In other words, when one infectious dose (i.e. λ = 1) is inhaled, there is a 63.2% chance of an individual contracting an infection. This reflects the fact that natural variance exists in the immune response of susceptible individuals, as well as in the ability of individual virions to cause disease. Hence, not all individuals who inhale the minimum infectious dose will become infected.
Although the precise minimum dose required to acquire a Covid-19 infection is unknown, it appears to be relatively small, something that is consistent with the rapid spread of Covid-19 that can occur in social gatherings. For example, Basu [21], using data from the Skagit Valley Chorale super-spreading incident [5], calculated that just 330 virus particles are required to initiate an infection in humans. Similarly, Prentiss et al [65], using reported data from five outbreaks, calculated the minimum infectious dose for SARS-CoV-2 in humans to be in the range 322 and 2012 virions, with an average of 600 virions. This value is consistent that found by Gale [66], who estimated an ID50 (i.e. the infective dose necessary to infect 50% of subjects) for SARS-CoV-2 of ~500 virions using a thermodynamic response model.
Acquiring a Covid-19 infection by the airborne route depends on the volume of air inhaled and the concentration of viral material in that inhaled air, as illustrated in Figure 1 and Equation 6.
where: dninoc is the number of virions inhaled per increment of time, dt; φ is the pulmonary ventilation rate (m3/s) - typically 6-9 L/min in healthy adults at rest; and Cr is the concentration of viral particles in the inhaled air (virions/m3)
For a susceptible individual at any given location within a room space, the number of virus particles inhaled, ninoc, during an exposure time, t seconds, will be:
where: φ is the pulmonary ventilation rate of the individual (m3/s); and Cv is the concentration of virus particles in the air (virions/m3).
When equations 1, 4 and 7 are combined, we obtain an expression, which enables the probability, P, of the individual acquiring an infection to be computed.
Prentiss et al [65] found that it takes an average of 600 virions to cause a Covid-19 infection, which equates to Pinf = 0.0017. So if we assume this value of Pinf and a pulmonary ventilation rate of 8 L/min (0.48 m3/h), then an adult, spending two hours breathing in air with a viral concentration of 10 virions/m3, would inhale on average 9.6 virus particles. This equates to a predicted probability of 0.0159 (i.e., 1.6%) of acquiring a Covid-19 infection, which is equivalent to inhaling a fractional infectious dose, λ, of 0.016 quanta.
What this effectively means is that for any given individual a large number of virus particles generally needs to be inhaled in order for an infection to occur. This is because many of the inhaled virions will have become degraded in the air [56,58] and will therefore not be fit enough to evade the hosts immune defences and cause an infection. Consequently, it is thought that most Covid-19 infections are initiated by very few virus particles that manage to get past the host's defences [67,68]. Evidence supporting this assertion comes from genomic studies which show for influenza [69] and SARS-CoV-2 [67,68], that tight transmission bottlenecks naturally occur in the infection process. These bottlenecks drastically reduce the size and genetic diversity of the viral population, which in turn affects how many new mutations occur as the virus spreads in the host population [68]. If the bottleneck is tight, then few mutations will occur, whereas if it is looser more genetic diversity will be exhibited. The comparative lack of genetic diversity associated with SARS-CoV-2 indicates that with Covid-19 the bottleneck is very tight [67,68]. This suggests that in most cases the number of virus particles that actually initiate a Covid-19 infection is very few, with the transmission bottleneck size estimated to be about one to eight viruses [67]. As such, this finding supports the assumption above that for most Covid-19 transmission events the value of Pinf is likely to be very small.
Concerning the viral dose inhaled, it does not matter whether the risk is near or far-field. In theory, an infectious dose can be acquired by inhaling either a high concentration of virions over a short period, or a lower concentration for a long period of time. In the case of near-field exposure, as illustrated in Figure 1, it is not difficult to see how a susceptible person located in the exhaled aerosol plume from an infector could easily inhale an infectious dose within a relatively short period of time. However, in the far-field, out of range of the exhalation plume, susceptible individuals may still be at risk if they spend long periods of time in the same space as the infector, even though the concentration of infectious viral particles in the air is much lower than in the aerosol plume. This is because of two effects: (i) the longer the susceptible person stays in the room space the greater the number of infectious particles they will inhale; and (ii) the longer the infector stays in the room space the higher the overall concentration of infectious particles will be in the room air. As such, this highlights the need to ventilate room spaces in order reduce the build-up of contaminants in room air.
2.2. Infection Risk
One of the big unknown factors in SARS-CoV-2 transmission is the amount of viral RNA that must be inhaled in order to acquire an infection. To establish an infection, the spike proteins on the SARS-CoV-2 virus must engage with ACE2 receptors on the host's epithelial cells, which facilitates entry of the virus into the cells [70]. Once inside, the virus must be fit enough to replicate and evade the hosts immune defences. However, many virus particles that are inhaled will: (i) miss the target receptors; (ii) be damaged and not capable of replication; or (iii) be overwhelmed by the host's immune defences. So, only a select few will actually go on to cause an infection [67,68]. Typically with viral infections, the inoculation dose, ninoc, has to be large, perhaps several thousand virions, in order to produce the low number of virus particles that actively infect an individual [61]. SARS-CoV-2 has been shown to degrade in the air [7,56,58]. So while SARS-CoV-2 RNA can be recovered in large quantities from room air [45,46,47,48,49,50,51,52,53,54], it is likely that most of this genetic material is incapable of causing an infection; something confirmed by Birgand et al. [52] who found that only 9% of viral cultures were viable.
Notwithstanding the uncertainty associated with the infectious dose required to initiate a Covid-19 infection, it is possible to use Equation 8 to assess relative risk due to exposed to SARS-CoV-2 in the air. The interaction between the viral concentration in the air and duration of exposure is illustrated in Figure 3, which shows the risk of acquiring a Covid-19 for a person with a pulmonary ventilation rate of 8 L/min, exposed to various concentrations (ranging 0 to 1000 RNA/m3) for 15, 30, 60, 120 and 180 minutes. Here the risk is computed using Equation 8 and data compiled by Prentiss et al. [65], who calculated that the minimum infectious dose for SARS-CoV-2 in humans ranged from 322 to 2012 virions (i.e. the extreme limits), with an average of 600 virions.
From Figure 3 it can be seen that irrespective of the minimum infectious dose required to initiate a Covid-19 infection, the risk of infection increases with both the exposure duration and the concentration inhaled. It can also be seen in all three plots that as the duration of exposure increases, so the probability curve tends to flatten, reflecting the limiting properties of the exponential term in Equation 8. It can also be seen that the risk of acquiring an infection is far from negligible, even when virus concentrations in the air are relatively low. This fact is illustrated in Figure 4, which is a close-up of Figure 3(B) showing the infection risk for the virus concentration range 0 to 60 RNA/m3, which reflects typical average exposure levels. From this it can be seen that the 1% probability threshold (represented by the dashed horizontal line) is exceeded at relatively low concentrations (~15 RNA/m3) when exposure times exceed 60 minutes, whereas for short exposures of 15 minutes, this threshold limit increases to (~50 RNA/m3). This suggests that inhalation of a relatively small number of virus particles, in the region ~10 (i.e., the amount inhaled in 60 minutes with a concentration of 20 RNA/m3) is enough for 1% of a population to become infected. As such, this concurs with the findings of Killingley et al. [71] who found that a low inoculum dose of 10 TCID50 was enough to infect 53% of a cohort of healthy young adults, many orders of magnitude lower than the TCID50 dose required for influenza [71]. Collectively, this highlights the highly infectious nature of SARS-CoV-2 and the need to minimise exposure risk.
2.3. Well-Riley Model
Although it is possible to use Equation 8 to calculate how many viral particles a subject is likely to hale, in any give situation we do not know the actual concentration of respiratory aerosols in the air, or the viral load in those aerosols that are inhaled. For any given Covid-19 outbreak, all we know, after the fact, is how many individuals were in the space and for how long, together with how many were infected. However, if we make some assumptions about the room ventilation rate, the average pulmonary ventilation rate, and the mixing of the room air, we can use the Wells-Riley equation [72,73] to estimate, after the fact, the average infectious dose inhaled.
In the Wells-Riley model the λ term in Equation 4 is replaced by, nq, which is the number of quanta of infection inhaled. So, the probability, P, of an individual becoming infected now becomes:
where, the number of quanta inhaled, nq, is equivalent to the fractional infectious dose, λ. So when nq = 1, the probability of an individual becoming infected is 0.632.
The Wells-Riley model also assumes that the room air is completely mixed, and that the quanta production rate (i.e. the rate at which infectious particles are emitted) is constant; together with an assumption that the system is in steady state. Given this, it can be shown that the average number of quanta inhaled, nq, by each susceptible person in a room space is:
where; q is the total quanta production rate of the infectious agent (quanta/s); φ is the average pulmonary ventilation rate of the room occupants (m3/s); t is the exposure time (s), and Q is the room ventilation rate with clean outside air (m3/s).
Combining equations 9 and 10 we obtain a probability equation, which quantifies the steady state far-field infection risk for each susceptible individual in a room space that contains an infector is present.
It should be noted that q in Equation 11 is the total quanta production rate in the room space. As such it represents the total infectious dose introduced by all the infectors who might be present. The value of q is generally assumed to be the product of the number of infectious people present and the average quanta production rate per person.
Equation 11 can be extended and used to compute the likely number of new cross-infection cases that will occur, as follows:
where: Nci is the number of new infection cases due to cross-infection; and Ns is the number of susceptible individuals present.
From Equation 12 it can be seen that when, on average, one quantum of infection is inhaled (i.e. nq = 1) by each and every individual in a room space, 63.2% of the susceptible individuals present will become infected [73].
It is important to note that the quanta generation rate, q, cannot be obtained directly, but rather, must be estimated from the epidemiological data collected for any given outbreak. Indeed, several studies have used the Wells-Riley methodology to estimate quanta production rates associated with reported outbreaks of Covid-19 infection [5,74,75]. For example, Buonanna et al. [34] estimated that for an infectious SARS-CoV-2 individual talking while walking, in excess of 100 quanta/h can be emitted, whereas symptomatic subjects when resting generally exhibit low quanta emission rates (<1 quantum/h). In another study, Burridge et al. [72] estimated that an asymptomatic Covid-positive room occupant, sitting at rest and talking only occasionally, would produce about 1 quanta/h, assuming a median viral load in the sputum of 7 × 10⁶ RNA copies/mL. This however, would rise to approximately 5 quanta/h if noise levels were high, with everyone talking, as might be the case in a call centre or noisy classroom. By contrast, Miller et al [5] investigating the Skagit Valley Chorale super-spreading outbreak [43], in which 53 out of 61 people at a choir rehearsal contracted Covid-19 and two died, estimated that the rate to be in the region 970 quanta/h. As such this highlights the important role that vocalisation and noise levels play in increasing the risk of SARS-CoV-2 transmission indoors.
The Wells-Riley equation (Equation 12) assumes complete room air mixing and applies to far-field transmission under steady-state conditions. From this equation it can be seen that the probability of acquiring an infection by the airborne route increases as: (i) the quanta generation rate increases (e.g. due to singing or shouting, or the presence of multiple infectors); and (ii) susceptible individuals spend longer in the presence of an infector. Conversely, the probability of infection decreases as the volume flow rate of clean outside (ventilation) air increases. Also, it can be seen that the number of new infections is directly proportional to the number of susceptible individuals present. So in order to reduce the risk of Covid-19 being transmitted by the airborne route in any given context, it is important to minimise the number of susceptibles present and the duration of exposure, and maximise the room ventilation rates so that the concentration of infectious particles in the air is reduced [76,77]. With this in mind, a minimum outside air volume flow rate of 10 L/s per person has been recommended for office buildings [78].
3. Outdoor Aerosol Transmission
The SARS-CoV-2 transmission risk is much greater indoors than outdoors, with <10% of infections thought to be contracted outdoors, with the odds of indoor transmission being 18.7 times higher than those outdoors [1]. Anecdotal and published evidence from the many sporting events and public gatherings held outside during the COVID-19 pandemic largely supports the opinion [79]. For example, out of 7324 positive cases in China reviewed by Qian et al [80], only one transmission event occurred outdoors and was the result of a conversation between two individuals. Lakha, Rudge and Holt [81] reviewed an estimated 20471 reported cases across 616 clusters from 28 countries, characterising the settings in which transmission occurred. They found only 461 cases (i.e. 2.3%) in 11 clusters were associated solely with outdoor environments, with a further 628 cases (3.1%) in 34 clusters associated with environments that contained some outdoor elements. Furthermore, the Irish Health Protection Surveillance Centre (HPSC) found that of the 232164 cases of Covid-19 recorded in Ireland up to March 24th 2021, only 262 were due to outdoor transmission, representing 0.1% of the total [82]. Collectively, this supports the belief that risk of SARS-CoV-2 transmission is much lower outdoors than indoors, confirming the findings of Bulfone et al [1].
Notwithstanding the fact that outdoor SARS-CoV-2 transmission is less common than that indoors, it is important to note that cross-infection is still possible outdoors, particularly at high-density outdoor gatherings with low mask use [1]. However, many of the so called ‘outdoor’ events at which transmission has occurred, have been characterised by: significant indoor elements; prolonged exposure or contact; mass gatherings involving shared or communal transport (e.g. large crowds using public transport to attend sporting events); consuming food and drink; and raised voices (e.g. shouting, singing, etc.), all of which can greatly increase that risk of SARS-CoV-2 transmission occurring. For example, the Cheltenham Festival, a major UK horseracing event that attracted >250,000 people over four days in March 2020, fits into this classification. Now, widely acknowledged to be a COVID-19 super-spreader event [83,84], this festival was far from being a purely outdoor event, with the pubs, bars and restaurants of Cheltenham packed all week long with race goers, who travelled to the racecourse daily either in shared cars or on public transport, and who shouted enthusiastically during the races. Consequently, events like this should perhaps not be treated as outdoors in nature because there is a high likelihood that much transmission occurred indoors.
The reasons why SARS-CoV-2 transmission is so much lower outdoors are not fully understood, although evidence suggests that the phenomenon might be linked to differences in airflow patterns between indoors and outdoors [13]. Covid-19 is primarily spread by the airborne route when infectious virus-laden aerosols are inhaled [5,17,18,19,20]. Therefore, the greater the concentration of virus particles in the air, the greater the risk of transmission. Consequently, in confined spaces, when an infectious person is present, the concentration of viral particles in the room air will tend to increase over time, particularly if the space is poorly ventilated, increasing the far-field risk of cross-infection occurring. The concentration of viral particles in room air can be modelled using Equation 13, which assumes complete air mixing, and that the rates at which the virus is introduced and removed from the space are constant.
where; Ct is the concentration of aerosolised viral particles in the room air at time t hours (virions/m3); α is the rate at which virus particles are introduced into the room air (virions/h); θ is a composite decay rate constant representing the rate at which virus particles are removed from the air either by ventilation, biological decay, or gravitational deposition (h-1); and V is the room volume (m3).
In the external environment, where spaces are not confined, the viral build-up that occurs indoors generally does not happen because infectious aerosols are quickly dispersed [85]. Indeed, there is evidence that at higher wind speeds, Covid-19 infection rates are reduced [86,87]. For example, Clouston et al. [86] found that on warmer days when individuals are more likely to gather outside, higher outdoor wind speeds were associated with up to 45% lower risk of SARS-CoV-2 transmission. Consequently, there is generally little or no far-field risk of contracting a SARS-CoV-2 infection outdoors, with near-field cross-infection thought to be the major route by which transmission occurs outside [85]. If this is the case, then it raises a number of important and intriguing questions, which potentially might yield new insights into the transmission of SARS-CoV-2 indoors. For the purposes of this review paper, these questions are formally laid out as follows:
- If far-field transmission is absent outdoors, does this mean that the far-field route is primarily driving the high rates of SARS-CoV-2 transmission observed indoors?
- Or alternatively, is it that far-field transmission plays a lesser role indoors, and that the observed difference in the spread of Covid-19 between the internal and external environments is primarily due to factors that affect the near-field route?
These are important questions that have been largely overlooked and which deserve further consideration. Therefore, in the following sections we will explore the issues raised by these two questions with the aim of gaining a better understanding of the factors that drive aerosol transmission of SARS-CoV-2 indoors.
4. Near-Field Aerosol Transmission
Near-field transmission is highly directional and involves a cone-shaped cloud of aerosols exhaled by an infected individual [17,26,60]. These aerosols are different from larger respiratory droplets (i.e., >100 µm in diameter), which, when exhaled, behave ballistically and fall out of the air within ~1.5 m [17,26]. While these larger droplets can contribute to the spread of infection by contaminating room surfaces (fomites) or impacting on the eyes or mouth, their mass and momentum are such that they cannot be inhaled [17]. Consequently, near-field transmission mainly concerns aerosols produced when respiratory droplets <100 µm rapidly evaporate to become small particles that can readily be inhaled [17,26,88]. Figure 1 shows that susceptible individuals in the path of such aerosol clouds are more likely to inhale air with a higher viral concentration than those located far away from an infector. Furthermore, during near-field exposure, the size of the aerosol particles inhaled is likely to be larger than that in the far-field [89], with aerosols >20 µm easily inhaled [21,60]. This is because at close range these larger aerosols, which generally settle out of the air over a few minutes, are inhaled before gravitational deposition can remove them from the air. By comparison, the chance of inhaling larger aerosols in the far-field is much less because these generally settle out of the air long before they can be inhaled [89]. Indeed, the evidence suggests that in the far-field aerosol particles up to 10 µm pose the greatest risk [89]. Having said this, it should be noted that Coleman et al [33], in a laboratory study involving subjects Covid-19 patients, found that 85% of the viral load was contained in fine respiratory aerosol particles (<5 μm), rather than in course aerosols, defined as ≥5 μm. Similarly, several field studies have observed that SARS-CoV-2 tends to be recovered from small aerosol particles <4 μm [50,53,90].
When not wearing a facemask, the near-field aerosol cloud produced by an infectious person can travel several meters [60], depending on the nature of the exhalation event and the velocity of the ambient air. Indeed, Bourouiba [59] showed that during violent exhalation events such as sneezing, aerosol clouds become turbulent and can travel as much as 7-8 m. As the exhaled aerosol cloud proceeds, it expands as surrounding air is entrained into the jet plume (see Figure 5), giving it a cone-shaped appearance.
Li et al [60] derived a steady state mass balance equation for the exhaled aerosol in a jet zone of length x ( ≤2 m), which can be written as follows:
where; Q0 and C0 are expired airflow rate (L/s) and aerosol concentration (particles/L) at the mouth origin; Q and C are jet airflow rate (L/s) and aerosol concentration (particles/L) at a distance x from the origin; and Cr is the aerosol concentration in room air (particles/L).
Equation 12 can be rearranged to produce:
From this, we can see that the viral concentration at the end of the jet is a function of both the viral concentration exhaled by the infectious person and the viral concentration in the surrounding room air. As such, this implies that indoors, the near-field transmission risk is influenced by the viral load in the air in the rest of the room. So, in well-ventilated spaces where occupants are sedentary and the concentration of viral particles in the room air is relatively low [78], it is likely that the impact on near-field transmission will be minimal. However in poorly ventilated spaces, where viral concentrations can reach >1000 RNA copies/m3 [52], the entrainment of viral particles from the room air into the exhalation jet plume may greatly increase the near-field risk of acquiring a Covid-19 infection. By comparison, outdoors, the concentration of virus particles in the ambient air will be zero, in which case Equation 15 becomes:
Li et al [60] were also able to show that distal to the mouth, the emitted jet conformed to:
where; x is the distance from the mouth origin (mm); and D is the mouth hydraulic diameter (assumed by Li et al to be 20 mm).
Equation 17 shows an inverse linear relationship between x and Q0/Q. When x = 0.5 m, Q0/Q = 0.125, whereas when x = 2 m, Q0/Q = 0.031. From this, we can conclude that the further away from the mouth origin, the more the jet becomes diluted, with the result that viral concentration in the surrounding ambient air becomes more influential. So, regarding near-field risk, one would expect socially distanced individuals (say 2 m apart) to be safer outdoors than indoors, simply because the ambient air contains little or no virus.
In addition to the enhanced dilution effect described above, when outdoors there is likely to be increased air movement, which will tend to disrupt the exhalation jet plume, increase dilution, and disperse the aerosols. Therefore, although near-field SARS-CoV-2 transmission can occur both indoors and outdoors [91], the near-field transmission risk is lower in the outdoor environment. This is because air velocities outdoors are generally much higher (e.g., light air movement: 0.3-1.5 m/s; gentle breeze: 3.4–5.4 m/s) than those indoors (e.g., approximately 0.1 m/s), with the result that the exhaled aerosol particles are more rapidly dispersed outdoors.
The important role that air movement plays in mitigating the transmission of the SARS-CoV-2 virus is highlighted by Clouston et al [86] who found that warmer days with average wind speeds <2.46 m/s (i.e. equivalent to a light breeze on the Beaufort scale) had an increased incidence of Covid-19 cases (aIRR=1.50, 95% C.I.=[1.25-1.81], p<0.001) compared to days with average wind speed ≥2.46 m/s. From this they concluded that outdoor transmission of Covid-19 might be occurring because the risk of transmission in the summer was highest on days when the wind speed was reduced. As such, this highlights the important role that air movement plays in disrupting the near-field transmission of aerosols.
5. Ceilings and Thermal Plumes
Another fundamental difference between internal and external environments is that indoor spaces have ceilings and outdoor spaces generally do not. In terms of fluid dynamics, this simple and often ignored difference has a profound effect on aerosol transport in the two environments. All human beings are surrounded by a personal thermal plume, comprising of upward flowing convective air currents [92]. These are illustrated in Figure 6, which is a Schlieren photograph taken by ourselves, showing the thermal plume emanating from the head and shoulders of a subject during a laboratory experiment. These air currents can exceed velocities of 0.2 m/s [92] and so can easily transport upwards respiratory aerosols up to 50 μm in diameter. While outdoors, these thermal plumes simply cause respiratory aerosols to be dispersed upwards away from susceptible individuals, indoors, any aerosol particles that become entrained into thermal plumes will be trapped by the ceiling of the room, as illustrated in Figure 6. Furthermore, when they reach the top of the room the aerosols tend to fan out along the underside of the ceiling due to the convection current and travel horizontally some distance (see Schlieren video in the Supplementary Material), before descending back towards the floor and travelling through the breathing zone. This interaction between thermal plumes and ceilings is unique to the internal environment and is one of the main drivers of air circulation within room spaces [93].
One of the characteristics of human thermal plumes is that the upward convection currents associated with them start at the floor and travel along the legs. This can cause horizontal air currents to occur at floor level in room spaces, which are capable of transporting the smallest respiratory aerosols, without them settling on the floor. So while larger aerosol particles will tend to settle out on the floor due to gravitational deposition, the finest aerosols will tend to remain airborne. Furthermore, when these fine aerosols reach the thermal plume of another human being, they will become entrained into that plume and travel upwards through the breathing zone of that individual. While the extent to which this phenomenon contributes to Covid-19 transmission indoors is unknown, it is completely absent outdoors and is therefore worthy of further investigation.
In order to illustrate this phenomenon, we performed a computational fluid dynamics (CFD) simulation of two subjects in an unventilated room space (details of the methodology used in the CFD analysis can be found in the Supplementary Material). The results of this analysis are presented in Figure 7, which shows the distribution of 5 μm aerosol particles, at several time stages after a short 5 seconds speech event by the person standing on the right. From this, it can be seen that the aerosols, although initially projected forward from the mouth, quickly rise due to the action of the thermal plume (also shown) and the buoyancy of the warm breath as seen in t=15 s. However, at the ceiling the upward trajectory of the particles is halted at t=25 s, resulting in the formation of a buoyant aerosol bolus containing a high concentration of particles. It proceeds to travel horizontally along the underside of the ceiling at t=45 s, while deforming as a semi-ring due to the action of the thermal plume of the person on the left, and the thermal plume from the speaker’s mouth shifting right towards the main plume from that person. This flow pattern is further amplified at t=55 s, demonstrates the strong combined effect of the ceiling and thermal plumes, resulting in the person on the left being exposed to a significant part of the emitted aerosol just after 45 seconds, despite being 2 m away from the speaker.
6. Incomplete Room Air Mixing
While many analysis techniques assume that the air in room spaces is well mixed, this is often not the case, especially in poorly ventilated spaces. In particular, the action of thermal and exhalation plumes can cause regions of high aerosol concentration to form, as illustrated in Figure 7. High aerosol concentrations can also occur in stagnant regions that are poorly ventilated, especially if eddy currents are present that cause particles to become trapped in a specific location. Furthermore, pressure gradients can cause concentrations to increase downstream of a source, as more and more aerosol particles are introduced in to the air stream. Collectively, this means that occupants may experience different levels of SARS-CoV-2 exposure, while located in the same room space, due to incomplete air mixing, allowing regions of high and low aerosol concentration to coexist at the same time. By contrast, this phenomenon is generally absent outdoors, where respiratory aerosol concentrations are rapidly diluted and dispersed to the atmosphere.
Incomplete room air mixing presents a major challenge when evaluating the infection risk posed to occupants. Traditionally, the Wells-Riley model has been used to assess infection risk. However, this approach assumes that the air within the room is completely mixed and that the quanta production rate is constant - both of which are unlikely to be true, particularly for those close to an infectious individual. Therefore, an alternative approach is required, which accommodates variations in airborne viral concentration over time. Using CFD, it is possible to simulate the transient behaviour of aerosol particles within a room space, and identify regions of high and low concentration, from which it is possible to infer risk as illustrated in Figure 8, which shows the plan of two identical room spaces both divided into 25 equal zones. In Case 1 the room is fully mixed with the result that all the virus particles are equally distributed throughout the space with each zone having a concentration of 50 virions/m3, whereas in Case 2 there is a high concentration zone (100 virions/m3) in the zones surrounding an infectious person, with the rest of the room having a low concentration of 22 virions/m3. Importantly, in this example, both rooms have an average concentration of 50 virions/m3 in the air. Assuming that the minimum infectious dose is 600 virions, that the pulmonary ventilation rate is 8 L/m and that the occupancy period is 60 minutes, it is possible to use Equation 8 to compute the infection risk to individuals in each of the zones. This produces the results shown in Figure 8, from which it can be seen that in Case 1 the probability of infection is uniformly 0.039 (or 3.9%). By comparison however, in Case 2 the probability is 0.077 (7.7%) in the high concentration region, and only 0.017 (1.7%) in the low concentration region. From this we can conclude that treating rooms as if they completely mixed is likely to lead to an underestimation of the infection risk posed to some individuals.
One of the inherent problems when calculating infection risk is the uncertainty surrounding the viral load in exhaled respiratory aerosols and the minimum infectious dose required to initiate an infection. While it is relatively straightforward using CFD to compute the likely number of aerosol particles in a particular location at a point in time, it is much more difficult to determine the viral load in those aerosol particles, let alone estimate whether or not that viral load will cause an infection. As such, it is difficult to calculate the absolute infection risk. However, it is much easier to compute the relative infection risk. Careful consideration of Figure 8 reveals that despite Equation 8 having an exponential term, an approximate linear relationship exists between aerosol concentration and the probability of infection, with a doubling of the virus concentration in the air resulting in an approximate doubling of the infection risk, assuming that exposure times are equal. As such, this makes calculation of the relative risk of infection a rather easy task. Only when exposure times are long and concentration levels are high, does this approximate linear relationship start to break down, as seen in Figure 3.
7. Effect of the Weather on the Survivability and Infectivity of SARS-CoV-2 in Aerosol
Although it is argued here that indoor airborne transmission of SARS-CoV-2 and other respiratory viruses such as influenza and respiratory syncytial virus (RSV) is greatly influenced by fluid dynamic mechanisms, outdoor weather conditions can also have a noticeable effect. It is known that rises in ambient temperature from 10C to 30C and vapour pressure from about 10 mb to 30 mb are highly correlated with a reduction in influenza transmission [94]. At the start of the Covid-19 pandemic, it was also observed that SARS-CoV-2 survived for longer at lower temperatures and humidities (i.e., 10C and 40% relative humidity (RH)) [55]. Furthermore, Beggs and Avital [57] showed a correlation between the survivability of SARS-Cov-2 in aerosols and enthalpy, vapour pressure and specific volume by analysing various literature reports on the pandemic outbreaks during a year in Europe. They argued that, as with influenza, increases in temperature and absolute humidity (AH)/vapour pressure correlate well with shorter survivability of SARS-CoV-2 in aerosols. On the other hand, Gómez-Herrera et al. [95] found that humid-rainy conditions were associated with outbreaks of influenza and RSV in Columbia. However, it is noted that these conditions (AH >22 gr/m3) were much higher than the humidity range of the European weather analysed by Beggs and Avital. However, Gómez-Herrera et al. observed an increase in Covid-19 outbreaks under cold (<14C) and dry (AH >9 gr/m3) weather conditions, thus agreeing with the findings of Beggs and Avital [57].
The apparent contradictory effect of humidity on the virus survivability was addressed by Verheyen & Bouroiba [96] who analysed weather conditions and Covid-19 cases in 126 countries in both northern and southern hemispheres. They argued that since indoor and outdoor AH are statistically the same, AH and saturation vapour density can be used to estimate indoor RH. This methodology found that less SARS-CoV-2 transmission occurred when indoor RH was >40% and <60%, assuming room spaces were at a thermally comfortable temperature. As such, this appears to agree with the findings of Morris et al. [55] who observed a similar U-shaped relationship between the viability of SARS-CoV-2 and RH.
In addition to effects associated with temperature and humidity, Ultraviolet (UV-A and UV-B) radiation from sunlight is thought to impact Covid-19 transmission [9,10,11]. Increased latitude away from the equator has been positively correlated with the worldwide incidence of Covid-19, with significant correlations observed between temperature and incidence and mortality [97]. However, as well as temperature, solar irradiance is strongly correlated with latitude, and therefore it may that solar radiation also plays a mitigating role. UV light is known to damage genetic material in respiratory viruses [98,99], and promote vitamin D production, which is thought to provide some immunological protection [10,100,101]. So there is reason to believe that exposure to sunlight might have a protective effect against Covid-19. However, the epidemiological evidence supporting this hypothesis is mixed. In the early stages of the pandemic, Sfica et al. [9] found evidence for an inverse relationship between the spread of Covid-19 and UV radiation. Balboni et al. [102] analysing the first two waves of the Covid-19 pandemic in Italy, also found some evidence that Covid-19 cases were inversely related to UV radiation levels. However, this correlation was much weaker that with temperature, with a strong mitigating effect against Covid-19 transmission observed when outdoor temperatures exceeded 10C [102]. Furthermore, Burra et al [97] suggested that UV radiation might induce an immunosuppression response, potentially leading to an increase in Covid-19 cases.
While a full discussion of weather-related issues is beyond the scope of this paper, the extent to which the climate influences the fluid transport of aerosols in buildings and other enclosed spaces is relevant. For example, in northern Europe where the climate is cold or cool for much of the year, people tend to spend much time indoors in buildings with the windows shut for comfort and energy-saving reasons [57]. In such circumstances, ventilation rates will tend to be low, generally causing the concentration of respiratory aerosols in room air to increase. By contrast, in hotter countries, people may be more willing to open windows to promote ventilation for comfort reasons. Also, the general behaviour of building occupants may differ from that exhibited in more northerly countries, with individuals spending more time outdoors. In addition, the use of ceiling fans and air conditioning units in warmer countries will strongly influence the fluid dynamics of the air in buildings.
In Europe and North America during the winter months the air becomes cold and dry and this has been shown to increase the viability of SARS-CoV-2 in aerosols [57]. When this cold outside air enters buildings it is warmed and so it temperature rises. However, it still remains dry [57], with its AH largely unchanged [96]. As a result, in colder climates during the winter, exhaled respiratory droplets will experience greater evaporation because the air is so dry [70]. This, in turn, will result in many more smaller aerosol particles being exhaled. As such, climatic conditions can profoundly influence the aerosol size and thus the aerodynamic behaviour of any virus carrying particles in the air, with drier air producing smaller aerosols, which will remain suspended in the air for longer and potentially be inhaled. For example, Lindsley et al. [103] found that a 4 μm particle takes 33 min to settle 1 m in still air, whereas a 1-μm particle takes about 8 hours. Smaller aerosol particles <4 μm are also likely to be deposited deeper in the lungs [104], and this may result in them being more infectious [105]. Interestingly, several studies have found viral RNA to be more concentrated in small respiratory aerosols <~5 μm compared with larger droplets [33,106,107,108,109]. Indeed, Cowling et al. [110] found that virus-carrying aerosol particles <5 μm accounted for approximately half of all influenza transmission events. It may therefore be that when cold dry air conditions predominate outdoors, conditions inside are more conducive to the production of small virus-laden respiratory aerosols and that this contributes to increased airborne transmission of SARS-CoV-2 and other viral infections within buildings during the winter months.
8. Aerosol Age and Virus Viability
While many researchers have recovered SAR-CoV-2 RNA from air inside buildings [45,46,47,48,49,50,51,52,53,54], it is important to remember that recovering genetic material from the air is not the same as being able to culture viruses from the air. This is because the genetic material in the air might not be viable and therefore may not capable of causing an infection. Over time viruses degrade in the environment. They become damaged and less ‘fit’, with the result at some point they are incapable of causing an infection. From early on in the Covid-19 pandemic it has been known that the SARS-CoV-2 virus degraded over time in aerosols, with van Doremalen [7] estimating the half-life to be about 1.1 hours. Using the same Goldberg rotating drum methodology as van Doremalen et al., others have observed similar results [74,111]. However, recently these results have been challenged by Haddrell and colleagues [56,58] using an electromagnetic levitation technique. They found that aerosols containing SARS-CoV-2 quickly lost viability over very short periods of time [56,58], with an approximate 50% reduction in viability occurring after just 5 seconds and an approximately 80% reduction after 10 minutes under normal room conditions (i.e., 18-21C and 40% RH) [56]. As such, there is an ongoing debate about how long SARS-CoV-2 can remain viable in room air.
Interestingly, Oswin et al. [56] using the electromagnetic levitation technique found that the loss of infectivity at 90% RH was initially much less than at 40% RH. However after 20 minutes, virus survival was only about 20% of the original value for both RH levels. Similar findings were observed by Haddrell et al. [58]. Haddrell et al. [58] further investigated the effect of humidity on the infectivity of SARS-CoV-2 in aerosols under laboratory conditions for RH values of 40% and 90%, in which they observed that for both RH levels the half-life of the virus greatly increased as the aerosol aged. They argued that at 90% RH, the high pH drives the loss of infectivity, while at 40% RH, high salt in the aerosol delayed loss in the virus infectivity. This work was further expanded to investigate the effect of CO2 on the infectivity of SARS-CoV-2, which found that even moderate increases in the ambient CO2 prolonged the life of the virus increasing the risk of airborne transmission [112]. While the practical implications of these findings required further work, the study appears to suggest that high indoor CO2 levels, air pollution and acidic conditions will all prolong the life of SARS-CoV-2 in room air, increasing the risk of transmission. As such, this suggests that maintaining CO2 levels below 1000 ppm [113] through good ventilation might be more important than many think.
9. Discussion
In the analysis above we have explored the main differences that exist between the indoor and outdoor environments with respect to the transmission of Covid-19. From this, a consistent picture emerges, which although complex helps to explain why the disease mainly spreads indoors. While much remains unknown about the transmission of SARS-CoV-2, our analysis clearly shows that profound differences exist in the fluid dynamic behaviour of the two environments, which likely explains why the vast majority of Covid-19 infections occur within buildings and other confined spaces, rather than outdoors. These differences are summarized in Table 1, from which it can be seen that at multiple levels the behaviour of respiratory aerosols indoors is very different from that outdoors. By contrast, the behaviour of large respiratory droplets >100 μm is broadly similar in both environments, with these generally not able to travel further than about 1.5 m. As such, this reinforces the consensus that Covid-19 is primarily spread by the airborne route via small respiratory aerosols, generally <~20 μm diameter [21,89].
Two issues in particular: the interaction between thermal plumes and ceilings; and the entrainment of room air into exhalation plumes, appear to have been largely overlooked in the literature. Both are not a problem outdoors. Yet indoors, they present a major challenge, because rooms are by definition confined and generally have ceilings. This means that indoors: (i) boluses of respiratory aerosols (high concentration clouds) will tend to form at the ceiling and travel horizontally, before descending through the breathing zone of the room occupants; and (ii) as the concentration of respiratory aerosols builds up in the room space, so the near-field exposure risk associated with exhalation plumes will tend to increase. Both these phenomena mean that the risk of transmission is much greater indoors compared with outdoors. They also highlight the inadequacy of the simplistic ‘near-field’-‘far-field’ analysis framework. In reality, in most indoor environments the near-field and far-field exposure risks are inextricably linked – something that is not the case outdoors. Because exhalation plumes entrain air from the surrounding room space, a feedback loop exists between the far-field and near-field. Similarly, because thermal and exhalation plumes are major drivers of circulation within room spaces, they cause respiratory aerosols to become widely dispersed, with the result that indoors, near-field risks can be projected considerable distances into the far-field. Consequently, profound differences in respiratory aerosol behaviour exist between the indoor and outdoor environments, with no clear boundary separating the near and far-fields, indoors.
In the light of this, the two questions that we postulated in Section 3 appear somewhat simplistic, because of the complex interactions that occur indoors between the near and far-fields. Despite this, it is clear that irrespective of location, the risk of SARS-CoV-2 transmission is essentially governed by two fundamental factors: the duration of exposure; and the concentration of virus in the inhaled air. In the external environment, both these factors are affected, with people spending less time in close proximity to each other, and aerosol concentrations in the outdoor air being much less than those found indoors. This latter point is important because it suggests that far-field transmission plays a key role in the spread of Covid-19 indoors. Inside buildings, because a feedback loop exists between the near and far-fields, it means that the respiratory aerosol concentration inhaled by most people indoors is much greater than that outdoors, irrespective of whether or not they are in close proximity to an infectious person. Hence the concept of rebreathed air postulated by Rudnick and Milton [114]. Consequently, this suggests that far-field transmission makes a substantial contribution to the body of Covid-19 infection that occurs indoors. Furthermore, it reinforces the belief that intervention measures primarily aimed at the far-field, such as improved room ventilation, can substantially reduce indoor SARS-CoV-2 transmission.
There is an ongoing debate regarding the extent to which SARS-CoV-2 can remain viable in the environment. Initial work by van Doremalen, et al. [7], undertaken early in the Covid-19 pandemic, indicated that the virus could remain viable in aerosols for several hours. However, this finding was subsequently challenged by Haddrell and colleagues [56,58] who observed a rapid loss of viability within a few minutes. While it is tempting to think that this would diminish the far-field exposure risk, it is important to realise that this is not necessarily the case, because small aerosols can become widely dispersed within room spaces very quickly. Consider for example the case illustrated in Figure 7, where 5 μm aerosol particles became widely dispersed around a 4.2 × 3.1 × 2.7 m room within 1 minute of a 5 second speech event occurring. Given that people often talk for far longer than 5 seconds, it is not difficult to see how individuals distal to an infector might become infected, even if the virus decay process is rapid. Furthermore, because the initial viral load in exhaled air can be very high, it means that even after 80% decay (which Oswin et al. estimate would occur within 20 minutes [56]) there is still likely to be enough viable SARS-CoV-2 virus present to cause an infection in some individuals. So although viable SARS-CoV-2 virus is not easily cultured from room air [52], this should not be taken as evidence that airborne transmission does not occur, as some have suggested [115], because exposure to high levels of viable virus can occur within a relatively short period of time.
Paradoxically, in well ventilated rooms the viable virus load present in any aerosols that are inhaled is likely to be higher than in comparative spaces that are poorly ventilated, simply because the aerosol residence time is shorter, meaning that less time is available for the virus to degrade. For example, if the ventilation rate is 2 ACH, the mean residence time of the aerosol particles will be 30 minutes, whereas if the rate is increased to 4 ACH, then the average residence time will be only 15 minutes. So although the aerosol concentration will be much lower in a better ventilated space, the virus in any aerosol particles that are inhaled is likely to be younger and therefore more capable of causing an infection. The extent to which this phenomenon influences the transmission of SARS-CoV-2 is however poorly understood, and further research is required to better understand the complex relationship that exist between viral decay, ventilation, and residence/exposure time.
Acquiring an infection is an inherently probabilistic process. In a room space, the viral dose inhaled by any given person will depend on many factors, such as: the duration of exposure; the occupant's behaviour; the viral concentration in the inhaled air; and the viability of the inhaled virus particles, all of which can vary greatly. Furthermore, not everyone exposed to the same infectious dose will acquire an infection, because the immune response can vary greatly between individuals. Therefore when assessing the Covid-19 infection risk, it is important to take a probabilistic approach, which evaluates things in terms of the likelihood of room occupants acquiring an infection, which is exactly what the risk models presented in Section 2 do. These can therefore be used to compute the probability of a person acquiring a SARS-CoV-2 infection given specified values for a set of input parameters.
Epidemiological evidence suggests that SARS-CoV-2 is highly infectious, with on average only 600 virus particles needing to be inhaled in order to establish an infection [65]. If this value is assumed, then exposure to even relatively low virus concentrations can present a substantial risk. For example, from Figure 4 it can be seen that being exposed to a relatively low SARS-CoV-2 concentration of ~15 RNA/m3 for 60 minutes, is enough for 1% of a population to become infected. When one considers just how low this exposure threshold is, it is perhaps not surprising that during the pandemic, Covid-19 spread so fast, especially given that viral loads well in excess of 100 RNA/m3 have often been observed in indoor environments [52]. As such, this highlights the importance of good ventilation in buildings to reduce the overall virus concentration in room air. With respect to this, in is recommended for many spaces that the supply of outside (fresh) air be a minimum 10 L/s per person, which is generally enough to ensure a maximum CO2 concentration of 800-1000ppm [116]. Since the Covid-19 pandemic, CO2 concentration has increasingly been used as a surrogate marker of respiratory aerosol concentration inside buildings [113,117,118,119,120]. Ventilation air introduced from outside dilutes the exhaled CO2 produced by building occupants, and so the CO2 concentration can be used to determine whether of not a space is adequately ventilated. CO2 concentrations that regularly exceed 1500ppm are indicative of a poorly ventilated space; one that likely could benefit from improved ventilation [116].
The role of thermal plumes in the transmission of airborne infection is poorly understood and so there is need for methodologies with which to investigate this phenomenon. Both the experimental flow visualisation techniques employed here (i.e., the Schlieren (Figure 2 and Figure 6) and the CFD (Figure 7)) are valuable tools that can be used to study the effects of thermal plumes and ceilings on the transport of infectious aerosols. They reveal the combined effect of: the thermal plume raising the particles towards the ceiling; the ceiling acting as a pathway for the particles to convect horizontally; and the final descent through the breathing zone of the other occupants, potentially puts many occupants at risk of becoming infected. In addition, the interaction between this phenomenon and the thermal plumes of the other room occupants further affects this pathway of transmission near the ceiling, as can be seen in Figure 7. The absence of a ceiling in the outdoor scenario, obviously removes this transmission pathway. However, even indoors the particles paths can be obstructed and distorted by other effects such as the thermal plumes of heaters (radiators), and the flow streams of air purifiers and room ventilation that have not been considered in Figure 7. Again, experimental flow visualisation and CFD can and should play a significant role in investigating these scenarios, where risk calculations can be embedded within the CFD. At the same time, one should also consider the cost of these techniques and the vast variations that can occur in indoor scenarios. Hence, we strongly recommend the efficient use of these advanced techniques to support the rapid development of reduced order modelling that goes beyond the assumption of well-mixed air, which is the basis of the Wells-Riley model. The scientific community urgently needs robust reduced order models that can capture the complexities of airborne transmission indoors, while still being relatively easy to use.
While CFD can be an extremely useful tool for assessing the risk of acquiring a Covid-19 infection, it does suffer from the inherent drawback that it models the transport of aerosol particles, rather than transmission of the infection itself. Therefore, in order to evaluate the risk posed by virus-laden aerosols it is necessary to perform post-processing using an infection model, such as the Wells-Riley approach. Although the Wells-Riley model is often used for this respect, it is not particularly well suited to this application. This is because it is primarily an after-the-fact epidemiological model designed to establish the quanta production rate when an outbreak occurs. Furthermore, it assumes a steady state, and that the room air is completely mixed and that the quanta production rate is constant. This makes it a rather difficult tool to use with CFD, where the dynamics of aerosol particles are being modelled, rather than the quanta. By comparison however, the approach presented in Section 2.1 is much more amenable for use with CFD, because it is quasi-steady-state and therefore when used numerically can accommodate transient changes in aerosol concentration within the room space. As such, it can be used to identify regions within spaces where the risk of infection is elevated. Also, because the risk of acquiring a SARS-CoV-2 is proportional to the number of aerosol particles that are inhaled, it is not strictly necessary to know the true viral load in the aerosols in order to assess relative risk. Consequently, this approach has many advantages over the Wells-Riley model when used to assess risk.
10. Conclusions
By comparing aerosol behaviour inside and outside buildings, we have been able to show that profound differences exist between the two environments, and that this is likely to be the main reason why SARS-CoV-2 transmission is so much higher indoors than outdoors. In particular, we have identified that a feedback loop exists between the near-field and the far-field inside buildings, which is completely absent outdoors. This feedback loop is facilitated by the action of the exhalation and thermal plumes associated with occupants in room spaces. These plumes drive much of the air circulation within rooms and can rapidly disperse respiratory aerosol particles throughout a space. Although the dynamics of these plumes are complex and not fully understood, it appears that they play a key role in driving the spread of Covid-19 infection indoors.
Funding
The support of the Royal Academy of Engineering under grant T2I\100002 is kindly acknowledged. The support of the UK Health Safety Agency (UKHSA) under grant RCAD-M20099 (Air Cleaning Technologies (ACT): design protocol) is also kindly acknowledged by the UK authors.
Conflicts of Interest
All the authors declare that they have no conflict of interest regard the research work presented in this paper.
References
- Bulfone, T.C.; Malekinejad, M.; Rutherford, G.W.; Razani, N. Outdoor Transmission of SARS-CoV-2 and Other Respiratory Viruses, a Systematic Review. The Journal of infectious diseases 2020. [CrossRef]
- James, A.; Eagle, L.; Phillips, C.; Hedges, D.S.; Bodenhamer, C.; Brown, R.; Wheeler, J.G.; Kirking, H. High COVID-19 Attack Rate Among Attendees at Events at a Church-Arkansas, March 2020. MMWR Morbidity and Mortality Weekly Report 2020, 69(20):632-635. [CrossRef]
- Moore SA, Faulkner G, Rhodes RE, Brussoni M, Chulak-Bozzer T, Ferguson LJ, Mitra R, O'Reilly N, Spence JC, Vanderloo LM: Impact of the COVID-19 virus outbreak on movement and play behaviours of Canadian children and youth: a national survey. International journal of behavioral nutrition and physical activity 2020, 17, 1–11.
- Lesser IA, Nienhuis CP: The impact of COVID-19 on physical activity behavior and well-being of Canadians. International journal of environmental research and public health 2020, 17, 3899. [CrossRef]
- Miller SL, Nazaroff WW, Jimenez JL, Boerstra A, Buonanno G, Dancer SJ, Kurnitski J, Marr LC, Morawska L, Noakes C: Transmission of SARS-CoV-2 by inhalation of respiratory aerosol in the Skagit Valley Chorale superspreading event. Indoor air 2021, 31, 314–323. [CrossRef]
- Jung J, Noh JY, Cheong HJ, Kim WJ, Song JY: Coronavirus disease 2019 outbreak at nightclubs and distribution centers after easing social distancing: vulnerable points of infection. Journal of Korean medical science 2020, 35.
- Van Doremalen N, Bushmaker T, Morris DH, Holbrook MG, Gamble A, Williamson BN, Tamin A, Harcourt JL, Thornburg NJ, Gerber SI: Aerosol and surface stability of SARS-CoV-2 as compared with SARS-CoV-1. New England journal of medicine 2020, 382, 1564–1567. [CrossRef]
- Derqui N, Koycheva A, Zhou J, Pillay TD, Crone MA, Hakki S, Fenn J, Kundu R, Varro R, Conibear E: Risk factors and vectors for SARS-CoV-2 household transmission: a prospective, longitudinal cohort study. The Lancet Microbe 2023, 4, e397–e408. [CrossRef] [PubMed]
- Sfica L, Bulai M, Amihaesei V-A, Ion C, Stefan M: Weather conditions (with focus on UV radiation) associated with COVID-19 outbreak and worldwide climate-based prediction for future prevention. Aerosol and Air Quality Research 2020, 20, 1862–1873. [CrossRef]
- Whittemore PB: COVID-19 fatalities, latitude, sunlight, and vitamin D. American journal of infection control 2020, 48, 1042–1044. [CrossRef] [PubMed]
- Merow C, Urban MC: Seasonality and uncertainty in global COVID-19 growth rates. Proceedings of the National Academy of Sciences 2020, 117, 27456–27464. [CrossRef] [PubMed]
- Tang L, Liu M, Ren B, Wu Z, Yu X, Peng C, Tian J: Sunlight ultraviolet radiation dose is negatively correlated with the percent positive of SARS-CoV-2 and four other common human coronaviruses in the US. Science of The Total Environment 2021, 751, 141816. [CrossRef] [PubMed]
- Rowe BR, Canosa A, Drouffe J-M, Mitchell JBA: Simple quantitative assessment of the outdoor versus indoor airborne transmission of viruses and COVID-19. Environmental research 2021, 198, 111189. [CrossRef] [PubMed]
- Cox-Ganser JM, Henneberger PK: Occupations by proximity and indoor/outdoor work: relevance to COVID-19 in all workers and Black/Hispanic workers. American Journal of Preventive Medicine 2021, 60, 621–628. [CrossRef] [PubMed]
- Senatore V, Zarra T, Buonerba A, Choo K-H, Hasan SW, Korshin G, Li C-W, Ksibi M, Belgiorno V, Naddeo V: Indoor versus outdoor transmission of SARS-COV-2: environmental factors in virus spread and underestimated sources of risk. Euro-Mediterranean journal for environmental integration 2021, 6, 1–9.
- Ninya N, Vallecillos L, Marce RM, Borrull F: Evaluation of air quality in indoor and outdoor environments: Impact of anti-COVID-19 measures. Science of the Total Environment 2022, 836, 155611. [CrossRef]
- Wang CC, Prather KA, Sznitman J, Jimenez JL, Lakdawala SS, Tufekci Z, Marr LC: Airborne transmission of respiratory viruses. Science 2021, 373, eabd9149. [CrossRef]
- Tang JW, Marr LC, Li Y, Dancer SJ: Covid-19 has redefined airborne transmission. BMJ 2021, 373(n913). [CrossRef]
- Zhang R, Li Y, Zhang AL, Wang Y, Molina MJ: Identifying airborne transmission as the dominant route for the spread of COVID-19. Proceedings of the National Academy of Sciences 2020, 117, 14857–14863. [CrossRef]
- Stadnytskyi V, Bax CE, Bax A, Anfinrud P: The airborne lifetime of small speech droplets and their potential importance in SARS-CoV-2 transmission. Proceedings of the National Academy of Sciences 2020, 117, 11875–11877. [CrossRef]
- Basu S: Computational characterization of inhaled droplet transport to the nasopharynx. Scientific Reports 2021, 11, 1–13.
- Mishra B, Mohapatra SC: Nasal ACE 2 receptors' the gateway to COVID 19? J Community Health Manag 2020, 7, 68–69. [CrossRef]
- Gandhi M, Yokoe DS, Havlir DV: Asymptomatic transmission, the Achilles-heel of current strategies to control COVID-19. In.: Mass Medical Soc; 2020.
- Hu Z, Song C, Xu C, Jin G, Chen Y, Xu X, Ma H, Chen W, Lin Y, Zheng Y: Clinical characteristics of 24 asymptomatic infections with COVID-19 screened among close contacts in Nanjing, China. Science China Life Sciences 2020, 1–6.
- Bake B, Larsson P, Ljungkvist G, Ljungstrom E, Olin AC: Exhaled particles and small airways. Respiratory research 2019, 20, 8. [CrossRef]
- Wei J, Li Y: Enhanced spread of expiratory droplets by turbulence in a cough jet. Building and Environment 2015, 93, 86–96. [CrossRef]
- Prather KA, Marr LC, Schooley RT, McDiarmid MA, Wilson ME, Milton DK: Airborne transmission of SARS-CoV-2. Science 2020, 370, 303–304. [CrossRef]
- Tang JW, Bahnfleth WP, Bluyssen PM, Buonanno G, Jimenez JL, Kurnitski J, Li Y, Miller S, Sekhar C, Morawska L: Dismantling myths on the airborne transmission of severe acute respiratory syndrome coronavirus (SARS-CoV-2). Journal of Hospital Infection 2021.
- Beggs CB: Is there an airborne component to the transmission of COVID-19?: a quantitative analysis study. medRxiv 2020.
- Alsved M, Matamis A, Bohlin R, Richter M, Bengtsson PE, Fraenkel CJ, Medstrand P, Londahl J: Exhaled respiratory particles during singing and talking. Aerosol Science and Technology 2020, 54, 1245–1248. [CrossRef]
- Asadi S, Wexler AS, Cappa CD, Barreda S, Bouvier NM, Ristenpart WD: Aerosol emission and superemission during human speech increase with voice loudness. Scientific Reports 2019, 9, 1–10.
- Gregson FKA, Watson NA, Orton CM, Haddrell AE, McCarthy LP, Finnie TJR, Gent N, Donaldson GC, Shah PL, Calder JD: Comparing the Respirable Aerosol Concentrations and 1 Particle Size Distributions Generated by Singing, 2 Speaking and Breathing. ChemRxiv. ChemrXiv 2020, 2020, 12789221:v1.
- Coleman KK, Tay DJW, Tan KS, Ong SWX, Than TS, Koh MH, Chin YQ, Nasir H, Mak TM, Chu JJH: Viral load of severe acute respiratory syndrome coronavirus 2 (SARS-CoV-2) in respiratory aerosols emitted by patients with coronavirus disease 2019 (COVID-19) while breathing, talking, and singing. Clinical Infectious Diseases 2022, 74, 1722–1728.
- Buonanno G, Stabile L, Morawska L: Estimation of airborne viral emission: quanta emission rate of SARS-CoV-2 for infection risk assessment. Environment International 2020, 105794.
- Wolfel R, Corman VM, Guggemos W, Seilmaier M, Zange S, Muller MA, Niemeyer D, Jones TC, Vollmar P, Rothe C: Virological assessment of hospitalized patients with COVID-2019. Nature 2020, 1–5.
- Oran DP, Topol EJ: Prevalence of asymptomatic SARS-CoV-2 infection: a narrative review. Annals of internal medicine 2020, 173, 362–367. [CrossRef]
- He J, Guo Y, Mao R, Zhang J: Proportion of asymptomatic coronavirus disease 2019: A systematic review and meta-analysis. Journal of medical virology 2021, 93, 820–830. [CrossRef] [PubMed]
- Gao Z, Xu Y, Sun C, Wang X, Guo Y, Qiu S, Ma K: A systematic review of asymptomatic infections with COVID-19. Journal of Microbiology, Immunology and Infection 2021, 54, 12–16. [CrossRef] [PubMed]
- Kleiboeker S, Cowden S, Grantham J, Nutt J, Tyler A, Berg A, Altrich M: SARS-CoV-2 Viral load Assessment in Respiratory Samples. Journal of Clinical Virology 2020, 104439.
- Prather KA, Wang CC, Schooley RT: Reducing transmission of SARS-CoV-2. Science 2020.
- Riediker M, Tsai D-H: Estimation of viral aerosol emissions from simulated individuals with asymptomatic to moderate coronavirus disease 2019. JAMA network open 2020, 3, e2013807–e2013807. [CrossRef]
- Bostock B: South Korea is testing 200,000 members of a doomsday church linked to more than 60% of its coronavirus cases. Business Insider 2020.
- Hamner L, Dubbel P, Capron I, Ross A, Jordan A, Lee J, Lynn J, Ball A, Narwal S, Russell S: High SARS-CoV-2 Attack Rate Following Exposure at a Choir Practice-Skagit County, Washington, March 2020. MMWR Morbidity and Mortality Weekly Report 2020, 69, 606. [CrossRef]
- Yusef D, Hayajneh W, Awad S, Momany S, Khassawneh B, Samrah S, Obeidat B, Raffee L, Al-Faouri I, Issa AB: Large Outbreak of Coronavirus Disease among Wedding Attendees, Jordan. Emerg Infect Dis 2020, 26.
- Otter JA, Zhou J, Price JR, Reeves L, Zhu N, Randell P, Sriskandan S, Barclay WS, Holmes AH: SARS-CoV-2 surface and air contamination in an acute healthcare setting during the first and second pandemic waves. Journal of Hospital Infection 2023, 132, 36–45. [CrossRef] [PubMed]
- Moore G, Rickard H, Stevenson D, Aranega-Bou P, Pitman J, Crook A, Davies K, Spencer A, Burton C, Easterbrook L: Detection of SARS-CoV-2 within the healthcare environment: a multi-centre study conducted during the first wave of the COVID-19 outbreak in England. Journal of Hospital Infection 2021, 108, 189–196.
- Santarpia JL, Rivera DN, Herrera VL, Morwitzer MJ, Creager HM, Santarpia GW, Crown KK, Brett-Major DM, Schnaubelt ER, Broadhurst MJ: Aerosol and surface contamination of SARS-CoV-2 observed in quarantine and isolation care. Scientific reports 2020, 10, 1–8.
- Conway Morris A, Sharrocks K, Bousfield R, Kermack L, Maes M, Higginson E, Forrest S, Pereira-Dias J, Cormie C, Old T: The Removal of Airborne Severe Acute Respiratory Syndrome Coronavirus 2 (SARS-CoV-2) and Other Microbial Bioaerosols by Air Filtration on Coronavirus Disease 2019 (COVID-19) Surge Units. Clinical Infectious Diseases 2021.
- Zhou J, Otter JA, Price JR, Cimpeanu C, Meno Garcia D, Kinross J, Boshier PR, Mason S, Bolt F, Holmes AH: Investigating severe acute respiratory syndrome coronavirus 2 (SARS-CoV-2) surface and air contamination in an acute healthcare setting during the peak of the coronavirus disease 2019 (COVID-19) pandemic in London. Clinical Infectious Diseases 2021, 73, e1870–e1877.
- Liu Y, Ning Z, Chen Y, Guo M, Liu Y, Gali NK, Sun L, Duan Y, Cai J, Westerdahl D: Aerodynamic analysis of SARS-CoV-2 in two Wuhan hospitals. Nature 2020, 582, 557–560. [CrossRef]
- Silva PGD, Goncalves J, Lopes AIB, Esteves NA, Bamba GEE, Nascimento MSJ, Branco PTBS, Soares RRG, Sousa SIV, Mesquita JR: Evidence of air and surface contamination with SARS-CoV-2 in a major hospital in Portugal. International Journal of Environmental Research and Public Health 2022, 19, 525. [CrossRef]
- Birgand G, Peiffer-Smadja N, Fournier S, Kerneis S, Lescure F-X, Lucet J-C: Assessment of air contamination by SARS-CoV-2 in hospital settings. JAMA network open 2020, 3, e2033232. [CrossRef]
- Chia PY, Coleman KK, Tan YK, Ong SWX, Gum M, Lau SK, Lim XF, Lim AS, Sutjipto S, Lee PH: Detection of air and surface contamination by SARS-CoV-2 in hospital rooms of infected patients. Nature communications 2020, 11, 2800. [CrossRef]
- Lednicky JA, Lauzardo M, Fan ZH, Jutla A, Tilly TB, Gangwar M, Usmani M, Shankar SN, Mohamed K, Eiguren-Fernandez A: Viable SARS-CoV-2 in the air of a hospital room with COVID-19 patients. International Journal of Infectious Diseases 2020, 100, 476–482. [CrossRef]
- Morris DH, Yinda KC, Gamble A, Rossine FW, Huang Q, Bushmaker T, Fischer RJ, Matson MJ, Van Doremalen N, Vikesland PJ: Mechanistic theory predicts the effects of temperature and humidity on inactivation of SARS-CoV-2 and other enveloped viruses. Elife 2021, 10, e65902. [CrossRef]
- Oswin HP, Haddrell AE, Otero-Fernandez M, Mann JFS, Cogan TA, Hilditch TG, Tian J, Hardy DA, Hill DJ, Finn A: The dynamics of SARS-CoV-2 infectivity with changes in aerosol microenvironment. Proceedings of the National Academy of Sciences 2022, 119, e2200109119. [CrossRef]
- Beggs CB, Avital EJ: A psychrometric model to assess the biological decay of the SARS-CoV-2 virus in aerosols. PeerJ 2021, 9, e11024. [CrossRef]
- Haddrell A, Otero-Fernandez M, Oswin H, Cogan T, Bazire J, Tian J, Alexander R, Mann JFS, Hill D, Finn A: Differences in airborne stability of SARS-CoV-2 variants of concern is impacted by alkalinity of surrogates of respiratory aerosol. Journal of the Royal Society Interface 2023, 20, 20230062. [CrossRef] [PubMed]
- Bourouiba L: Turbulent gas clouds and respiratory pathogen emissions: potential implications for reducing transmission of COVID-19. Jama 2020, 323, 1837–1838.
- Li Y, Cheng P, Jia W: Poor ventilation worsens short-range airborne transmission of respiratory infection. Indoor Air 2022, 32, e12946.
- Zwart MP, Hemerik L, Cory JS, de Visser JAGM, Bianchi FJJA, Van Oers MM, Vlak JM, Hoekstra RF, Van der Werf W: An experimental test of the independent action hypothesis in virus-insect pathosystems. Proceedings of the Royal Society B: Biological Sciences 2009, 276, 2233–2242.
- Lunn TJ, Restif O, Peel AJ, Munster VJ, De Wit E, Sokolow S, Van Doremalen N, Hudson P, McCallum H: Dose-response and transmission: the nexus between reservoir hosts, environment and recipient hosts. Philosophical Transactions of the Royal Society B 2019, 374, 20190016. [CrossRef] [PubMed]
- Aganovic A, Cao G, Kurnitski J, Wargocki P: New dose-response model and SARS-CoV-2 quanta emission rates for calculating the long-range airborne infection risk. Building and Environment 2023, 228, 109924. [CrossRef]
- Olkin I, Gleser LJ, Derman C: Probability Models And Applications (Revised Second Edition): World Scientific; 2019.
- Prentiss M, Chu A, Berggren KK: Finding the infectious dose for COVID-19 by applying an airborne-transmission model to superspreader events. PLoS One 2022, 17, e0265816.
- Gale P: Thermodynamic equilibrium dose-response models for MERS-CoV infection reveal a potential protective role of human lung mucus but not for SARS-CoV-2. Microbial risk analysis 2020, 16, 100140. [CrossRef] [PubMed]
- Lythgoe KA, Hall M, Ferretti L, de Cesare M, MacIntyre-Cockett G, Trebes A, Andersson M, Otecko N, Wise EL, Moore N: SARS-CoV-2 within-host diversity and transmission. Science 2021, 372, eabg0821. [CrossRef] [PubMed]
- Bendall EE, Callear AP, Getz A, Goforth K, Edwards D, Monto AS, Martin ET, Lauring AS: Rapid transmission and tight bottlenecks constrain the evolution of highly transmissible SARS-CoV-2 variants. Nature Communications 2023, 14, 272. [CrossRef] [PubMed]
- McCrone JT, Woods RJ, Martin ET, Malosh RE, Monto AS, Lauring AS: Stochastic processes constrain the within and between host evolution of influenza virus. Elife 2018, 7, e35962. [CrossRef] [PubMed]
- Seminara G, Carli B, Forni G, Fuzzi S, Mazzino A, Rinaldo A: Biological fluid dynamics of airborne COVID-19 infection. Rendiconti Lincei Scienze fisiche e naturali 2020, 1–33.
- Killingley B, Mann AJ, Kalinova M, Boyers A, Goonawardane N, Zhou J, Lindsell K, Hare SS, Brown J, Frise R: Safety, tolerability and viral kinetics during SARS-CoV-2 human challenge in young adults. Nature Medicine 2022, 28, 1031–1041. [CrossRef]
- Burridge HC, Fan S, Jones RL, Noakes CJ, Linden PF: Predictive and retrospective modelling of airborne infection risk using monitored carbon dioxide. Indoor and Built Environment 2022, 31, 1363–1380. [CrossRef]
- Riley EC, Murphy G, Riley RL: Airborne spread of measles in a suburban elementary school. American journal of epidemiology 1978, 107, 421–432. [CrossRef]
- Dabisch P, Schuit M, Herzog A, Beck K, Wood S, Krause M, Miller D, Weaver W, Freeburger D, Hooper I: The Influence of Temperature, Humidity, and Simulated Sunlight on the Infectivity of SARS-CoV-2 in Aerosols. Aerosol Science and Technology 2020(just-accepted):1-15.
- Buonanno G, Morawska L, Stabile L: Quantitative assessment of the risk of airborne transmission of SARS-CoV-2 infection: prospective and retrospective applications. Environment international 2020, 145, 106112. [CrossRef]
- Beggs CB, Noakes CJ, Sleigh PA, Fletcher LA, Siddiqi K: The transmission of tuberculosis in confined spaces: an analytical review of alternative epidemiological models. Int J Tuberc Lung Dis 2003, 7, 1015–1026.
- Beggs CB, Shepherd SJ, Kerr KG: Potential for airborne transmission of infection in the waiting areas of healthcare premises: stochastic analysis using a Monte Carlo model. BMC Infect Dis 2010, 10, 247.
- Burridge HC, Bhagat RK, Stettler MEJ, Kumar P, De Mel I, Demis P, Hart A, Johnson-Llambias Y, King M-F, Klymenko O et al: The ventilation of buildings and other mitigating measures for COVID-19: a focus on wintertime. Proceedings of the Royal Society A 2021, 477, 20200855. [CrossRef]
- Weed M, Foad A: Rapid scoping review of evidence of outdoor transmission of covid-19. medRxiv 2020.
- Qian H, Miao T, Liu L, Zheng X, Luo D, Li Y: Indoor transmission of SARS-CoV-2. Indoor Air 2021, 31, 639–645.
- Lakha F, Rudge JW, Holt H: Rapid synthesis of evidence on settings which have been associated with SARS-CoV-2 transmission clusters. In.; 2020.
- McGreevy R: Outdoor transmission accounts for 0.1% of State's Covid-19 cases. In: The Irish Times. 2021.
- Sassano M, McKee M, Ricciardi W, Boccia S: Transmission of SARS-CoV-2 and other infections at large sports gatherings: a surprising gap in our knowledge. Frontiers in medicine 2020, 7.
- Ibrahim Y: Between soap and science: The pandemic, experts and expendable lives. Social Sciences & Humanities Open 2020, 2, 100080.
- Poydenot F, Abdourahamane I, Caplain E, Der S, Haiech J, Jallon A, Khoutami I, Loucif A, Marinov E, Andreotti B: Risk assessment for long-and short-range airborne transmission of SARS-CoV-2, indoors and outdoors. PNAS nexus 2022, 1, pgac223. [CrossRef] [PubMed]
- Clouston SAP, Morozova O, Meliker JR: A wind speed threshold for increased outdoor transmission of coronavirus: an ecological study. BMC Infectious Diseases 2021, 21, 1–9.
- Ganslmeier M, Furceri D, Ostry JD: The impact of weather on COVID-19 pandemic. Scientific reports 2021, 11, 22027. [CrossRef]
- Xie X, Li Y, Chwang AT, Ho PL, Seto WH: How far droplets can move in indoor environments--revisiting the Wells evaporation-falling curve. Indoor Air 2007, 17, 211–225. [CrossRef]
- Obeid S, White P, Rosati Rowe J, Ilacqua V, Rawat MS, Ferro AR, Ahmadi G: Airborne respiratory aerosol transport and deposition in a two-person office using a novel diffusion-based numerical model Journal of Exposure Science & Environmental Epidemiology 2023:1-20.
- Lednicky JA, Lauzardo M, Alam MM, Elbadry MA, Stephenson CJ, Gibson JC, Morris Jr JG: Isolation of SARS-CoV-2 from the air in a car driven by a COVID patient with mild illness. International Journal of Infectious Diseases 2021, 108, 212–216. [CrossRef]
- Mittal R, Meneveau C, Wu W: A mathematical framework for estimating risk of airborne transmission of COVID-19 with application to face mask use and social distancing. Physics of Fluids 2020, 32, 101903. [CrossRef]
- Craven BA, Settles GS: A Computational and Experimental Investigation of the Human Thermal Plume. Journal of Fluids Engineering 2006, 128, 1251. [CrossRef]
- Bhagat RK, Wykes MSD, Dalziel SB, Linden PF: Effects of ventilation on the indoor spread of COVID-19. Journal of Fluid Mechanics 2020, 903.
- Shaman J, Kohn M: Absolute humidity modulates influenza survival, transmission, and seasonality. Proceedings of the National Academy of Sciences 2009, 106, 3243–3248. [CrossRef]
- Gomez-Herrera S, Gontijo ESJ, Enriquez-Delgado SM, Rosa AH: Distinct weather conditions and human mobility impacts on the SARS-CoV-2 outbreak in Colombia: Application of an artificial neural network approach. International Journal of Hygiene and Environmental Health 2021, 238, 113833. [CrossRef]
- Verheyen CA, Bourouiba L: Associations between indoor relative humidity and global COVID-19 outcomes. Journal of the Royal Society Interface 2022, 19, 20210865. [CrossRef]
- Burra P, Soto-Diaz K, Chalen I, Gonzalez-Ricon RJ, Istanto D, Caetano-Anolles G: Temperature and latitude correlate with SARS-CoV-2 epidemiological variables but not with genomic change worldwide. Evolutionary Bioinformatics 2021, 17, 1176934321989695.
- Beggs CB, Avital EJ: Upper-room ultraviolet air disinfection might help to reduce COVID-19 transmission in buildings: a feasibility study. PeerJ 2020, 8, e10196. [CrossRef]
- Ratnesar-Shumate S, Williams G, Green B, Krause M, Holland B, Wood S, Bohannon J, Boydston J, Freeburger D, Hooper I: Simulated sunlight rapidly inactivates SARS-CoV-2 on surfaces. The Journal of infectious diseases 2020, 222, 214–222. [CrossRef]
- Moriyama M, Hugentobler WJ, Iwasaki A: Seasonality of respiratory viral infections. Annual review of virology 2020, 7.
- Sharun K, Tiwari R, Dhama K: COVID-19 and sunlight: Impact on SARS-CoV-2 transmissibility, morbidity, and mortality. Annals of Medicine and Surgery 2021, 66, 102419.
- Balboni E, Filippini T, Rothman KJ, Costanzini S, Bellino S, Pezzotti P, Brusaferro S, Ferrari F, Orsini N, Teggi S: The influence of meteorological factors on COVID-19 spread in Italy during the first and second wave. Environmental Research 2023, 228, 115796. [CrossRef]
- Lindsley WG, Blachere FM, Davis KA, Pearce TA, Fisher MA, Khakoo R, Davis SM, Rogers ME, Thewlis RE, Posada JA et al: Distribution of airborne influenza virus and respiratory syncytial virus in an urgent care medical clinic. Clin Infect Dis 2010, 50, 693–698.
- Hanes J, Dawson M, Har-el Ye, Suh J, Fiegel J: Gene delivery to the lung. Drugs and the Pharmaceutical Sciences 2004, 134, 489–540.
- Alford RH, Kasel JA, Gerone PJ, Knight V: Human influenza resulting from aerosol inhalation. Proceedings of the Society for Experimental Biology and Medicine 1966, 122, 800–804. [CrossRef]
- Bischoff WE, Swett K, Leng I, Peters TR: Exposure to influenza virus aerosols during routine patient care. J Infect Dis 2013, 207, 1037–1046. [CrossRef]
- Coleman KK, Sigler WV: Airborne Influenza A Virus Exposure in an Elementary School. Scientific Reports 2020, 10, 1–7.
- Lindsley WG, Blachere FM, Thewlis RE, Vishnu A, Davis KA, Cao G, Palmer JE, Clark KE, Fisher MA, Khakoo R et al: Measurements of airborne influenza virus in aerosol particles from human coughs. PLoS One 2010, 5, e15100.
- Yan J, Grantham M, Pantelic J, Bueno de Mesquita PJ, Albert B, Liu F, Ehrman S, Milton DK: Infectious virus in exhaled breath of symptomatic seasonal influenza cases from a college community. Proc Natl Acad Sci U S A 2018, 115, 1081–1086. [CrossRef]
- Cowling BJ, Ip DK, Fang VJ, Suntarattiwong P, Olsen SJ, Levy J, Uyeki TM, Leung GM, Malik Peiris JS, Chotpitayasunondh T et al: Aerosol transmission is an important mode of influenza A virus spread. Nat Commun 2013, 4, 1935. [CrossRef]
- Schuit M, Ratnesar-Shumate S, Yolitz J, Williams G, Weaver W, Green B, Miller D, Krause M, Beck K, Wood S: Airborne SARS-CoV-2 is Rapidly Inactivated by Simulated Sunlight. The Journal of infectious diseases 2020. [CrossRef]
- Haddrell A, Oswin H, Otero-Fernandez M, Robinson J, Cogan T, Alexander R, Mann J, Finn A, Hill D, Davidson A: Ambient Carbon Dioxide Concentration Correlates with SARS-CoV-2 Aerostability and Infection Risk. Research Square 2023.
- Burridge HC, Bontitsopoulos S, Brown C, Carter H, Roberts K, Vouriot C, Weston D, Mon-Williams M, Williams N, Noakes C: Variations in classroom ventilation during the COVID-19 pandemic: Insights from monitoring 36 naturally ventilated classrooms in the UK during 2021. Journal of Building Engineering 2023, 63, 105459.
- Rudnick SN, Milton DK: Risk of indoor airborne infection transmission estimated from carbon dioxide concentration. Indoor Air 2003, 13, 237–245. [CrossRef]
- Heneghan CJ, Spencer EA, Brassey J, Pluddemann A, Onakpoya IJ, Evans DH, Conly JM, Jefferson T: SARS-CoV-2 and the role of airborne transmission: a systematic review (version 3). F1000Research 2022, 10, 232.
- CIBSE: COVID-19: Ventilation (v5). In. London: CIBSE; 2021.
- Bain-Reguis N, Smith A, Martin CH, Currie J: Indoor CO2 and thermal conditions in Twenty Scottish Primary School Classrooms with different Ventilation Systems during the COVID-19 pandemic. Pollutants 2022, 2, 180–204. [CrossRef]
- Lyu X, Luo Z, Shao L, Awbi H, Piano SL: Safe CO2 threshold limits for indoor long-range airborne transmission control of COVID-19. Building and Environment 2023, 234, 109967. [CrossRef] [PubMed]
- Di Gilio A, Palmisani J, Pulimeno M, Cerino F, Cacace M, Miani A, de Gennaro G: CO2 concentration monitoring inside educational buildings as a strategic tool to reduce the risk of Sars-CoV-2 airborne transmission. Environmental research 2021, 202, 111560. [CrossRef] [PubMed]
- Villanueva F, Notario A, Cabanas B, Martin P, Salgado S, Gabriel MF: Assessment of CO2 and aerosol (PM2. 5, PM10, UFP) concentrations during the reopening of schools in the COVID-19 pandemic: the case of a metropolitan area in Central-Southern Spain Environmental Research 2021:111092.
Figure 1.
Inhaled aerosol concentration from cone-shaped near-field aerosol plume. Here, Vs is the inhaled volume and is the mean concentration of the inhaled aerosol.
Figure 1.
Inhaled aerosol concentration from cone-shaped near-field aerosol plume. Here, Vs is the inhaled volume and is the mean concentration of the inhaled aerosol.
Figure 2.
Schlieren photograph of a person talking, showing: (i) the cone-shaped turbulent exhalation jet emanating from the mouth; and (ii) the vertical thermal plume passing over the face and head.
Figure 2.
Schlieren photograph of a person talking, showing: (i) the cone-shaped turbulent exhalation jet emanating from the mouth; and (ii) the vertical thermal plume passing over the face and head.

Figure 3.
Probability of Covid-19 infection for a range of SARS-CoV-2 virus concentrations and exposure times, assuming: (A). 322 virions; (B) 600 virions; and (C) 2012 virions, are required to establish an infection.
Figure 3.
Probability of Covid-19 infection for a range of SARS-CoV-2 virus concentrations and exposure times, assuming: (A). 322 virions; (B) 600 virions; and (C) 2012 virions, are required to establish an infection.
Figure 4.
Probability of Covid-19 infection for the virus concentration range 0-60 RNA/m3 and a range of exposure times, assuming that 600 virions are required to establish an infection. The horizontal dashed line represents the 1% probability risk of infection.
Figure 4.
Probability of Covid-19 infection for the virus concentration range 0-60 RNA/m3 and a range of exposure times, assuming that 600 virions are required to establish an infection. The horizontal dashed line represents the 1% probability risk of infection.
Figure 5.
Near-field exhalation cone showing air entrainment.
Figure 6.
Schlieren photograph showing the thermal plume being trapped by a ceiling.
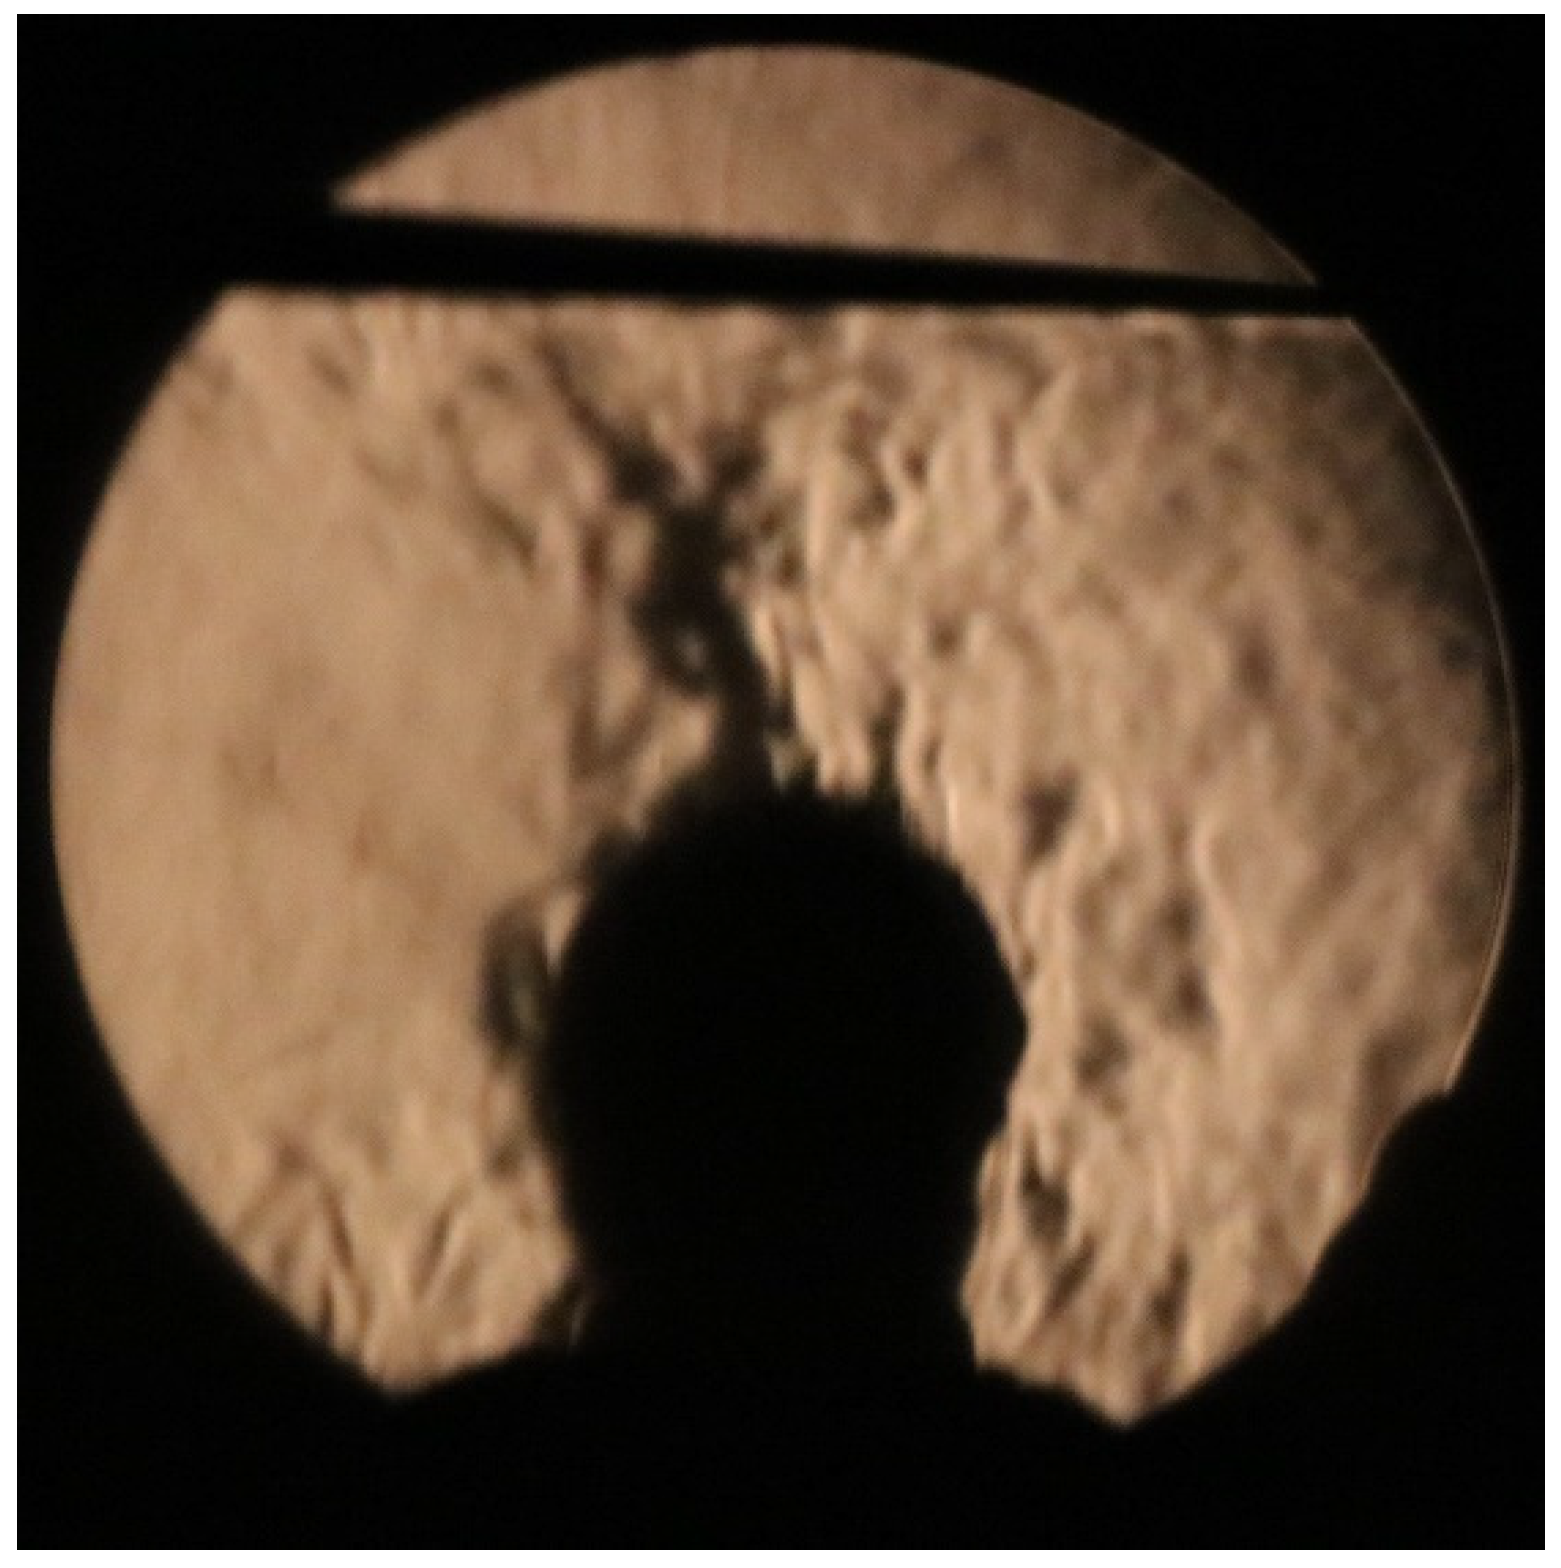
Figure 7.
CFD results that illustrate the impact of thermal plumes on the distribution of 5 μm aerosol particles, after a 5 second speech event between two standing people meeting in a small room with minimal ventilation. The velocity magnitude contours are plotted for the room’s mid-cross section plane in m/s, the time is in seconds, and the particles have been enlarged for clarity. The two people stand at 2 m apart in a room of (4.2, 3.1, 2.7) m, where further details on the CFD setup appear in the Supplementary Material.
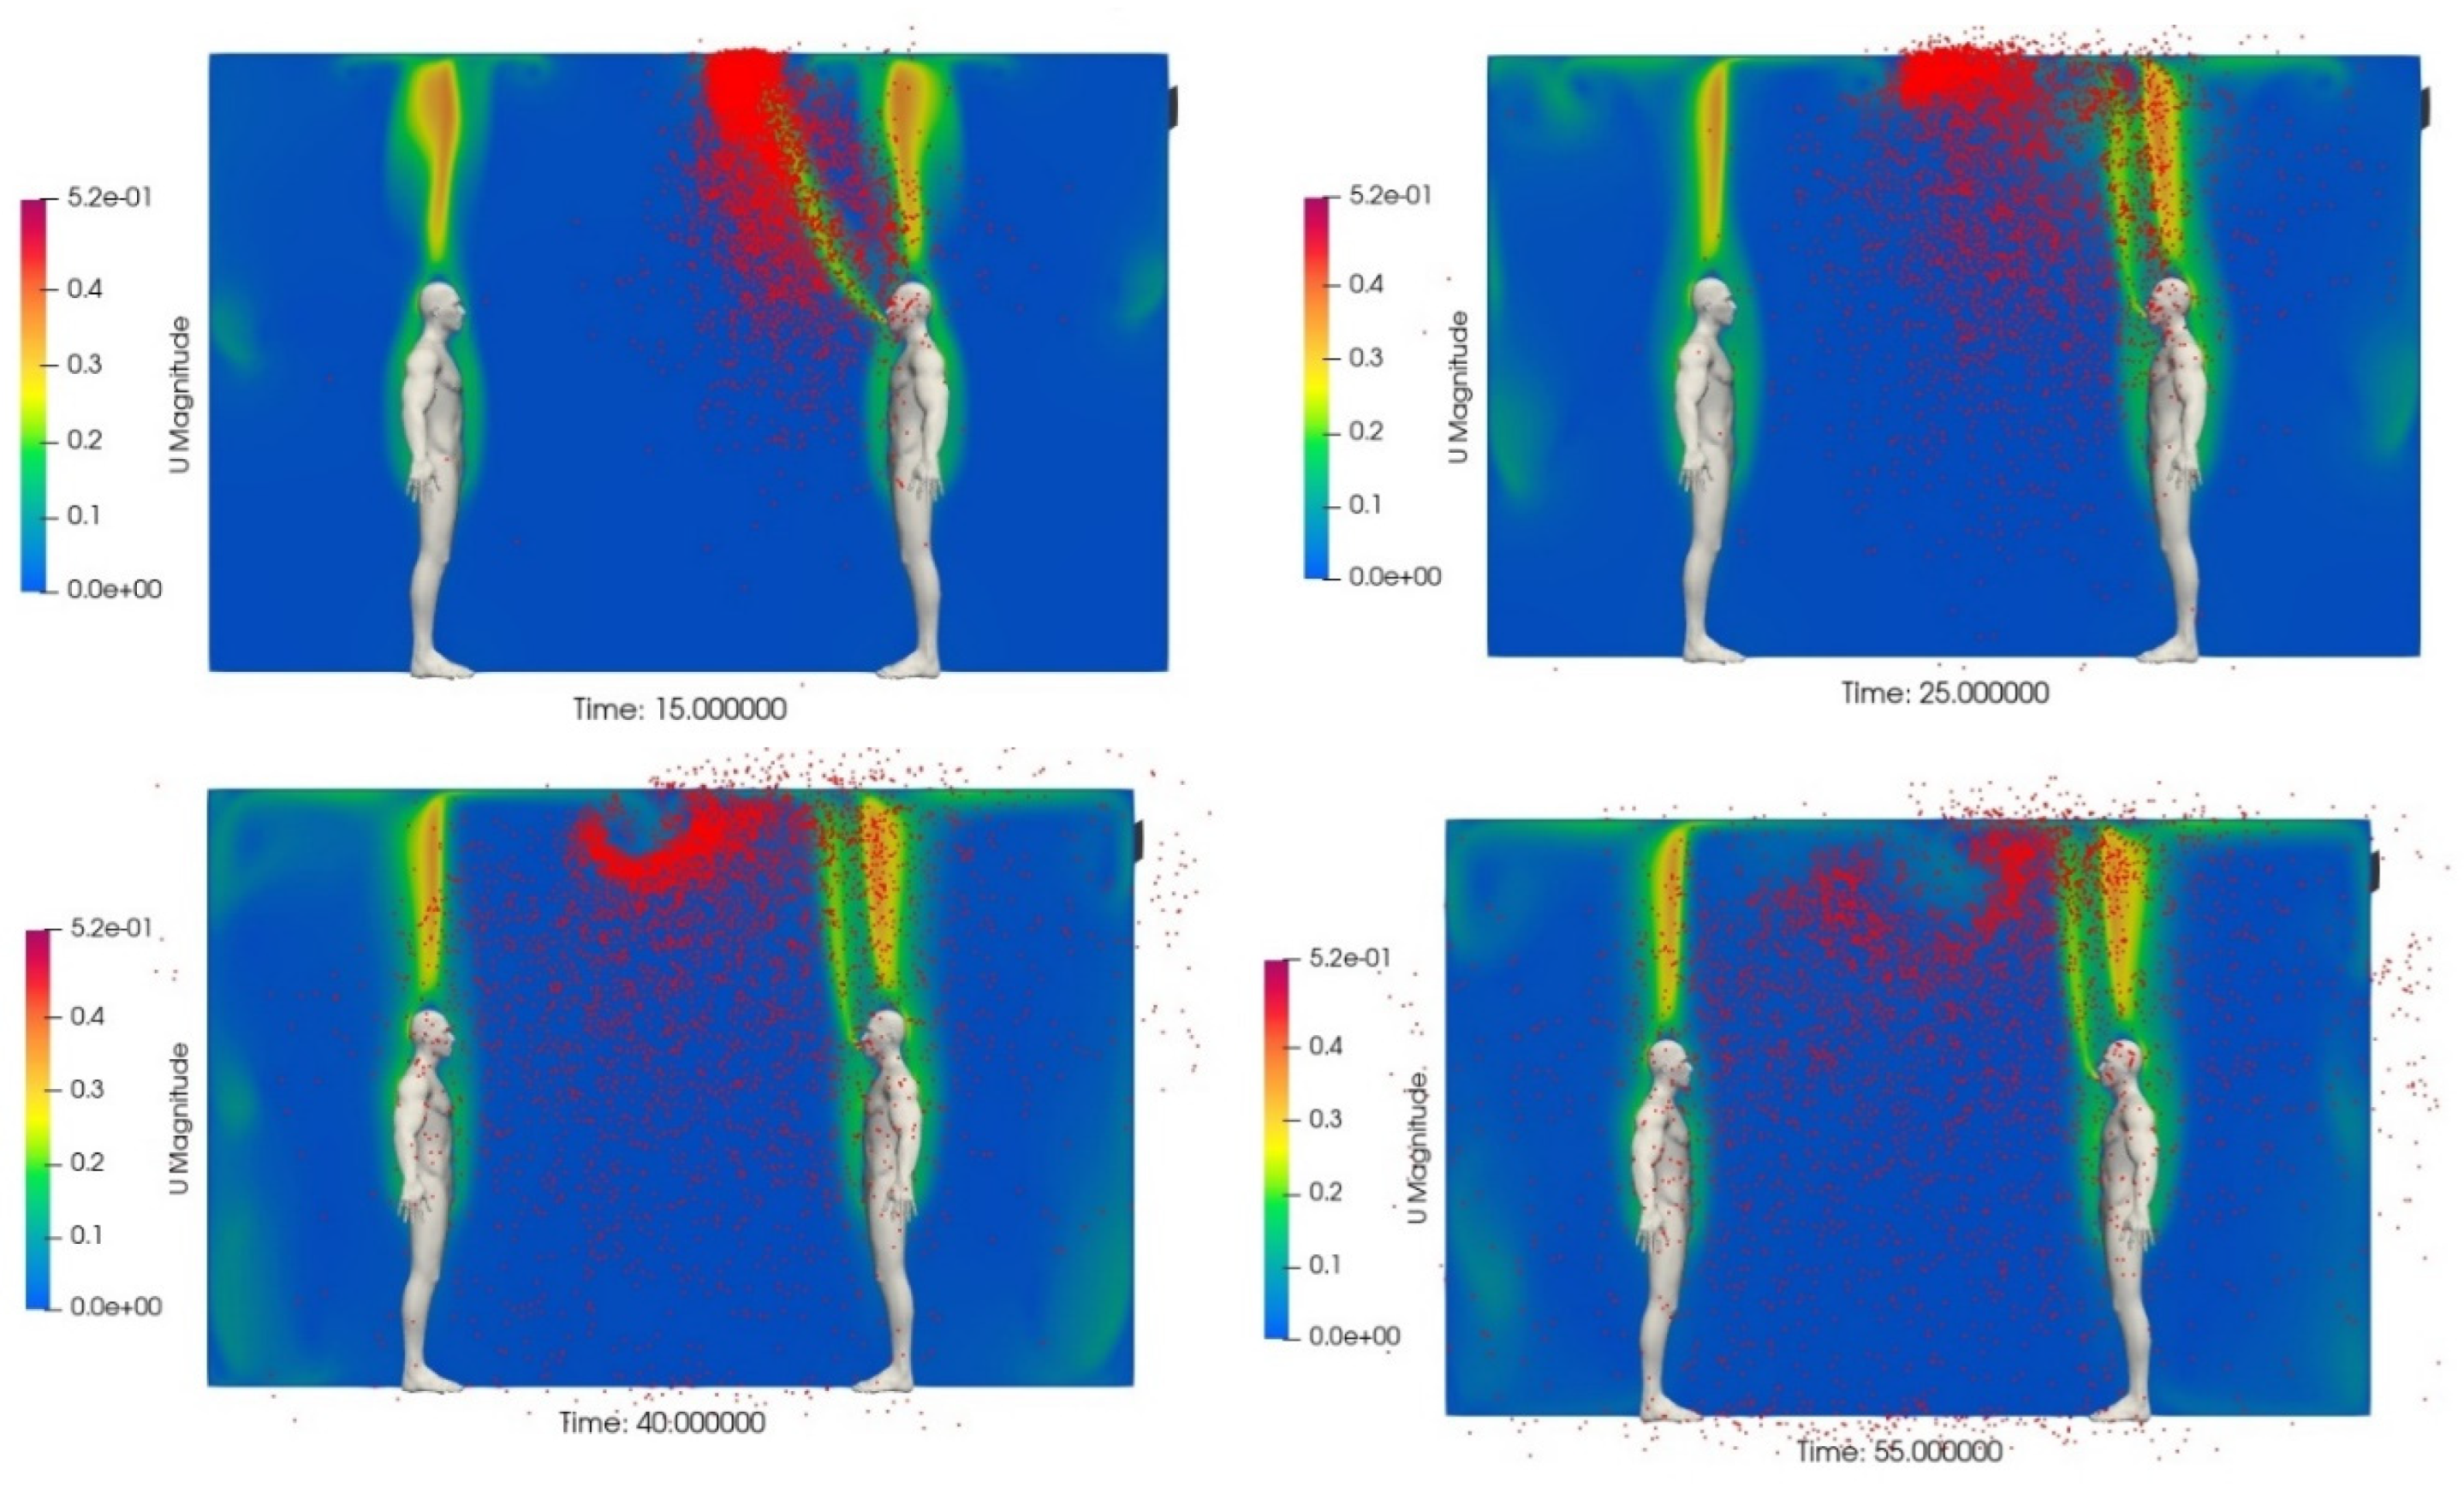
Figure 8.
Two identical rooms, each with an average virus concentration of 50 virions/m3. In Case 1 (top) the room air is uniformly mixed, while in Case 2 (bottom) there is a high concentration zone, having 100 virions/m3, with the rest of the room having a low concentration of 22 virions/m3. Also shown are the inhaled viral load, the number of quanta inhaled (lambda), and the probability of infection.
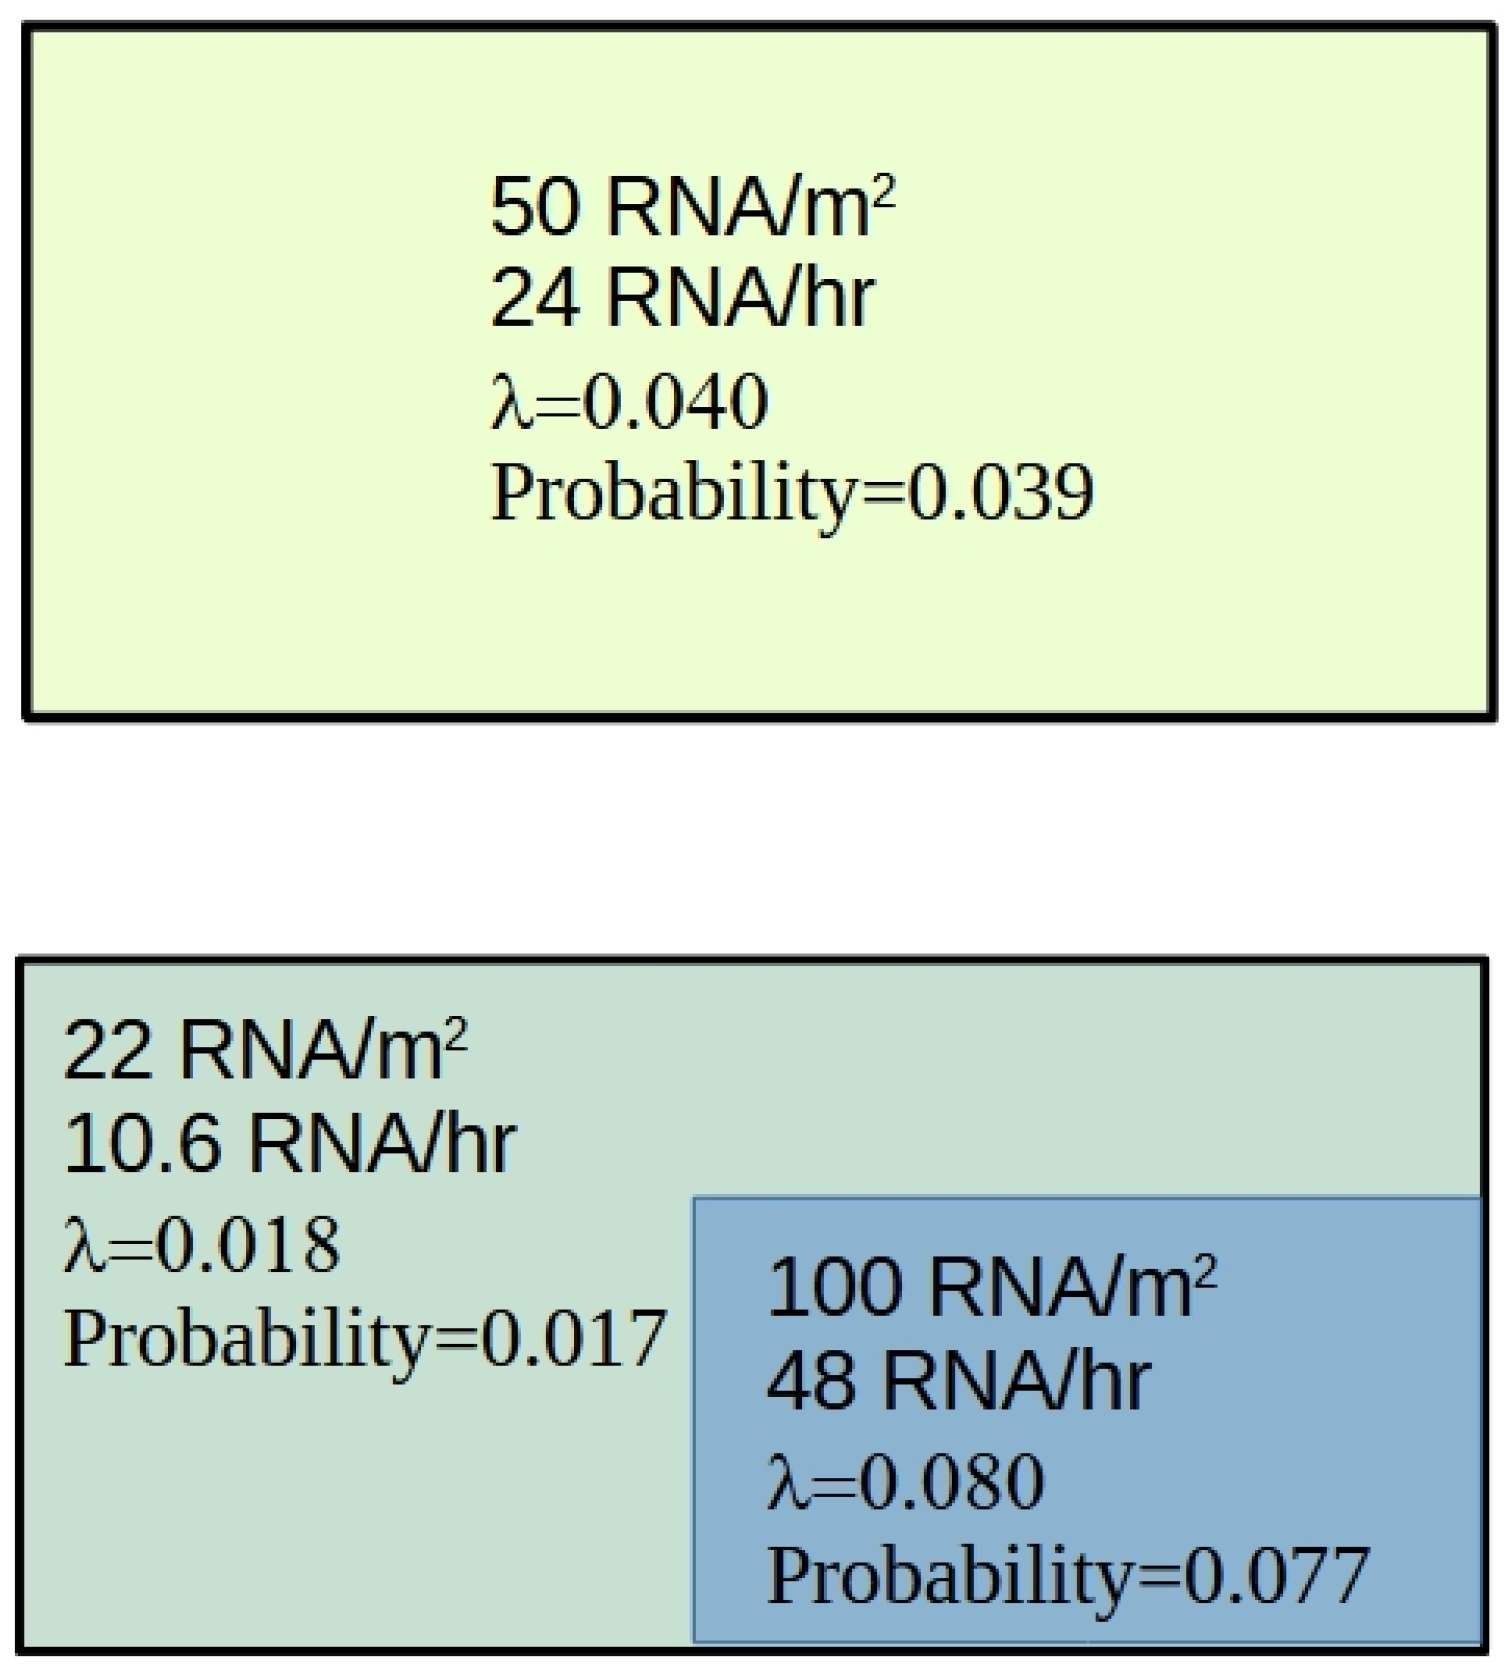

Table 1.
Summary of the different fluid related infection attributes typically associated with indoor and outdoor environments.
Table 1.
Summary of the different fluid related infection attributes typically associated with indoor and outdoor environments.
| Attribute | Outdoors | Indoors |
|---|---|---|
| Aerosol concentration | Space is not confined outdoors and so the respiratory aerosol concentration cannot build up. As a result, the far-field infection risk is non-existent outdoors. | Indoor spaces are confined and so the respiratory aerosol concentration can build up. As a result the far-field infection risk indoors is much greater than that outdoors. |
| Air velocities | Air velocities are generally much higher outdoors than indoors, so exhalation plumes tend to be rapidly dispersed, depending on the wind conditions. | Air velocities indoors are generally low (~0.1 m/s) and so exhalation plumes are not rapidly dispersed, increasing the near-field exposure risk. |
| Air entrainment | Outdoors, exhalation plumes are diluted by clean air and therefore the near-field exposure risk is greatly reduced. | Indoors, contaminated room air is entrained into exhalation plumes, with result that the near-field exposure risk increases as the aerosol concentration builds up in the room space. |
| Thermal plumes | Outdoors, the thermal plumes produced by people transport respiratory aerosols skywards where they are quickly dispersed. | Indoors, the room ceiling traps any respiratory aerosols that are entrained into thermal plumes. This causes a bolus of aerosols to form at the ceiling, which can then be transported (dispersed) around the room increasing the far-field risk of infection. |
| Incomplete mixing | Outdoors, aerosols are rapidly dispersed and so high concentration regions cannot develop. The only exception to this is when a susceptible person is down wind of an infector. In which case they could be exposed to a high concentration of respiratory aerosols. | Due to incomplete air mixing, indoor spaces often contain high and low aerosol concentration regions. Individuals in high-concentration regions have therefore a much greater exposure risk compared with their counterparts in low-concentration regions. |
| Occupancy patterns | Because outdoor spaces are generally not confined, people tend to move around, spending less time in one place. They are also general spaced further apart. | In many indoor contexts, people tend to spend long periods on time grouped together in the same location. Therefore, exposure times are generally much greater indoors compared with outdoors. |
| Droplet transmission | The behaviour of respiratory droplets >100μm is broadly similar in the indoor and outdoor environments. In both environments these large droplets behave ballistically, travelling less than about 1.5 m. | The behaviour of respiratory droplets >100μm is broadly similar in the indoor and outdoor environments. In both environments these large droplets behave ballistically, travelling less than about 1.5 m. |
Disclaimer/Publisher’s Note: The statements, opinions and data contained in all publications are solely those of the individual author(s) and contributor(s) and not of MDPI and/or the editor(s). MDPI and/or the editor(s) disclaim responsibility for any injury to people or property resulting from any ideas, methods, instructions or products referred to in the content. |
© 2024 by the authors. Licensee MDPI, Basel, Switzerland. This article is an open access article distributed under the terms and conditions of the Creative Commons Attribution (CC BY) license (http://creativecommons.org/licenses/by/4.0/).
Copyright: This open access article is published under a Creative Commons CC BY 4.0 license, which permit the free download, distribution, and reuse, provided that the author and preprint are cited in any reuse.


