
Submitted:
09 January 2024
Posted:
10 January 2024
You are already at the latest version
Abstract
Alloy 800H stands as one of the few code qualified materials for fabricating in core and out of core components operating in high temperature reactors (HTRs). Welding is a common practice for assembling these components, however, the election of a suitable filler material is essential to enhance the high-temperature creep resistance of Alloy 800H weldments in high temperature applications. In this study, Inconel 625 and Haynes 230 filler material were used to weld the Alloy 800H plates employing the Gas Tungsten Arc Welding (GTAW) technique. The high temperature tensile, creep rupture property, microstructural stability and evolution of the weldments after high temperature exposure were investigated and compared with Alloy 800H. The results showed that the both weldments exhibited enhanced tensile and creep behavior at 760 oC. The creep rupture time of the weldments with Inconel 625 filler and Haynes 230 filler materials was about two and three time longer than that of Alloy 800H base metal when tested at 80 MPa and 760 oC, respectively. Carbides (MC and M23C6) were commonly observed in the microstructure of both the weld and base metals in the two weldments after high temperature creep tests. However, the Inconel 625 filler weldment displayed detrimental δ and Laves phase in the fusion zone and these precipitates could be potential sites for initiating cracks following prolonged high temperature exposure. The study showed that the weldment with Haynes 230 exhibited better phase stability and creep rupture property than the one with Inconel 625 filler material, suggesting its potential as a candidate filler material for Alloy 800H for further investigation. The finding also emphasizes the critical consideration of microstructural evolutions and phase stability in evaluating high temperature materials and their weldments in high temperature reactor applications.
Keywords:
Alloy 800H
; Inconel 625
; Haynes 230
; creep
; microstructure
1. Introduction
Incoloy 800H (or Alloy 800H, UNS—Unified Numbering System No. N08810) is one of a few code-qualified materials up to 760 °C for fabricating in-core and out-of-core components operating in high temperature reactors, e.g., reactivity control rods and intermediate heat exchanger (IHX). The alloy is an iron-based alloy with its nominal composition of Fe-32.5Ni-21Cr [1]. To improve creep rupture properties, Alloy 800H maintains a carbon content of at least 0.05%. Alloy 800H must undergo solution-annealing at temperature above 1050 °C, such as 1093 °C, to achieve a stable austenitic structure. It is intended for use at temperatures >593 °C [1]. The annealing treatment at temperature above 1050 °C is specified to produce an ASME grain size number of 5 or coarser, i.e., coarser than 65 µm. This alloy is currently approved under ASME Section III, Division 5 for nuclear service up to 760 °C [2]. Effort to extend the ASME allowable stresses of Alloy 800H beyond 800 °C, preferably up to 950 °C and the service lifetime of 60 years will be required. These efforts are based on the concepts of longer life time and higher operation temperature, including off-normal, and accident conditions, for various components in the modern HTGR development [3].
Welding processes are required for assembling components in the application of Alloy 800H. Achieving high reliability in a long-term, high-temperature service environment requires the welds to possess high creep resistance [4]. However, a suitable filler material to improve the high temperature creep resistance of the Alloy 800H weldments is required at the high temperature application. Cross-weld creep testing of most Ni-based Inconel and stainless steel alloys indicates that weld strengths are usually in the range of 50–100% of those in the Ally 800H base material [4,5,6]. Commonly-used filler materials for Alloy 800H welding, such as Inconel 82, 182, 188, and SS 304 alloys, exhibit slightly lower creep rupture stresses than Alloy 800H BM under different creep rupture times ranging from 538 to 760 °C, regardless of exposure time being short or long [5,7,8]. A recent investigation at Idaho National Laboratory, using Inconel 617 filler material, did not demonstrate an improvement in creep rupture properties [9]. In addition, the high content of cobalt of Alloy 617 (10-15 wt. %) makes it unsuitable due to activation of the cobalt under neutron irradiation. Haynes 230, a solid solution strengthened Ni-Cr-W alloy, exhibits enhanced creep rupture strength than Alloy 800H at higher than 475 °C. It also demonstrates better corrosion resistance at elevated temperatures and contained a lower cobalt concentration [10]. Inconel 625 is a Ni-Cr-Mo alloy with additional Nb and it has an excellent combination of corrosion resistance and superior creep resistance at the high temperature over 600 °C [11,12]. In this paper, Inconel 625 and Haynes 230 were selected as candidate filler materials to produce Alloy 800H weldments (WMs) using the Gas Tungsten Arc Welding technique. The high-temperature tensile and creep properties of these weldments were then compared and analyzed. The microstructure before and after the creep test and fracture mode were reported. Creep mechanisms, dislocation structure and precipitates evolution were explicated.
2. Materials and Experiments
2.1. Materials
The Alloy 800H plates, having the dimensions of 508 mm (20″) in length, 152 mm (6″) in width and 19 mm (3/4″) in thickness, were used in this study. The plates were melted and manufactured by VDM Metals, Germany. The material was solution annealed at 1167 oC for 32 mins according to the provided specification from the supplier. The as-received plates have an equiaxial austenitic structure with an average grain size of 121 ± 78 µm, which is within the specification of Alloy 800H (ASME grain size number of 5 or coarser [4]). Inconel 625 and Haynes 230 filler wires have a diameter of 1.6 mm (0.0625″). Table 1 provides the compositions of as-received 800H and the nominal chemical compositions of the two filler materials.
2.2. Welding process and specimen fabrication
Gas tungsten arc welding (GTAW) technique was employed in the welding process. A double-side modified X-type groove profile butt joint was designed for fabricating the Alloy 800H weldments (see Figure 1 (a)). Multiple passes were performed perpendicularly to rolling direction (see Figure 1 (b)). Minimum distortion after the welding process was achieved and no post-weld heat treatment was performed. Bend testing was performed, and all of the bent samples failed outside of fusion zones.
Rod-shape tensile and creep specimens with a dimeter of 0.25 in (6.35 mm) were machined across the weld beam and the pulling direction was aligned along the rolling direction (RD) of the plates. Figure 2 provides the geometry of the specimens. Note that the U-shape section of the weld seam (U-shape notch, as shown in Figure 1 (a)) was positioned in the middle of gauge section of specimens. So the fusion zone width was relatively uniform, having a width of approximately 0.25 inch (6.35 mm) as indicated by the shaded area in Figure 2. The 60o V-shape and 0.030 inch wide grooves at each side of the shoulders are used to insert the extensometer crossheads for creep strain measurements.
2.3. Hardness measurement
Vickers hardness of the welds were measured using a Struers hardness tester. A load of 500 gram force (gf) with a dwell time of 15 seconds were used. After mechanical ground using a series of silicon sand papers, the specimens were finely polished with 0.5 μm diamond suspensions and colloidal silica. Then the polished samples were etched with Marble’s reagent (10 ml H2O + 50 ml HCL + 10 ml CuSO4). The measurement was performed across the weld metal, fusion boundary, heat affected zone and unaffected base metal at every 300 μm distance, and the average value of three measurements in each location was reported.
2.4. High temperature tests
High temperature tensile tests were conducted at 760 oC in a hydraulic MTS testing system (Model 318.25) with a force capacity of 250 kN. A three-zone MTS high-temperature split furnace (Model 653.04B) mounted on the tester was used to heat up the specimens and maintain a constant temperature. Temperature was monitored with three K-type thermocouples in contact with the top, middle and bottom of the specimen’s reduced area section, and the temperature profile remained constant within ±1 °C of the nominal temperature during the test. A strain rate of 1×10⁻⁴ s-1 was used, and the soak time was set to 30 mins at the test temperature before testing. A high temperature self-supporting furnace extensometer (Epsilon Model 3448) was used to measure displacement.
High temperature creep tests were performed at 760 oC in air using creep testers from Applied Test Systems (ATS). Load was applied using the calibrated weights through a counterbalanced lever arm with a ratio of 3:1. A three-zone ATS Series 3210 split tube furnace was mounted on the creep tester to heat up the specimens and maintain a constant temperature. Temperature was monitored with three K-type thermocouples in contact with the top, middle and bottom of the specimen’s reduced area section. The test temperature was controlled within +/-0.5 oC of the target temperature without overshooting. The WinSCC software was used to control and monitor the tests, and collect and export experimental data. The creep specimen was heated up to the target temperature and soaked for one hour before the load was applied for testing. Strain was measured with HEIDENHAIN dual averaging linear displacement encoder connected in a Series 4124 average extensometer frame. The measurement accuracy is ± 0.2 µm. The adjusted length of the reduced area section was used to calculate the creep strain according to ASTM E139 [15]. The specimen was tested until rupture.
2.5. Microstructure examination
As-weld and post-creep test microstructures were characterized. TEM analysis were performed from the different locations of the crept specimen, including fusion zone (FZ) weld metal, heat affected zone (HAZ) adjacent to the fusion boundary, and the base metal (BM) close to the fracture surface in the gauge section in order to analyze the plastic deformation behavior and phase evolutions in each region. In addition, the microstructure of the threaded end section was also analyzed. This section experienced negligible deformation but had the same thermal exposure history with the gage section, and their comparison would help distinguish the creep deformation mechanism from high temperature ageing effect.
The cut slices from the specimens were first mechanically ground to a thickness of 0.2 mm, then the electropolishing was conducted at 17 V DC and -30 °C with an electrolyte composed of 95% methanol and 5% perchloric acid. The electron-transparent foils were examined using the FEI OSIRIS Scanning/TEM (STEM) operated at 200 kV. Nano beam electron diffraction (NBED) technique was used to analyze the crystal structure of precipitates. Local chemical compositions were investigated by ChemiSTEM Energy-dispersive X-ray spectroscopy (EDS) using the Cliff-Lorimer quantification approach implemented within the Brucker ESPRIT software. Fracture surface was examined with Hitachi scanning electron microscopy (SEM).
3. Results
3.1. Hardness
Figure 3 provides the plots of the measured Vickers hardness (HV) across the FZ, HAZ and unaffected base metal of the weldments with the two filler materials. The hardness in the FZ ranged from 170 to 190 HV, significantly higher than that of the base metal, which was approximately 120 HV. From the fusion boundary, the hardness experienced a gradual decrease over a span of approximately 7 mm before reaching the hardness of the unaffected BM. In the machined weldment specimens, as illustrated in Figure 2, the reduced section contained approximately 6.4 mm weld metal, 7 mm HAZ and 1 to 2 mm of unaffected BM materials on each side of FZ. Consequently, the volume fraction distribution within a 25 mm gauge section can be estimated as approximately 26% for FZ, 60% for HAZ, and 14% for unaffected base metal materials. The observed hardness gradients and volume fraction distribution can be attributed to the varying microstructures and phases present in the FZ, HAZ, and base metal, and will affect the tensile and creep performance of the weldment specimens, which will be presented and discussed in the later sections.
3.2. High temperature tensile test
Figure 4 presents the tensile stress-strain curves of the Alloy 800H BM specimen and the weldment specimens with Inconel 625 and Haynes 230 filler materials. The tests were conducted at a strain rate of 1x10⁻⁴ s-1 at 760 oC. Both weldment specimens experienced rupture in the HAZ section of the gauge length during the tensile tests. It is noted that the stress-strain curves of the weldments are considered nominal due to material and property heterogeneity in the gauge section. The results showed that the apparent 0.2% yield stress (YS) of the weldment specimens was higher, but the apparent ductility was lower compared with those of Alloy 800H. The apparent YS of welds reached to 203 MPa and 194 MPa with the Inconel 625 and Haynes 230 filler materials compared to 118 MPa of BM specimen. The higher apparent YS of the weldment specimens was likely due to the higher hardness of FZ and HAZ materials, which consisted of a total volume fraction of approximately 86% in the gauge section. The ultimate tensile strength (UTS) of the weld are similar to the one of BM despite slightly higher, i.e., 224 MPa vs. 236 MPa and 238 MPa between 800H and the WMs with Inconel 625 and Haynes 230 filler materials, respectively. The comparable UTS between the BM and the weldment specimens and the fracture locations in HAZ indicated satisfactory weld qualify in this study.
3.3. High temperature creep test
Figure 5 (a) and (b) provide the creep strains and strain rates at the constant applied load of 80 MPa at 760 oC as a function of creep time in the Alloy 800H BM and the weldment specimens. The onset of tertiary creep was defined by 0.2% strain offset from linear secondary creep (Figure 5 (c)), following the criteria in [16]. Table 2 lists the minimum creep strain rate, creep strain at rupture, time to tertiary stage (Tt) and creep time at rupture (TR). The apparent minimum creep strain rate of the weldment specimens was about one order lower than that of the BM specimen. The time to tertiary stage and the time to rupture of the BM specimen was much shorter than those of the weldment. Furthermore, the apparent creep strain of the weldment specimens at rupture was only about 10%. On the contrast, the creep strain of the 800H BM specimen reached as high as 45%. In the weldment specimens, the ratios between the time to tertiary stage and time to rupture was close to 0.3, and the value of the Alloy 800H BM specimen was only 0.13, indicating that the majority of the creep time was in the tertiary stage in both the BM and the weldment specimens.
Figure 6 provides images of the ruptured BM and weldment specimens after the creep tests. The base metal specimen displayed relatively uniform within gauge section, with slight necking observed near the fracture surface (Figure 6 (a)). Surface cracks were evenly distributed along the gauge section and were perpendicular to the applied loading direction. In both weldment specimens, the FZ and the HAZ adjacent to the fusion boundary experienced relatively uniform deformation, with no surface cracks in these areas. Necking and rupture occurred closed to the unaffected base metal, as shown in Figure 6 (b) and (c). This localized deformation was attributed to the lower hardness of the unaffected base metal compared to the FZ and HAZ, as illustrated in Figure 3. The materials were cut from different locations in the tested weldment specimen, denoted as 1: FZ, 2: HAZ adjacent to the fusion boundary, 3: the base metal region close to rupture surface, and 4: un-deformed region in the thread section. The subsequent sections will present and compare the microstructures of as-received 800H BM and as-welded materials, as well as the post-creep weldment specimens.
3.4. Microstructures
3.4.1. As-received Alloy 800H base metal
The as-received 800H base metal has equiaxial grain structure with a number of annealing twins. Figure 7 (a) provides the optical image taken from the as-received BM. Second-phase particles, mainly Ti-rich Ti(C, N) in the interior of grains and Cr-rich carbides decorating grain boundaries, are distributed in the material. The as-received material contains dislocations dominantly located on (111) planes and some dislocation cross-slips were also observed among the (111) slip planes, as shown in Figure 7 (b).
3.4.2. As-welded microstructure
Figure 8 shows the inverse pole figure map (IPFM) image showing FZ and HAZ (a), and a HAADF (high angle annular dark field) image of the FZ (b) of the Inconel 625 filler material. The image showed that second-phase particles were distributed in the grain interiors and at the grain boundaries of the FZ (Figure 8 (b)). No significant grain growth was observed in the HAZ. The IPFM of the Haynes 230 filler weldment exhibits a similar characteristic, so it is not shown here.
In the FZ of the Inconel 625 filler material, the two main types of SPPs are Nb-, Ti-, and Si-rich MC (face-centered cubic – FCC) and Mo- and Si-rich intermetallic Laves phase (hexagonal close-packed – HCP). For example, in Figure 9 (a), the SPPs at the grain boundary were HCP Laves phase, verified by tilting them to different zone axes. Figure 9 (b) show the NBED (nano beam electron diffraction) pattern taken from the Laves phase at the zone axis of [0001]. The SSP in the grain interior is a MC carbide and Figure 9(c) shows the NBDP from its [111] zone axis. Figure 9(d)-(h) provide the element EDX mapping of the studied region showing the difference of the chemical compositions between the two phases. Additionally, nano-sized MC carbide was also observed within the FZ. Figure 10 provides the HAADF image in (a) and the element EDX mapping (b-f) of the region containing these nano-sized Nb and Ti-rich MC precipitates. These carbides were embedded in a dense dislocation network, as shown in Figure 10 (a). The formation of dislocations likely occurred during the precipitation of MC, potentially contributing to the strengthening of the fusion zone for improved the high temperature properties. When comparing the SPPs in the FZ of the Inconel 625 filler weldment with those in the Haynes 230 filler weldment, it was observed that the majority of the SPPs in the FZ of the Haynes 230 filler weldment are Ti- and Cr- rich (Figure 11 (a-d)) and W-Cr-Mn-Si rich (Figure 11 (e-h)) carbides, and some of them are in nano-size scales (less than 100 nm). This indicates a distinct composition of precipitates in the two different weldments.
Figure 12 shows the microstructure of the as-welded HAZ adjacent to the fusion boundary and it appeared to be quite similar with the one of the as-received material. The only noticeable difference is the presence of a thin film layer of Cr-rich carbides along the grain boundary, as illustrated in Figure 12 (c)). This thin layer is likely a consequence of the thermal cycles during the welding process.
3.4.3. Microstructure after creep rupture
3.4.3.1. FZ of Inconel 625 and Haynes 230 filler specimens (Region 1 in Figure 6)
After the creep deformation and high temperature exposure, a significant amount of rod-shape precipitations appeared in the FZ of the Inconel 625 filler weldment specimen, as shown in Figure 13 (a). The NBED pattern in Figure 13 (b) indicated that it was the orthorhombic delta (δ) phase. The δ phase was enriched in Ni and Nb. Additionally, Ni-, Nb- and Ti-rich Laves particles, Si- and Mo-rich M6C, Cr- and Mn-rich M23C6, and Ti-rich MC carbides were also observed. Figure 13(c-e) provided the NBED patterns of the observed Laves, M23Cr6 and M6C phases and their sizes varied up to 2 μm. In contrast, the MC was smaller (less than 0.2 μm), Figure 13(k).
In the FZ of the Haynes 230 filler material WM specimen, significant amounts of SSPs also observed in the microstructure but no δ and Laves phases were observed. The principal precipitations are carbide phases. Figure 14 shows a HAADF image in (a), NBED patterns in (b -c), and ChemiSTEM element EDX maps in (d-m). It contains Cr-rich M23C6 carbides (Figure 14 (d)), W-, Mo-, Nb-, Si-, Ti- and Al-rich M6C carbide (Figure 14 (d-l)), and Ti(C, N), Figure 14 (e).
3.4.3.2 HAZ adjacent to fusion boundary (Region 2 in Figure 6)
In the HAZ, the Ti(C, N) and Cr- and Mn-rich M23C6 particles continued to precipitate during creep test. Figure 15 provides the TEM bright field (a) and dark field (b-c) images and electron diffraction patterns (d) showing the Ti(C, N) and M23C6 carbides. Figure 15 (d) was the electron diffraction pattern taken close to [112] zone axis of matrix, and the reflections from Ti(C, N) and M23C6. Note that the white arrowed diffraction spots are used to take the dark field images to show FCC Ti(C, N) and FCC M23C6 in Figure 15 (b) and (c). It can be seen that grain boundaries were the preferred locations for both Ti(C, N) and M23C6 carbides. The size of the Ti(C, N) carbides are smaller than the one of M23C6, and they distributed throughout the grain interiors, Figure 15 (b). The precipitated M23C6 tended to distribute adjacent to grain boundary and their amount gradually decreased towards the grain interiors, Figure 15 (c).
3.4.3.3. Base metal close to rupture surface (Region 3 in Figure 6)
Figure 16 provides the TEM bright images taken from the base metal region close to the fracture surface at three different reflections (a) g=(11), (b) g =(11) and g =(111). It can be seen that the dislocation structure in the form of dislocation loops are well aligned with the <110>{111}slip systems. These dislocation loops were produced due to the interaction between dislocation and precipitates via Orowan dislocation-precipitate bypass mechanism [17]. Cross slips were also observed to take place, indicating that screw dislocations move from one slip plane to another {111} planes during creep deformation. The by-passed precipitates in the {111} slip planes were identified as the Ti (C, N) with a size of about 10 nm.
Figure 17 shows the distribution and morphology of M23C6 and Ti (C, N) precipitates in the deformed Alloy 800H base metal section of the weldment specimen. They appeared in the three main manners: 1) M23C6 segregated in the grain boundary and had a size of hundreds of nano-meters, Figure 17(a); 2) M23C6 clustered adjacent to grain boundary and also precipitated along the slip planes or dislocations, and having a size of about 50 nm and containing Moiré fringes. The amount of these M23C6 gradually decreased towards the grain interiors, Figure 17(b); 3) M23C6 cluster consisted of large M23C6 (hundreds of nms in size) and smaller ones (about 50 nm in size and containing Moiré fringes), Figure 17(c). Figure 17(d) provides an enlarged TEM BF image showing small M23C6 (about 50 nm in size) containing Moiré fringes and Oroman dislocation loops with Ti (C, N) precipitates.
3.4.3.4. High-temperature ageing structure in Incoloy 800H (Region 4 in Figure 6)
Figure 18 reveals the microstructure of the un-deformed base metal. Cr-rich M23C6 with Moiré fringes and nano-sized Ti-rich Ti(C, N) carbides were two predominant precipitates. Both tyoes of precipitates tended to precipitate along the pre-existing dislocation within the microstructure. The absence of Orowan dislocation loop surrounding the Ti(C,N) indicated that these carbides precipitated as a result of thermal aging without interaction with dislocation movement. This is in contrast to the observation in the gauge section presented in Figure 16 and Figure 17 (d).
3.4.3.5. Fractography
Figure 19, Figure 20 and Figure 21 provide the SEM micrographs of the fracture surface from the Alloy 800H BM specimens, and the weldment specimens with Inconel 625 and Haynes 230 filler materials. The SEM micrographs revealed obvious surface oxidation on the fracture surface of all specimens due to prolonged exposure in air during the tests. The surface oxidation appeared to be more significant in the weldment specimens compared with the BM specimens. This could be attributed to the longer rupture time, i.e., 1091 hours and 1643 hours with the Inconel 625 and Haynes 230 filler metal specimens as opposed to 467 hours in the BM specimen. The fracture surface of the Alloy 800H BM specimen showed predominantly transgranular facture failure (Figure 19 (a) and (b)) and contained a few secondary cracks, as arrowed in Figure 19 (c). The fracture surface of the weldment specimens displayed a combination of transgranular rupture and intergranular rupture. Arrows in Figure 20 (c) and Figure 21(c) indicated the presence of intergranular cracks on the fracture surface of the weldment specimens.
4. Discussion
4.1. High temperature creep deformation and mechanisms
The Alloy 800H weldments with Inconel 625 filler and Haynes 230 filler materials exhibited a strengthened property in both high temperature tensile and creep behavior. This is mainly because of the higher hardness and apparent YS in the gauge section, where it mainly consisted of FZ and HAZ with a small volume faction of the unaffected base metal. The higher apparent 0.2% YS in the weldment caused a lower ratio of the applied stress to the apparent yield stress, i.e., about 0.40 vs. 0.68, in the weldment specimens compared with the base metal specimen when applying the same stress of 80 MPa in the current study. According to the deformation mechanism maps (DMMs) developed by Beardsley et al. [18], three creep mechanisms were presented: low-temperature power-law, high-temperature power-law, and Coble creep in Alloy 800H with an average grain size of 100 µm, at test temperatures ranging from 750 to 1020 oC and the test stresses ranging from 14.1 to 105 MPa. In this study, high-temperature power-law dislocation creep was likely to be the dominant mechanism in the Alloy 800H base metal (HAZ and unaffected base metal in the gauge section) under the current test conditions (stress and temperature). Moreover, the dislocation bypass on the precipitates by bowing around (Orowan mechanism) or cutting through them (shearing mechanism) was an important contributor to facilitate dislocation slips in addition to the dislocation climb. The physical-based model because of the climb and Orowan mechanisms was widely developed for the prediction of the creep rate and its correlated creep lifetime [19,20,21]. Li et al. [22] developed a high temperature creep model by considering the coexistence of climb, cutting, and Orowan mechanisms during creep processes, and the contribution of these mechanisms were considered to be dependent on the precipitate size and distribution relative to the slip plane. The considerable amounts of Orowan dislocation loops and cross slips in the Alloy 800H base metal material of the weldment specimens had provided a strong evidence of the dislocation power-law creep, and the coexistence of climb, cutting, and Orowan mechanisms in the current test condition.
In the current study, both the base metal and the weldment specimens showed a significantly longer tertiary creep stage than the primary and secondary stages, as shown in Figure 5. Particularly the secondary creep stage is relatively short. It took only 60 hours (13% of total time) in the primary and secondary stages, and 407 hours in the tertiary stage until final rupture in the base metal material. In comparison, the weldment specimen took about 30% of total time to reach the tertiary stage. Tertiary creep is a stage characterized by an increased creep rate due to a high recovery rate. It is often associated with metallurgical changes, including coarsening of precipitate particles and formation of voids, ultimately leading to failure [23]. It is likely that the competitive process between the significantly precipitation and growth of Ti(C, N) and M23C6 played a role in the prolonged tertiary creep stage in the studied 800H and its weldment. On one side, it can increase the creep resistance as obstacles of dislocation movement, on the other side, it also caused the initiation and growth of the voids due to the growth of these precipitates which will promote voids, cavities and cracking especially in the grain boundaries. The later process is aggressively more prevailing than the former one with the increasing creep time, so that the creep strain rate increases gradually in the tertiary stage. According to the Time-Temperature-Transformation (TTT) diagram of Incoloy 800 in [24], carbides continue to precipitate after prolonged exposure at high temperature. It was reported that the fine carbides (Ti and Cr carbides) are precipitated at 550 to 760 oC at regions of high density of dislocations inside the grains after short periods of thermal exposure leading to strengthening of the grains, and at the grain boundaries coarse chromium carbides were produced, leading to chromium depletion in their vicinity so that precipitation free zones (PFZs) caused low strength to result aside of the grain boundaries [24]. In this study, Cr-depletion and PFZs were not observed from this region, however, significant amount of coarse Cr- and Mn-rich M23C6 carbides were present along the grain boundaries, as shown in Figure 17 (a). In the final stage of the tertiary phase, the nucleation of cavities followed by growth and interlinkage along the grain boundary led to final failure [25]. As observed in both base metal and weldment specimens, the cracks developed along a direction perpendicular to the applied load and intergranular cracking was more dominant fracture mode in the weldment specimens due to the prolonged high temperature exposure and extensive carbide precipitates and growth, Figure 19, Figure 20 and Figure 21. Intergranular cracking is considered as the dominant fracture mechanism of high temperature Incoloys [25]. It was reported that creep cavities and intergranular cracks were developed in the perpendicular direction of the stress in Inconel 617, and M23C6 carbides were found to form along the grain boundary and inside of matrix at the temperatures of 649 to 1093 °C [26].
4.2. Precipitate evolution during high temperature creep
The precipitates of the studied materials exhibited a significant evolution and changes after long time exposure of high temperature and stress. Carbides (MC or Ti (C, N), and M23C6, M6C) have been the commonly observed in the microstructure of FZ, HAZ and base metals, with significant changes in their amount and morphology evident across different conditions: as-received, as-welded, and after creep. The thermal exposure and creep load led to a substantial increase in the compositions and morphological variations of carbides.
The study reveals significant changes in the types and compositions of precipitates in the fusion zone (FZ) of weldment specimens after creep tests. In both as-weld and post-creep conditions, the FZ of the Inconel 625 filler weldment exhibited intermetallic Laves phase were present. Laves phase is a hexagonal close packed (hcp) intermetallic compound with an AB2 type structure. The 'A' atoms, such as Fe, Ni, or Cr, and 'B' atoms, including Mo, Nb, or Si, play crucial roles in the formation of Laves phase. [27]. The Laves phase forms in Inconel 625 during solidification such as in welding process, because the carbon content of Inconel 625 is generally sufficiently high to promote the formation of both carbides and intermetallics at the end of solidification [27,28,29]. Laves phase also continue precipitating during the prolonged heat treatment in Inconel 625 according to the TTT diagram [27]. Laves phases are extremely hard and not plastically deformable at room temperature. Therefore, Laves phase has been considered to have a detrimental effect on hardening of a material and encourages the brittleness. In addition, δ phase was observed after the creep deformation in the FZ of Inconel 625 filler WM specimen. The δ phase initiates precipitation after approximately 20 hours of heating within the temperature range of 650-980 oC in Inconel 625 [27]. δ phase is Nb- and Ni- enriched has an acicular morphology which provides a distinctive needle-like or rod shape. The Laves particles are very similar in morphology to the blocky, irregularly shaped MC and M23C6 carbides. Like Laves phase, δ particles formed during creep is also detrimental and reduce the ductility and toughness of the material. They can cause stress concentration and become a favorable location of initiation and propagation of cracks. The solid solution strengthening can be significantly weakened because they could deplete the solute atoms that are contributing in solid solution hardening and therefore reducing the strength of materials, and corrosion resistance can also be reduced as a result of the solid solution depletion [27]. In current study, while the formation of δ and Laves phases in the Inconel 625 filler material potentially introduces brittleness to the fusion zone, the mitigated effect on creep resistance is evident in comparison to the less creep-resistant Incoloy 800H base metal. So the failure occurs in the base metal rather in the fusion zone. In contrast, the weld metal in the fusion zone of Haynes 230 did not exhibit deleterious δ and Laves phases. Principal phases precipitated from solid solution are the same types before and after creep. They are all carbides, i.e., Ti(C, N), Cr-Mn rich M23C6 carbides, and W, Mo, Nb, Si, Ti, and Al rich M6C carbide. The observation that the weldment with Haynes 230 filler material maintained the same types of precipitates before and after creep, particularly carbides, suggests better phase stability compared to the Inconel 625 filler material.
5. Conclusions
In this study, high temperature creep properties of Alloy 800H and its weldments using Inconel 625 and Haynes 230 filler materials were investigated and compared at 760 oC, 80 MPa. The microstructure before and after the creep test and fracture mode were reported. Creep mechanisms, dislocation structure and precipitates evolution were explicated. The following conclusion can be drawn:
- -
- High temperature apparent tensile yield strength and creep resistance of Incoloy 800H welds at 80 MPa and 760 oC were significantly enhanced by adding Inconel 625 and Haynes 230, into the Alloy 800H weldments. Both of the weldments showed longer creep rupture time but lower rupture strain compared with the BM specimen.
- -
- Significant dislocation slip and interaction with precipitates were observed in the microstructure, indicating the high temperature power-law creep mechanism. Dislocation bypassing through the Orowan mechanism accompanying with climb and cutting facilitated dislocation slips during high temperature creep deformation.
- -
- Microstructural characterization revealed extensive precipitation took place after the prolonged creep testing at high temperature. A large number of sub-micron sized carbides (MC and M23C6) were observed in the microstructure of FZ, HAZ adjacent to fusion boundary and base metals under various conditions (as-received, as-welded and creep tested). The varied sizes and locations of the M23C6 and MC carbides suggest a complex microstructural evolution during the creep test.
- -
- The weldment with Inconel 625 filler weldments exhibited detrimental δ and Laves phase in the weld metal after creep test. Although the failure occurred in the base metal rather than in the fusion zone under the current test condition, the presence of these phase could cause potential crack initiation after prolonged high temperature ageing.
- -
- The weldment with Haynes 230 filler material demonstrated superior phase stability and improved creep rupture properties compared to the one with Inconel 625 filler material. This suggests that Haynes 230 could be a promising filler material for further investigations in Alloy 800H application.
In conclusion, microstructural evolutions and phase stability of filler materials and base metals are important aspects in high temperature creep deformation and they should be evaluated and understood when studying the high temperature materials and their weldments in high temperature reactor applications.
Author Contributions
W. Li: Conceptualization, Investigation, Methodology, funding acquisition, Writing – original draft. L. Xiao, L. Walters, and Q. Dong: Methodology, Validation, Writing—review and editing. M. Ienzi, and R. Sloan: Writing - Review & Editing.
Funding
This work was supported by Atomic Energy of Canada Limited’s Federal Nuclear Science & Technology Work Plan.
Conflicts of Interest
The authors declare that they have no known competing financial interests or personal relationships that could have appeared to influence the work reported in this paper.
References
- W. Ren and R. Swindeman, Status of Alloy 800H in Considerations for the Gen IV Nuclear Energy Systems, Journal of Pressure Vessel Technology, Vol 136, October 2014, 054001-1. [CrossRef]
- K. Natersan, A. Purohit and S.W. Tam, Materials Behavior in HTGR Environments, NUREG/CR-6824 ANL-02/37, Argonne National Laboratory, July 2003.
- P. Simon, NGNP High Temperature Materials White Paper. INL/EXT-09-17187, Idaho National Laboratory, 2010.
- ASME Standard, an International Code: 2019 ASME Boiler and Pressure Vessel Code, Section III, Rules for Construction of Nuclear Facility Components, Division 5 High Temperature Reactors, 2019 July 1.
- J.R. Lindgren, B.E. Thurgood, R.H. Ryder and C.C. Li, Mechanical Properties of Welds in Commercial Alloys for High-Temperature Gas-Cooled Reactor Components, Nuclear Technology, 66 (1984)(1) 207-213. [CrossRef]
- W. Ren, T. Totemeier, M. Santella, R. Battiste and D.E. Clark, Status of Testing and Characterization of CMS Alloy 617 and Alloy 230, ORNL/TM-2006-547, August 31, 2006.
- J. W. York and R. L. Flury, Assessment of Candidate Weld Metals for Joining Alloy 800, Sub 4308-2, Oak Ridge National Laboratory, 1976 February.
- D.B. Roach and J. A. Vanecho, Creep Rupture Properties of HK-40 and Alloy 800 Weldments, Corrosion/81, Toronto, Ontario, April 1981, Paper 238.
- R.E. Rupp, T. Leung Sham, An Initial Assessment of the Creep-Rupture Strengths for Weldments with Alloy 800H Base Metal and Alloy 617 Filler Metal, Proceedings of the ASME 2022, Pressure Vessels & Piping Conference (PVP 2022), July 17-22, 2022, Las Vegas, Nevada, USA.
- H.M. Tawancy, D.L. Klarstrom and M.F. Rothman, Development of a New Nickel-Base Superalloy, Journal of Metals, 36 (1984)(9) 58-62. [CrossRef]
- S. Hastuty, P. Zacharias, M. Awwaluddin, P.H. Setiawan, E. Siswanto, B. Santoso, A. Nugroho and A.M. AbdulRani, Considerations of Material Selection for Control Rod Drive Mechanism of Reaktor Daya Eksperimental, Journal of Physics: Conf. Series 1198 (2019) 032010. [CrossRef]
- Kreitcberg, K. Inaekyan, S. Turenne and V. Brailovski, Temperature- and Time-Dependent Mechanical Behavior of Post-Treated IN625 Alloy Processed by Laser Powder Bed Fusion, J. Manuf. Mater. Process. 2019, 3, 75;. [CrossRef]
- https://www.haynesintl.com/alloys/alloy-portfolio_/High-temperature-Alloys/HAYNES-230-ALLOY/nominal-composition.
- https://www.specialmetals.com/documents/technical-bulletins/inconel/inconel-alloy-625.pdf.
- ASTM International. “Standard Test Methods for Conducting Creep, Creep-Rupture, and Stress-Rupture Tests of Metallic Materials.” E139-11 (Reapproved 2018). ASTM International, West Conshohocken, PA (2018).
- M.K. Booker, Analysis of the Creep Strain-Time Behaviour of Alloy 800, ORNL/TM-8449.
- E. Orowan, Zur Kristallplastizität. III, Z. Phys. 89 (9) (1934) 634–659. [CrossRef]
- A.L. Beardsley, C.M. Bishop and M.V. Kral, A Deformation Mechanism Map for Incoloy 800H Optimized Using the Genetic Algorithm, Metal. Mater. Trans. A, 50 (2019) 4098-4110. [CrossRef]
- 19. Z. Bai and Y. Fan, Abnormal strain rate sensitivity driven by a unit dislocation-obstacle interaction in BCC Fe. Phys. Rev. Lett. 120 (2018) 125504. [CrossRef]
- J. Zhao, J. Gong, A. Saboo, D.C. Dunand and G.B. Olson, Dislocation-Based Modeling of Long-Term Creep Behaviors of Grade 91 Steels. Acta Mater. 149 (2018) 19–28. [CrossRef]
- M. Kabir, T.T. Lau, D. Rodney, S. Yip and K.J. Van Vliet, Predicting Dislocation Climb and Creep from Explicit Atomistic Details. Phys. Rev. Lett. 105, (2010) 095501. [CrossRef]
- L. Li, F. Liu, L. Tan, Q. Fang, P.K. Liaw and J. Li, Uncertainty and statistics of dislocation precipitate interactions on creep resistance, Cell Reports Physical Science, Vol 3, Issue 1, January 19, 2022 . [CrossRef]
- W.D. Callister Jr., Materials Science and Engineering-An Introduction, 5th ed, John Wiley&Sons, Inc., 1999.
- K. Spiradek, H.P. Degischer and H. Lahodny, Correlation between Microstructure and the Creep Behaviour at High Temperature of Alloy 800H, CONF-8806156: IAEA Specialists Meeting on High-temperature Metallic Materials for Gas-cooled Reactors, Cracow (Poland), 20-23 June 1988. https://inis.iaea.org/collection/NCLCollectionStore/_Public/21/068/21068264.pdf?r=1&r=1.
- M.E. Kassner and T.S. Hayes, Creep Cavitation in Metals, International Journal of Plasticity, 19 (2003) 1715-1748. [CrossRef]
- C. Jang, D. Lee and D. Kim, Oxidation Behavior of Alloy 617 in Very High Temperature Air and Helium Environments, Int. J. Press. Vessels Piping 85 (2008) 368-377. [CrossRef]
- S. Floreen, G.E. Fuchs and W.J. Yang, The Metallurgy of Alloy 625. https://www.tms.org/superalloys/10.7449/1994/Superalloys_1994_13_37.pdf.
- J.N. DuPont, C.V. Robino and A.R. Marder, Solidification of Nb-Bearing Superalloys: Part II. Pseudo Ternary Solidification Surfaces, Metallurgical and Material Transactions A, 29A (1998) 2797-2806. [CrossRef]
- M. J. Cieslak, T. J. Headley, T. Kollie and A. D. Romig, Solidification of An Alloy 625 Weld Overlay, Met Trans. A, 19A, (1988) 2319-2331.
Figure 1.
Schematic views of groove profile butt joint (all dimensions are in inch).
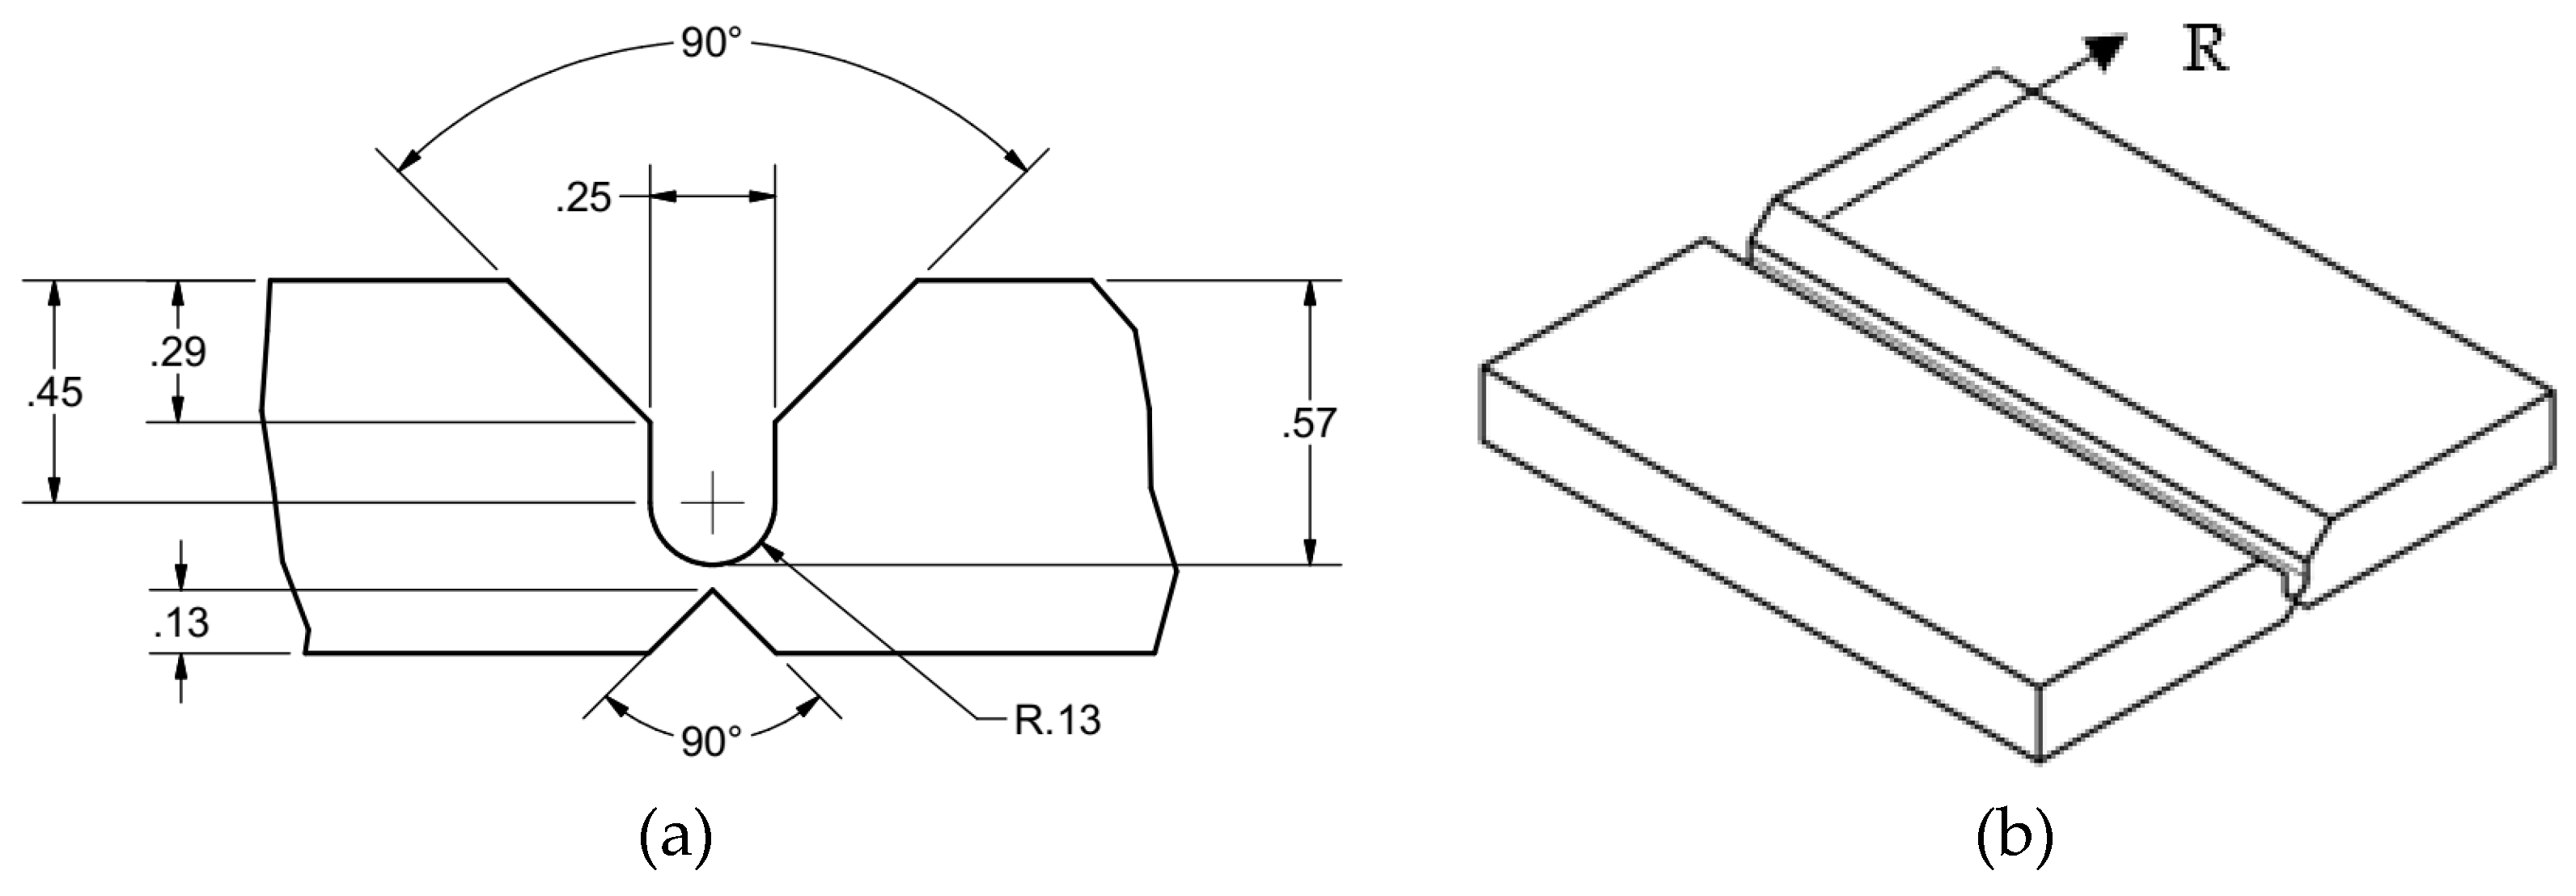
Figure 2.
Geometry of tensile and creep specimens (all dimensions are in inch). The location of the fusion zone (crossed lines, about 0.25 in or 6.35 mm) was indicated in the center of the reduced area section.
Figure 2.
Geometry of tensile and creep specimens (all dimensions are in inch). The location of the fusion zone (crossed lines, about 0.25 in or 6.35 mm) was indicated in the center of the reduced area section.
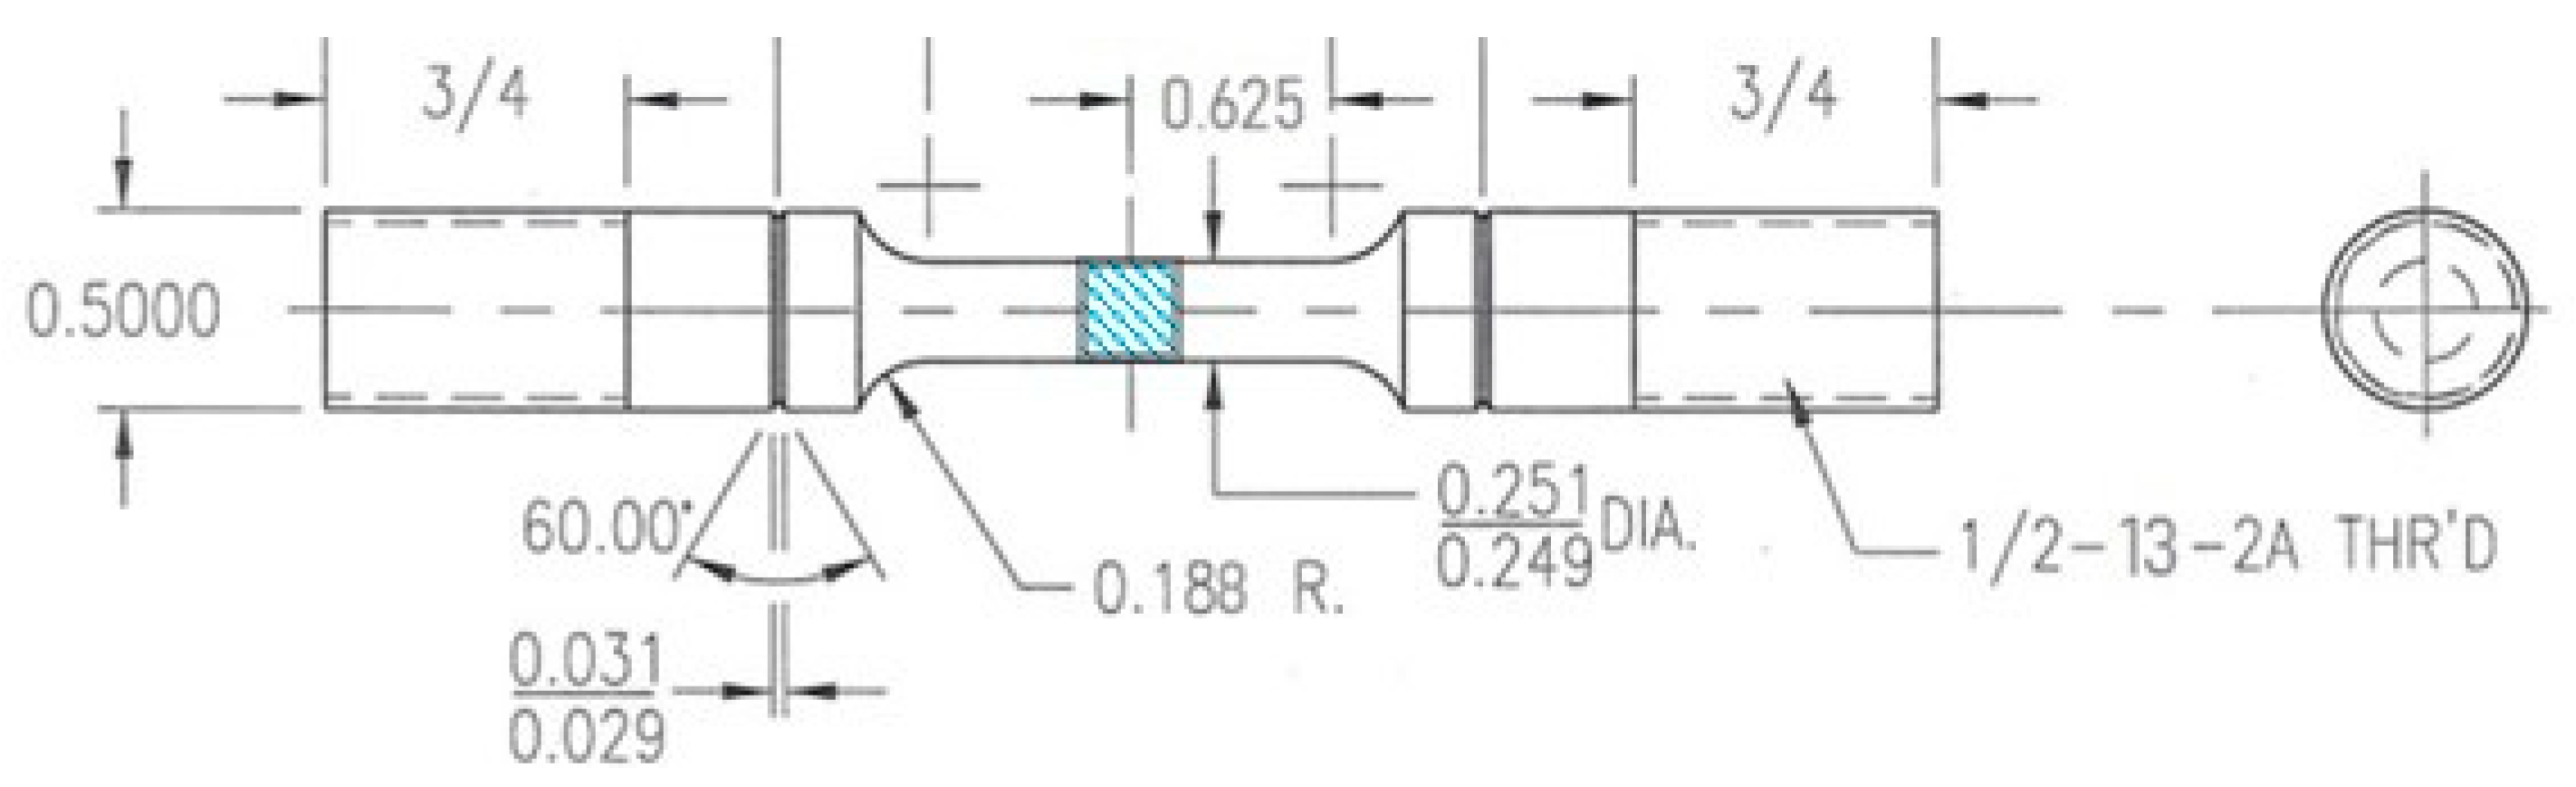
Figure 3.
Vickers hardness across the FZ, HAZ and unaffected BM of the weldments. The two dashed vertical lines indicate the approximate boundaries among FZ, HAZs and unaffected BM.
Figure 3.
Vickers hardness across the FZ, HAZ and unaffected BM of the weldments. The two dashed vertical lines indicate the approximate boundaries among FZ, HAZs and unaffected BM.
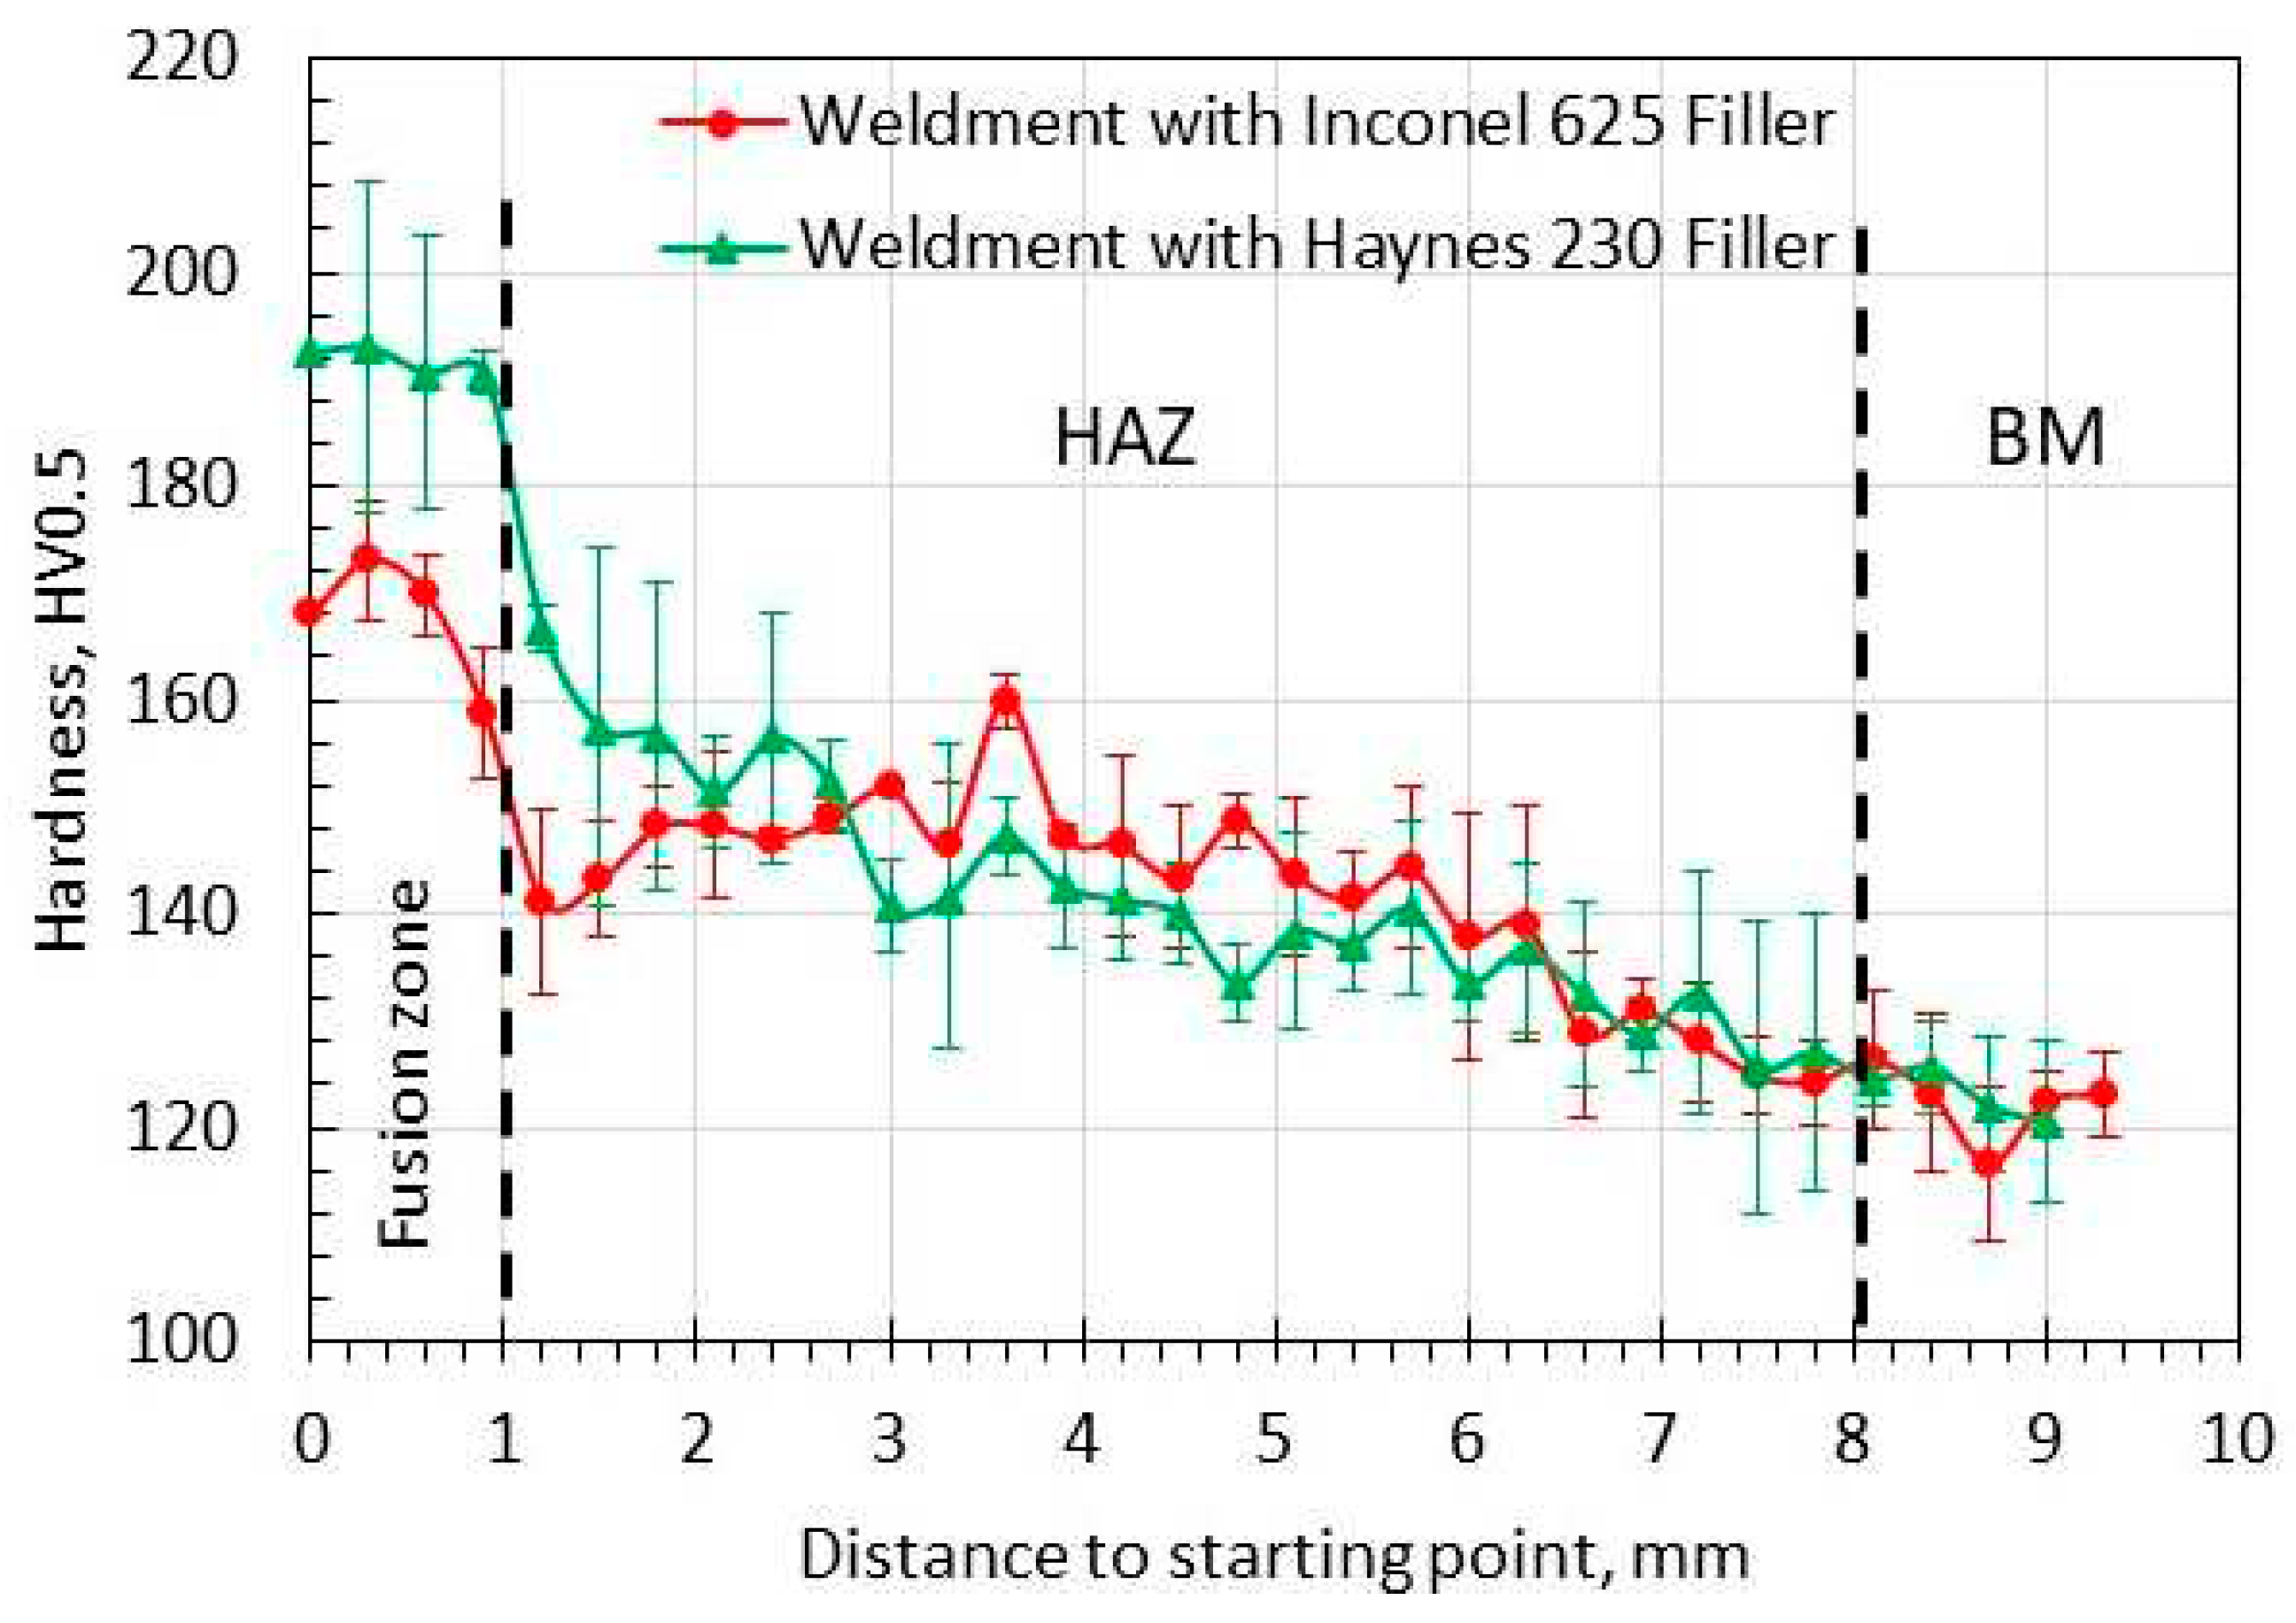
Figure 4.
Tensile stress-strain curves of Alloy 800H BM and the weldment specimens with Inconel 625 and Haynes 230 filler materials at the strain rate of 1x10⁻⁴ s-1 at 760 oC.
Figure 4.
Tensile stress-strain curves of Alloy 800H BM and the weldment specimens with Inconel 625 and Haynes 230 filler materials at the strain rate of 1x10⁻⁴ s-1 at 760 oC.
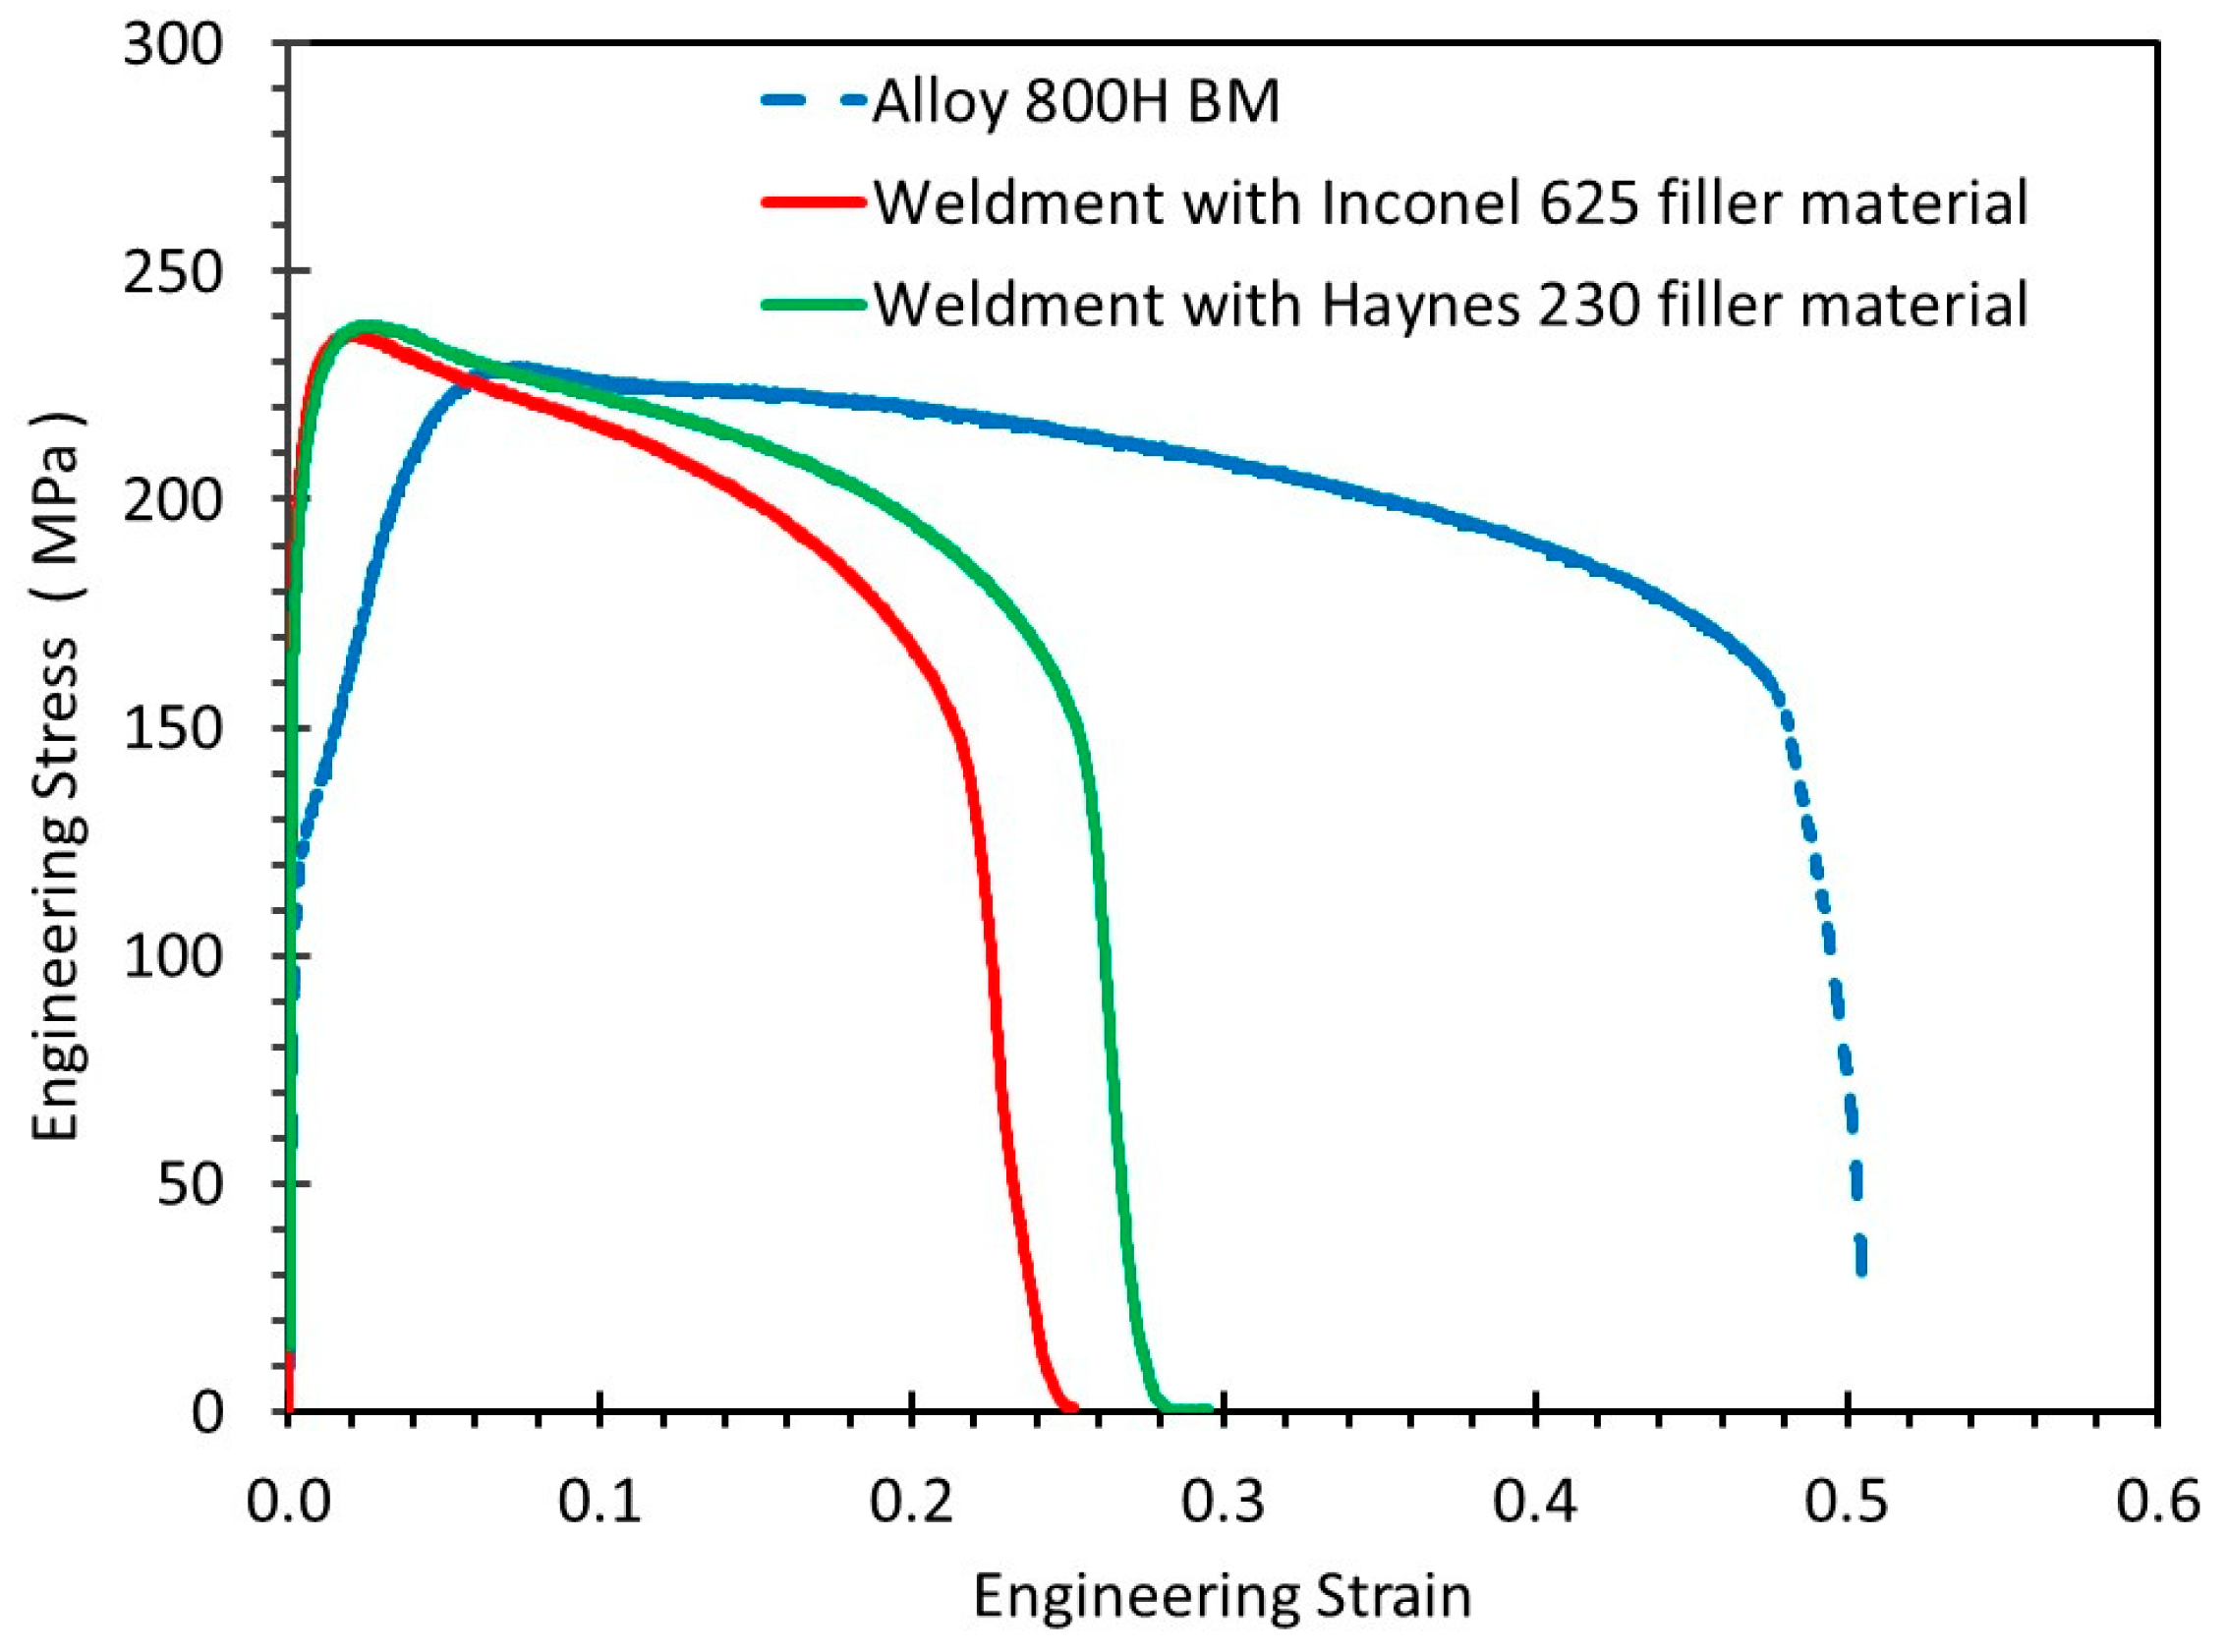
Figure 5.
Creep curves of the Alloy 800H BM and WM specimens with Inconel 625 and Haynes 230 filler materials at 760 oC and 80 MPa. (a) Creep strain and (b) creep strain rate as a function of time.
Figure 5.
Creep curves of the Alloy 800H BM and WM specimens with Inconel 625 and Haynes 230 filler materials at 760 oC and 80 MPa. (a) Creep strain and (b) creep strain rate as a function of time.
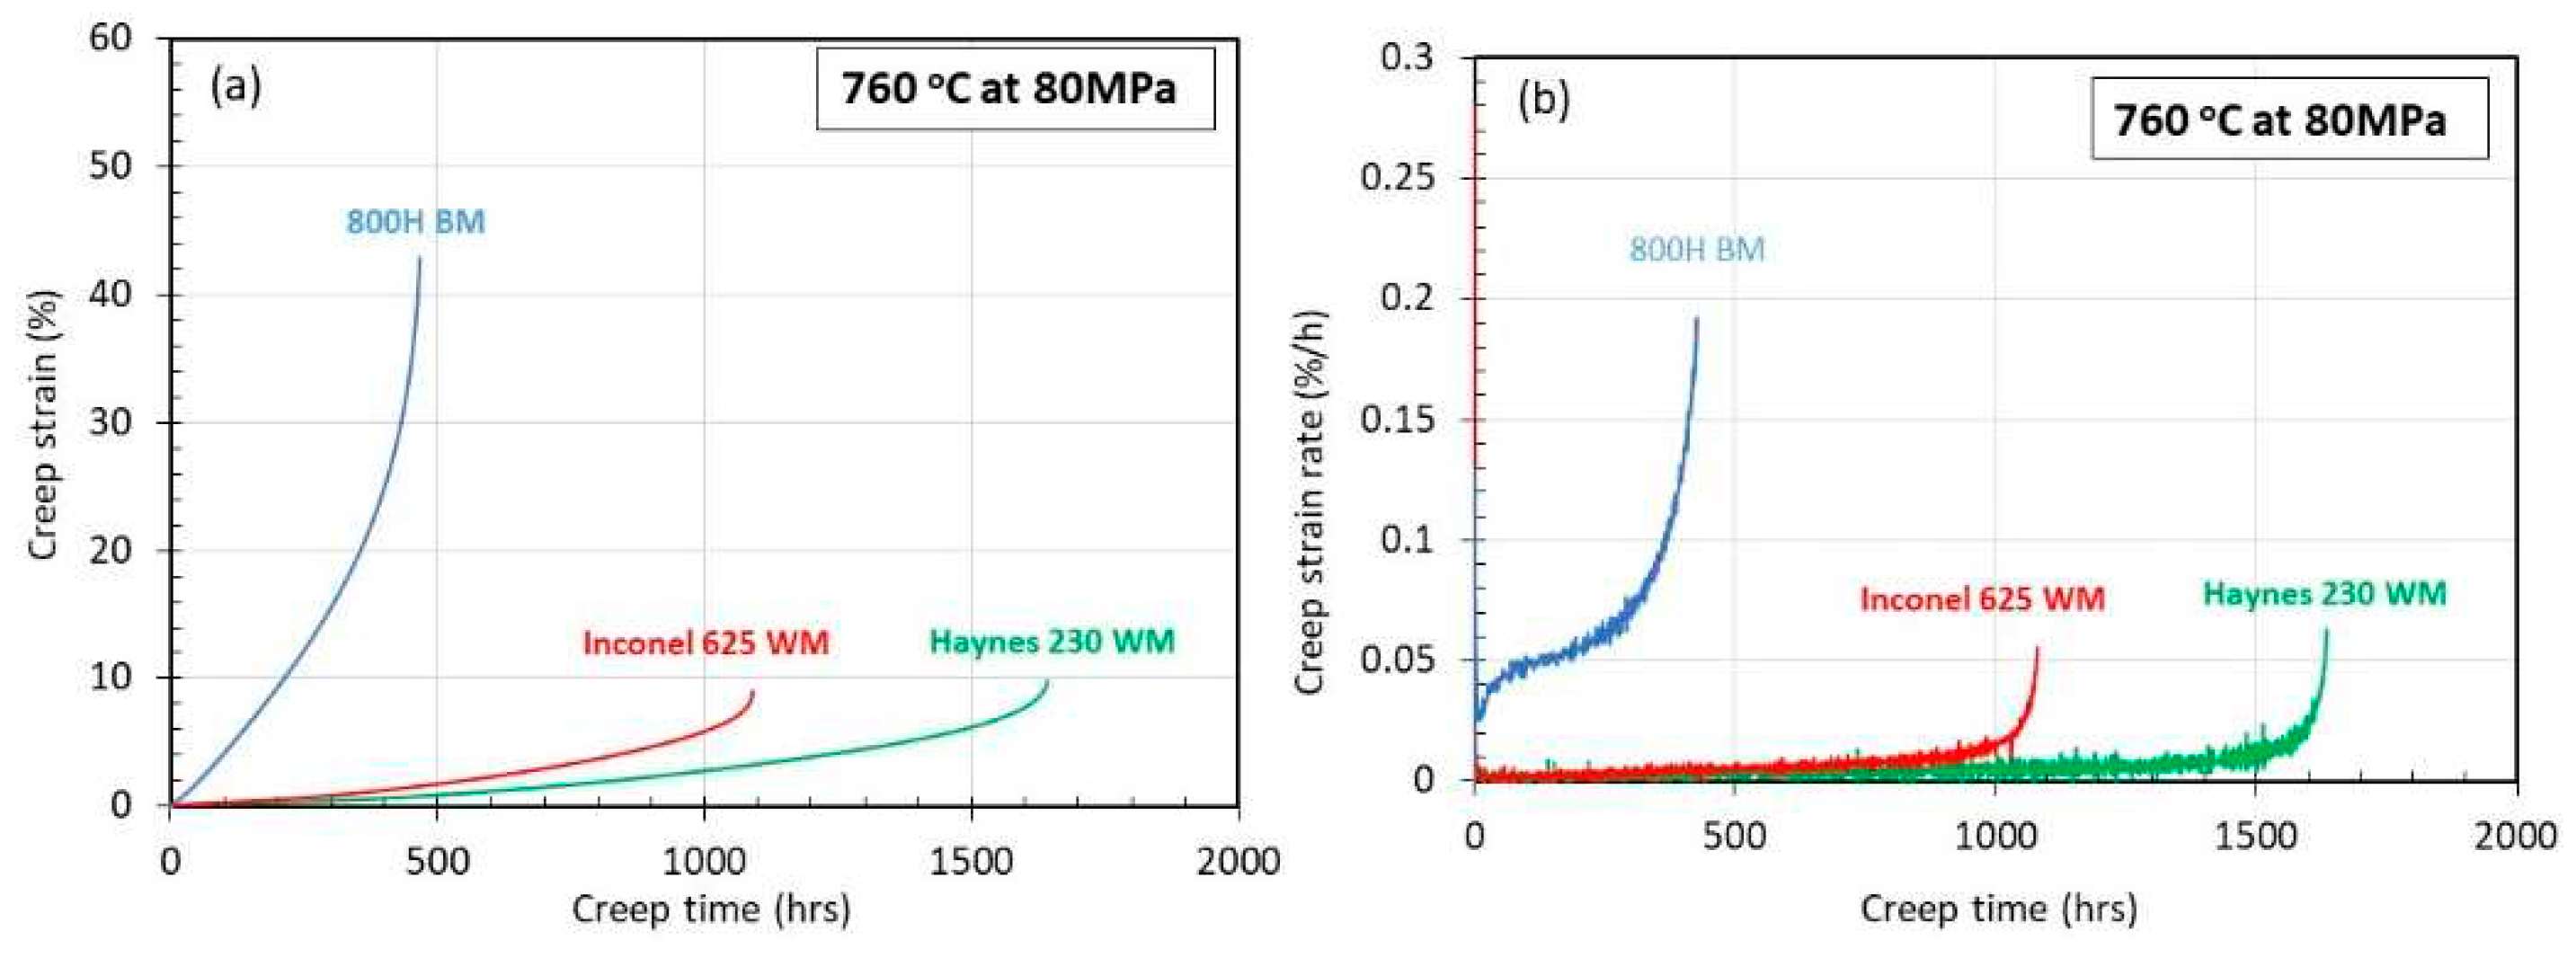
Figure 6.
Images of the ruptured creep specimens (a) base metal specimen, (b) and (c) the weldment specimens with Inconel 625 and Haynes 230 filler materials after creep at 760 oC, 80 MPa. In (b) and (c), the regions for microstructure examinations were labeled, 1: FZ, 2: HAZ, 3: base metal close to facture surface adjacent to the fusion boundary, and 4: un-deformed base metal.
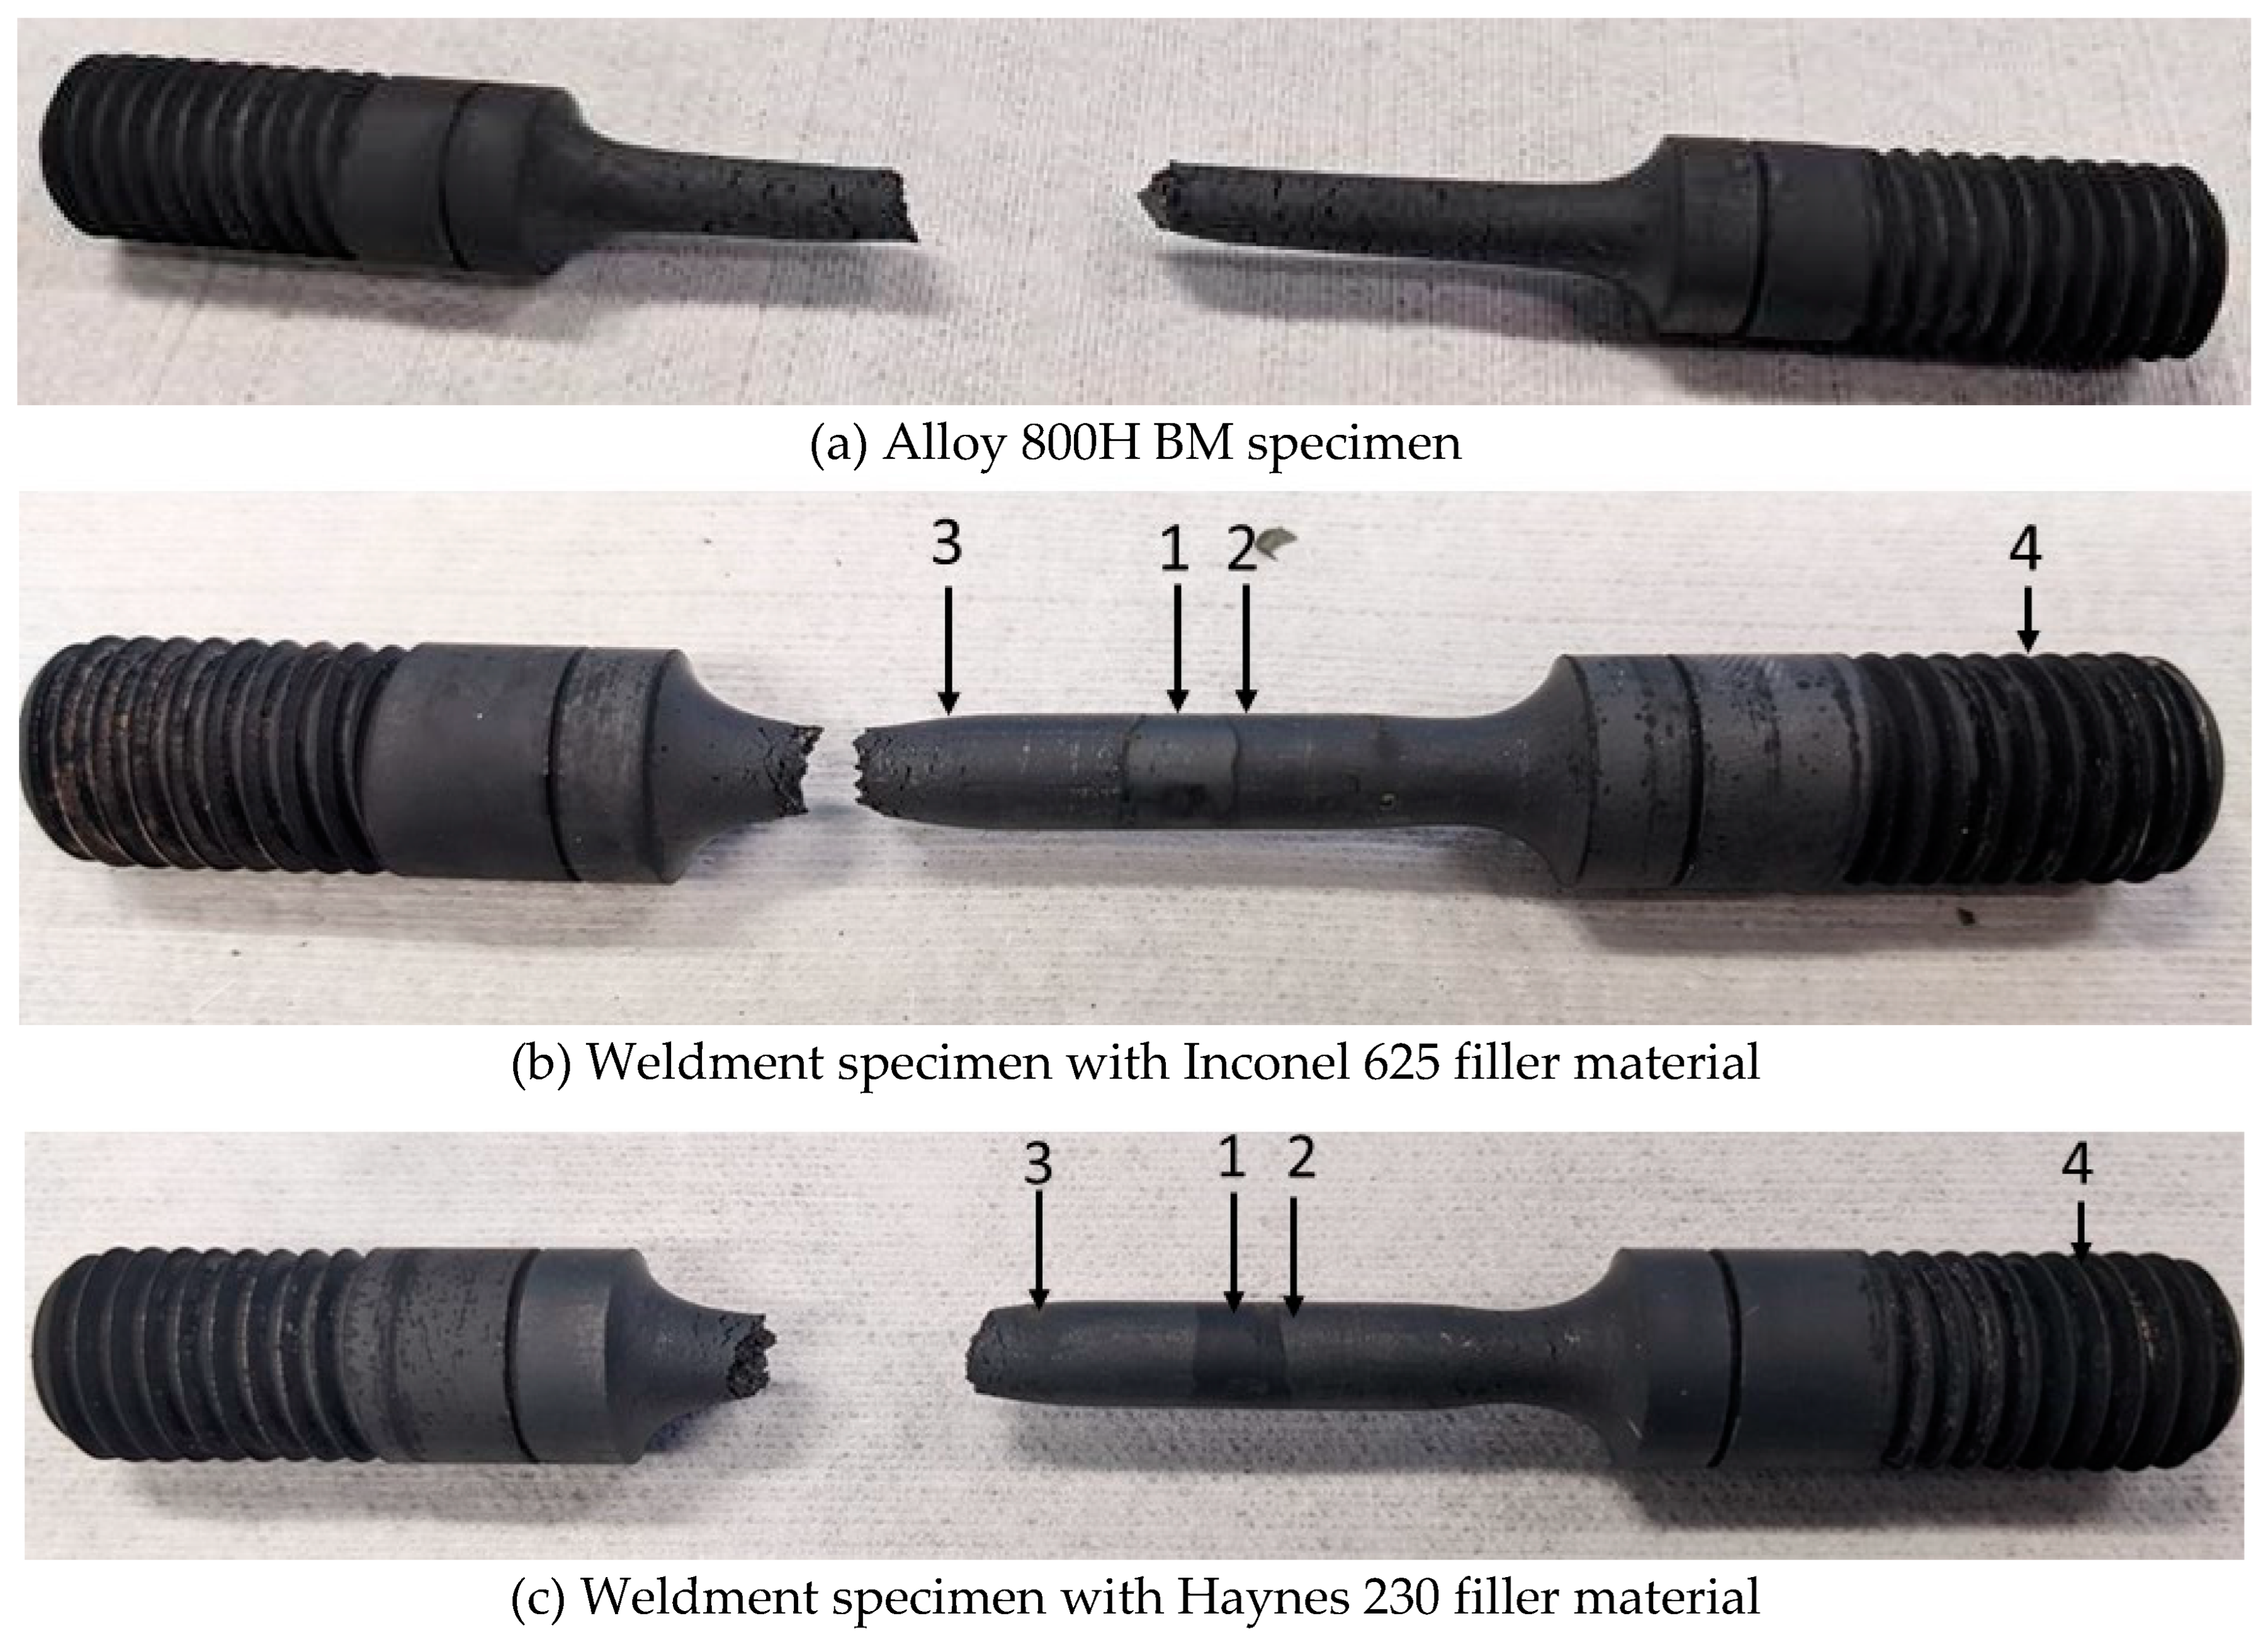
Figure 7.
a) Optical and (b) TEM images of as-received Alloy 800H BM.
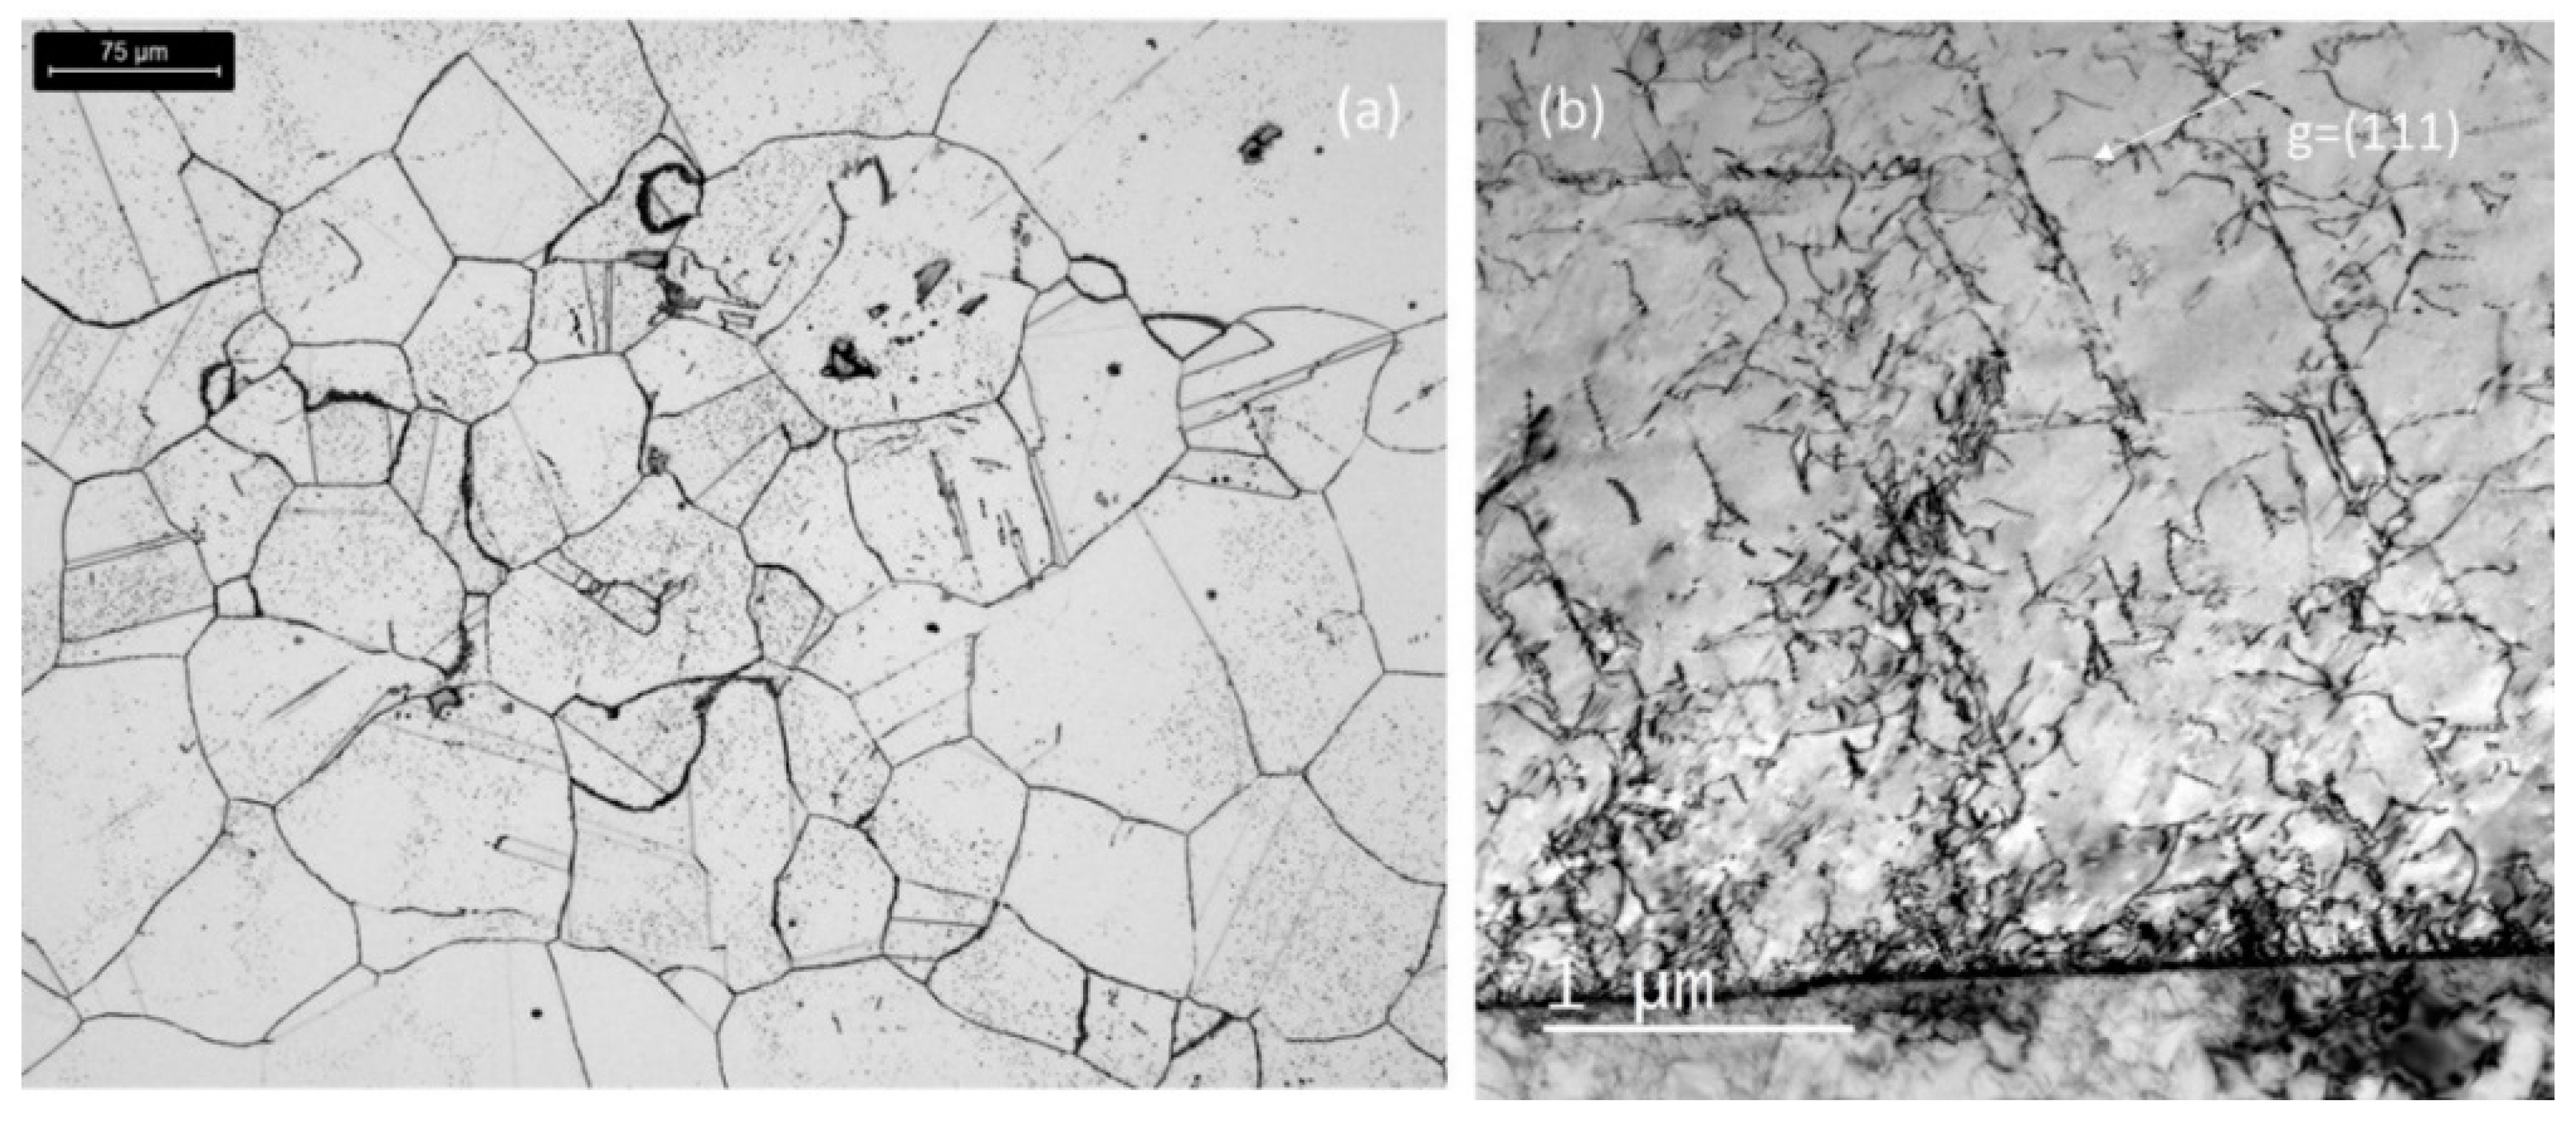
Figure 8.
a) IPFM image at as-welded condition of the weldment with Inconel 625 filler material, showing the FZ (left) and HAZ (right) grain morphology (b) HAADF image showing the precipitates in the FZ.
Figure 8.
a) IPFM image at as-welded condition of the weldment with Inconel 625 filler material, showing the FZ (left) and HAZ (right) grain morphology (b) HAADF image showing the precipitates in the FZ.
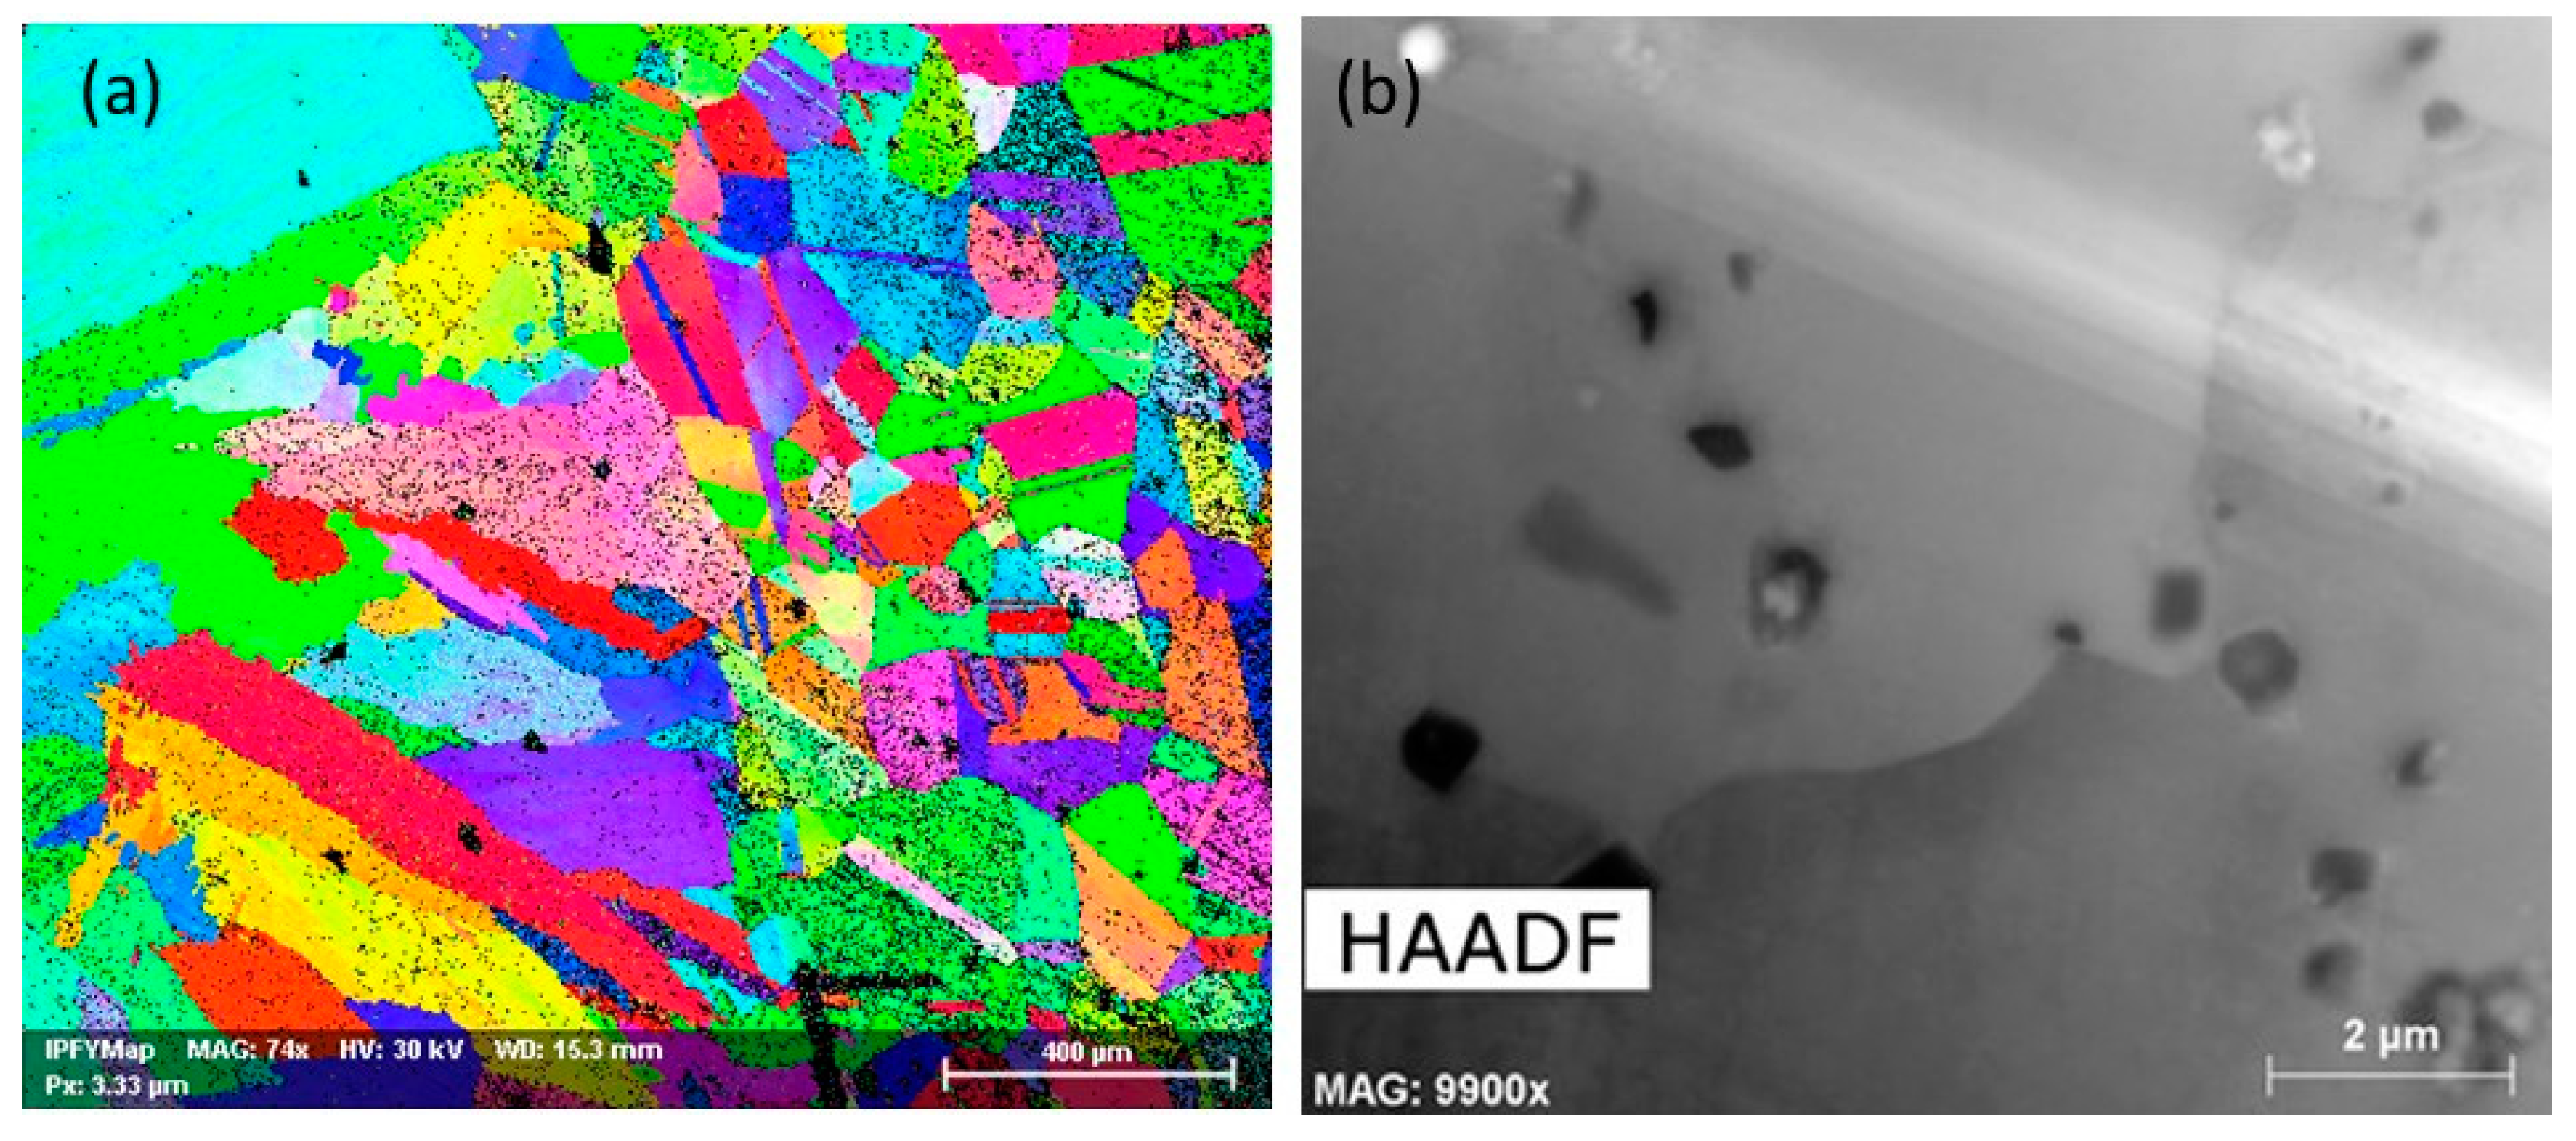
Figure 9.
As-welded FZ of the weldment with Inconel 625 FM. (a) HAADF image, (b) and (c) NBED patterns of the Laves and MC phases, and (d)-(l) ChemiSTEM EDX maps of the studied region in (a).
Figure 9.
As-welded FZ of the weldment with Inconel 625 FM. (a) HAADF image, (b) and (c) NBED patterns of the Laves and MC phases, and (d)-(l) ChemiSTEM EDX maps of the studied region in (a).
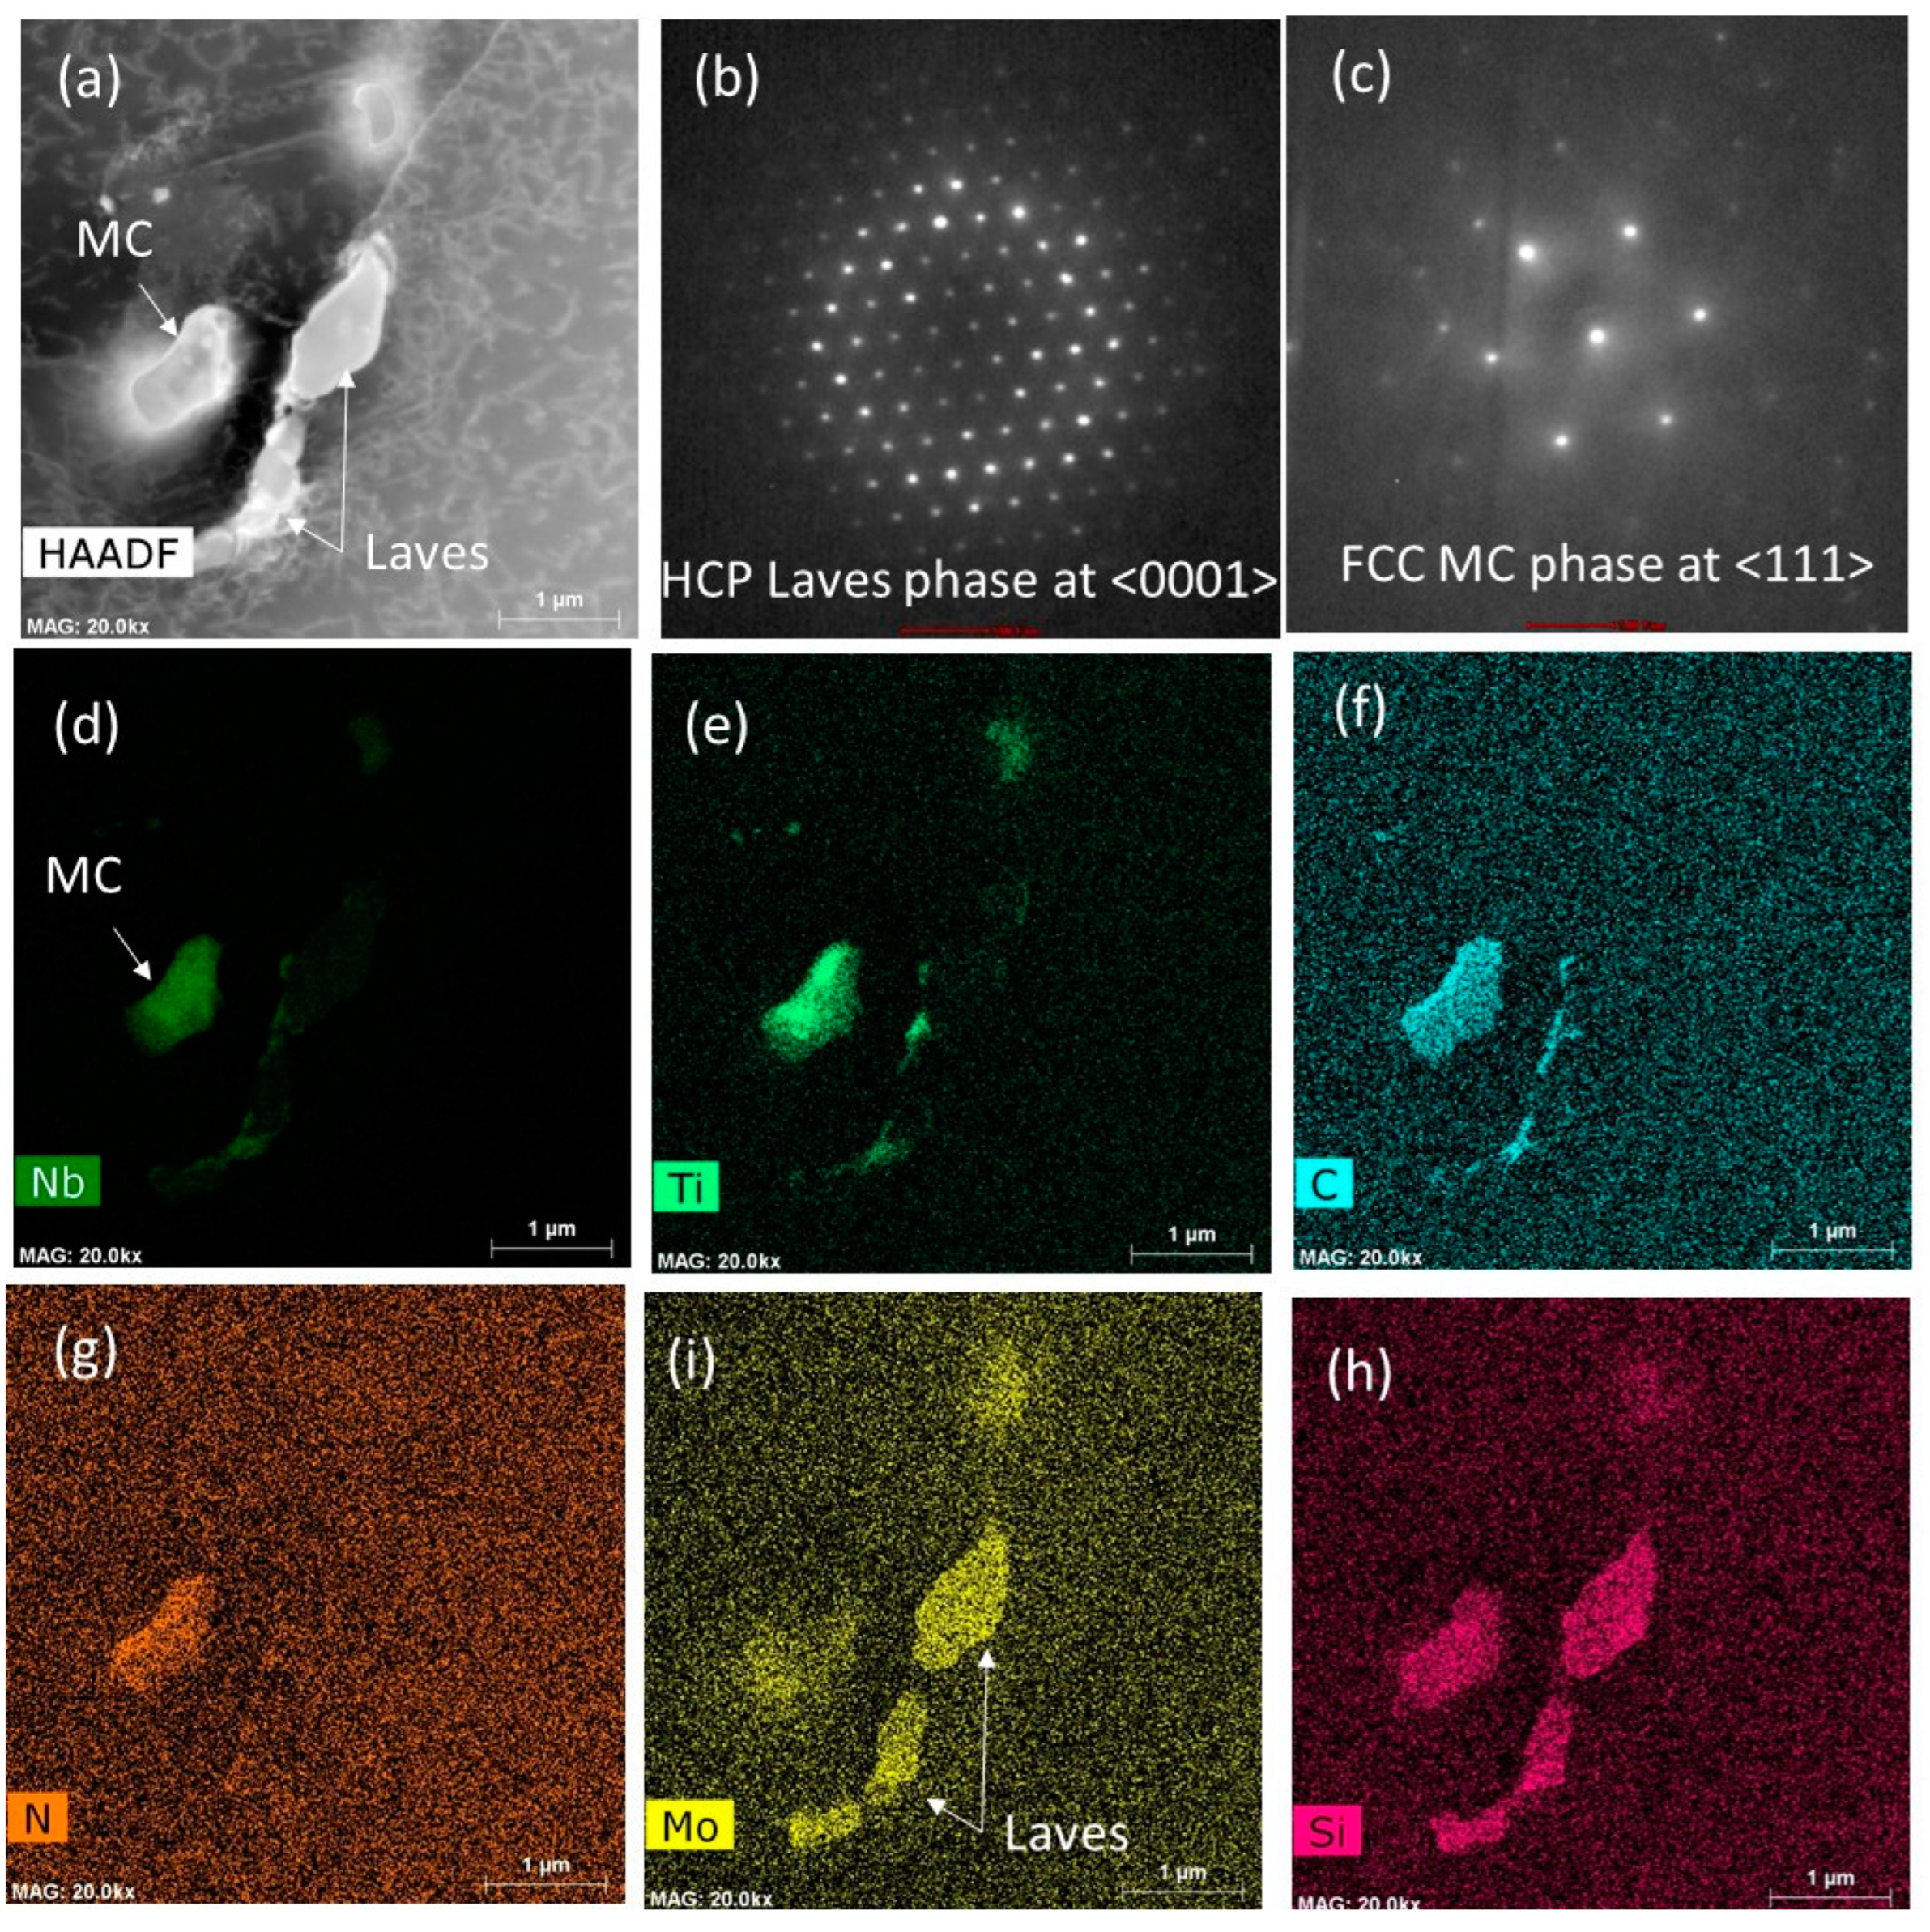
Figure 10.
As-welded FZ using Inconel 625 FM. (a) HAADF image, and ChemiSTEM EDX maps of (b) Fe, (c) Ni, (d) Cr, (e) Nb and (f) Ti showing the Nb- and Ti-rich nano-sized MC carbides.
Figure 10.
As-welded FZ using Inconel 625 FM. (a) HAADF image, and ChemiSTEM EDX maps of (b) Fe, (c) Ni, (d) Cr, (e) Nb and (f) Ti showing the Nb- and Ti-rich nano-sized MC carbides.
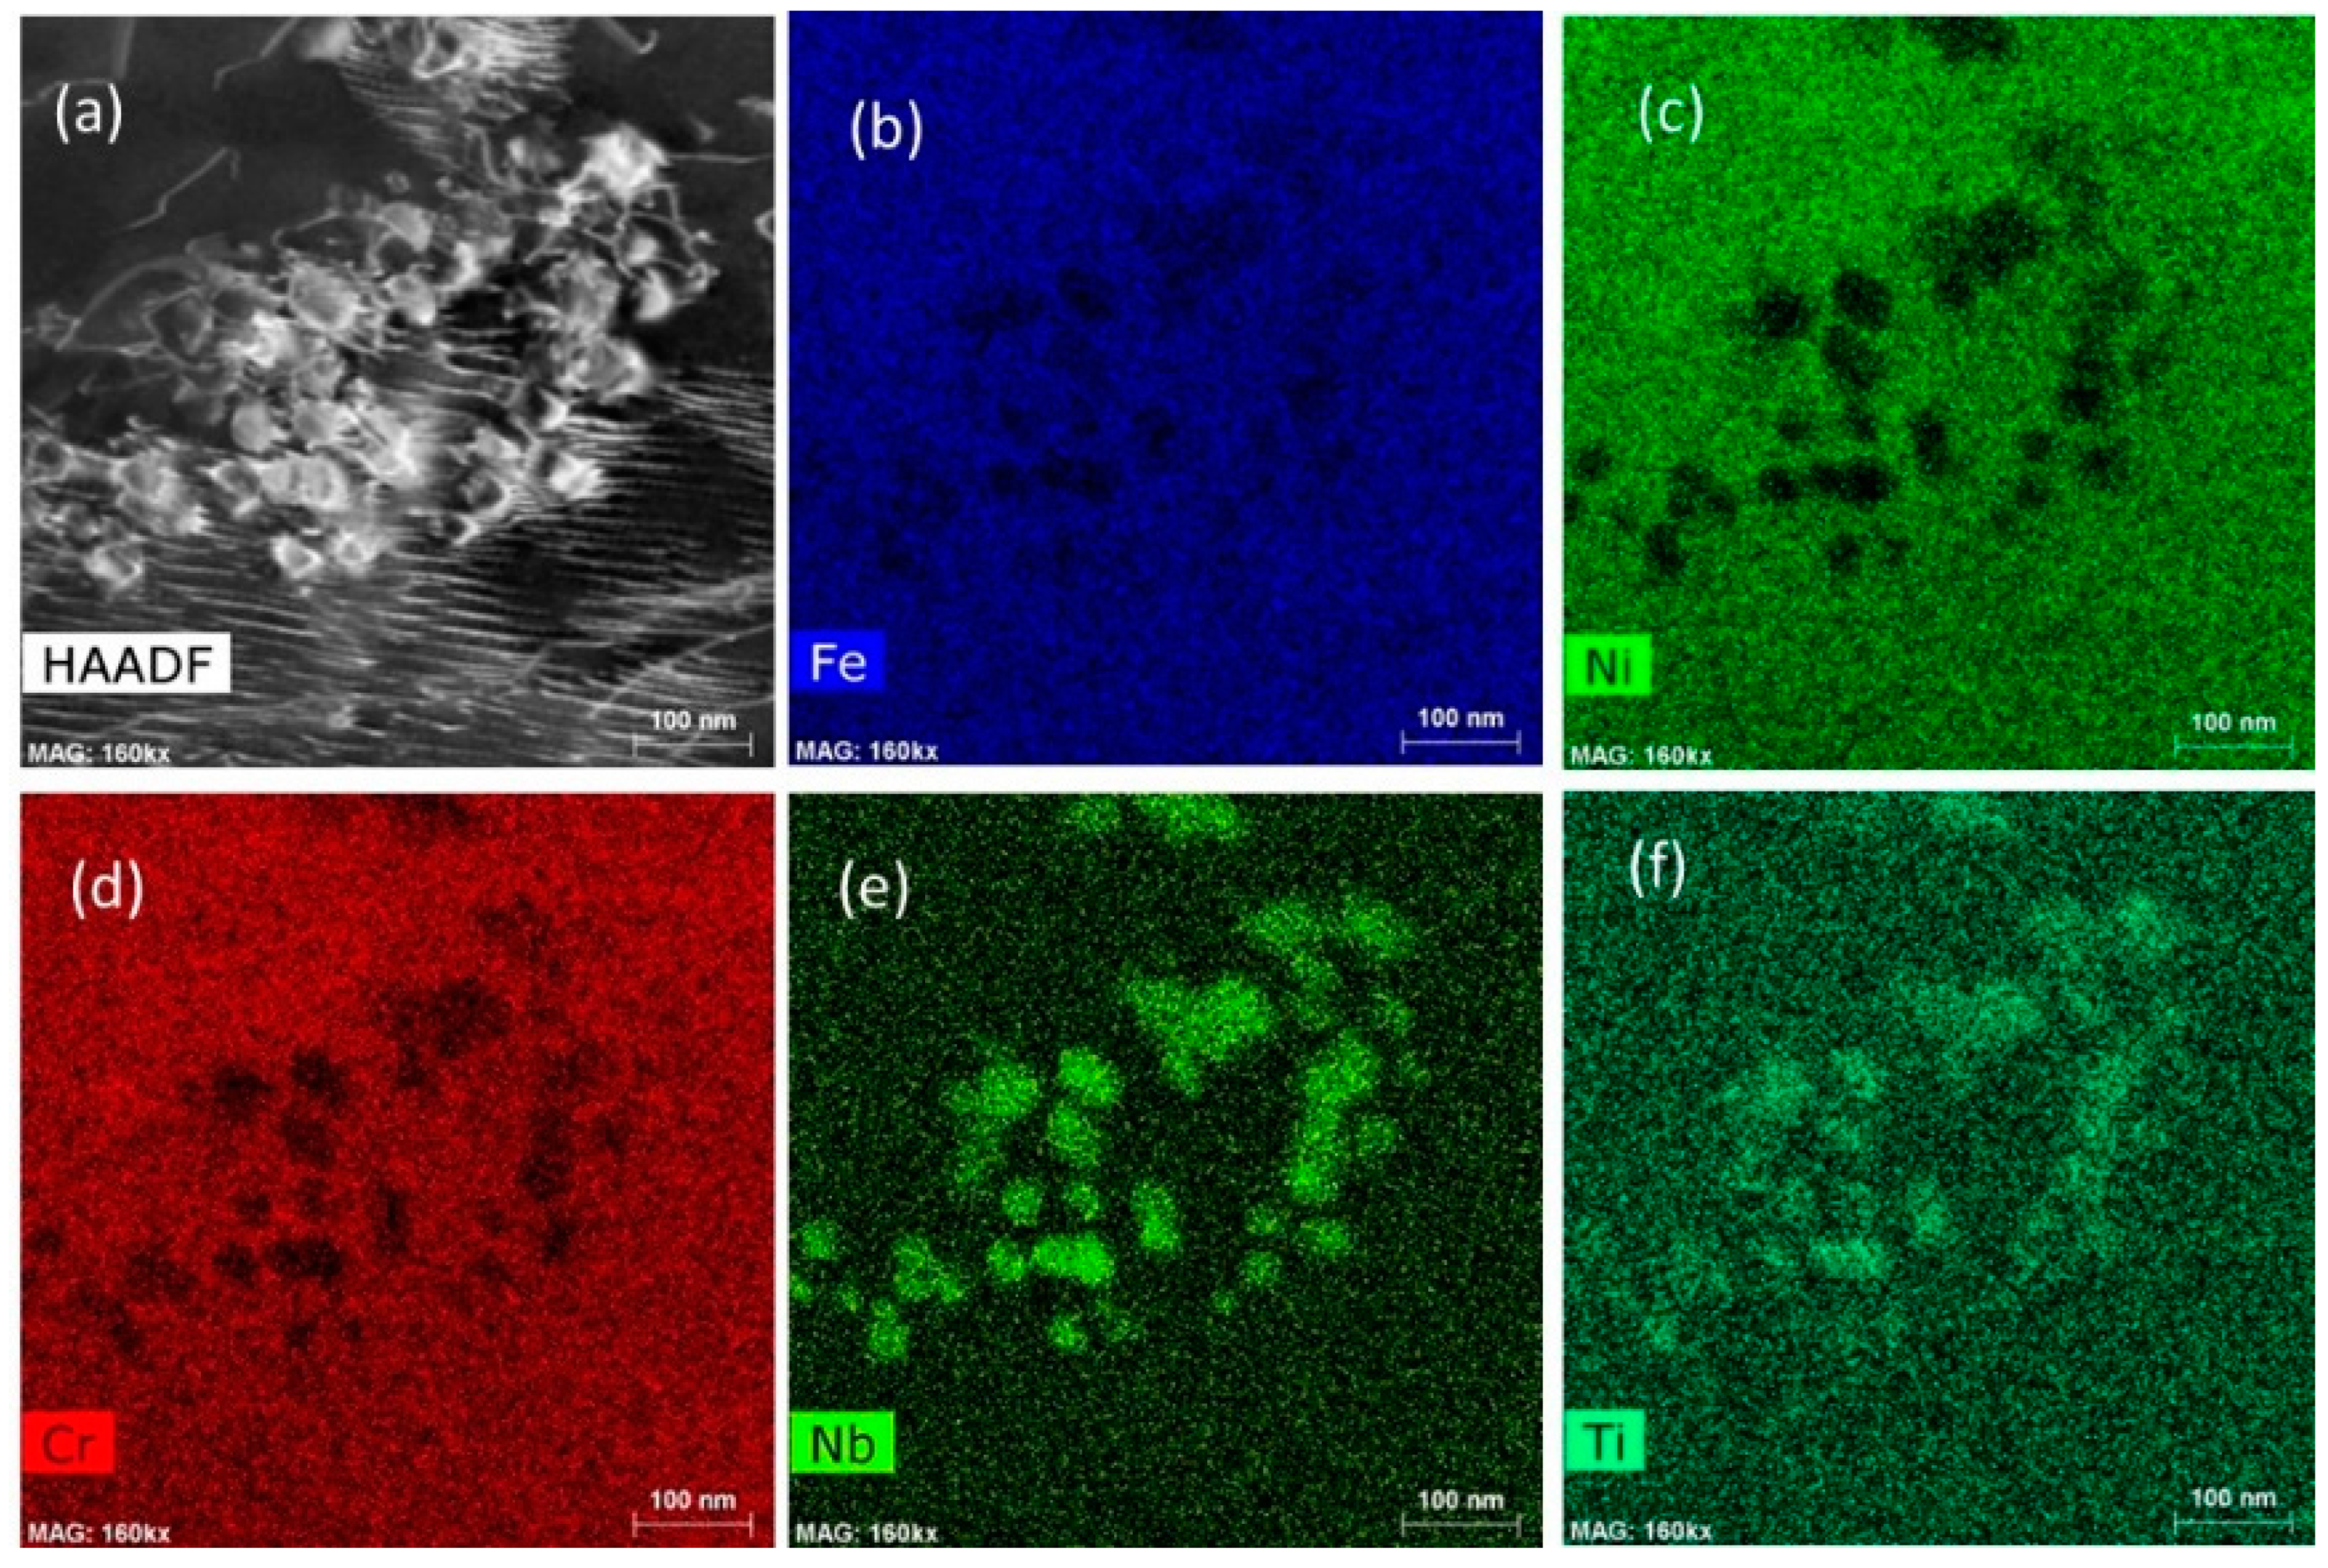
Figure 11.
As-welded fusion zone using Haynes 230 filler material showing the different carbides. (a) and (e) HAADF images, (b)-(d) ChemiSTEM EDX maps of Cr, Ti and N indicating MC and M23C6 carbides, and (f)-(h) ChemiSTEM EDX maps showing nano-sized W, Mn and Cr-rich carbides.
Figure 11.
As-welded fusion zone using Haynes 230 filler material showing the different carbides. (a) and (e) HAADF images, (b)-(d) ChemiSTEM EDX maps of Cr, Ti and N indicating MC and M23C6 carbides, and (f)-(h) ChemiSTEM EDX maps showing nano-sized W, Mn and Cr-rich carbides.
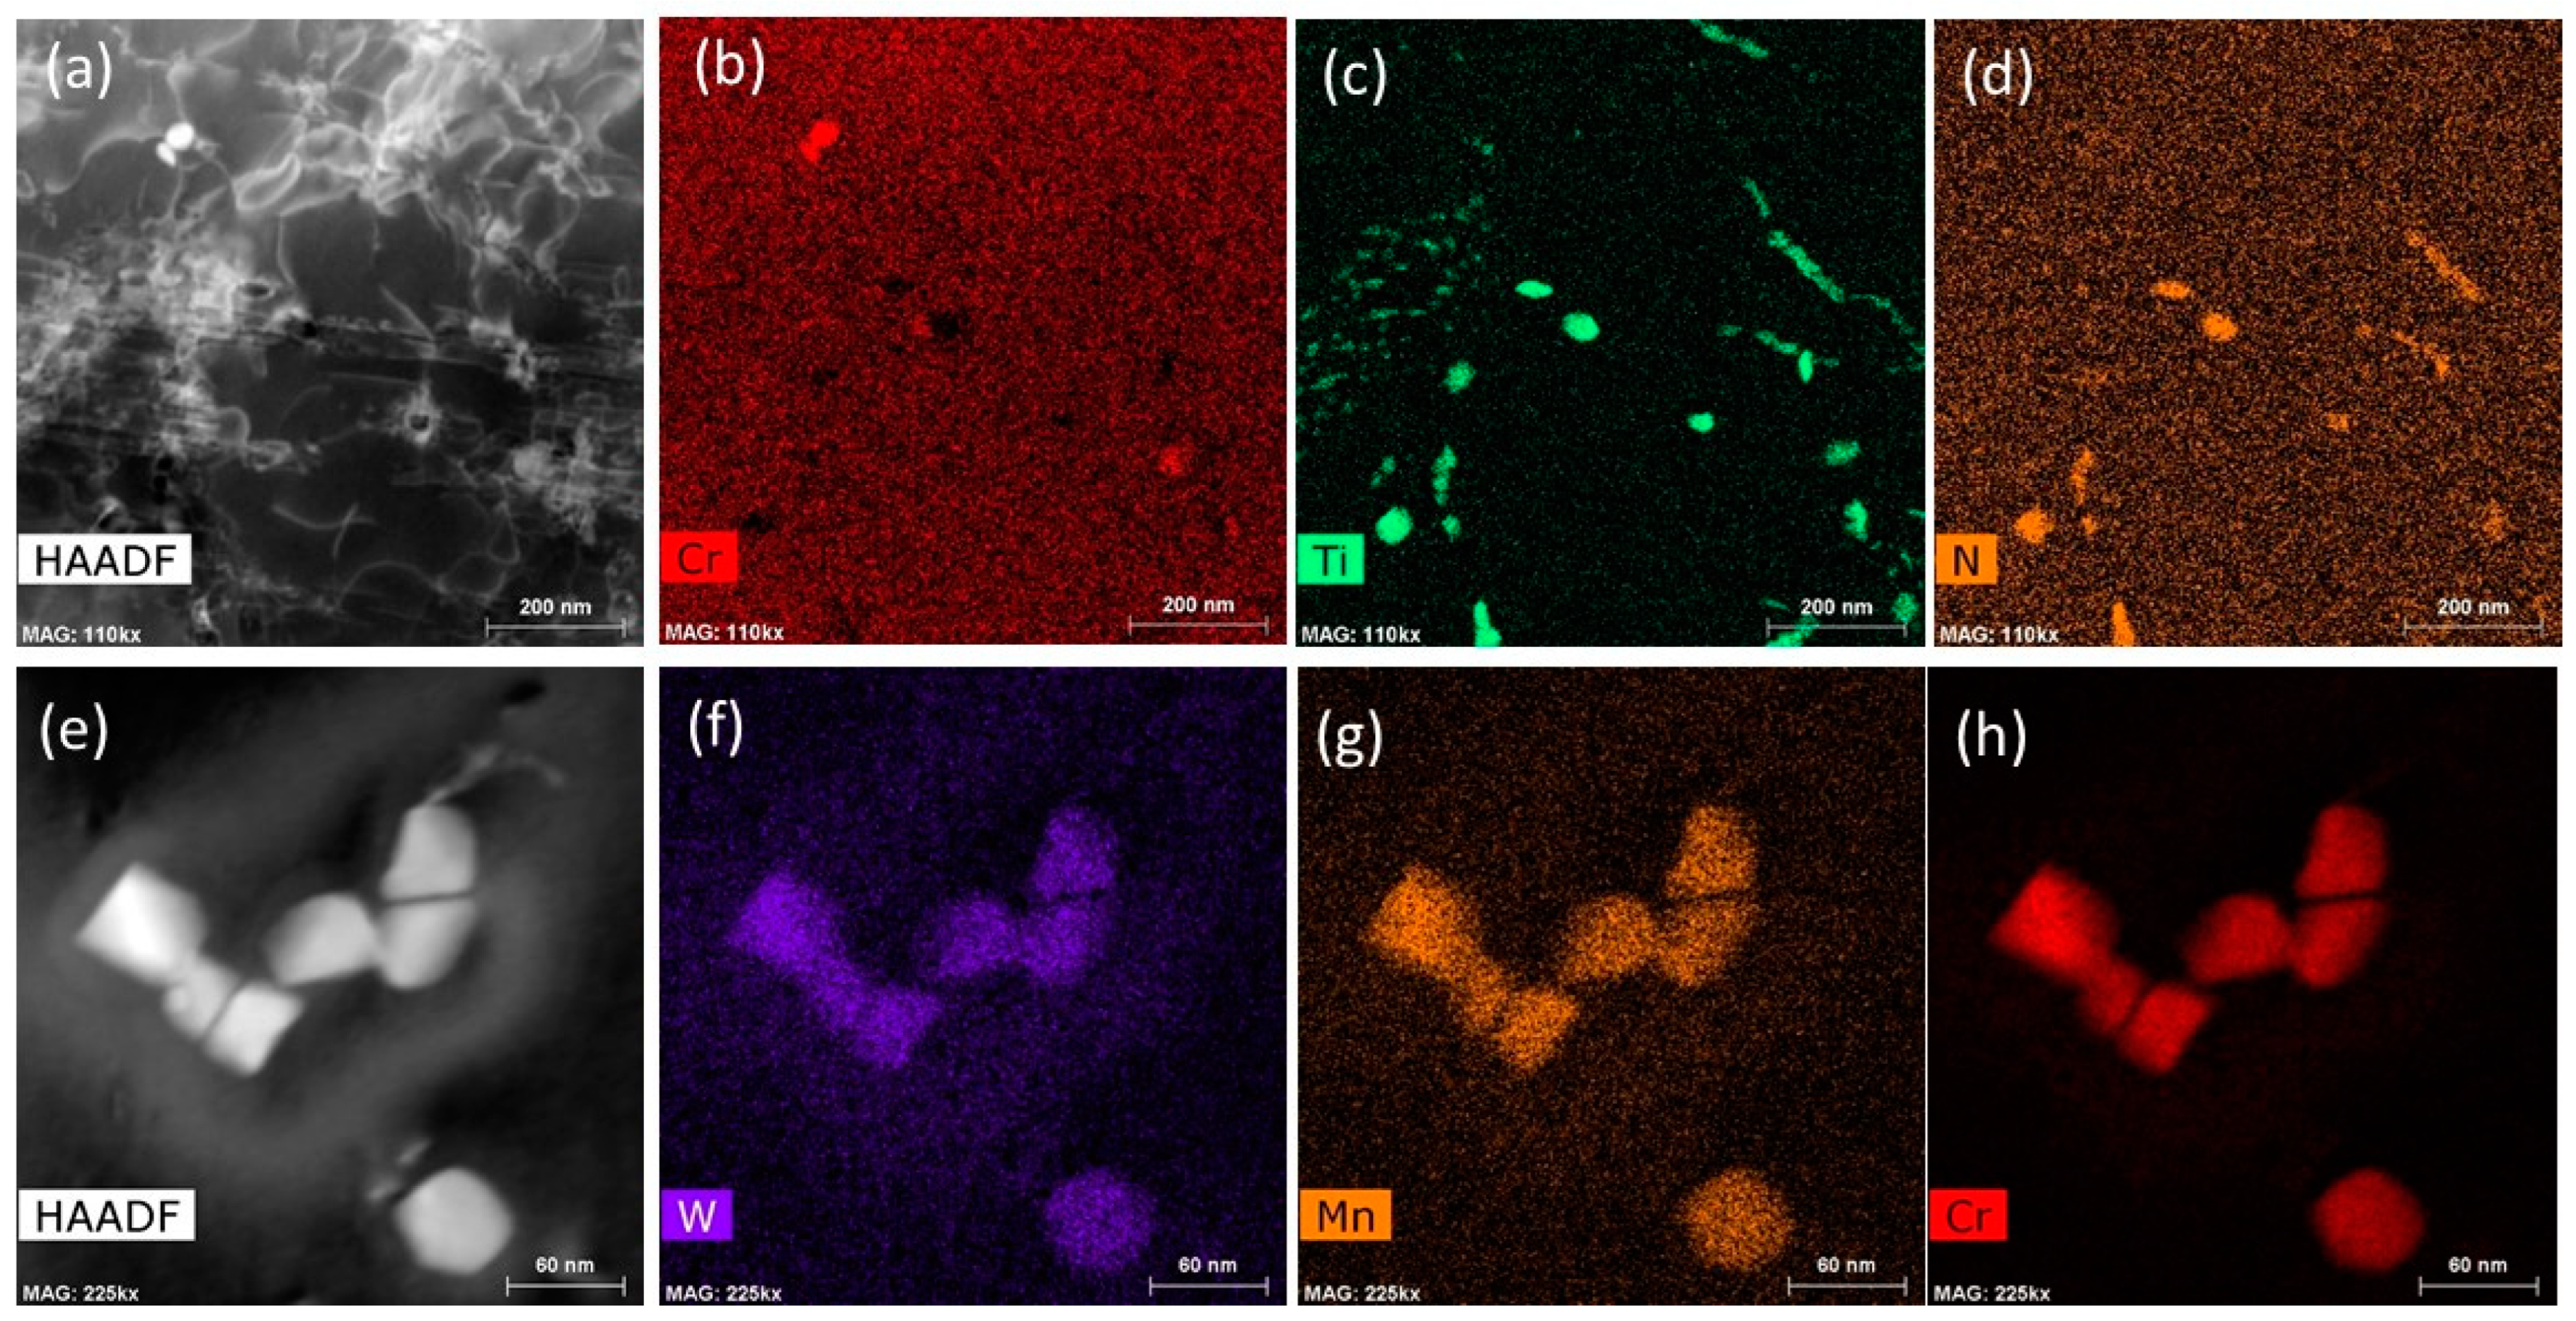
Figure 12.
As-welded HAZ (a) HAADF image, and ChemiSTEM EDX maps of (b) Fe, (c) Cr, (d) N, (e) Ti and (f) C.
Figure 12.
As-welded HAZ (a) HAADF image, and ChemiSTEM EDX maps of (b) Fe, (c) Cr, (d) N, (e) Ti and (f) C.
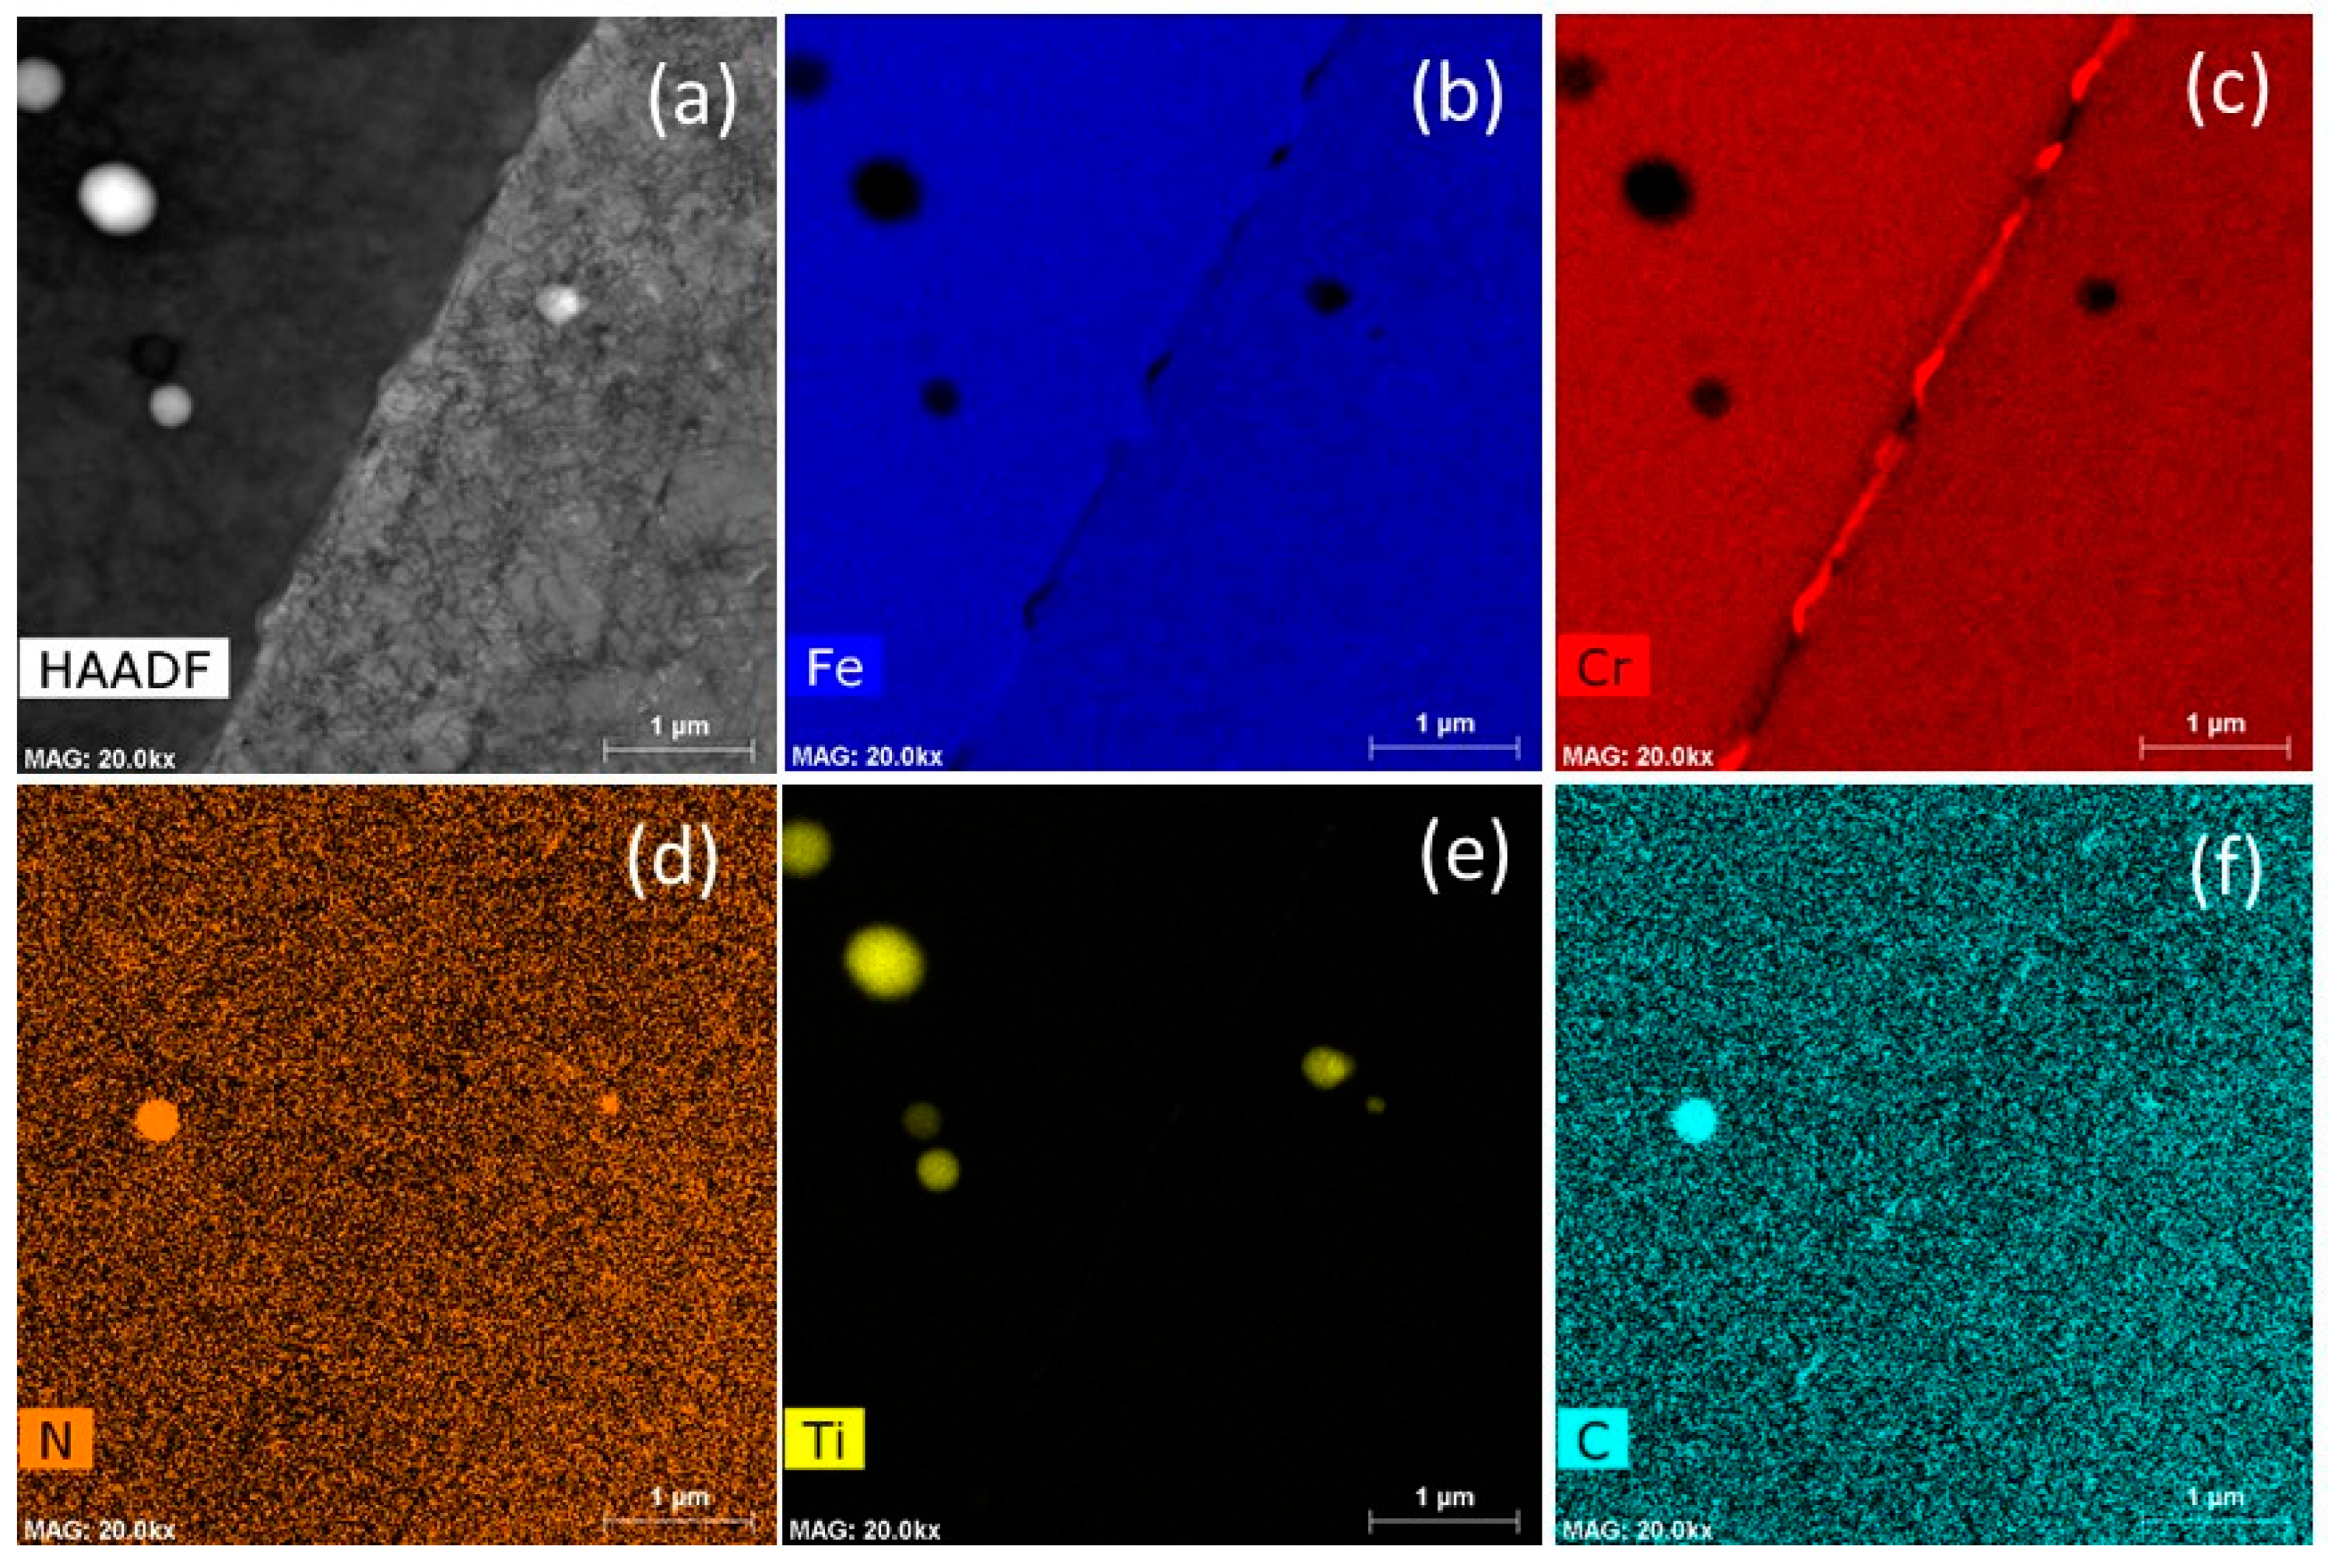
Figure 13.
FZ of Inconel 625 filler specimen after creep rupture (1091 hours) at 760 oC, 80 MPa. (a) HAADF image showing the identified SSPs and (b)-(e) NBED patterns taken from the SSPs and matrix in (a): (b) rod shape δ phase at the zone axis of [100] and the parallel [110] zone axis of the matrix, (c) HCP Laves phase at [1120], (d) M23C6 carbide at [120], (e) M6C at [110], and (f)-(n) ChemiSTEM element EDX maps showing chemical compositions of the SSPs.
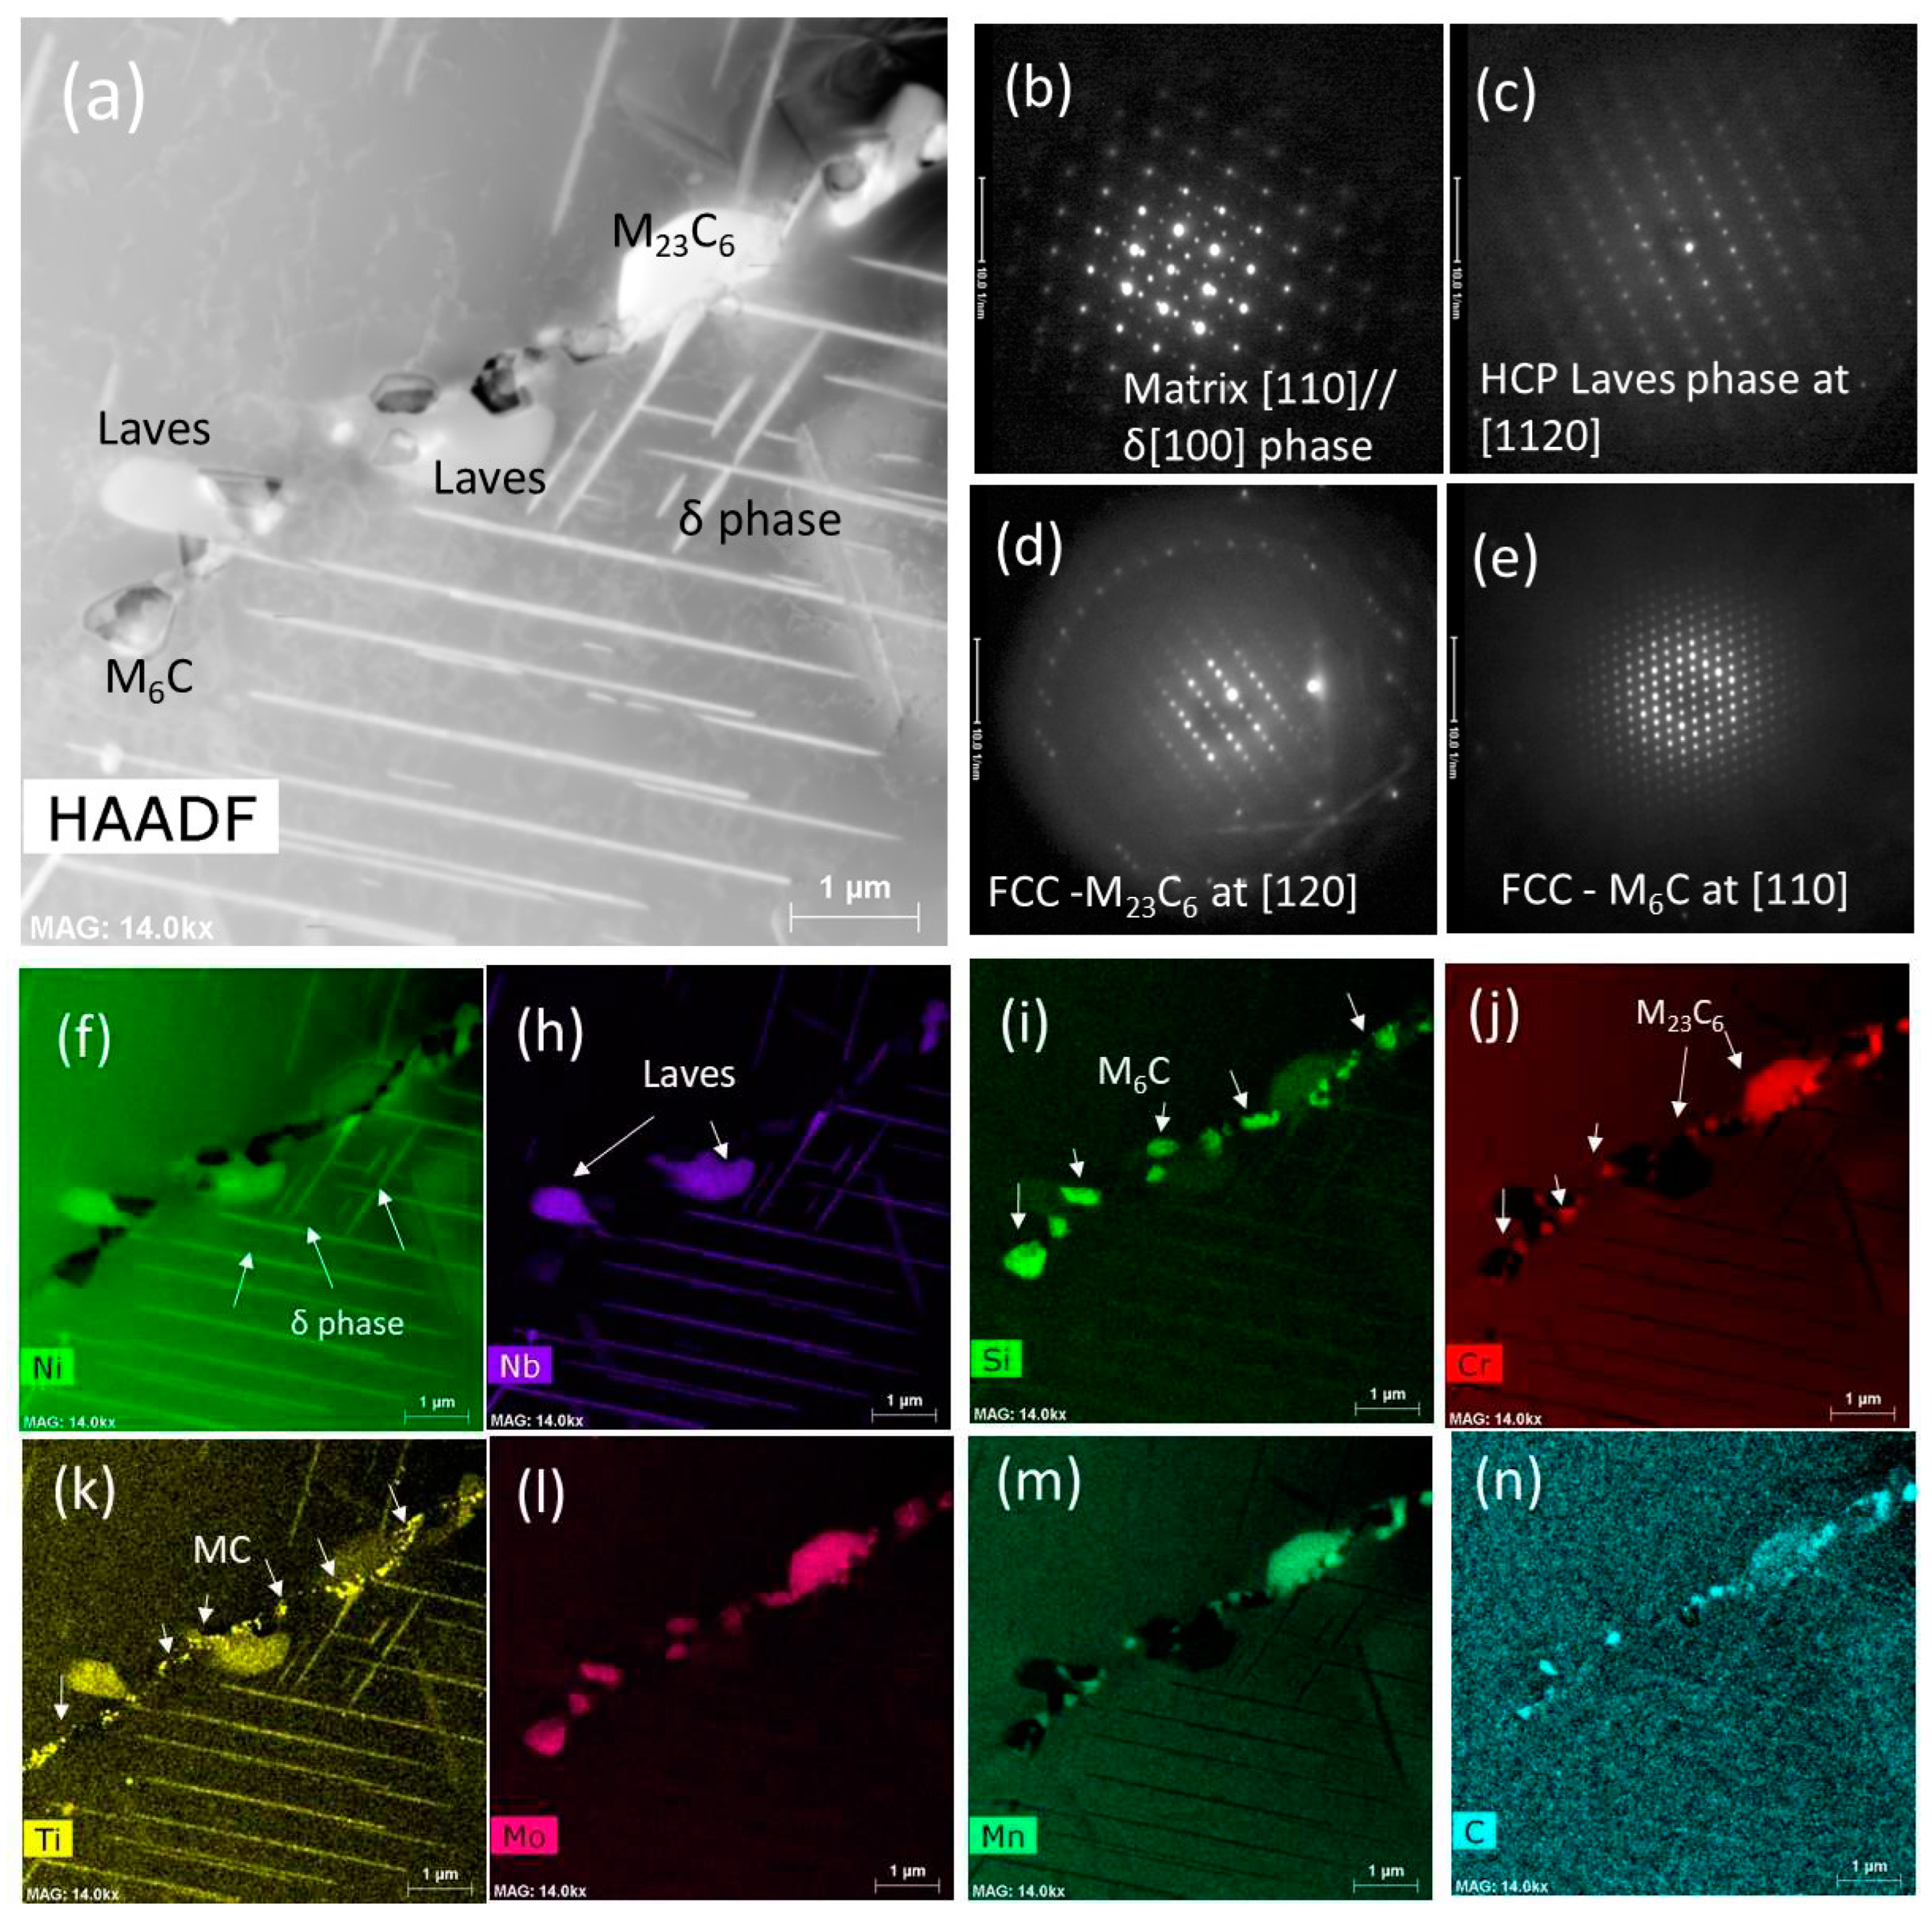
Figure 14.
Fusion zone of Haynes 230 filler weldment after creep rupture for 1643 hours at 760 oC, 80 MPa. (a) HAADF image, (b) and (c) NBED patterns taken at [110] zone axis from the M6C SSP (O1) and matrix (O2), and (d) (m) ChemiSTEM element EDX maps.
Figure 14.
Fusion zone of Haynes 230 filler weldment after creep rupture for 1643 hours at 760 oC, 80 MPa. (a) HAADF image, (b) and (c) NBED patterns taken at [110] zone axis from the M6C SSP (O1) and matrix (O2), and (d) (m) ChemiSTEM element EDX maps.
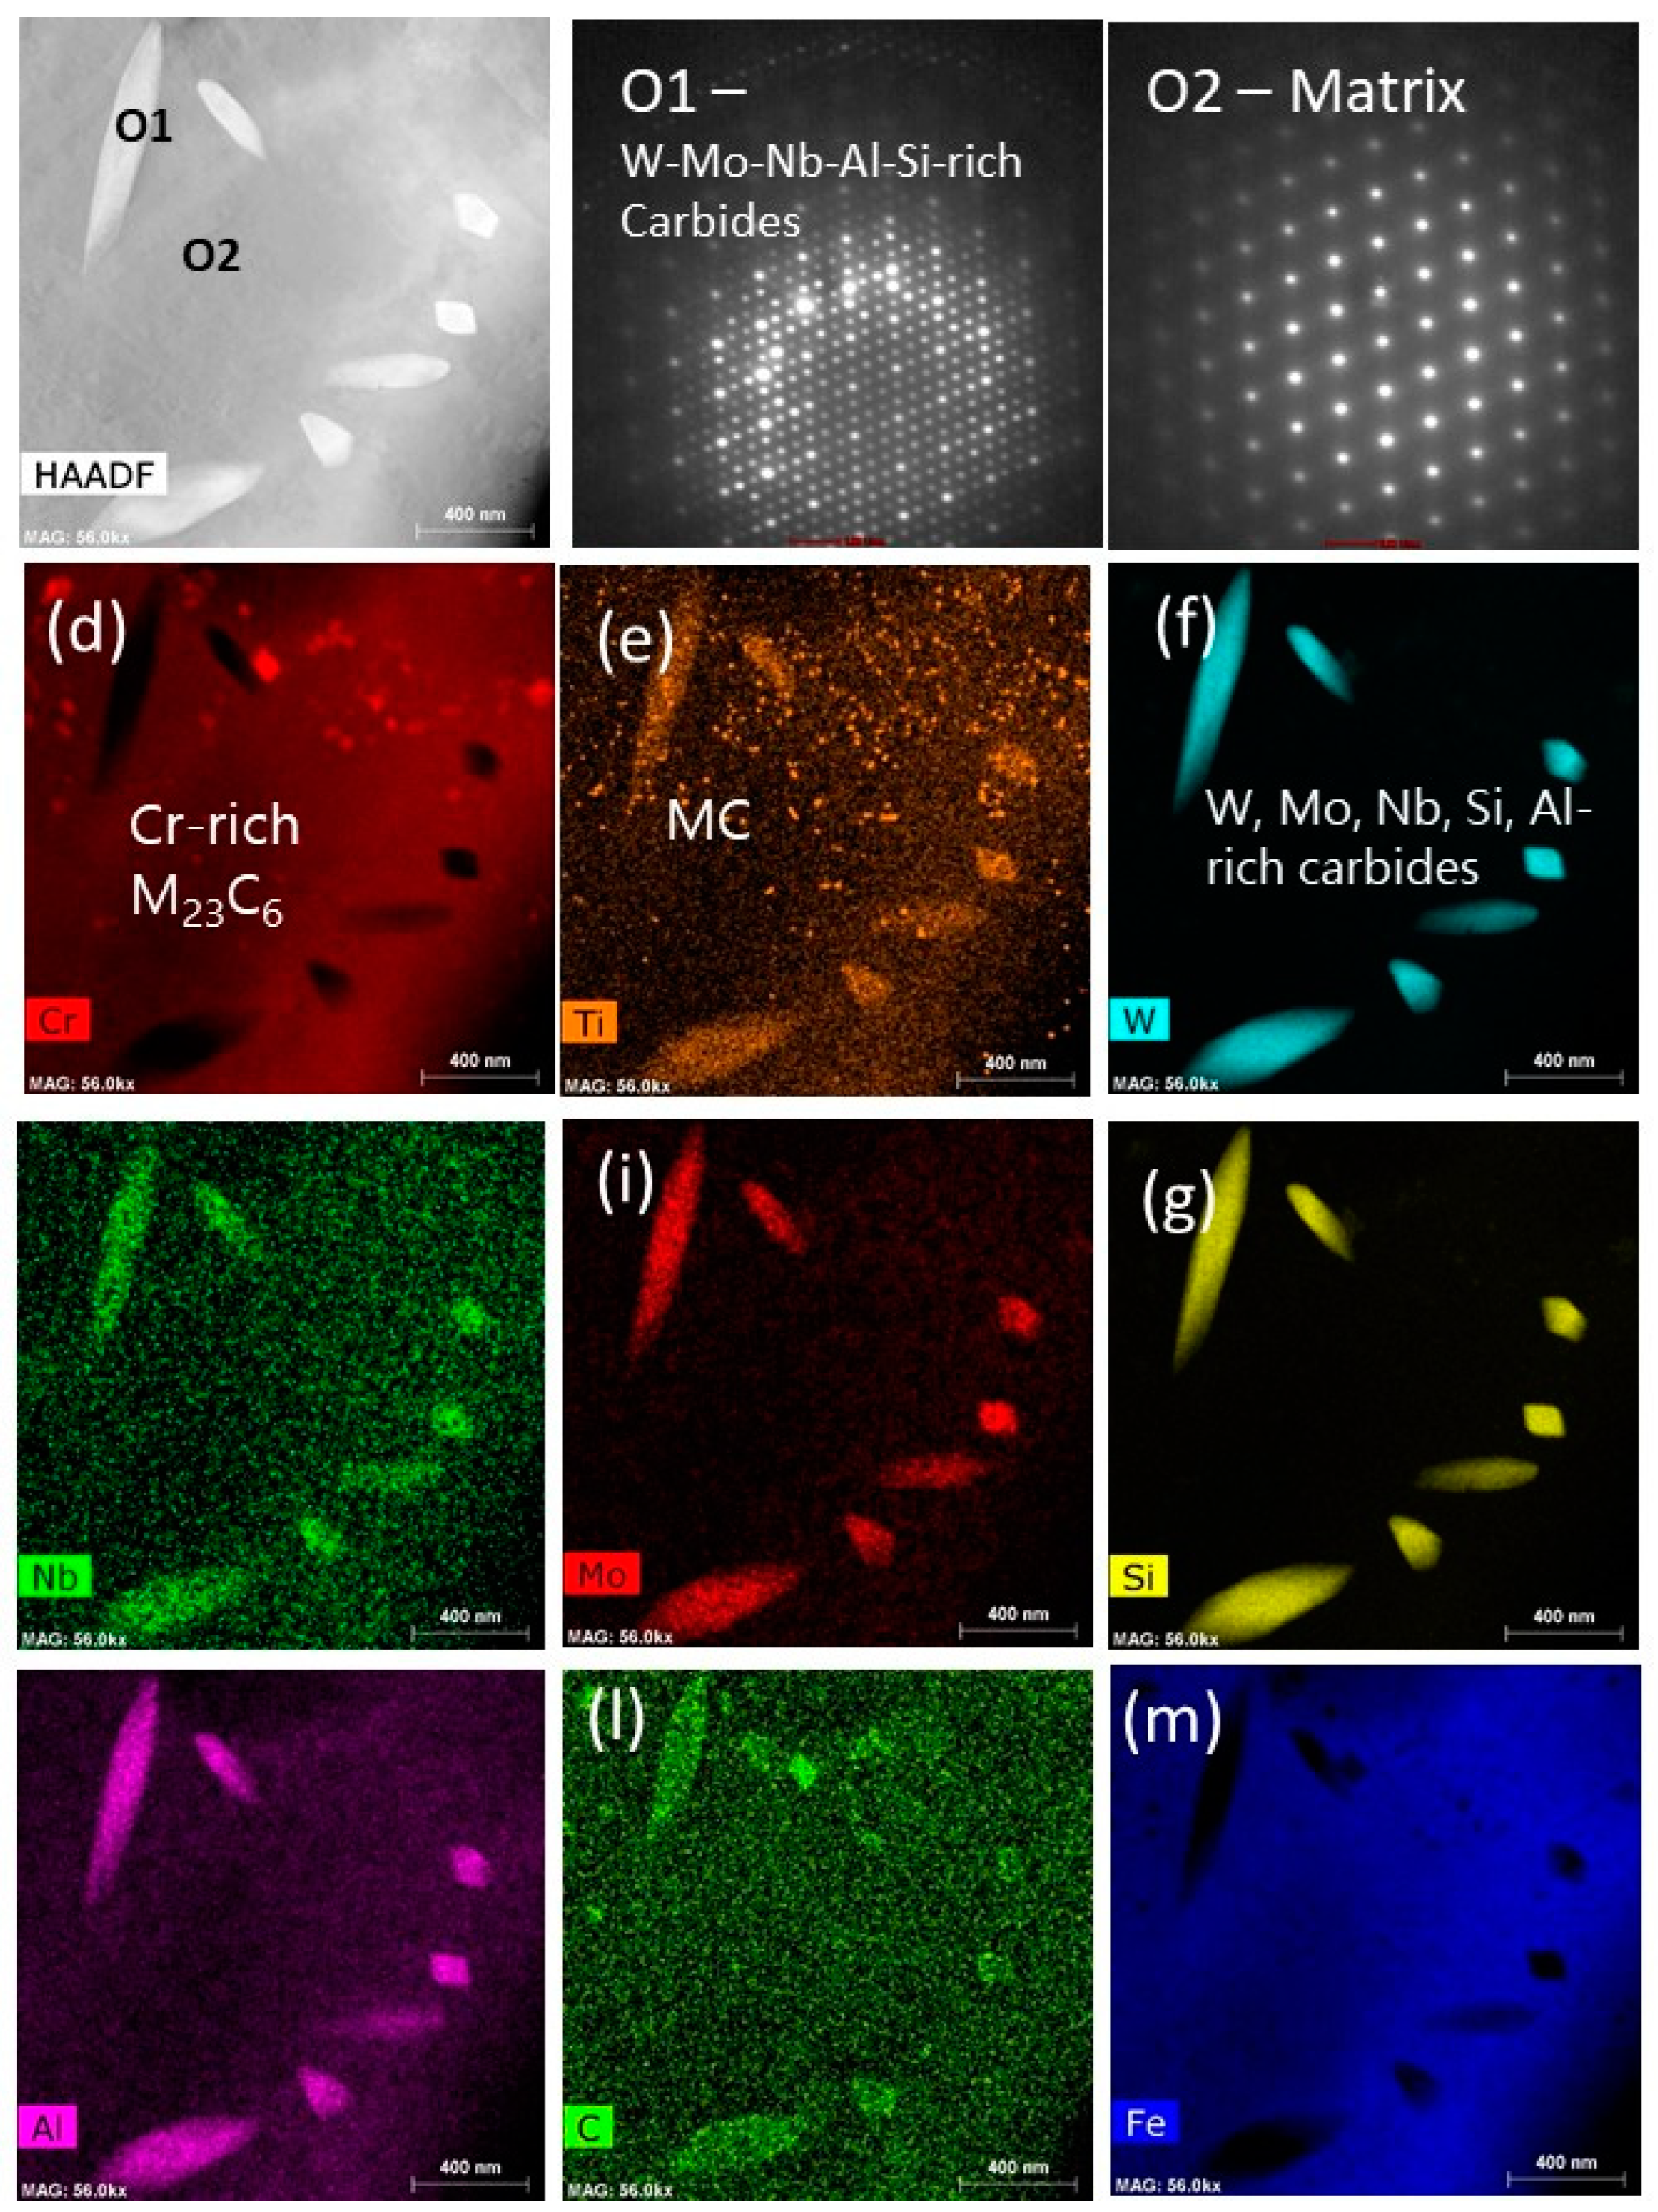
Figure 15.
TEM images showing the Ti(C, N) and M23C6 carbides in the HAZ adjacent to fusion boundary. (a) bright field (BF) image, (b) dark field (DF) image showing Ti(C,N) precipitates only, (c) DF image showing M23C6 only in the microstructure, and (d) diffraction pattern taken at [112] zone axis showing the reflections from Ti(C, N) and M23C6, which were used to taken the DFs in (b) and (c).
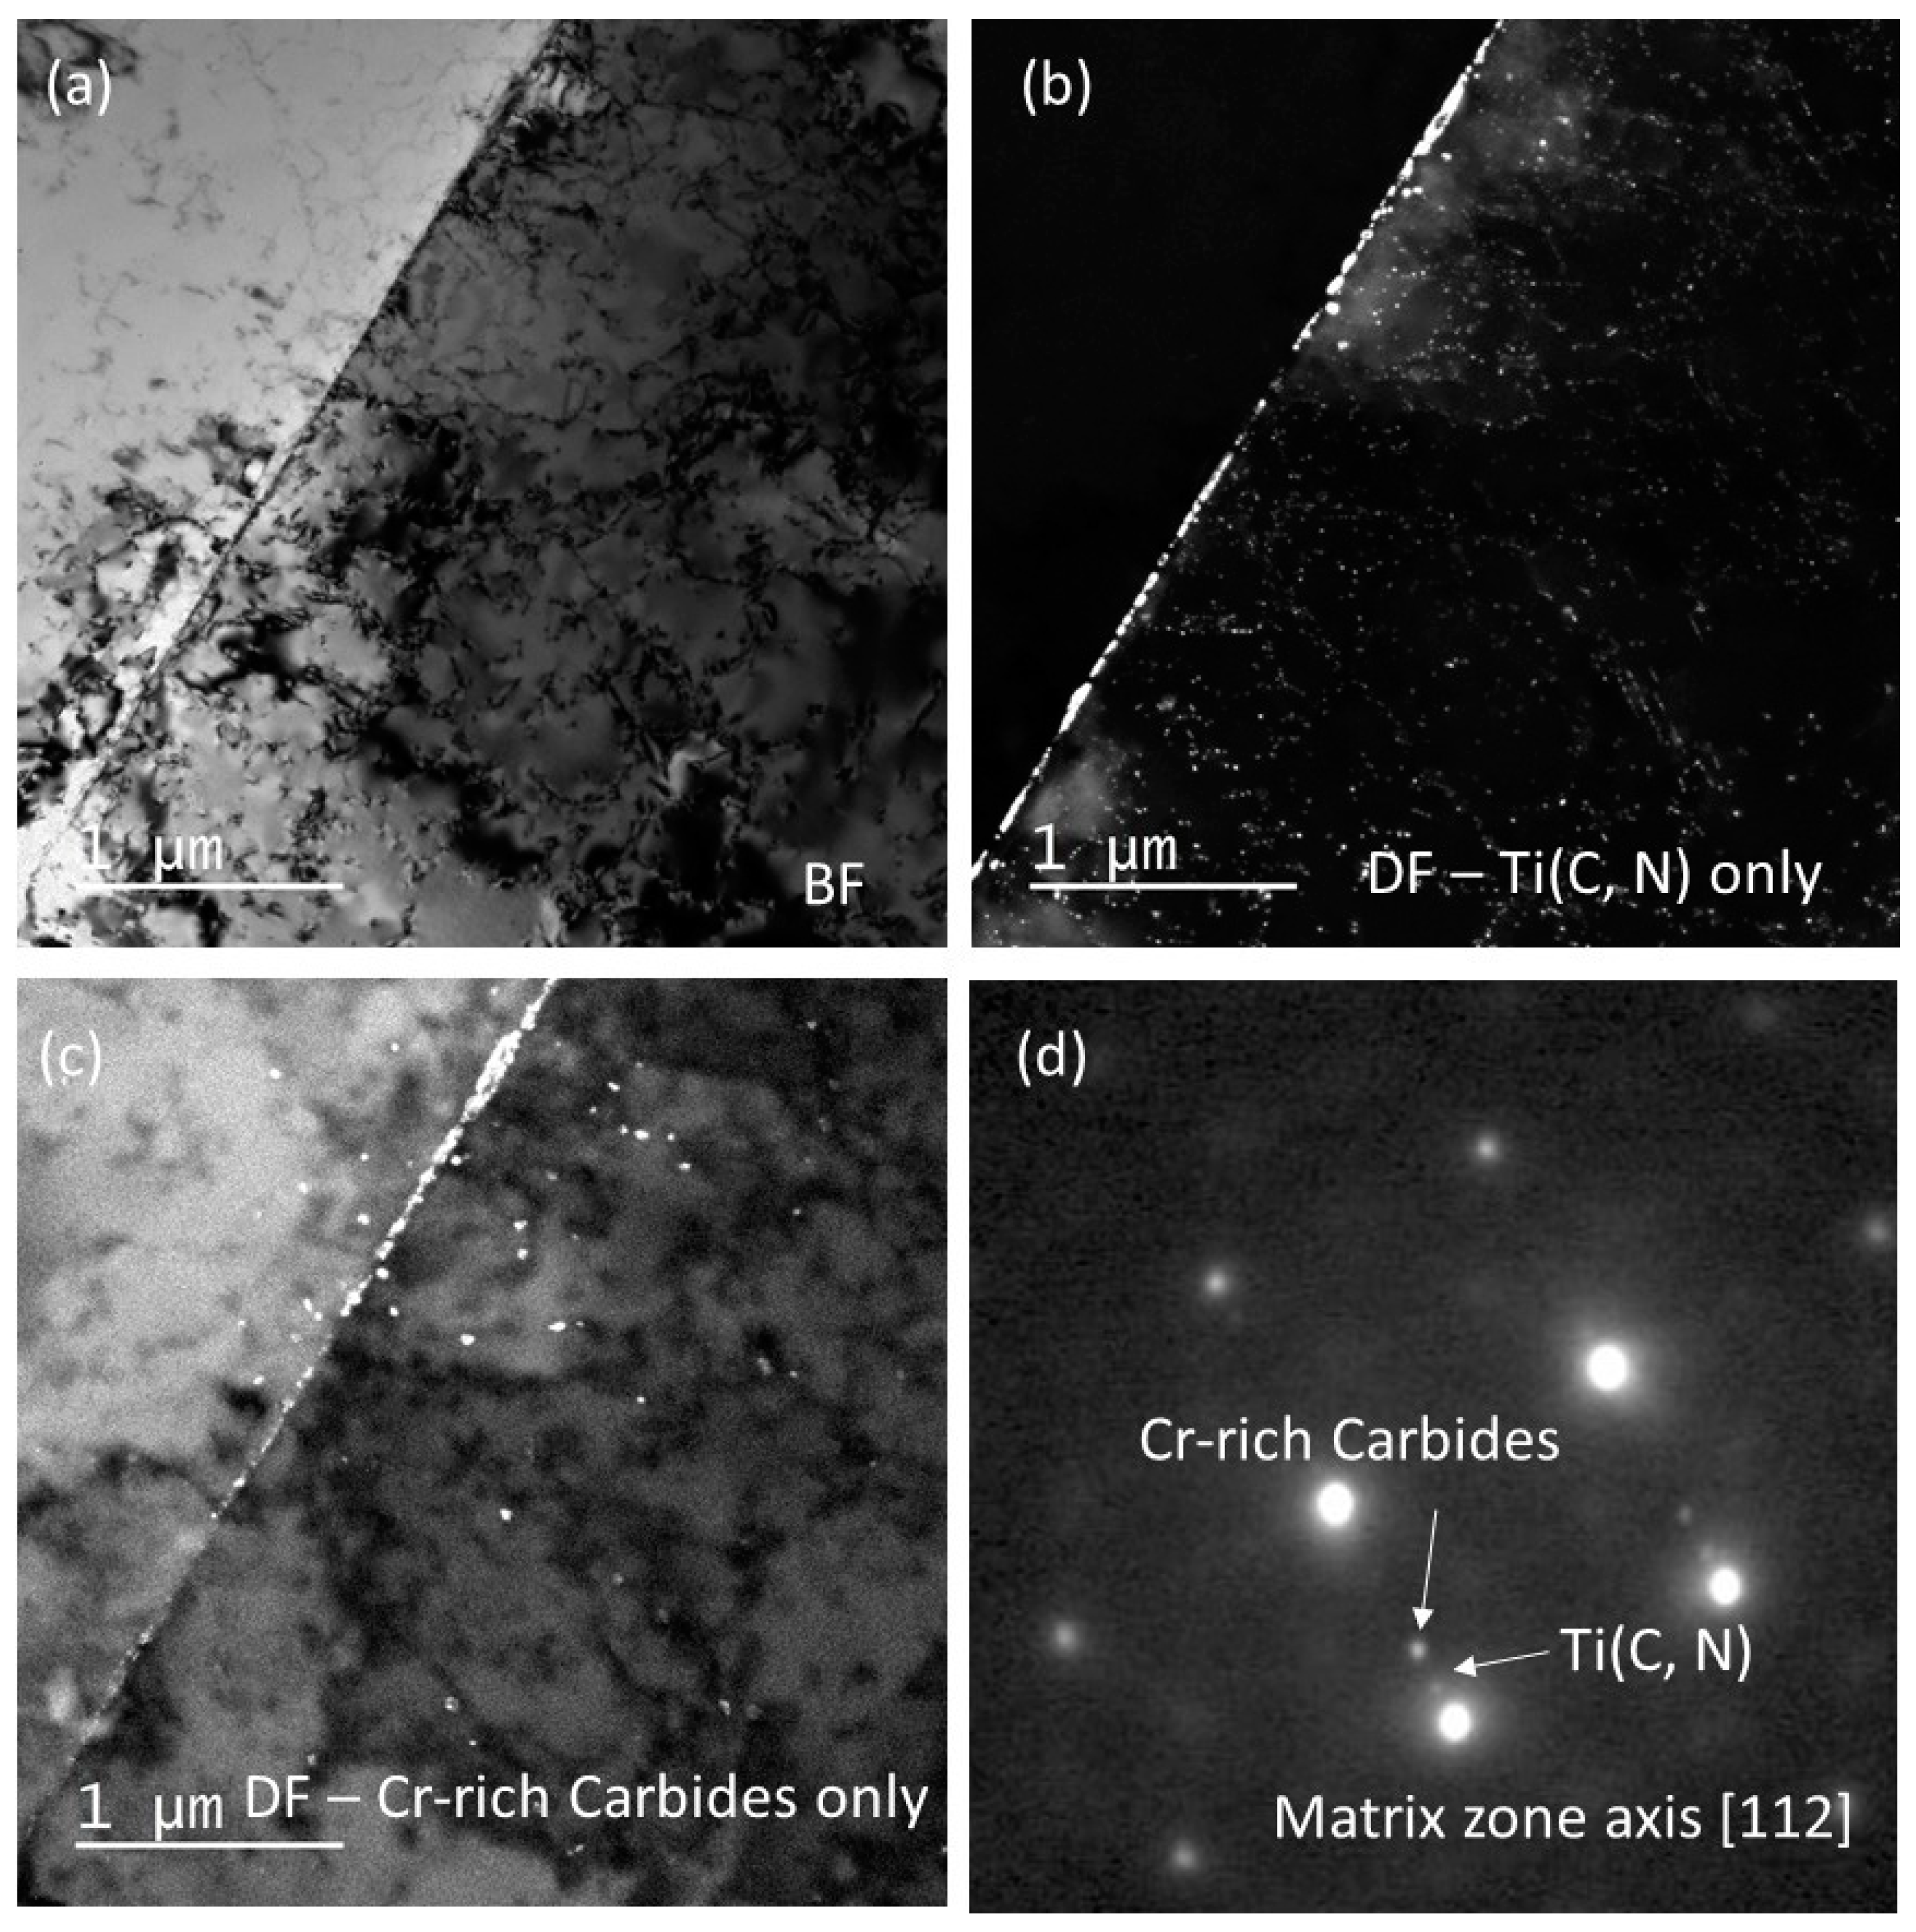
Figure 16.
TEM BF images showing the Orowan dislocation loops and the cross slips, taken at three different reflections (a) g=11, (b) g= 11 and g= 111.
Figure 16.
TEM BF images showing the Orowan dislocation loops and the cross slips, taken at three different reflections (a) g=11, (b) g= 11 and g= 111.
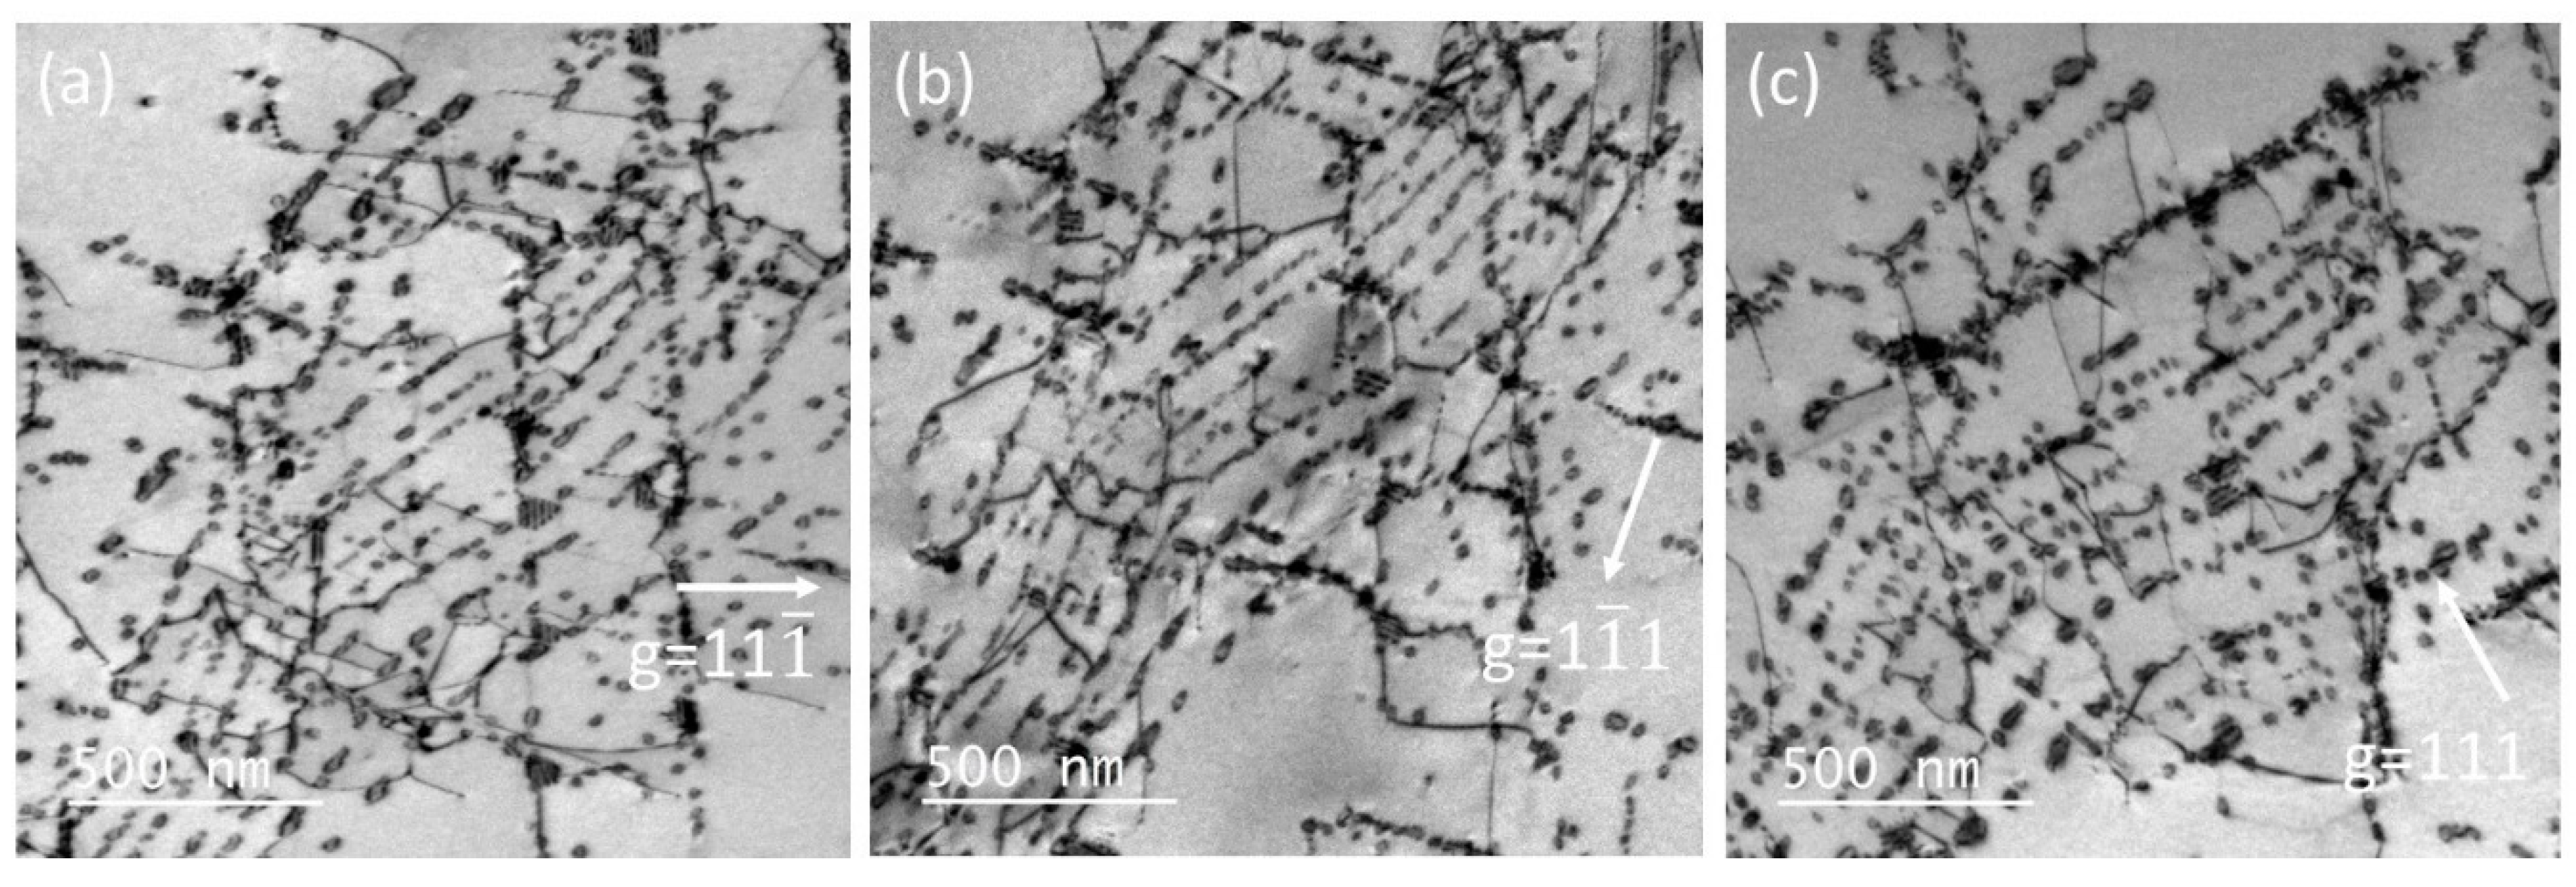
Figure 17.
TEM BF images of base metal in the necked region close to the fracture surface. (a) and (b) M23C6 near grain boundary, (c) M23C6 clusters with dislocation networks, and (d) small M23C6 containing Moiré fringes and Ti(C, N) precipitates with Oroman dislocation loops.
Figure 17.
TEM BF images of base metal in the necked region close to the fracture surface. (a) and (b) M23C6 near grain boundary, (c) M23C6 clusters with dislocation networks, and (d) small M23C6 containing Moiré fringes and Ti(C, N) precipitates with Oroman dislocation loops.
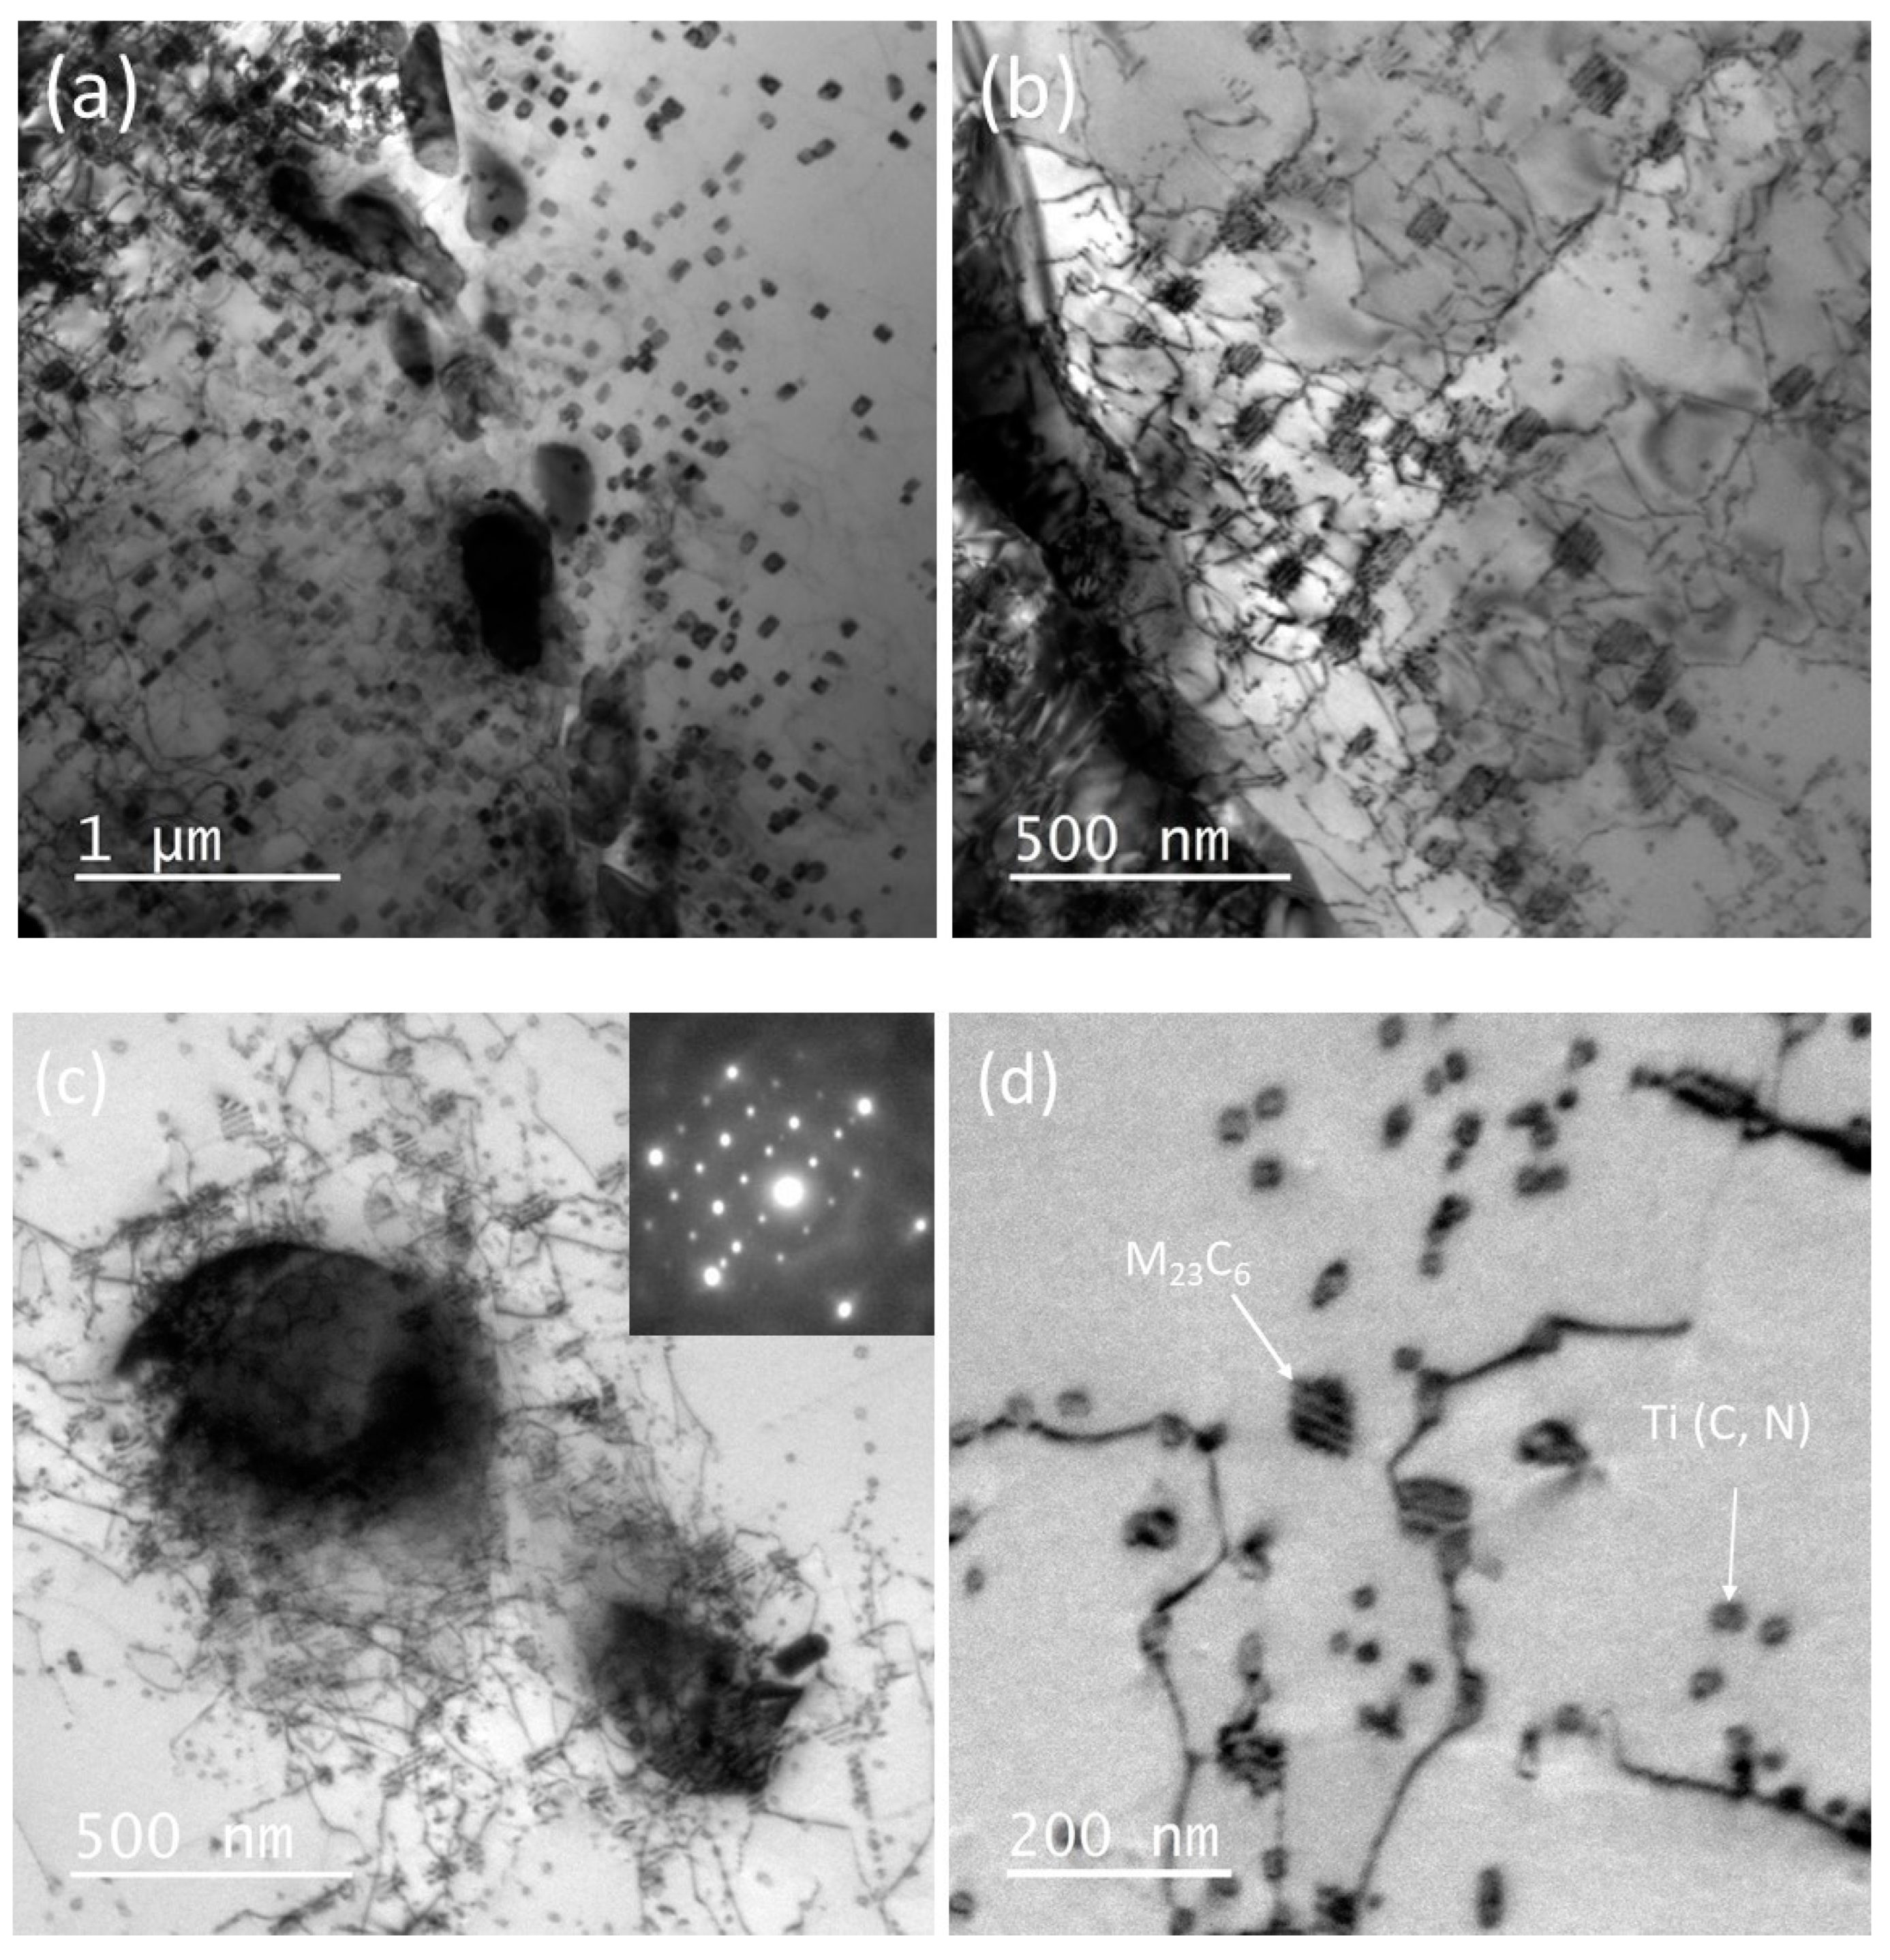
Figure 18.
TEM BF images in the un-deformed region.
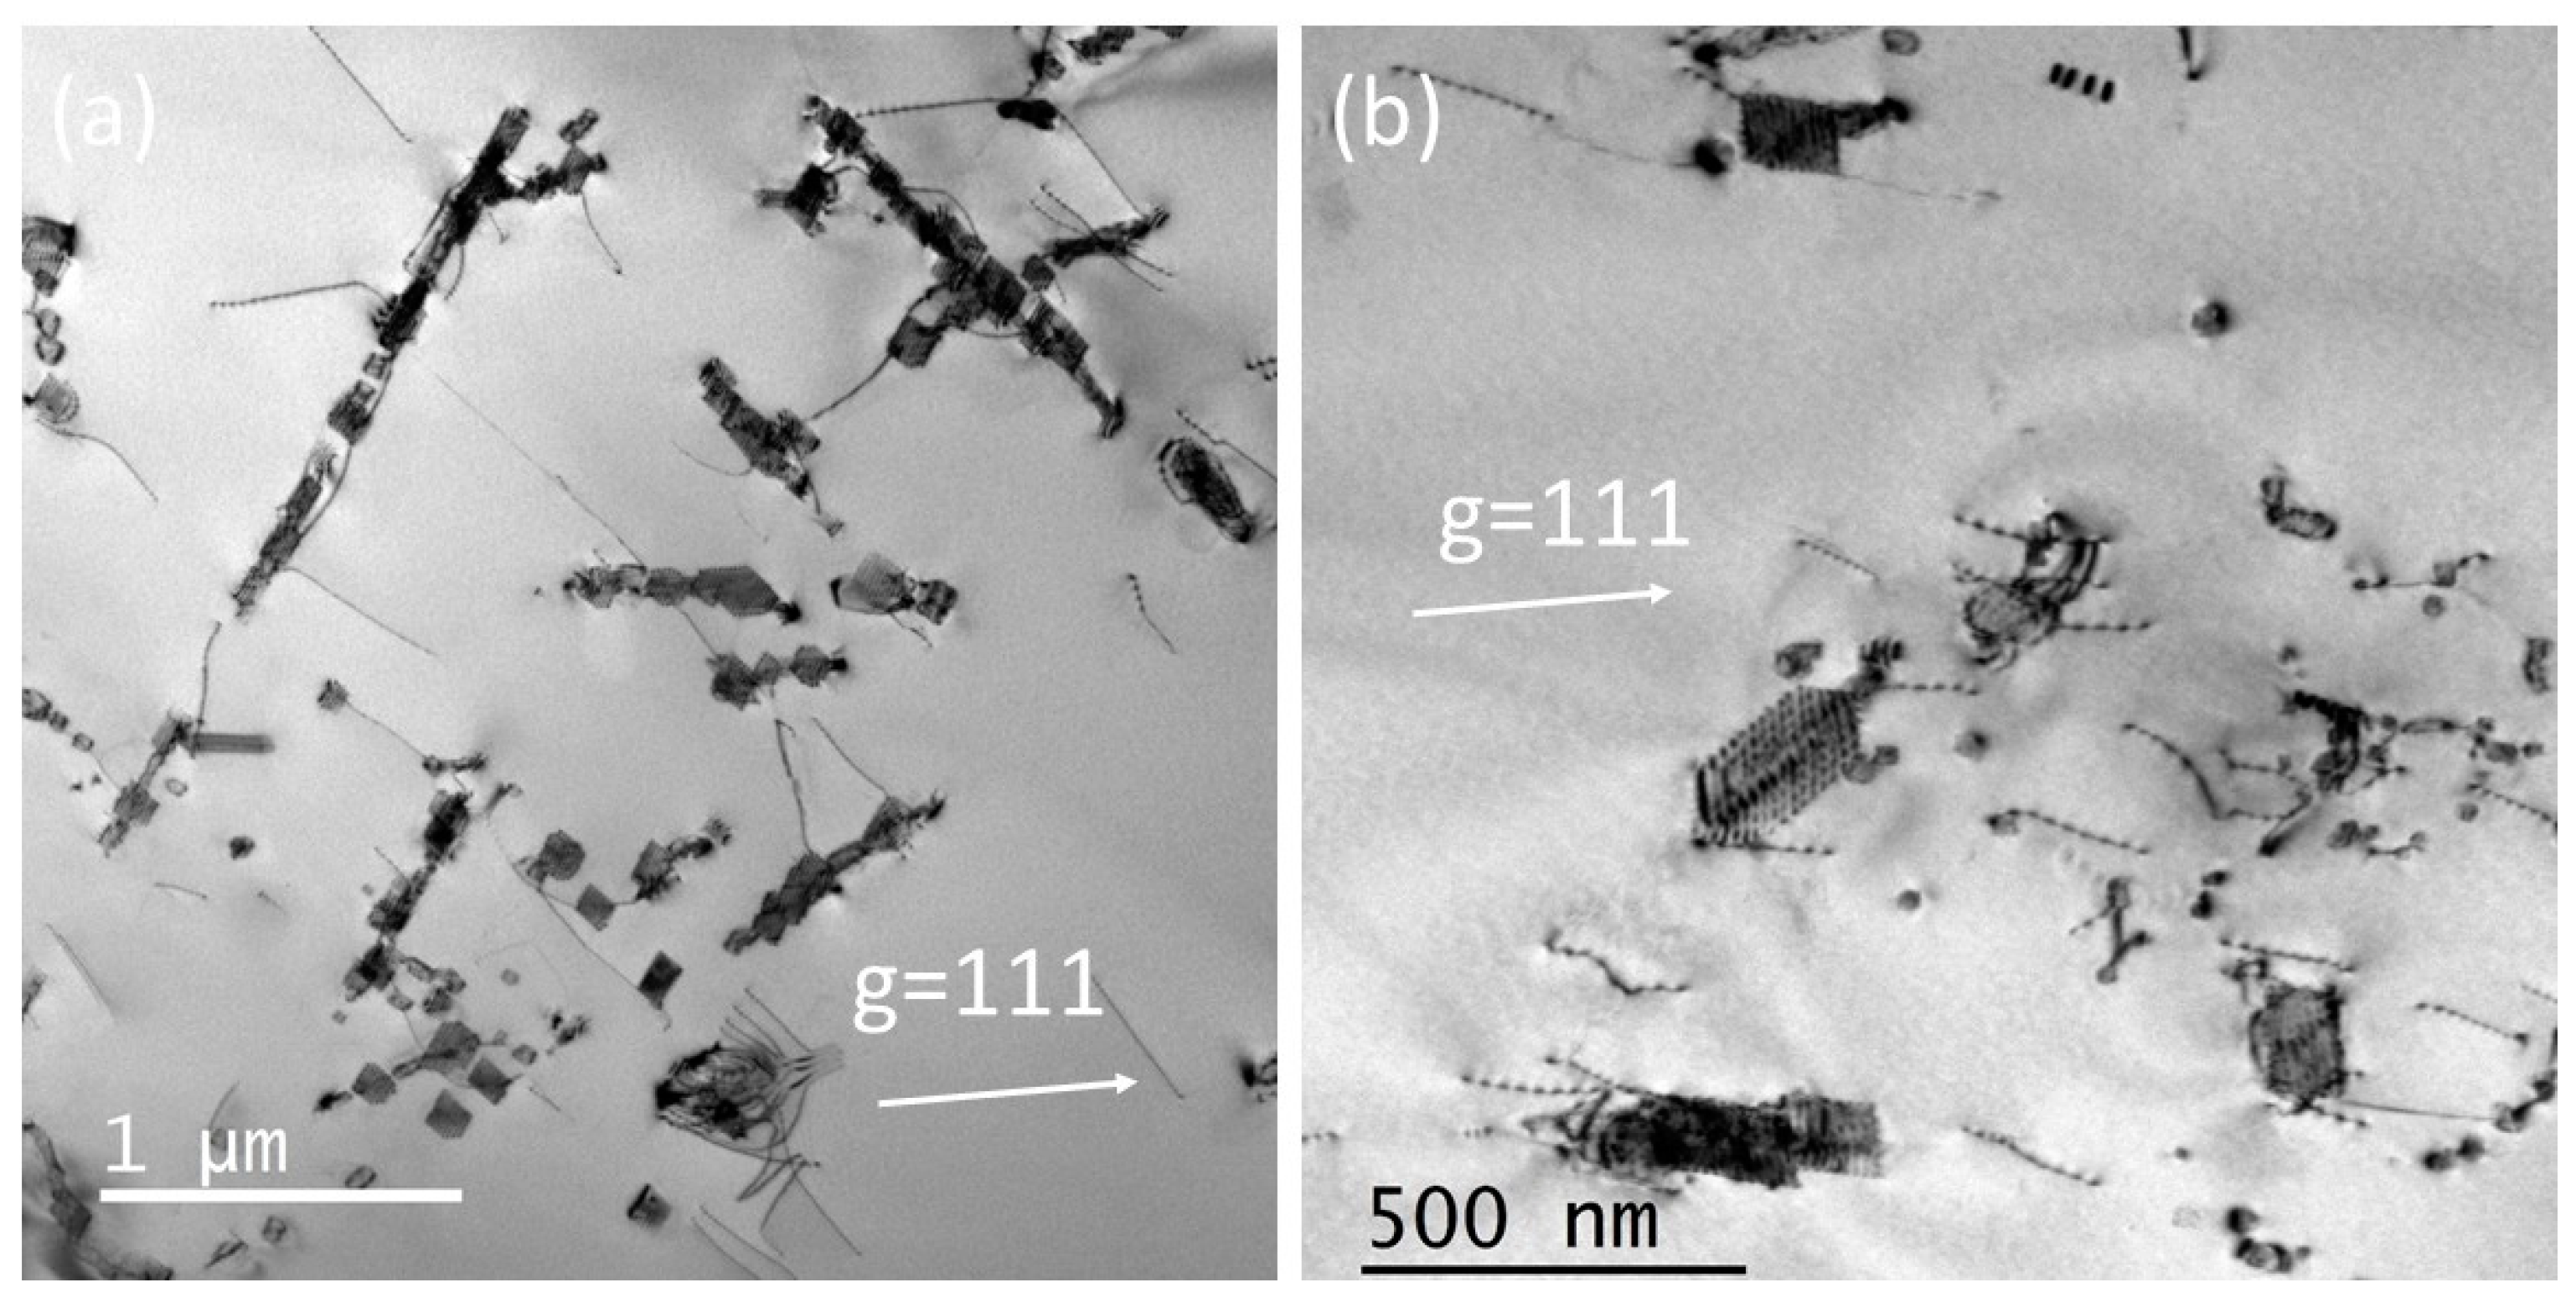
Figure 19.
SEM micrographs of fracture surface for Incoloy 800H BM specimen. The arrows in (c) indicate a secondary crack.
Figure 19.
SEM micrographs of fracture surface for Incoloy 800H BM specimen. The arrows in (c) indicate a secondary crack.
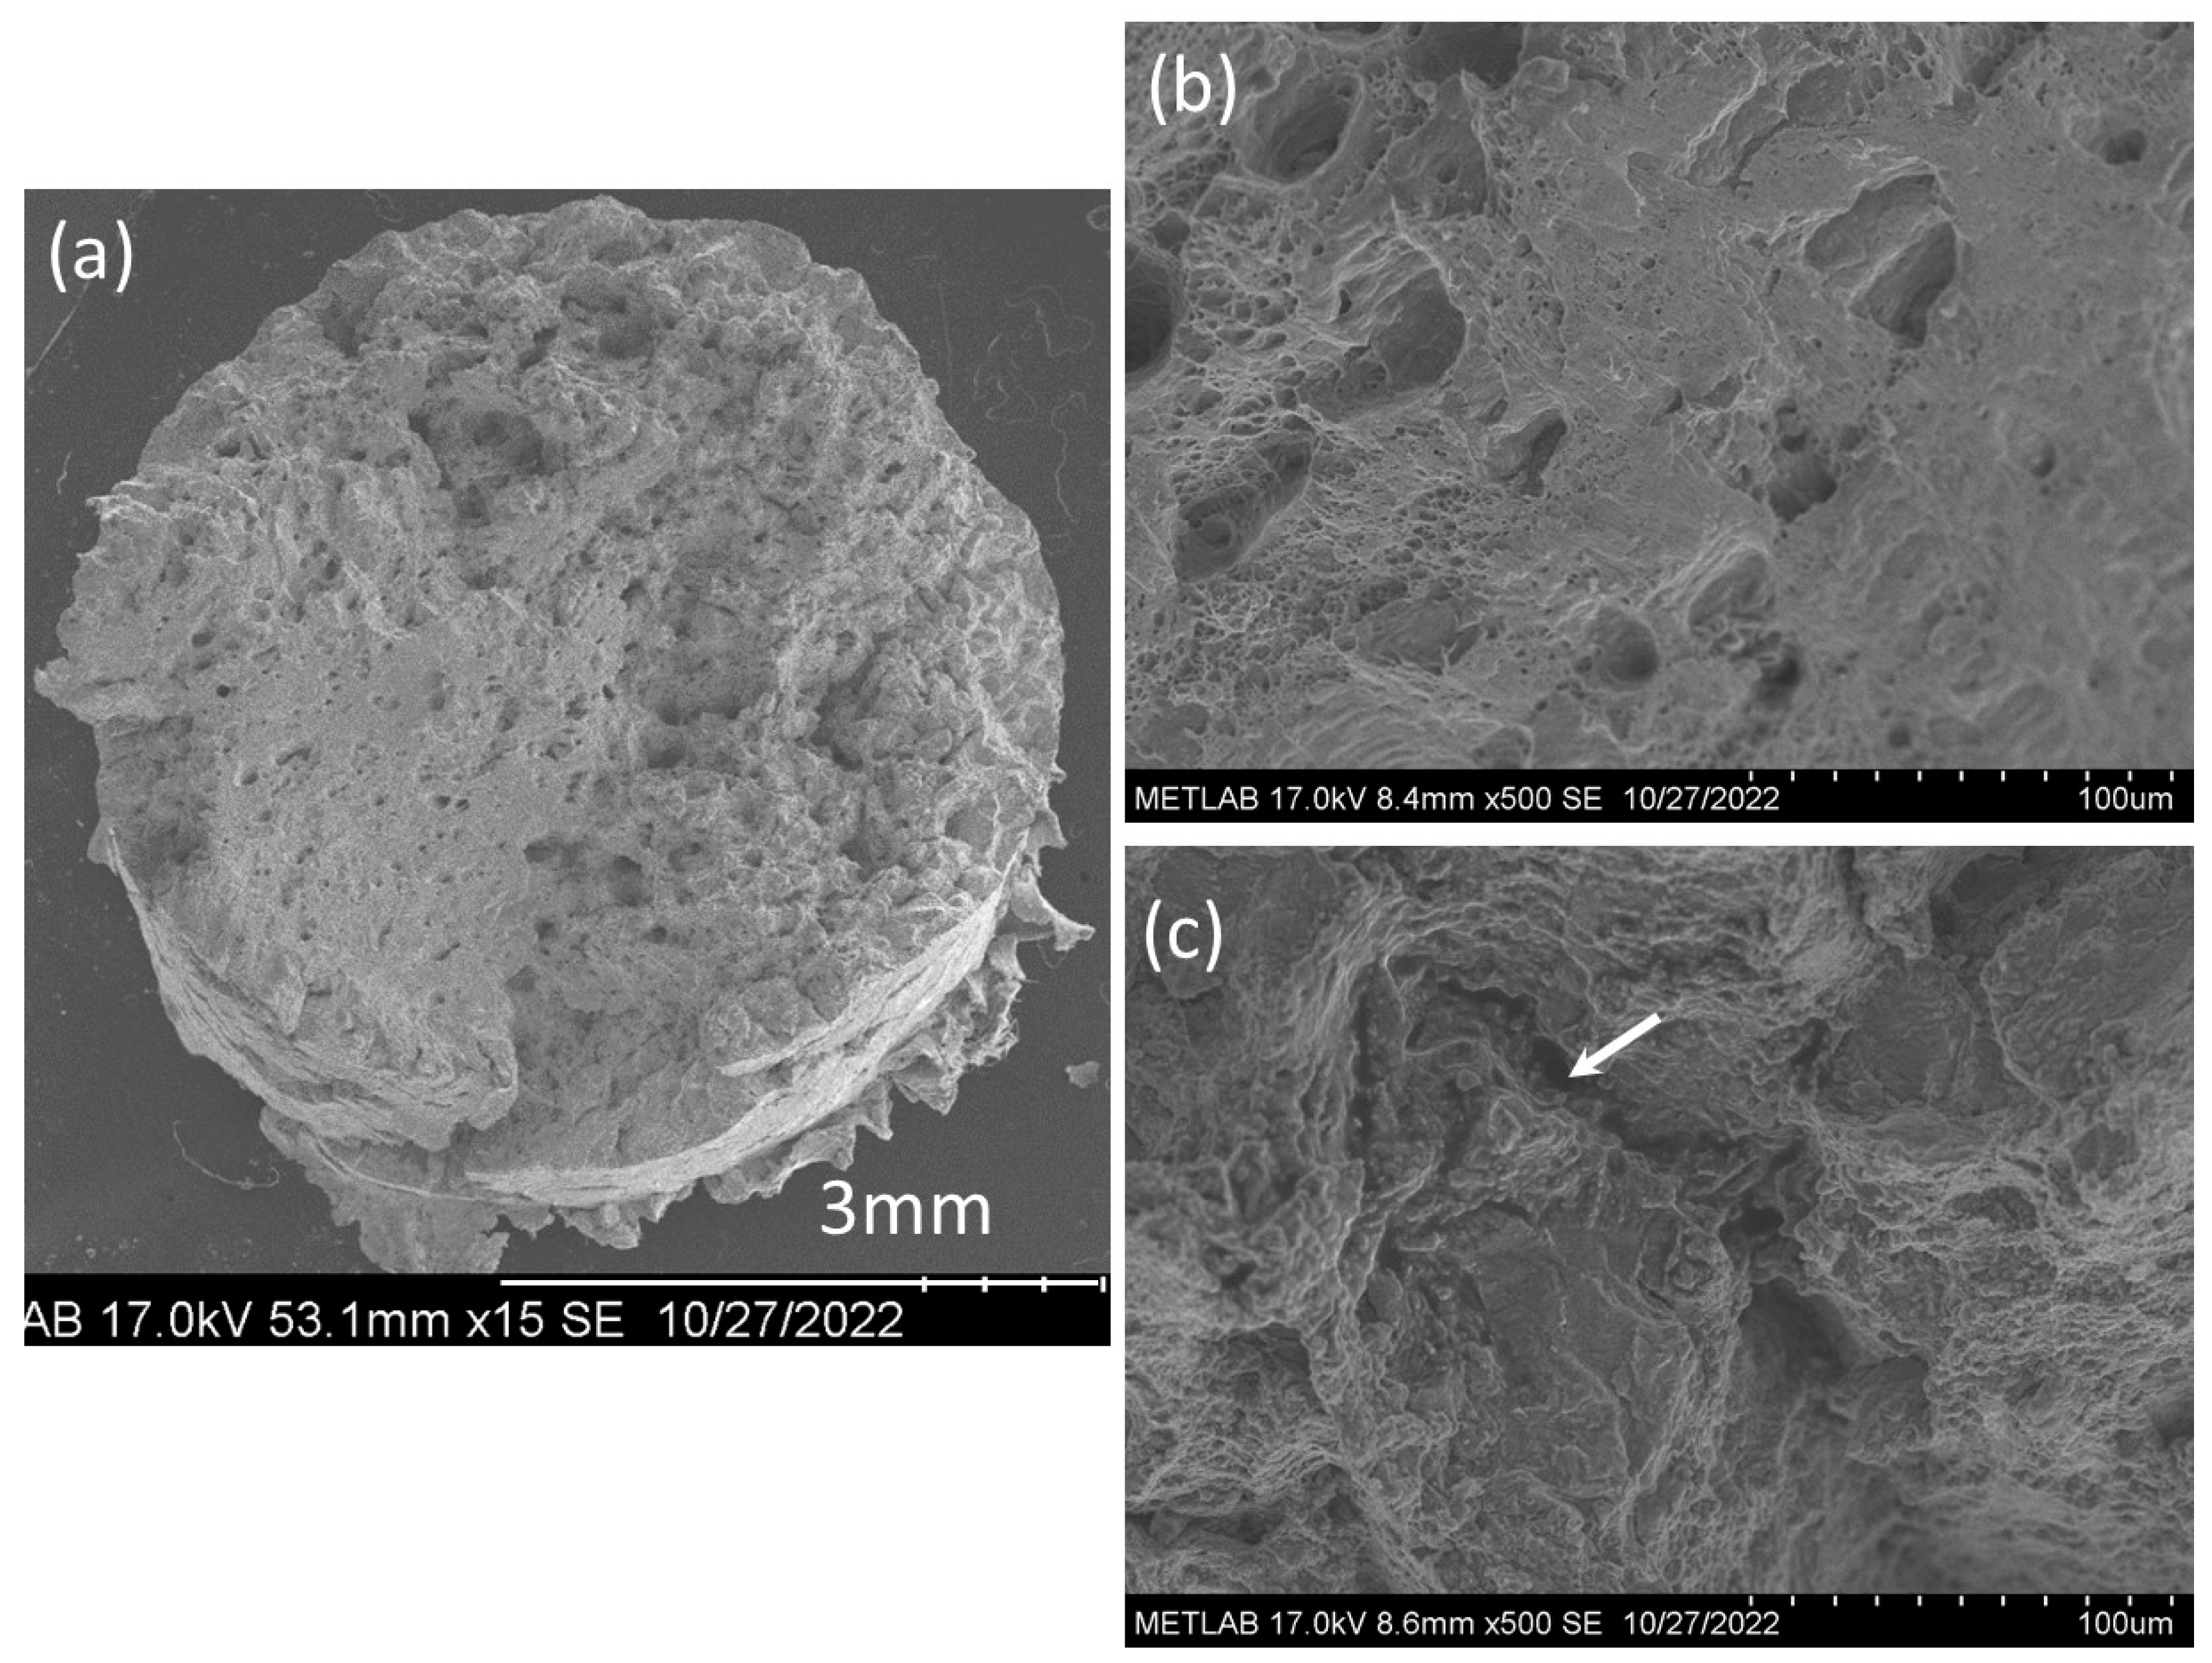
Figure 20.
SEM micrographs of fracture surface for the WM specimen with the Inconel 625 filler material. The arrows in (c) indicate the intergranular cracks.
Figure 20.
SEM micrographs of fracture surface for the WM specimen with the Inconel 625 filler material. The arrows in (c) indicate the intergranular cracks.
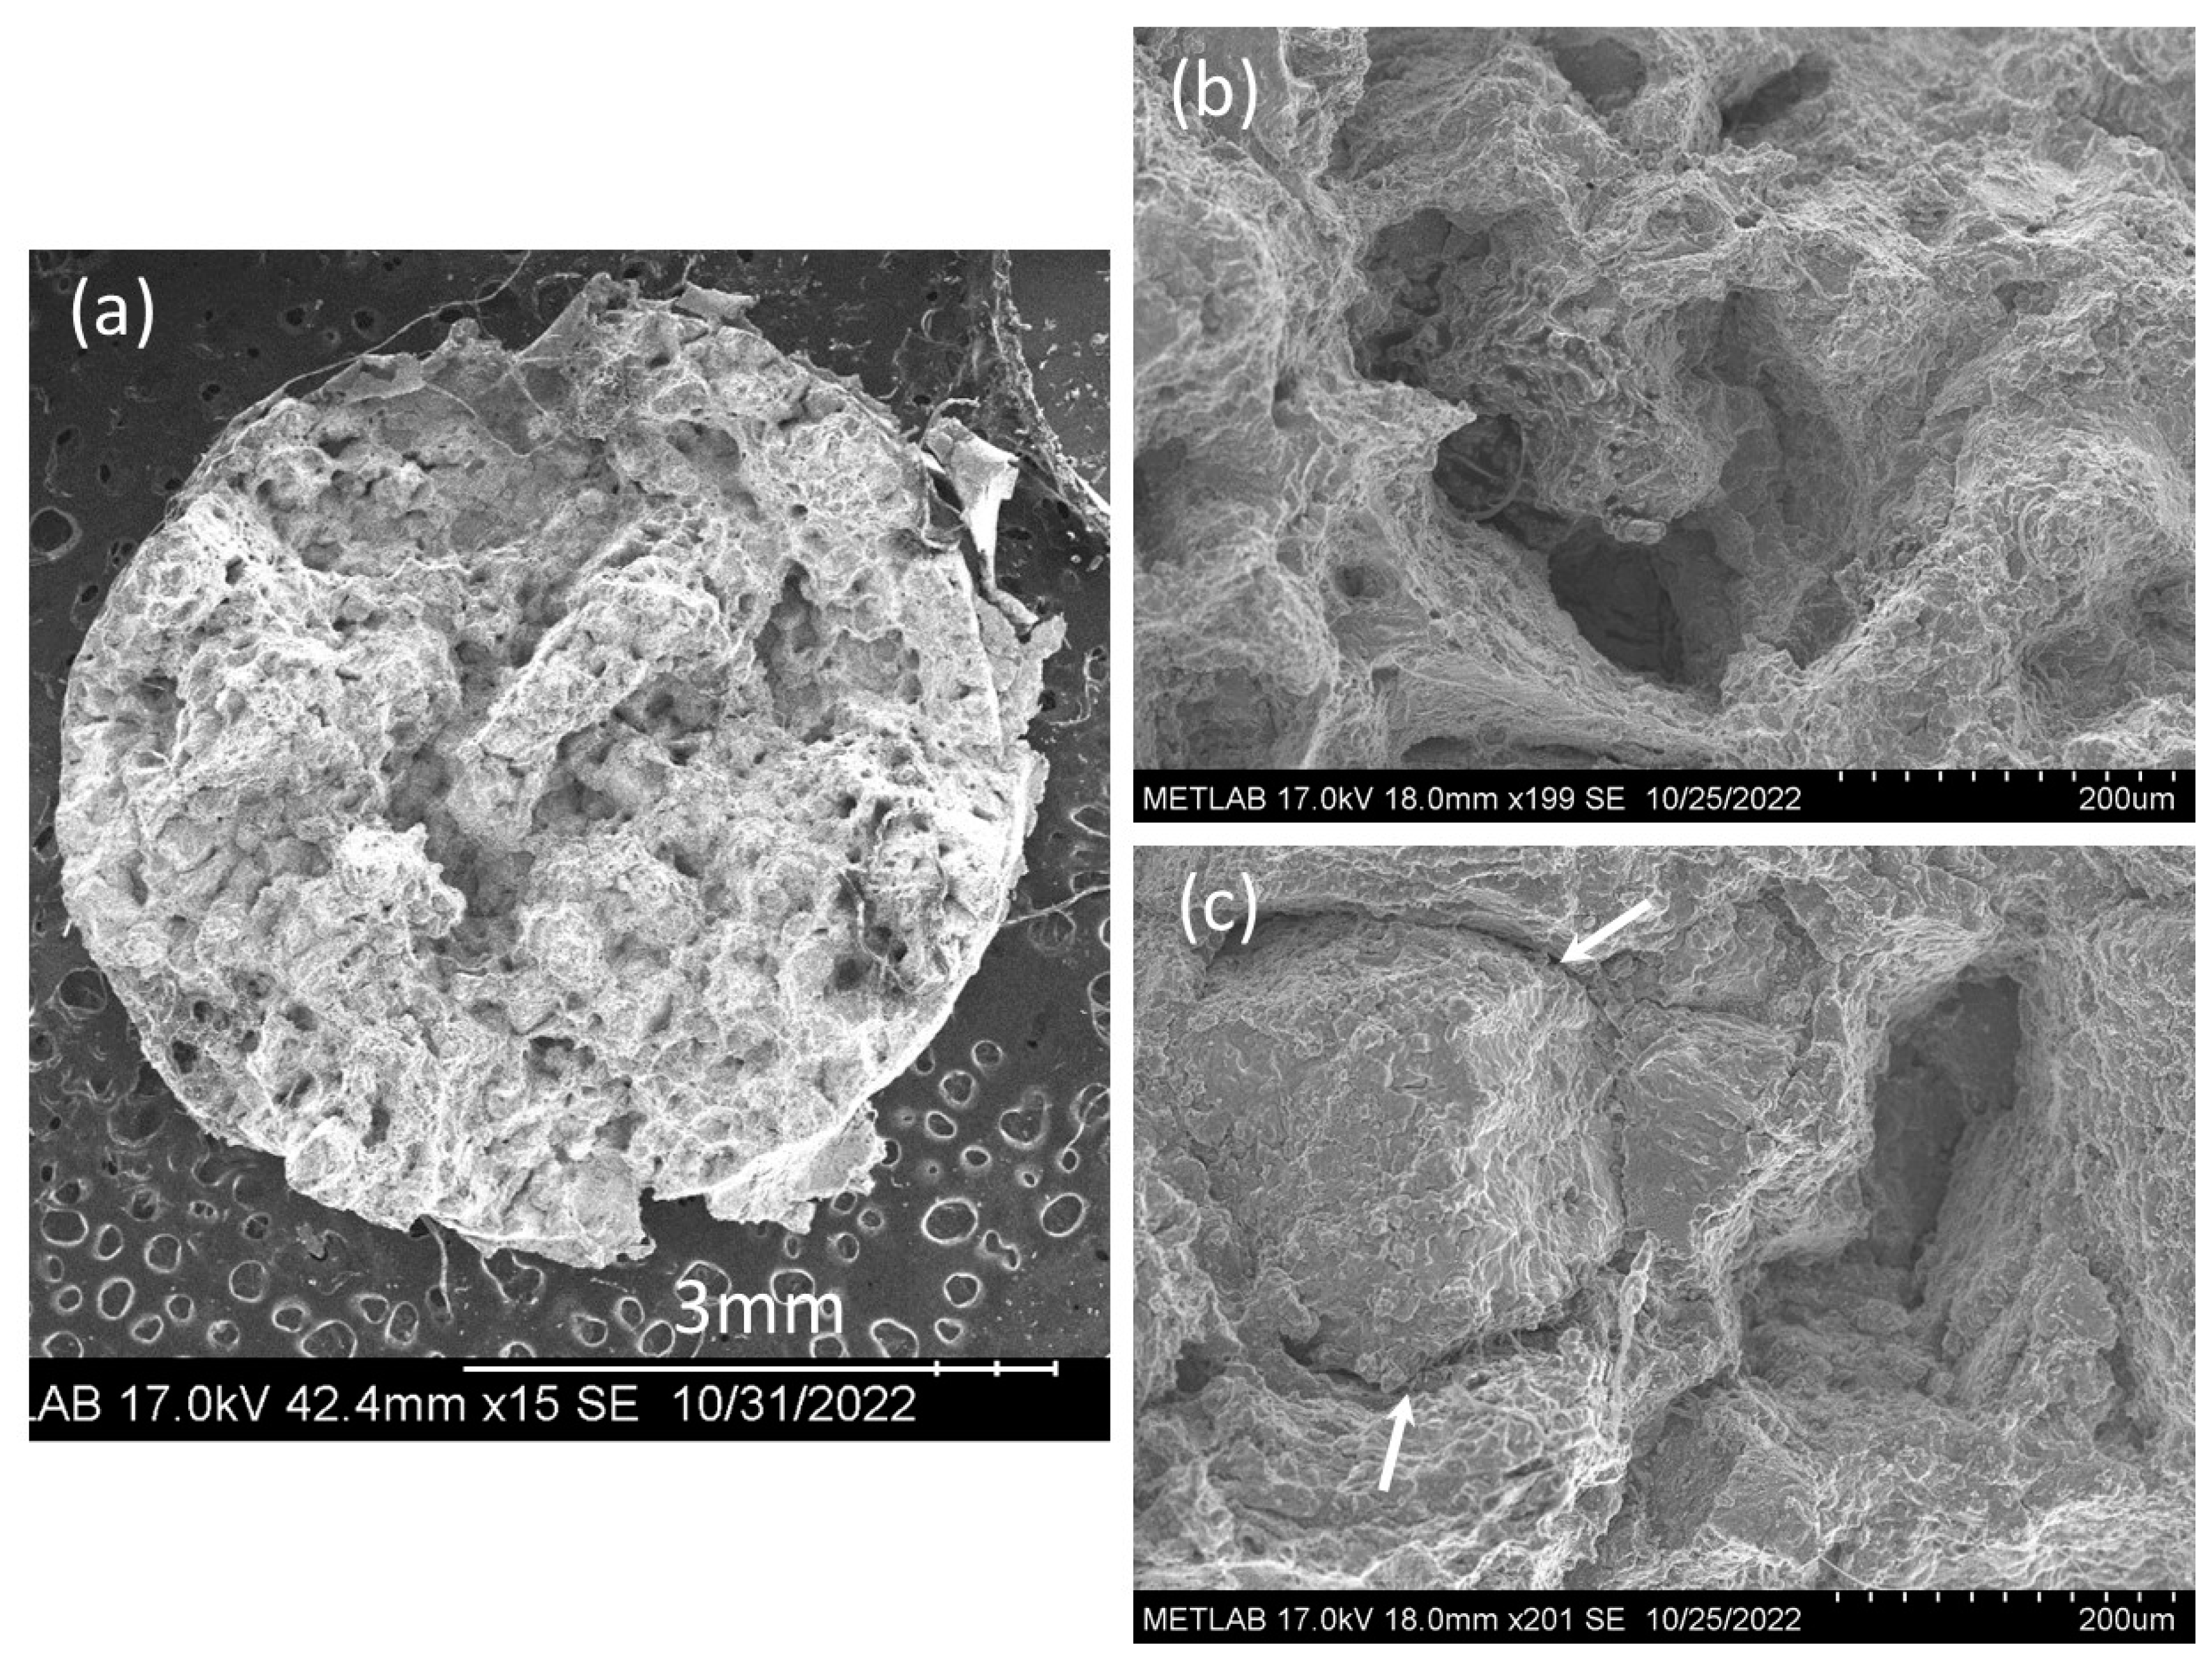
Figure 21.
SEM micrographs of fracture surface for the WM specimen with the Haynes 230 filler material. The arrow in (c) indicate an intergranular crack.
Figure 21.
SEM micrographs of fracture surface for the WM specimen with the Haynes 230 filler material. The arrow in (c) indicate an intergranular crack.
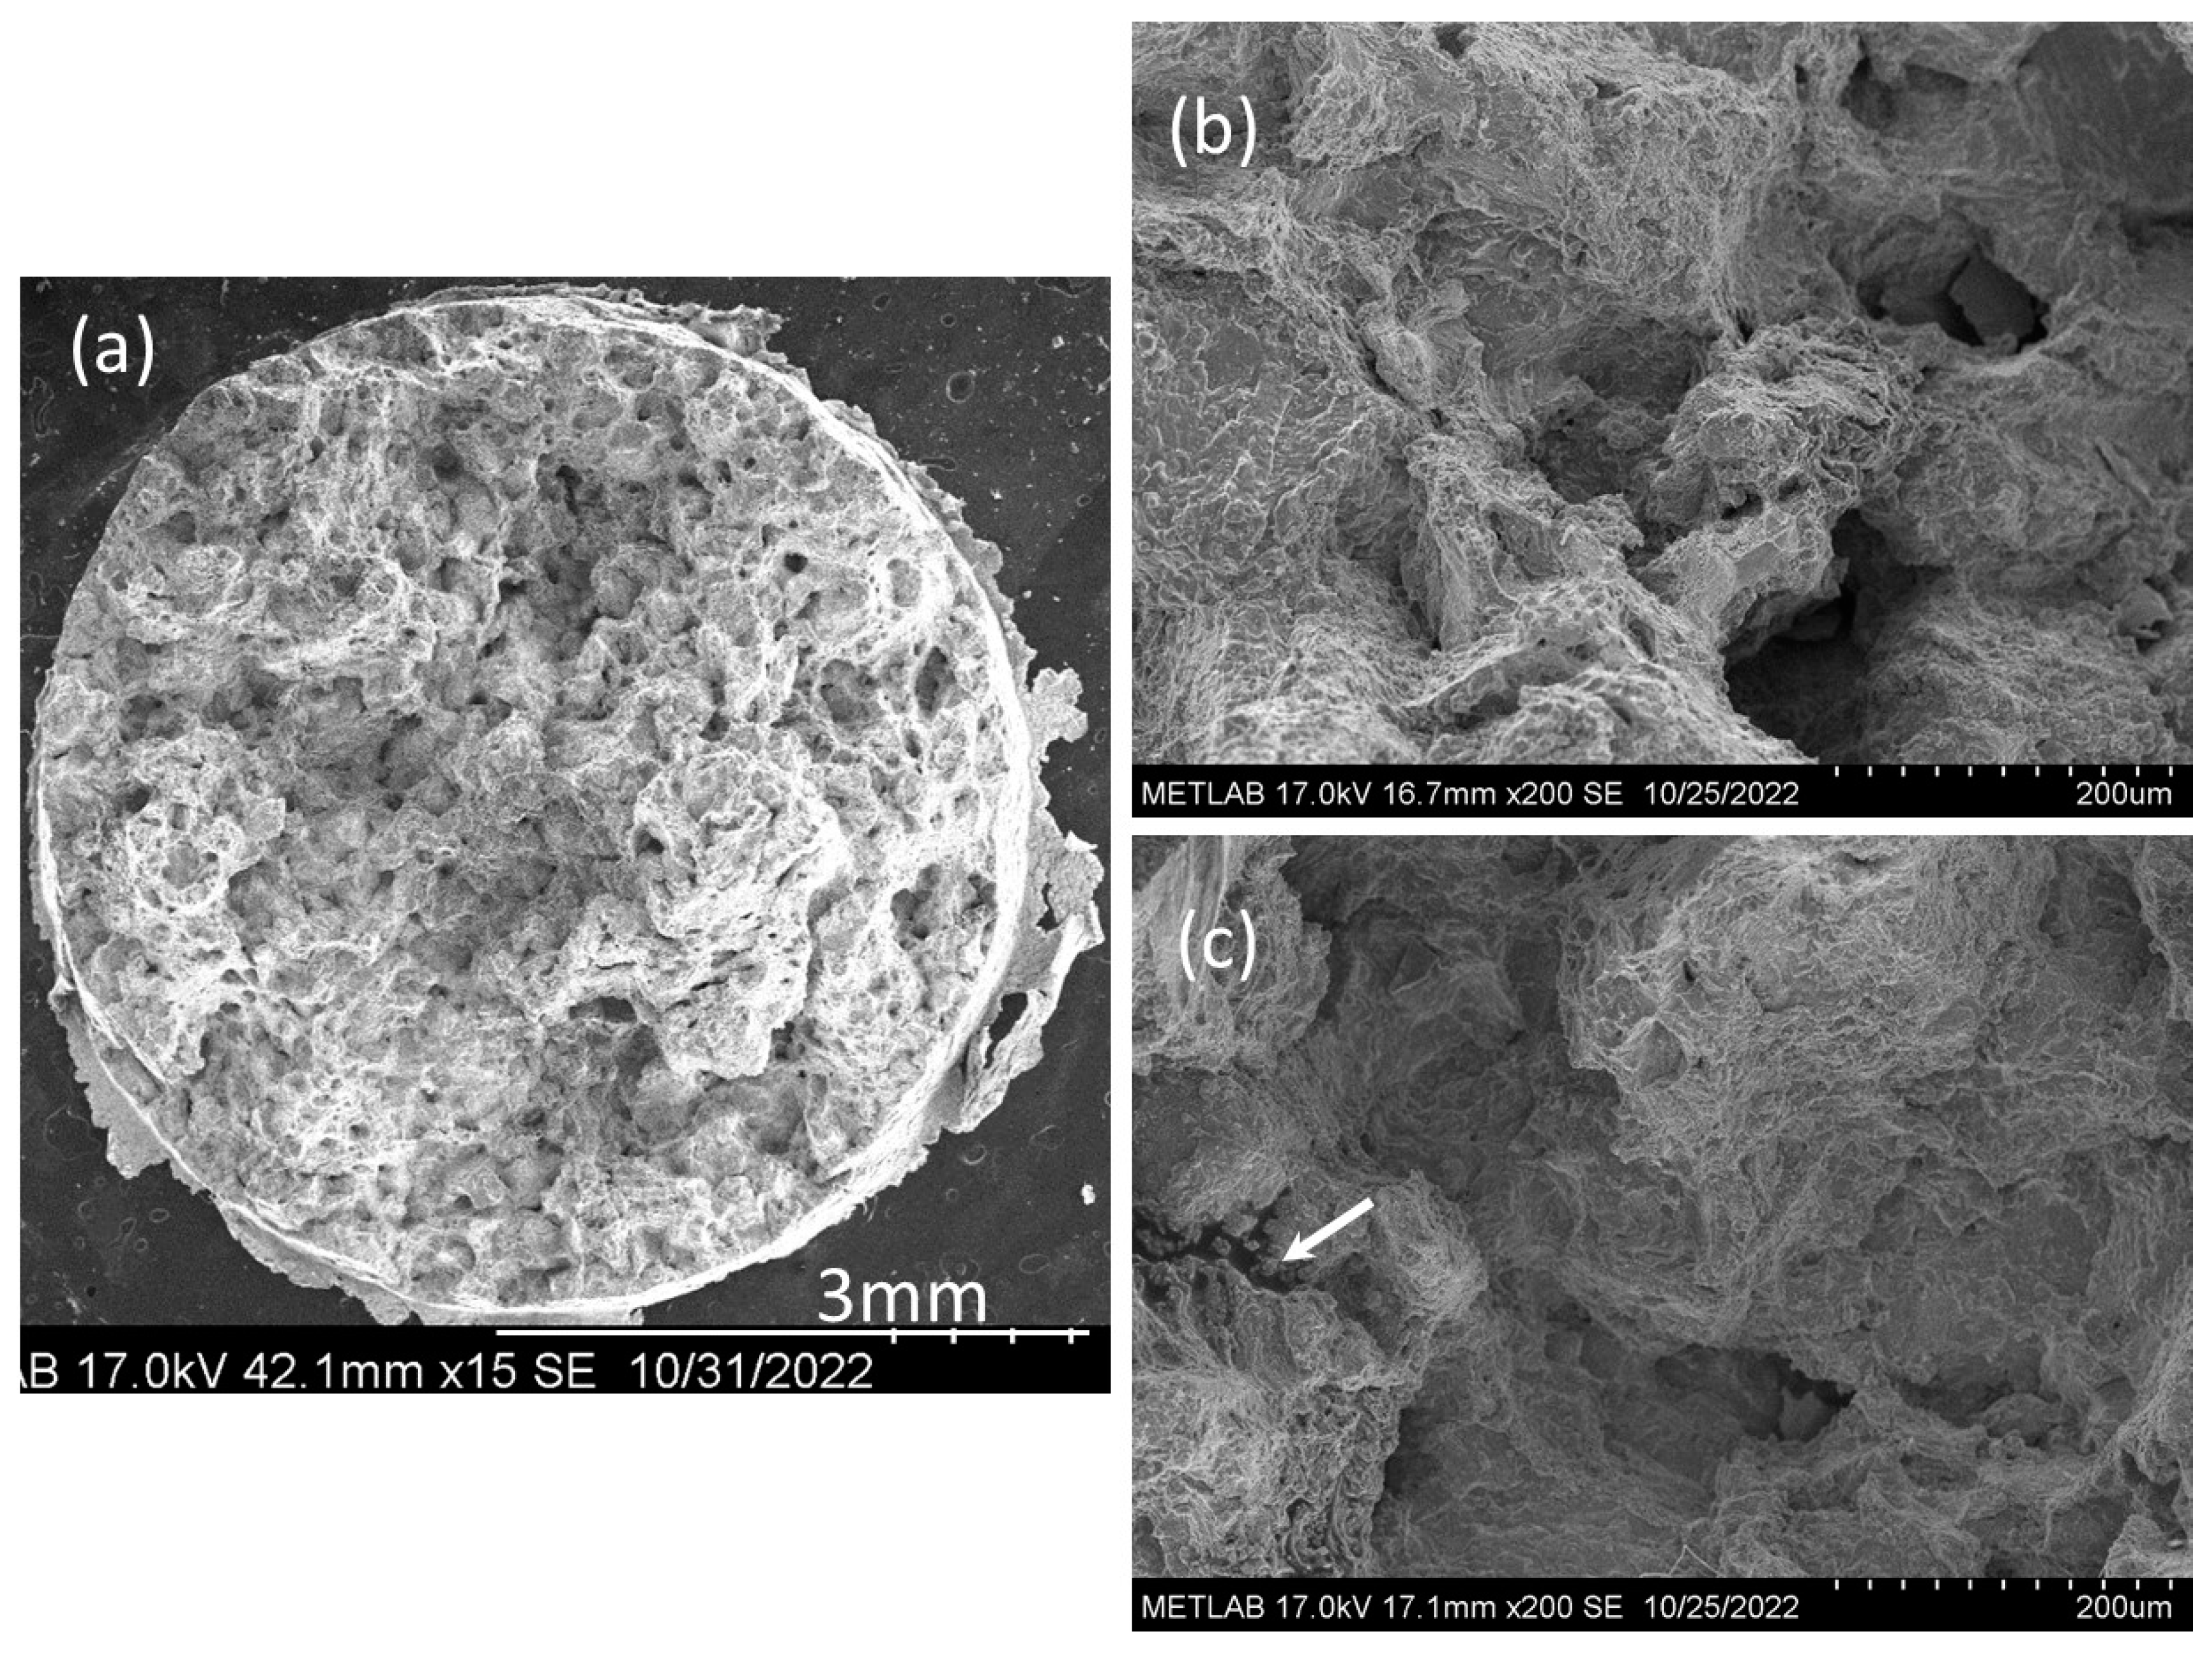

Table 1.
Chemical composition of as-received (AR) Alloy 800H, and nominal chemical compositions of Inconel 625 and Haynes 230 filler material (wt.%) [13,14].
| Element | Fe | Ni | Cr | Mo | Nb | Co | Mn | C | Al | Ti | Si | B | W |
|---|---|---|---|---|---|---|---|---|---|---|---|---|---|
| AR Alloy 800H | 45.6 | 30.3 | 20.6 | 0.7 | - | 0.05 | 0.7 | 0.08 | 0.49 | 0.52 | 0.4 | - | - |
| Inconel 625 | <5.0 | >58.0 | 20.0~23.0 | 8.0~10.0 | 3.15~4.15 | <1.00 | <0.50 | <0.10 | <0.40 | <0.40 | <0.50 | - | - |
| Haynes 230 | <3.0 | 57.0 Bal | 22.0 | 2.0 | <0.50 | <5.00 | 0.50 | 0.10 | 0.30 | <0.10 | 0.40 | <0.015 | 14.0 |
Table 2.
Creep strain parameters of Alloy 800H and the weldments at 760 oC and 80 MPa.
| Material | Minimum strain rate (h-1) |
Stain at Rupture (%) |
Time to tertiary stage(hours), Tt | Time to Rupture (hours), TR |
|---|---|---|---|---|
| Incoloy 800H BM | 10-4 | 44.96 | 60 | 467 |
| Weldment with Inconel 625 FM | 10-5 | 9.66 | 320 | 1091 |
| Weldment with Haynes 230 FM | 10-5 | 10.51 | 456 | 1643 |
Disclaimer/Publisher’s Note: The statements, opinions and data contained in all publications are solely those of the individual author(s) and contributor(s) and not of MDPI and/or the editor(s). MDPI and/or the editor(s) disclaim responsibility for any injury to people or property resulting from any ideas, methods, instructions or products referred to in the content. |
© 2024 by the authors. Licensee MDPI, Basel, Switzerland. This article is an open access article distributed under the terms and conditions of the Creative Commons Attribution (CC BY) license (https://creativecommons.org/licenses/by/4.0/).
Copyright: This open access article is published under a Creative Commons CC BY 4.0 license, which permit the free download, distribution, and reuse, provided that the author and preprint are cited in any reuse.


