Submitted:
09 January 2024
Posted:
10 January 2024
You are already at the latest version
Abstract
This paper presents a customized adaptive cascaded deep learning (ACDL) model for the design and performance prediction of metasurface absorbers. A multi-resonant metasurface absorber structure is introduced, with 10 target-driven design parameters. The proposed deep learning model takes advantage of cascading several sub-deep neural network (DNN) layers with forward noise mitigation capability. The inherent appearance of sparse data is completely dealt with in this work by proposing a trained adaptive selection technique. On the basis of the findings, the prediction response is quite fast and accurate enough to retrieve the design parameters of the studied metasurface absorber and with two sized patches of 4000 and 7000 datasets. The training loss taken form the second DNN of our proposed model shows logarithmic mean squared errors of 0.039 and 0.033 when using Keras and the adaptive method, respectively, with a dataset split of 4000. On the contrary, for a dataset split of 7000, the errors are 0.049 with Keras and 0.045 with the adaptive method. On the other hand, the validation loss is evaluated using the mean square error method, which results in a loss with 4000 datasets split with the Keras method of 0.044, while it is 0.020 with the adaptive method. When extending the dataset to 7000, the validation loss with the keras splitting method is 0.0073, while it is improved, reaching 0.006 with the proposed adaptive method, and achieving a prediction accuracy of 94%. This proposed deep learning model can be deployed in the design process and synthesis of multi-resonant metasurface absorber structures. The proposed model shows its advantages of making the design process more efficient in sparse dataset handling, efficient approach in multi-resonance metasurface data pre-processing, less time consuming, and computationally valuable.
Keywords:
Absorbers
; Adam algorithm
; deep learning
; machine learning
; metamaterial
; metasurface
; neural network
1. Introduction
Energy harvesting is the process of capturing wasted energy from the ambient energy sources within the surrounding environment and then utilizing such energy for recharging purposes. Over the past few years, there has been much demands on the deployment and use of wireless sensors in many engineering applications, including the internet of things [1,2]. Due to the nature of wireless connectivity of such devices, the wireless sensors need to be self-powered [3]. In principle, the design approach of electromagnetic energy harvesting systems could take one of three directions: analytical/empirical formulations, full-wave numerical simulations or trained trial and error approach. Unfortunately, the three approaches can generally be time consuming and computationally expensive while trying to achieve the optimal design. Thus, it is crucial to reconsider more efficient alternatives to aid in the design process, among which is the deployment and integration of intelligent algorithms during the design process.
In the last two decades, metamaterials and their 2D counterparts, the metasurfaces, have attracted a lot of attention from academia and industry, due to their unique properties, including peculiar constitutive parameters’ responses and potential applications, which are not realizable in most natural materials. Such properties are realized by subwavelength resonant engineered inclusions that are assembled periodically or aperiodically in a host medium. The recent evolution of metasurfaces and metamaterials has marked a transformative shift, primarily motivated by the demand for advanced capabilities in optical and electromagnetic domains [4]. These engineered materials hold the potential for revolutionizing diverse applications, offering the prospect of downsized optics, unparalleled control over wavefronts, and tailored wave manipulation. Such advances have begun to reshape the landscape of communication, sensing and optical technologies [5,6,7]. However, it is vital to acknowledge that the path to these innovations has been fraught with challenges. The intricate process of designing and synthesizing such materials has imposed substantial hurdles, necessitating extensive simulations, formidable computational resources, and iterative design procedures [8,9,10,11,12,13].
Various deep learning models have also been used in many engineering applications, including the design of microwave and photonic structures. The multilayer perceptron (MLP) is one of the machine learning models used, especially in the extraction of features from large data problems such as image processing [14]. With the advancement of machine learning algorithms, bidirectional MLP was adopted to design photonic structures even at the nanoscale, as in [15]. Although MLP could be applied in the design of photonic inverse problems, it still has limitations, especially with problems that involve a challenging parameterization process. Hence, the convolution neural network (CNN) and Transpose CNN are powerful tools to extract image features and shrink large data from images such as the image of the photonic structure to low-dimensional feature vectors [16]. The image of the structure is first pixelated and then convoluted with a feature extraction matrix or filter to form a feature map. The pooled feature map is constructed from the pooling process (using either maximum, sum, or average) to the feature map. Finally, the pooled feature map is flattened and serves as input to the deep neural network, as illustrated in [17]. CNN used in [18] to design an anisotropic digital coding metasurface, which means that the surface with a metallic layer will be coded as ’1’, while surfaces without a metallic layer will be coded as ’0’, which can be used to design the metallic reflector. In the same study, high-level precision was achieved with the machine learning method as compared to the numerical analysis method. In [19], the model is trained to learn the relationship between the geometry of metamaterials and the properties of their absorption and to demonstrate the effectiveness of machine learning in the design of metamaterials for high-temperature applications. All the aforementioned published papers show the power of machine learning algorithms in minimizing the time required to design the desired metamaterial or metasurface structure in order to fit a desired application of interest.
Different optimization techniques have been employed to design metasurfaces and their impact on performance has been studied as in [18,20,21,22,23,24]. State-of-the-art multi-objective optimization algorithms have been used to realize metasurfaces that meet multiple design goals and achieve high performances in terms of reflection, transmission, polarization, angular, and frequency-dependent properties [25]. Custom state-of-the-art multi-objective and surrogate-assisted optimization algorithms have been employed to explore the solution space and design metasurface topologies that achieve an arbitrary number of user-specified performance criteria [26]. Statistical learning optimization has been used to optimize highly efficient and robust metasurface designs, including single- and multi-functional devices, while also accounting for manufacturing imperfections [27]. The choice of optimizer can affect the convergence criteria and the efficiency of finding the optimum point, with gradient-based optimizers generally outperforming population-based methods in terms of function evaluations [28].
In light of this background and to alleviate some of the challenges in the design of metasurface absorbers and extending the work in [29], the main contributions in this research are outlined as follows:
- Optimal Dataset Size Determination: we investigated thoroughly the requisite dataset size to attain a high level of accepted accuracy in deep neural network (DNN) models for metasurface design. Our numerical experiments reveal that a dataset comprising 4000 samples is adequate to establish a robust DNN model for a rapid design and synthesis of metasurface absorbers with an accuracy above 90%.
- Sparse Data Handling with Cascaded DNN: we addressed the challenge of handling datasets that are characterized by a high prevalence of sparse data. Further, we examined the effectiveness of cascaded DNN models in refining prediction values. Our findings indicate that while cascaded DNNs are effective, careful hyperparameter tuning of the optimizer is essential in order to mitigate numerical instability. Furthermore, we determine that a two-layer cascaded neural network is sufficient to achieve the desired accuracy in the design of multi-resonant metasurface absorbers. The impact of two other data sorting and selection techniques, namely: ascending data sorting and bootstrap method were also investigated and compared with the proposed adaptive descending data sorting method.
- Dataset Arrangement Impact Analysis: we conducted a systematic investigation addressing the impact of different dataset arrangements on prediction accuracy, which to the best of our knowledge has not been thoroughly explored. Our study demonstrates that there is relatively limited influence on prediction accuracy when datasets are randomly organized or arranged using an alternative method, which we refer to it here as the Adaptive Cascaded DL (ACDL) model. This approach involves aggregating response values for specific cases and subsequently arranging them in descending order, contributing to our understanding of dataset arrangement strategies for metasurface design through AI.
The remainder of this paper is organized as follows. Section 2 outlines the contribution in this work through the proposed adaptive cascaded deep learning model. Section 3 presents a rotational concentric split-ring resonator (R-SRR) unit cell as the main building block of electromagnetic metasurface absorber. The data set are then generated through full-wave electromagnetic simulations. Moreover, the results are presented and discussed in Section 4. Finally, summary of the findings from this research study is concluded in Section 4.
2. Proposed Customized DL Model Methodology
2.1. Model Processing Environment
In this study, the computational tasks were executed under Windows operating system with CPU, Intel Core i7-7700K @ 4.2 GHz with 4 cores. The system was equipped with 32 GB of random access memory. The computational aspects of the study were primarily facilitated by the use of the PyCharm integrated development environment (IDE). The model was implemented and hardcoded using Python version 3.9 within the PyCharm environment using pandas, matplotlib, keras, and other libraries.
2.2. Proposed ACDL Model Setting and Training
In the scientific framework of deep neural network learning algorithms, four primary components are involved. These begin with data pre-processing, a pivotal step aimed at standardizing and normalizing the input data in order to mitigate issues associated with sparse and dense datasets [30,31]. There are two most commonly adopted approaches for this step, called standardization and normalization, which are calculated using [32]
where , , , and are the minimum, maximum, mean and standard deviation values of the input vector x, respectively.
Our proposed model utilizes the standardization method to prepare the dataset. Afterwards, the scaled dataset is divided into two subsets: a trained dataset consisting of 95% of the data and a test dataset consisting of 5% of the data.The second stage involves feed forward propagation, a process in which input data are weighted, combined with biases, and passed through activation functions () to produce a neuron-specific output, as illustrated in Equations (3) and (4) [30], and the activation function is used to introduce a non-linearity in the model using [33]
where is the weighted sum, is the weight for the input , is the bias of the neuron i, and is the predicted output after applying the activation function to the weighted sum . In principle, there are several types of activation functions, and their deployment depends mainly on the type of problem (a detailed explanation can be found in [34,35,36]).
The simple process is illustrated in Figure 1. This process continues until the model accuracy produces satisfactory results from the prediction cycles, and the number of epochs is completed.
In this proposed DL model, the neural network’s architecture includes 10 input neurons in the input layer, followed by three hidden layers with 1000, 900, and 1000 neurons, respectively. The output layer comprises 1001 neurons, and it utilizes LeakyReLU activation in hidden layers and linear activation in the output layer, which are computed using
where represents the mean square logarithmic error, is the truth value, is the network predicted value, n is the batch size and is the mean square error.
Referring to Figure 2, a forward flowchart summarizing the overall procedure of the proposed ACDL model for the metasurface absorber design. The first stage of this model involves the intake of a structured dataset, encompassing critical attributes such as structural dimensions and absorbance target response.
Following the dataset ingestion, a pivotal division takes place, segregating the dataset into two distinct methodologies: Keras and the proposed mechanism of adaptive data splitting. Each of those two distinct mechanisms follow a unique path, leading to an intricate process of deep learning through cascaded DNNs. This cascaded architecture is strategically designed to enhance the predictive accuracy of the model and capture potential relationships within the dataset. We emphasize here that the main focus is on assessing the performance of the developed model, which is characterized by continuous monitoring of validation and training loss metrics. This iterative assessment aims to determine the optimal number of cascaded DNN layers, ensuring that the model achieves superb capabilities. In the second and last stage, the actual predictions of the model from each DNN are rigorously compared with those predicted for a distinct testing dataset, facilitating a comprehensive assessment of the model performance and its ability to generalize beyond the training data. Figure 2 serves as the foundational visual representation of this procedure, encapsulating the complex path from predictive and evaluation accuracy.
In our methodological approach, we constructed a cascaded Deep Neural Network (DNN) architecture while rigorously determining the optimal number of cascaded DNN layers needed for further prediction enhancement. Figure 3 visually illustrates this cascaded DNN structure, which comprises multiple layers that progressively refine the predictions for improved accuracy. The initial layer takes structural parameters as input, absorber’s scattering parameter response, and generates preliminary predictions, which are further refined in the second DNN layer. This iterative process culminates in the third DNN layer, which employs these refined predictions for comprehensive training using both training and testing datasets. Upon completion of the forward propagation, the focus shifts to loss reduction via the backpropagation stage, which optimizes weights and biases using optimizers, i.e, Adam optimizer used here, in order to minimize the cost function [37]. Note that the backpropagation flow involves calculating the derivative of the loss function (in our case, MSLE, see Equation (5), with respect to the batch size and applying the chain rule to compute the rate of change of the cost function with respect to the weights and biases. More details about this process can be found in in [38,39]. Note that throughout the numerical experimentation, the Mean Square Logarithmic error (MSLE) is used as the cost function, while the Mean Square Error (MSE), Equation (6), is used to evaluate the overall performance of the system.
In order to examine the influence of the dataset size, we collected comprehensively two distinct data population configurations, namely: one with 4000 samples and another with 7000 samples. We also investigated the effect of the organization of the data set throughout two mechanisms (keras and adaptive data splitting. The first method involves random data arrangement, followed by dataset splitting with a 95% to 5% ratio in order to evaluate the impact of data randomness on the trained model performance. The second data management mechanism, which is one of our contributions in this research work, organizes the scattering and absorbance response values for the metasurface absorbing structure in descending order, designed to assess the influence of the data arrangement, particularly for sparse data sets. Note that design datasets were generated using comprehensive electromagnetic full-wave simulation tasks, ensuring an accurate representation of metasurface behavior.
3. Metasurface Absorber Structure Model
Figure 4 shows the proposed metasurface unit cell of two split-ring resonators, SRRs, as part of the absorbing structure. It consists of two edge-coupled concentric circular metallic rings with two gap cuts (slits). The square-shaped structure is mounted on a Rogers substrate ( = 2.2, tan = 0.0009) with a thickness of = 1.57 mm and is backed with a metallic ground layer. The metallic parts of the structure are made of metallic copper.It is very important to mention here that this proposed metasurface structure is different from the classical edge-coupled SRRs, due to the dependence of the two opposite cuts on angular positions, i.e. and . In other words, the two concentric rings are rotational due to their dependence on angles. Thus, the deployed unit cell results in asymmetric-SRR structure, which has not been explored in deep learning studies concerning such metasurface absorbing structure.
Within the 3D numerical structure model, periodic unit cell boundary conditions are enforced in the x and y directions, respectively, while open space boundary conditions were applied to the boundaries along the z direction. In order to excite the metasurface absorber structure, Floquet ports were assigned along the two walls, i.e. ±z-direction.
This developed metasurface structure was used to generate, train and test the dataset through a set of simulation tasks, taking into consideration the parameters of interest. The dependent variables are: a) the unit cell period, L, in the x and y directions, b) the outer and inner radii of the inner and outer rings: , , respectively, c) the widths of the rings: and , d) the two slits (, ) added to the dependent variables and d) with their angular positions and ). Thus, a total of 10 dependent variables are considered in this research in order to generate 4000 random data sets of reflection coefficient, , and absorbance responses, with 1001 data points each from the design parameters, which are then considered as the input to the DL model. In another case study, a dataset size of 7000 was also generated and its impact was assessed in order to study the effect of increasing the data set on the precision of the prediction from the DL model, the data set was increased to include the change of lattice size, L with respect to and , with a size of 7000.
4. Results and Discussions
From the design perspective of metasurface absorbers, two important responses are required in the dataset generation, which are the scattering reflection coefficient, and the absorption strength, A. This absorbance strength is expressed as
where A corresponds to the absorbance strength of the metasurface absorber. Note that since the proposed absorbing structure is backed with a metallic layer, . Thus, there is a direct relationship between the and the absorbance responses.
In this section, we present the results from the trained ACDL model. For convenience, the initial dataset were uniformly distributed at random. To partition this dataset into training and testing subsets, we employ the Keras split function, adhering to a predefined split ratio of 95% for training and 5% for testing. This approach grants us invaluable insights into the dynamic effects of random dataset organization and the consequent influence on our model’s performance. On the other hand, the second dataset follows our proposed adaptive data splitting mechanism, which is uniquely tailored to address the specific challenges posed by sparse datasets.Within this framework, we aggregate the scattering parameters response values corresponding to distinct geometrical structure design and, with careful data handling and precision, we arrange them in a descending order based on the data response strength, as illustrated in Figure 5.
Figure 6 shows the significance of the proposed adaptive splitting method in this analysis. One standout observation is the adaptive method’s consistent superiority in terms of validation errors compared to the Keras method. As illustrated in Table 1, the adaptive method consistently delivers lower validation losses across all layers, with and exhibiting notably lower validation losses of 0.024 and 0.020, respectively, while the Keras method trails behind with validation losses of 0.049 and 0.044, respectively. This remarkable and sustained advantage in reducing validation errors accentuates the adaptive method’s unique ability to ensure the reliability and precision of deep neural network models. Moreover, it is worth noting that the training loss under the Adaptive method is marginally higher, as shown in Table 1, with a training loss of 0.15 as compared to 0.032 with the Keras method for the third DNN layer. However, given the importance of validation accuracy in real-world applications, this minor increase in the training loss is outweighed by the significant gain in validation performance. This emphasizes the importance of carefully weighing the trade-offs when selecting the appropriate dataset splitting method. From the aforementioned results and discussion, it is apparent that employing cascaded neural networks with only two layers proves to be the optimal choice for designing multi-resonant metasurface absorbers, offering a balance between performance and efficiency. This finding is especially significant, as it sets the stage for further investigation when the dataset is increased from 4000 to 7000, where scalability and robustness of this approach can be further explored.
Figure 7 and Figure 8 present a comparison between actual design response and predicted responses from each layer for the Keras splitting method for the metasurface absorber design responses in terms of and absorbance strength, respectively. Clearly, we could observe a significant amount of noise generated from the first layer of the DNN model with Keras splitting. Furthermore, this noise was reduced via refining the data within the second layer, due to the change of inputted data to the model and enhancement in the gradient calculation. We note here the hyperparameters of the second DNN layer and due to the small values of the gradient vector at this layer; changed from 0.9 to 0.95 in order to make the model more numerically stable.
Figure 9 and Figure 10 present a comparison between actual design response and predicted responses from each layer for the proposed splitting method for the metasurface absorber design in terms of and absorbance strength. Interestingly, the prediction of the actual performance was greatly improved in terms of absorption response and encountered noise from the DL model, specifically with two deep neural network cascaded layers.
Upon careful examination of the prediction samples (Figure 8 and Figure 10), it becomes evident that a clear distinction in prediction quality emerges. Specifically, when assessing predictive accuracy in terms of generated noise, where values exceeding zero dB are of particular significance, the dataset organized through the adaptive data sorting method exhibits a slight advantage. This advantage becomes notably pronounced when employing two cascaded deep neural network layers. In essence, the adaptive data sorting method demonstrates superior predictive stability and response accuracy in scenarios where minimizing noise in predictions is a crucial criterion.
Another investigation focusing on impact of dataset size is considered next, where dataset was increased from 4000 to 7000 samples. As shown in Figure 15 and the dataset findings in Table 2, significant reduction to validation errors can be seen with the adaptive splitting method as compared to the Keras method across all layers. From Table 2, we can see that the validation losses with the adaptive method are 0.0067 and 0.006 for and layers, respectively, while higher values of 0.077 and 0.0073 resulted with the Keras splitting method with and , respectively. From such results, the proposed splitting mechanism showed higher precision and accuracy while increasing the dataset population. Moreover, the deployment of only two layers within the DNN model turns out to provide the optimal performance in terms of training and validation losses when dataset size of 7000 or even lowering it to 4000.
In order to ensure the accuracy of the results from the suggested data sorting mechanism via descending order, a comparison is made with dataset sorting through an ascending order. For convenience, the same dataset of 4000 cases was used. Figure 11 depicts the predicted responses of the absorbance from the descending order data sorting and compared with the ascending order. Clearly, we can see that the prediction accuracy of the ascending order sorting is less accurate than the proposed descending data sorting, since not all resonance peaks of the absorber were detected. This is expected due to large pool of sparse data that comes as a priority in the ascending order topology. On the other hand, the predicted absorbance peaks when sorting data in descending order are all comparable to the actual absorbance response (i.e., see red curve). Another important metric is the prediction accuracy of the model when considering data sorting by either ascending or descending order. Figure 12 illustrates a reduction in the prediction accuracy of the trained DL model when sorting the data in ascending order by almost 20% as compared against the case of descending order.
Next, we investigate the prediction performance and accuracy of the developed DL model with another splitting technique, the bootstrap method. Figure 13 shows the prediction responses for reflection coefficient from the bootstrap method, our proposed descending data sorting order and actual response of the absorber. Interestingly, the predicted reflection coefficient response from the bootstrap shows more robustness in the prediction of the absorber performance, where absorber’s resonances are well predicted. The accuracy of the trained DL model with bootstrap method and compared with our proposed data sorting is illustrated in Figure 14. As shown, lower prediction accuracy was realized from the bootstrap method by almost 5% as compared against the proposed data sorting technique but better than the ascending data order approach with almost 15% increase.
To empirically assess the performance of the cascaded DNN model trained on a dataset comprising 7000 samples, we execute a series of rigorous numerical experiments. Such experiments are conducted with unwavering precision, employing two distinct data-splitting methodologies. The outcome of these endeavors culminates in the generation of comprehensive test samples, each tailored to evaluate the effectiveness of the respective data-splitting method.
Figure 15.
Validation loss for 7000 dataset, with data split using Keras split function and our proposed adaptive data merging technique.
Figure 15.
Validation loss for 7000 dataset, with data split using Keras split function and our proposed adaptive data merging technique.

Upon augmenting the dataset from 4000 data samples to 7000, the evaluation of structural absorbance is extended through the consistent application of data partitioning and a three-tier cascaded neural network framework. The comparative visualizations presented in Figure 16 and Figure 17 illustrate the actual absorbance alongside the predicted absorbance values across the three cascaded layers. For instance, the predicted absorbance from the Keras method provides unrealistic absorption strength values (either above one and even negative absorbance values) (see Figure 16) as compared to the case of our proposed adaptive splitting from Figure 17. Moreover, the deployment of two DNN layers along with adaptive splitting results in a best prediction scenario from the absorbance response.
Lastly, we present the prediction accuracy of the proposed DL model with adaptive data splitting and compared against the case with Keras splitting from the second layer, as shown in Figure 18. We can observe that the proposed model reached a prediction accuracy of 79% while the accuracy with the Keras data splitting mechanism was around 54% for dataset population of 4000. Moreover, the prediction accuracy has improved further when increasing the size of the dataset to 7000, where the accuracy reached 94% for our proposed model as compared to 92% when Keras splitting is considered. Hence, the proposed adaptive splitting method shows better prediction accuracy as compared against the model with Keras splitting feature.
Table 3 provides a comparison between various state of art artificial intelligence based models for the design and synthesis of metasurface absorbers at different frequency regimes. From the structural geometry, our proposed structure has not been explored in earlier studies, where the generated dataset has dependency on the angular location of the SRRs’ split gaps, i.e. function of angles and . Moreover, our model has explored a mechanism for pre-processing of data via adaptive data splitting mechanism, as illustrated in Figure 5. This technique has shown significant convergence and accuracy of the trained and validated dataset by considering only two deep neural network layers, as evident from Table 1 and Table 2, where accuracy of 94% was achieved for the 7000 dataset with the proposed DL model with the adaptive data splitting and sorting mechanism.
5. Conclusions
In this paper, we proposed an adaptive cascaded deep learning (ACDL) model for the design and synthesis prediction of metasurface absorbers. A comprehensive exploration of key factors influencing the precision of metasurface response predictions was carried out. Firstly, a deep neural network model was developed with a novel data splitting technique, termed here as ACDL model, was introduced and rigorously compared against the conventional Keras split function using random dataset distribution. The results demonstrate that the proposed data-splitting method has a substantial impact on enhancing the quality of metasurface response predictions. This is exemplified through graphical representations and numerical results, showcasing its superiority.
Secondly, the paper investigated the impact of dataset size in the context of multi-resonance metasurface design and prediction. It is established that a dataset consisting of 4000 samples strikes an optimal balance, thus achieving a high degree of accuracy in metasurface response predictions. Moreover, the findings from this research emphasized that enlarging the dataset may introduce unwanted noise into predictions due to the nature of the multi-resonance metasurface absorber response.
Thirdly, the introduction of cascaded neural networks for augmenting the quality of scattering and absorption responses predictions is explored. Although a valuable enhancement, it demands particular attention due to the challenge posed by small gradients, potentially leading to numerical instability. The study in this paper emphasizes the necessity of fine-tuning optimizer hyperparameters, as evidenced by adjustments in learning rate and within the Adam optimizer.Moreover, the impact of sparse data on the trained DL model was thoroughly investigated by assessing the performance of the model with the proposed data sorting with ascending data sorting and the bootstrap method. From the analyzed statistical data, the proposed descending data sorting achieved higher prediction accuracy of 20% and 5% as compared to ascending order data sorting and the bootstrap method, respectively.
Lastly, the accuracy of the prediction from the developed ACDL model reached 94% for a sufficient dataset of 7000. As such, we believe that this proposed data splitting technique can be integrated in many artificial intelligence to aid in the design process and enhanced prediction of metasurface absorbers performance.
References
- Tan, T.; Yan, Z.; Zou, H.; Ma, K.; Liu, F.; Zhao, L.; Peng, Z.; Zhang, W. Renewable energy harvesting and absorbing via multi-scale metamaterial systems for Internet of things. Applied Energy 2019, 254, 113717. [Google Scholar] [CrossRef]
- Sabban, A. Wearable circular polarized antennas for health care, 5G, energy harvesting, and IoT systems. Electronics 2022, 11, 427. [Google Scholar] [CrossRef]
- Kjellby, R.A.; Cenkeramaddi, L.R.; Frøytlog, A.; Lozano, B.B.; Soumya, J.; Bhange, M. Long-range & self-powered IoT devices for agriculture & aquaponics based on multi-hop topology. 2019 IEEE 5th World Forum on Internet of Things (WF-IoT). IEEE, 2019, pp. 545–549.
- Ma, W.; Cheng, F.; Liu, Y. Deep-learning-enabled on-demand design of chiral metamaterials. ACS nano 2018, 12, 6326–6334. [Google Scholar] [CrossRef] [PubMed]
- Malkiel, I.; Mrejen, M.; Nagler, A.; Arieli, U.; Wolf, L.; Suchowski, H. Plasmonic nanostructure design and characterization via deep learning. Light: Science & Applications 2018, 7, 60. [Google Scholar] [CrossRef]
- Nadell, C.C.; Huang, B.; Malof, J.M.; Padilla, W.J. Deep learning for accelerated all-dielectric metasurface design. Optics express 2019, 27, 27523–27535. [Google Scholar] [CrossRef]
- Jiang, J.; Sell, D.; Hoyer, S.; Hickey, J.; Yang, J.; Fan, J.A. Free-form diffractive metagrating design based on generative adversarial networks. ACS nano 2019, 13, 8872–8878. [Google Scholar] [CrossRef] [PubMed]
- An, S.; Fowler, C.; Zheng, B.; Shalaginov, M.Y.; Tang, H.; Li, H.; Zhou, L.; Ding, J.; Agarwal, A.M.; Rivero-Baleine, C.; others. A deep learning approach for objective-driven all-dielectric metasurface design. ACS Photonics 2019, 6, 3196–3207. [Google Scholar] [CrossRef]
- Shalaginov, M.Y.; Campbell, S.D.; An, S.; Zhang, Y.; Ríos, C.; Whiting, E.B.; Wu, Y.; Kang, L.; Zheng, B.; Fowler, C.; others. Design for quality: reconfigurable flat optics based on active metasurfaces. Nanophotonics 2020, 9, 3505–3534. [Google Scholar] [CrossRef]
- An, S.; Zheng, B.; Tang, H.; Shalaginov, M.Y.; Zhou, L.; Li, H.; Kang, M.; Richardson, K.A.; Gu, T.; Hu, J.; others. Multifunctional metasurface design with a generative adversarial network. Advanced Optical Materials 2021, 9, 2001433. [Google Scholar] [CrossRef]
- Fang, Z.; Zhan, J. Deep physical informed neural networks for metamaterial design. IEEE Access 2019, 8, 24506–24513. [Google Scholar] [CrossRef]
- Zhelyeznyakov, M.V.; Brunton, S.; Majumdar, A. Deep learning to accelerate scatterer-to-field mapping for inverse design of dielectric metasurfaces. ACS Photonics 2021, 8, 481–488. [Google Scholar] [CrossRef]
- Tanriover, I.; Hadibrata, W.; Aydin, K. Physics-based approach for a neural networks enabled design of all-dielectric metasurfaces. ACS Photonics 2020, 7, 1957–1964. [Google Scholar] [CrossRef]
- Ma, W.; Liu, Z.; Kudyshev, Z.A.; Boltasseva, A.; Cai, W.; Liu, Y. Deep learning for the design of photonic structures. Nature Photonics 2021, 15, 77–90. [Google Scholar] [CrossRef]
- Malkiel, I.; Mrejen, M.; Nagler, A.; Arieli, U.; Wolf, L.; Suchowski, H. Plasmonic nanostructure design and characterization via deep learning. Light: Science & Applications 2018, 7, 60. [Google Scholar] [CrossRef]
- Ma, W.; Liu, Z.; Kudyshev, Z.A.; Boltasseva, A.; Cai, W.; Liu, Y. Deep learning for the design of photonic structures. Nature Photonics 2021, 15, 77–90. [Google Scholar] [CrossRef]
- Sajedian, I.; Kim, J.; Rho, J. Finding the optical properties of plasmonic structures by image processing using a combination of convolutional neural networks and recurrent neural networks. Microsystems & nanoengineering 2019, 5, 27. [Google Scholar] [CrossRef]
- Zhang, Q.; Liu, C.; Wan, X.; Zhang, L.; Liu, S.; Yang, Y.; Cui, T.J. Machine-learning designs of anisotropic digital coding metasurfaces. Advanced theory and simulations 2019, 2, 1800132. [Google Scholar] [CrossRef]
- Ding, W.; Chen, J.; Li, X.M.; Xi, X.; Ye, K.P.; Wu, H.B.; Fan, D.G.; Wu, R.X. Deep learning assisted heat-resistant metamaterial absorber design. 2021 International Conference on Microwave and Millimeter Wave Technology (ICMMT). IEEE, 2021, pp. 1–3.
- Liu, Z.; Raju, L.; Zhu, D.; Cai, W. A hybrid strategy for the discovery and design of photonic structures. IEEE Journal on Emerging and Selected Topics in Circuits and Systems 2020, 10, 126–135. [Google Scholar] [CrossRef]
- Donda, K.; Zhu, Y.; Merkel, A.; Fan, S.W.; Cao, L.; Wan, S.; Assouar, B. Ultrathin acoustic absorbing metasurface based on deep learning approach. Smart Materials and Structures 2021, 30, 085003. [Google Scholar] [CrossRef]
- Qiu, T.; Shi, X.; Wang, J.; Li, Y.; Qu, S.; Cheng, Q.; Cui, T.; Sui, S. Deep learning: a rapid and efficient route to automatic metasurface design. Advanced Science 2019, 6, 1900128. [Google Scholar] [CrossRef]
- Ghorbani, F.; Beyraghi, S.; Shabanpour, J.; Oraizi, H.; Soleimani, H.; Soleimani, M. Deep neural network-based automatic metasurface design with a wide frequency range. Scientific Reports 2021, 11, 7102. [Google Scholar] [CrossRef]
- Niu, C.; Phaneuf, M.; Qiu, T.; Mojabi, P. A deep learning based approach to design metasurfaces from desired far-field specifications. IEEE Open Journal of Antennas and Propagation 2023. [Google Scholar] [CrossRef]
- Mansouree, M.; Arbabi, A. Metasurface design using level-set and gradient descent optimization techniques. 2019 International Applied Computational Electromagnetics Society Symposium (ACES). IEEE, 2019, pp. 1–2.
- Campbell, S.D.; Whiting, E.B.; Werner, D.H.; Werner, P.L. High-Performance Metasurfaces Synthesized via Multi-Objective Optimization. 2019 International Applied Computational Electromagnetics Society Symposium (ACES). IEEE, 2019, pp. 1–2.
- Campbell, S.D.; Zhu, D.Z.; Whiting, E.B.; Nagar, J.; Werner, D.H.; Werner, P.L. Advanced multi-objective and surrogate-assisted optimization of topologically diverse metasurface architectures. Metamaterials, Metadevices, and Metasystems 2018. SPIE, 2018, Vol. 10719, pp. 43–48. [CrossRef]
- Elsawy, M.; Gobé, A.; Leroy, G.; Lanteri, S.; Genevet, P. Advanced computational framework for the design of ultimate performance metasurfaces. Smart Photonic and Optoelectronic Integrated Circuits 2023. SPIE, 2023, Vol. 12425, pp. 34–37. [CrossRef]
- Al Ajmi, H.; Bait-Suwailam, M.M.; Khriji, L. A Comparison Study of Deep Learning Algorithms for Metasurface Harvester Designs. 2023 International Conference on Intelligent Computing, Communication, Networking and Services (ICCNS). IEEE, 2023, pp. 74–78.
- Heaton, J. Ian Goodfellow, Yoshua Bengio, and Aaron Courville: Deep learning: The MIT Press, 2016, 800 pp, ISBN: 0262035618. Genetic programming and evolvable machines 2018, 19, 305–307. [Google Scholar] [CrossRef]
- Ahsan, M.M.; Mahmud, M.P.; Saha, P.K.; Gupta, K.D.; Siddique, Z. Effect of data scaling methods on machine learning algorithms and model performance. Technologies 2021, 9, 52. [Google Scholar] [CrossRef]
- Raju, V.G.; Lakshmi, K.P.; Jain, V.M.; Kalidindi, A.; Padma, V. Study the influence of normalization/transformation process on the accuracy of supervised classification. 2020 Third International Conference on Smart Systems and Inventive Technology (ICSSIT). IEEE, 2020, pp. 729–735.
- Nwankpa, C.; Ijomah, W.; Gachagan, A.; Marshall, S. Activation functions: Comparison of trends in practice and research for deep learning. arXiv preprint, arXiv:1811.03378 2018.
- Dietterich, T.G. Ensemble methods in machine learning. International workshop on multiple classifier systems. Springer, 2000, pp. 1–15.
- Apicella, A.; Donnarumma, F.; Isgrò, F.; Prevete, R. A survey on modern trainable activation functions. Neural Networks 2021, 138, 14–32. [Google Scholar] [CrossRef]
- Apicella, A.; Donnarumma, F.; Isgrò, F.; Prevete, R. A survey on modern trainable activation functions. Neural Networks 2021, 138, 14–32. [Google Scholar] [CrossRef]
- Sun, S.; Cao, Z.; Zhu, H.; Zhao, J. A survey of optimization methods from a machine learning perspective. IEEE Transactions on cybernetics 2019, 50, 3668–3681. [Google Scholar] [CrossRef]
- Fahlman, S. Proceedings of the 1988 Connectionist Models Summer School. Faster-learning variations on back-propagation: An empirical study, 1988.
- Chauvin, Y.; Rumelhart, D.E. Backpropagation: theory, architectures, and applications; Psychology press, 2013.
Figure 1.
Neural network Feed Forward principle with single neuron.
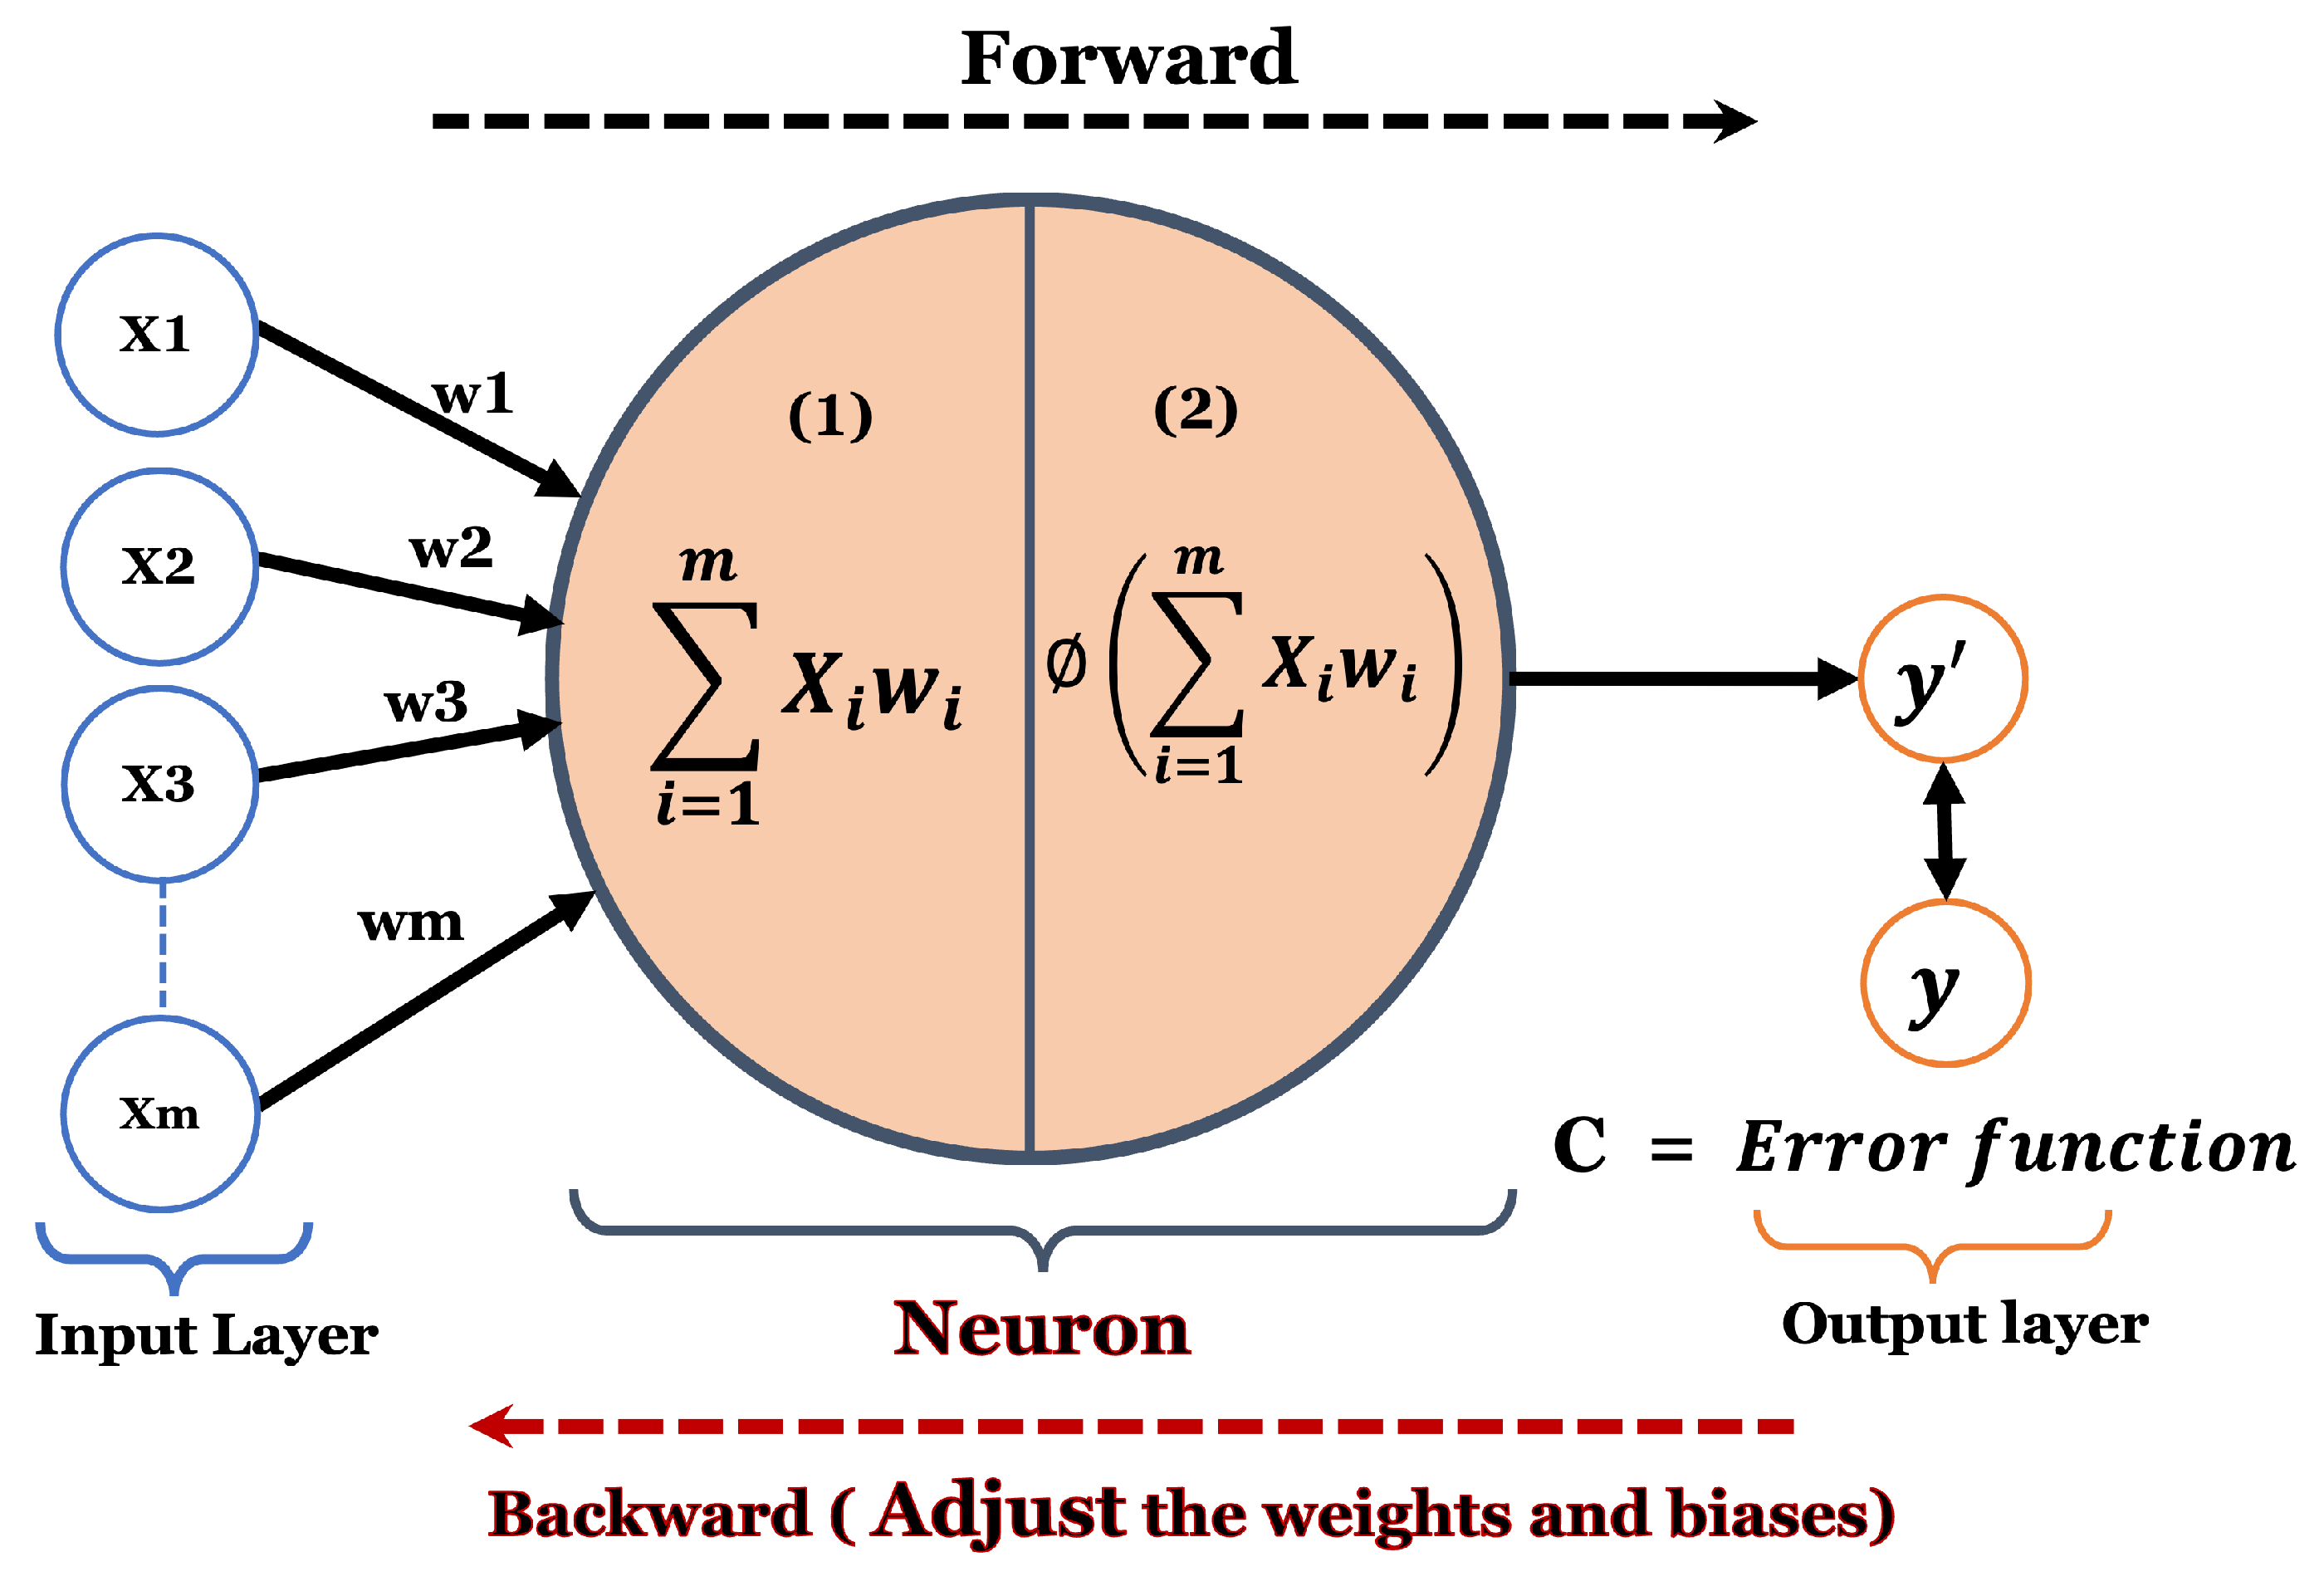
Figure 2.
A flowchart diagram of the proposed adaptive cascaded deep learning model.
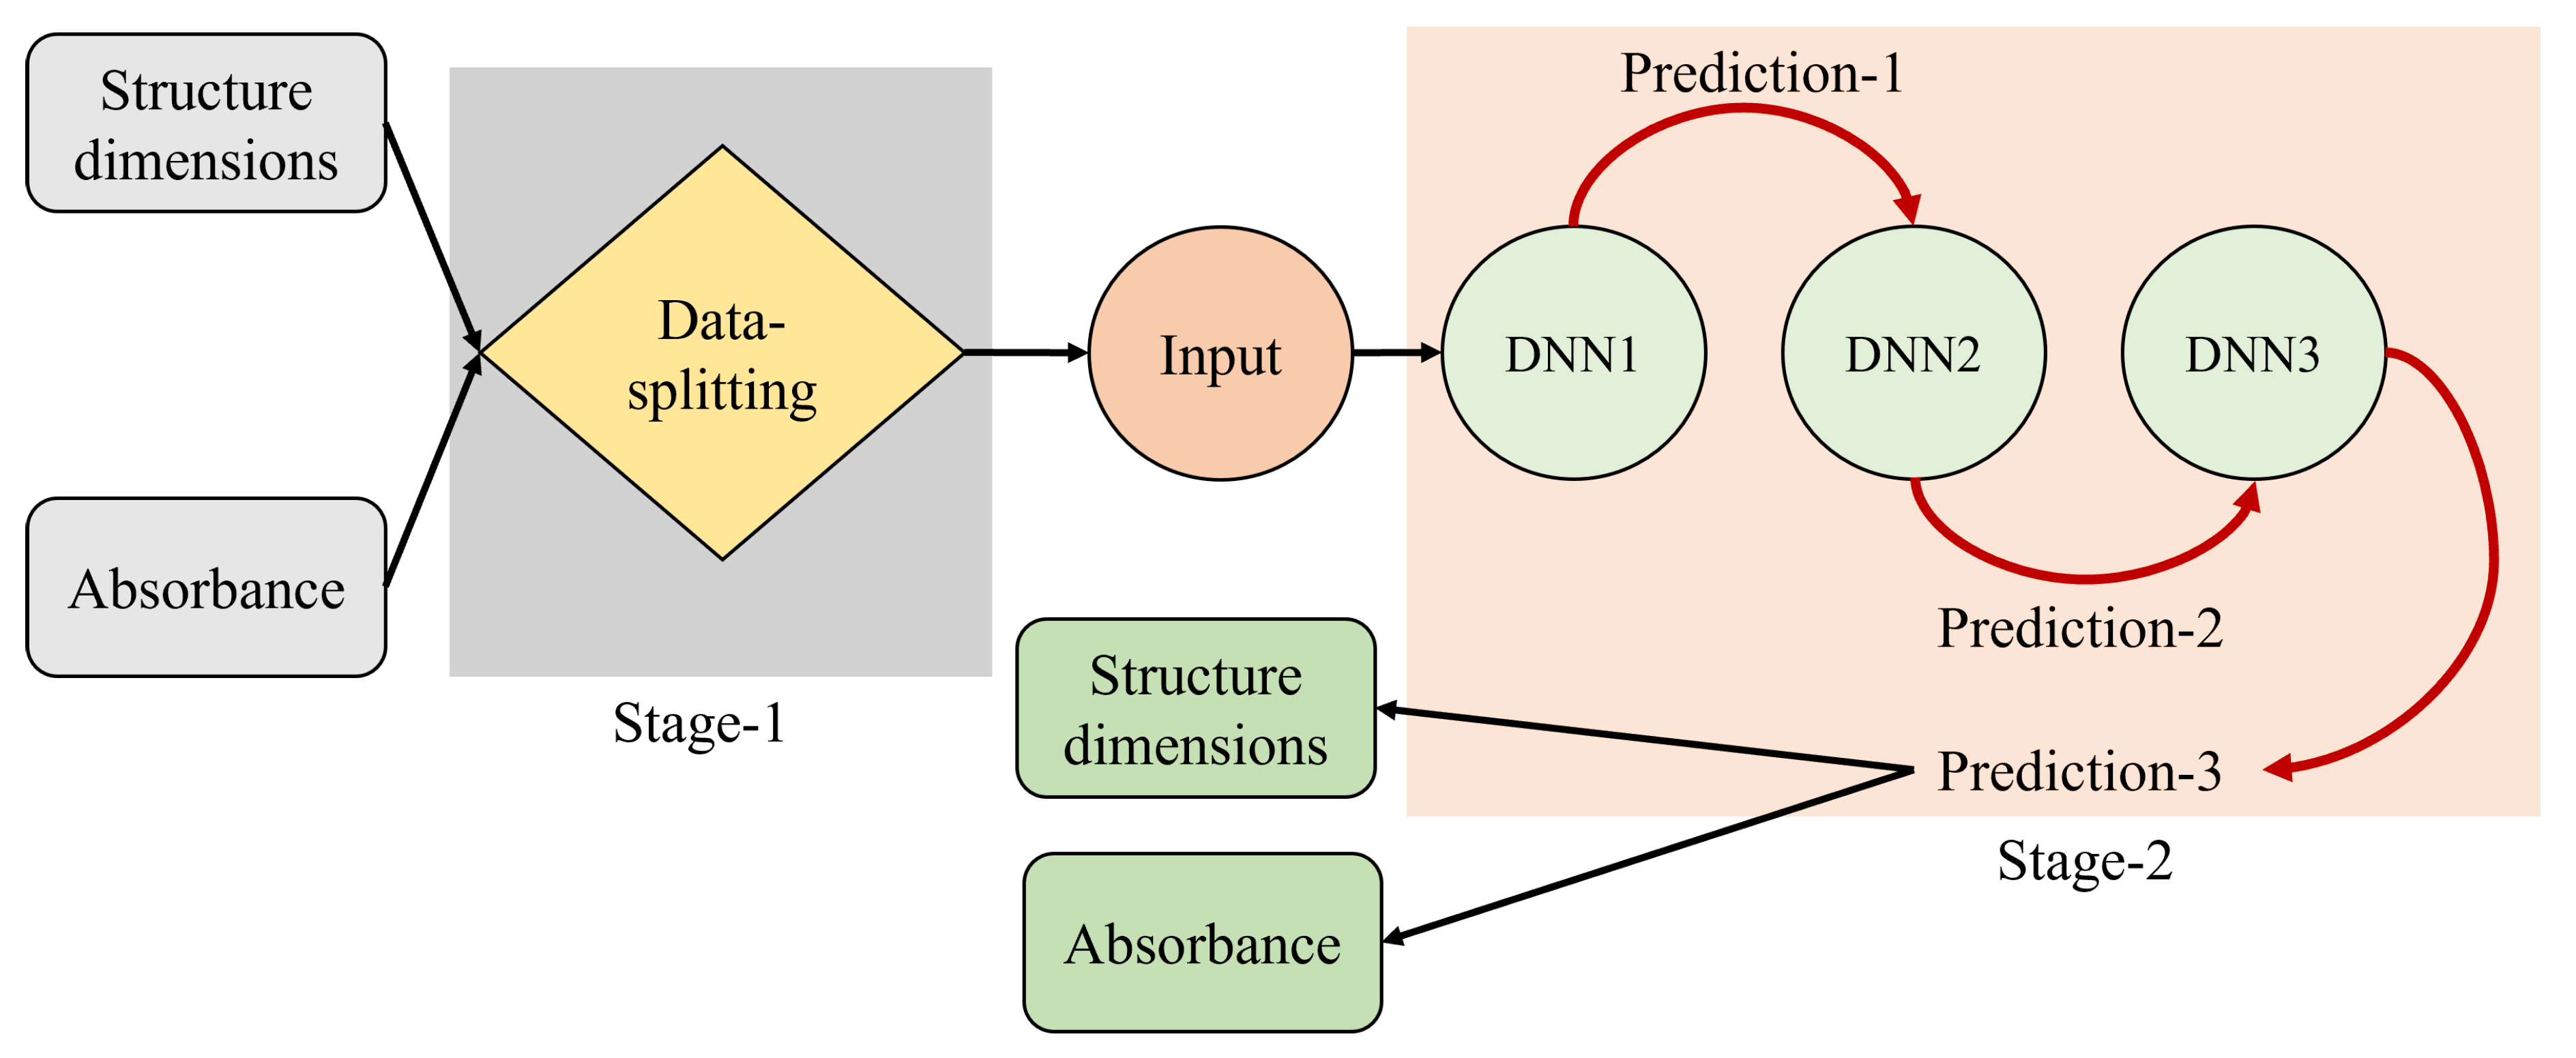
Figure 3.
A comprehensive flowchart diagram showing forward flow of Cascaded neural network under study after data splitting mechanism.
Figure 3.
A comprehensive flowchart diagram showing forward flow of Cascaded neural network under study after data splitting mechanism.
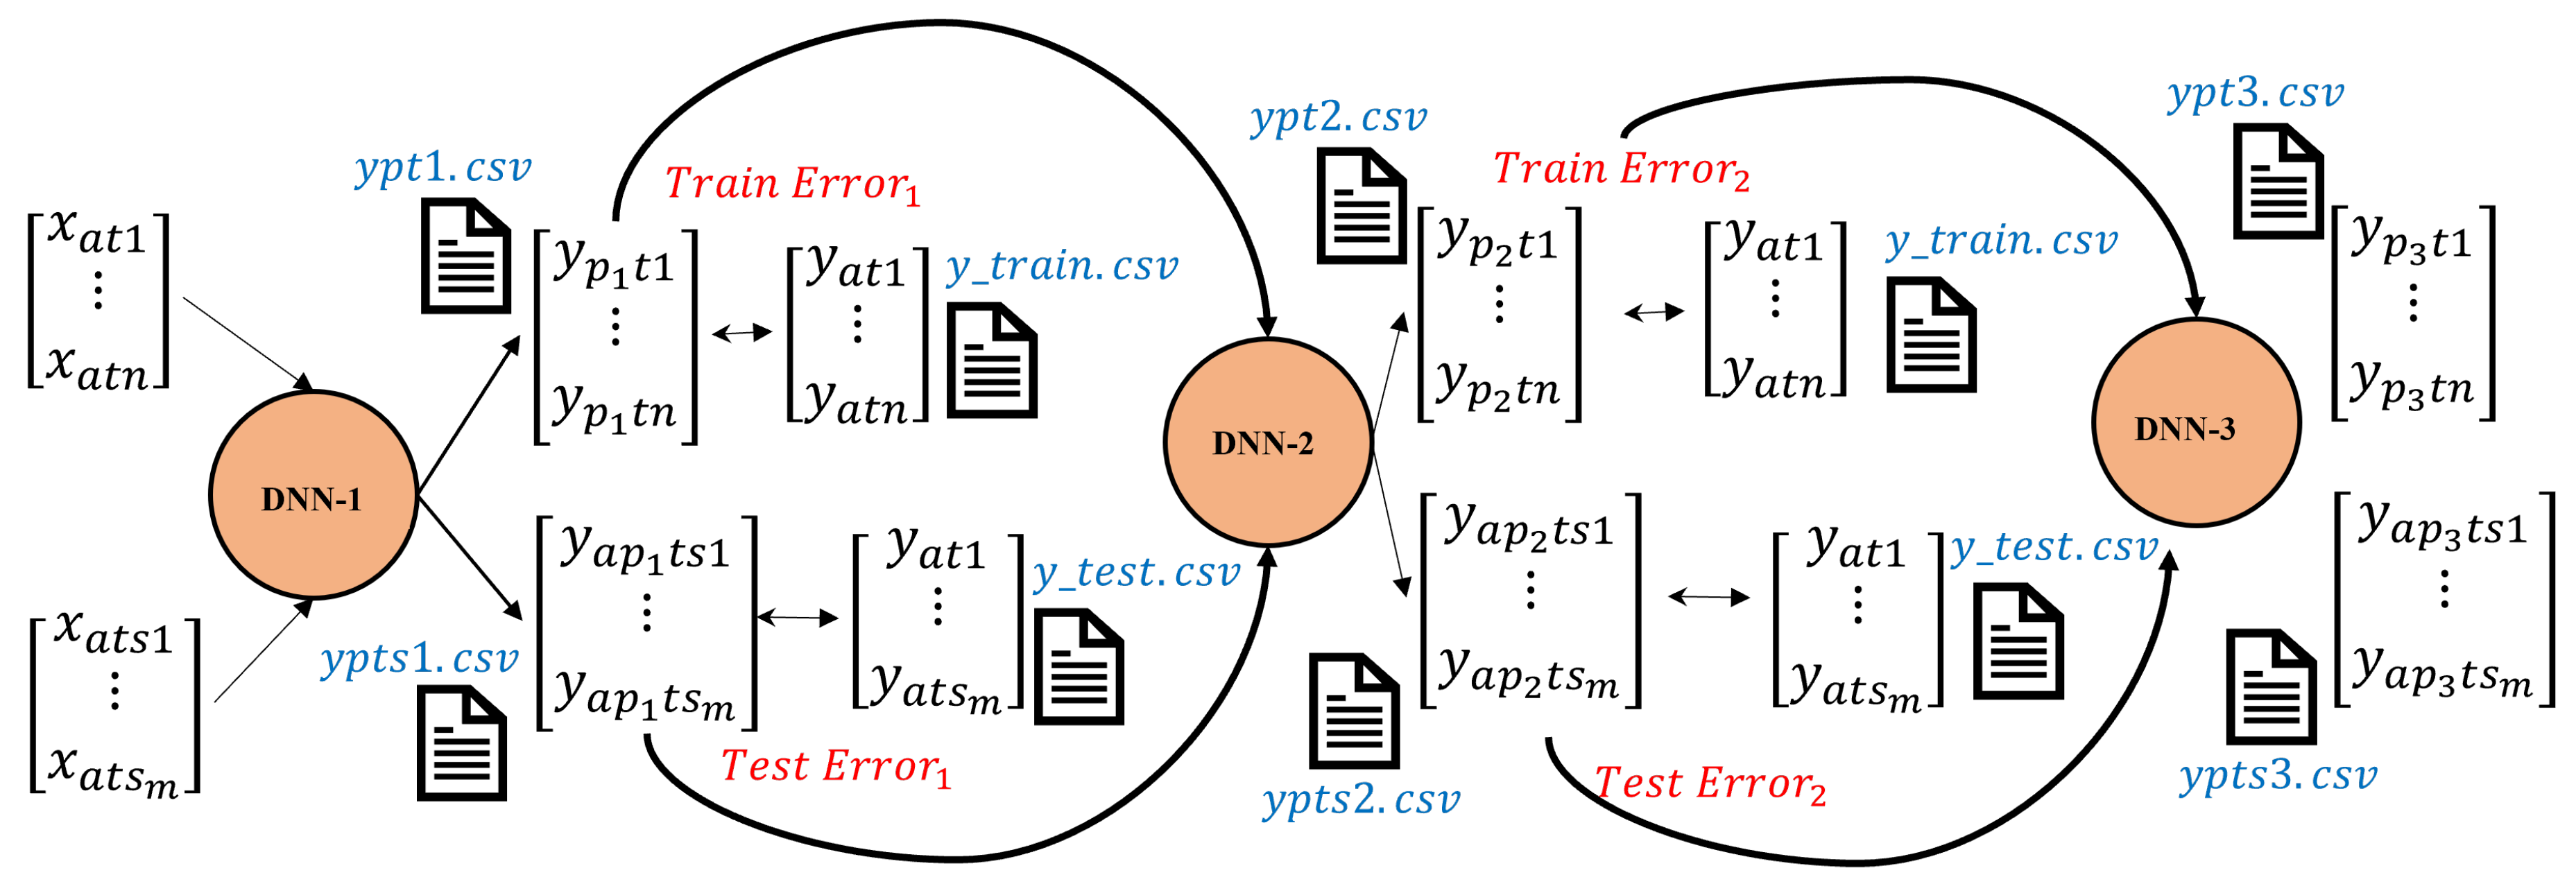
Figure 4.
The proposed metasurface energy absorber unit cell structure under study with its geometrical parameters. Note that light blue areas represent metallization layers.
Figure 4.
The proposed metasurface energy absorber unit cell structure under study with its geometrical parameters. Note that light blue areas represent metallization layers.
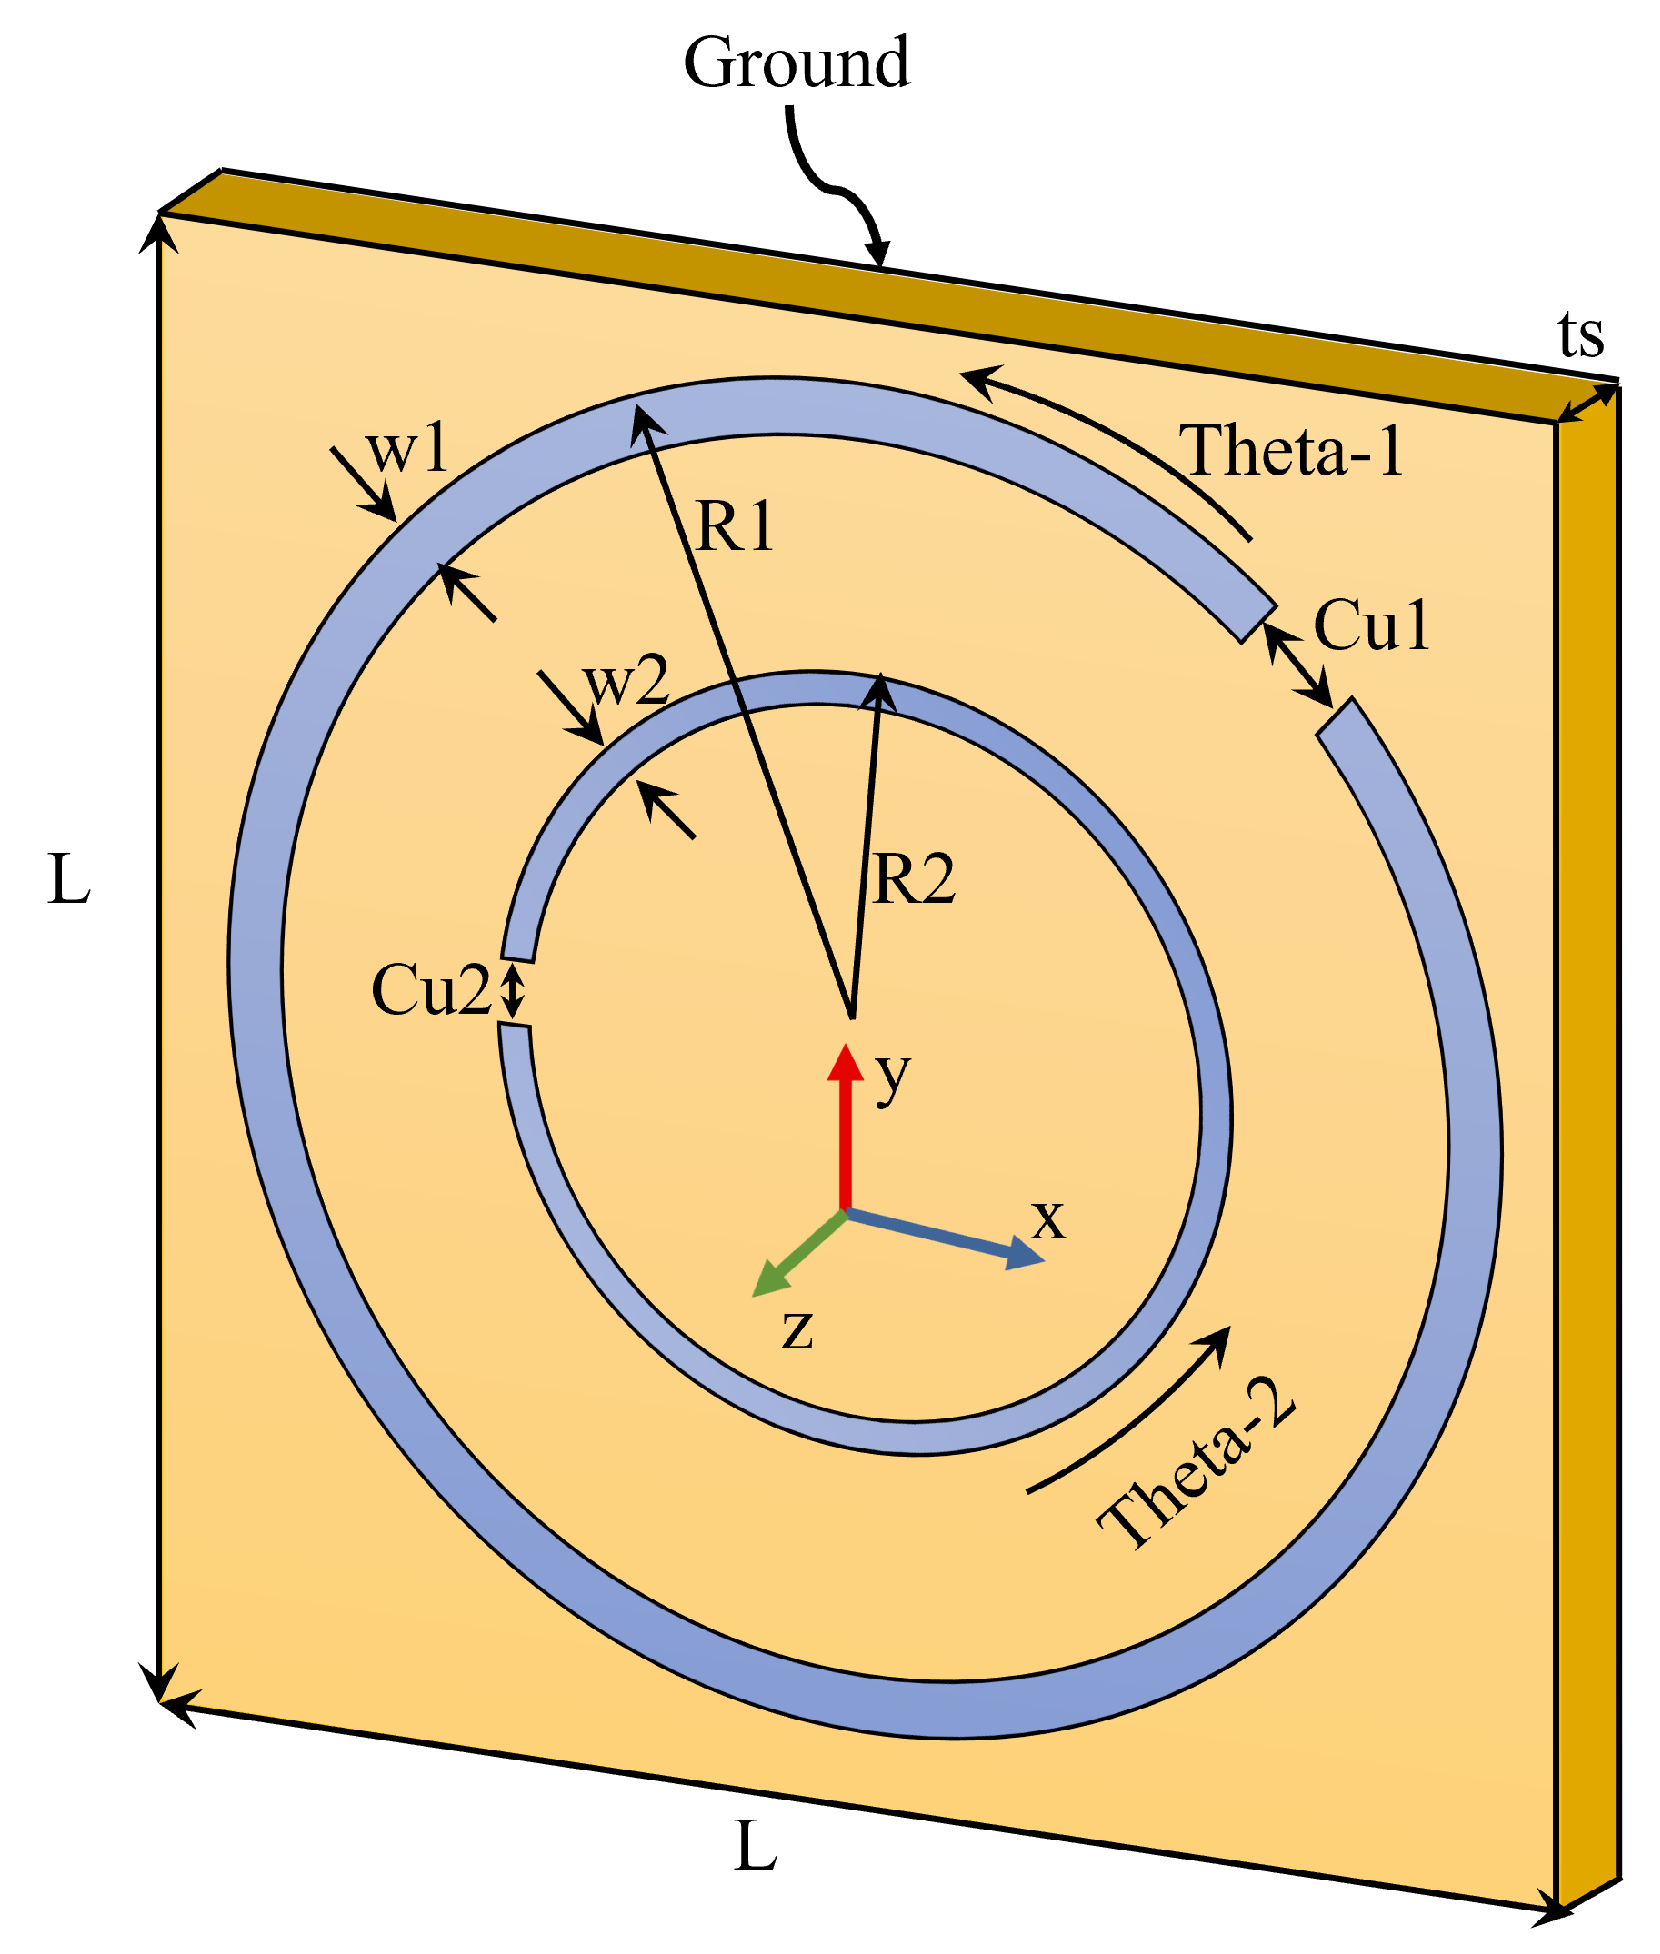
Figure 5.
Proposed adaptive technique data splitting method.Note that the data sorting is based solely on the maximum sum of all sample values of each case.
Figure 5.
Proposed adaptive technique data splitting method.Note that the data sorting is based solely on the maximum sum of all sample values of each case.
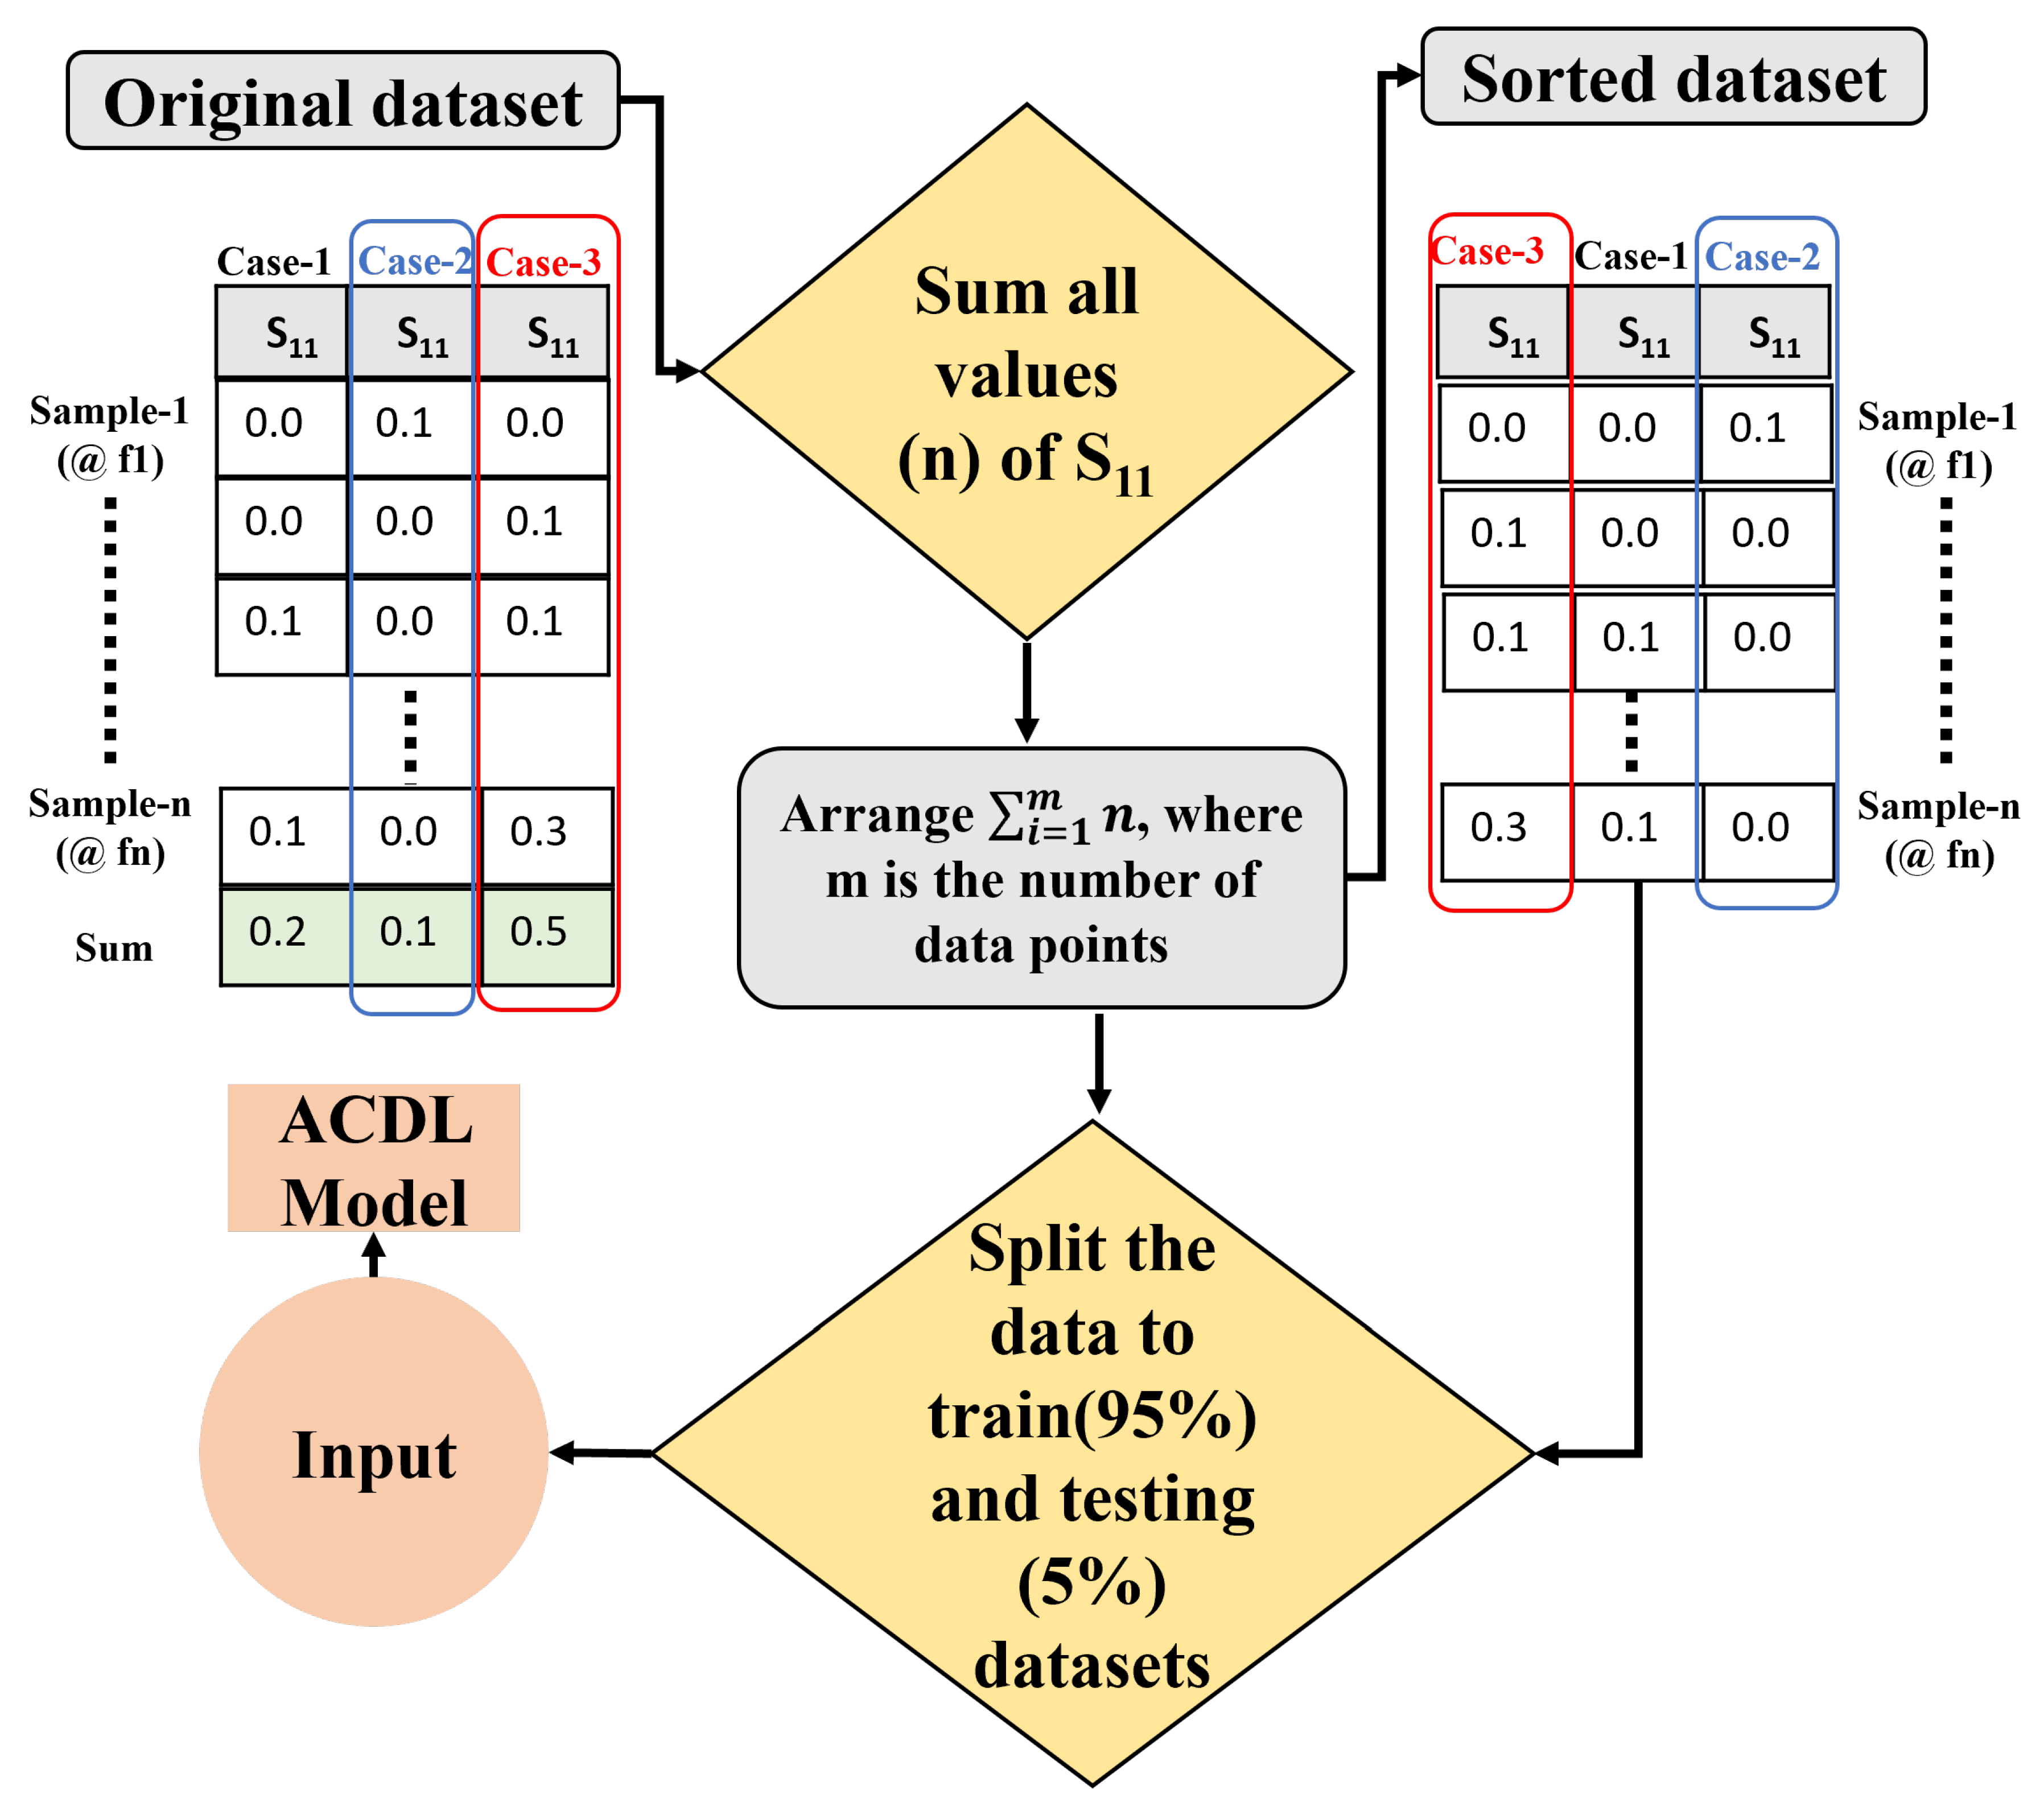
Figure 6.
Validation loss for 4000 dataset, with data splitted using Keras split function and our proposed adaptive data merging technique.
Figure 6.
Validation loss for 4000 dataset, with data splitted using Keras split function and our proposed adaptive data merging technique.
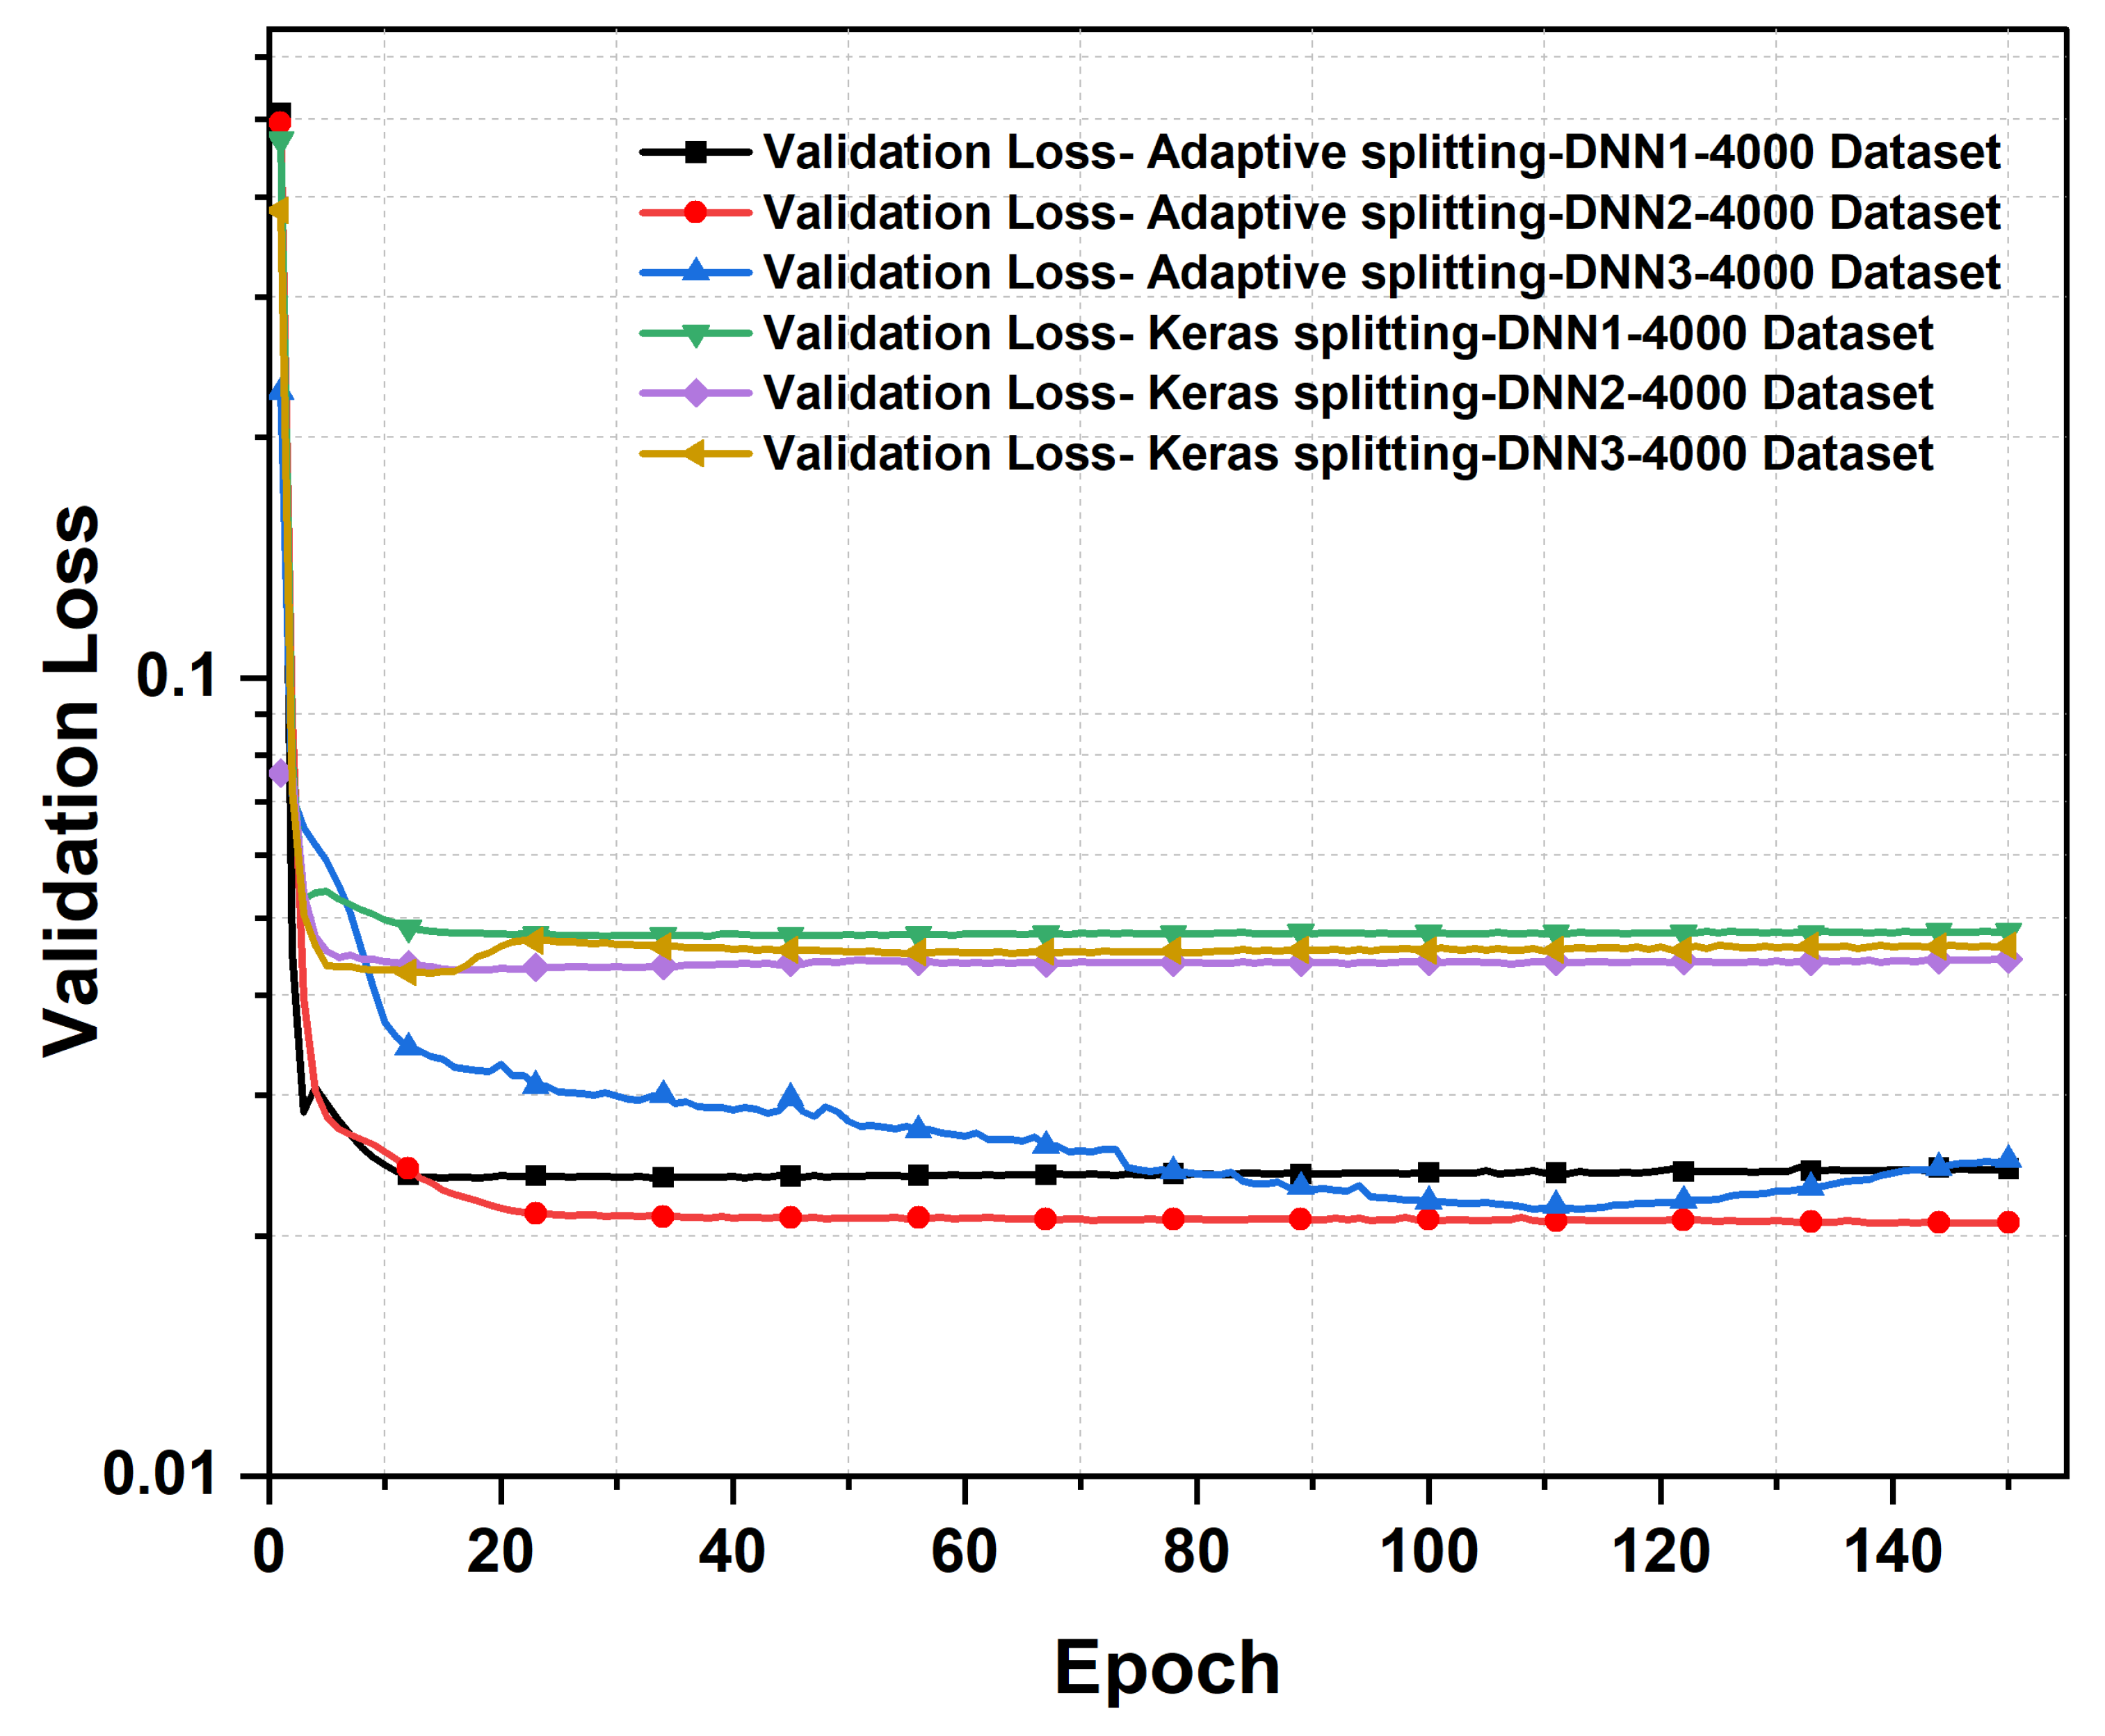
Figure 7.
Comparing the actual response of and predicted response, from the three cascaded DNN with Keras Split function and 4,000 samples dataset. The actual metasurface absorber design parameters are:1.4 mm , = 6.02, = 46.0, 0.13 mm, 0.9 mm, 14 mm, 8 mm, and L = 30 mm.
Figure 7.
Comparing the actual response of and predicted response, from the three cascaded DNN with Keras Split function and 4,000 samples dataset. The actual metasurface absorber design parameters are:1.4 mm , = 6.02, = 46.0, 0.13 mm, 0.9 mm, 14 mm, 8 mm, and L = 30 mm.
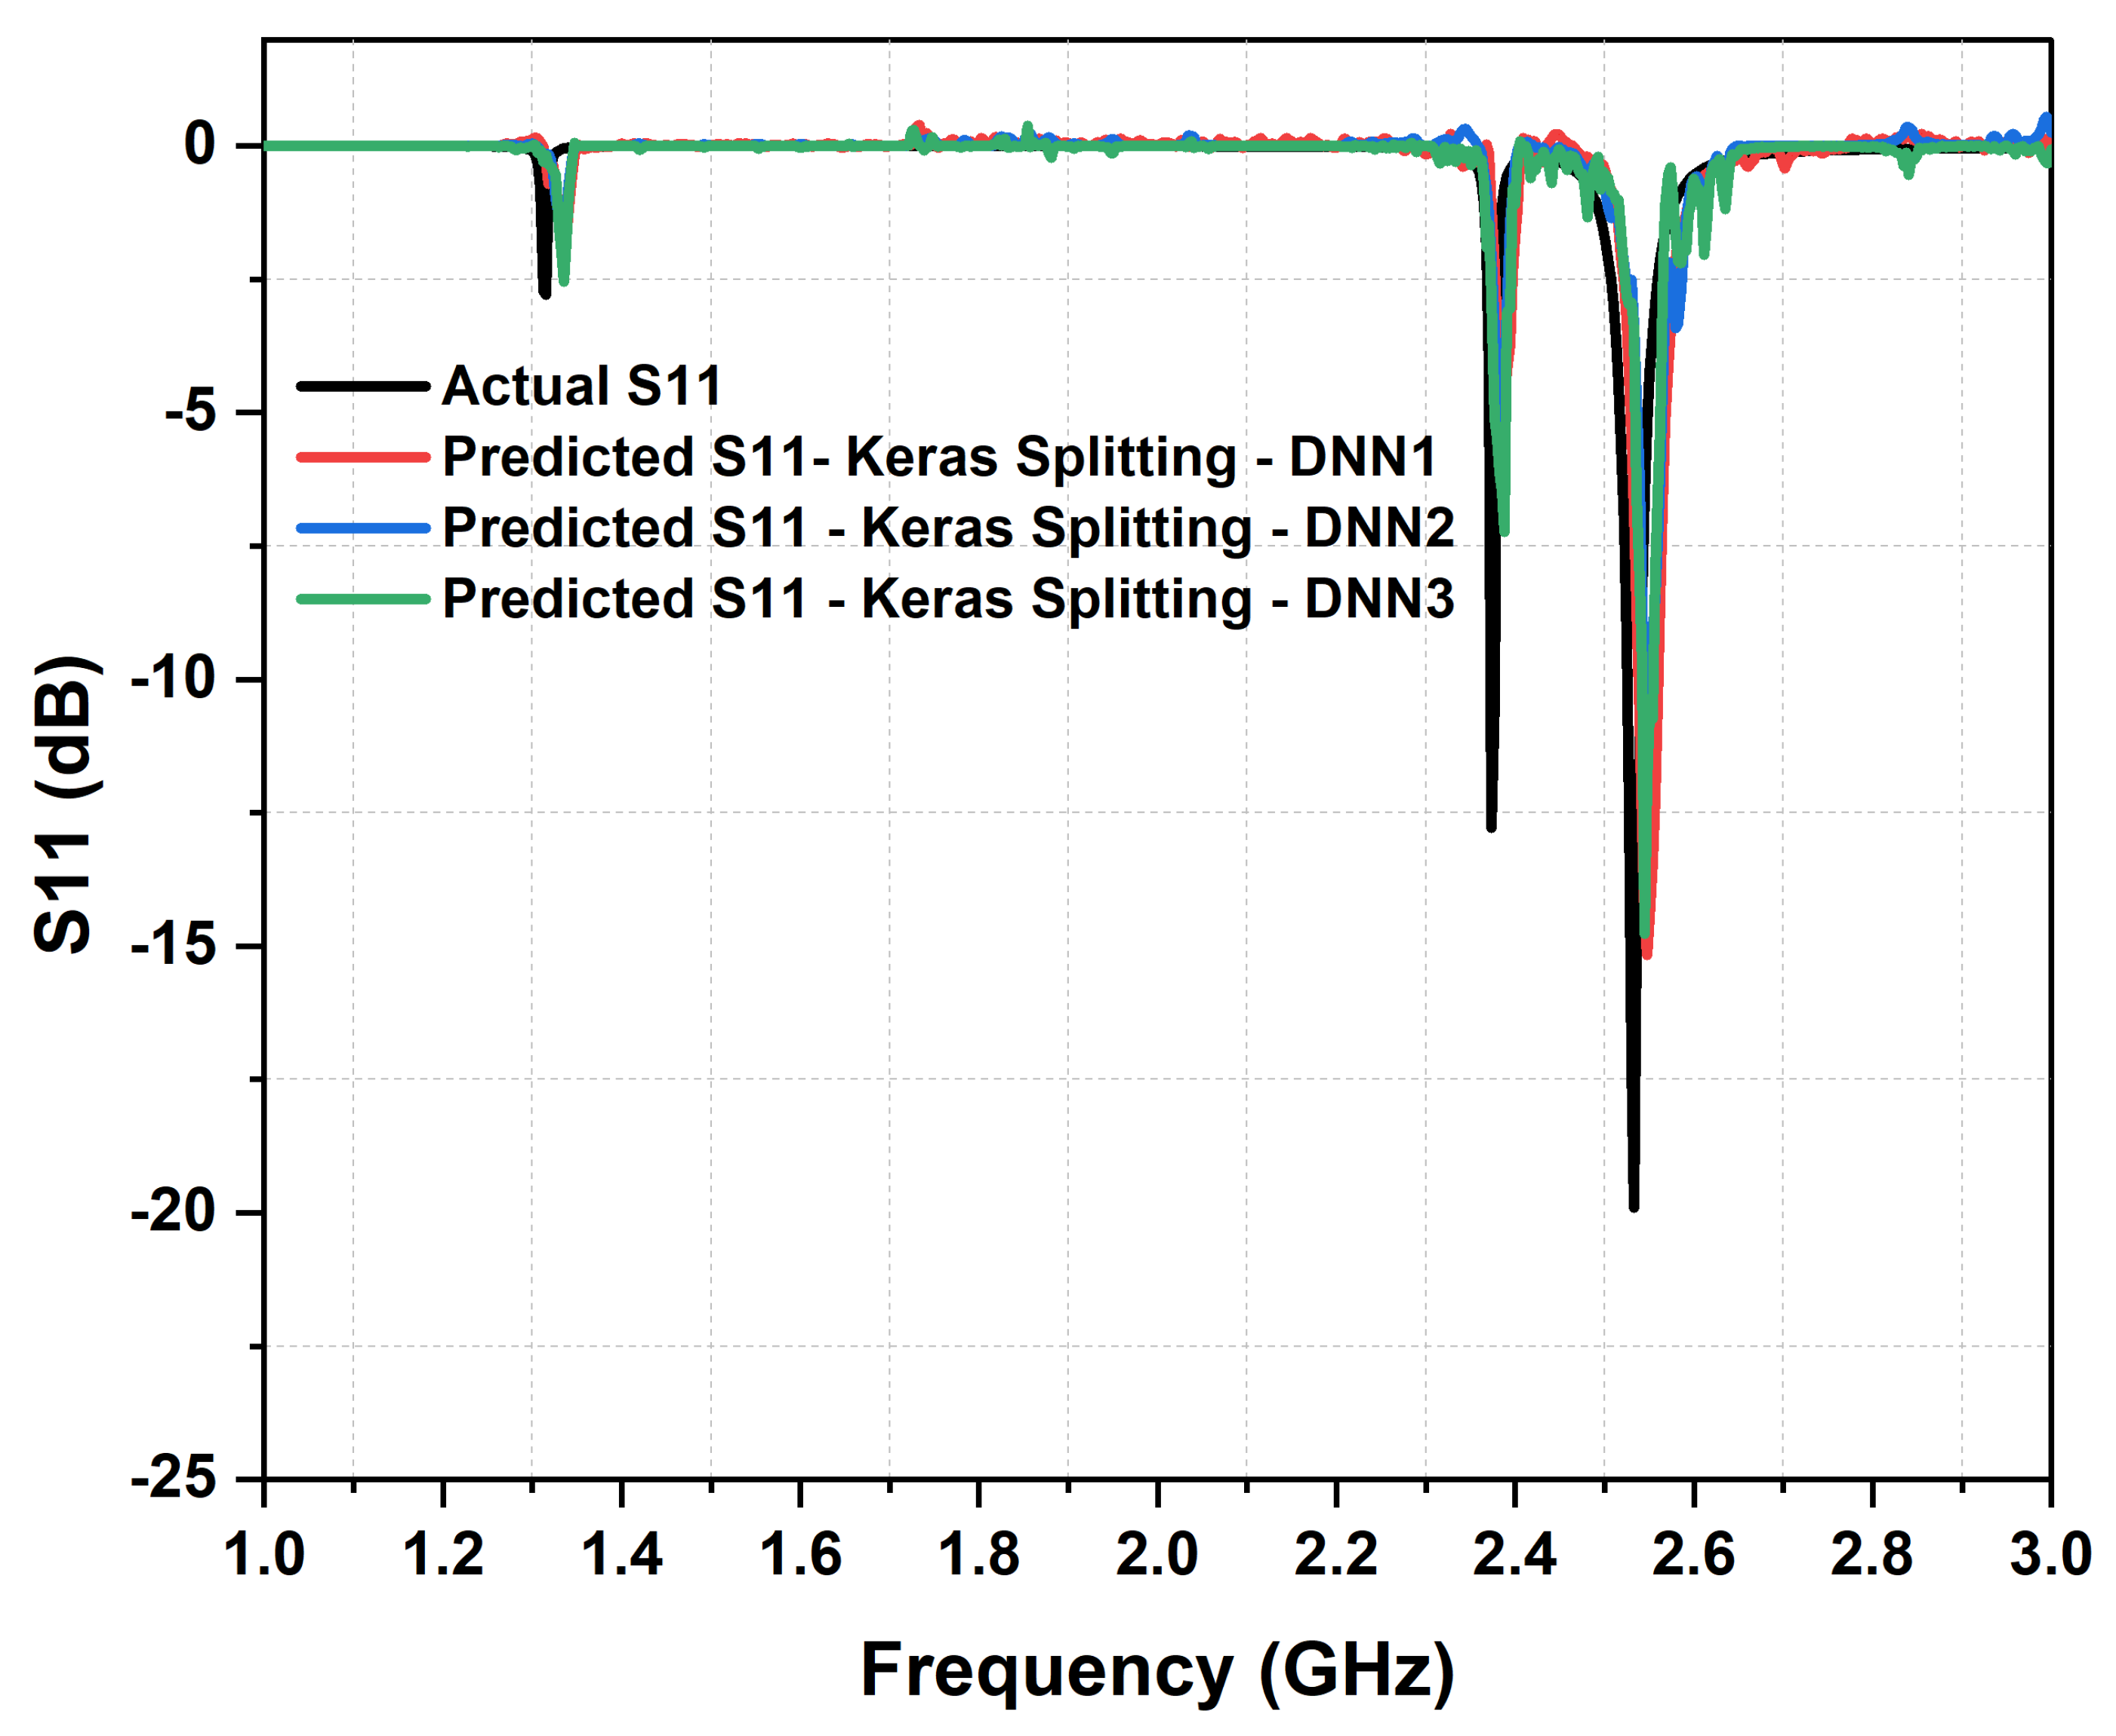
Figure 8.
Comparing the actual absorbance and predicted absorbance, from the three cascaded DNN with Keras Split function and 4,000 samples dataset. The actual metasurface absorber design parameters are: 1.4 mm , = , = , 0.13 mm, 0.9 mm, 14 mm, 8 mm, and L = 30 mm.
Figure 8.
Comparing the actual absorbance and predicted absorbance, from the three cascaded DNN with Keras Split function and 4,000 samples dataset. The actual metasurface absorber design parameters are: 1.4 mm , = , = , 0.13 mm, 0.9 mm, 14 mm, 8 mm, and L = 30 mm.
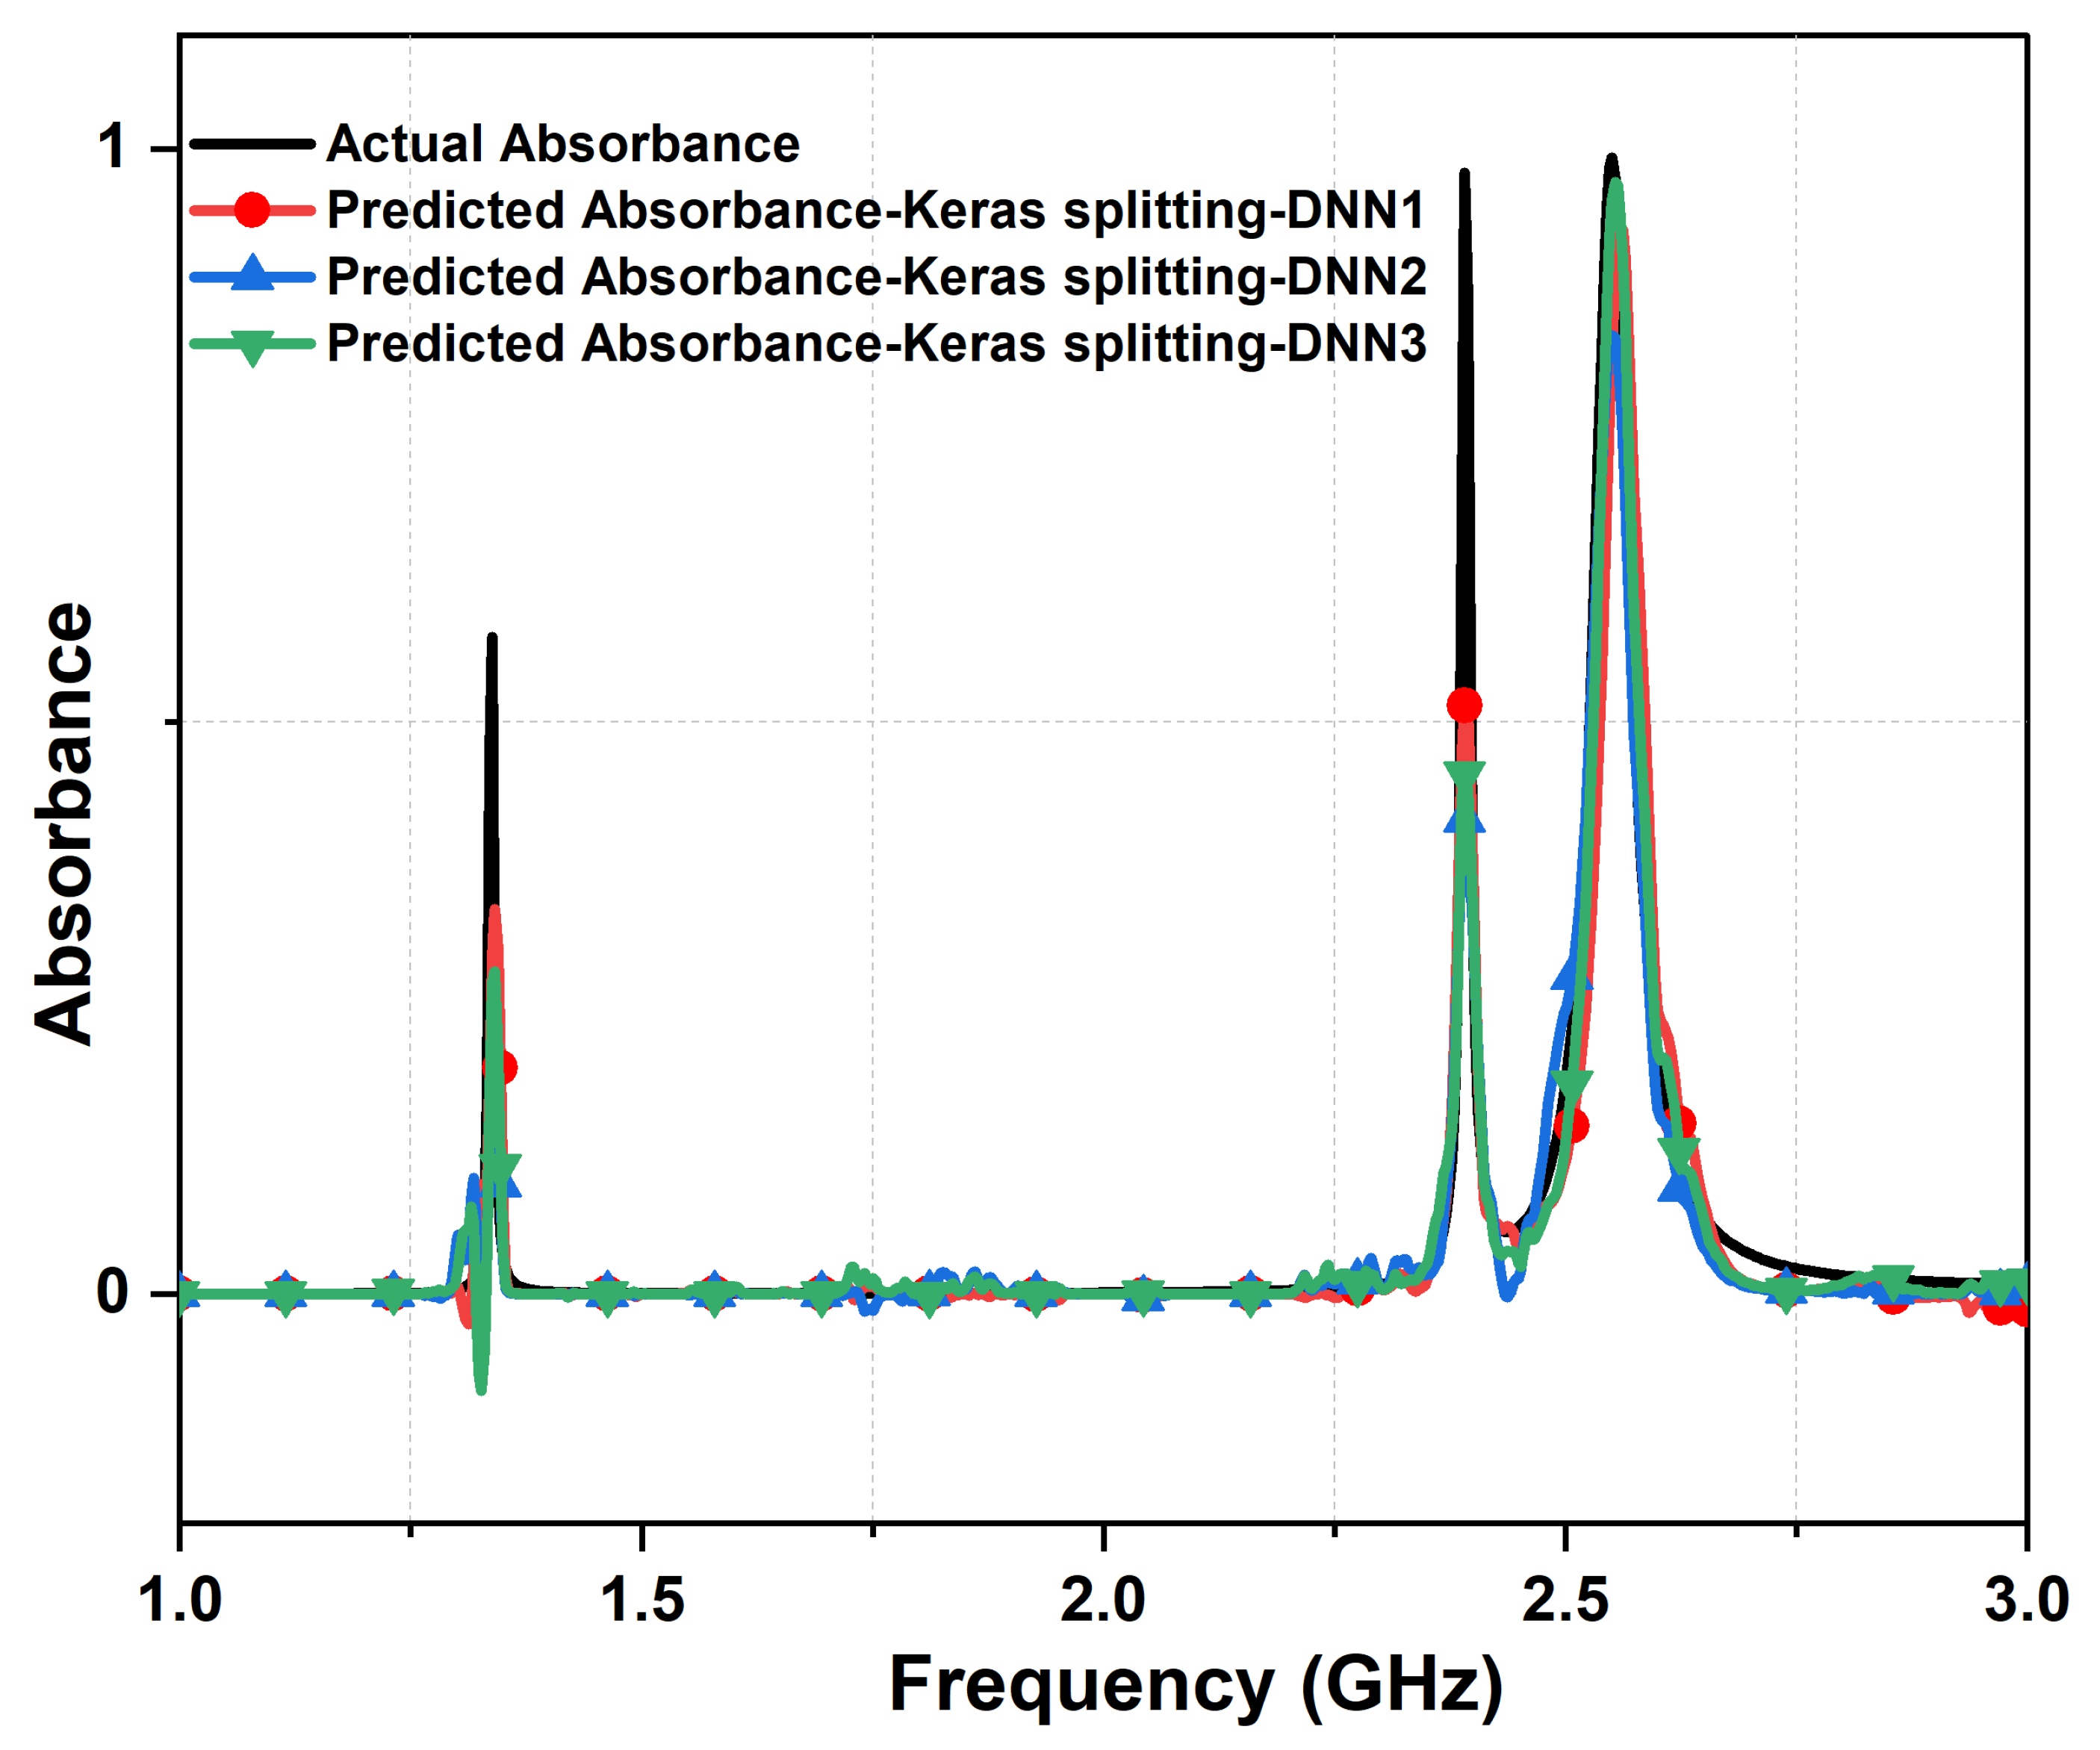
Figure 9.
Comparing the actual response of and predicted response, from the three cascaded DNN with our proposed adaptive data merging technique and 4,000 samples dataset. The actual metasurface absorber design parameters are:1.4 mm , = , = , 0.6 mm, 0.2 mm, 14 mm, 8 mm, and L = 30 mm.
Figure 9.
Comparing the actual response of and predicted response, from the three cascaded DNN with our proposed adaptive data merging technique and 4,000 samples dataset. The actual metasurface absorber design parameters are:1.4 mm , = , = , 0.6 mm, 0.2 mm, 14 mm, 8 mm, and L = 30 mm.
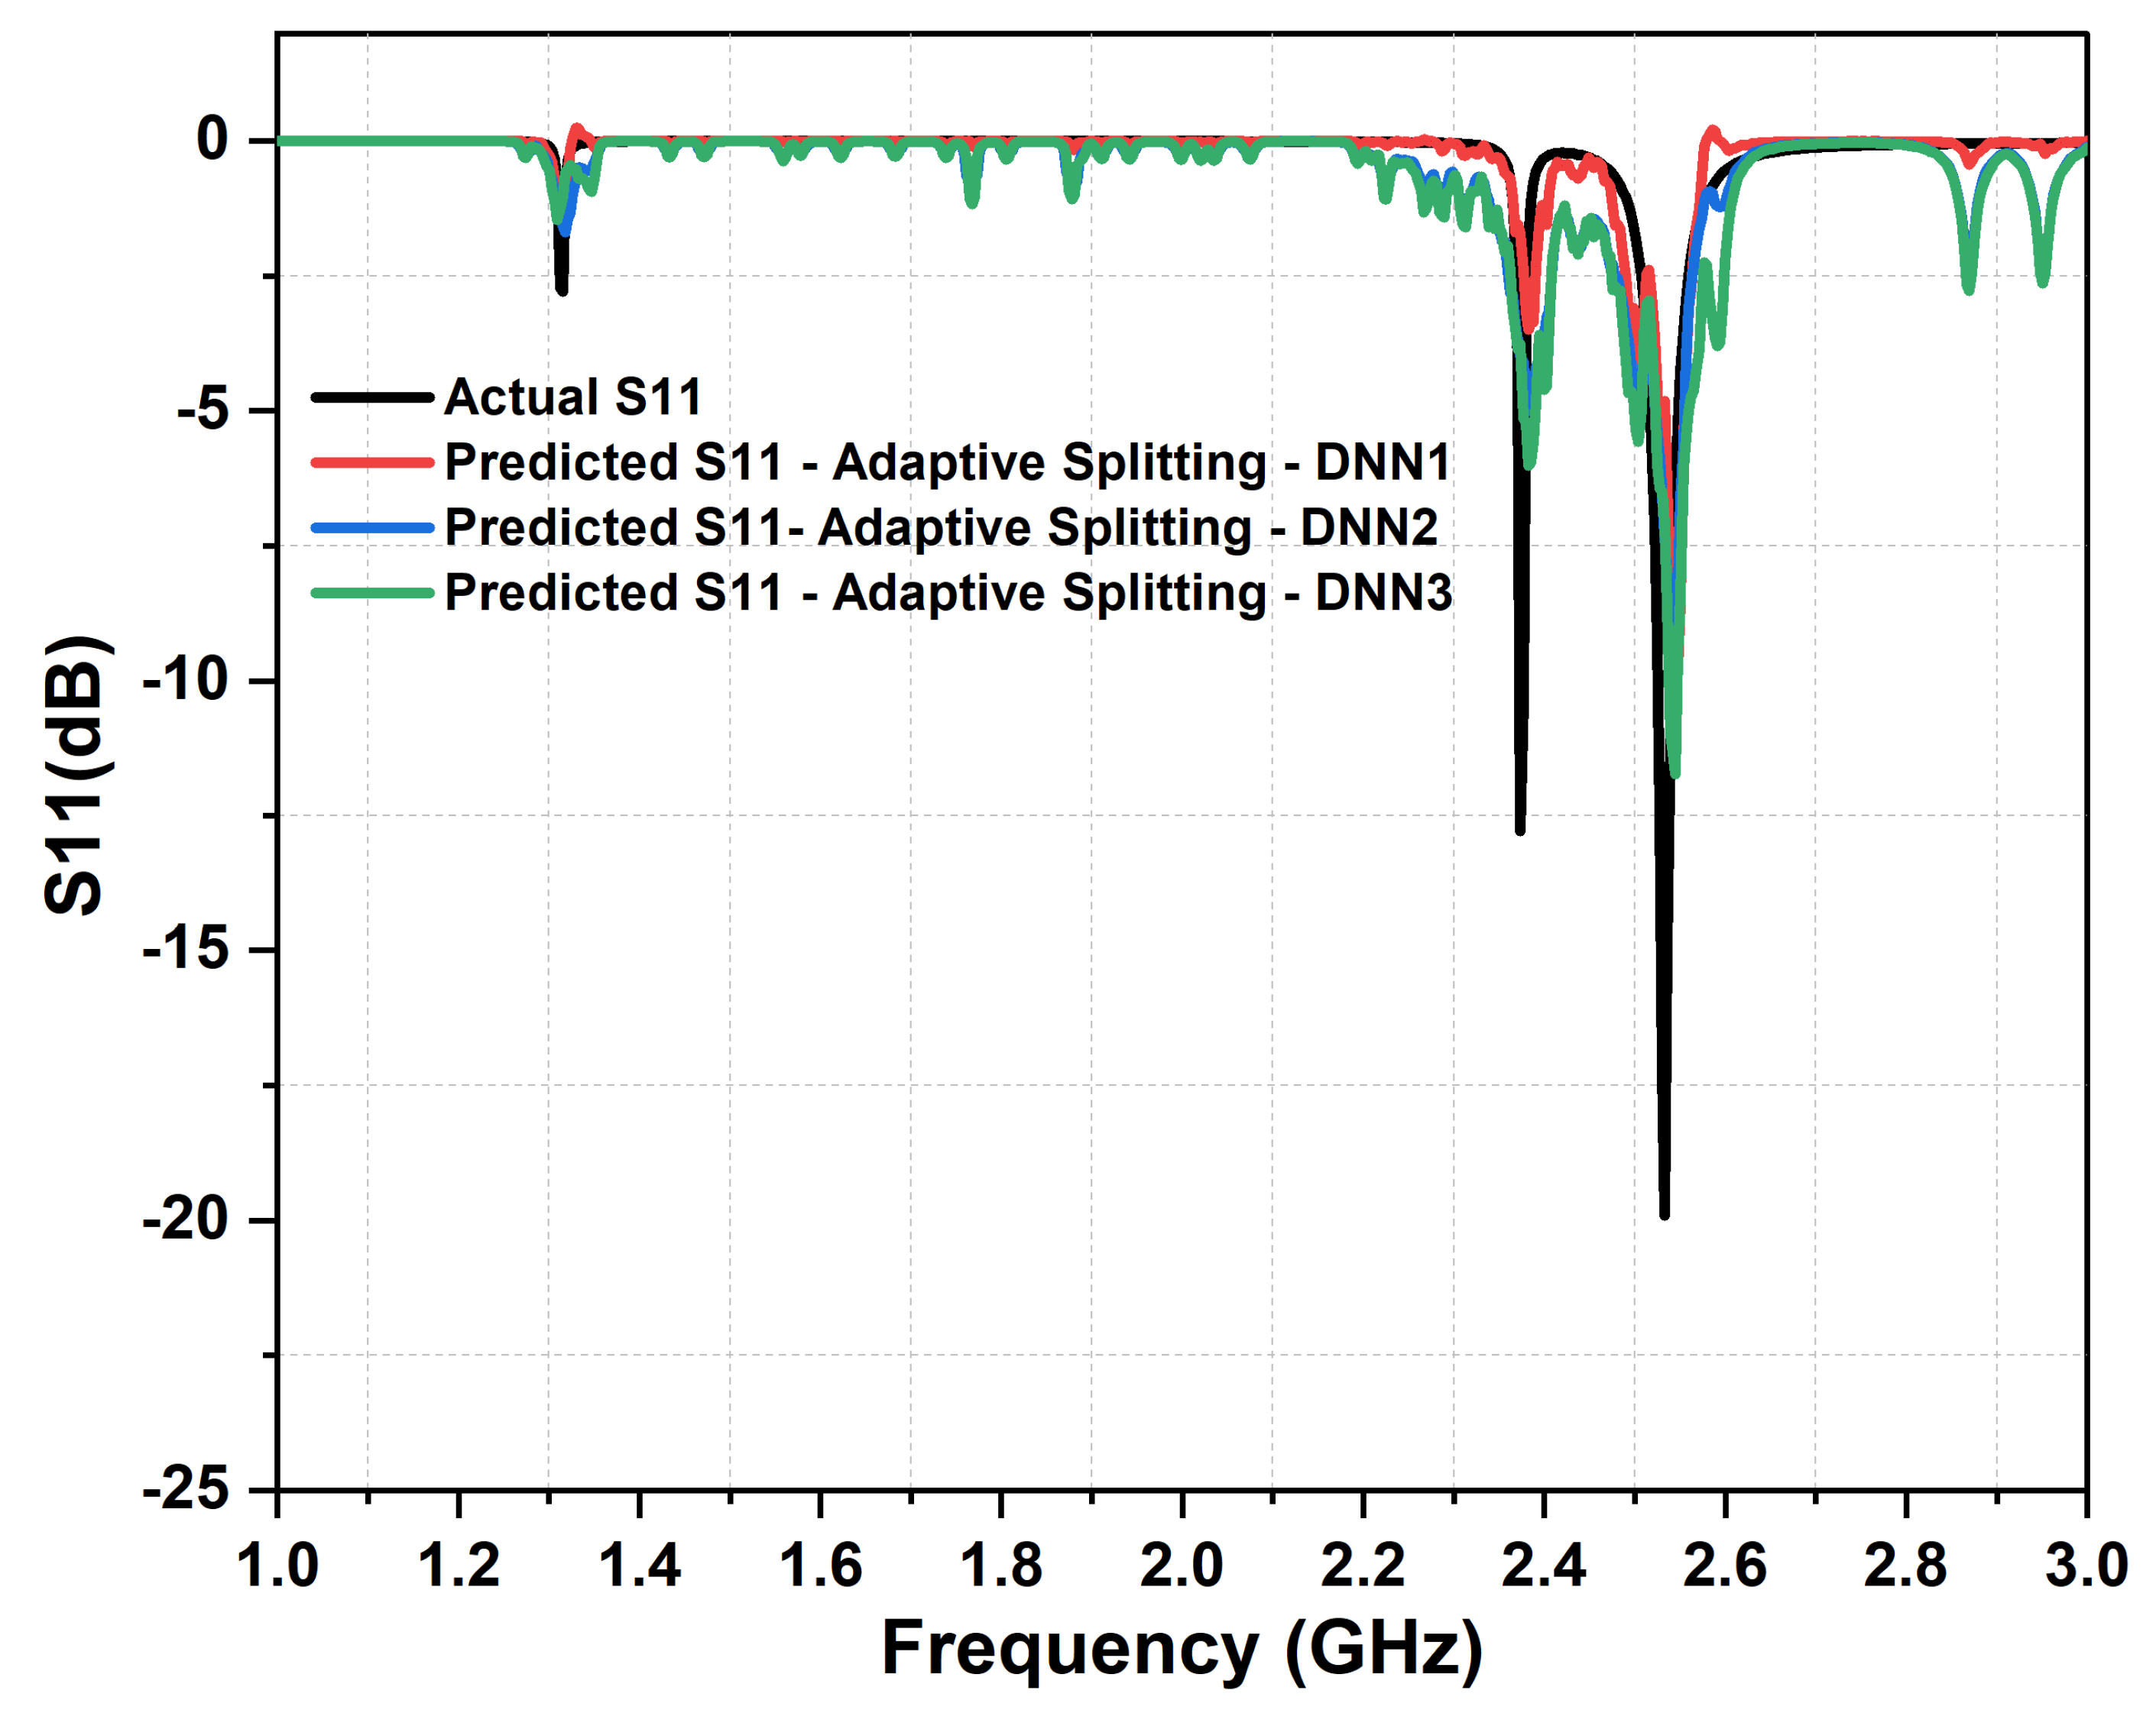
Figure 10.
Comparing the actual absorbance and predicted absorbance, from the three cascaded DNN with Adaptive Split function and 4,000 samples dataset. The actual metasurface absorber design parameters are: 1.4 mm , = , = , 0.13 mm, 0.9 mm, 14 mm, 8 mm, and L = 30 mm.
Figure 10.
Comparing the actual absorbance and predicted absorbance, from the three cascaded DNN with Adaptive Split function and 4,000 samples dataset. The actual metasurface absorber design parameters are: 1.4 mm , = , = , 0.13 mm, 0.9 mm, 14 mm, 8 mm, and L = 30 mm.
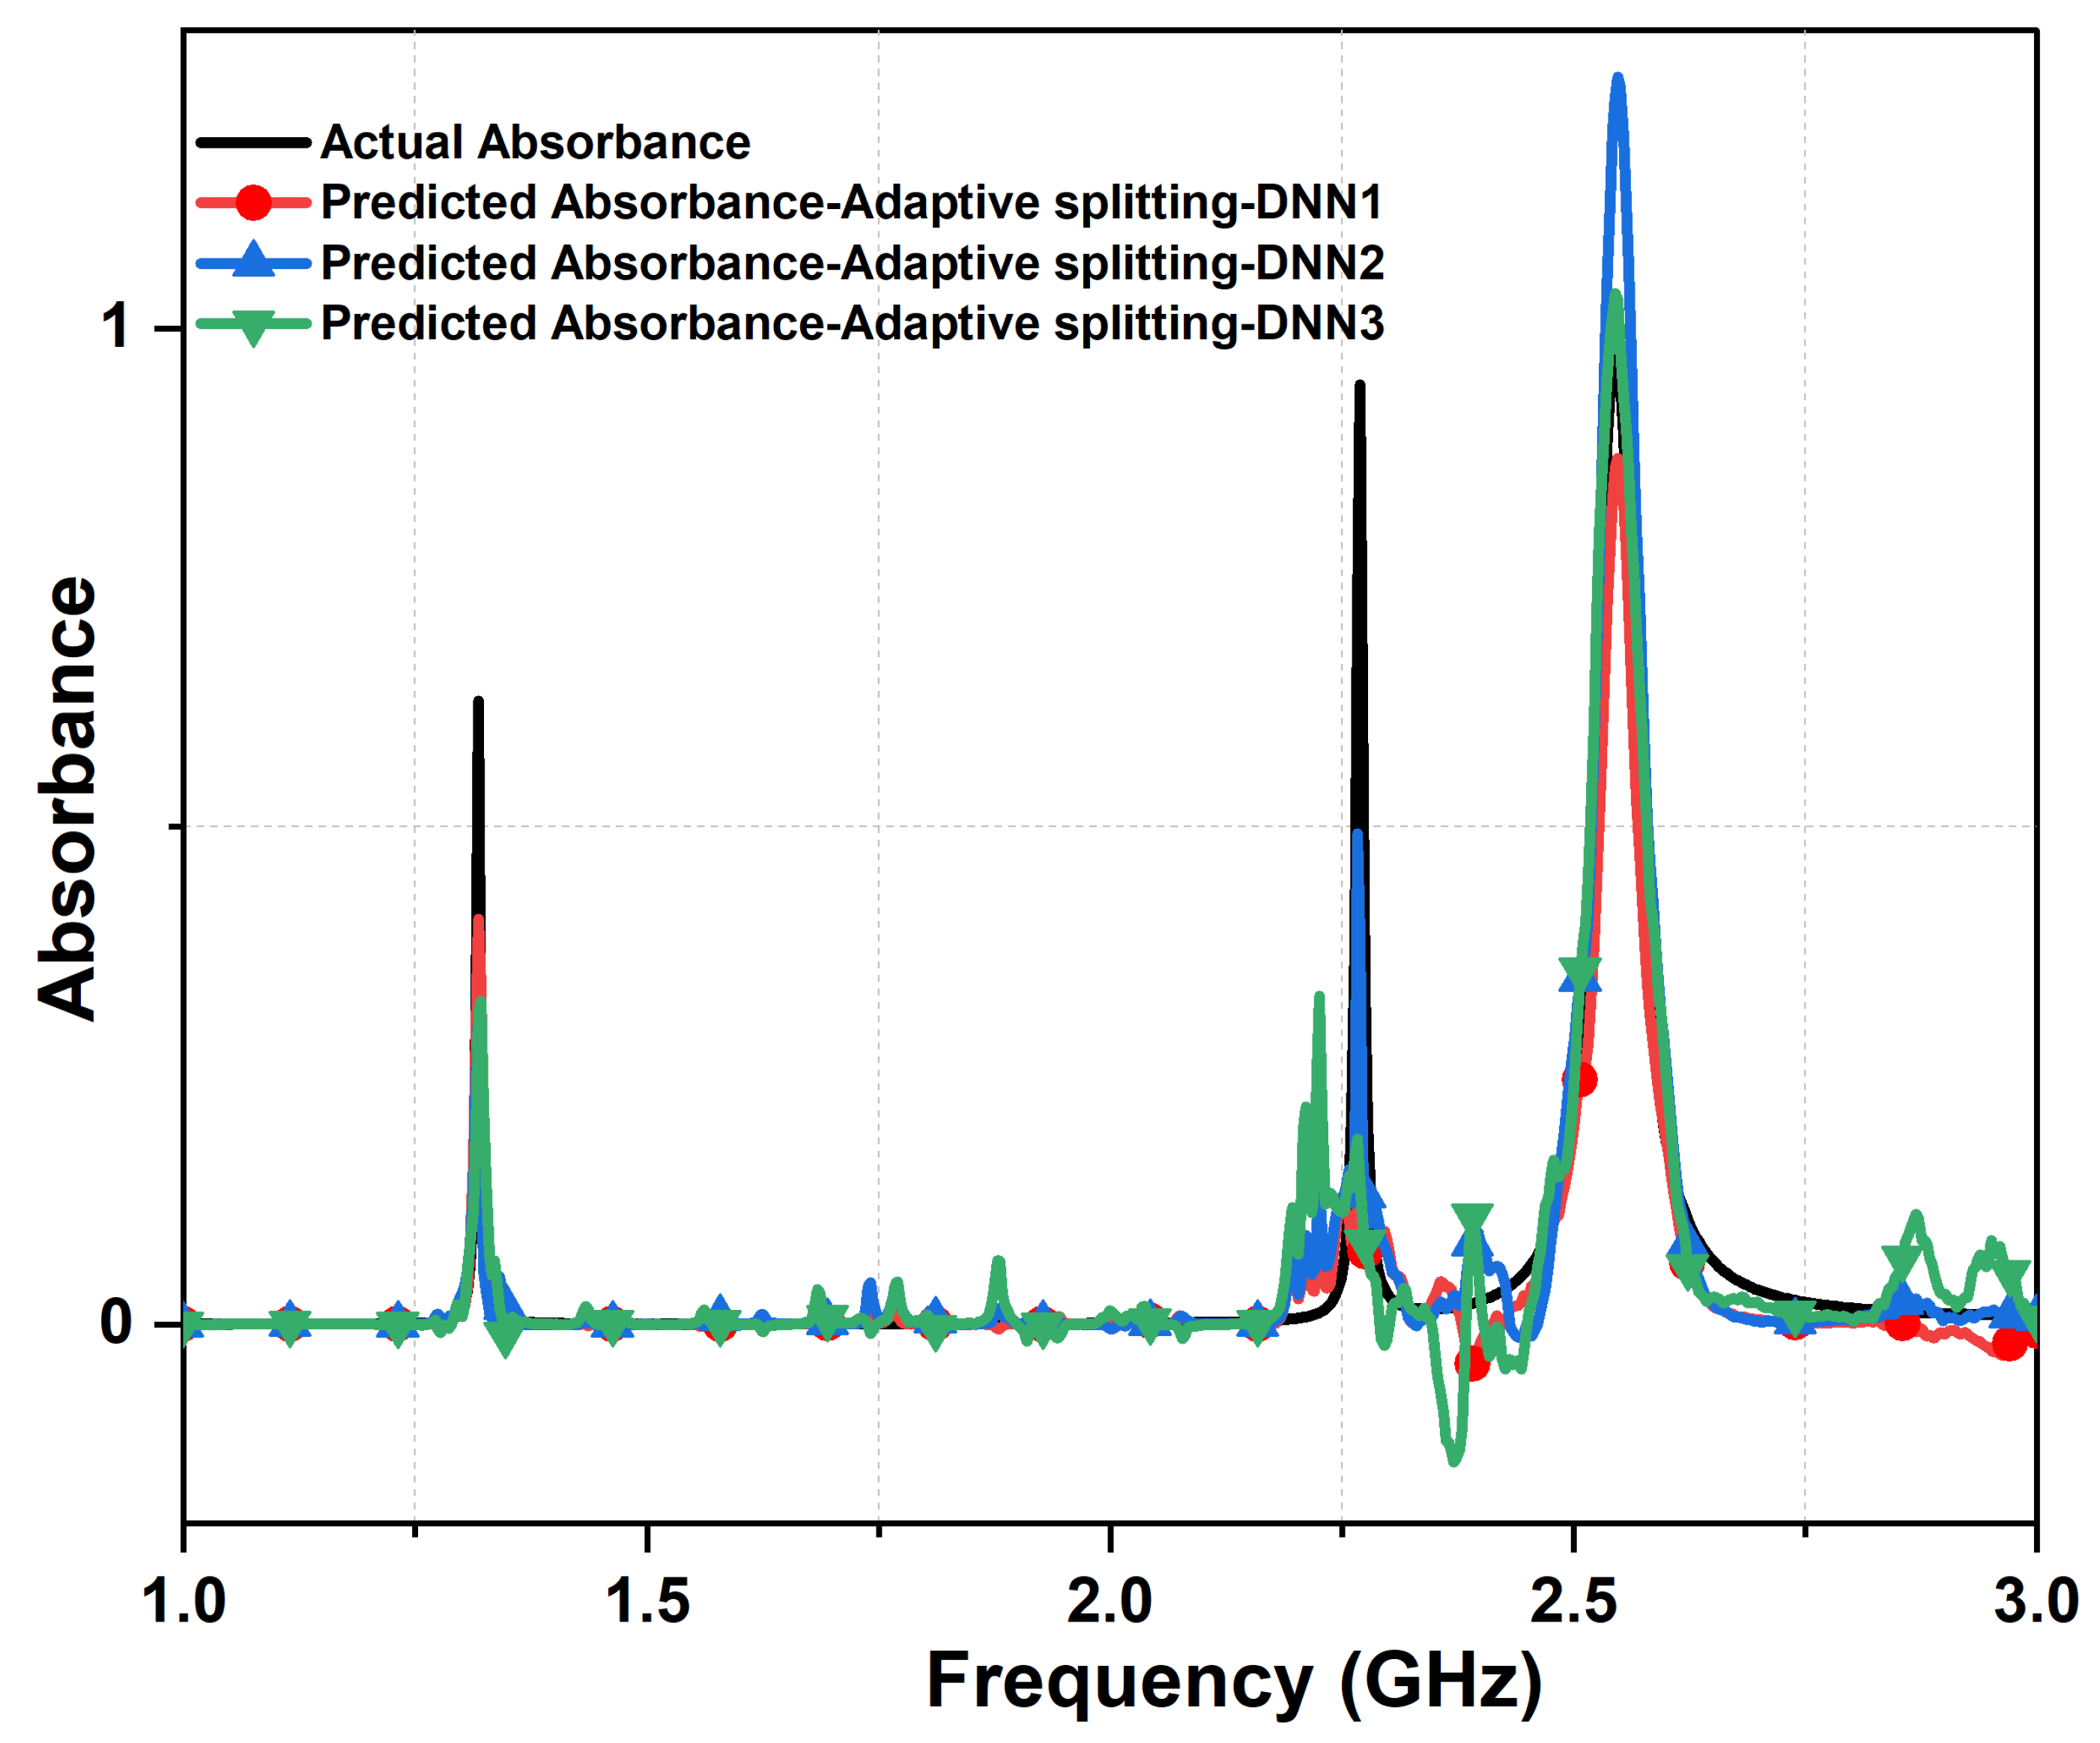
Figure 11.
Comparing the actual absorbance and predicted absorbance between descending and ascending order, from the second DNN. The actual metasurface absorber design parameters are: 1.4 mm, = , = , 0.13 mm, 0.9 mm, 14 mm, 8 mm, and L = 30 mm.
Figure 11.
Comparing the actual absorbance and predicted absorbance between descending and ascending order, from the second DNN. The actual metasurface absorber design parameters are: 1.4 mm, = , = , 0.13 mm, 0.9 mm, 14 mm, 8 mm, and L = 30 mm.
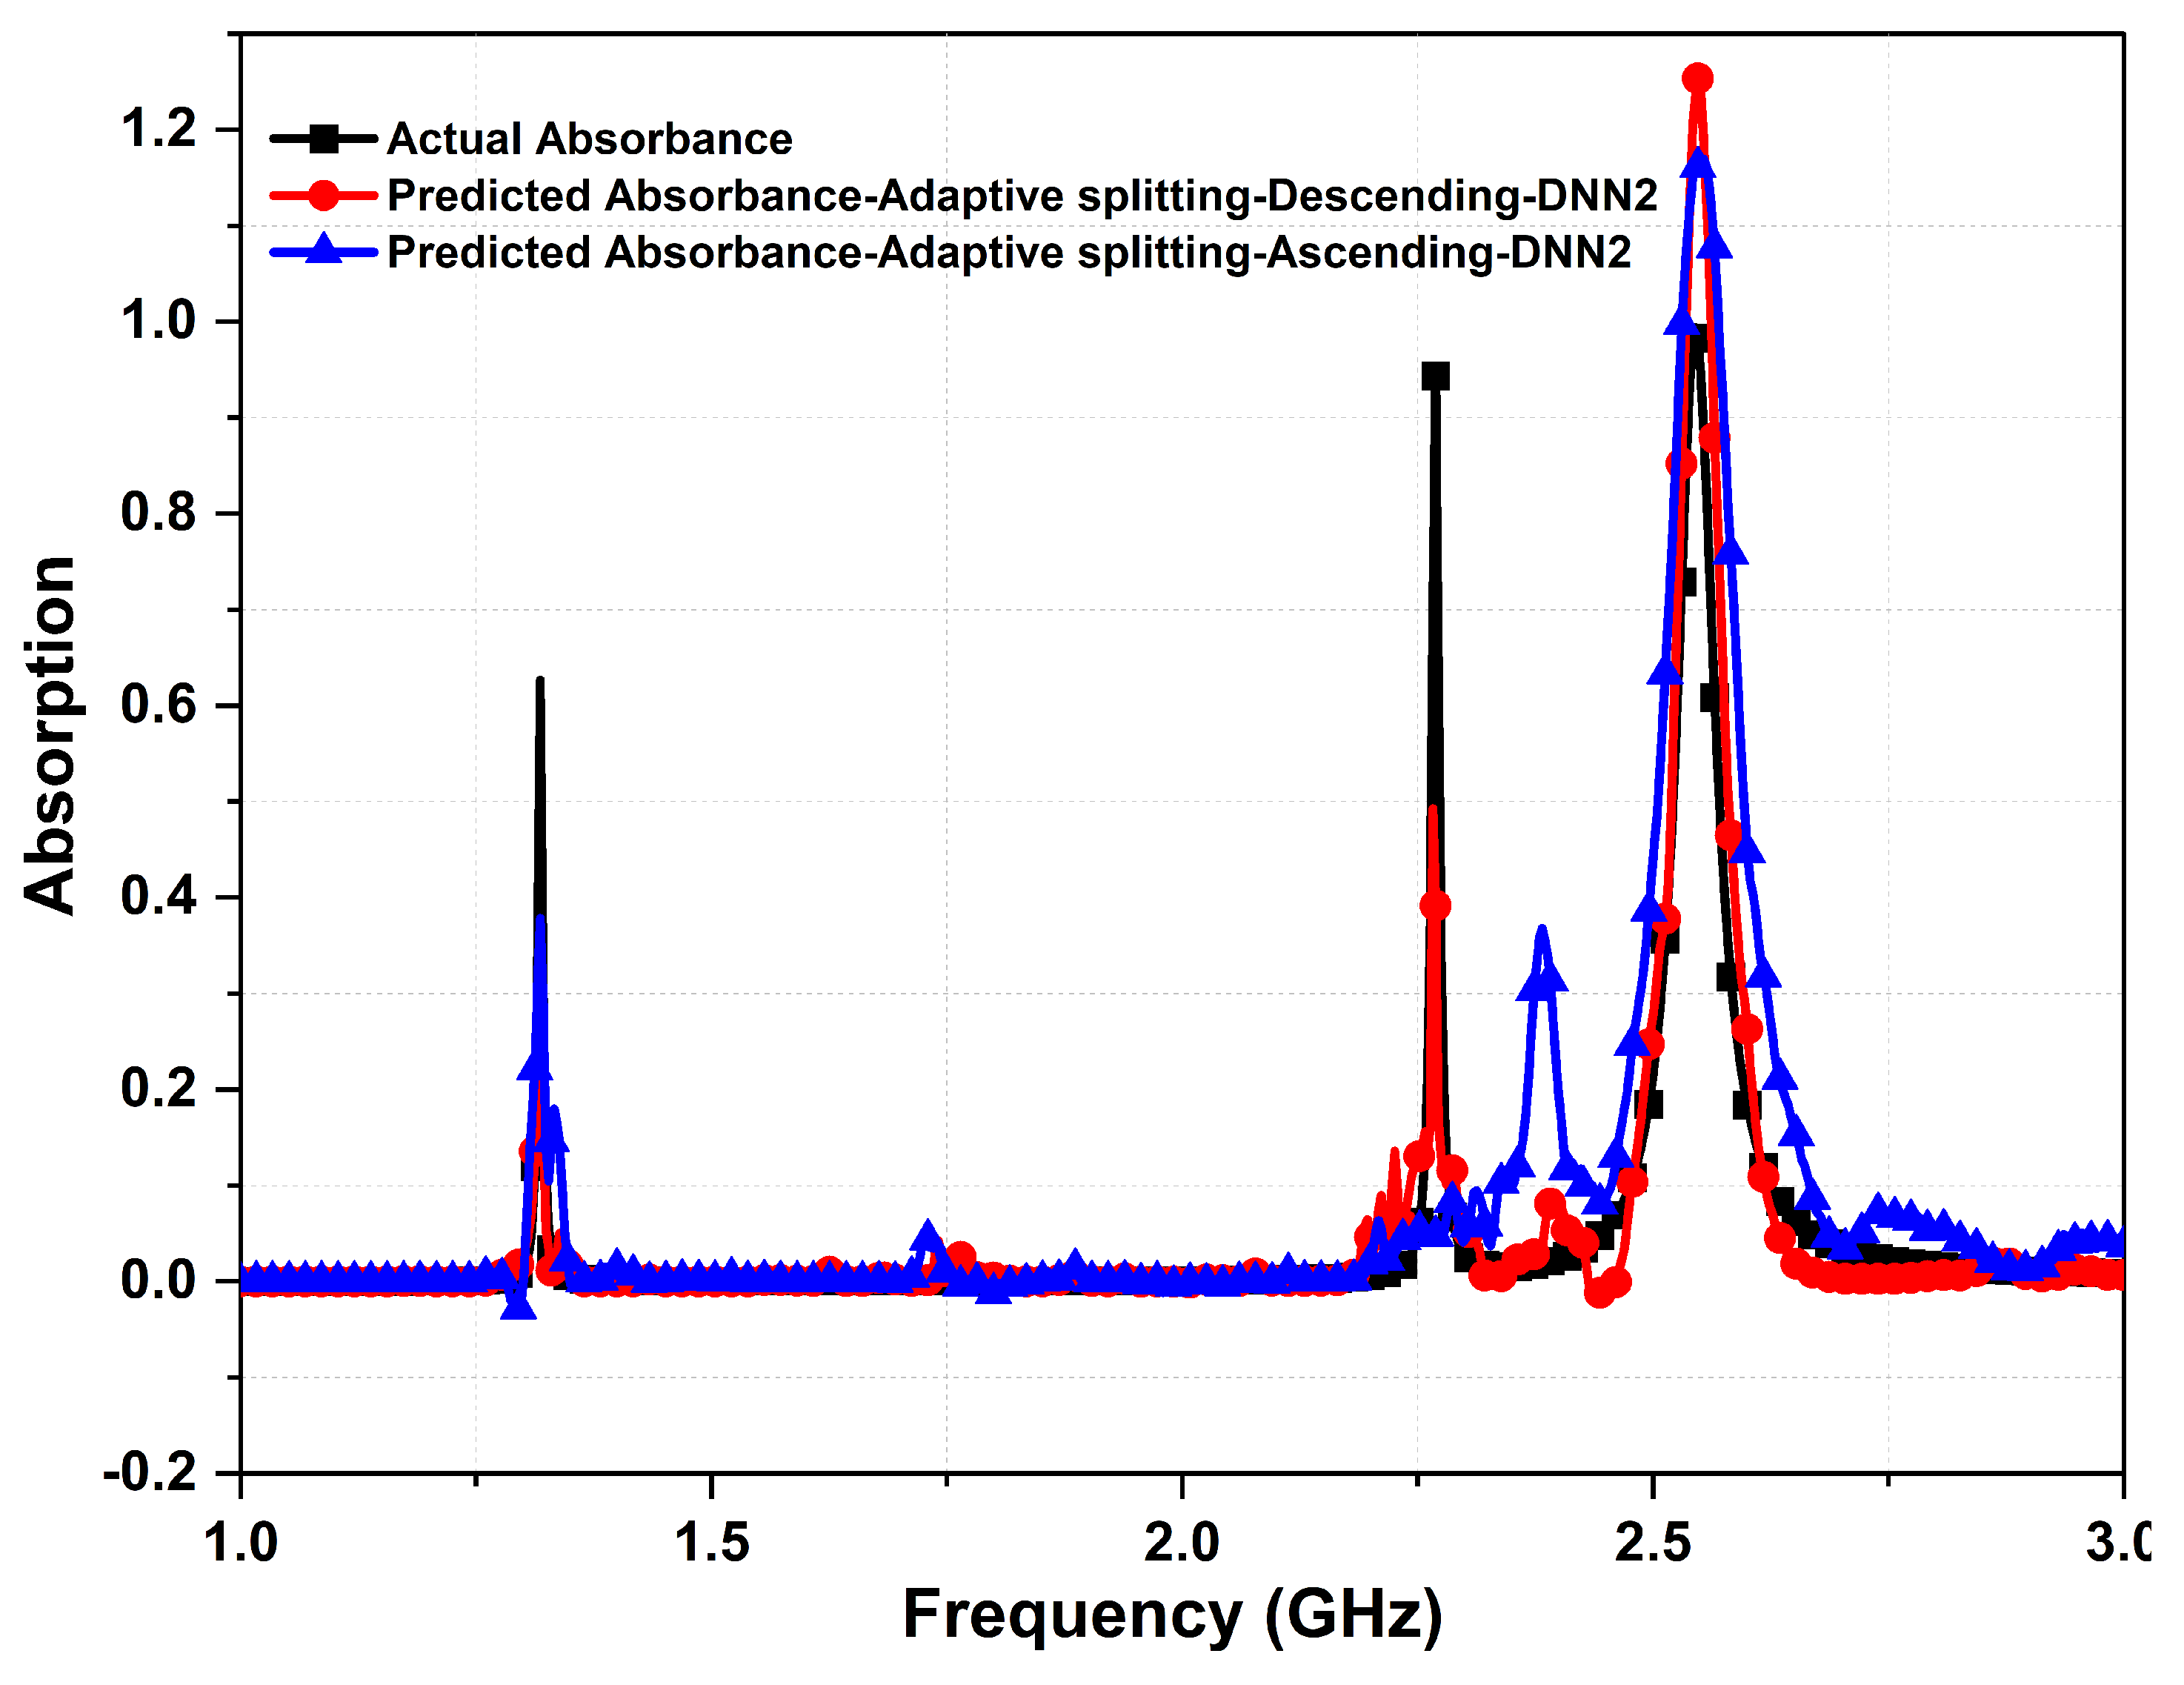
Figure 12.
Comparing the prediction accuracy between the trained DL model with descending and ascending order data sorting.
Figure 12.
Comparing the prediction accuracy between the trained DL model with descending and ascending order data sorting.
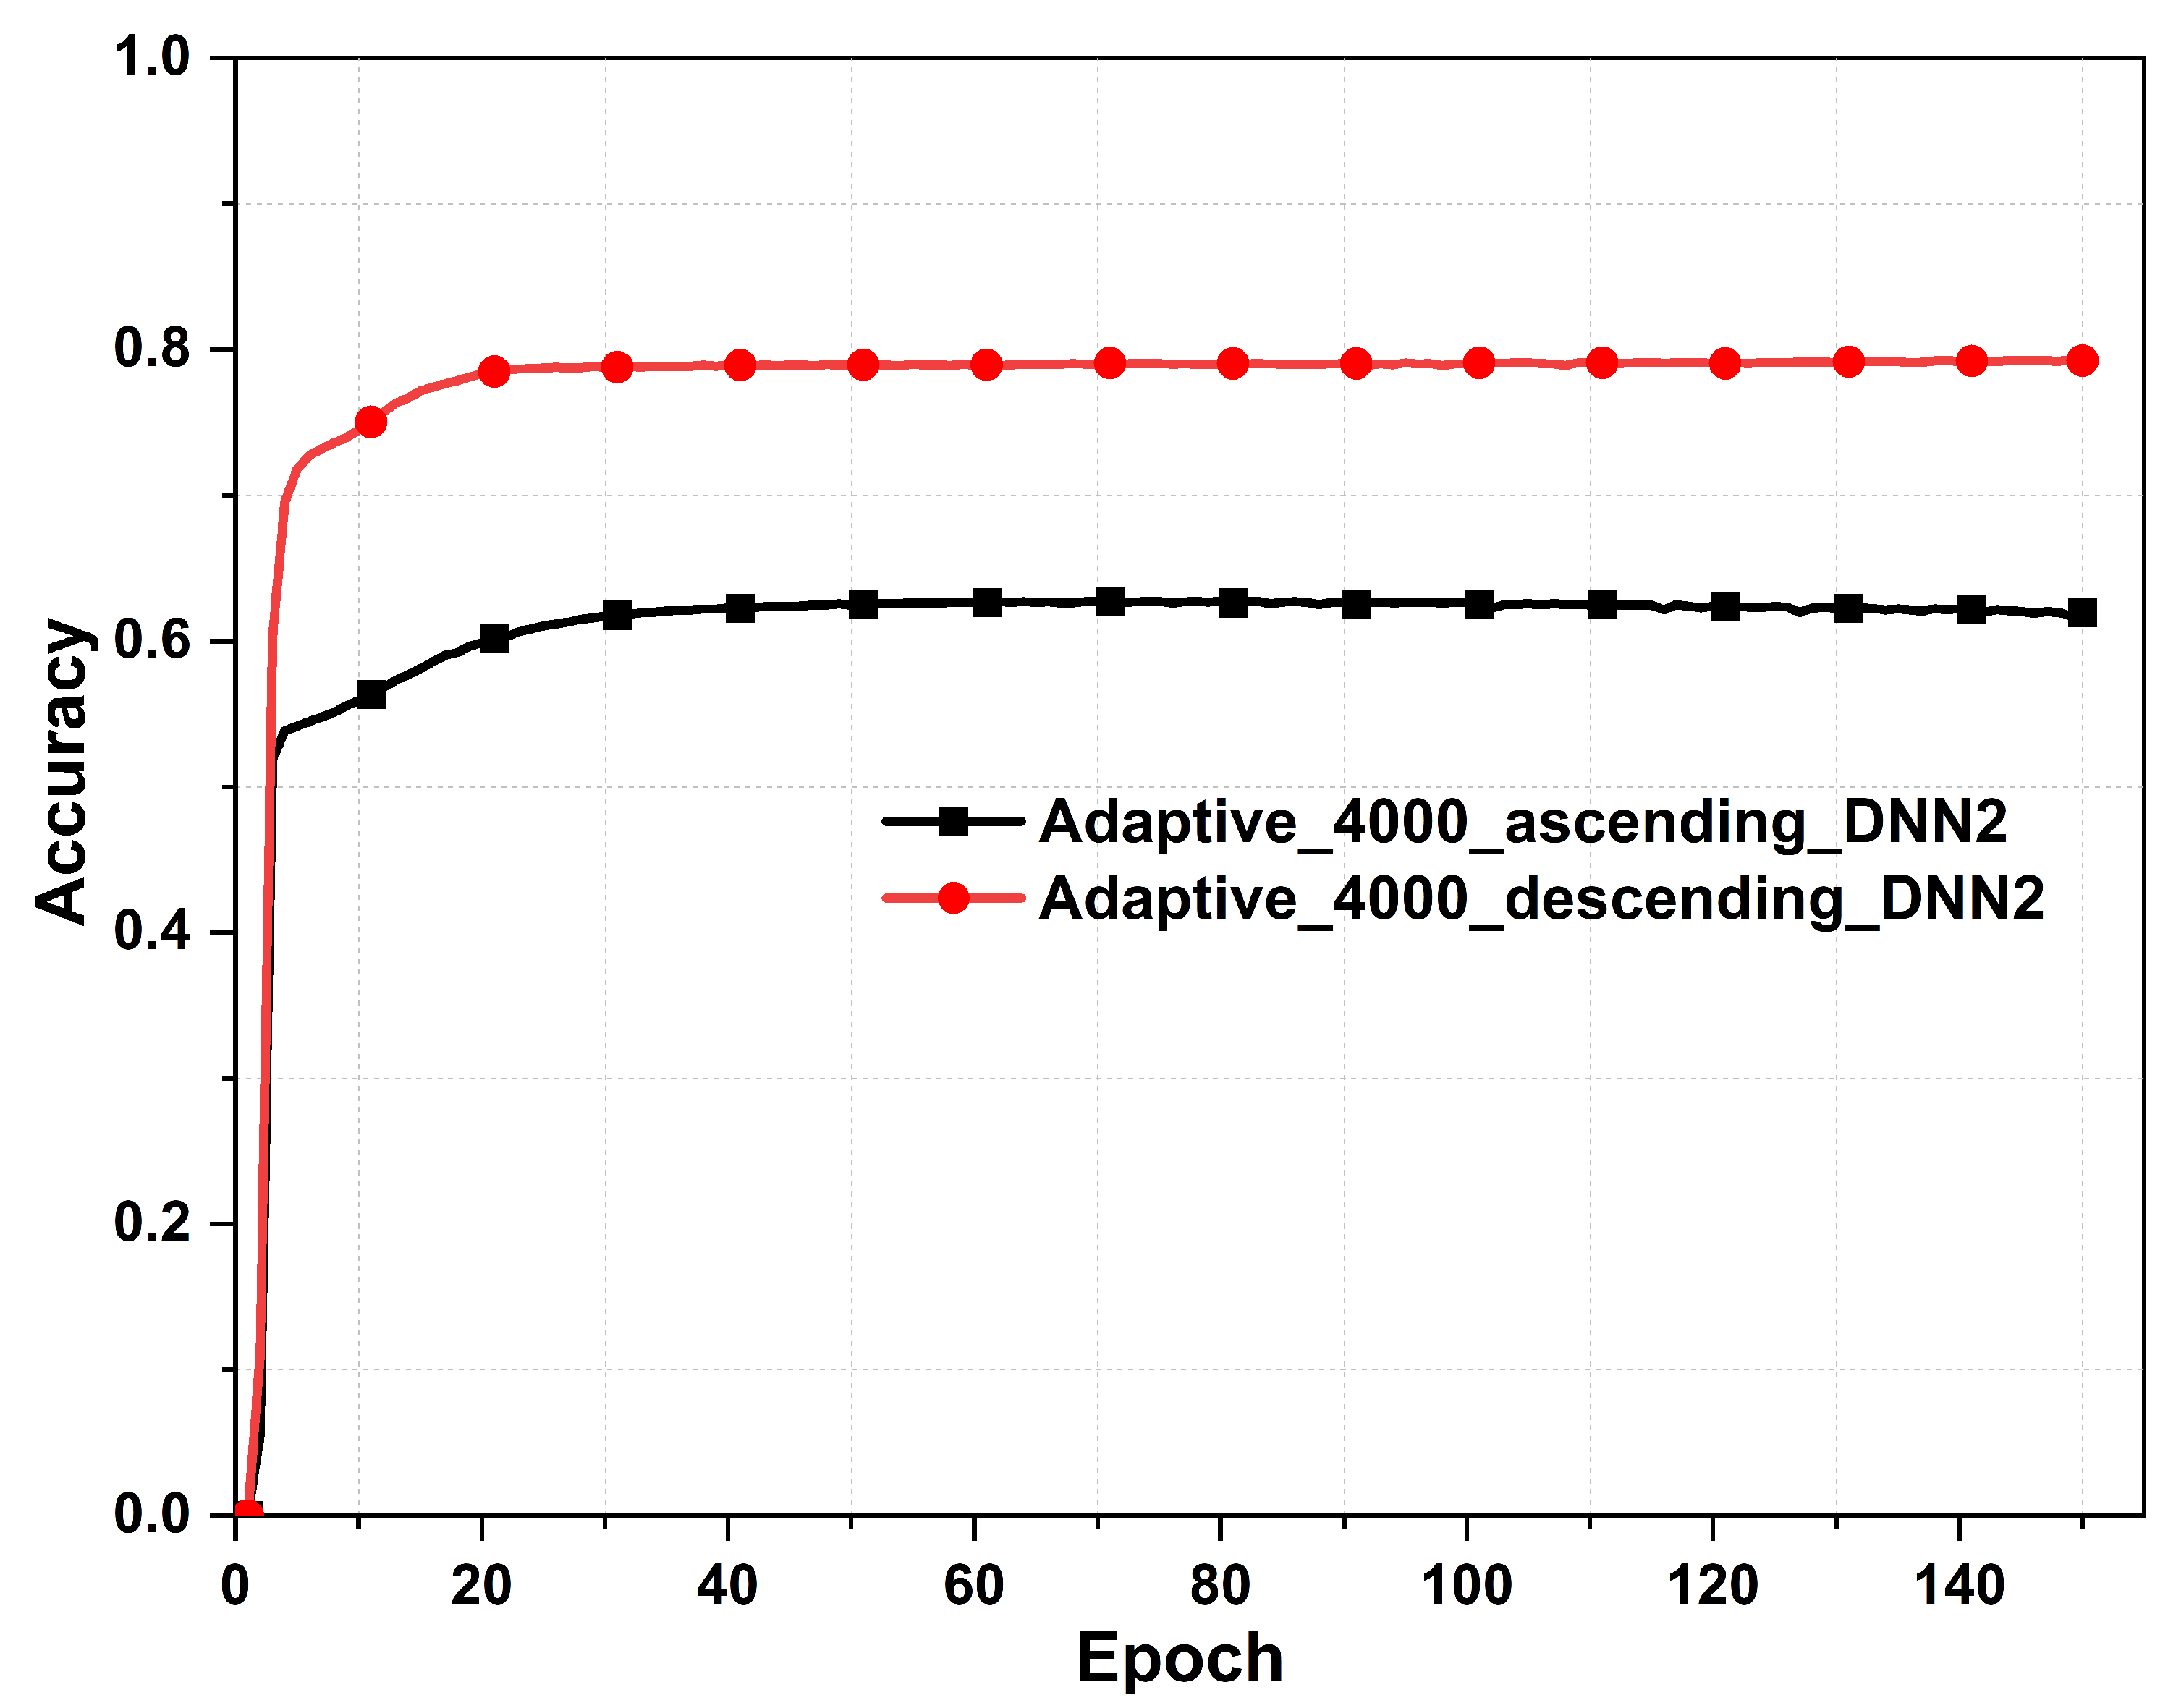
Figure 13.
Comparing the actual absorbance and predicted absorbance between descending order data sorting and bootstrap method, from the second DNN. The actual metasurface absorber design parameters are: 1.4 mm, = , = , 0.13 mm, 0.9 mm, 14 mm, 8 mm, and L = 30 mm.
Figure 13.
Comparing the actual absorbance and predicted absorbance between descending order data sorting and bootstrap method, from the second DNN. The actual metasurface absorber design parameters are: 1.4 mm, = , = , 0.13 mm, 0.9 mm, 14 mm, 8 mm, and L = 30 mm.
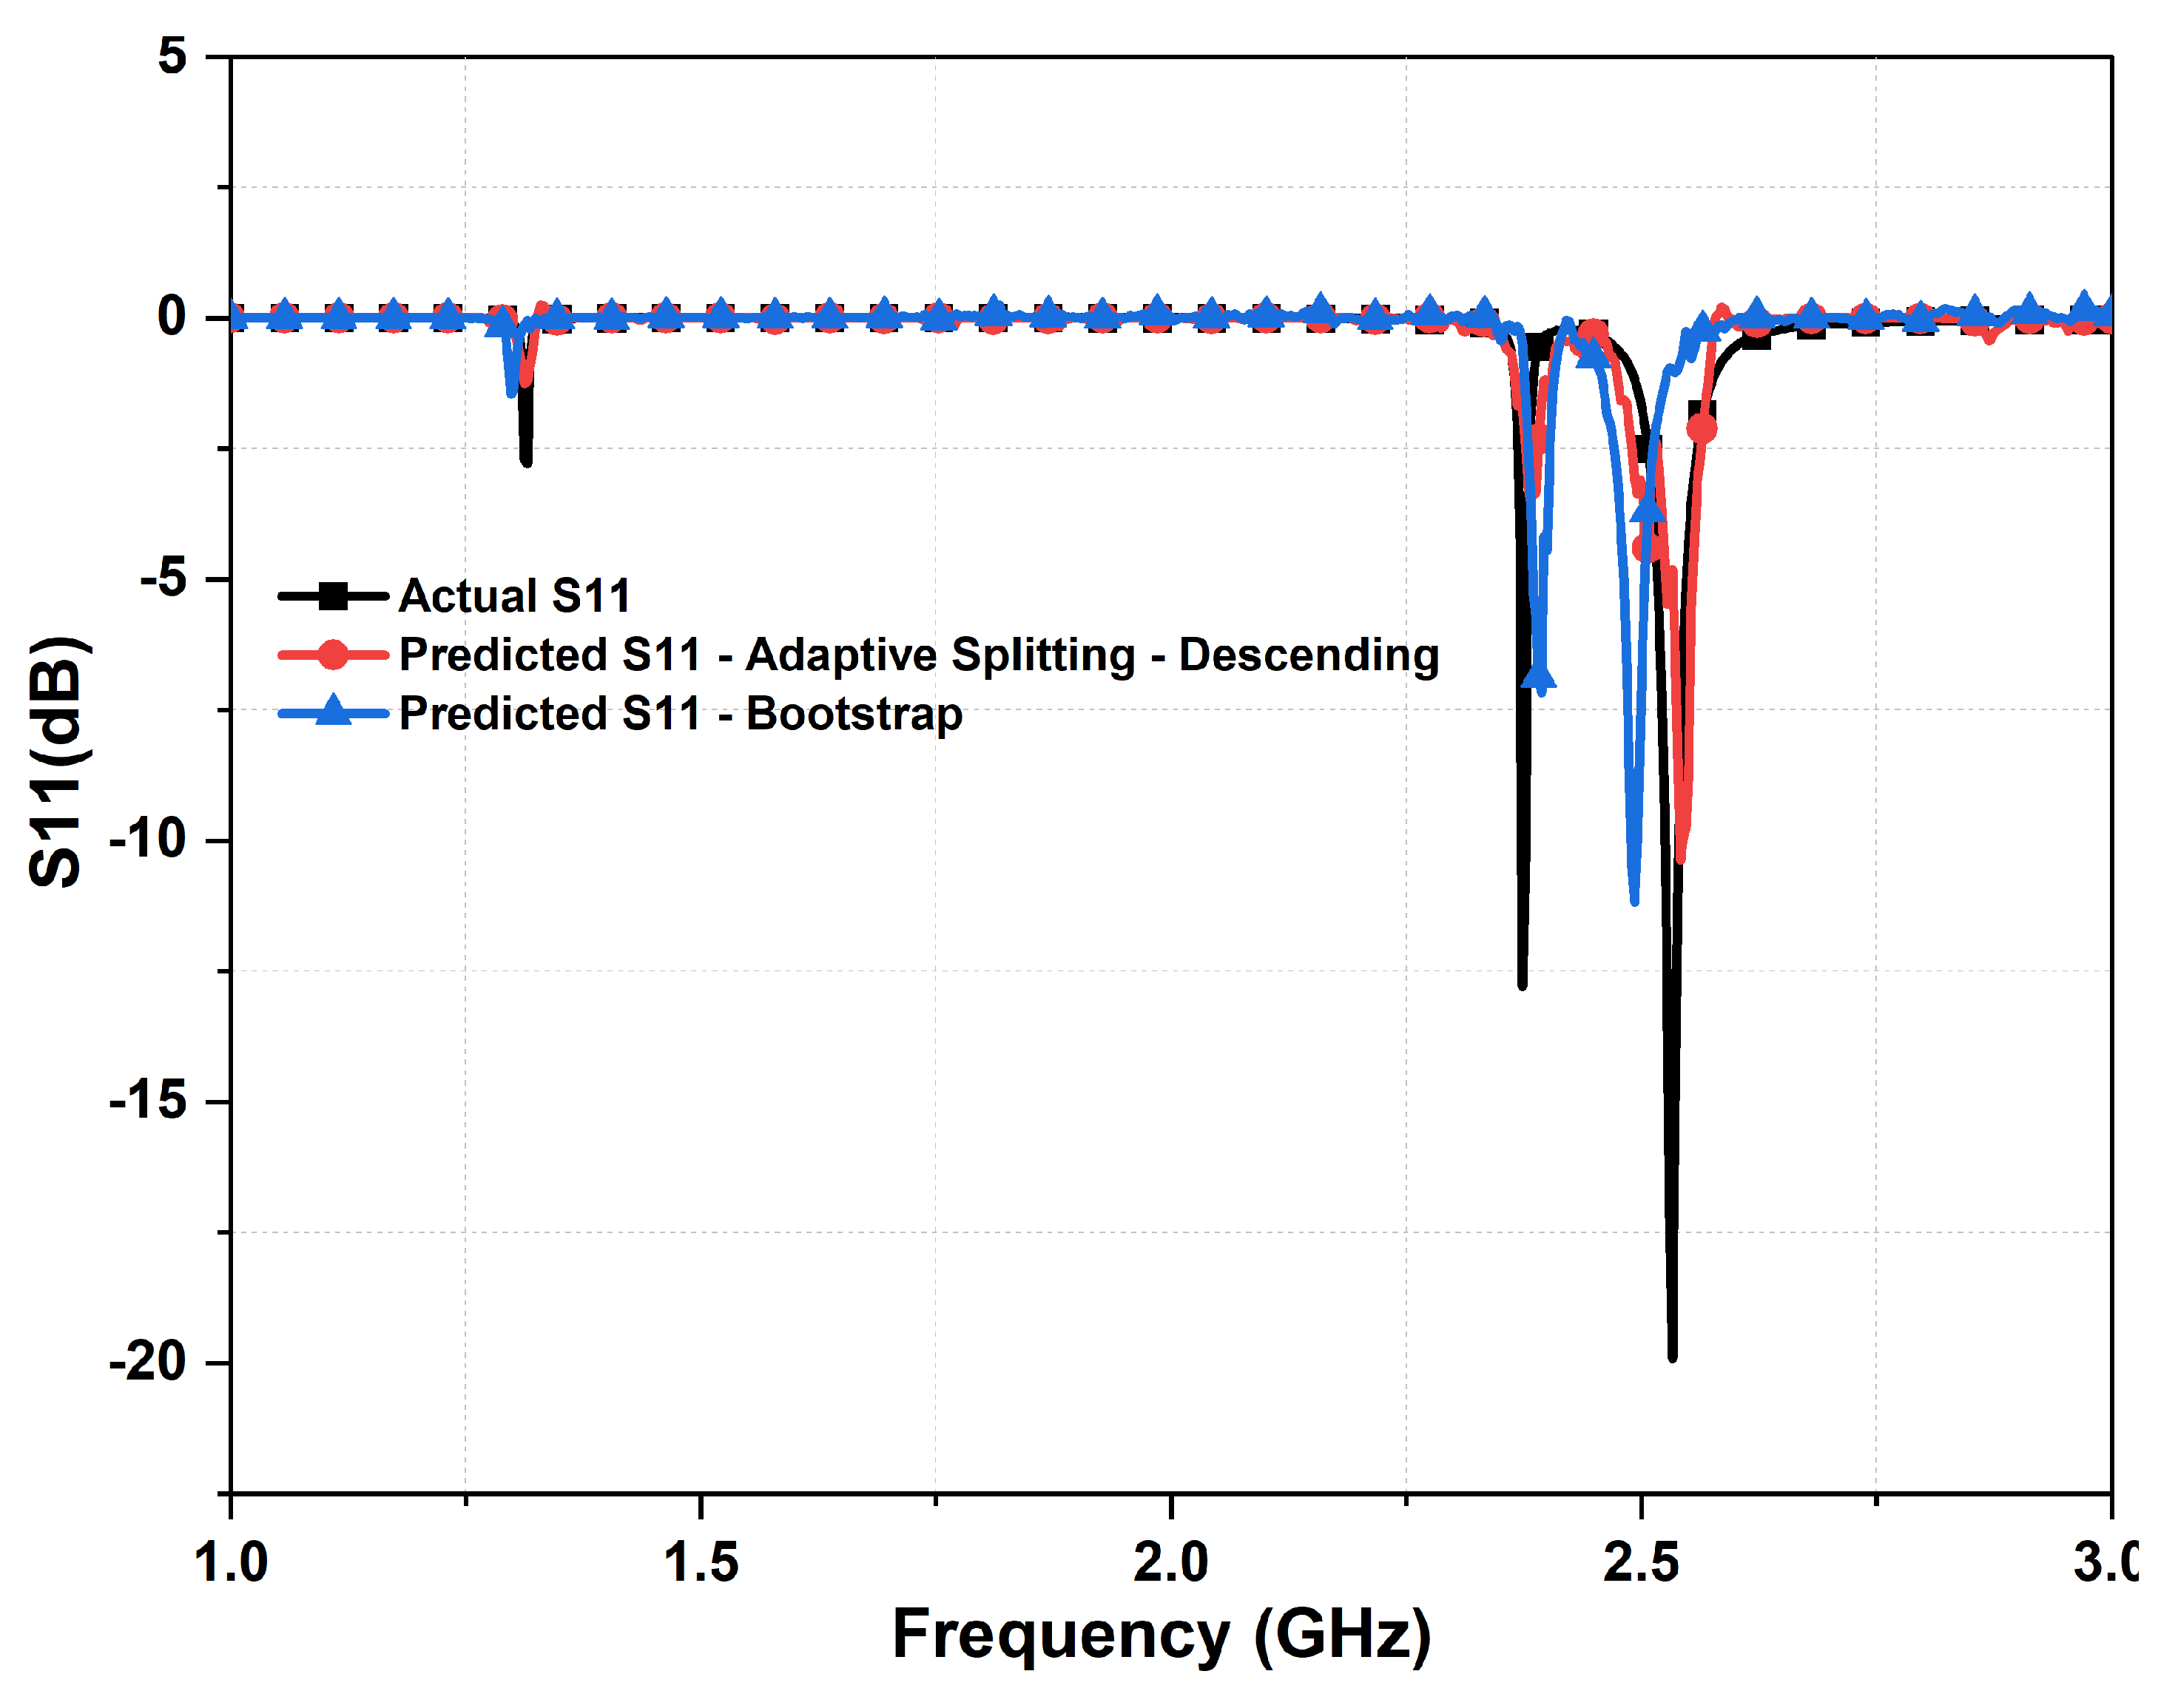
Figure 14.
Comparing the prediction accuracy between the trained DL model with descending order data sorting and bootstrap method.
Figure 14.
Comparing the prediction accuracy between the trained DL model with descending order data sorting and bootstrap method.
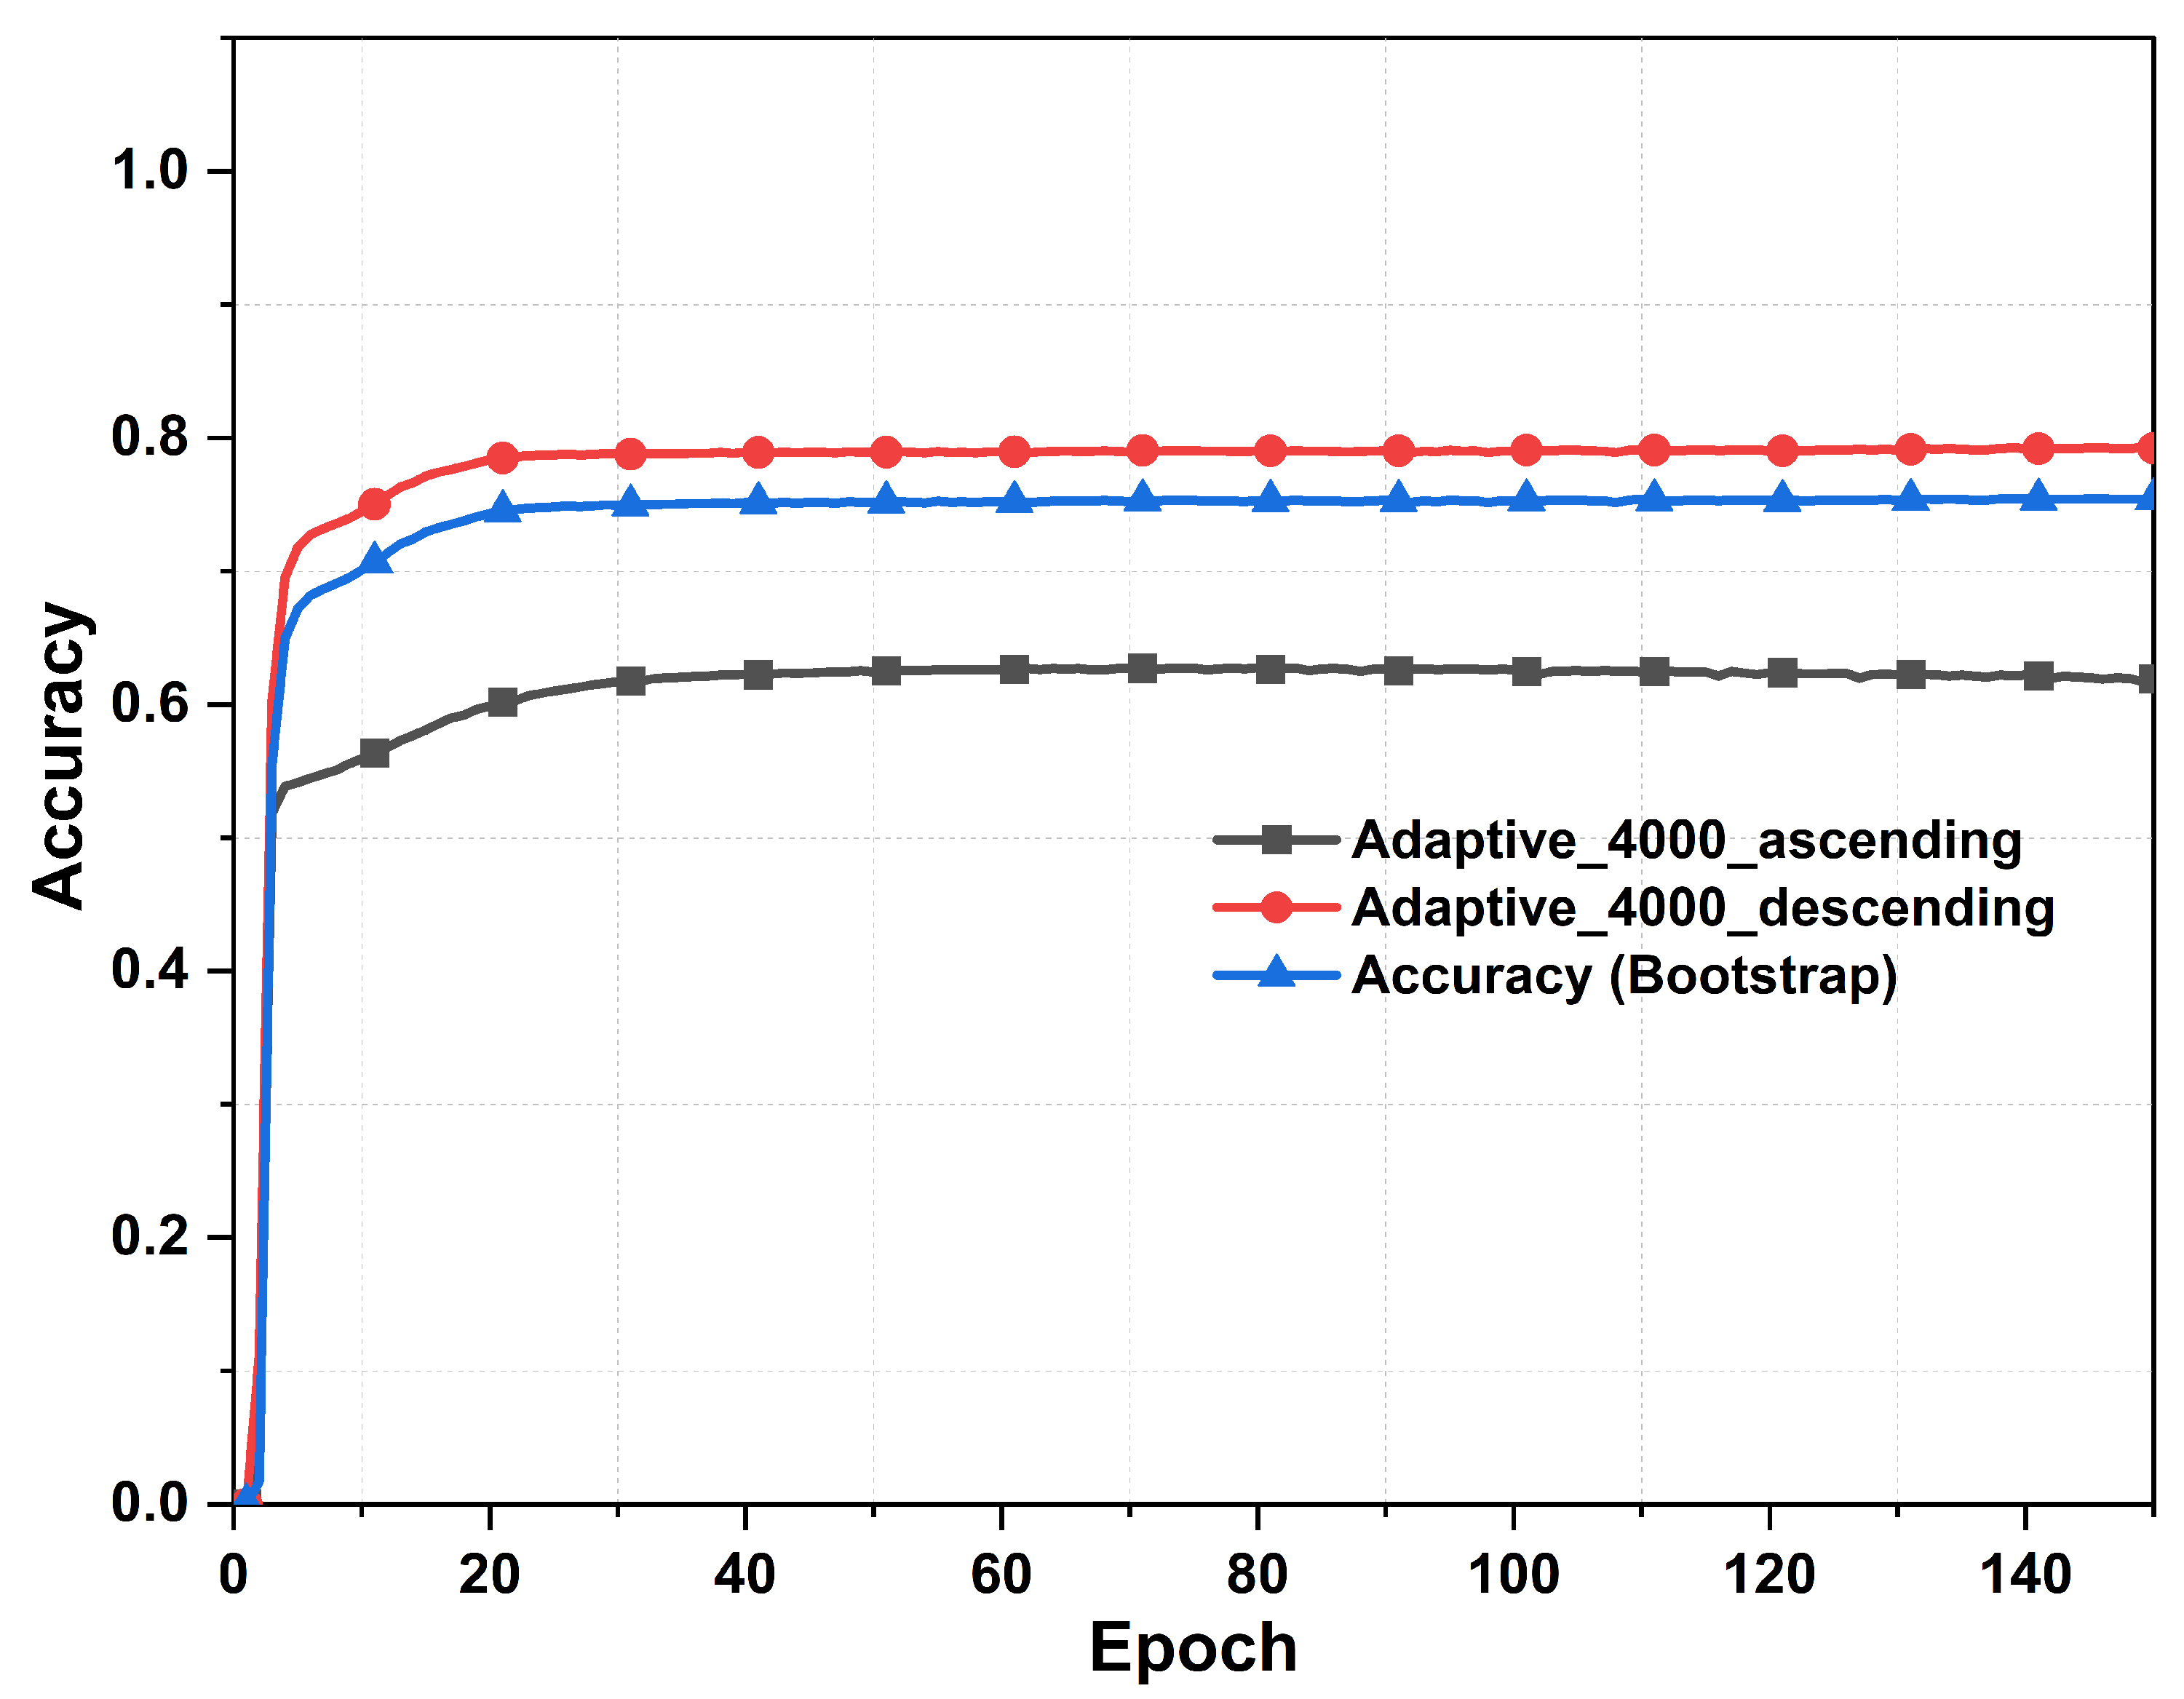
Figure 16.
Comparing the actual absorbance and predicted absorbance, from the three cascaded DNN with Keras Split function and 7,000 samples dataset. The actual metasurface absorber design parameters are: 1.33 mm, 1.47 mm , = , = , 0.63 mm, 0.92 mm, 15.71 mm, 13.71 mm, and L = 30 mm.
Figure 16.
Comparing the actual absorbance and predicted absorbance, from the three cascaded DNN with Keras Split function and 7,000 samples dataset. The actual metasurface absorber design parameters are: 1.33 mm, 1.47 mm , = , = , 0.63 mm, 0.92 mm, 15.71 mm, 13.71 mm, and L = 30 mm.
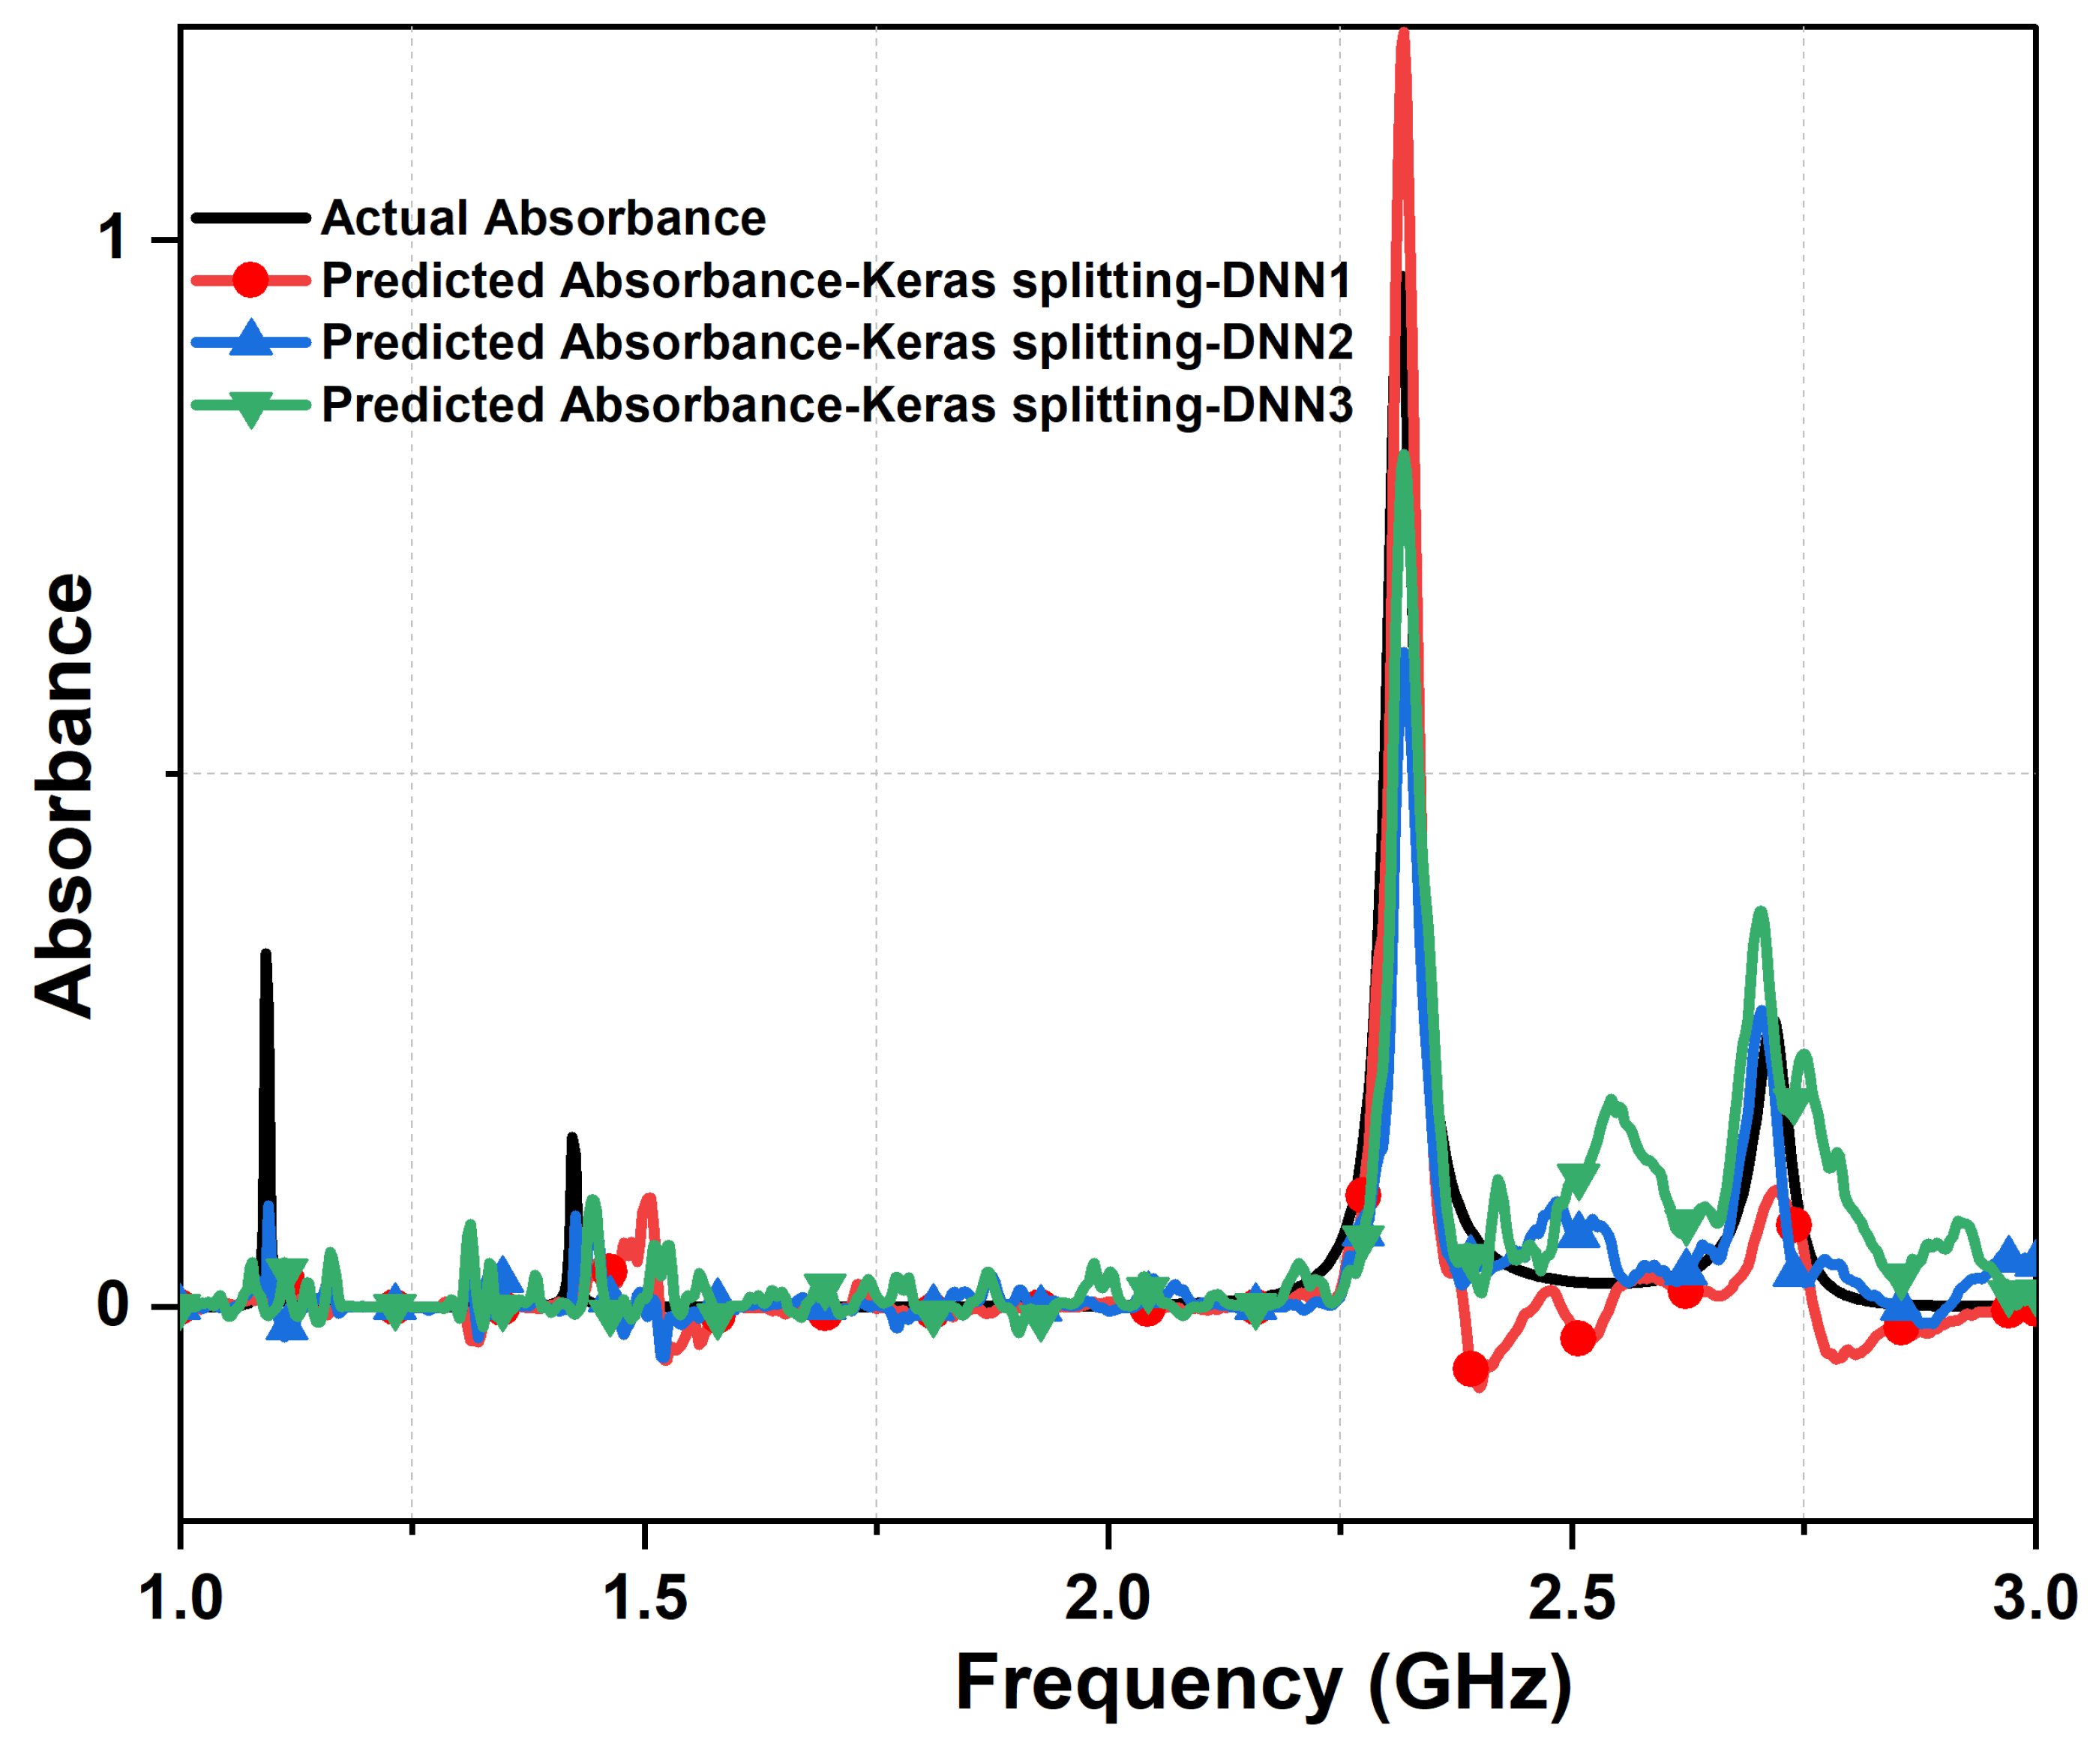
Figure 17.
Comparing the actual absorbance and predicted absorbance, from the three cascaded DNN with our proposed adaptive data merging technique and 7,000 samples dataset. The actual metasurface absorber design parameters are: 1.33 mm, 1.47 mm , = , = , 0.63 mm, 0.92 mm, 15.71 mm, 13.71 mm, and L = 30 mm.
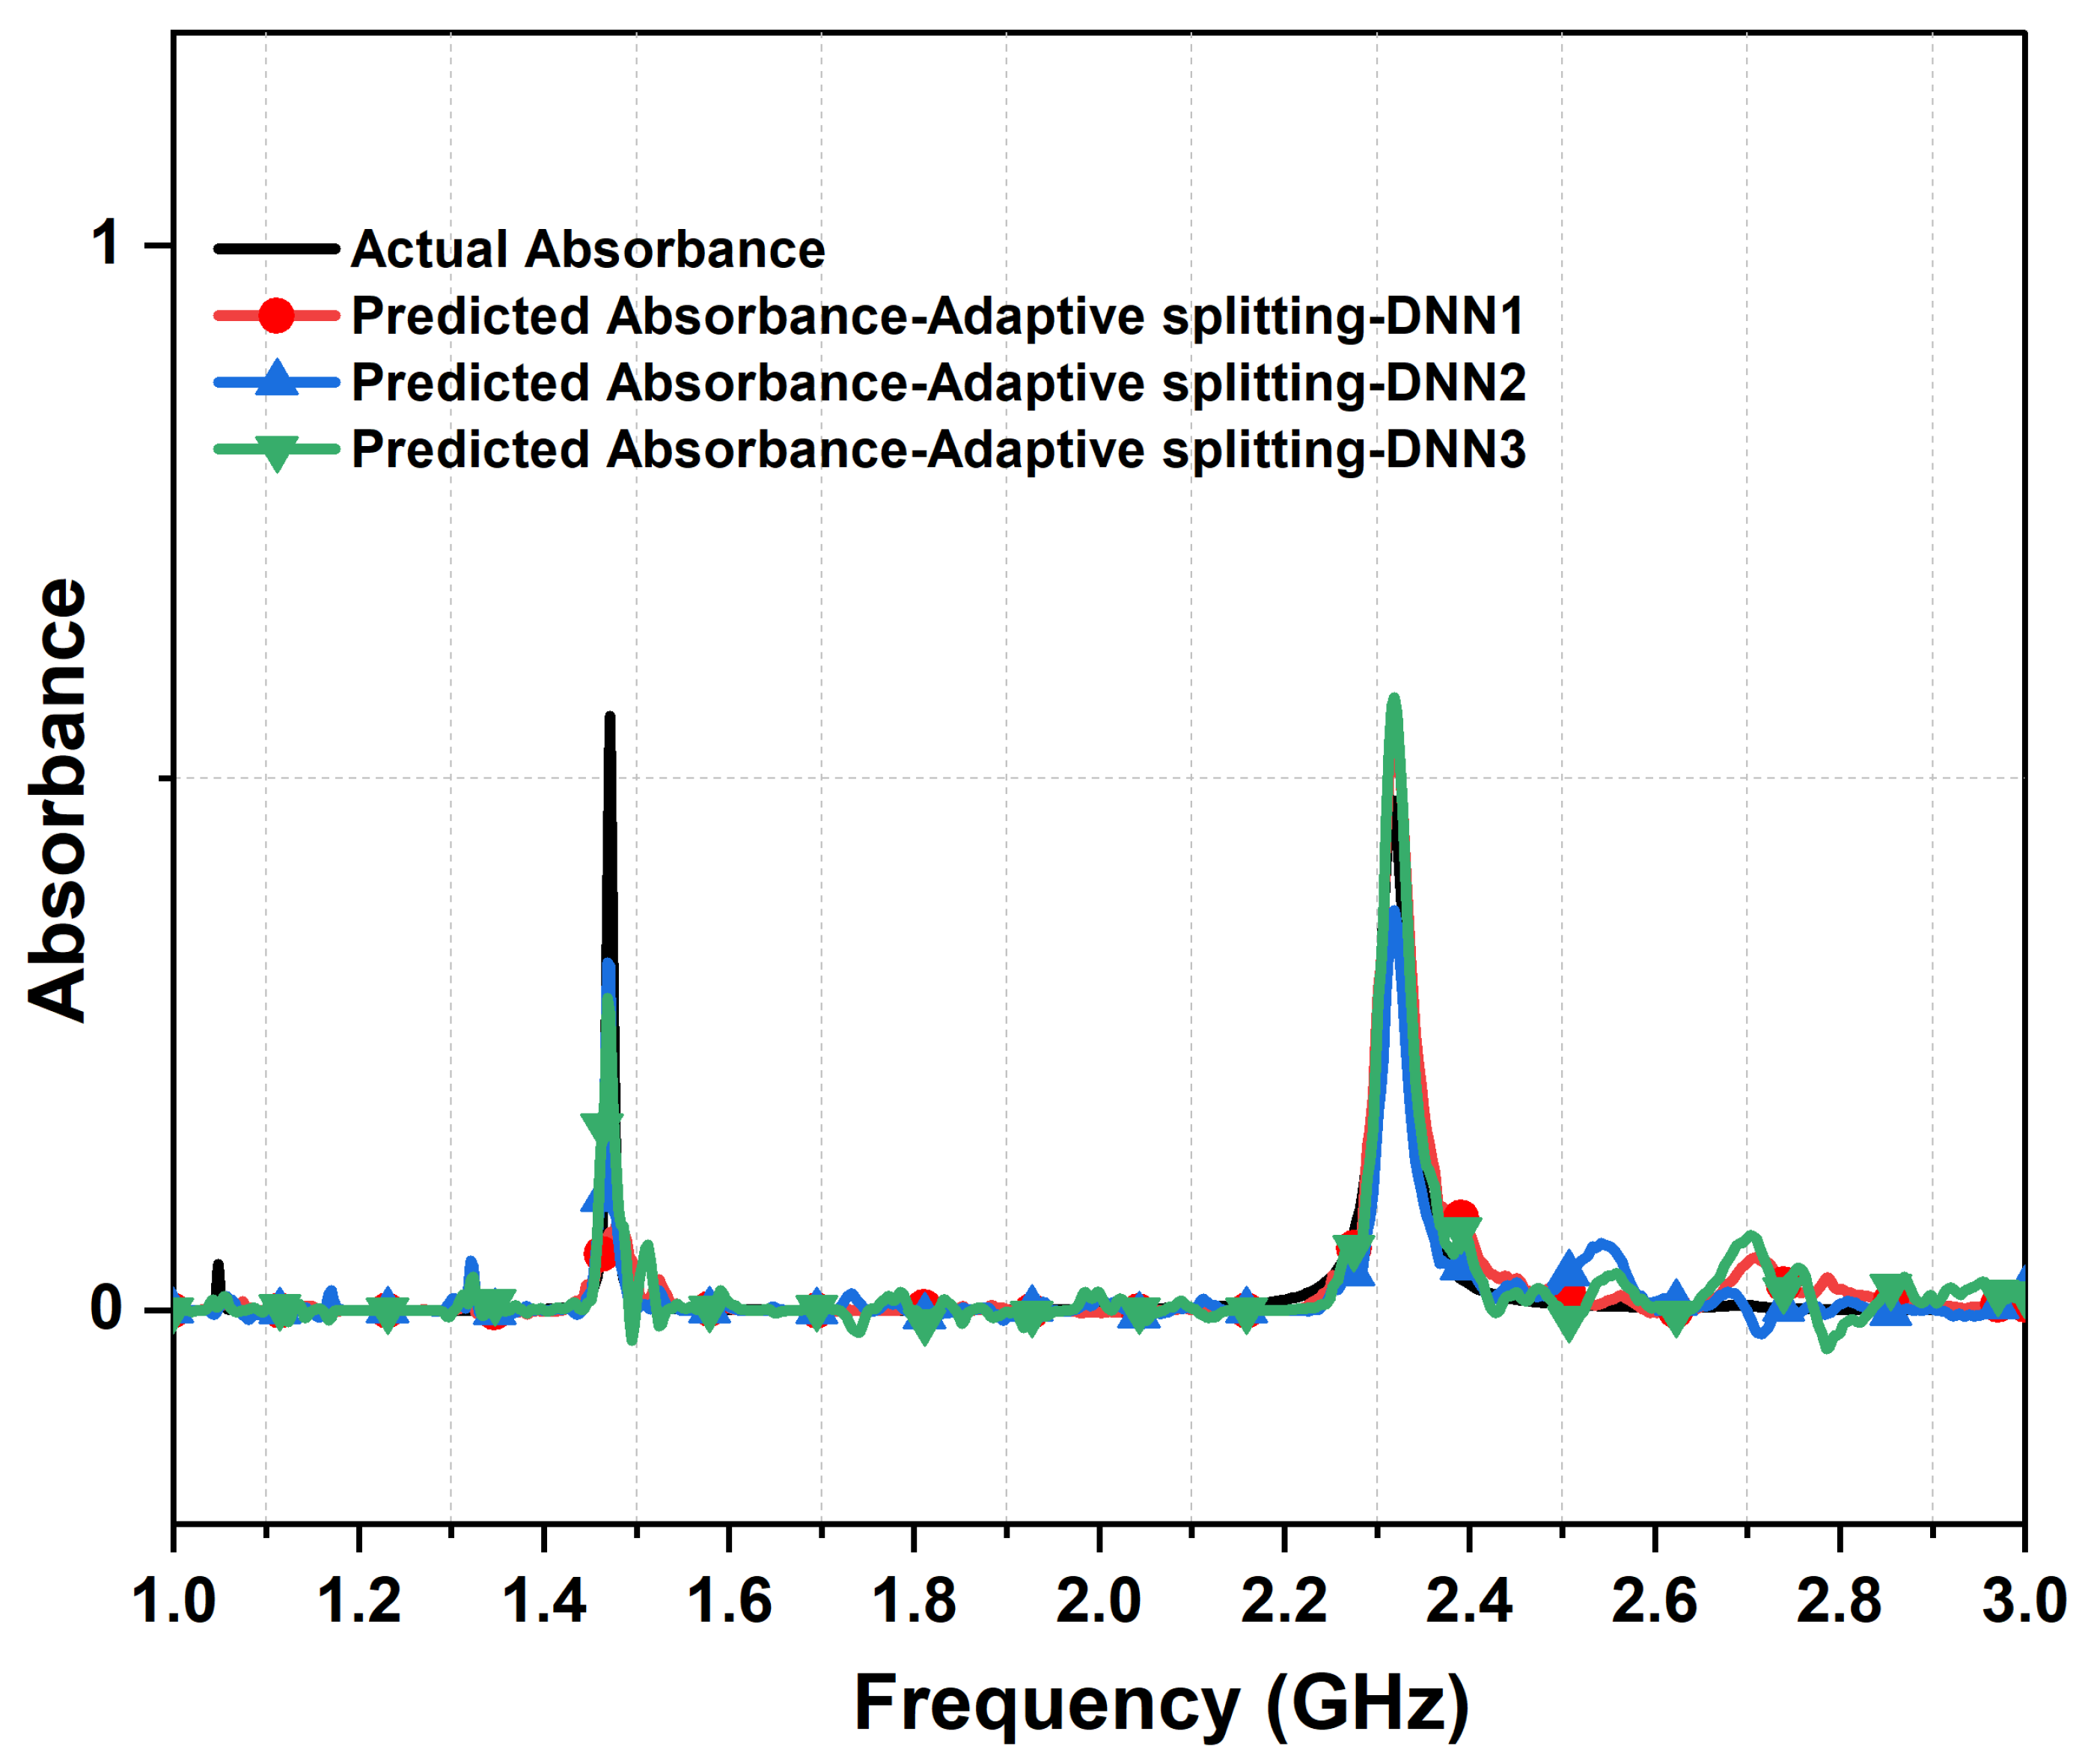
Figure 18.
Accuracy of the cascaded neural network with two layers as a function of epochs, with and without the adaptive data splitting.
Figure 18.
Accuracy of the cascaded neural network with two layers as a function of epochs, with and without the adaptive data splitting.
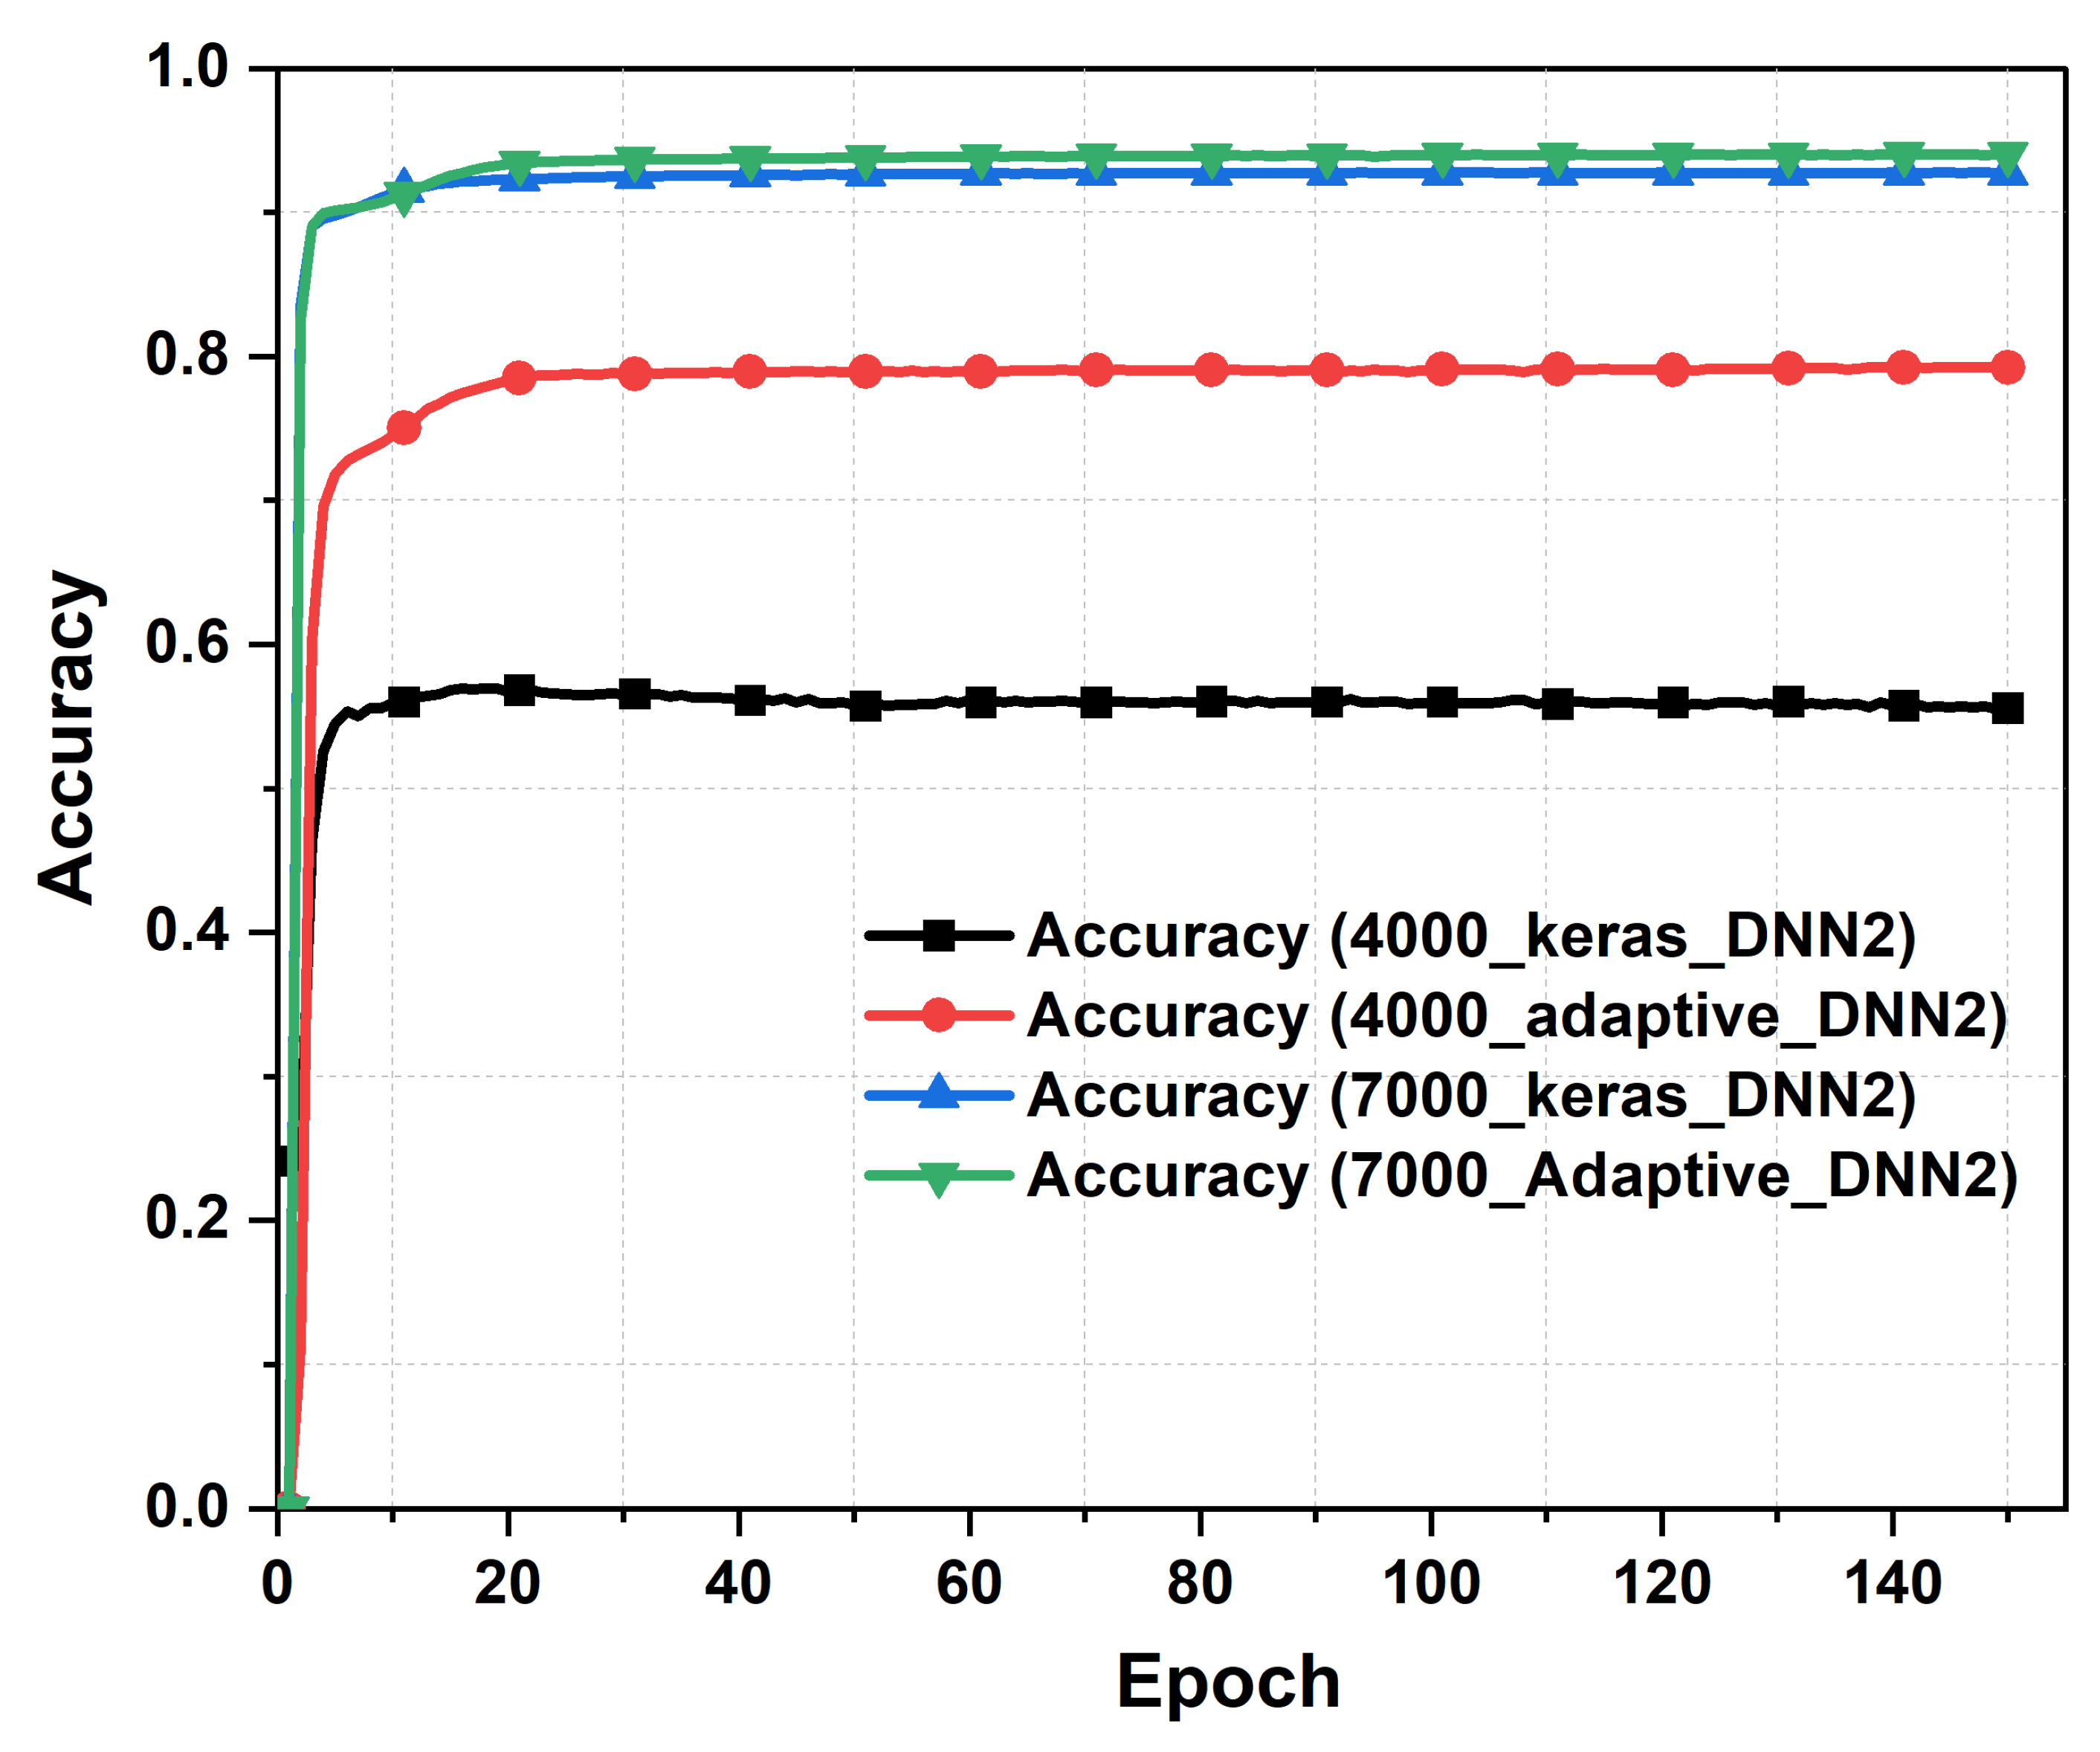

Table 1.
Training (MSLE) and validation (MSE) losses with 4000 dataset using the proposed ACDL model after 150 epochs.
Table 1.
Training (MSLE) and validation (MSE) losses with 4000 dataset using the proposed ACDL model after 150 epochs.
| Dataset Splitting Method |
Training Loss | Validation Loss | ||||
|---|---|---|---|---|---|---|
| DNN1 | DNN2 | DNN3 | DNN1 | DNN2 | DNN3 | |
| Keras | 0.031 | 0.033 | 0.032 | 0.049 | 0.044 | 0.046 |
| Adaptive | 0.037 | 0.039 | 0.15 | 0.024 | 0.020 | 0.25 |
Table 2.
Training (MSLE) and validation (MSE) losses with 7000 dataset using the proposed ACDL model after 150 epochs.
Table 2.
Training (MSLE) and validation (MSE) losses with 7000 dataset using the proposed ACDL model after 150 epochs.
| Dataset Splitting Method |
Training Loss | Validation Loss | ||||
|---|---|---|---|---|---|---|
| DNN1 | DNN2 | DNN3 | DNN1 | DNN2 | DNN3 | |
| Keras | 0.051 | 0.49 | 0.047 | 0.077 | 0.0073 | 0.0095 |
| Adaptive | 0.049 | 0.045 | 0.05 | 0.0067 | 0.006 | 0.081 |
Table 3.
Comparison of state of art artificial intelligence models for metasurface absorbers design.
Table 3.
Comparison of state of art artificial intelligence models for metasurface absorbers design.
| Reference | Structure | Machine Learning Model | Accuracy | Model Complexity |
|---|---|---|---|---|
| [20] | Different shapes | GAN | 95% | complex structure; complex dataset preparation (based on GAN); Large dataset requirement |
| [21] | Acoustic metasurface | CNN | - | Complex dataset preparation (based on CNN) |
| [18] | Pexilated Metasurface | CNN | 90.5% | Complex structure; Complex dataset preparation (based on CNN) |
| [22] | Pexilated Metasurface | CNN | 90% | Required significant data preprocessing |
| [23] | 8-Rings pattern Metasurface | CNN | 90% | Complex structure; Complex dataset preparation (based on CNN) |
| [24] | Diploe antenna based on metasurfaces | GAN | - | Complex structure; complex dataset preparation (based on GAN) |
| Proposed model | Edge-coupled SRR with automated cut gap position | DNN | 94% (7000 dataset) | Straight forward dataset management mechanism; Ease of integration with postprocessing data from EM simulators; Simple design structure to implement |
Disclaimer/Publisher’s Note: The statements, opinions and data contained in all publications are solely those of the individual author(s) and contributor(s) and not of MDPI and/or the editor(s). MDPI and/or the editor(s) disclaim responsibility for any injury to people or property resulting from any ideas, methods, instructions or products referred to in the content. |
© 2024 by the authors. Licensee MDPI, Basel, Switzerland. This article is an open access article distributed under the terms and conditions of the Creative Commons Attribution (CC BY) license (http://creativecommons.org/licenses/by/4.0/).
Copyright: This open access article is published under a Creative Commons CC BY 4.0 license, which permit the free download, distribution, and reuse, provided that the author and preprint are cited in any reuse.


