
Submitted:
08 January 2024
Posted:
10 January 2024
You are already at the latest version
Abstract
This paper investigates the relationship between public debt and economic growth in the context of a panel kink regression with latent group structures. The proposed model allows us to explore the heterogeneous threshold effects of public debt on economic growth based on unknown group patterns. We propose a least squares estimator and demonstrate the consistency of estimating group structures. The finite
sample performance of the proposed estimator is evaluated by simulations. Our findings reveal that the nonlinear relationship between public debt and economic growth is characterized by a heterogeneous threshold level, which varies among different groups, and highlight that the mixed results found in previous studies may stem from the assumption of a homogeneous threshold effect.
Keywords:
Kink regression model
; Latent group structures
; Public debt
; Debt threshold
1. Introduction
In recent years, particularly during the pandemic, many countries have seen a consistent rise in public debt. This trend has sparked concerns about its potential effects on sustained economic growth. According to the conventional view, rooted in the Ricardian Equivalence theory, the negative impacts of rising public debt could be offset by an equal increase in private savings. This suggests that the overall national savings would remain unchanged, thus not influencing growth (e.g., Barro [1]). Conversely, if Ricardian Equivalence is not applicable, another strand of literature believes that increased public debt could negatively affect long-term economic growth (e.g., Blanchard [2], Elmendorf and Gregory Mankiw [3]).
Recent studies have shifted towards exploring potential nonlinear dynamics within the debt-growth nexus, examining how accumulating debt might adversely affect economic growth, particularly when debt levels surpass certain thresholds. A seminal study by Reinhart and Rogoff [4] posits that public debt begins to impede economic growth when the debt-to-GDP ratio exceeds 90%. Using threshold regression models, studies by Cecchetti et al. [5], Caner et al. [6], Afonso and Jalles [7] identified varying thresholds of debt-to-GDP ratios—85%, 77%, and 59%, respectively—at which public debt begins to harm economic growth. However, Kourtellos et al. [8] were unable to confirm a significant threshold effect for public debt when adjusting for endogeneity concerns.
The above-mentioned studies provide mixed evidence about the nonlinear effects of public debt on economic growth and two main challenges emerge. Firstly, these findings are obtained under strong assumptions of homogeneity in threshold levels across different countries. Commonly, heterogeneity is modeled as unit-specific, time-invariant fixed-effects. Chudik et al. [9] examine a dynamic heterogeneous panel threshold model with cross-sectional dependent errors, yet this approach still assumes a uniform threshold level for all countries. As allowing for country-specific threshold levels is data-demanding, applied researchers face a trade-off between adopting flexible methods for modeling unobserved heterogeneity and building parsimonious specifications that can be well handled by a limited dataset. Secondly, conventional threshold regression models assume a discontinuous regression function at the actual threshold level, which may not be suitable in this context. It is not intuitively expected to observe an abrupt jump in the economic growth rate when the public debt ratio increases marginally at the turning point. Chan and Tsay [10] introduces a continuous threshold autoregressive model, which enables a piece-wise linear function of the threshold variable. Building on this, Hansen [11] expands the framework by proposing tests for a threshold effect and inferring the regression parameters in a continuous threshold model with an unknown threshold parameter, termed the kink threshold regression (KTR) model. This model is also applied to re-examine the issue of public debt overhang, albeit under the assumption of a uniform threshold level.
Motivated by previous studies, in this paper, we employ a panel kink threshold regression model with latent group structures to reexamine the debt-growth puzzle. Our contributions are twofold. In terms of methodology, our proposed model extends the panel threshold regression model with latent group structures of Miao et al. [12] by incorporating a continuous threshold effect. This model enables variations in slope and threshold coefficients across individual units through a group-based pattern within a continuous threshold effect framework, effectively addressing the previously mentioned two challenges. The proposed data-driven method aligns with other studies in panel latent group structures (e.g., Bonhomme and Manresa [13], Su et al. [14], and Bonhomme et al. [15]), balancing the trade-off between the limited flexibility of homogeneity assumptions and the extensive data requirements of heterogeneity inherently. We present the estimation strategy and show the latent group structure can be estimated consistently with a probability that approaches 1. This extends Theorem 3.1 from Miao et al. [12] to the context of continuous threshold effects. Our second contribution lies in our empirical findings. By using the dataset of Chudik et al. [9], encompassing data from forty countries spanning from 1980 to 2010, we determine that the optimal number of groups is three and recover the group structures. We observe two out of these three groups benefit significantly from increasing public debt, up to a certain threshold beyond which the significance diminishes. Our findings indicate the presence of a heterogeneous threshold effect, suggesting that any contradictory conclusions in the previous studies might stem from overlooking this heterogeneous impact on the way countries manage their debt obligations.
The rest of the paper is organized as follows. Section 2 describes our panel kink threshold regression model and the estimation strategy. Section 3 details the assumptions and establishes the consistency of the estimators for group membership. In Section 4, we evaluate the finite sample performance of our model through Monte Carlo simulations. The empirical results of our study are presented in Section 5. Section 6 concludes the paper. Technical proofs are relegated to the appendix.
2. The Model and Estimates
This section presents the panel kink regression model in latent group structure and introduces the estimation procedure.
2.1. The Model
To explore the heterogeneous threshold effects of the public debt on economic growth, we consider the following panel kink threshold regression model with latent group structures,
for , where N denote the number of cross-sectional units and T the number of time periods. The variable represents the economic growth of country i in year t. The lagged dependent variable is included on the right-hand side to capture persistency in economic growth. The main variable of interest is the lagged value of the logarithm of the public debt-to-GDP ratio (multiplied by 100), denoted by . We deliberately choose the lagged public debt-to-GDP ratio as the threshold variable, given the substantial evidence suggesting that contemporaneous public debt is endogenous.(e.g. Panizza and Presbitero [16], Frankel and Romer [17]).1 Following Miao et al. [12], we allow both the slope and kink coefficient parameters to be group-specific, where determines the group-membership with and G is known as the number of groups. Thus, within the same group g, all members have the same coefficients . is the random disturbance term which is assumed to be serially uncorrelated over t. Let as the smallest sigma field generated by . We assume For all and . Many models in previous literature can be considered special cases of our model, as represented by equation (1). For instance, if is known a priori, all countries are categorized into the same group, and model (1) then becomes a pooled panel kink regression model, akin to the one proposed by Hansen [11]. Alternatively, if , model (1) simplifies to a heterogeneous panel model with group patterns, as introduced by Bonhomme and Manresa [13].
2.2. Estimation
Let , and , where . We denote the true parameters as , where , , and . We can estimate model (1) as the following steps:
Denote . Given G, we can obtain the following least squares estimator of ,
where
For any given and group structure , the slope coefficients , , can be estimated by
Then, we can estimate and as
where .
To solve the above optimization problem, we employ the EM-type iterative algorithm for exploring the space, as proposed by Miao et al. [12].
Algorithm: Initialize as a random starting point for the group structure and set .
Step 1 Given , compute the following
Step 2 Given and , compute the slope coefficients for each group
Step 3 Compute the followings for all
Step 4 Set and continue repeating Steps 1-3 until numerical convergence is achieved.
3. Asymptotic Results
In this section, we present the asymptotic results of the estimators of the group structure. Below, we list some regularity conditions used to derive the consistency of the group structure estimator.
Assumption A1. (i). For each , , where is the smallest sigma field generated by .
(ii). are mutually independence of each other across i.
(iii). For all i, are strictly stationary mixing process with mixing coefficients satisfying for some constants & .
Assumption A2. (i). For some and some constants , , , and .
(ii). The parameter space and are compact such that and .
(iii). has a density function and is continuous over and .
(iv). Let and . For some constants , as , we have
(v). Define
There exists a constant . such that for all
(vi). For all and , we have for some constants .
(vii). For any and , for some constants , we have
(viii). For all : .
(ix). and as .
Assumption 1 is similar to Assumptions A.1 (i)-(iii) of Miao et al. [12] and Assumptions A.2 (a)-(c) in Su and Chen [19] and is standard in the literature. Assumption 1 (i) assumes the martingale difference sequence condition and Assumption 1 (ii) is the cross-sectional independence. Assumption 1 (iii) imposes the strong mixing condition.
Assumptions 2 (i)-(ii) are the regularity conditions. Assumption 2 (iii) is similar to Assumption 1.4 of Hansen [11] and requires that the threshold variable, , has a bounded density function. Assumption 2 (iv) is a non-colinearity condition, similar to Assumption A.4(ii) in the Miao et al. [12], but specifies that it requires to hold for each individual. Assumption 2 (v), paralleling Assumption A2 of Miao et al. [12] and Assumption 1 (g) of Bonhomme and Manresa [13], extends the full rank condition in the standard kink regression model to encompass cases with latent groups. Assumptions 2 (vi)-(viii) are needed for the identification and mirror Assumption A.3 (i)-(iii) of Miao et al. [12]. Specifically, Assumption 2 (vi) requires the group-specific slope and threshold coefficients to be distinct from each other. Assumption 2 (vii) is inferred from Assumption 2 (vi). Assumption 2 (viii) ensures that each group size is sufficiently large that is asymptotically non-negligible. Assumption 2 (ix) is similar to Assumption A.3 (iv) of Miao et al. [12] and defines the relative magnitude of individual size N and period size T, fitting many empirical macroeconomic applications, including ours.
Theorem 1.
Given Assumptions A1 - A2, as , we have
Theorem 1 extends Theorem 3.1 of Miao et al. [12] to allow for the continuous threshold effect and is similar to Theorem 2 of Bonhomme and Manresa [13]. This theorem states, as , the probability of correctly assigning the group structure approaches 1. Therefore, given the latent group structure can be estimated at a faster rate (see Lemma A3 in the appendix for the rate of recovering latent group structure) than the convergence rate of the estimators of the slope and kink threshold parameters of the pooled panel kink regression model (see Hansen [11]), similar to Miao et al. [12], we can establish the estimators of the slope and kink threshold parameters of the panel kink regression model with latent groups are asymptotically equivalent to the infeasible estimators that are obtained as if the group structure is known a priori.2
4. Monte Carlo Simulation
In this section, we propose Monte Carlo simulations to test our estimator with a small sample size. We list the data-generating processes(DGPs) and the Monte Carlo results, where we first consider the static model, and then a dynamic model suits our empirical application. We have
- DGP1:
where , , denotes the group specified fixed effect, and are group specified slopes. is the threshold value. We set the number of groups to be 3, thus are chosen among . We set the parameters , . We propose a diminishing threshold effect, with . As following the theory, the group identification does not rely on the heterogeneous threshold effect across groups, to test that, we focus on two cases, (1) homogeneous group-specific threshold values, while we set ; (2) heterogeneous group-specific threshold values, with threshold values . We repeat the Monte Carlo simulation 1000 times and the results are shown in Table 1, Table 2 and Table 3.
Table 1 reports the Monte Carlo results for homogeneous group-specific threshold value DGP and Table 1 shows the results for heterogeneous group-specific threshold value DGP. It is worth noting that for both DGPs with homogenous and heterogenous thresholds across groups, as seen from the mean squared error(MSE) panels, our estimator displays convergence with either the number of N or T increases. In Table 3, we also report the average misclassification frequency(MF) in Table 3 across replications, where for each replication, we define . The estimation results show that with either N or T increase, we observe a decreasing misclassification frequency. In the most unfavorable scenario, the average rate of misclassification with our approach stands at approximately , indicating the effectiveness of our proposed method. Also, with a fixed N and T, the estimators with homogeneous thresholds DGP have a smaller , compared with heterogeneous thresholds DGP. This observation aligns with the results presented in [12]. Theoretical indications from the study suggest that in threshold regression, group identification hinges on the variation in slopes across groups. The distinct threshold effects specific to each group do not contribute to the identification process.
DGP2:
where and again we keep the number of groups as 3. We set , and , which suggests a dynamic model with stationary process and a diminishing threshold effect. Again, we consider two DGPs that cover both homogeneous group-specified threshold values() and heterogeneous group-specific threshold values(). We repeat the Monte Carlo simulation 1000 times and report the results in Table 4, Table 5 and Table 6.
Again, Table 4 and Table 5 report the Monte Carlo results for the homogeneous and heterogeneous group-specified threshold effect, respectively. Similar to the results in DGP1 with a static setup, the Monte Carlo results in DGP2 show convergence with either N or T increases. We can observe the convergence in Table 4 with homogeneous group-specific threshold value cases and Table 5 with heterogeneous group-specific threshold values. In Table 6, we observe that misclassification frequency decreases as N or T increases.
5. Empirical Results
In this section, we estimate the panel kink regression model with latent groups in equation (1). We explore the heterogeneous nonlinear effect of public debt on economic growth.
5.1. Data
We employ a balanced panel dataset that includes forty countries spanning from 1980 to 2010, obtained from Chudik et al. [9]. Of these, twenty-one are OECD countries, which is often considered as a rich country club. The public debt to GDP ratio, represented as , is calculated by taking the logarithm. Figure 1, Figure 2 and Figure 3 depict time series plots of yearly average economic growth versus the yearly average public debt to GDP ratio for all countries, as well as separately for OECD and non-OECD countries. A visual examination of these plots reveals a common trend between the two variables, indicating that the public debt to GDP ratio captures the pattern of economic growth in all scenarios. However, a closer comparison of Figure 2 and Figure 3 reveals an asymmetric co-movement between these variables in OECD versus non-OECD countries, pointing to the club-based heterogeneity in the impact of public debt on economic growth. This observation motivates us to further explore the identification of latent group structures and the uncovering of group-based heterogeneity.
5.2. Determining the Number of Groups
Since the true number of groups is unknown, we follow Miao et al. [12] and employ a BIC-type information criterion (IC) to ascertain the number of groups. This method is outlined as follows:
where represents the mean squared error for a given group number G and is the tuning parameter used for the penalty term.3 Then, the optimal number of groups is chosen by
where is the maximum number of groups, as determined by the empirical researcher. In our study, given the size of our dataset, we set . Figure 4 displays the values of the IC for various choices of group numbers, ranging from 1 to 5. We observe that when , the IC attains its minimum value. Hence, we conclude that the optimal number of groups for our study is three.
5.3. Estimation Results
We then proceed to estimate the model (1) by setting (indicating no latent group, our benchmark) and using (as determined by the IC criterion). The results of these estimations are summarized in Table 7.
Assuming a homogeneous kink threshold effect across all countries, we find the estimated tipping point to be 40.45%. However, in contrast to the conventional view, the pooled panel kink regression analysis reveals that higher public debt leads to lower growth in countries with lower debt levels and it appears to benefit economies with higher debt levels.
When analyzing the results of the panel kink regression with latent group structures, the estimations for Group 1 align with the counter-intuitive results from the benchmark. The results suggest a negative impact on economic growth when a country’s debt-to-GDP ratio is below 43.51%, becoming insignificant above this level. However, only seven countries fall into Group 1. The results for Groups 2 and 3 are particularly notable, indicating threshold heterogeneity where the impact of public debt on growth varies depending on the group members. Specifically, for Group 2, the turning point is at 44.28%, where public debt fosters economic growth up to this level, after which the positive effect disappears. Group 3, with the highest threshold of 58.14%, exhibits a significant positive impact of public debt on growth when below this level, but this effect becomes insignificant once the threshold is exceeded. Notably, Group 2 experiences a more substantial impact in the lower regime, indicating these countries benefit most from public debt. Consistent with the existing literature (e.g. Baum et al. [20]), our results for Groups 2 and 3 indicate that while the impact of public debt on GDP growth is initially positive and statistically significant, it declines to near zero, and loses significance beyond specific public debt-to-GDP ratios.
Figure 5 illustrates the world map with assigned group memberships. Interestingly, these classifications correlate to some extent with geographic location, economic development level, and the independence of the Central Bank. For instance, Group 1, which includes countries like China and Turkey, is characterized by relatively weaker Central Bank independence. Group 2 is predominantly associated with the Indo-Pacific region. Meanwhile, Group 3 encompasses a majority of the countries in the pan-American and European regions, indicating a distinct geographic and economic pattern in the grouping. In summary, our findings emphasize the heterogeneity of threshold effects crucial in determining the influence of debt on growth. Ignoring these group patterns, as seen in the pooled panel kink regression results, could lead to counter-intuitive conclusions and erroneous policy implications.
6. Conclusion
This paper makes an important contribution to the ongoing debate regarding the nonlinear relationship between public debt and economic growth. While existing literature primarily assumes a homogeneous threshold effect of public debt on economic growth, our approach diverges by employing a panel kink regression model that incorporates latent group structures. This method allows us to explore the heterogeneous threshold effects based on unkown group patterns. We propose a least squares estimator and demonstrate the consistency of estimating group structures. Our findings reveal that the nonlinear relationship between public debt and economic growth is characterized by a heterogeneous threshold level, which varies among different groups, highlighting that the mixed results found in previous studies may stem from the arguably incorrect assumption of a homogeneous threshold effect.
Appendix A. Lemmas
In this section, we propose some lemmas which help to prove the theorems. Throughout the appendix, let denote the Euclidean norm. We use to denote the joint convergence of N and T when N and T pass to infinity simultaneously. , , , and ⟹ denote almost sure convergence, convergence in probability, convergence in distribution and weak convergence respectively. ⋀ and ⋁ denote the minimum and maximum operators.
First, we denote an auxiliary function:
Lemma A1.
Under Assumption A1-A2, we have
Proof.
Note that
Under Assumptions A1-A2 and closely following the proof of Lemma A.1 of Miao et al. [12], we can show , which concludes the proof. □
Lemma A2.
: Suppose Assumptions A1-A2 hold, we have , where
Proof.
Our proof essentially extends the Lemma A.2 of Miao et al. [12] to allow for the continuous threshold effect. It suffices to show (i) and (ii) .
First, to show (i), by the definition of least squares estimator and the fact that is minimized at , we can show .
Next, for any and , as , we can show
where and are some bounded constants.
By applying Assumption 2 (iv) and using equations (A1), uniformly in we have
where .
Thus, we have
where the last inequality is by Assumption A2 (v). This concludes the proof of (i).
Lemma A3.
Let . Suppose that Assumptions A1-A2 hold. Then, for some , we have
where .
Proof.
Our proof follows Lemma A.3 of Miao et al. [12]. The only difference is the details of bounding , where in our case
Note that, by simple calculation, we can show
Therefore, for , we have
where
Then, closely following the steps taken by Lemma A.3 of Miao et al. [12] by using our defined , for some constants C, we can show
where .
Next, we show the leading term on the right-hand side of the above inequality is . Let , applying Assumption A2 (vii), we have
By Assumption A1-A2 and applying Lemma C.1 of Miao et al. [12], we can show the first two terms of the last inequality are to be . Let and apply Lemma C.1 of Miao et al. [12], we can show the rest three terms are of order . The result then follows from the Markov inequality as used in the proof of Lemma A.3 of Miao et al. [12]. □
Appendix B. Theorem
Proof of Theorem 1: By Lemma A2, we have . Therefore, we can apply Lemma A3 and have . This follows
which concludes the proof of this theorem.
References
- Barro, R.J. Are government bonds net wealth? Journal of Political Economy 1974, 82, 1095–1117. [Google Scholar] [CrossRef]
- Blanchard, O.J. Debt, deficits, and Finite Horizons. Journal of Political Economy 1985, 93, 223–247. [Google Scholar] [CrossRef]
- Elmendorf, D.W.; Gregory Mankiw, N. Chapter 25 Government debt. In Handbook of Macroeconomics; 1999; pp. 1615–1669. [Google Scholar]
- Reinhart, C.M.; Rogoff, K.S. Growth in a Time of Debt. American Economic Review 2010, 100, 573–578. [Google Scholar] [CrossRef]
- Cecchetti, S.G.; M S, M.; Fabrizio, Z. The Real Effects of Debt. Bank For International Settlements Working Papers 2011, 352. [Google Scholar]
- Caner, M.; Grennes, T.; Koehler-Geib, F. Finding the Tipping Point: When Sovereign Debt Turns Bad. Sovereign Debt and the Financial Crisis 2010, 63–75. [Google Scholar]
- Afonso, A.; Jalles, J.T. Growth and productivity: The role of government debt. International Review of Economics & Finance 2013, 25, 384–407. [Google Scholar]
- Kourtellos, A.; Stengos, T.; Tan, C.M. The effect of public debt on growth in multiple regimes. Journal of Macroeconomics 2013, 38, 35–43. [Google Scholar] [CrossRef]
- Chudik, A.; Mohaddes, K.; Pesaran, M.H.; Raissi, M. Is There a Debt-Threshold Effect on Output Growth? Review of Economics and Statistics 2017, 99, 135–150. [Google Scholar] [CrossRef]
- Chan, K.S.; Tsay, R.S. Limiting properties of the least squares estimator of a continuous threshold autoregressive model. Biometrika 1998, 85, 413–426. [Google Scholar] [CrossRef]
- Hansen, B.E. Regression kink with an unknown threshold. Journal of Business & Economic Statistics 2017, 35, 228–240. [Google Scholar]
- Miao, K.; Su, L.; Wang, W. Panel threshold regressions with latent group structures. Journal of Econometrics 2020, 214, 451–481. [Google Scholar] [CrossRef]
- Bonhomme, S.; Manresa, E. Grouped patterns of heterogeneity in panel data. Econometrica 2015, 83, 1147–1184. [Google Scholar] [CrossRef]
- Su, L.; Shi, Z.; Phillips, P.C. Identifying latent structures in panel data. Econometrica 2016, 84, 2215–2264. [Google Scholar] [CrossRef]
- Bonhomme, S.; Lamadon, T.; Manresa, E. Discretizing unobserved heterogeneity. Econometrica 2022, 90, 625–643. [Google Scholar] [CrossRef]
- Panizza, U.; Presbitero, A.F. Public debt and economic growth in Advanced Economies: A Survey. Swiss Journal of Economics and Statistics 2013, 149, 175–204. [Google Scholar] [CrossRef]
- Frankel, J.A.; Romer, D. Does trade cause growth? American Economic Review 1999, 89, 379–399. [Google Scholar] [CrossRef]
- Zhang, J.; Chen, C.; Sun, Y.; Stengos, T. Endogenous Kink threshold regression. 2023. [Google Scholar]
- Su, L.; Chen, Q. Testing homogeneity in panel data models with interactive fixed effects. Econometric Theory 2013, 29, 1079–1135. [Google Scholar] [CrossRef]
- Baum, A.; Checherita-Westphal, C.; Rother, P. Debt and growth: New evidence for the euro area. Journal of International Money and Finance 2013, 32, 809–821. [Google Scholar] [CrossRef]
| 1 | Zhang et al. [18] study the endogenous kink regression model by applying a nonparametric control function approach. Their method can be extended to our latent structure model. We leave this for future study. |
| 2 | Given the asymptotic equivalence holds, the asymptotic normality of the slope and kink threshold estimators can be derived by following Hansen [11]. We will not go through the details here. |
| 3 | In the empirical application, as suggested by Miao et al. [12], we use . |
Figure 1.
Yearly Average Economic Growth and Public Debt to GDP Ratio: All Countries
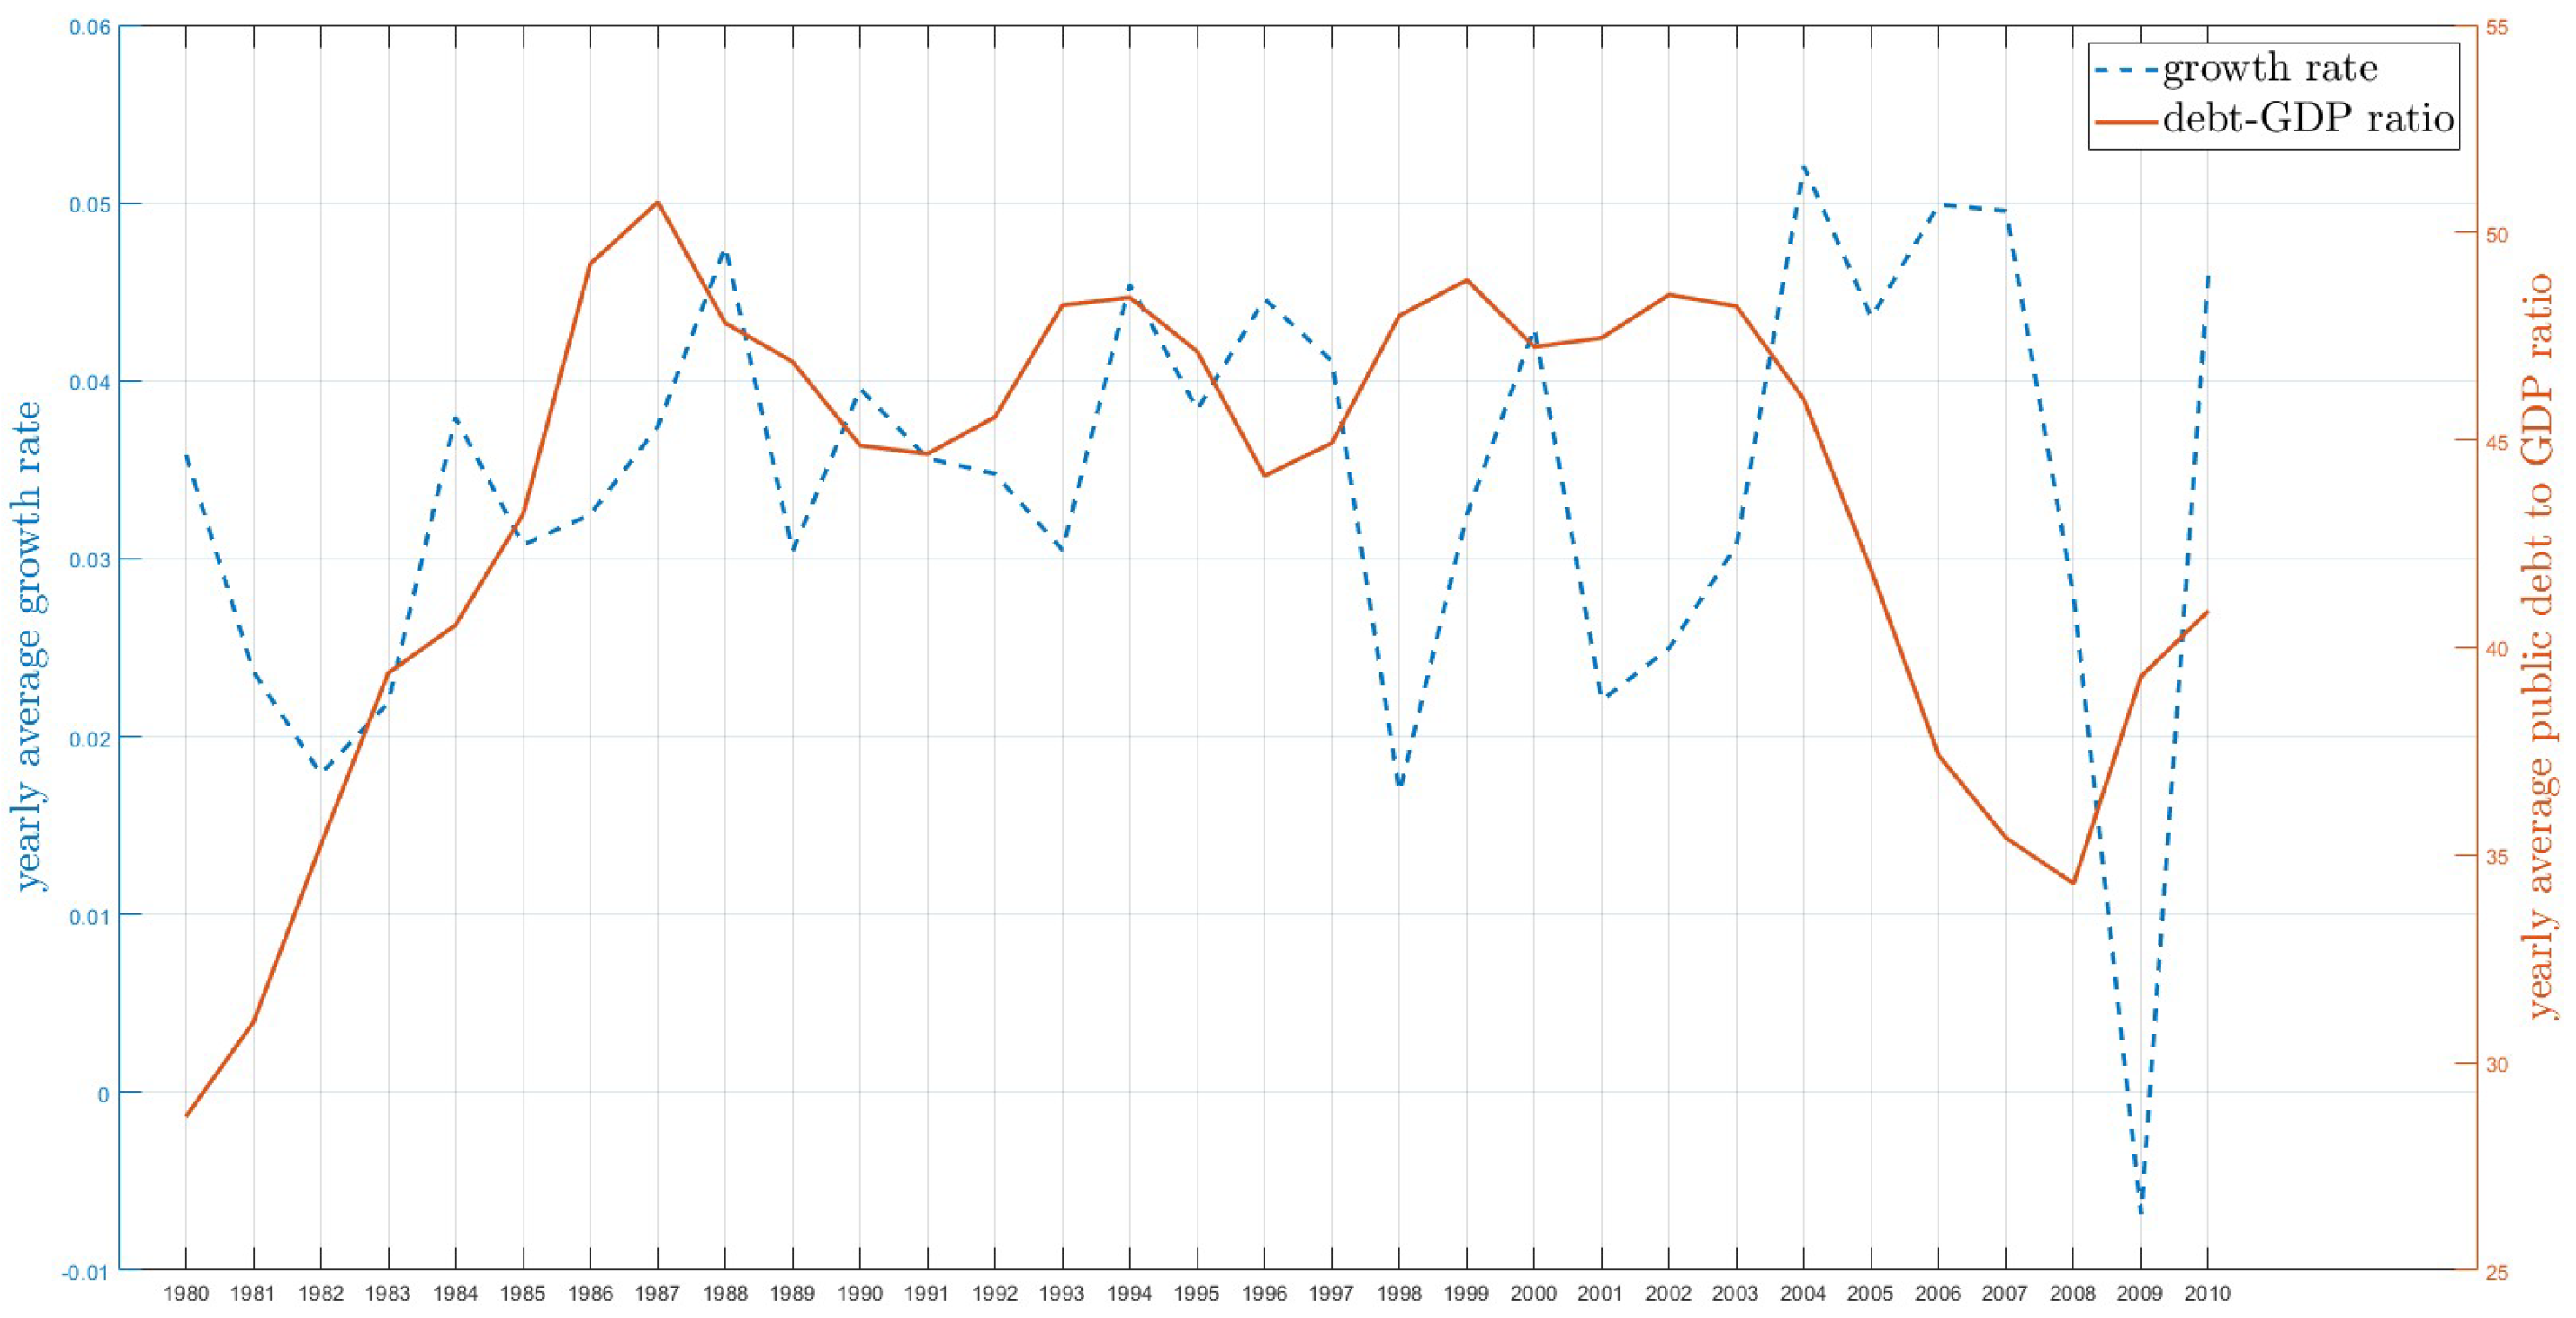
Figure 2.
Yearly Average Economic Growth and Public Debt to GDP Ratio: OECD Countries
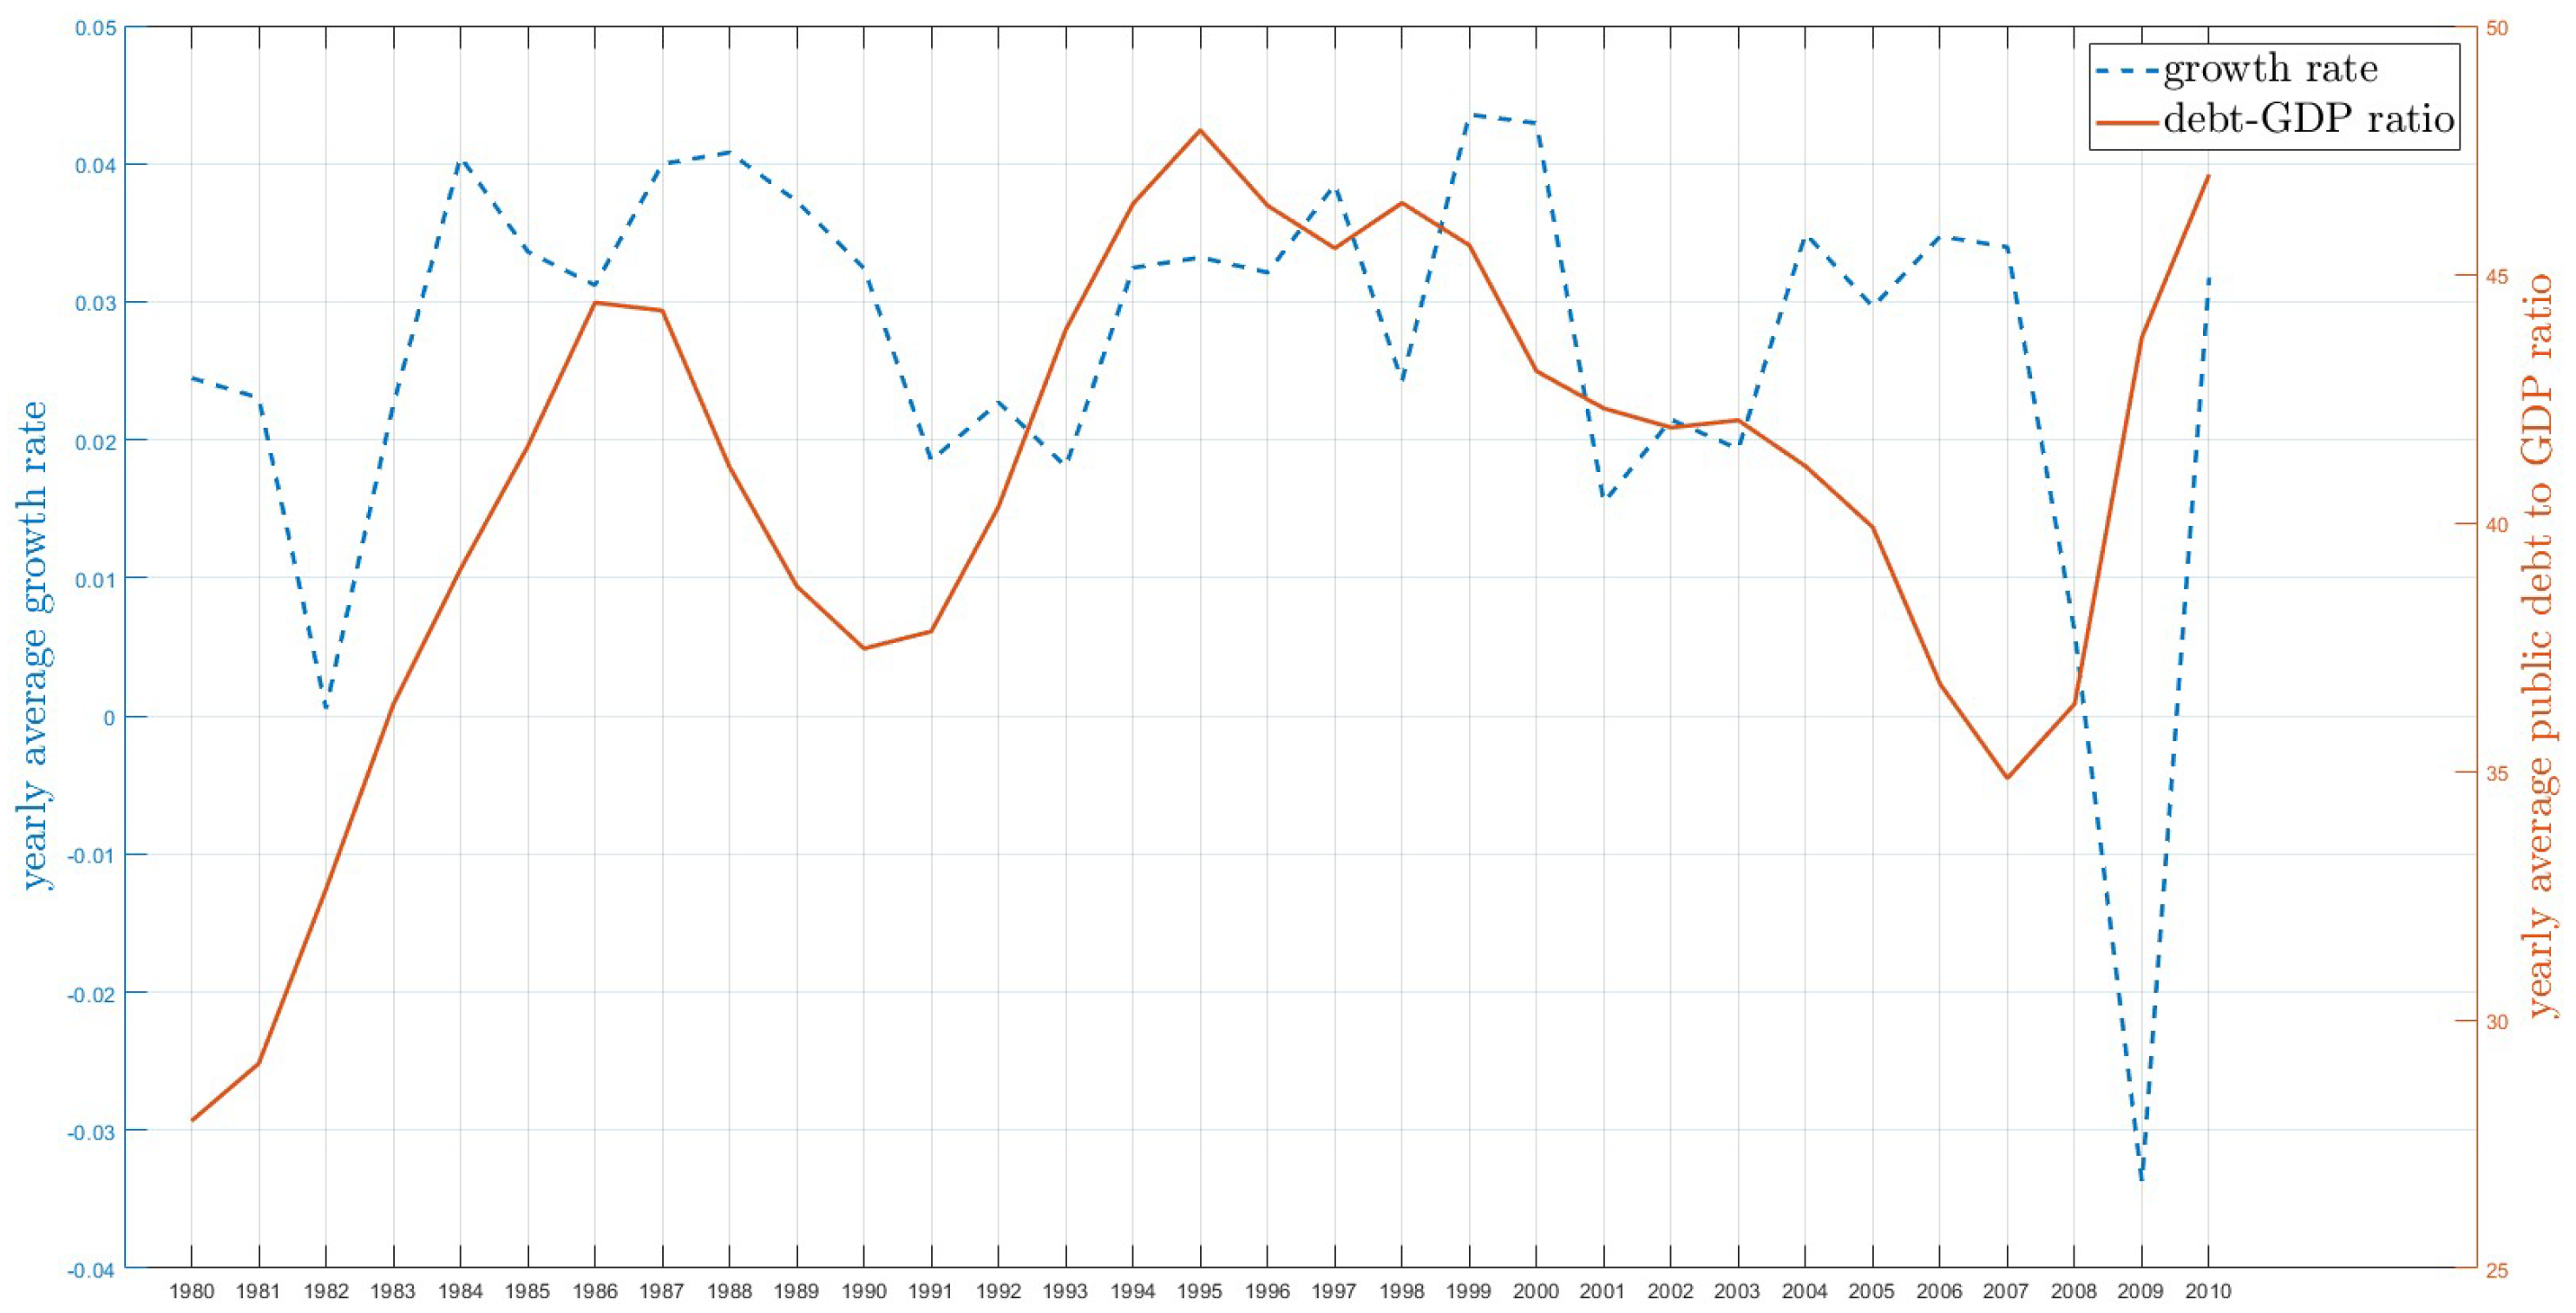
Figure 3.
Yearly Average Economic Growth and Public Debt to GDP Ratio: OECD Countries
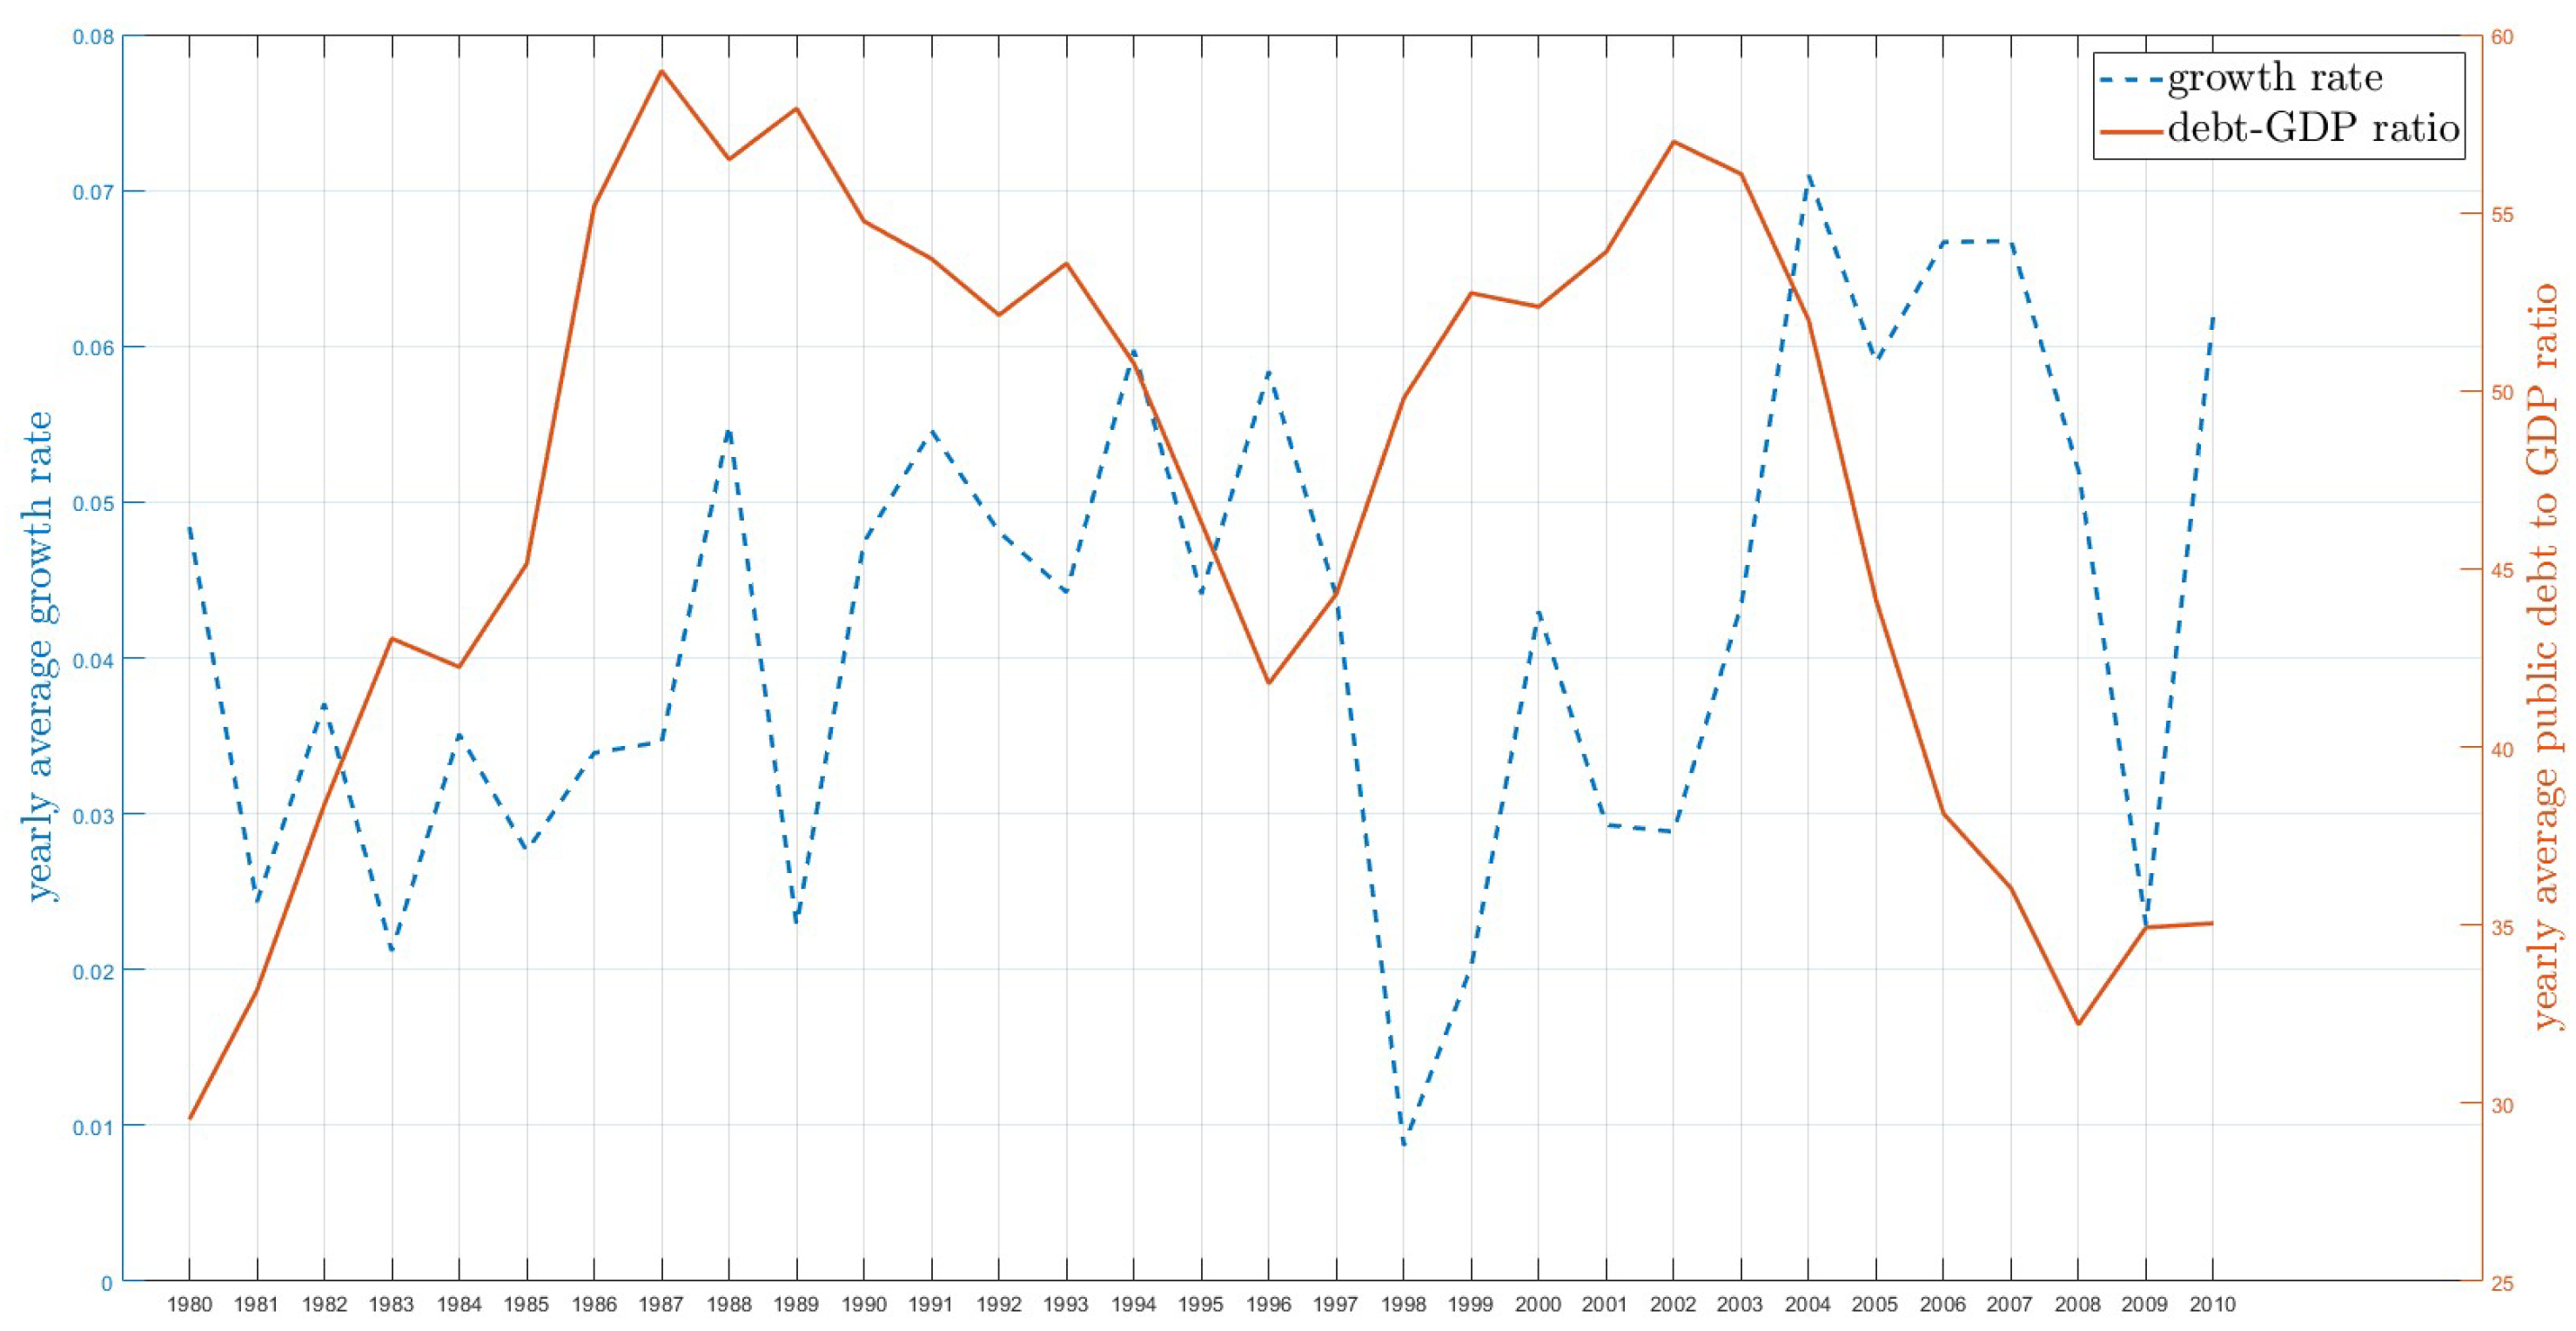
Figure 4.
The Information Criterion for Determining the Number of Groups
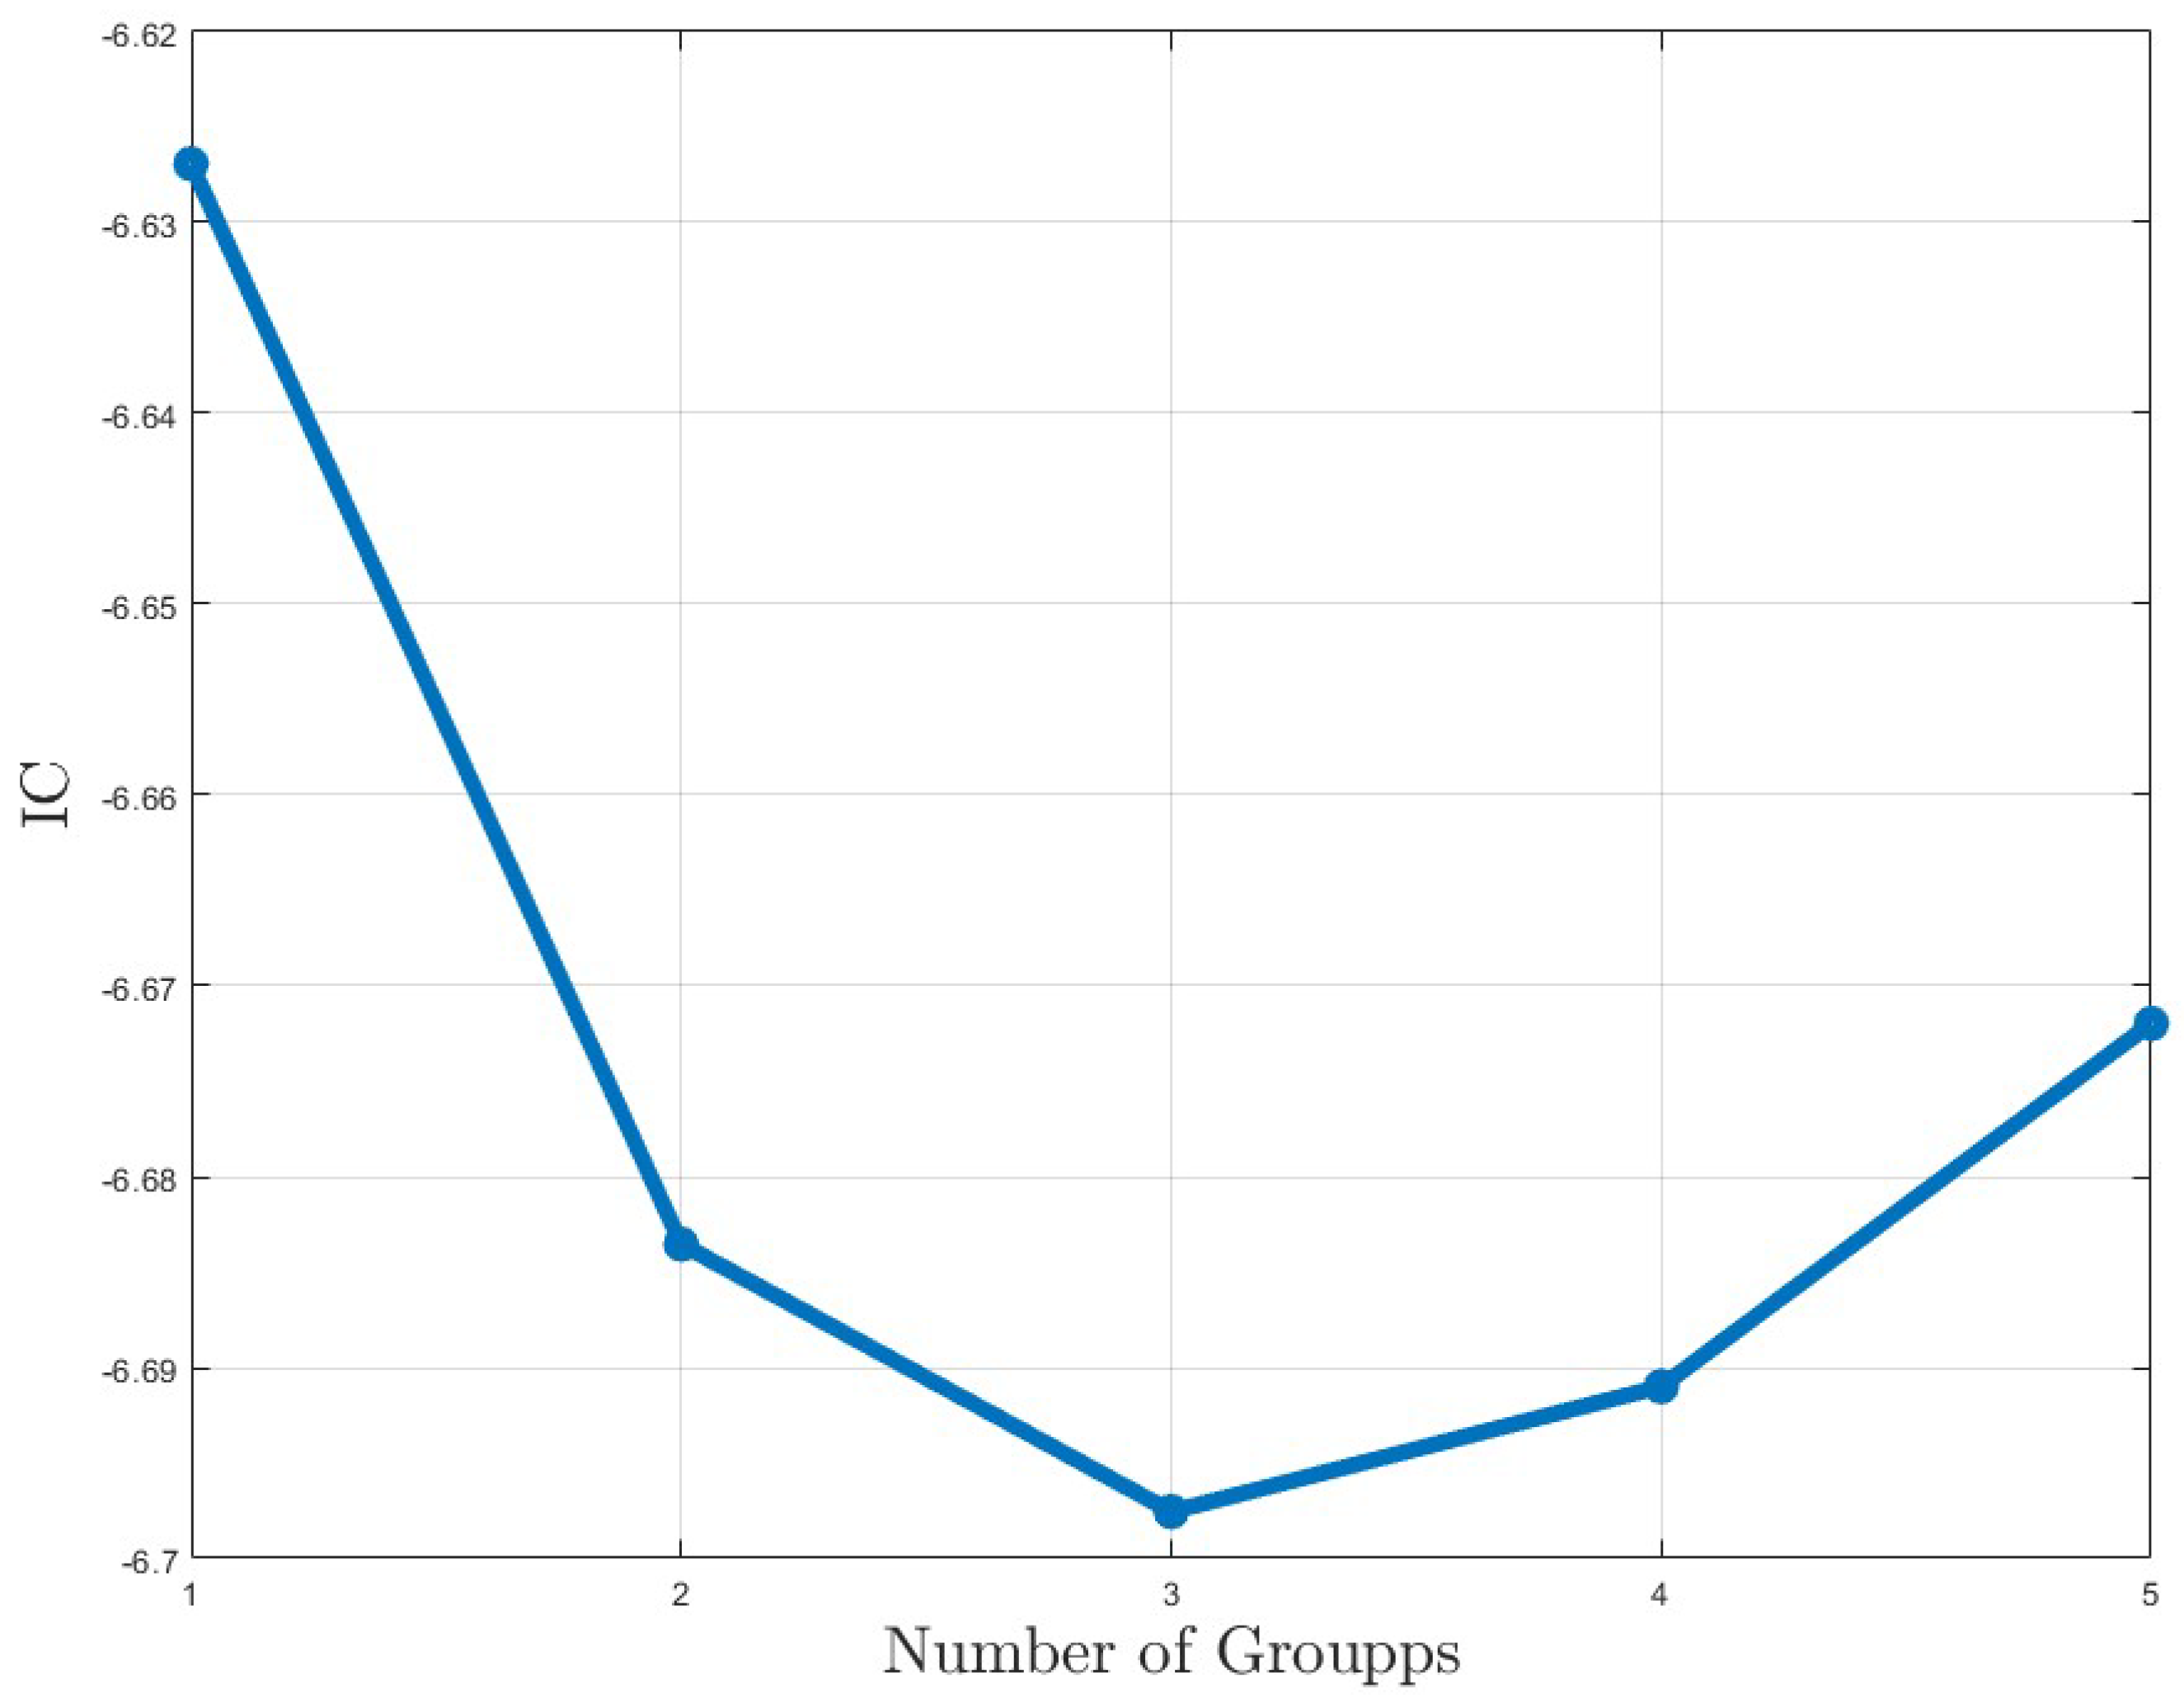
Figure 5.
Estimates of Group Memberships
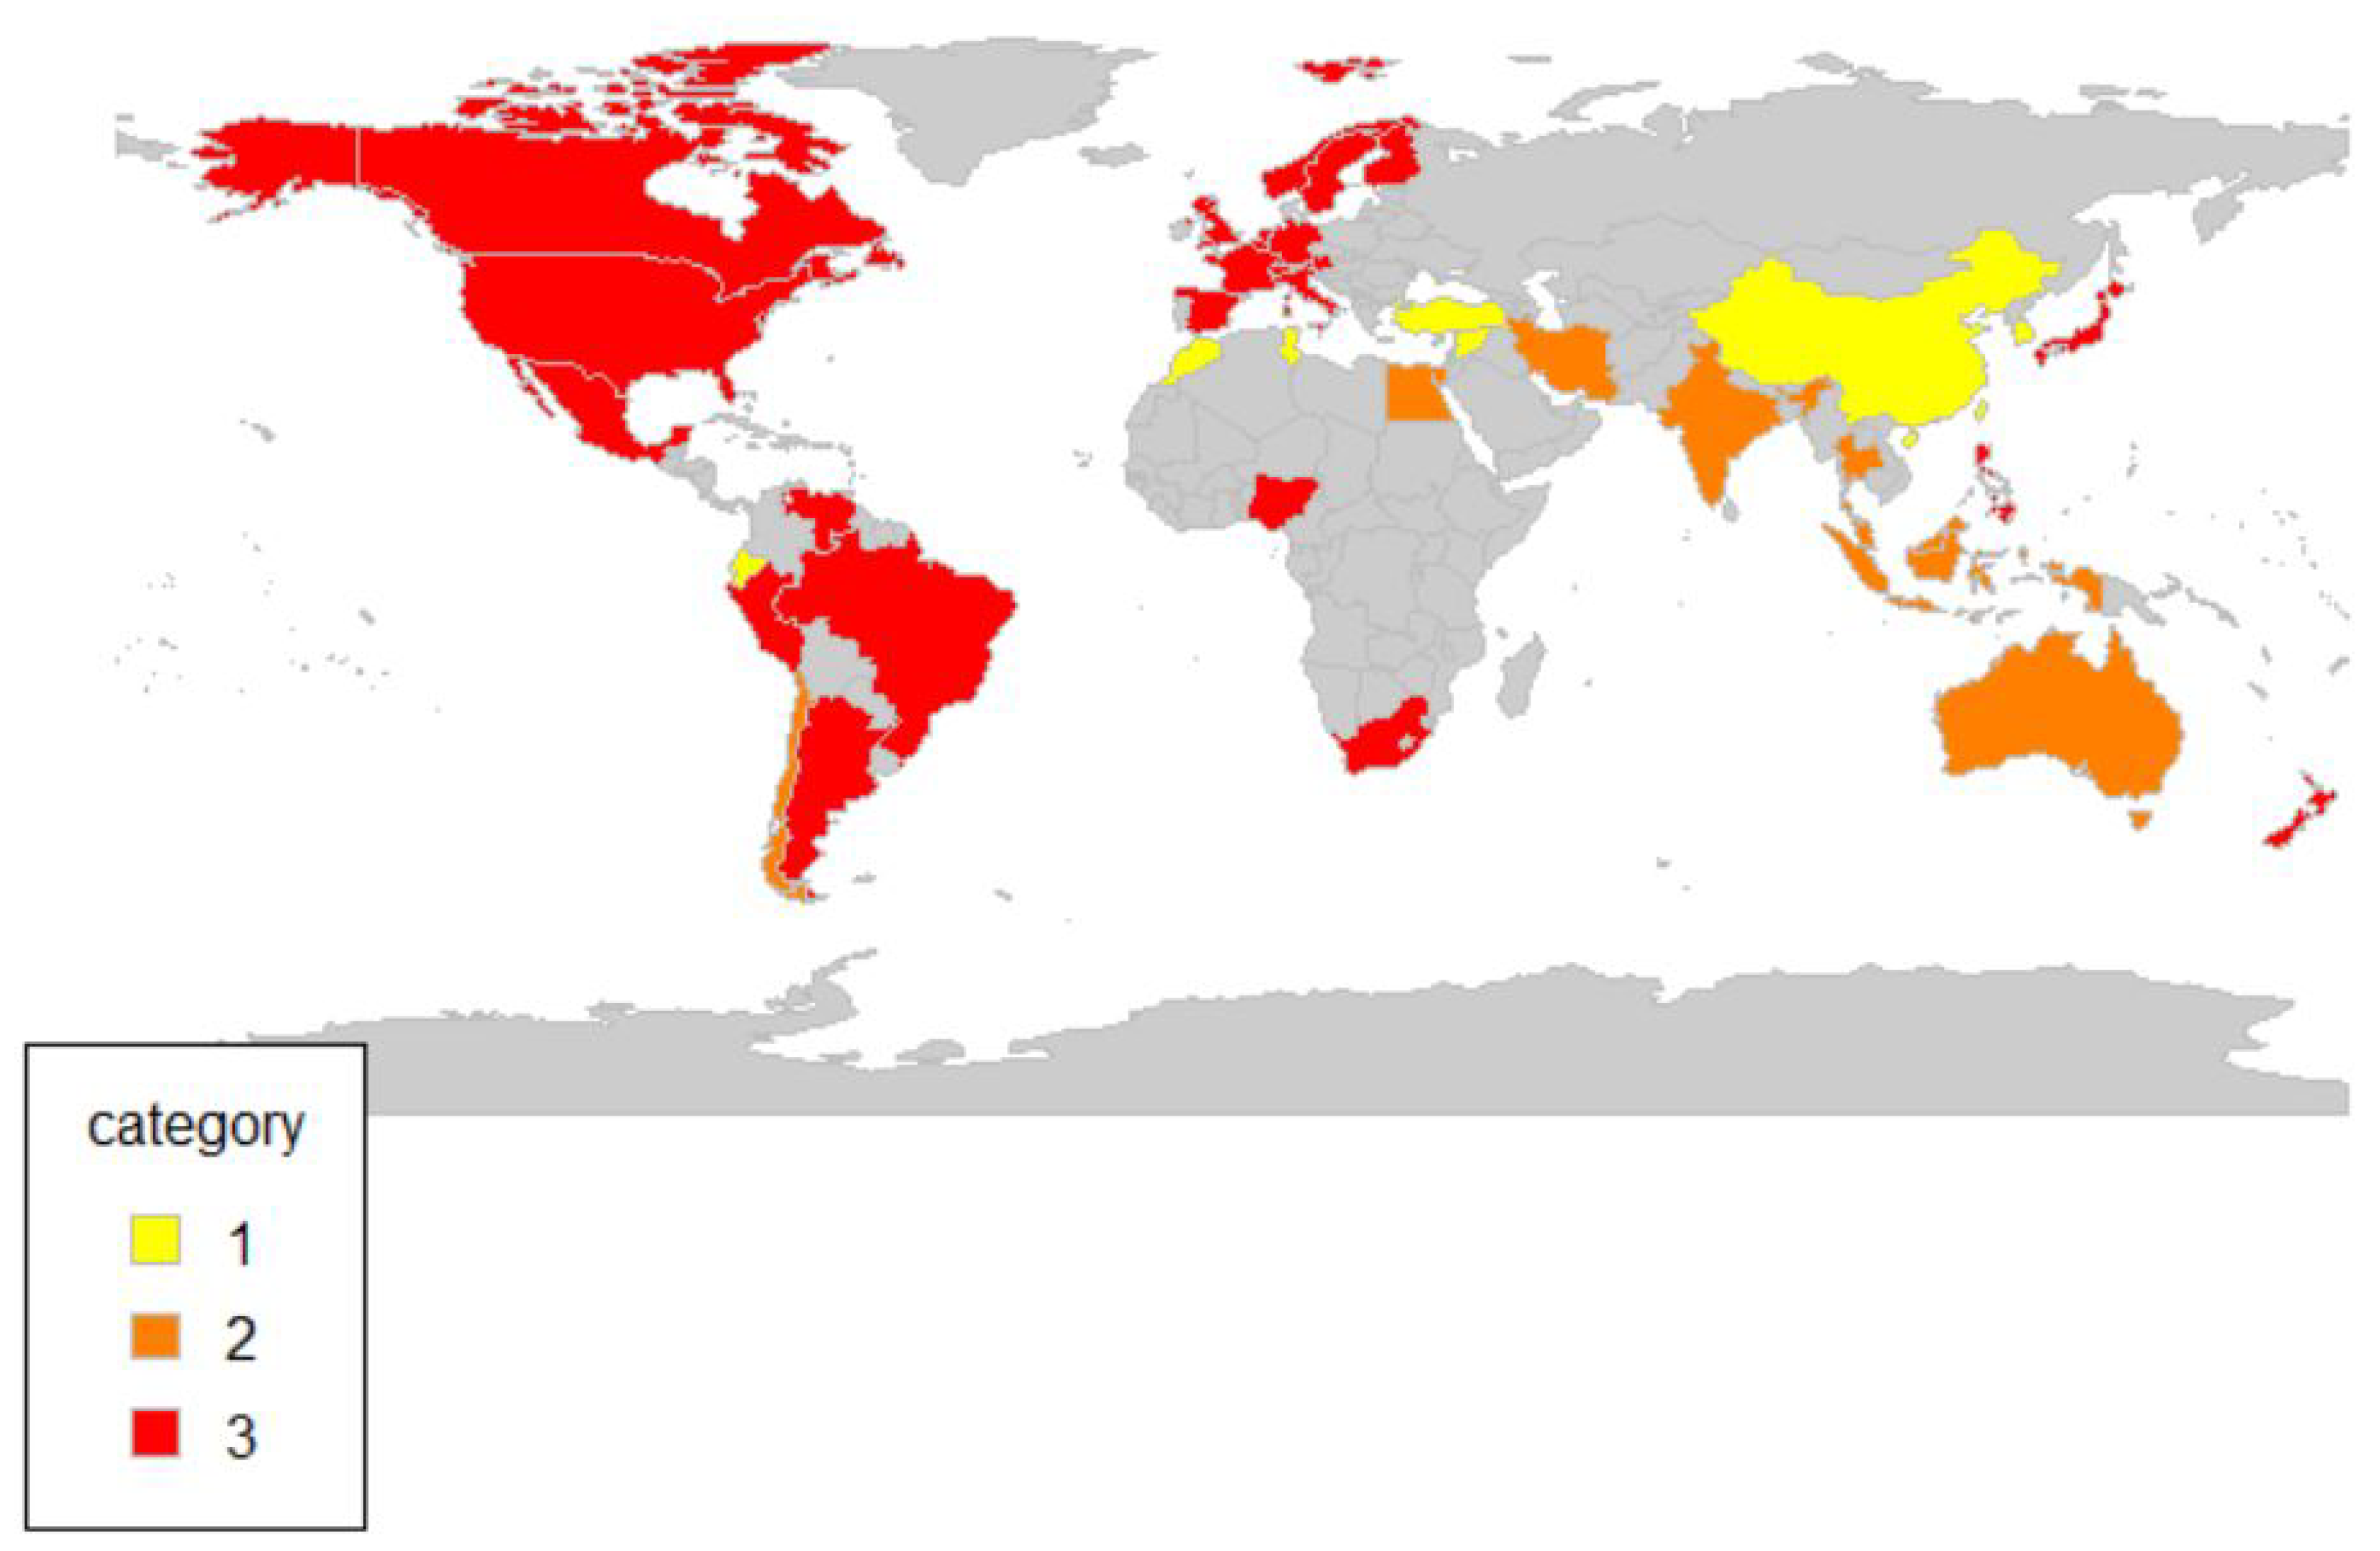

Table 1.
DGP1-Monte Carlo Simulation Results
| Group 1 | Group 2 | Group 3 | ||||||||
| MSE | ||||||||||
| N=50 | T=30 | 0.014 | 0.030 | 0.209 | 0.007 | 0.017 | 0.126 | 0.458 | 0.035 | 0.336 |
| N=100 | T=30 | 0.010 | 0.007 | 0.107 | 0.005 | 0.003 | 0.065 | 0.007 | 0.010 | 0.118 |
| N=50 | T=60 | 0.043 | 0.141 | 0.173 | 0.004 | 0.003 | 0.051 | 0.007 | 0.186 | 0.170 |
| N=100 | T=60 | 0.002 | 0.002 | 0.027 | 0.002 | 0.001 | 0.030 | 0.003 | 0.003 | 0.033 |
| BIAS | ||||||||||
| N=50 | T=30 | -0.019 | 0.049 | 0.030 | -0.014 | 0.030 | 0.010 | -0.069 | 0.054 | 0.064 |
| N=100 | T=30 | -0.021 | -0.011 | -0.037 | -0.006 | 0.002 | -0.003 | -0.010 | 0.015 | 0.019 |
| N=50 | T=60 | -0.030 | 0.053 | 0.012 | -0.012 | 0.001 | -0.049 | -0.010 | 0.069 | 0.018 |
| N=100 | T=60 | 0.001 | 0.009 | 0.024 | 0.001 | 0.005 | 0.009 | -0.013 | 0.004 | -0.026 |
| STD | ||||||||||
| N=50 | T=30 | 0.118 | 0.166 | 0.457 | 0.085 | 0.127 | 0.355 | 0.673 | 0.180 | 0.576 |
| N=100 | T=30 | 0.100 | 0.081 | 0.325 | 0.067 | 0.057 | 0.254 | 0.081 | 0.098 | 0.343 |
| N=50 | T=60 | 0.205 | 0.371 | 0.416 | 0.066 | 0.053 | 0.219 | 0.082 | 0.426 | 0.412 |
| N=100 | T=60 | 0.042 | 0.042 | 0.163 | 0.040 | 0.037 | 0.173 | 0.051 | 0.050 | 0.179 |
Table 2.
DGP1-Monte Carlo Simulation Results
| Group 1 | Group 2 | Group 3 | ||||||||
| MSE | ||||||||||
| N=50 | T=30 | 0.139 | 0.731 | 0.391 | 0.024 | 0.401 | 0.288 | 0.011 | 0.043 | 0.255 |
| N=100 | T=30 | 0.016 | 0.003 | 0.099 | 0.003 | 0.003 | 0.035 | 0.006 | 0.033 | 0.144 |
| N=50 | T=60 | 0.028 | 0.010 | 0.135 | 0.005 | 0.004 | 0.074 | 0.036 | 0.034 | 0.173 |
| N=100 | T=60 | 0.007 | 0.001 | 0.055 | 0.001 | 0.001 | 0.020 | 0.001 | 0.010 | 0.072 |
| BIAS | ||||||||||
| N=50 | T=30 | -0.100 | 0.112 | 0.008 | -0.016 | 0.122 | 0.065 | -0.028 | 0.051 | -0.044 |
| N=100 | T=30 | -0.025 | 0.017 | 0.021 | -0.003 | 0.006 | 0.018 | -0.018 | 0.030 | -0.005 |
| N=50 | T=60 | -0.036 | 0.008 | -0.013 | -0.018 | 0.005 | -0.046 | -0.019 | 0.031 | 0.008 |
| N=100 | T=60 | -0.010 | 0.009 | 0.020 | 0.001 | 0.004 | 0.002 | -0.004 | 0.025 | -0.005 |
| STD | ||||||||||
| N=50 | T=30 | 0.164 | 0.098 | 0.368 | 0.069 | 0.062 | 0.268 | 0.188 | 0.182 | 0.416 |
| N=100 | T=30 | 0.085 | 0.035 | 0.233 | 0.036 | 0.036 | 0.140 | 0.033 | 0.097 | 0.268 |
| N=50 | T=60 | 0.359 | 0.847 | 0.625 | 0.153 | 0.622 | 0.533 | 0.102 | 0.200 | 0.504 |
| N=100 | T=60 | 0.124 | 0.056 | 0.314 | 0.059 | 0.052 | 0.186 | 0.076 | 0.179 | 0.380 |
Table 3.
DGP1-Mis-classification Frequency(MF)
| N=50 | N=100 | N=50 | N=100 | |
| T=30 | 0.0036 | 0.0021 | 0.0114 | 0.0088 |
| T=60 | 0 | 0 | 0.004 | 0.002 |
Note: The table reports the sample average misclassification frequency of our estimator across replications. For each replication, we define
Table 4.
DGP2-Monte Carlo Simulation Results
| Group 1 | Group 2 | Group 3 | ||||||||||
|---|---|---|---|---|---|---|---|---|---|---|---|---|
| MSE | 0.001 | 0.009 | 0.023 | 0.004 | 0.000 | 0.011 | 0.017 | 0.003 | 0.000 | 0.016 | 0.027 | 0.002 |
| 0.001 | 0.005 | 0.011 | 0.002 | 0.000 | 0.006 | 0.013 | 0.002 | 0.000 | 0.014 | 0.015 | 0.002 | |
| 0.000 | 0.002 | 0.006 | 0.002 | 0.000 | 0.003 | 0.007 | 0.001 | 0.000 | 0.004 | 0.007 | 0.001 | |
| 0.000 | 0.002 | 0.004 | 0.001 | 0.000 | 0.002 | 0.004 | 0.000 | 0.000 | 0.003 | 0.005 | 0.001 | |
| BIAS | 0.006 | 0.018 | -0.068 | 0.016 | 0.005 | -0.029 | -0.037 | 0.036 | -0.001 | -0.095 | 0.007 | 0.040 |
| 0.009 | 0.007 | -0.060 | 0.020 | 0.006 | -0.036 | -0.062 | 0.031 | 0.001 | -0.096 | -0.015 | 0.041 | |
| 0.001 | -0.011 | -0.021 | 0.015 | 0.002 | -0.022 | -0.031 | 0.016 | 0.001 | -0.047 | -0.021 | 0.019 | |
| 0.001 | -0.015 | -0.026 | 0.013 | 0.002 | -0.019 | -0.036 | 0.013 | 0.000 | -0.040 | -0.034 | 0.017 | |
| STD | 0.031 | 0.094 | 0.134 | 0.058 | 0.017 | 0.099 | 0.125 | 0.038 | 0.015 | 0.081 | 0.163 | 0.029 |
| 0.021 | 0.072 | 0.085 | 0.044 | 0.012 | 0.068 | 0.094 | 0.026 | 0.010 | 0.068 | 0.123 | 0.024 | |
| 0.020 | 0.048 | 0.077 | 0.039 | 0.011 | 0.047 | 0.078 | 0.024 | 0.009 | 0.047 | 0.079 | 0.018 | |
| 0.013 | 0.036 | 0.054 | 0.028 | 0.008 | 0.036 | 0.048 | 0.017 | 0.007 | 0.042 | 0.064 | 0.015 | |
Table 5.
DGP2-Monte Carlo Simulation Results
| Group 1 | Group 2 | Group 3 | ||||||||||
|---|---|---|---|---|---|---|---|---|---|---|---|---|
| MSE | 0.001 | 0.016 | 0.011 | 0.005 | 0.000 | 0.007 | 0.018 | 0.002 | 0.001 | 0.012 | 0.053 | 0.006 |
| 0.001 | 0.006 | 0.005 | 0.003 | 0.000 | 0.006 | 0.010 | 0.002 | 0.001 | 0.007 | 0.045 | 0.004 | |
| 0.000 | 0.006 | 0.004 | 0.002 | 0.000 | 0.003 | 0.007 | 0.001 | 0.000 | 0.003 | 0.026 | 0.002 | |
| 0.000 | 0.002 | 0.002 | 0.001 | 0.000 | 0.002 | 0.004 | 0.001 | 0.000 | 0.002 | 0.012 | 0.001 | |
| BIAS | 0.017 | -0.036 | -0.046 | 0.030 | 0.003 | -0.050 | -0.053 | 0.032 | -0.022 | -0.080 | -0.089 | 0.068 |
| 0.017 | -0.015 | -0.045 | 0.025 | 0.001 | -0.059 | -0.042 | 0.035 | -0.020 | -0.067 | -0.105 | 0.061 | |
| 0.011 | -0.015 | -0.021 | 0.015 | 0.001 | -0.027 | -0.037 | 0.015 | -0.011 | -0.041 | -0.046 | 0.034 | |
| 0.010 | -0.004 | -0.025 | 0.011 | 0.001 | -0.025 | -0.036 | 0.015 | -0.010 | -0.035 | -0.048 | 0.029 | |
| STD | 0.028 | 0.123 | 0.095 | 0.061 | 0.016 | 0.069 | 0.125 | 0.035 | 0.015 | 0.071 | 0.213 | 0.036 |
| 0.018 | 0.075 | 0.059 | 0.044 | 0.011 | 0.046 | 0.091 | 0.025 | 0.011 | 0.050 | 0.184 | 0.025 | |
| 0.017 | 0.076 | 0.062 | 0.042 | 0.011 | 0.048 | 0.078 | 0.023 | 0.009 | 0.040 | 0.154 | 0.020 | |
| 0.014 | 0.046 | 0.038 | 0.028 | 0.007 | 0.035 | 0.052 | 0.016 | 0.007 | 0.033 | 0.097 | 0.016 | |
Table 6.
DGP2-Misclassification Frequency(MF)
| N=50 | N=100 | N=50 | N=100 | |
| T=30 | 0.0038 | 0.005 | 0.057 | 0.0539 |
| T=60 | 0 | 0 | 0.005 | 0.0064 |
Note: The table reports the sample average misclassification frequency of our estimator across replications. For each replication, we define
Table 7.
Estimated Kink Threshold and Slope Coefficients
| Latent group | ✓ | |||
|---|---|---|---|---|
| G1 | G2 | G3 | ||
| 3.7020 | 3.7773 | 3.7906 | 4.0630 | |
| (0.0023) | (0.0055) | (0.0053) | (0.0026) | |
| -0.0842 | ||||
| (0.0388) | (0.0775) | (0.0626) | (0.0579) | |
| (0.0028) | (0.0044) | (0.0044) | (0.0029) | |
| 0.0022 | 0.0061 | 0.0032 | ||
| (0.0037) | (0.0083) | (0.0077) | (0.0066) | |
| Country | 40 | 7 | 9 | 24 |
Note:, , and * denote statistical significance at a 1%, 5%, and 10% level, respectively. This table presents the results of the panel kink regression model estimations, both without and with latent group structures. The optimal number of groups, determined to be 3, is based on minimizing the IC criterion, as outlined in the results section. The first column shows the kink threshold and the slope parameters. The second column gives the results of the pooled panel kink regression model. The last three columns report the latent group estimates.
Disclaimer/Publisher’s Note: The statements, opinions and data contained in all publications are solely those of the individual author(s) and contributor(s) and not of MDPI and/or the editor(s). MDPI and/or the editor(s) disclaim responsibility for any injury to people or property resulting from any ideas, methods, instructions or products referred to in the content. |
© 2024 by the authors. Licensee MDPI, Basel, Switzerland. This article is an open access article distributed under the terms and conditions of the Creative Commons Attribution (CC BY) license (http://creativecommons.org/licenses/by/4.0/).
Copyright: This open access article is published under a Creative Commons CC BY 4.0 license, which permit the free download, distribution, and reuse, provided that the author and preprint are cited in any reuse.


