Submitted:
04 January 2024
Posted:
08 January 2024
You are already at the latest version
Abstract
Co-inhibitory receptors (Co-IRs) are essential in controlling the progression of immunopathology in rheumatoid arthritis (RA) by limiting T cell activation. The objective of this investigation was to determine the phenotypic expression of Co-IRs T cells and to assess the levels of serum soluble PD-1, PDL-2, and Tim3 in Taiwanese RA patients. Co-IRs T cells were immunophenotyped employing multicolor flow cytometry, and ELISA was utilized for measuring soluble PD-1, PDL-2, and Tim3. Correlations have been detected across the percentage of T cells expressing Co-IRs (MFI) and different indicators in the blood, including ESR, high sensitivity CRP (hsCRP), 28 joint disease activity scores (DAS28), and soluble PD-1/PDL-2/Tim3. In RA patients, we recognized elevated levels of PD-1 (CD279), CTLA-4, and TIGIT on CD4+ T cells; TIGIT, HLA-DR, TIM3, and LAG3 on CD8+ T cells; and CD8+CD279+TIM3+, CD8+HLA-DR+CD38+ T cells. The following tests proved to be correlated with hsCRP: CD4/CD279 MFI, CD4/CD279%, CD4/TIM3%, CD8/TIM3%, CD8/TIM3 MFI, CD8/LAG3%, and CD8+HLA-DR+CD38+%. CD8/LAG3 and CD8/TIM3 MFIs are linked to ESR. DAS28-ESR and DAS28-CRP exhibited relationships with CD4/CD127 MFI, CD8/CD279%, and CD8/CD127 MFI, respectively. CD4+CD279+TIM3+% was correlated with DAS28-ESR (p=0.0084, N=46), DAS28-CRP (p=0.007, N=47), and hsCRP (p=0.002, N=56), respectively. In the serum of patients with RA, levels of soluble PD-1, PDL-2, and Tim3 were extremely elevated. CD4+ TIM3+% (p=0.0089, N=46) and CD8+ TIM3+% (p=0.0305, N=46) were correlated with sTIM3 levels; sPD1 levels were correlated with CD4+CD279+% (p<0.0001, N=31) and CD3+CD279+% (p=0.0084, N=30). Co-IRs expressions on CD4+ and CD8+ T cells, as well as soluble PD-1, PDL-2, and Tim3 levels, could function as indicators of disease activity and potentially play crucial roles in the pathogenesis of RA, in accordance to our findings.
Keywords:
Rheumatoid arthritis
; T cell
; Co-inhibitory receptors
; disease activity
1. Introduction
Rheumatoid arthritis (RA) is a widely observed autoimmune disorder distinguished by the gradual deterioration of articular structures, inflammation of the joints, and alterations in the cardiovascular and metabolic systems. The pathogenesis of RA is predominantly attributed to an autoimmune dysfunction that progresses through conceptual phases. Gaining an understanding of the underlying causes that instigate and sustain the disease represents a potential avenue for advancement [1]. Individuals diagnosed with RA have demonstrated that their central immune system gets triggered by innate myeloid/lymphoid cells, promptly defensive natural killer (NK)/mast cells, adaptive T and B cells [2,3]. Progressive joint degeneration ensues as a consequence of the anomalous cytokine production and cell proliferation initiated through these immunological encounters [2,3,4]. Exceptionally robust immune treatment options encompass achieving the development of tolerance and regaining of immunologic homeostasis with the goal to attain drug-free remission [5].
Diverse behaviors to therapeutic tailored agents, involving T cell co-stimulation signalling blockades, and inhibiting pro-inflammatory cytokines (TNFα and IL-6), and B cell depletion, reveal that RA is a disorder that has numerous root causes. Immunoreactivity modulation is impacted by the complicated interaction of a multitude of molecules within cells. An immunologic phenomena, co-inhibition is now recognized as a developing target for immune-mediated disorders. Lackluster co-inhibition and/or overbearing co-stimulation may contribute to the emergence of autoimmunity. Investigating these underlying processes provides the potential for discovering innovative therapy targets for treatment-resistant RA suffers. T cell exhaustion is distinguished by a substantial decrease of T cell proliferation and the loss of effector functionality [6]. Standardized assays for immunophenotyping that determine RA clinical profiles enable novel prospects for patient stratification and prioritize therapeutic adaptations [7].
The immune system possesses a unique ability to safeguard the body and ensure homeostasis via the functioning of multiple balances and checks. T cell receptors must exist for T cell activation, and cytokines generate yet another co-stimulatory signal through an immune co-receptor which has been enhanced [8]. Co-inhibitory receptors (Co-IRs) have a vital role in controlling the continuing inflammation and immune abnormalities in RA. Their ability to reduce T cell activation indicate that stimulating these pathways of inhibition on a personal or systemic magnitude could serve as an effective approach to establish biomarkers of RA activity. The aims of this study were to ascertain the immunological phenotypic expression of Co-IRs on T cells and soluble mediators that correspond with disease activity in patients with RA in Taiwan, in accordance with this theory.
2. Patients and Methods
2.1. Descriptive attributes of cohorts and study populations
The majority of the participants in this study were enrolled in the rheumatology clinics affiliated with Chang Gung Memorial Hospital. The study enrolled rheumatologists who diagnosed RA in each individual based on the criteria set forth by the American College of Rheumatology. Sixty-three patients with RA met the diagnostic criteria, while 28 healthy controls were enlisted. The human research protocols received approval from the ethics committee at Chang Gung Memorial Hospital (Institutional Review Board No. 201800457B0), and informed consent was obtained from all human subjects. Prior to conducting any measurements, interventions, or blood collections, informed consent was obtained.
2.2. Cell isolation
Peripheral blood mononuclear cells (PBMCs) mononuclear cells (SFMCs) were directly isolated by Ficoll-Hypaque gradient (Sigma-Aldrich).
2.3. Antibodies for immune-phenotype
CD3-PerCP-Cy5.5, CD4-PerCP-Cy5.5, CD8-APC, CD38-PE, CD127-FITC, CD127-PerCP-Cy5.5, CD160-Alex Fluor 488, LAG3(CD223)-PE, CD244-PE, PD-1(CD279)-FITC, CTLA-4-Alex Fluor 488, HLA-DR-FITC, TIGIT-PE and TIM3-PE antibodies were included.
2.4. Flow cytometric analysis
All patients who initiated treatment with conventional DMARDs were enrolled in an immunophenotyping study using multicolor flow cytometry. Blood was drawn as part of standard laboratory testing procedures. Flow cytometry was used to promptly analyze all of the obtained samples. To inhibit Fc receptors and prevent non-specific antibody binding, peripheral blood mononuclear cells were extracted and suspended in PBS containing 3% human IgG. They were then incubated in the dark for 15 minutes at 4 °C. Following this, the cells were rinsed with PBS containing 1% BSA. The background fluorescence was evaluated utilizing isotype- and fluorochrome-matched control mAbs. Antibodies were used to stain cells, and multicolor flow cytometry was used to evaluate the results. The cells were collected and analyzed using FlowJo, LLC software (Tree Star, Ashland, OR, USA). On the basis of a comprehensive four-color flow cytometric analysis utilizing the HIP method, the phenotype of subsets of immune cells was determined. Clinical disease activity was correlated with the results, which included high sensitivity CRP (hsCRP), ESR, and 28 joint disease activity scores (DAS28-CRP and DAS28-ESR).
2.5. Enzyme-linked immunosorbent assay (ELISA)
The serum levels of specific related Co-IRs and ligand for soluble PD-1, PDL-2 and Tim3 analysis were measured using ELISA kits (R&D Systems), according to the manufacturer’s instructions.
2.6. Statistical analysis
The statistical analyses were performed with Graph Pad Prism 8.4.1. Data are expressed as mean plus/minus standard deviation (S.D.) or number (%). Differences between groups were compared using unpaired t-test. Correlation analysis was performed using Pearson’s correlation coefficient. By using Spearman correlation analysis, the relationship between Co-IR expression/soluble levels and DAS28-CRP and DAS28-ESR was evaluated. All reported P-values were two-sided and were not adjusted for multiple testing. The level of significance was set at P < 0.05.
3. Results
3.1. Co-IRs expression on T cells characterization with Taiwanese RA
A summary of the characteristics of forty-eight RA patients was provided in supplementary Table 1. Flow cytometry was utilized to determine the percentages (%) and mean fluorescence intensities (MFI) of Co-IRs on CD4+ and CD8+ T cells isolated from peripheral blood. Significantly higher percentages and absolute quantities of several Co-IRs were expressed in patients with RA compared to the control group. PD-1 (CD279) expression on CD4+ T cells was significantly greater on RA patients' CD4+ T cells instead of on those from healthy volunteers, as shown in Table 1 (8.129 ± 1.128%, (N=48) vs. 3.93 ± 0.7035%, (N=27), p=0.0104). In comparison to healthy volunteers, CTLA-4 expression on CD4+ T cells was significantly higher in RA patients (0.1935 ± 0.03325%, (N=46) vs. 0.08889 ± 0.0209%, (N=27), p=0.0271). Additionally, RA patients showed higher TIGIT expression on CD4+ T cells relative to healthy volunteers (20.13 ± 0.8377%, (N=26) vs. 25.91 ± 1.214%, (N=48), p=0.0016). CD127 expression was significantly reduced on CD8+ T cells of RA patients compared to healthy volunteers (23.96 ± 2.343%, (N=48) vs. 40.86 ± 4.19%, (N=27), p=0.0003; MFI: 349.3 ± 11, (N=33) vs. 421 ± 14.87, (N=25), p=0.0002). RA patients exhibited higher TIGIT expression on CD8+ T cells relative to healthy volunteers (48.08 ± 2.361%, (N=48) vs. 25.81 ± 1.774%, (N=27), p<0.0001; MFI: 636.8 ± 23.9, (N=33) vs. 565.2 ± 14.94, (N=25), p=0.022). Compared to healthy volunteers, RA patients exhibited higher HLA-DR expression on CD8+ T cells (43.37 ± 3.425%, (N=31) vs. 18.6 ± 1.909%, (N=17), p<0.0001; MFI: 698.6 ± 30.88, (N=31) vs. 547.2 ± 24.81, (N=17), p=0.0018). In contrast to healthy volunteers, TIM3 expression on CD8+ T cells proved considerably greater in RA patients (18.71 ± 1.905%, (N=48) vs. 9.826 ± 1.19%, (N=27), p=0.0015; MFI: 468.4 ± 14.15, (N=48) vs. 384.9 ± 12.23, (N=27), p=0.0002). In RA patients, the proportion of LAG-3 CD8+T cells was substantially greater compared to those of healthy volunteers (0.9522 ± 0.1999%, (N=46) vs. 0.1963 ± 0.05324%, (N=27), p=0.0057). The study identified the following percentages of total T-cells expressing CD3: CD3+CD244+ (16.58 ± 2.761%, (N=48) vs. 7.477 ± 2.673%, (N=26), p=0.0353), CD3+CD279+ (7.237 ± 0.998%, (N=46) vs. 3.978 ± 0.7626%, (N=27), p=0.0257), CD3+TIGIT+ (43.15 ± 2.507%, (N=47) vs. 28 ± 2.888%, (N=27), p=0.0003) and CD3+CD57+ (19.81 ± 1.708%, (N=46) vs. 11.67 ± 1.38%, (N=27), p=0.0015) were expanded in RA patients compared to healthy volunteers. T cells expressing CD8+CD279+TIM3+ (0.3413 ± 0.08567%, N=46) compared to 0.08077 ± 0.01666%, (N=26), p=0.0265) and CD8+HLA-DR+CD38+ (9.191 ± 1.341%, N=47) compared to 4.519 ± 0.8416%, (N=27), p=0.0155) were also significantly more prevalent in RA patients than in healthy volunteers (Table 2).
| Markers | Mean±SD (Number) | P Value | |
| RA | Normal | ||
| CD4+CD279+TIM3+ | 0.5702 ± 0.08012 (47) | 0.3667 ± 0.0859 (27) | 0.1057 |
| CD4+CTLA4+LAG3+ | 0.1234 ± 0.02512 (47) | 0.07037 ± 0.02123 (27) | 0.1549 |
| CD4+CD127+TIGIT+ | 4.458 ± 0.5114 (48) | 5.041 ± 0.6587 (27) | 0.4914 |
| CD8+CD279+TIM3+ | 0.3413 ± 0.08567 (46) | 0.08077 ± 0.01666 (26) | 0.0265 |
| CD8+CTLA4+LAG3+ | 0.01667 ± 0.005436 (48) | 0.007407 ± 0.005136 (27) | 0.2635 |
| CD8+CD127+TIGIT+ | 2.896 ± 0.3579 (47) | 2.426 ± 0.4004 (27) | 0.4057 |
| CD8+CD160+CD244+ | 0.3596 ± 0.08051 (47) | 0.432 ± 0.1224 (25) | 0.6114 |
| CD8+HLA-DR+CD127+ | 1.016 ± 0.2676 (19) | 1.716 ± 0.3932 (19) | 0.1497 |
| CD8+HLA-DR+CD38+ | 9.191 ± 1.341 (47) | 4.519 ± 0.8416 (27) | 0.0155 |
| CD3+CD160+CD244+ | 0.8298 ± 0.2617 (47) | 0.4444 ± 0.2109 (27) | 0.3153 |
| CD3+CD279+TIGIT+ | 4.359 ± 0.5808 (46) | 2.408 ± 0.3742 (26) | 0.0207 |
3.2. Correlation between RA Disease Activity and Co-IRs expression on T cells
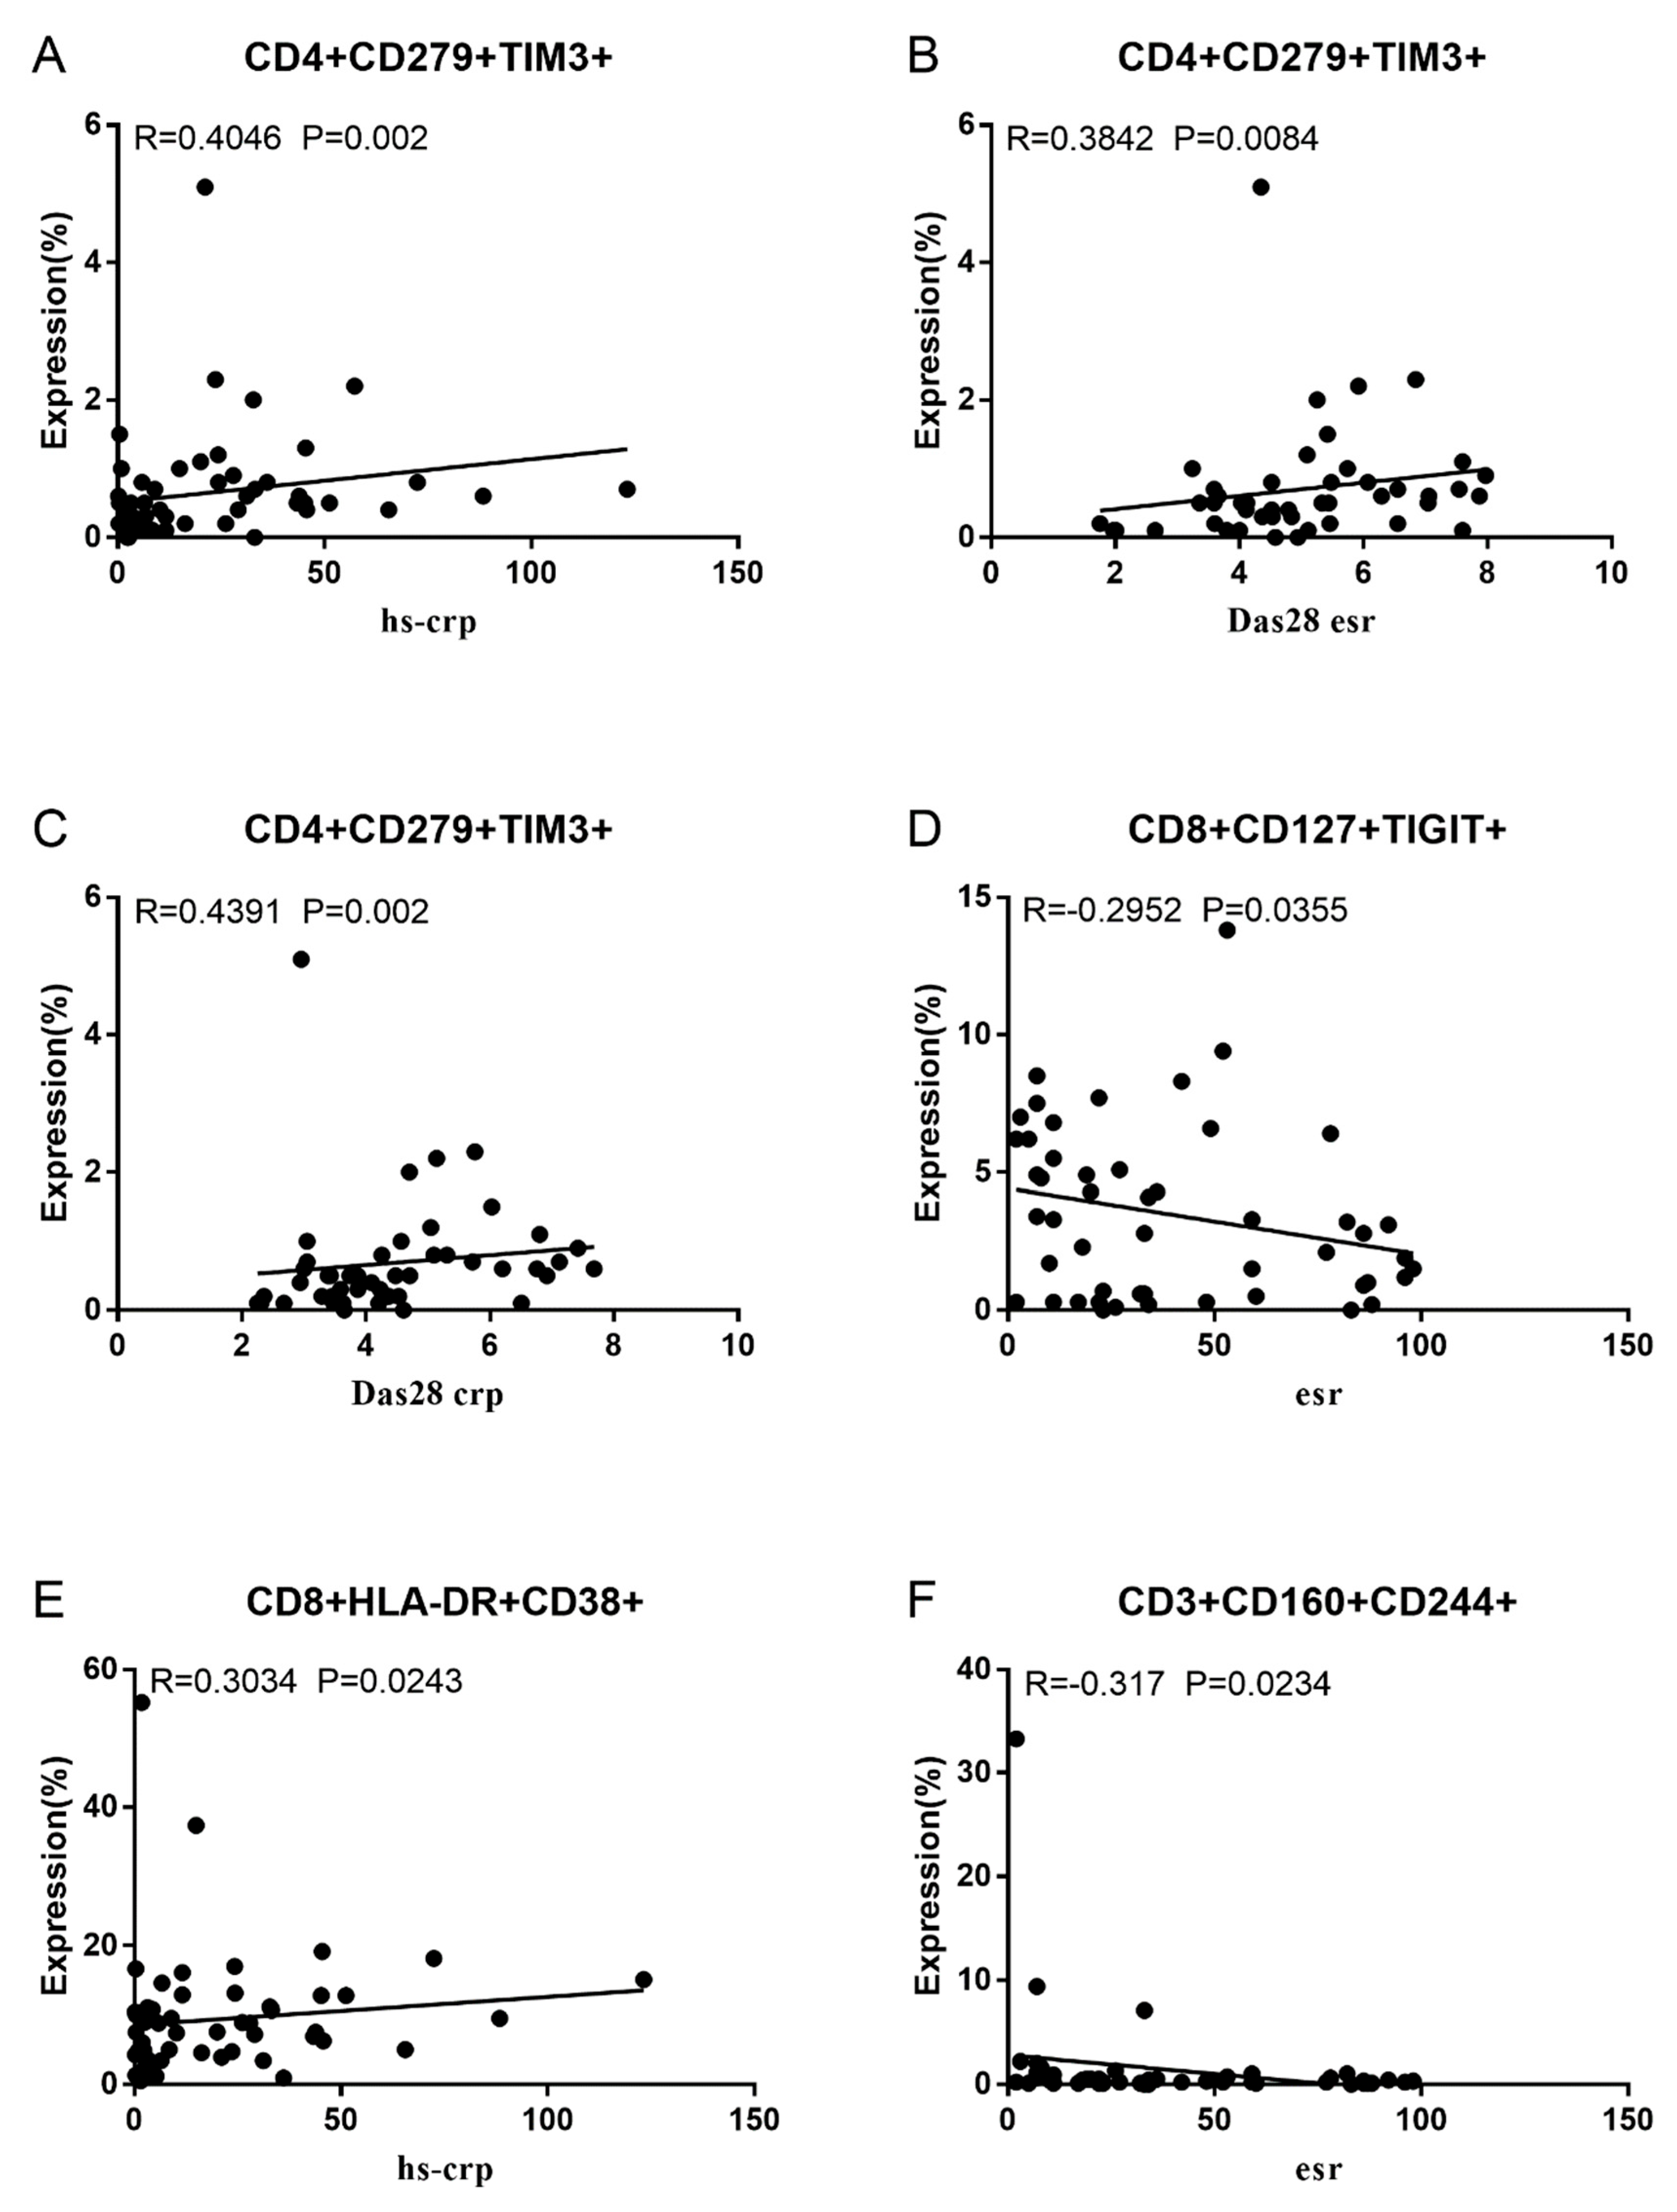
Co-IRs expression regulates the continuous inflammatory process; therefore, disease activity in RA is assessed by monitoring their levels. Evaluated was the disease activity of fifty-seven RA patients, nine of whom had been determined repeatedly. As can be seen in Figure 1A,C, CD4/PD1 MFI in CD4 T cells were linked with hsCRP (p=0.0393, N=56) and ESR (p=0.0096, N=51). There was a correlation between hsCRP and CD4/CD279% (p=0.0251, N=56, Figure 1B), CD4/TIM3% (p=0.0459, N=56, Figure 1D) and CD4/TIGIT MFI (p=0.0156, N=45, Figure 1E). CD4/CD127 MFI were correlated to DAS28-ESR (p=0.0321, N=40, Figure 1F), and DAS28-CRP (p=0.0145, N=40, Figure 1G). As shown in Figure 2A and B, CD8/TIM3 MFI (p=0.0459, N=51) and CD8/LAG3 MFI (p=0.0182, N=39) were correlated to ESR. There was a correlation between hsCRP and CD8/TIM3% (p=0.0114, N=56, Figure 2C), CD8/TIM3 MFI (p=0.001, N=56, Figure 2D), CD8/LAG3% (p=0.0236, N=56, Figure 2E) and CD8+HLA-DR MFI (p=0.0128, N=43, Figure 2F). DAS28-ESR was linked with CD8/CD279% (p=0.0456, N=46, Figure 2G) and CD8/CD127 MFI (p=0.0063, N=40, Figure 2H). Additionally associated to DAS28-CRP were CD8/CD279% (p=0.0363, N=47, Figure 2I), and CD8/CD127 MFI (p=0.0157, N=40, Figure 2J). ESR and CD3/CD244% showed a correlation (p=0.0405, N=51, Figure 2K). In double positive Co-IRs, as shown in Figure 3, CD4+CD279+TIM3+% was linked with hsCRP (p=0.002, N=56, Figure 3A), DAS28-ESR (p=0.0084, N=46, Figure 3B), and DAS-28 CRP (p=0.002, N=47, Figure 3C), CD8+CD127+TIGIT+% were correlated to ESR (p=0.0355, N=51, Figure 3D), CD8+HLA-DR+CD38+% with hsCRP (p=0.0243, N=55, Figure 3E) and CD3+CD160+CD244+% were correlated to ESR (p=0.0234, N=51, Figure 3F). Supplementary Table 1 and Table 2 showed the detailed relationships between the activity of the RA disease and the expression of Co-IRs on T cells.
activity.
Figure 1.
Significant correlation between RA Disease Activity and Co-IRs expression on CD4 T cells. (A) CD4/CD279 MFI with hsCRP (p=0.0393, N=56) (B) CD4/CD279 MFI with ESR (p=0.0096, N=51) (C) CD4/CD279% with hsCRP (p=0.0251, N=56) (D) CD4/TIM3% with hsCRP (p=0.0459, N=56) (E) CD4/TIGIT MFI with hsCRP (p=0.0156, N=45) (F) CD4/CD127 MFI with DAS28-ESR (p=0.0321, N=40) (G) CD4/CD127 MFI with DAS28-CRP (p=0.0145, N=40).
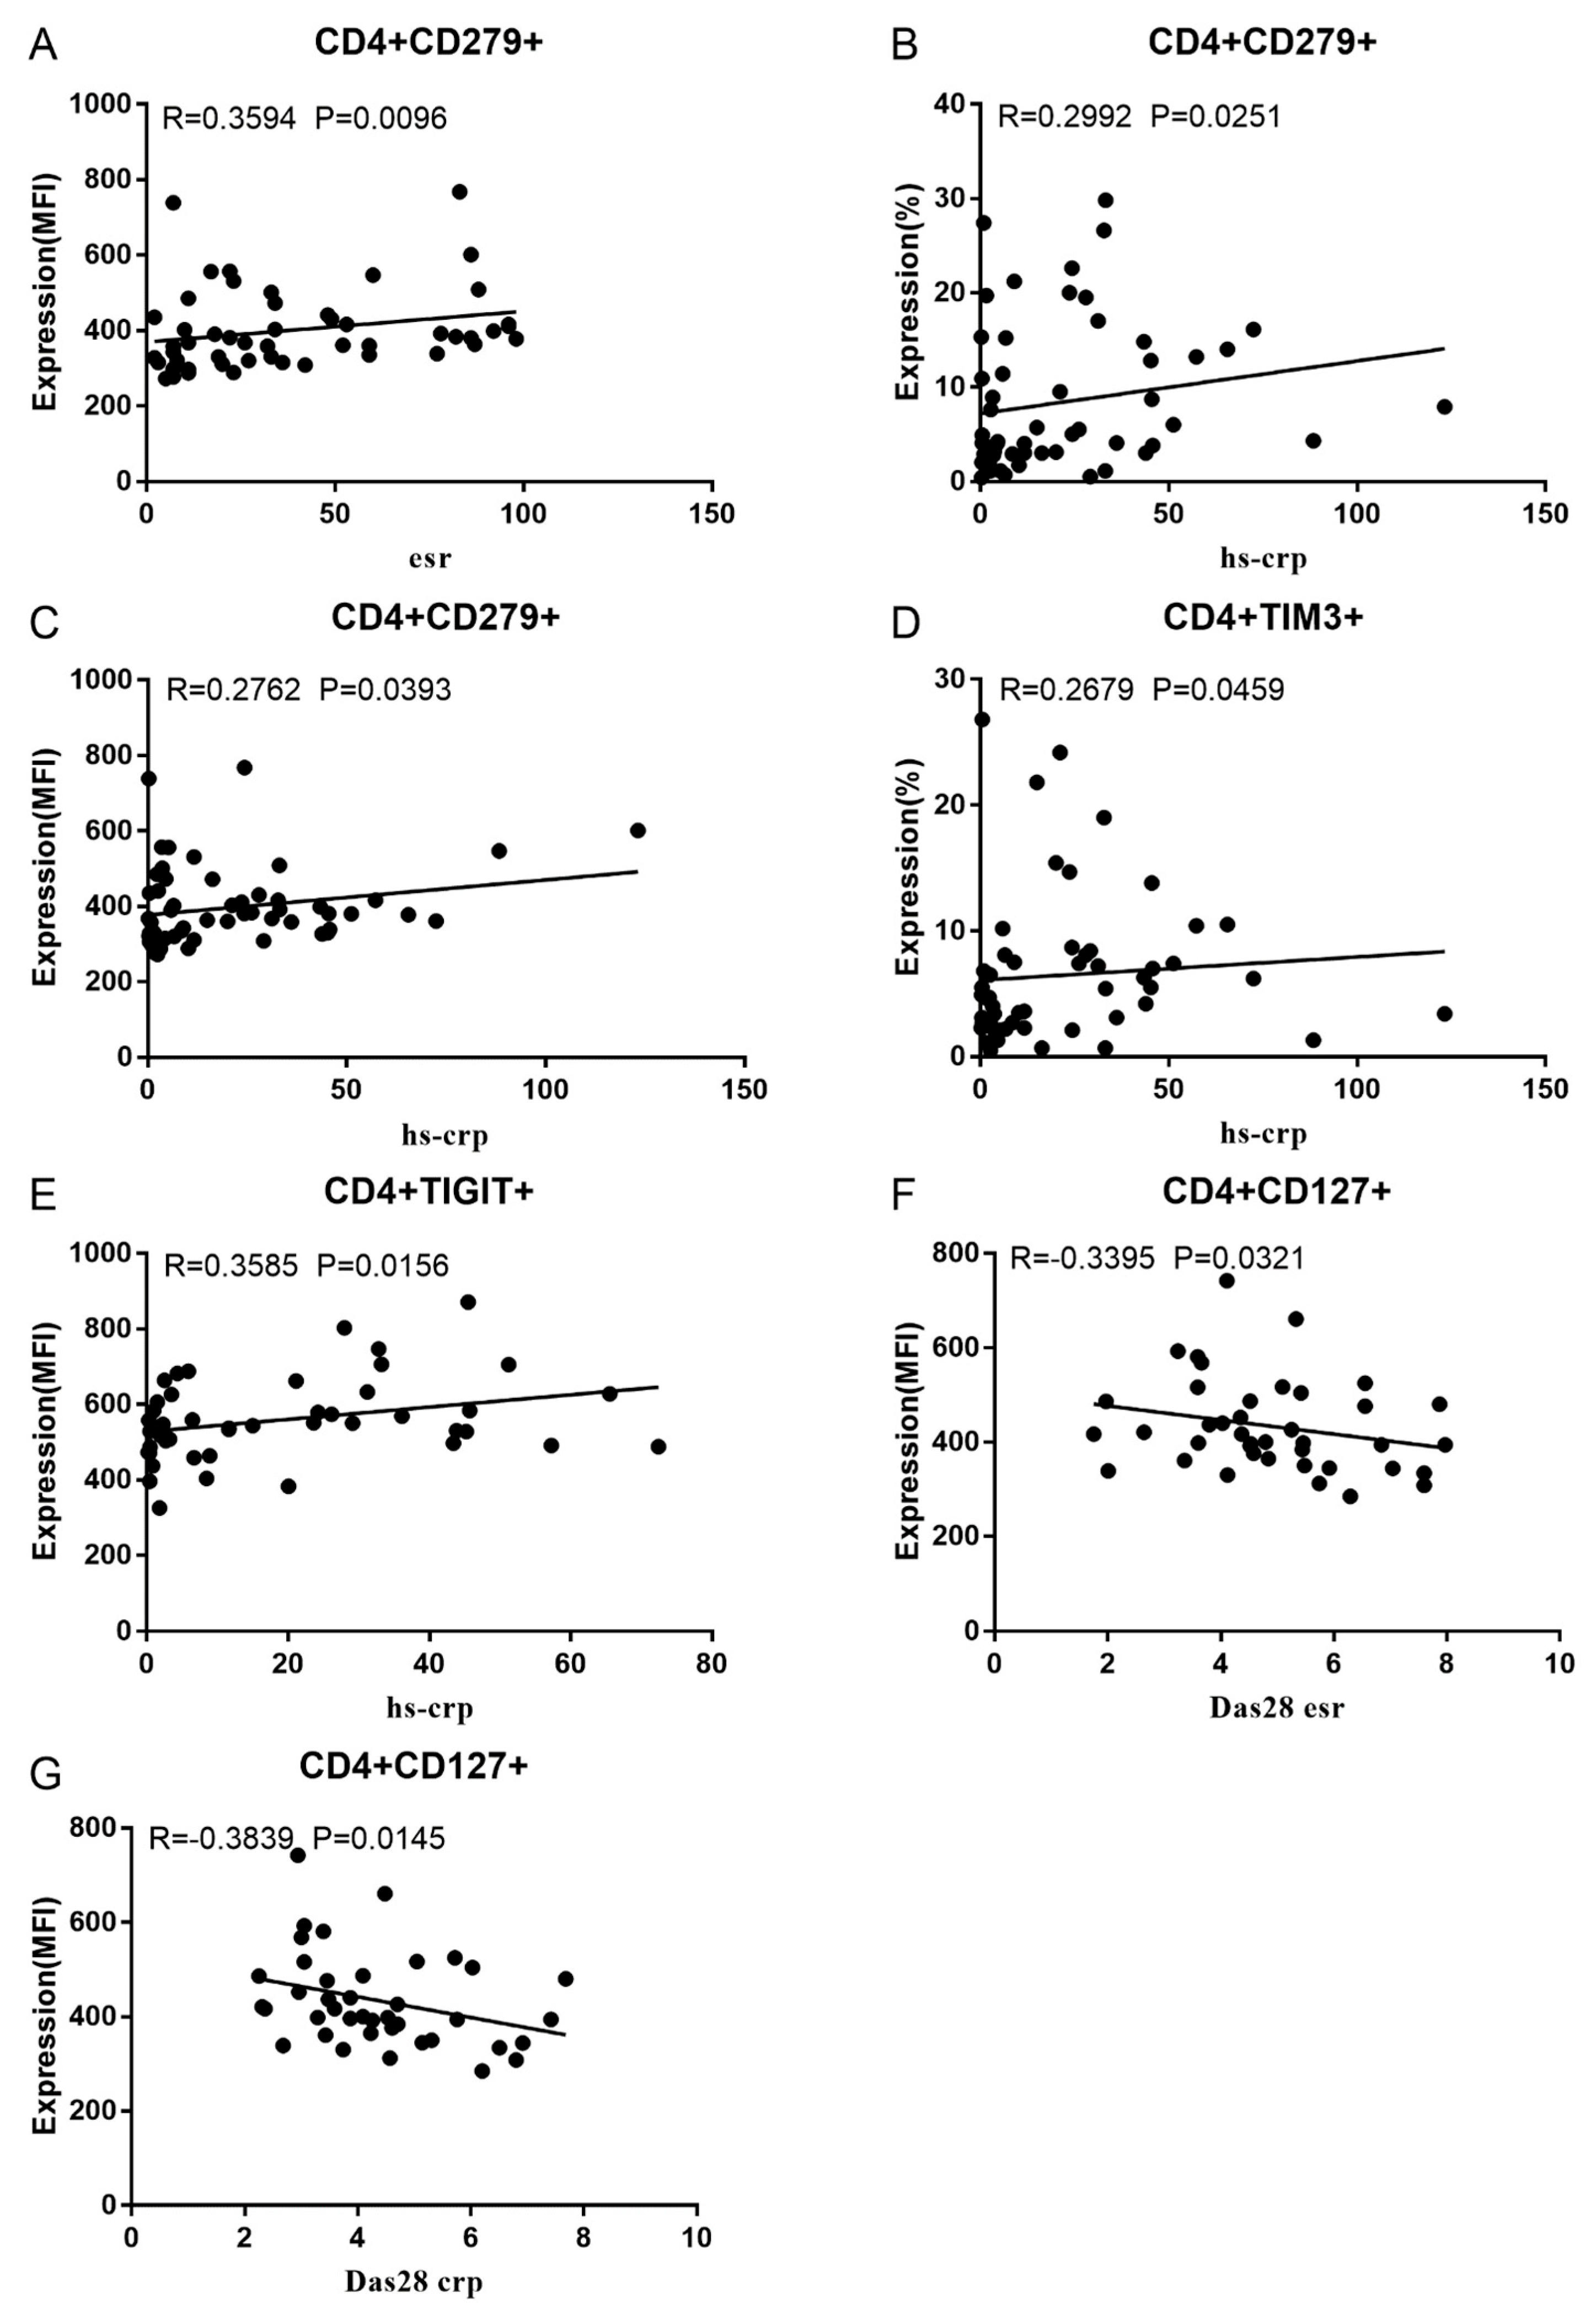
Figure 2.
Significant correlation between RA Disease Activity and Co-IRs expression on CD3 and CD8 T cells. (A) CD8/TIM3 MFI with ESR (p=0.0459, N=51) (B) CD8/LAG3 MFI with ESR (p=0.0182, N=39) (C) CD8/TIM3% with hsCRP (p=0.0114, N=56) (D) CD8/TIM3 MFI with hsCRP (p=0.001, N=56) (E) CD8/LAG3% with hsCRP (p=0.0236, N=56) (F) CD8+HLA-DR MFI with hsCRP (p=0.0128, N=43) (G) CD8/CD279% with DAS28-ESR (p=0.0456, N=46) (H) CD8/CD127 MFI with DAS28-ESR (p=0.0063, N=40) (I) (CD8/CD279% with DAS28-CRP (p=0.0363, N=47), (J) CD8/CD127 MFI with DAS28-CRP (p=0.0157, N=40). (K) CD3/CD244% with ESR (p=0.0405, N=51).
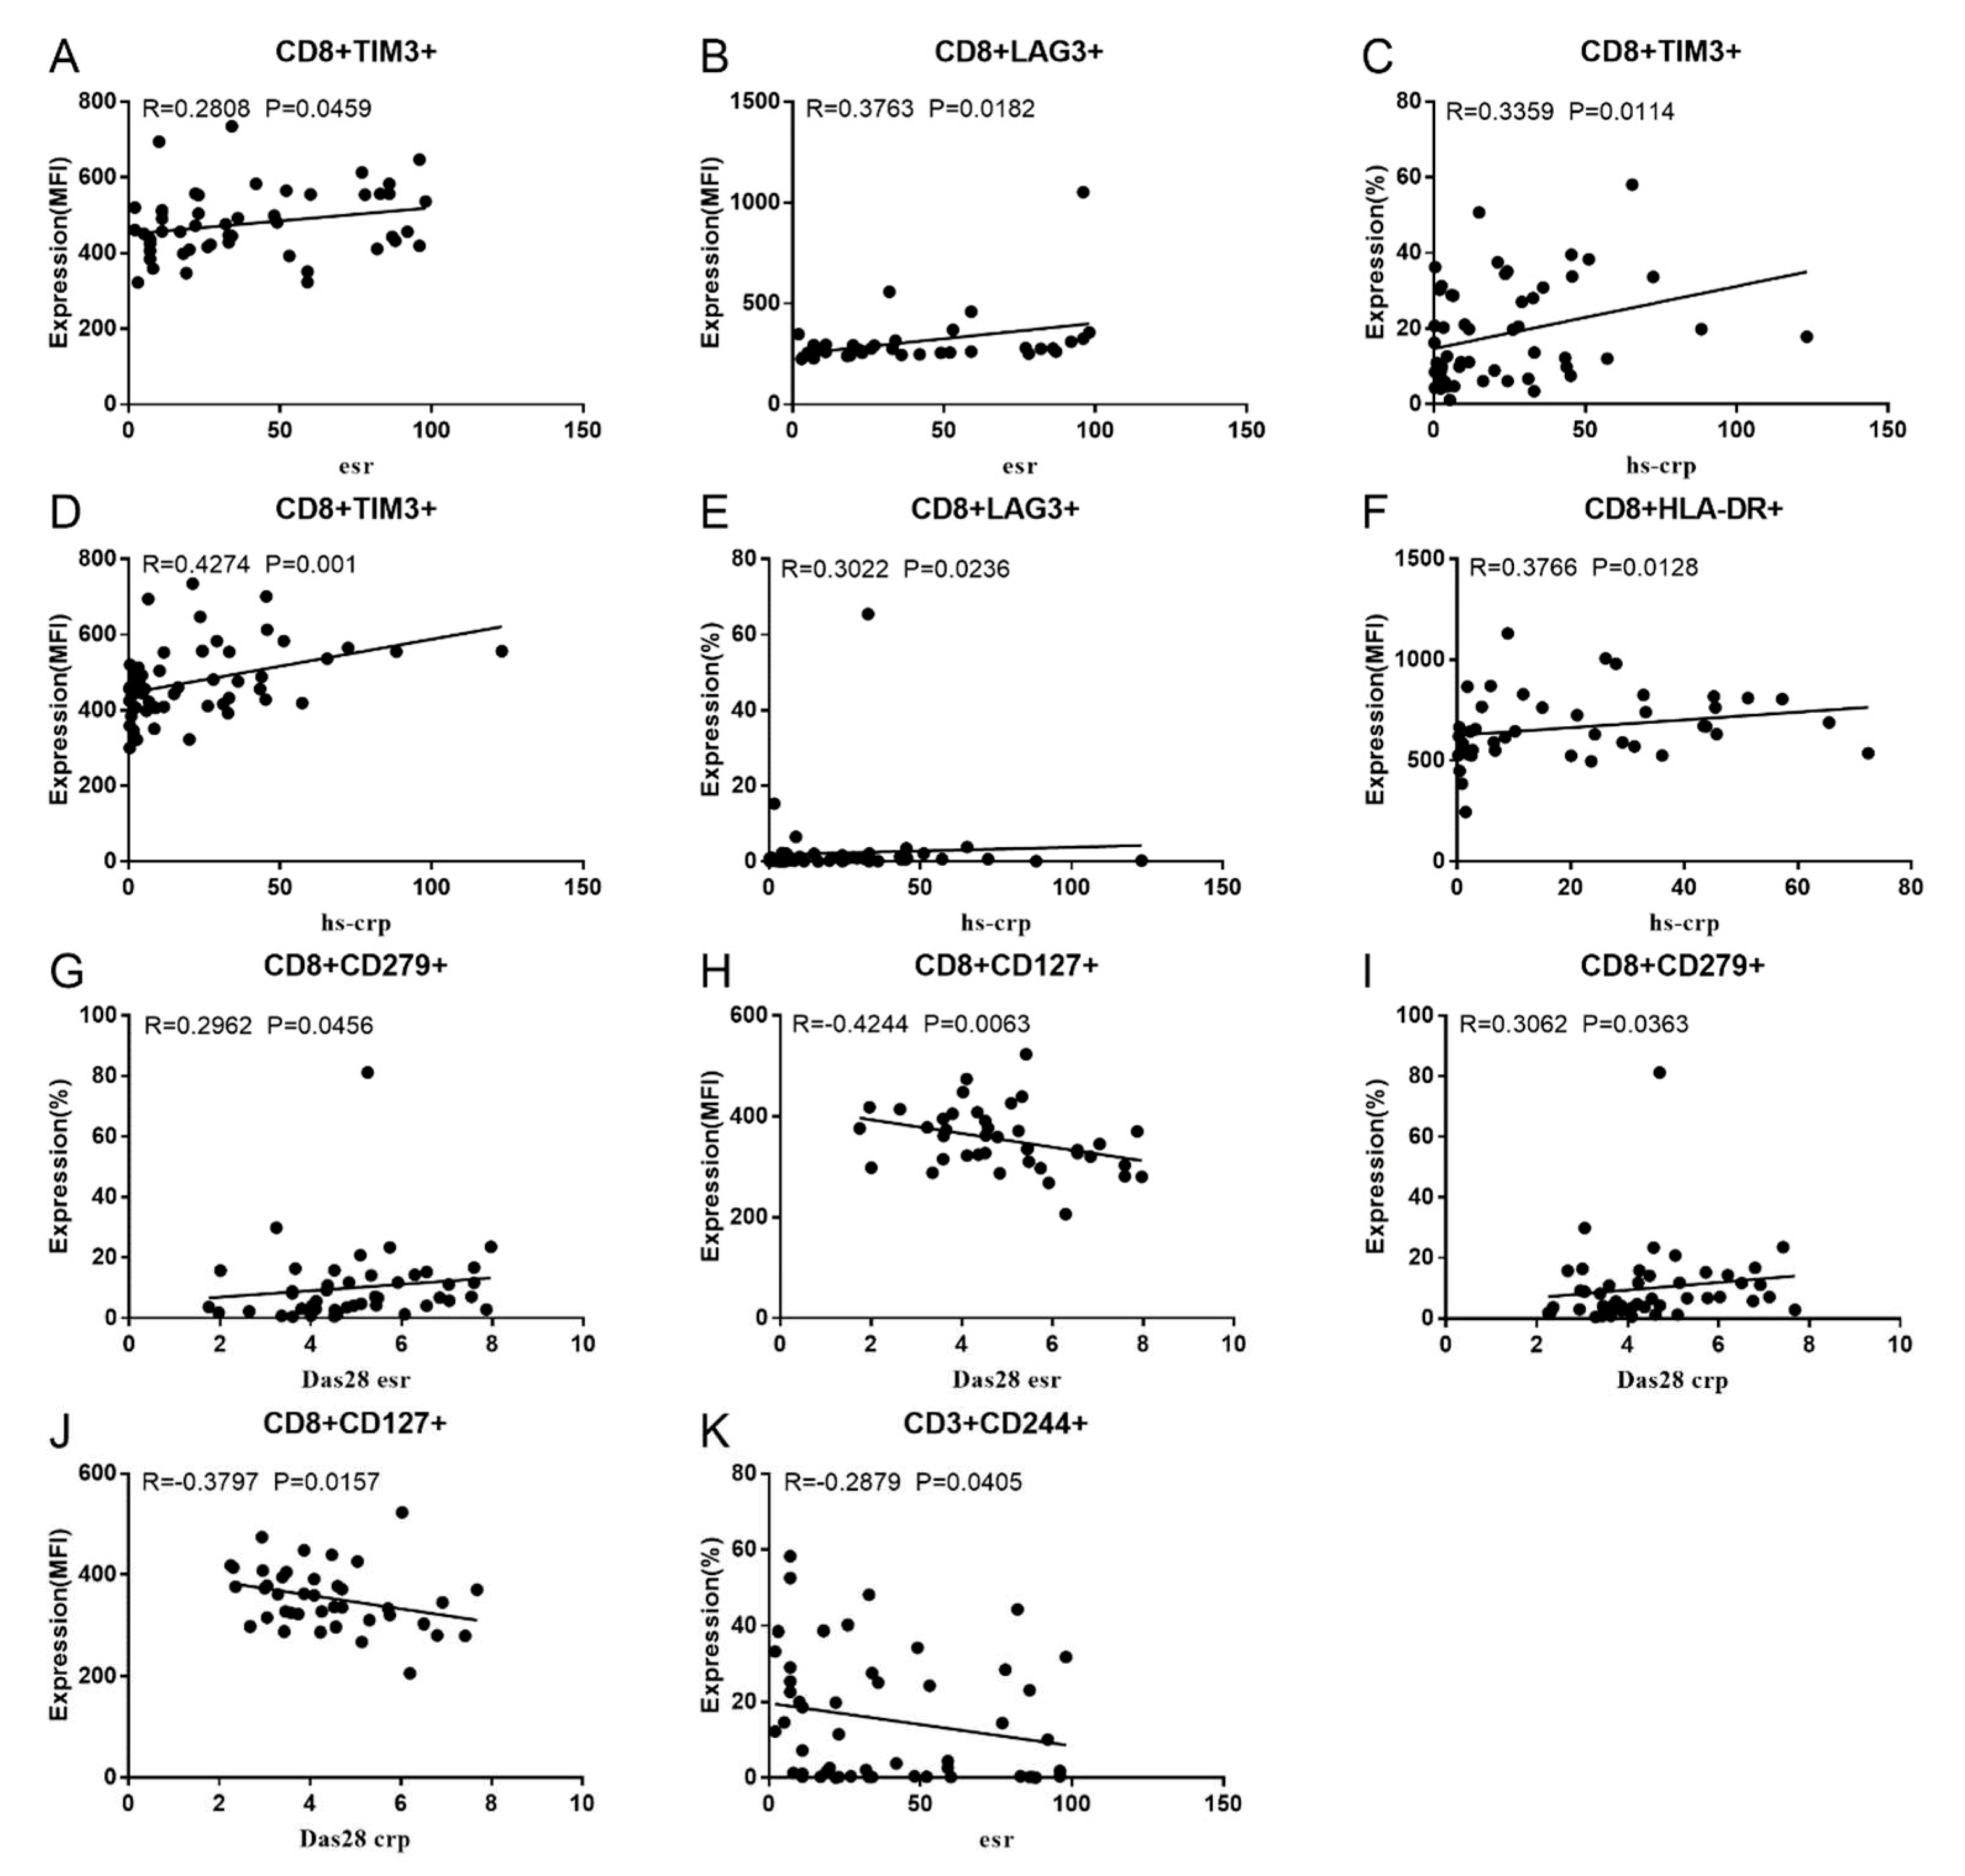
Figure 3.
Significant correlation between RA Disease Activity and two Co-IRs expression on T cells. (A) CD4+CD279+TIM3+% with hsCRP (p=0.002, N=56) (B) CD4+CD279+TIM3+% with DAS28-ESR (p=0.0084, N=46) (C) CD4+CD279+TIM3+% with DAS-28 CRP (p=0.002, N=47) (D) CD8+CD127+TIGIT+% with ESR (p=0.0355, N=51) (E) CD8+HLA-DR+CD38+% with hsCRP (p=0.0243, N=55) (F) CD3+CD160+CD244+% with ESR (p=0.0234, N=51).
3.3. Soluble PD1, PDL-2 and Tim3 levels in RA and correlation to cell expression
As shown in Figure 4A–C, RA patients have significant elevated serum levels of soluble PD-1, PDL-2 and Tim3 than normal controls (sPD1: 450.5 ± 89.01, n=31 vs. 111.1 ± 32.92, n=92 p<0.0001; sPD-L2: 17.9 ± 1.566, n=47 vs 12.78 ± 0.2314, n=92 p<0.0001; sTIM3: 4.288 ± 0.3015, n=40 vs 3.675 ± 0.08441, n=92 p=0.0104). sTIM3 levels were correlated to CD4+ TIM3+% (p=0.0089, N=46, Figure 4D) and CD8+ TIM3+% (p=0.0305, N=46, Figure 4E). sPD-1 levels were correlated to CD4+CD279+% (p<0.0001, N=31, Figure 4F). Our data indicate soluble PD1, PDL-2 and Tim3 levels also can serve as serologic marker of disease
4. Discussion
The findings of this study illustrate the fact that augmented expression of Co-IRs (PD-1, CTLA-4, TIGIT, and TIM3) in CD4/CD8 T cells is crucial for the emergence and progression of RA. PD-1+ T cells are detectable in the RA synovium and synovial fluids [9], and there is an upward correlation with RA activity [10,11]. PD-1 is widely distributed across myriad T cell subsets and is accountable to earn the differentiation of a variety of distinct functioning T cells. Early remission of RA consecutive to CTLA-4Ig immunotherapy is often predicted using T follicular helper cells (Tfh) that are CD4+PD-1+CXCR5+ at baseline [12] along with over a variety of chronic autoimmune inflammatory disorders [13,14,15]. Extra-lymphoid inflammatory tissue, including the synovium of patients with RA, contains PD-1hiCXCR5-CD4+ peripheral helper T (Tph) cells. These cells are known to drive plasmablast responses and generate antibodies, suggesting that they could potentially function as a feasible target for therapy [16,17]. Tph cells are indicative of the severity of RA [18]. Seropositive early RA patients with active disease exhibit elevated Tph cells, whereas Tfh cells are constitutively elevated [19].
Tfr (T follicular regulatory; CD4+CXCR5+Foxp3+) and Tfh cells are both crucial for humoral immunity responses; the Tfr/Tfh ratio of cells has been associated with the onset of RA [20,21]. PD-1+ICOS+ Tfh, Tfh17-like, and Tfh1/17-like cells perform opposing tasks to Tfr-like and mTfr-like regulatory cells [22,23] which contribute to cytokine disequilibrium in the advancement of RA [22]. CD8+ T cells are starting to assume an integral part in RA; PD-1highCD8+ T cells, which are akin to CD4 Tph T cells, have the capacity of emitting IL-21 present plasmablast auxiliary functions [23]. In RA, smoking reactivates exhausted CD8+ T cells to perform effector roles through the substitution of cytotoxic CD107 for PD-1 and in accordance to serum survivin values [24]. It is worth noting that PD-1 may exhibit distinct involvement in auto-inflammatory reactions in psoriatic arthritis (PsA) and autoimmune processes in RA [25]. A correlation is being observed between the presence of PD-1-expressing CD4/CD8 T cells and the extent of disease in Taiwanese patients with RA.
Song et al. observed that the inhibitory effect of TIM-3 and IL-37 on inflammation could possess an aspect in the development of RA [26]. Nonetheless, no correlation was noticed between DAS28 and TIM3 expression on diverse T cells [26]. In contrast, a negative correlation has been noted by others across the levels of Tim3 on circulating CD4+ and CD8+ T cells and DAS28 in RA patients [11,27,28]. Tim3 and PD-1 co-expression possesses disease-suppressive properties in RA [29]. In addition, PD-1 and TIM3 expression were found to be enhanced on Tph entity cells in bronchoalveolar lavage fluid from patients with interstitial lung disease (ILD). Expression of Co-IRs in peripheral blood distinguished idiopathic ILD from that of RA [30]. We identified CD4+CD279+TIM3+ cells exhibited a correlation with DAS28-CRP, hsCRP, and DAS28-ESR, all of which could potentially function as biomarkers.
In this study, CD4+ and CD8+ T cells of RA patients evidenced TIGIT upregulation. Positive correlations have been noted across TIGIT expression levels and frequency on CD4/CD8+ T cells and inflammatory markers (CRP and ESR), autoantibodies (RF and Anti-CCP), and the DAS28 score in RA [31]. As a therapeutic target, inhibition of the TIGIT pathway induces a variety of autoimmune diseases, while TIGIT function augmentation ameliorates autoimmune settings in mice [32]. In mice, TIGIT introduction at the onset of the disease more effectively diminished anti-collagen II antibody levels and disease severity [33]. The true populations of Treg cells, CD4+CD25hiCD127lowFoxp3+Helios+ T cells, were reduced and inversely correlated with disease activity in RA patients. On the contrary, CD226 and TIGIT expression levels were increased in CD4+Foxp3+ cells, yet they were inconsistent to RA activity or progression [34]. The co-expression of TIGIT and PD-1 on CD4+T cells has been linked to autoantibody production and RA activity [35]. First-degree relatives who are autoantibody-positive have a higher prevalence of TIGIT+ CD4 T cells [36]. Consequently, TIGIT expression on CD4 T cells is crucial for the production of autoantibodies by B cells in RA.
Significantly increased CD8+CD279+TIM3+T cells, which might be exhausted T (TEX) cells, were observed in the RA patients included in this study. Persistent antigen exposure causes T cell exhaustion, which in turn manifests in a hierarchical and gradual decline of effector function owing to overstimulation. As a consequence, the cells fail to eliminate an infection or tumor. Notwithstanding their compromised functionality, TEX cells still manage to impart a certain degree of control over persistent viral infections and impede tumor growth [37]. Calcium flux and calcineurin signaling, which enable epigenetic modifications that enforce the exhausted state, are utilized to induce TOX in response to persistent antigen exposure [38]. An exhausted phenotype is induced in CD8+ T cells through TOX interactions with nuclear receptor subfamily 4 group A (NR4A) when coupled with an elaborate T cell signaling network [39]. The distinguishing characteristic of TEX cells is the co-expression of the TIGIT, Lag3, PD-1, CTLA-4, and Tim3. Extracellular vesicles (EVs) are crucial in the development of RA and convey microRNAs (miRNAs) corresponding to PD-1 and additional indicators of T cell inhibition, which may contribute to T cell exhaustion [40]. EVs have been demonstrated to promote the production of inflammatory mediators, including chemokines and cytokines [41]. Co-IRs enhancement that ends up in T cell exhaustion may indicate that distinct T cell differentiation functions dysfunctionally at different stages of RA.
CD38 catalyzes the metabolism of nicotinamide adenine dinucleotide (NAD); thus, NAD deprivation is a prominent pathological factor [42]. CD38high NK cells, as opposed to CD38low NK-like T cells, disrupt immunity impeding the differentiation of Treg cells through the activation of mTOR signaling in CD4+ T cells [43]. HLA-DR+CD38high CD8+ T cells demonstrated the greatest degree of hyperactivation and were the most vigorously primed [44]. Significantly prevalent HLA-DR+CD38+CD8+ T cells were identified in Taiwanese RA patients, suggesting that CD8 T cell hyperactivation plays a crucial role. Activated CD38hi CD8 T cells are detected in the T cell infiltrate of synovial tissue generated by inflammatory arthritis following PD-1 block therapy [45]. Persistent sufferers of hepatitis C are bombarded by heavily cytotoxic CD38+HLA-DR+CD8+ T cells, which elicit liver damage [46]. The survival or mortality of H7N9 patients can be distinguished based on clonal expansion kinetics [47]. Hyper-activation and dysregulation of HLA-DR+CD38highCD8+ T cells consequence in exhaustion within COVID-19 patients with severe disease [48]. Survivors' proportion of CD8+CD38+ cells declined subsequent to their recovery from Covid-19 [49]. Acute GVHD can be recognized by a profusion of proliferating, activated CD38highCD8+ T cells that are cytotoxic in nature. These cells lack the capacity to react to the reactivation of CMV or EBV [50]. The correlation between CD8+HLA-DR+CD38+% and hsCRP implies a causal relationship with persistent RA disease activity.
TIM3 pathways and ligands that connect PD-1 to PD-L1/2 may inhibit the autoimmunity of RA. sTIM3 correlated significantly with ESR and MMP-3 in RA patients with moderate ACPA titers (200 U/mL) [51]. Elevated plasma levels of sTim3 are indicative of disease activity in the early stages of RA. The serum concentration of sLAG3 increased substantially in RA patients as well [52]. sPD-1 is a key mediator predict the development of inflammatory and radiographic progression in early RA [53]. sPD-1 and sPD-L1 surges may serve as useful biomarkers for identifying the onset of ILD in patients with RA [54,55]. Divergent control of sPD-L1 during the early and late stages of RA may be indicative of an evolution from acute to chronic inflammation [56]. CD4 T cell resistance to PD-1-mediated suppression is increased in RA and psoriatic arthritis (PsA), which may be partially due to the presence of soluble PD1 in the inflammatory milieu [57]. We established a correlation between elevated levels of soluble PD-1, PDL-2 and Tim3 in RA and disease activity as a biomarker.
The major concern of this study is the precise identification of T cell immunophenotypes contributions to the pathogenesis of RA, which single-cell RNA sequencing (scRNA-seq) may be able to resolve. Therefore, additional research is required to identify the molecular properties. Additionally, larger samples with varied biologic agent responses are needed to pinpoint specific target pathways.
5. Conclusions
Our study is potentially valuable in the clinical setting for identifying potential markers with crucial roles in the progression and monitoring of RA disease activity. Our study unveils the biological processes by which Co-IRs T cells dampen the immune system broadly while offering a justification for the use of soluble PD-L1 as a predictor of RA disease activity and therapeutic response. Our novel findings may increase the likelihood of individualized treatment and suggest new possible avenues of therapy for RA.
Supplementary Materials
The following supporting information can be downloaded at the website of this paper posted on Preprints.org. Figure S1: title; Table S1: title; Video S1: title.
Author Contributions
Conceptualization, resources, funding acquisition C.M W. and J.Y.C. methodology, data curation, investigation Y.J.J.W., L.Y.H. and J.W.Z., original draft preparation C.M W. J.Y.C. and Y.J.J.W. All authors have read and agreed to the published version of the manuscript.
Funding
This work was supported by funding from the Chang Gung Memorial Hospital (Grant numbers: CMRPG 5I0072, CMRPG 5H0022 and CMRPG 3J1422) and the Ministry of Science and Technology, Taiwan (Grant numbers: MOST 109-2314-B-182-068-MY3)
Institutional Review Board Statement
The human research protocols received approval from the ethics committee at Chang Gung Memorial Hospital (Institutional Review Board No. 201800457B0)
Informed Consent Statement
Informed consent was obtained from all subjects involved in the study.
Data Availability Statement
The data presented in this study are available on request from the corresponding author.
Acknowledgments
We greatly appreciate the Shin Chu Blood Donor Center for the collection of samples.
Conflicts of Interest
The study was carried out in accordance with the relevant guidelines and regulations. The authors declare no conflict of interests and any potential financial conflicts of interest that any of the authors may have. The funders had no role in the design of the study; in the collection, analyses, or interpretation of data; in the writing of the manuscript; or in the decision to publish the results.
References
- McInnes, I. B.; Schett, G. , Pathogenetic insights from the treatment of rheumatoid arthritis. Lancet (London, England) 2017, 389, 10086,2328–2337. [Google Scholar] [CrossRef]
- Choy, E. , Understanding the dynamics: pathways involved in the pathogenesis of rheumatoid arthritis. Rheumatology (Oxford, England) 5. 2012, 51 Suppl 5, v3-11.. [CrossRef] [PubMed]
- Mellado, M.; Martinez-Munoz, L.; Cascio, G.; Lucas, P.; Pablos, J. L.; Rodriguez-Frade, J. M. , T Cell Migration in Rheumatoid Arthritis. Frontiers in immunology 2015, 6, 384. [Google Scholar] [CrossRef] [PubMed]
- Kwok, S. K.; Cho, M. L.; Park, M. K.; Oh, H. J.; Park, J. S.; Her, Y. M.; Lee, S. Y.; Youn, J.; Ju, J. H.; Park, K. S.; Kim, S. I.; Kim, H. Y.; Park, S. H. , Interleukin-21 promotes osteoclastogenesis in humans with rheumatoid arthritis and in mice with collagen-induced arthritis. Arthritis and rheumatism 2012, 3, 740–751. [Google Scholar] [CrossRef] [PubMed]
- Firestein, G. S.; McInnes, I. B. , Immunopathogenesis of Rheumatoid Arthritis. Immunity 2017, 2, 183–196. [Google Scholar] [CrossRef] [PubMed]
- Wherry, E. J.; Kurachi, M. , Molecular and cellular insights into T cell exhaustion. Nature reviews. Immunology 2015, 8, 486–499. [Google Scholar] [CrossRef] [PubMed]
- Maecker, H. T.; McCoy, J. P.; Nussenblatt, R. , Standardizing immunophenotyping for the Human Immunology Project. Nature reviews. Immunology 2012, 3, 191–200. [Google Scholar] [CrossRef]
- Croft, M.; Dubey, C. Accessory Molecule and Costimulation Requirements for CD4 T Cell Response. Critical reviews in immunology 2017, 37, 2-6, 261-290. [Google Scholar] [CrossRef]
- Raptopoulou, A. P.; Bertsias, G.; Makrygiannakis, D.; Verginis, P.; Kritikos, I.; Tzardi, M.; Klareskog, L.; Catrina, A. I.; Sidiropoulos, P.; Boumpas, D. T. , The programmed death 1/programmed death ligand 1 inhibitory pathway is up-regulated in rheumatoid synovium and regulates peripheral T cell responses in human and murine arthritis. Arthritis and rheumatism 2010, 7, 1870–1880. [Google Scholar] [CrossRef]
- Luo, Q.; Ye, J.; Zeng, L.; Luo, Z.; Deng, Z.; Li, X.; Guo, Y.; Huang, Z.; Li, J. , Elevated expression of PD-1 on T cells correlates with disease activity in rheumatoid arthritis. Molecular medicine reports 2018, 2, 3297–3305. [Google Scholar] [CrossRef]
- Koohini, Z.; Hossein-Nataj, H.; Mobini, M.; Hosseinian-Amiri, A.; Rafiei, A.; Asgarian-Omran, H. , Analysis of PD-1 and Tim-3 expression on CD4(+) T cells of patients with rheumatoid arthritis; negative association with DAS28. Clinical rheumatology 2018, 8, 2063–2071. [Google Scholar] [CrossRef] [PubMed]
- Aldridge, J.; Andersson, K.; Gjertsson, I.; Hultgård Ekwall, A. K.; Hallström, M.; van Vollenhoven, R.; Lundell, A. C.; Rudin, A. Blood PD-1+TFh and CTLA-4+CD4+ T cells predict remission after CTLA-4Ig treatment in early rheumatoid arthritis. Rheumatology (Oxford, England) 2022, 61, 3, 1233-1242. [Google Scholar] [CrossRef]
- Cao, G.; Chi, S.; Wang, X.; Sun, J.; Zhang, Y. , CD4+CXCR5+PD-1+ T Follicular Helper Cells Play a Pivotal Role in the Development of Rheumatoid Arthritis. Medical science monitor : international medical journal of experimental and clinical research 2019, 25, 3032–3040. [Google Scholar] [CrossRef] [PubMed]
- An, L. M.; Li, J.; Ji, L. L.; Li, G. T.; Zhang, Z. L. , [Detection of peripheral follicular helper T cells in rheumatoid arthritis]. Beijing da xue xue bao. Yi xue ban = Journal of Peking University. Health sciences 2016, 48, 951–957. [Google Scholar] [PubMed]
- Wang, J.; Shan, Y.; Jiang, Z.; Feng, J.; Li, C.; Ma, L.; Jiang, Y. , High frequencies of activated B cells and T follicular helper cells are correlated with disease activity in patients with new-onset rheumatoid arthritis. Clinical and experimental immunology 2013, 2, 212–220. [Google Scholar] [CrossRef] [PubMed]
- Rao, D. A. , T Cells That Help B Cells in Chronically Inflamed Tissues. Frontiers in immunology 2018, 9, 1924. [Google Scholar] [CrossRef] [PubMed]
- Rao, D. A.; Gurish, M. F.; Marshall, J. L.; Slowikowski, K.; Fonseka, C. Y.; Liu, Y.; Donlin, L. T.; Henderson, L. A.; Wei, K.; Mizoguchi, F.; Teslovich, N. C.; Weinblatt, M. E.; Massarotti, E. M.; Coblyn, J. S.; Helfgott, S. M.; Lee, Y. C.; Todd, D. J.; Bykerk, V. P.; Goodman, S. M.; Pernis, A. B.; Ivashkiv, L. B.; Karlson, E. W.; Nigrovic, P. A.; Filer, A.; Buckley, C. D.; Lederer, J. A.; Raychaudhuri, S.; Brenner, M. B. , Pathologically expanded peripheral T helper cell subset drives B cells in rheumatoid arthritis. Nature 2017, 7639, 110–114. [Google Scholar] [CrossRef] [PubMed]
- Zhao, L.; Li, Z.; Zeng, X.; Xia, C.; Xu, L.; Xu, Q.; Song, Y.; Liu, C. , Circulating CD4(+) FoxP3(-) CXCR5(-) CXCR3(+) PD-1(hi) cells are elevated in active rheumatoid arthritis and reflect the severity of the disease. International journal of rheumatic diseases 2021, 8, 1032–1039. [Google Scholar] [CrossRef] [PubMed]
- Fortea-Gordo, P.; Nuño, L.; Villalba, A.; Peiteado, D.; Monjo, I.; Sánchez-Mateos, P.; Puig-Kröger, A.; Balsa, A.; Miranda-Carús, M. E. , Two populations of circulating PD-1hiCD4 T cells with distinct B cell helping capacity are elevated in early rheumatoid arthritis. Rheumatology (Oxford, England) 2019, 58, 1662–1673. [Google Scholar] [CrossRef]
- Wang, X.; Yang, C.; Xu, F.; Qi, L.; Wang, J.; Yang, P. , Imbalance of circulating Tfr/Tfh ratio in patients with rheumatoid arthritis. Clinical and experimental medicine 2019, 1, 55–64. [Google Scholar] [CrossRef]
- Cao, G.; Wang, P.; Cui, Z.; Yue, X.; Chi, S.; Ma, A.; Zhang, Y. , An imbalance between blood CD4(+)CXCR5(+)Foxp3(+) Tfr cells and CD4(+)CXCR5(+)Tfh cells may contribute to the immunopathogenesis of rheumatoid arthritis. Molecular immunology 2020, 125, 1–8. [Google Scholar] [CrossRef] [PubMed]
- Su, R.; Wang, Y.; Hu, F.; Li, B.; Guo, Q.; Zheng, X.; Liu, Y.; Gao, C.; Li, X.; Wang, C. , Altered Distribution of Circulating T Follicular Helper-Like Cell Subsets in Rheumatoid Arthritis Patients. Frontiers in medicine 2021, 8, 690100. [Google Scholar] [CrossRef]
- Higashioka, K.; Yoshimura, M.; Sakuragi, T.; Ayano, M.; Kimoto, Y.; Mitoma, H.; Ono, N.; Arinobu, Y.; Kikukawa, M.; Yamada, H.; Horiuchi, T.; Akashi, K.; Niiro, H. , Human PD-1(hi)CD8(+) T Cells Are a Cellular Source of IL-21 in Rheumatoid Arthritis. Frontiers in immunology 2021, 12, 654623. [Google Scholar] [CrossRef] [PubMed]
- Wasen, C.; Turkkila, M.; Bossios, A.; Erlandsson, M.; Andersson, K. M.; Ekerljung, L.; Malmhall, C.; Brisslert, M.; Toyra Silfversward, S.; Lundback, B.; Bokarewa, M. I. , Smoking activates cytotoxic CD8(+) T cells and causes survivin release in rheumatoid arthritis. Journal of autoimmunity 2017, 78, 101–110. [Google Scholar] [CrossRef] [PubMed]
- Bartosinska, J.; Zakrzewska, E.; Krol, A.; Raczkiewicz, D.; Purkot, J.; Majdan, M.; Krasowska, D.; Chodorowska, G.; Giannopoulos, K. , Differential expression of programmed death 1 (PD-1) on CD4+ and CD8+ T cells in rheumatoid arthritis and psoriatic arthritis. Polish archives of internal medicine 2017, 12, 815–822. [Google Scholar] [CrossRef] [PubMed]
- Song, L.; Wang, Y.; Sui, Y.; Sun, J.; Li, D.; Li, G.; Liu, J.; Li, T.; Shu, Q. , High Interleukin-37 (IL-37) Expression and Increased Mucin-Domain Containing-3 (TIM-3) on Peripheral T Cells in Patients with Rheumatoid Arthritis. Medical science monitor : international medical journal of experimental and clinical research 2018, 24, 5660–5667. [Google Scholar] [CrossRef]
- Liu, Y.; Shu, Q.; Gao, L.; Hou, N.; Zhao, D.; Liu, X.; Zhang, X.; Xu, L.; Yue, X.; Zhu, F.; Guo, C.; Liang, X.; Ma, C. , Increased Tim-3 expression on peripheral lymphocytes from patients with rheumatoid arthritis negatively correlates with disease activity. Clinical immunology (Orlando, Fla.) 2010, 2, 288–295. [Google Scholar] [CrossRef]
- Li, S.; Peng, D.; He, Y.; Zhang, H.; Sun, H.; Shan, S.; Song, Y.; Zhang, S.; Xiao, H.; Song, H.; Zhang, M. Expression of TIM-3 on CD4+ and CD8+ T cells in the peripheral blood and synovial fluid of rheumatoid arthritis. APMIS : acta pathologica, microbiologica, et immunologica Scandinavica 2014, 122, 899–904. [Google Scholar] [CrossRef] [PubMed]
- Skejoe, C.; Hansen, A. S.; Stengaard-Pedersen, K.; Junker, P.; Hoerslev-Pedersen, K.; Hetland, M. L.; Oestergaard, M.; Greisen, S.; Hvid, M.; Deleuran, M.; Deleuran, B. , T-cell immunoglobulin and mucin domain 3 is upregulated in rheumatoid arthritis, but insufficient in controlling inflammation. American journal of clinical and experimental immunology 2022, 3, 34–44. [Google Scholar]
- Nakazawa, M.; Suzuki, K.; Takeshita, M.; Inamo, J.; Kamata, H.; Ishii, M.; Oyamada, Y.; Oshima, H.; Takeuchi, T. , Distinct Expression of Coinhibitory Molecules on Alveolar T Cells in Patients With Rheumatoid Arthritis-Associated and Idiopathic Inflammatory Myopathy-Associated Interstitial Lung Disease. Arthritis & rheumatology (Hoboken, N.J.) 2020. [Google Scholar]
- Luo, Q.; Deng, Z.; Xu, C.; Zeng, L.; Ye, J.; Li, X.; Guo, Y.; Huang, Z.; Li, J. Elevated Expression of Immunoreceptor Tyrosine-Based Inhibitory Motif (TIGIT) on T Lymphocytes is Correlated with Disease Activity in Rheumatoid Arthritis. Medical science monitor : international medical journal of experimental and clinical research 2017, 23, 1232–1241. [Google Scholar] [CrossRef] [PubMed]
- Yue, C.; Gao, S.; Li, S.; Xing, Z.; Qian, H.; Hu, Y.; Wang, W.; Hua, C. , TIGIT as a Promising Therapeutic Target in Autoimmune Diseases. Frontiers in immunology 2022, 13, 911919. [Google Scholar] [CrossRef] [PubMed]
- Zhao, W.; Dong, Y.; Wu, C.; Ma, Y.; Jin, Y.; Ji, Y. , TIGIT overexpression diminishes the function of CD4 T cells and ameliorates the severity of rheumatoid arthritis in mouse models. Experimental cell research 2016, 1, 132–138. [Google Scholar] [CrossRef] [PubMed]
- Yang, M.; Liu, Y.; Mo, B.; Xue, Y.; Ye, C.; Jiang, Y.; Bi, X.; Liu, M.; Wu, Y.; Wang, J.; Olsen, N.; Pan, Y.; Zheng, S. G. , Helios but not CD226, TIGIT and Foxp3 is a Potential Marker for CD4(+) Treg Cells in Patients with Rheumatoid Arthritis. Cellular physiology and biochemistry : international journal of experimental cellular physiology, biochemistry, and pharmacology 2019, 5, 1178–1192. [Google Scholar] [CrossRef]
- Luo, Q.; Fu, P.; Guo, Y.; Fu, B.; Guo, Y.; Huang, Q.; Huang, Z.; Li, J. , Increased TIGIT(+)PD-1(+)CXCR5(-)CD4(+)T cells are associated with disease activity in rheumatoid arthritis. Experimental and therapeutic medicine 2022, 4, 642. [Google Scholar] [CrossRef] [PubMed]
- Anaparti, V.; Tanner, S.; Zhang, C.; O'Neil, L.; Smolik, I.; Meng, X.; Marshall, A. J.; El-Gabalawy, H. , Increased frequency of TIGIT+ CD4 T Cell subset in autoantibody-positive first-degree relatives of patients with rheumatoid arthritis. Frontiers in immunology 2022, 13, 932627. [Google Scholar] [CrossRef] [PubMed]
- McLane, L. M.; Abdel-Hakeem, M. S.; Wherry, E. J. , CD8 T Cell Exhaustion During Chronic Viral Infection and Cancer. Annual review of immunology 2019, 37, 457–495. [Google Scholar] [CrossRef] [PubMed]
- Khan, O.; Giles, J. R.; McDonald, S.; Manne, S.; Ngiow, S. F.; Patel, K. P.; Werner, M. T.; Huang, A. C.; Alexander, K. A.; Wu, J. E.; Attanasio, J.; Yan, P.; George, S. M.; Bengsch, B.; Staupe, R. P.; Donahue, G.; Xu, W.; Amaravadi, R. K.; Xu, X.; Karakousis, G. C.; Mitchell, T. C.; Schuchter, L. M.; Kaye, J.; Berger, S. L.; Wherry, E. J. , TOX transcriptionally and epigenetically programs CD8(+) T cell exhaustion. Nature 2019, 7764, 211–218. [Google Scholar] [CrossRef] [PubMed]
- Seo, W.; Jerin, C.; Nishikawa, H. Transcriptional regulatory network for the establishment of CD8(+) T cell exhaustion. Experimental & molecular medicine 2021, 2, 202–209. [Google Scholar]
- Greisen, S. R.; Yan, Y.; Hansen, A. S.; Venø, M. T.; Nyengaard, J. R.; Moestrup, S. K.; Hvid, M.; Freeman, G. J.; Kjems, J.; Deleuran, B. , Extracellular Vesicles Transfer the Receptor Programmed Death-1 in Rheumatoid Arthritis. Frontiers in immunology 2017, 8, 851. [Google Scholar] [CrossRef]
- Schioppo, T.; Ubiali, T.; Ingegnoli, F.; Bollati, V.; Caporali, R. , The role of extracellular vesicles in rheumatoid arthritis: a systematic review. Clinical rheumatology 2021. [Google Scholar] [CrossRef]
- Zeidler, J. D.; Hogan, K. A.; Agorrody, G.; Peclat, T. R.; Kashyap, S.; Kanamori, K. S.; Gomez, L. S.; Mazdeh, D. Z.; Warner, G. M.; Thompson, K. L.; Chini, C. C. S.; Chini, E. N. , The CD38 glycohydrolase and the NAD sink: implications for pathological conditions. American journal of physiology. Cell physiology 2022, 3, C521–c545. [Google Scholar] [CrossRef]
- Wang, H.; Fang, K.; Yan, W.; Chang, X. , T-Cell Immune Imbalance in Rheumatoid Arthritis Is Associated with Alterations in NK Cells and NK-Like T Cells Expressing CD38. Journal of innate immunity 2022, 2, 148–166. [Google Scholar] [CrossRef]
- Chaturvedi, V.; Marsh, R. A.; Zoref-Lorenz, A.; Owsley, E.; Chaturvedi, V.; Nguyen, T. C.; Goldman, J. R.; Henry, M. M.; Greenberg, J. N.; Ladisch, S.; Hermiston, M. L.; Jeng, M.; Naqvi, A.; Allen, C. E.; Wong, H. R.; Jordan, M. B. , T-cell activation profiles distinguish hemophagocytic lymphohistiocytosis and early sepsis. Blood 2021, 17, 2337–2346. [Google Scholar] [CrossRef]
- Wang, R.; Singaraju, A.; Marks, K. E.; Shakib, L.; Dunlap, G.; Adejoorin, I.; Greisen, S. R.; Chen, L.; Tirpack, A. K.; Aude, C.; Fein, M. R.; Todd, D. J.; MacFarlane, L.; Goodman, S. M.; DiCarlo, E. F.; Massarotti, E. M.; Sparks, J. A.; Jonsson, A. H.; Brenner, M. B.; Postow, M. A.; Chan, K. K.; Bass, A. R.; Donlin, L. T.; Rao, D. A. , Clonally expanded CD38(hi) cytotoxic CD8 T cells define the T cell infiltrate in checkpoint inhibitor-associated arthritis. Science immunology 2023, 85, eadd1591. [Google Scholar] [CrossRef]
- Huang, C. H.; Fan, J. H.; Jeng, W. J.; Chang, S. T.; Yang, C. K.; Teng, W.; Wu, T. H.; Hsieh, Y. C.; Chen, W. T.; Chen, Y. C.; Sheen, I. S.; Lin, Y. C.; Lin, C. Y. , Innate-like bystander-activated CD38(+) HLA-DR(+) CD8(+) T cells play a pathogenic role in patients with chronic hepatitis C. Hepatology (Baltimore, Md.) 2022, 76, 803–818. [Google Scholar] [CrossRef]
- Wang, Z.; Zhu, L.; Nguyen, T. H. O.; Wan, Y.; Sant, S.; Quiñones-Parra, S. M.; Crawford, J. C.; Eltahla, A. A.; Rizzetto, S.; Bull, R. A.; Qiu, C.; Koutsakos, M.; Clemens, E. B.; Loh, L.; Chen, T.; Liu, L.; Cao, P.; Ren, Y.; Kedzierski, L.; Kotsimbos, T.; McCaw, J. M.; La Gruta, N. L.; Turner, S. J.; Cheng, A. C.; Luciani, F.; Zhang, X.; Doherty, P. C.; Thomas, P. G.; Xu, J.; Kedzierska, K. , Clonally diverse CD38(+)HLA-DR(+)CD8(+) T cells persist during fatal H7N9 disease. Nature communications 2018, 1, 824. [Google Scholar] [CrossRef]
- Du, J.; Wei, L.; Li, G.; Hua, M.; Sun, Y.; Wang, D.; Han, K.; Yan, Y.; Song, C.; Song, R.; Zhang, H.; Han, J.; Liu, J.; Kong, Y. , Persistent High Percentage of HLA-DR(+)CD38(high) CD8(+) T Cells Associated With Immune Disorder and Disease Severity of COVID-19. Frontiers in immunology 2021, 12, 735125. [Google Scholar] [CrossRef]
- Bobcakova, A.; Barnova, M.; Vysehradsky, R.; Petriskova, J.; Kocan, I.; Diamant, Z.; Jesenak, M. , Activated CD8(+)CD38(+) Cells Are Associated With Worse Clinical Outcome in Hospitalized COVID-19 Patients. Frontiers in immunology 2022, 13, 861666. [Google Scholar] [CrossRef]
- Khandelwal, P.; Chaturvedi, V.; Owsley, E.; Lane, A.; Heyenbruch, D.; Lutzko, C. M.; Leemhuis, T.; Grimley, M. S.; Nelson, A. S.; Davies, S. M.; Jordan, M. B.; Marsh, R. A. , CD38(bright)CD8(+) T Cells Associated with the Development of Acute GVHD Are Activated, Proliferating, and Cytotoxic Trafficking Cells. Biology of blood and marrow transplantation : journal of the American Society for Blood and Marrow Transplantation 2020, 26, 1–6. [Google Scholar] [CrossRef]
- Matsumoto, H.; Fujita, Y.; Asano, T.; Matsuoka, N.; Temmoku, J.; Sato, S.; Yashiro-Furuya, M.; Watanabe, H.; Migita, K. , T cell immunoglobulin and mucin domain-3 is associated with disease activity and progressive joint damage in rheumatoid arthritis patients. Medicine 2020, 44, e22892. [Google Scholar] [CrossRef]
- Saadati, N.; Khodashahi, M.; Rezaieyazdi, Z.; Sahebari, M.; Saremi, Z.; Mohammadian Haftcheshmeh, S.; Rafatpanah, H.; Salehi, M. Serum Level of Soluble Lymphocyte-Activation Gene 3 Is Increased in Patients with Rheumatoid Arthritis. Iranian journal of immunology : IJI 2020, 4, 324–332. [Google Scholar]
- Greisen, S. R.; Rasmussen, T. K.; Stengaard-Pedersen, K.; Hetland, M. L.; Hørslev-Petersen, K.; Hvid, M.; Deleuran, B. , Increased soluble programmed death-1 (sPD-1) is associated with disease activity and radiographic progression in early rheumatoid arthritis. Scandinavian journal of rheumatology 2014, 2, 101–108. [Google Scholar] [CrossRef] [PubMed]
- Xu, L.; Jiang, L.; Nie, L.; Zhang, S.; Liu, L.; Du, Y.; Xue, J. , Soluble programmed death molecule 1 (sPD-1) as a predictor of interstitial lung disease in rheumatoid arthritis. BMC immunology 2021, 1, 69. [Google Scholar] [CrossRef] [PubMed]
- Wu, X.; Xu, L.; Cheng, Q.; Nie, L.; Zhang, S.; Du, Y.; Xue, J. , Increased serum soluble programmed death ligand 1(sPD-L1) is associated with the presence of interstitial lung disease in rheumatoid arthritis: A monocentric cross-sectional study. Respiratory medicine 2020, 166, 105948. [Google Scholar] [CrossRef]
- Wasén, C.; Erlandsson, M. C.; Bossios, A.; Ekerljung, L.; Malmhäll, C.; Töyrä Silfverswärd, S.; Pullerits, R.; Lundbäck, B.; Bokarewa, M. I. , Smoking Is Associated With Low Levels of Soluble PD-L1 in Rheumatoid Arthritis. Frontiers in immunology 2018, 9, 1677. [Google Scholar] [CrossRef]
- Bommarito, D.; Hall, C.; Taams, L. S.; Corrigall, V. M. , Inflammatory cytokines compromise programmed cell death-1 (PD-1)-mediated T cell suppression in inflammatory arthritis through up-regulation of soluble PD-1. Clinical and experimental immunology 2017, 3, 455–466. [Google Scholar] [CrossRef]
Figure 4.
Soluble PD-1, PDL-2 and Tim3 levels elevated RA and correlation to T cell Co-IRs expression. (A) sPD1: 450.5 ± 89.01, n=31 vs. 111.1 ± 32.92, n=92 p<0.0001 (B) sPDL2: 17.9 ± 1.566, n=47 vs 12.78 ± 0.2314, n=92 p<0.0001 (C) sTIM3: 4.288 ± 0.3015, n=40 vs 3.675 ± 0.08441, n=92 p=0.0104) (D) sTIM3 levels were correlated to CD4+TIM3+% (p=0.0089, N=46) (E) CD8+TIM3+% (p=0.0305, N=46) (F) sPD1 levels were correlated to CD4+CD279+ % (p<0.0001, N=31). ***, P < 0.001, **, P < 0.01; *, P < 0.05.
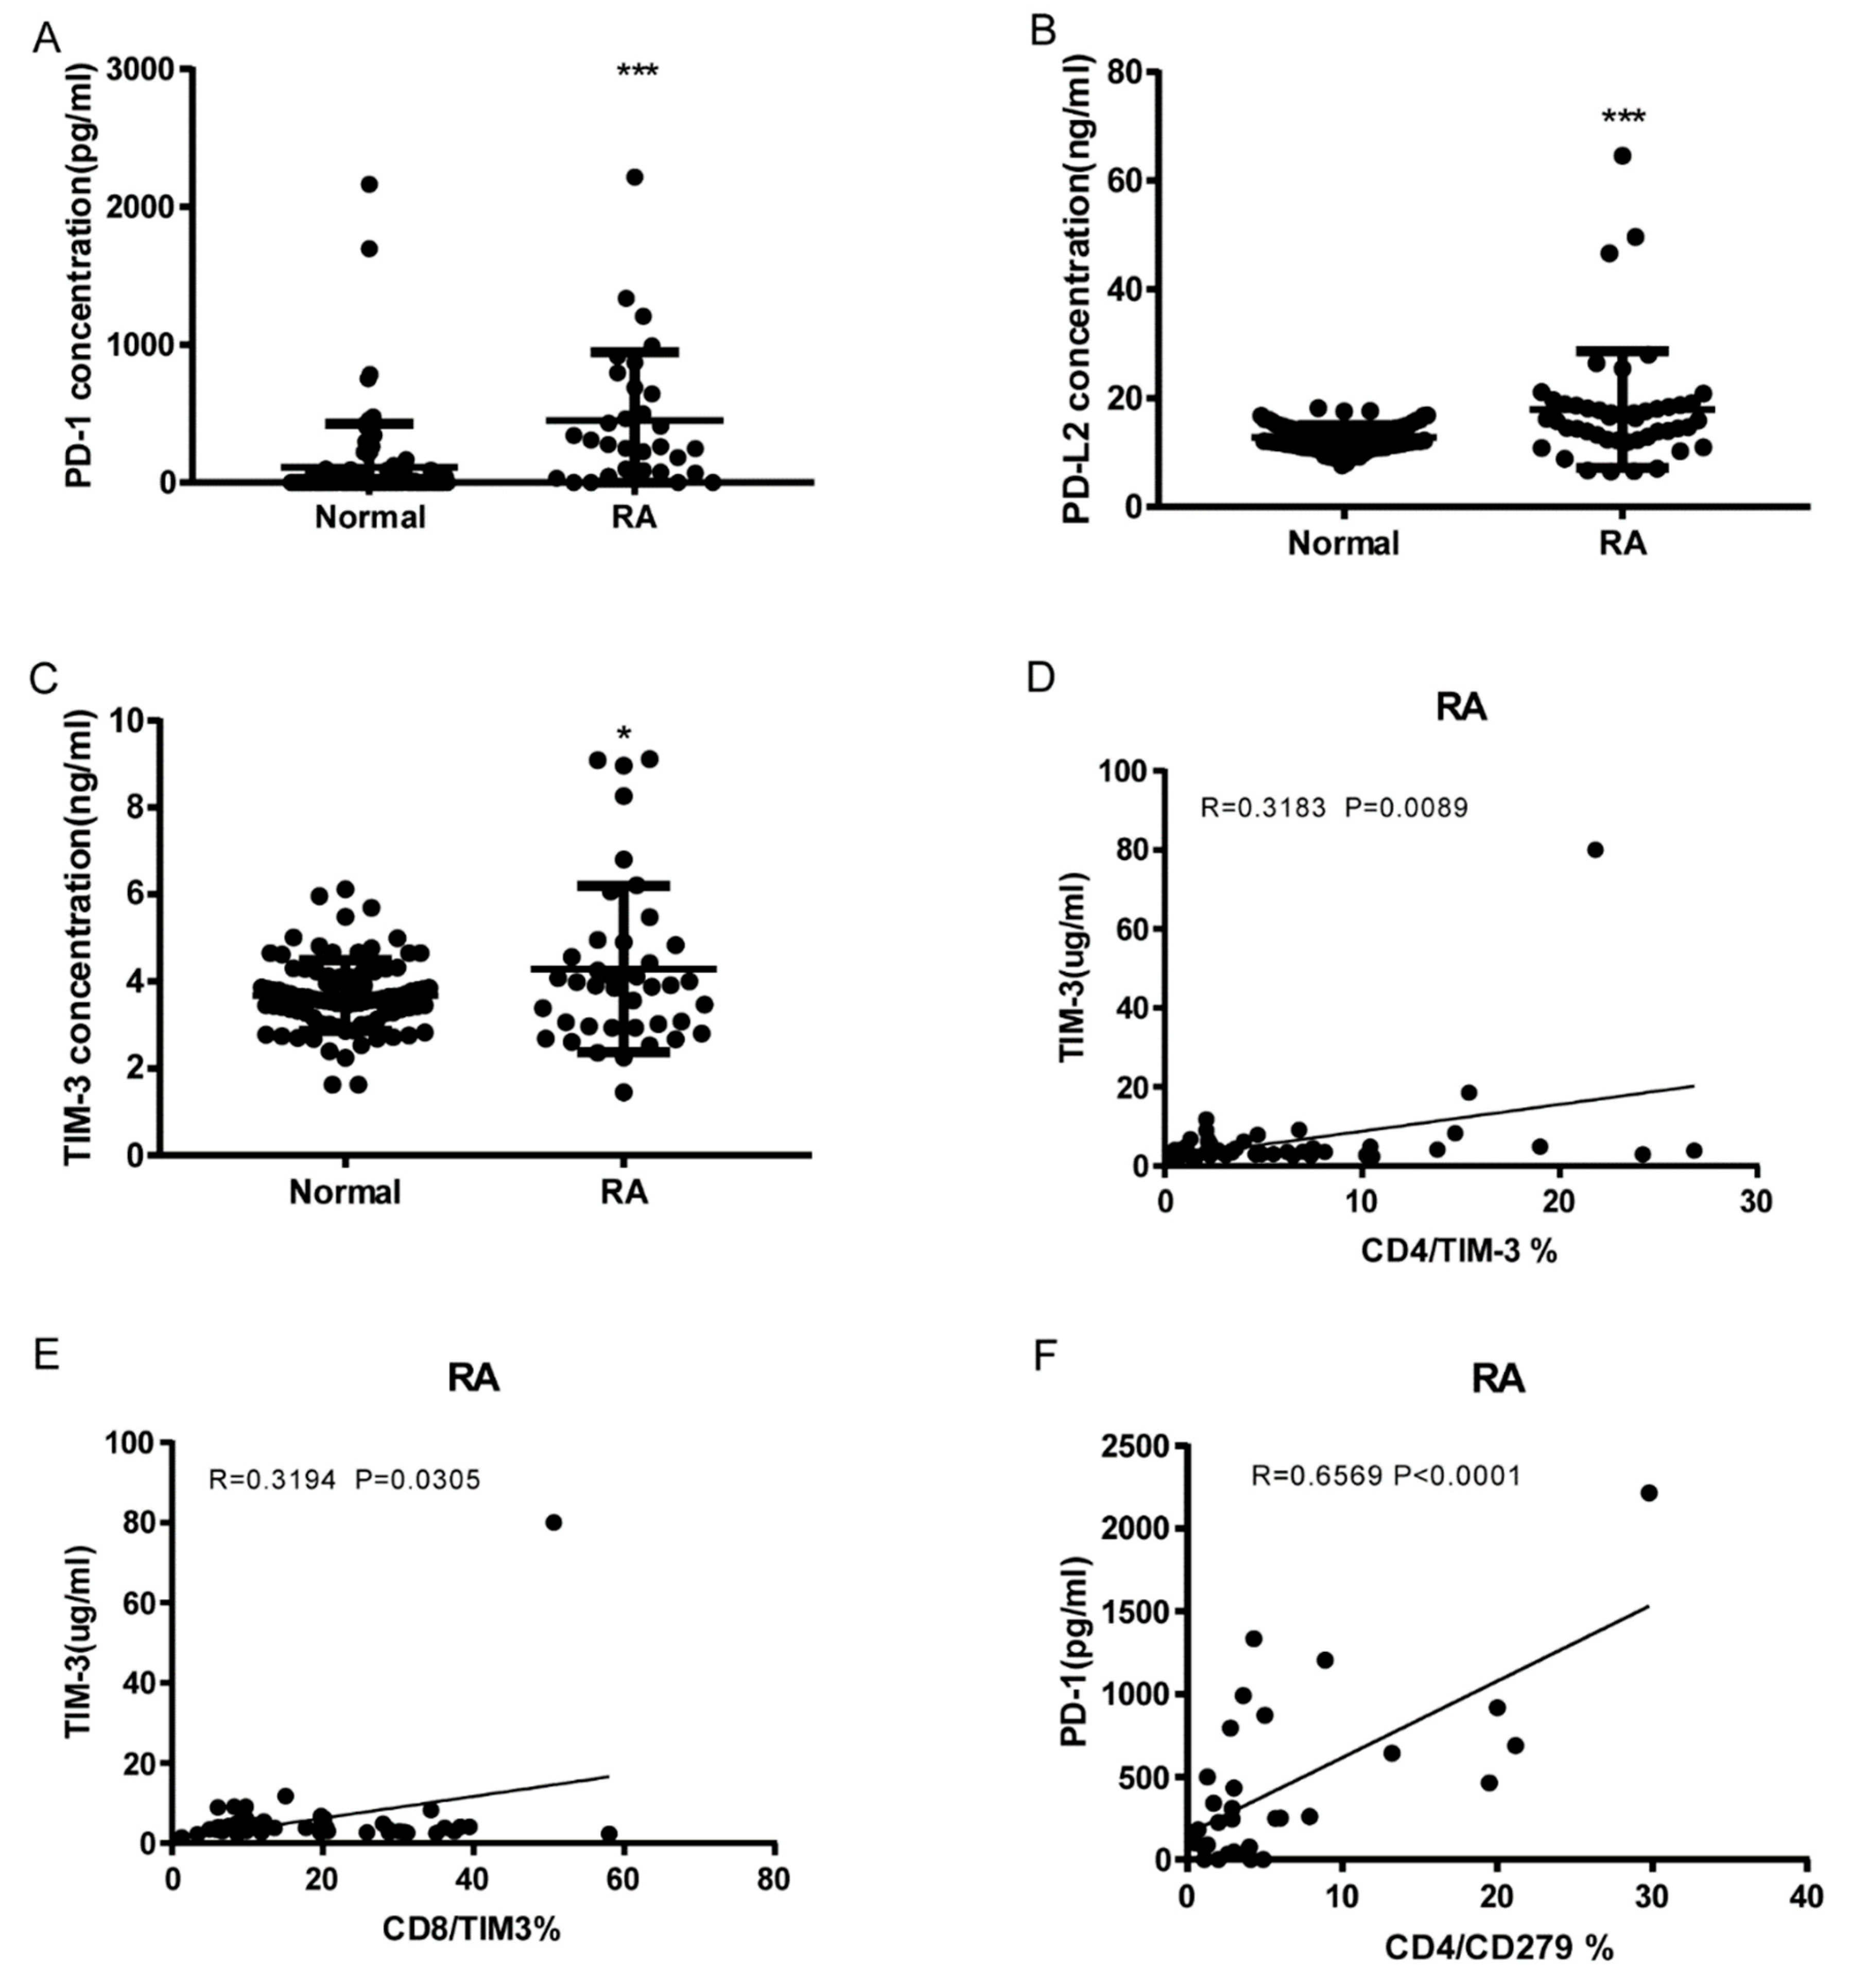

Table 1.
T cell expression of single Co-IRs in RA and Normal.
| Markers | Mean±SD (Number) | P Value | |
|---|---|---|---|
| RA | Normal | ||
| CD4+CD279 | 8.129 ± 1.128 (48) | 3.93 ± 0.7035 (27) | 0.0104 |
| CD4+TIM3+ | 6.425 ± 0.8824 (48) | 4.015 ± 0.9389 (26) | 0.0862 |
| CD4+CTLA4+ | 0.1935 ± 0.03325 (46) | 0.08889 ± 0.0209 (27) | 0.0271 |
| CD4+LAG3+ | 1.513 ± 0.2435 (48) | 0.84 ± 0.1783 (25) | 0.0673 |
| CD4+CD127+ | 39.4 ± 3.769 (48) | 44.59 ± 5.149 (27) | 0.4159 |
| CD4+TIGIT+ | 25.91 ± 1.214 (48) | 20.13 ± 0.8377 (26) | 0.0016 |
| CD8+CD279+ | 7.94 ± 1.028 (47) | 4.896 ± 0.9672 (27) | 0.0525 |
| CD8+TIM3+ | 18.71 ± 1.905 (48) | 9.826 ± 1.19 (27) | 0.0015 |
| CD8+CTLA4+ | 0.266 ± 0.04565 (47) | 0.163 ± 0.03626 (27) | 0.1247 |
| CD8+LAG3+ | 0.9522 ± 0.1999 (46) | 0.1963 ± 0.05324 (27) | 0.0057 |
| CD8+CD127+ | 23.96 ± 2.343 (48) | 40.86 ± 4.19 (27) | 0.0003 |
| CD8+TIGIT+ | 48.08 ± 2.361 (48) | 25.81 ± 1.774 (27) | <0.0001 |
| CD8+CD160+ | 36.11 ± 2.629 (47) | 29.04 ± 1.988 (27) | 0.0661 |
| CD8+CD244+ | 4.063 ± 0.8992 (48) | 1.726 ± 0.4429 (27) | 0.065 |
| CD8+HLA-DR+ | 43.37 ± 3.425 (31) | 18.6 ± 1.909 (17) | <0.0001 |
| CD8+CD38+ | 29.03 ± 3.093 (31) | 22.97 ± 2.123 (17) | 0.1828 |
| CD3+CD160+ | 12.16 ± 1.294 (47) | 10.93 ± 1.137 (27) | 0.5247 |
| CD3+CD244+ | 16.58 ± 2.761 (48) | 7.477 ± 2.673 (26) | 0.0353 |
| CD3+CD279+ | 7.237 ± 0.998 (46) | 3.978 ± 0.7626 (27) | 0.0257 |
| CD3+TIGIT+ | 43.15 ± 2.507 (47) | 28 ± 2.888 (27) | 0.0003 |
| CD3+NKG2C+ | 16.14 ± 2.491 (46) | 9 ± 2.623 (26) | 0.0685 |
Disclaimer/Publisher’s Note: The statements, opinions and data contained in all publications are solely those of the individual author(s) and contributor(s) and not of MDPI and/or the editor(s). MDPI and/or the editor(s) disclaim responsibility for any injury to people or property resulting from any ideas, methods, instructions or products referred to in the content. |
© 2024 by the authors. Licensee MDPI, Basel, Switzerland. This article is an open access article distributed under the terms and conditions of the Creative Commons Attribution (CC BY) license (http://creativecommons.org/licenses/by/4.0/).
Copyright: This open access article is published under a Creative Commons CC BY 4.0 license, which permit the free download, distribution, and reuse, provided that the author and preprint are cited in any reuse.


