

Submitted:
04 January 2024
Posted:
04 January 2024
You are already at the latest version
Abstract
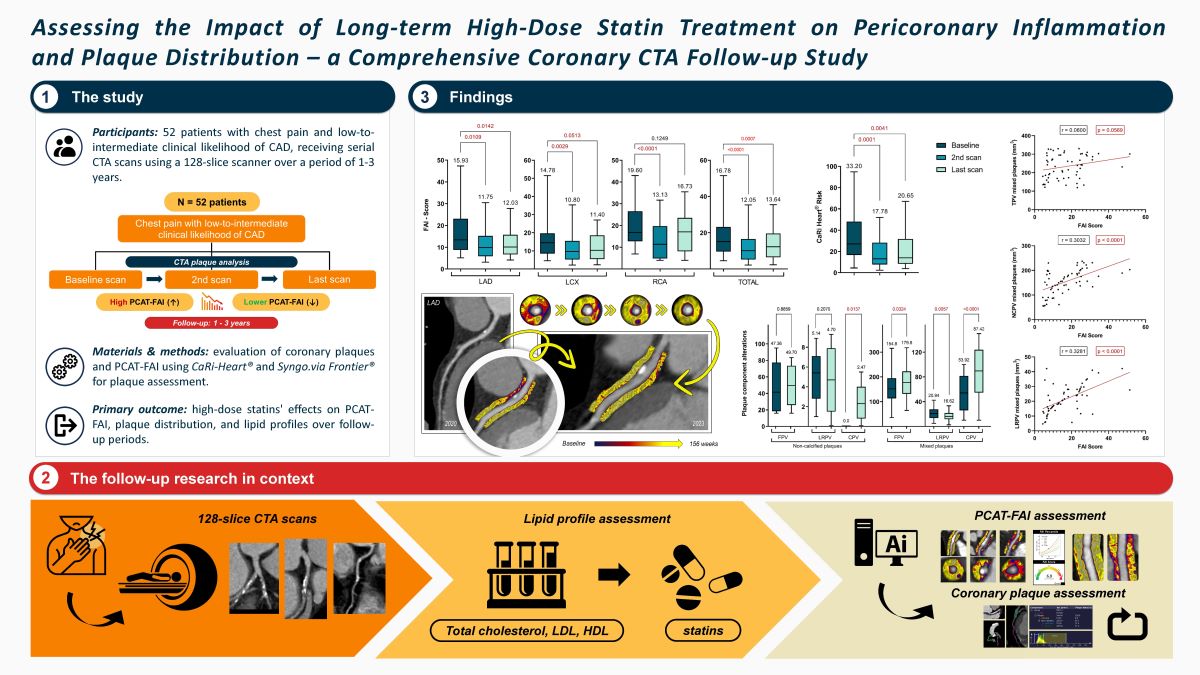
(1) Background: CTA has validated the use of pericoronary adipose tissue (PCAT) attenuation as a credible indicator of coronary inflammation and plays a crucial role in coronary artery disease (CAD). This study aimed to evaluate the long-term effects of high-dose statins on PCAT attenuation at coronary lesion sites and changes in plaque distribution; (2) Methods: Our prospective observational study included 52 patients (mean age 60.43) with typical chest pain, a low-to-intermediate likelihood of CAD, and documented atheromatous plaque through CCT. We utilized advanced features of the CaRi-Heart® and syngo.via Frontier® systems to assess coronary plaques and changes in PCAT attenuation; (3) Results: Changes in plaque morphology were investigated, revealing significant alterations. Notably, in mixed plaques, calcified portions increased (p < 0.0001), while non-calcified plaque volume (NCPV) decreased (p = 0.0209). PCAT attenuation generally decreased after one year and remained low, indicating reduced inflammation in the following arteries: LAD (p = 0.0142), LCX (p = 0.0513), and RCA (p = 0.1249). The CaRi-Heart® risk also decreased significantly (p = 0.0041). Linear regression analysis demonstrated a correlation between increased PCAT attenuation and higher volumes of NCPV (p < 0.0001, r = 0.3032) and lipid-rich plaque volume (p < 0.0001, r = 0.3281); (4) Conclusions: Our study provides evidence that high-dose statin therapy significantly reduces CAD risk factors, inflammation, and plaque vulnerability, as evidenced by the notable decrease in PCAT attenuation, a critical indicator of plaque progression.
Keywords:
pericoronary adipose tissue inflammation
; computed tomography angiography
; fat attenuation index score
; atherosclerosis
; coronary artery disease
; high-dose statin
1. Introduction
Coronary artery disease (CAD) is a major global health challenge and the leading cause of death worldwide, responsible for over 9 million deaths in 2019 [1-2]. It manifests in various forms, such as stable and unstable angina, myocardial infarction (MI), and sudden cardiac death [3]. Significantly, a quarter of MI patients develop heart failure, which has a high five-year mortality rate of 50%, placing considerable strain on healthcare systems [4].
Pericoronary adipose tissue (PCAT) is a specific type of epicardial adipose tissue (EAT) that surrounds the coronary arteries, with distinct morphological and functional characteristics despite its close proximity to EAT [5-6]. Emerging research suggests that PCAT plays a unique role in cardiovascular diseases, making both its quantitative and qualitative assessment crucial for evaluating an individual's risk of cardiometabolic disorders [5,7-8]. Vascular inflammation within PCAT is a hallmark of unstable “vulnerable” coronary plaques and a key contributor to the progression of coronary atherosclerosis [9-11]. Utilizing computed tomography angiography (CTA) to measure the fat attenuation index (FAI) has become clinically important for identifying high-risk patients [12-13] and assessing the impact of anti-inflammatory treatments, such as how statins have been shown to reduce the CT attenuation in EAT, indicating their therapeutic effect [14].
CTA serves as a noninvasive method for evaluating PCAT, using the FAI to monitor changes in PCAT and track coronary plaque progression. An increase in PCAT density often signifies various stages of CAD [13] and is associated with vulnerable plaque characteristics, predictors of clinical incidents [15-16], especially in acute coronary syndrome [17]. However, the study of PCAT's role in plaque progression is still emerging, limited by patient numbers and follow-up duration, leaving the full impact of PCAT density changes on plaque progression yet to be fully understood [18-19].
Statin therapy plays a crucial role in stabilizing plaques in CAD, mainly by reducing low-density and fibro-fatty plaque volumes and increasing denser, calcium-rich plaques. This increase in calcium in heart arteries further lowers plaque detachment risk [20]. Statins work through various mechanisms, including reducing lipid accumulation in plaques, decreasing inflammation, and enhancing endothelial function [21-22]. They effectively decrease plaque and external elastic membrane volumes without impacting the lumen volume, primarily due to their anti-inflammatory properties. However, there are some associated risks with intensive statin use [23].
Against this backdrop, our objective was to investigate the effects of extended high-dose statin therapy on the FAI of PCAT at coronary lesion sites. Additionally, we sought to assess alterations in plaque distribution over time, utilizing a 128-slice contrast-enhanced CTA during follow-up appointments.
2. Results
2.1. Baseline characteristics of the study population
In this study, we enrolled 52 participants who met all the previously outlined inclusion criteria. The average age of these patients at the initial scan was 60.43 ± 9.21 years, with males constituting 65.38% (n = 34) of the cohort. The cohort had a high prevalence of traditional risk factors for CAD, with hypertension being the most prevalent at 84.61% (n = 44). Additionally, 63.46% (n = 33) of the patients had hyperlipidemia, while diabetes mellitus and smoking were present in 26.92% (n = 14) and 17.30% (n = 9) of the patients, respectively. A considerable number of patients, accounting for 42.30% (n = 22), indicated a family history of CAD, underscoring the hereditary aspect of the disease in their familial background. The composition of plaque types within the selected coronary arteries was categorized as follows: 54.06% (n = 80) were calcified plaques, 4.73% (n = 7) were non-calcified plaques, and 41.21% (n = 61) were mixed plaques featuring both calcified and non-calcified components. The mean calcium score among the participants was 127.5 ± 72.96. The distribution across different calcium score ranges was as follows: scores < 10 were observed in 5.77% (n = 3), scores ranging from 10 to 400 comprised the majority at 69.23% (n = 36), and scores > 400 were found in 25.00% (n = 13). These findings are presented in Table 1.
2.2. Serial changes in the lipid panel outcomes during follow-up
After commencing statin therapy, the blood tests conducted during the first-year follow-up revealed significant changes in lipid profiles. The average total cholesterol levels decreased significantly from 194.3 ± 66.76 to 145.2 ± 34.7 (p = 0.0003). Notable alterations were also observed in LDL-Cho and HDL-Cho levels, with LDL-Cho decreasing from 105.9 ± 33.97 to 87.69 ± 32.99 (p < 0.0001) and HDL-Cho increasing from 38.11 ± 8.72 to 47.10 ± 7.97 (p < 0.0001).
Long-term analysis at the time of the last visit revealed persistent significant differences in these parameters when comparing initial and final visits, with total cholesterol (p < 0.0001), LDL-Cho (p < 0.0001), and HDL-Cho (p < 0.0001) all showing notable differences. Triglyceride levels also changed significantly after one year and showed a significant long-term decrease from 188.7 ± 66.01 to 171.9 ± 53.76 (p < 0.0001), reflecting effective anti-triglyceride therapy. These findings are detailed in Table 2.
2.3. Serial changes of plaque features before and after statin treatment
Subsequently, we examined the morphological changes in plaque features during the follow-up period. However, due to the minimal changes experienced during the short (1 year) follow-up and the very time-consuming evaluation procedure, we only performed plaque analysis on the baseline CTA scans and the last multi-year control scans. The study observed an overall increase in the volume of calcified plaques, though this change was not statistically significant between the initial and final follow-up CTA scans (p = 0.0773). Regarding non-calcified plaques, changes were also noted, highlighting the dynamic and variable nature of plaque morphology. However, only 7 plaques were analyzed in this category, and a significant transformation was observed solely in the CPV over a period of 3 years.
Figure 1 presents the TPV values for each plaque type, illustrating the shifts in plaque morphology during the follow-up period. However, these changes were not statistically significant.
In our longitudinal analysis of plaque morphology, we found the mixed plaques particularly intriguing due to their dynamic changes. Specifically, the CPV within these plaques significantly increased from 53.92 ± 31.29 mm³ to 87.42 ± 43.48 mm³ (p < 0.0001). In contrast, the NCPV significantly decreased from 180.5 ± 66.81 mm³ to 155.4 ± 59.51 mm³ (p = 0.0209). Although the TPV increased, this change was not statistically significant, moving from 237.4 ± 70.0 mm³ to 256.9 ± 79.84 mm³ (p = 0.1454). Further analysis of the NCPV showed an increase in the volume of fibrotic plaques from 154.8 ± 63.04 mm³ to 179.8 ± 63.46 mm³ (p = 0.0324), while lipid-rich plaques significantly decreased from 20.94 ± 9.93 mm³ to 16.62 ± 7.69 mm³ (p = 0.0057). In summary, during the follow-up period, there was a decrease in NCPV with significant changes in the FPV and LRPV, alongside a significant increase in CPV in mixed plaques. These findings are further detailed in Table 3 and Figure 2.
The findings we've discussed are best validated by a specific instance from our patient pool, which is depicted in detail in Figure 3. This illustration provides a clear view of how statin therapy contributes to the reduction of the FAI-Score and the alteration of plaque characteristics, showcasing the changes in a patient over the course of treatment.
2.4. Serial changes of lesion-specific PCAT-FAI before and after statin treatment
For all lesions across the coronary arteries, follow-up data revealed that high-dose statin therapy significantly altered the lesion-specific PCAT-FAI after nearly one year, with a general trend of gradual decrease remaining thereafter at the last scan. Figure 4 displays the diagrams that break down the data into the two specific follow-up intervals: 1 year and over 3 years, and Table 4 shows the specific data for all the PCAT-FAI parameters.
It's important to note that the traditionally measured FAI in HU units showed a significant decrease only in the LAD at the one-year follow-up (-68.94 ± 6.88 vs. -72.83 ± 6.29, p = 0.0061). This reduction remained consistent up to the final scans (-68.94 ± 6.88 vs. -71.75 ± 8.07, p = 0.0138).
Regarding specific FAI scores, there was an overall decrease across all three coronary arteries at the one-year mark compared to initial measurements. This decrease was significant for the total score (16.78 ± 8.76 vs. 12.05 ± 7.88, p < 0.0001), LAD (15.93 ± 9.22 vs. 11.75 ± 7.35, p = 0.0109), LCX (14.78 ± 7.35 vs. 10.80 ± 7.27, p = 0.0029), and RCA (19.60 ± 8.99 vs. 13.13 ± 8.34, p < 0.0001). Although these values started to increase slightly by the time of the last CTA, a significant difference was maintained for the total score (16.78 ± 8.76 vs. 13.64 ± 8.00, p = 0.0007), LAD (15.93 ± 9.22 vs. 12.03 ± 6.27, p = 0.0142), and LCX (14.78 ± 7.35 vs. 12.15 ± 7.51, p = 0.0513). However, for the RCA, after 3 years, the FAI score increased to the point where the difference was no longer significant (19.60 ± 8.99 vs. 16.73 ± 9.17, p = 0.1249).
The FAI scores for the LAD, LCX, and RCA were plotted on percentile curves for different age and sex groups, with their predictive value assessed using Cox proportional hazards models. These models were adjusted for risk factors such as hypertension, diabetes, smoking, hyperlipidemia, high-risk plaque features, and the modified Duke CAD prognostic index [24].
Concurrently, a notable shift in the PCAT-FAI score percentiles was observed, indicating a significant decrease across all three coronary arteries when comparing baseline scans with subsequent scans. For the LAD, scores decreased from 72.88 ± 16.22 to 64.96 ± 24.45 (p = 0.0526) and further to 61.91 ± 17.96 (p = 0.0044). The LCX scores dropped from 73.56 ± 15.60 to 63.85 ± 16.32 (p = 0.0120) and then to 60.18 ± 18.07 (p < 0.0001). For the RCA, the scores went from 81.73 ± 13.61 to 70.73 ± 18.98 (p = 0.0001) and subsequently changed to 71.72 ± 19.21 (p = 0.0041).
There was a notable reduction in the CaRi-Heart® Risk score between the initial and second scans (33.20 ± 22.07 vs. 17.78 ± 13.41, p = 0.0001). Although there was an increase in the score at the time of the last visit, it still remained significantly lower compared to the initial value (33.20 ± 22.07 vs. 20.65 ± 16.14, p = 0.0041), as depicted in Figure 5. The CaRi-Heart® analysis takes into account age and gender to assess coronary inflammation and predicts the 8-year risk of a fatal cardiac event. This evaluation includes the FAI Score, plaque burden, and various clinical risk factors.
2.5. Relationship between the PCAT-FAI assessment and plaque component morphology
Considering the individual PCAT-FAI score values for each plaque, we conducted a linear regression analysis based on the baseline CTA scans. Intriguingly, this shed light on what the literature has previously speculated but not studied with FAI scoring: an increase in FAI score correlates with an increase in TPV (p = 0.0569, r = 0.0600), NCPV (p < 0.0001, r = 0.3032), and significantly, with the increase in LRPV (p < 0.0001, r = 0.3281). However, such a correlation was not found between the FAI score and the TPV of calcified plaques (p = 0.4277), nor in the CPV (p = 0.2021) or FPV (p = 0.9992) of mixed plaques (Figure 6).
3. Discussion
Our study's main outcome strongly supports the benefits of statin therapy in reducing risk factors and inflammation associated with CAD. The data from our participant cohort, demonstrating significant reductions in lipid levels, plaque-specific inflammation, and changes in plaque structure, indicate that high-dose statin therapy has a positive impact on both the biochemical and structural aspects of CAD pathology.
The FAI-Score correlates with the vulnerable component of plaque, a topic that recent studies have investigated, particularly examining the relationship between PCAT-FAI and the increase in NCPV and LRPV. These studies have focused on the predictive power of PCAT attenuation and NCPV concerning MI. Research has demonstrated that PCAT attenuation around the RCA can predict MI occurrence, making it a significant predictive marker for assessing the 5-year MI risk [25]. Additionally, the combination of FAI and plaque assessments has been shown to more effectively distinguish ischemia compared to evaluations based solely on stenosis. This highlights the significance of FAI as a marker for the risk of coronary atherosclerosis, supporting its strong association with the development of coronary atherosclerosis and plaque vulnerability [26-27].
Statins not only improved lipid profiles but also seemed to induce a shift in plaque morphology, with increases in CPV suggesting a move towards more stable plaque forms, and a decrease in NCPV reflecting potential reductions in vulnerability to rupture.
This study's findings resonate with existing research that links statin use with a slowdown in CAD progression and improved lipid regulation [28]. It is well-established that statins can notably decrease the advancement of atherosclerotic plaques and the incidence of MACE, despite increasing coronary calcium, which may be indicative of plaque stabilization [29-31]. The relevance of high-dose statins in delivering additional vascular protection above standard doses is supported by clinical trials, though the appropriateness of this therapy remains patient-specific due to the variability in clinical conditions and risks [32-33]. Such therapy's impact on the different components of coronary plaques has also been substantiated, supporting the study's report of differential changes in plaque types [19,34].
Nonetheless, this research is constrained by factors such as its limited participant number and relatively brief follow-up period, which may not fully reflect the long-term effects of statin treatment. The potential for selection bias given by the sole use of CTA scans for plaque evaluation also poses a limitation, as some plaques may not be detectable by this method alone. The participant selection, characterized by a high prevalence of traditional CAD risk factors, could additionally limit the generalizability of the study's results. Future research would benefit from a broader and more diverse cohort and an extended monitoring timeline to validate the findings presented here. Utilizing a variety of imaging techniques could offer a more nuanced view of the changes in plaque composition over time.
In summary, the clinical implications of this study are significant, underlining the importance of high-dose statin therapy in the management and potential modification of CAD. The evidence of statin efficacy in improving lipid profiles, reducing plaque-specific inflammation, and stabilizing plaque morphology holds considerable promise for CAD treatment strategies. Although the study's limitations indicate a need for ongoing research, they do not undermine the current clinical application of its findings. Future studies, addressing these limitations, could provide even stronger support for the use of statins in CAD management and prevention strategies.
4. Materials and Methods
4.1. Study design and population
In our single-center, longitudinal, prospective, observational, nonrandomized study, 109 patients with typical chest pain and a low to intermediate risk of CAD were recruited. These participants underwent a detailed examination of their coronary anatomy, atherosclerotic changes, FAI scoring, and plaque analysis using 128-slice CTA. The study was designed to monitor the same group of individuals over time to observe any developments in their condition. Follow-up periods were divided into two intervals: one spanning approximately one year, and another extending beyond three years.
Our study applied the following inclusion criteria: (1) the initial CTA had to show at least one lesion with a luminal stenosis of 25-49% in any major coronary artery with a diameter of ≥ 2 mm, below CAD-RADS category 3; (2) participants had to be new to statin therapy and free from any other lipid-lowering medications at the time of their baseline scan; The following exclusion criteria were applied: (1) patients whose coronary CTA results were not clear enough for quantitative assessment (n = 23) or PCAT density analysis (n = 15) at either the initial or follow-up scans, precluding good quality analysis; (2) patients who had clinical incidents leading to coronary revascularization in the interval between their CTA’s (n = 19). After applying these exclusion criteria, the final analysis included 148 lesions from 52 patients (as shown in Figure 7).
At each visit, comprehensive lipid profiles, including measurements of total cholesterol, triglycerides, low-density lipoprotein cholesterol (LDL-Cho), and high-density lipoprotein cholesterol (HDL-Cho) levels, were collected. Additionally, we meticulously recorded demographic data, other laboratory test results, cardiovascular risk factors, and any new or progressing symptoms for each participant.
4.2. Coronary CTA acquisition protocol
All study procedures utilized a 128-slice scanner (Somatom Definition AS, Siemens Healthineers) for conducting CTA scans on all study participants. Patients with heart rates under 65 bpm underwent scans with retrospective gating and specific technical settings. If heart rates exceeded 65 bpm, beta-blockers were used to to achieve the target heart rate, with continuous blood pressure monitoring. The procedure included a non-contrast coronary calcium scan, followed by an iodine contrast injection and a saline flush, with patients holding their breath. The scans were systematically archived in a specialized electronic imaging database, which facilitated offline image post-processing and cloud-based distribution.
4.3. Pericoronary adipose tissue FAI and plaque analysis
Images obtained from the scans were converted to DICOM format, anonymized, and then securely sent to our collaborative research facility, the Centre of Caristo Diagnostics in Oxford, UK, for post-processing. This process involved analyzing inflammation in the PCAT for each coronary artery. Utilizing advanced artificial intelligence (AI) algorithms from CaRi-Heart® by Caristo Diagnostics, the PCAT-FAI and AI-based FAI scores were accurately calculated for each major coronary artery across all patients.
The AI algorithms enhance the precision of the PCAT-FAI by measuring attenuation in 3D layers, each 1 mm thick, around the coronary arteries [6,35]. These algorithms perform a series of complex operations, including segmenting cardiac structures and evaluating the PCAT. They adjust for a range of scan-related variables to ensure that the PCAT-FAI is a reliable marker of coronary inflammation, distinct from standard CT attenuation values [36].
To clarify, the distinctions between FAI, FAI-Score, and CaRi-Heart® risk are as follows: (1) FAI, measured in Hounsfield units (HU), offers an unmodified graphical depiction of inflammation levels in the three primary epicardial coronary arteries; (2) FAI-Score provides a customized evaluation, quantifying coronary inflammation in these arteries while incorporating age and gender, and is expressed as a relative risk; (3) CaRi-Heart® risk represents the absolute risk of experiencing a fatal cardiac event within the next eight years. This risk assessment is based on individualized FAI-Score values, the extent of coronary atherosclerotic plaque, and other clinical risk factors.
For the assessment of plaque characteristics and components at baseline and during follow-up visits, we utilized the Syngo.via Frontier® (Syngo.Via, Siemens Healthineers) offline workstation. This enabled us to measure various types of plaque volumes, including total (TPV), calcified (CPV), non-calcified (NCPV), lipid-rich (LRPV), and fibrotic (FPV) plaques. Furthermore, we visually categorized all target lesions into one of three predefined types: calcified, non-calcified, or mixed (containing both calcified and non-calcified components).
4.4. Statistical analysis
Following the calculation of the PCAT-FAI for each coronary artery, the results were transmitted to our institution and cataloged in a Microsoft Excel electronic database. For statistical evaluation, we used GraphPad Prism 9.5 software (GraphPad Software, Inc.). Our analysis encompassed PCAT-FAI measurements across 148 coronary arteries, including 50 from the LAD, 48 from the LCX, and 50 from the RCA. We also calculated the CaRi-Heart® risk scores for each participant.
Data from various follow-up periods were comparatively analyzed. We displayed categorical data as counts and percentages, applying the Chi-square test or Fisher’s exact test for analysis, contingent on dataset dimensions. For continuous data, we provided means ± standard deviations, employing the paired Student’s t-test for normally distributed datasets, or the Wilcoxon signed-rank test for those with skewed distributions. To explore the association between shifts in PCAT-FAI values and alterations in plaque attributes, Pearson's correlation was used for normally distributed variables, while Spearman's rank correlation was utilized for others. A p < 0.05 was used to denote statistical significance.
5. Conclusions
Our study validates the efficacy of high-dose statin therapy in diminishing risk factors, inflammation, and plaque vulnerability in CAD. It demonstrates that a high FAI score, indicative of inflamed PCAT and vulnerable plaque morphology, is significantly reduced following high-dose statin treatment. This underscores the significance of the FAI score as a predictive marker for the progression and evolution of CAD.
Author Contributions
Conceptualization, B.B.M., I.B. and T.B.; methodology, T.B. and I.B.; validation, B.B.M., I.B., E.B., N.R., ZS.P. and T.B; formal analysis, I.B., T.M. and ZS.P.; investigation, B.B.M., E.B. and T.B.; resources, I.B.; data curation, N.R., T.M.; writing—original draft preparation, B.B.M. and T.B.; writing—review and editing, B.B.M. and T.B.; visualization, B.B.M., E.B., N.R. and T.B.; supervision, I.B.; project administration, I.B. and T.B.; funding acquisition, I.B. and T.B. All authors have read and agreed to the published version of the manuscript.
Funding
This research has been funded by the research grant Intel-FAT, proposal registration code PN-III-P4-ID- PCE-2020-2861, contract number PCE 206/2021, Project funded by the Romanian Ministry of Education - UEFISCDI.
Institutional Review Board Statement
The research procedures followed good clinical practice guidelines and adhered to the Declaration of Helsinki. Institutional ethics approval was obtained from the ethics committee (26884 / 10 November 2021) and from the Scientific Research Ethics Committee at the "G. E. Palade" University of Medicine, Pharmacy, Science, and Technology in Târgu Mureș (1513 / 9 December 2021).
Informed Consent Statement
Informed consent was obtained from all subjects involved in the study.
Data Availability Statement
The data presented in this study are available on request from the corresponding author. The data are not publicly available due to privacy reasons.
Acknowledgments
Preliminary findings from this study were presented at the 2023 ESC Congress of the European Society of Cardiology in Amsterdam [37]. This paper also constitutes a component of the first author's doctoral thesis at the University of Medicine, Pharmacy, Science, and Technology 'G. E. Palade' of Târgu-Mures, as part of the Doctoral School of Medicine and Pharmacy, and has received the endorsement of all contributing authors.
Conflicts of Interest
The authors report no conflicts of interest. Furthermore, the funding bodies were not involved in any aspect of the study's design, nor in the gathering, analysis, or interpretation of data. They also did not contribute to the manuscript's composition or influence the decision to publish the findings.
References
- Mack M, Gopal A. Epidemiology, Traditional and Novel Risk Factors in Coronary Artery Disease. Heart Fail Clin 2016, 12, 1–10. [CrossRef] [PubMed]
- Cheema KM, Dicks E, Pearson J, Samani NJ. Long-term trends in the epidemiology of cardiovascular diseases in the UK: insights from the British Heart Foundation statistical compendium. Cardiovasc Res. 2022, 118, 2267–2280. [Google Scholar] [CrossRef] [PubMed]
- Malakar AK, Choudhury D, Halder B, Paul P, Uddin A, Chakraborty S. A review on coronary artery disease, its risk factors, and therapeutics. J Cell Physiol. 2019, 234, 16812–16823. [CrossRef]
- Velagaleti RS, Pencina MJ, Murabito JM, et al. Long-term trends in the incidence of heart failure after myocardial infarction. Circulation. 2008, 118, 2057–2062. [CrossRef] [PubMed]
- Mancio J, Oikonomou EK, Antoniades C. Perivascular adipose tissue and coronary atherosclerosis. Heart. 2018, 104, 1654–1662. [CrossRef]
- Antonopoulos AS, Sanna F, Sabharwal N, et al. Detecting human coronary inflammation by imaging perivascular fat. Sci Transl Med. 2017, 9, eaal2658.
- Blindu E, Benedek I, Rodean IP, et al. Regional Differences in the Level of Inflammation Between the Right and Left Coronary Arteries – a Coronary Computed Tomography Angiography Study of Epicardial Fat Attenuation Index in Four Scenarios of Cardiovascular Emergencies - Journal of Cardiovascular Emergencies. 2023, 9, 111-119.
- Akoumianakis I, Antoniades C. The interplay between adipose tissue and the cardiovascular system: is fat always bad? Cardiovasc Res. 2017, 113, 999–1008. [Google Scholar] [CrossRef] [PubMed]
- Ross, R. Atherosclerosis - an inflammatory disease. N Engl J Med. 1999, 340, 115–126. [Google Scholar] [CrossRef]
- Ridker PM, Everett BM, Thuren T, et al. Antiinflammatory Therapy with Canakinumab for Atherosclerotic Disease. N Engl J Med. 2017, 377, 1119–1131. [Google Scholar] [CrossRef]
- Matyas BB, Gerculy R, Rat N, et al. Highly Inflamed Non-Calcified Coronary Plaques Sealed with Stents in Patients with Zero Calcium Score – a Case Series and Review of the Literature - Journal of Cardiovascular Emergencies, 2023; accepted.
- Tzolos E, McElhinney P, Williams MC, et al. Repeatability of quantitative pericoronary adipose tissue attenuation and coronary plaque burden from coronary CT angiography. J Cardiovasc Comput Tomogr. 2021, 15, 81–84. [Google Scholar] [CrossRef]
- Lin A, Nerlekar N, Yuvaraj J, et al. Pericoronary adipose tissue computed tomography attenuation distinguishes different stages of coronary artery disease: a cross-sectional study. Eur Heart J Cardiovasc Imaging. 2021, 22, 298–306. [Google Scholar] [CrossRef] [PubMed]
- Goeller M, Achenbach S, Marwan M, et al. Epicardial adipose tissue density and volume are related to subclinical atherosclerosis, inflammation and major adverse cardiac events in asymptomatic subjects. J Cardiovasc Comput Tomogr. 2018, 12, 67–73. [Google Scholar] [CrossRef]
- Kwiecinski J, Dey D, Cadet S, et al. Peri-Coronary Adipose Tissue Density Is Associated With 18F-Sodium Fluoride Coronary Uptake in Stable Patients With High-Risk Plaques. JACC Cardiovasc Imaging. 2019, 12, 2000–2010. [Google Scholar] [CrossRef] [PubMed]
- Matyas BB, Blindu E, Rat N, et al. A Race Against Time: Coronary-CTA Discovers a Highly Inflamed Plaque in 49-Year-Old Right Before STEMI - Journal of Cardiovascular Emergencies, 2023; accepted.
- Goeller M, Achenbach S, Cadet S, et al. Pericoronary Adipose Tissue Computed Tomography Attenuation and High-Risk Plaque Characteristics in Acute Coronary Syndrome Compared With Stable Coronary Artery Disease. JAMA Cardiol. 2018, 3, 858–863. [Google Scholar] [CrossRef] [PubMed]
- Goeller M, Tamarappoo BK, Kwan AC, et al. Relationship between changes in pericoronary adipose tissue attenuation and coronary plaque burden quantified from coronary computed tomography angiography. Eur Heart J Cardiovasc Imaging. 2019, 20, 636–643. [Google Scholar] [CrossRef] [PubMed]
- Dai X, Yu L, Lu Z, Shen C, Tao X, Zhang J. Serial change of perivascular fat attenuation index after statin treatment: Insights from a coronary CT angiography follow-up study. Int J Cardiol. 2020, 319: 144-149.
- Lee SE, Chang HJ, Sung JM, et al. Effects of Statins on Coronary Atherosclerotic Plaques: The PARADIGM Study. JACC Cardiovasc Imaging. 2018, 11, 1475–1484. [Google Scholar] [CrossRef]
- Takata K, Imaizumi S, Zhang B, Miura S, Saku K. Stabilization of high-risk plaques. Cardiovasc Diagn Ther. 2016, 6, 304–321. [Google Scholar] [CrossRef]
- Banach M, Serban C, Sahebkar A, et al. Impact of statin therapy on coronary plaque composition: a systematic review and meta-analysis of virtual histology intravascular ultrasound studies. BMC Med. 2015, 13: 229.
- Reilly SD, Litovsky SH, Steinkampf MP, Caulfield JB. Statins improve human coronary atherosclerotic plaque morphology. Tex Heart Inst J. 2008, 35, 99–103. [Google Scholar]
- New-Maddox TM, Stanislawski MA, Grunwald GK, et al. Nonobstructive coronary artery disease and risk of myocardial infarction. JAMA. 2014, 312, 1754–1763. [Google Scholar] [CrossRef] [PubMed]
- Tzolos E, Williams MC, McElhinney P, et al. Pericoronary Adipose Tissue Attenuation, Low-Attenuation Plaque Burden, and 5-Year Risk of Myocardial Infarction. JACC Cardiovasc Imaging. 2022, 15, 1078–1088. [Google Scholar] [CrossRef] [PubMed]
- Sun JT, Sheng XC, Feng Q, et al. Pericoronary Fat Attenuation Index Is Associated With Vulnerable Plaque Components and Local Immune-Inflammatory Activation in Patients With Non-ST Elevation Acute Coronary Syndrome. J Am Heart Assoc. 2022, 11, e022879. [Google Scholar] [CrossRef]
- Zou L, Xiao X, Jia Y, et al. Predicting coronary atherosclerosis heart disease with pericoronary adipose tissue attenuation parameters based on dual-layer spectral detector computed tomography: a preliminary exploration. Quant Imaging Med Surg. 2023, 13, 2975–2988. [Google Scholar] [CrossRef]
- Bedi U, Singh M, Singh P, Molnar J, Khosla S, Arora R. Effects of statins on progression of coronary artery disease as measured by intravascular ultrasound. J Clin Hypertens (Greenwich). 2011, 13, 492–496. [Google Scholar] [CrossRef]
- van Rosendael AR, van den Hoogen IJ, Gianni U, et al. Association of Statin Treatment With Progression of Coronary Atherosclerotic Plaque Composition. JAMA Cardiol. 2021, 6, 1257–1266. [Google Scholar] [CrossRef]
- Nicholls SJ, Ballantyne CM, Barter PJ, et al. Effect of two intensive statin regimens on progression of coronary disease. N Engl J Med. 2011, 365, 2078–2087. [Google Scholar] [CrossRef]
- Nicholls SJ, Puri R, Anderson T, et al. Effect of evolocumab on progression of coronary disease in statin-treated patients: the GLAGOV randomized clinical trial. JAMA. 2016, 316: 2373–2384.
- Dorresteijn JA, Boekholdt SM, van der Graaf Y, et al. High-dose statin therapy in patients with stable coronary artery disease: treating the right patients based on individualized prediction of treatment effect. Circulation. 2013, 127, 2485–2493. [Google Scholar] [CrossRef]
- Lee SE, Sung JM, Andreini D, et al. Association Between Changes in Perivascular Adipose Tissue Density and Plaque Progression. JACC Cardiovasc Imaging. 2022, 15, 1760–1767. [Google Scholar] [CrossRef] [PubMed]
- Smit JM, van Rosendael AR, El Mahdiui M, et al. Impact of Clinical Characteristics and Statins on Coronary Plaque Progression by Serial Computed Tomography Angiography. Circ Cardiovasc Imaging. 2020, 13, e009750. [Google Scholar] [CrossRef] [PubMed]
- Antoniades C, Kotanidis CP, Berman DS. State-of-the-art review article. Atherosclerosis affecting fat: What can we learn by imaging perivascular adipose tissue? J Cardiovasc Comput Tomogr. 2019, 13, 288–296. [Google Scholar] [CrossRef] [PubMed]
- Kotanidis CP, Antoniades C. Perivascular fat imaging by computed tomography (CT): a virtual guide. Br J Pharmacol. 2021, 178, 4270–4290. [Google Scholar] [CrossRef] [PubMed]
- Matyas B, Benedek I, Rosca A, et al. Reduction of perivascular inflammation following long-term statin treatment - a coronary CT follow-up study using Fat Attenuation Index. European Heart Journal, 2023, 44, ehad655–153. [Google Scholar]
Figure 1.
Serial changes of total plaque volume (TPV) for each plaque type.
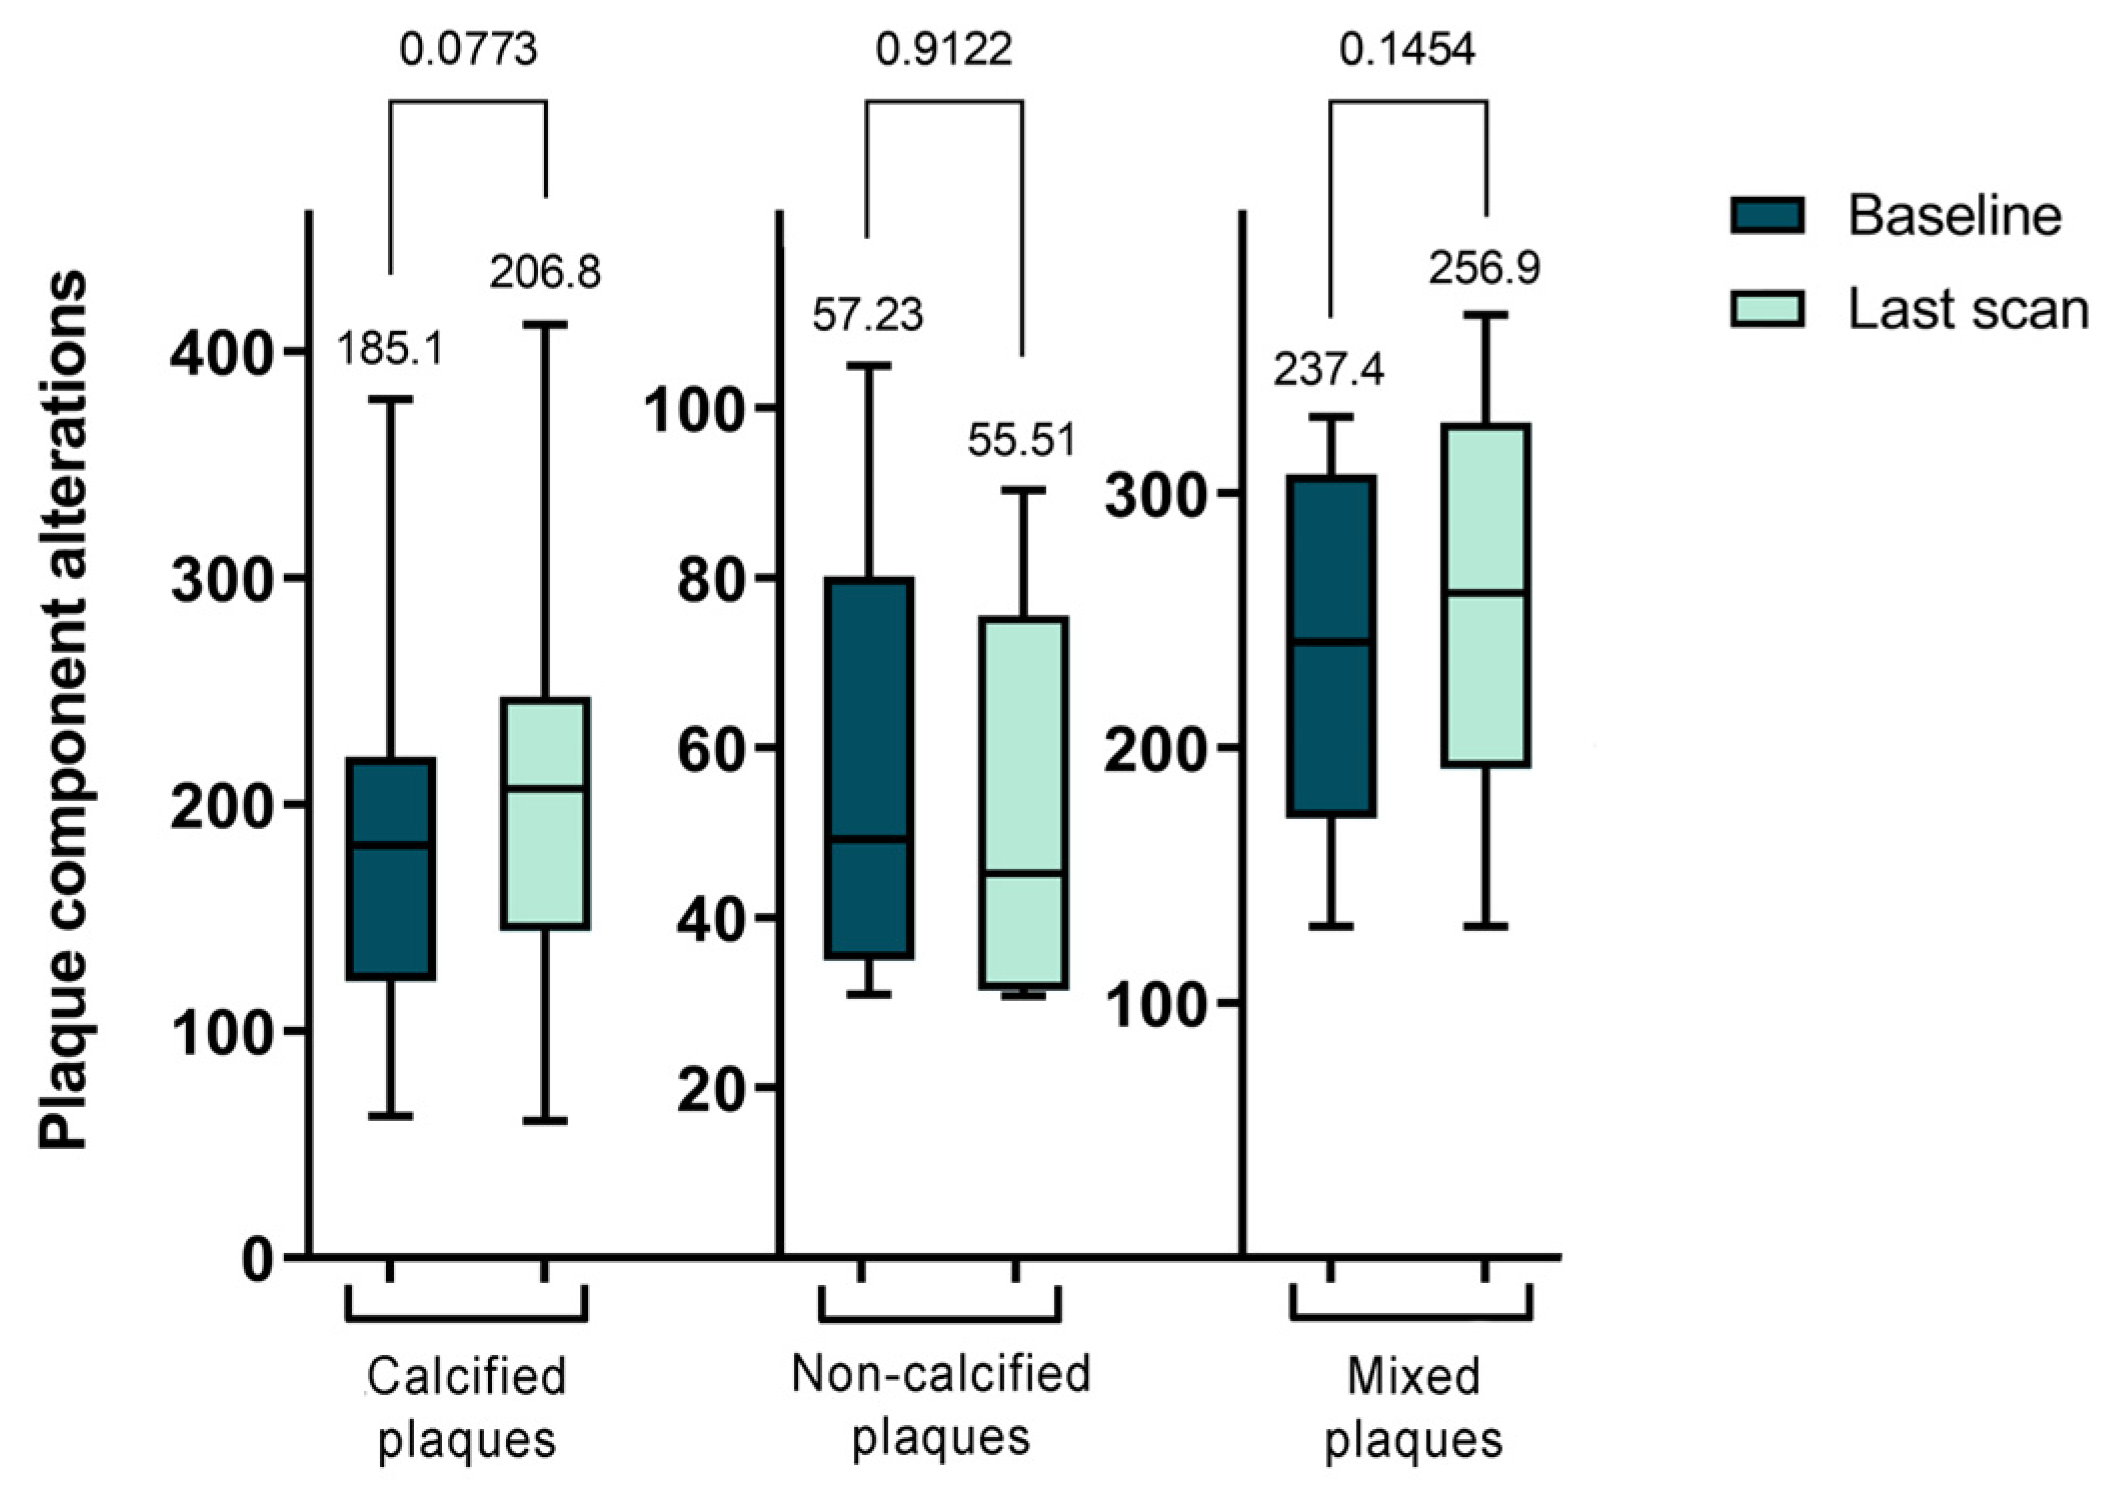
Figure 2.
Serial changes of plaque components in the non-calcified and mixed plaque types.
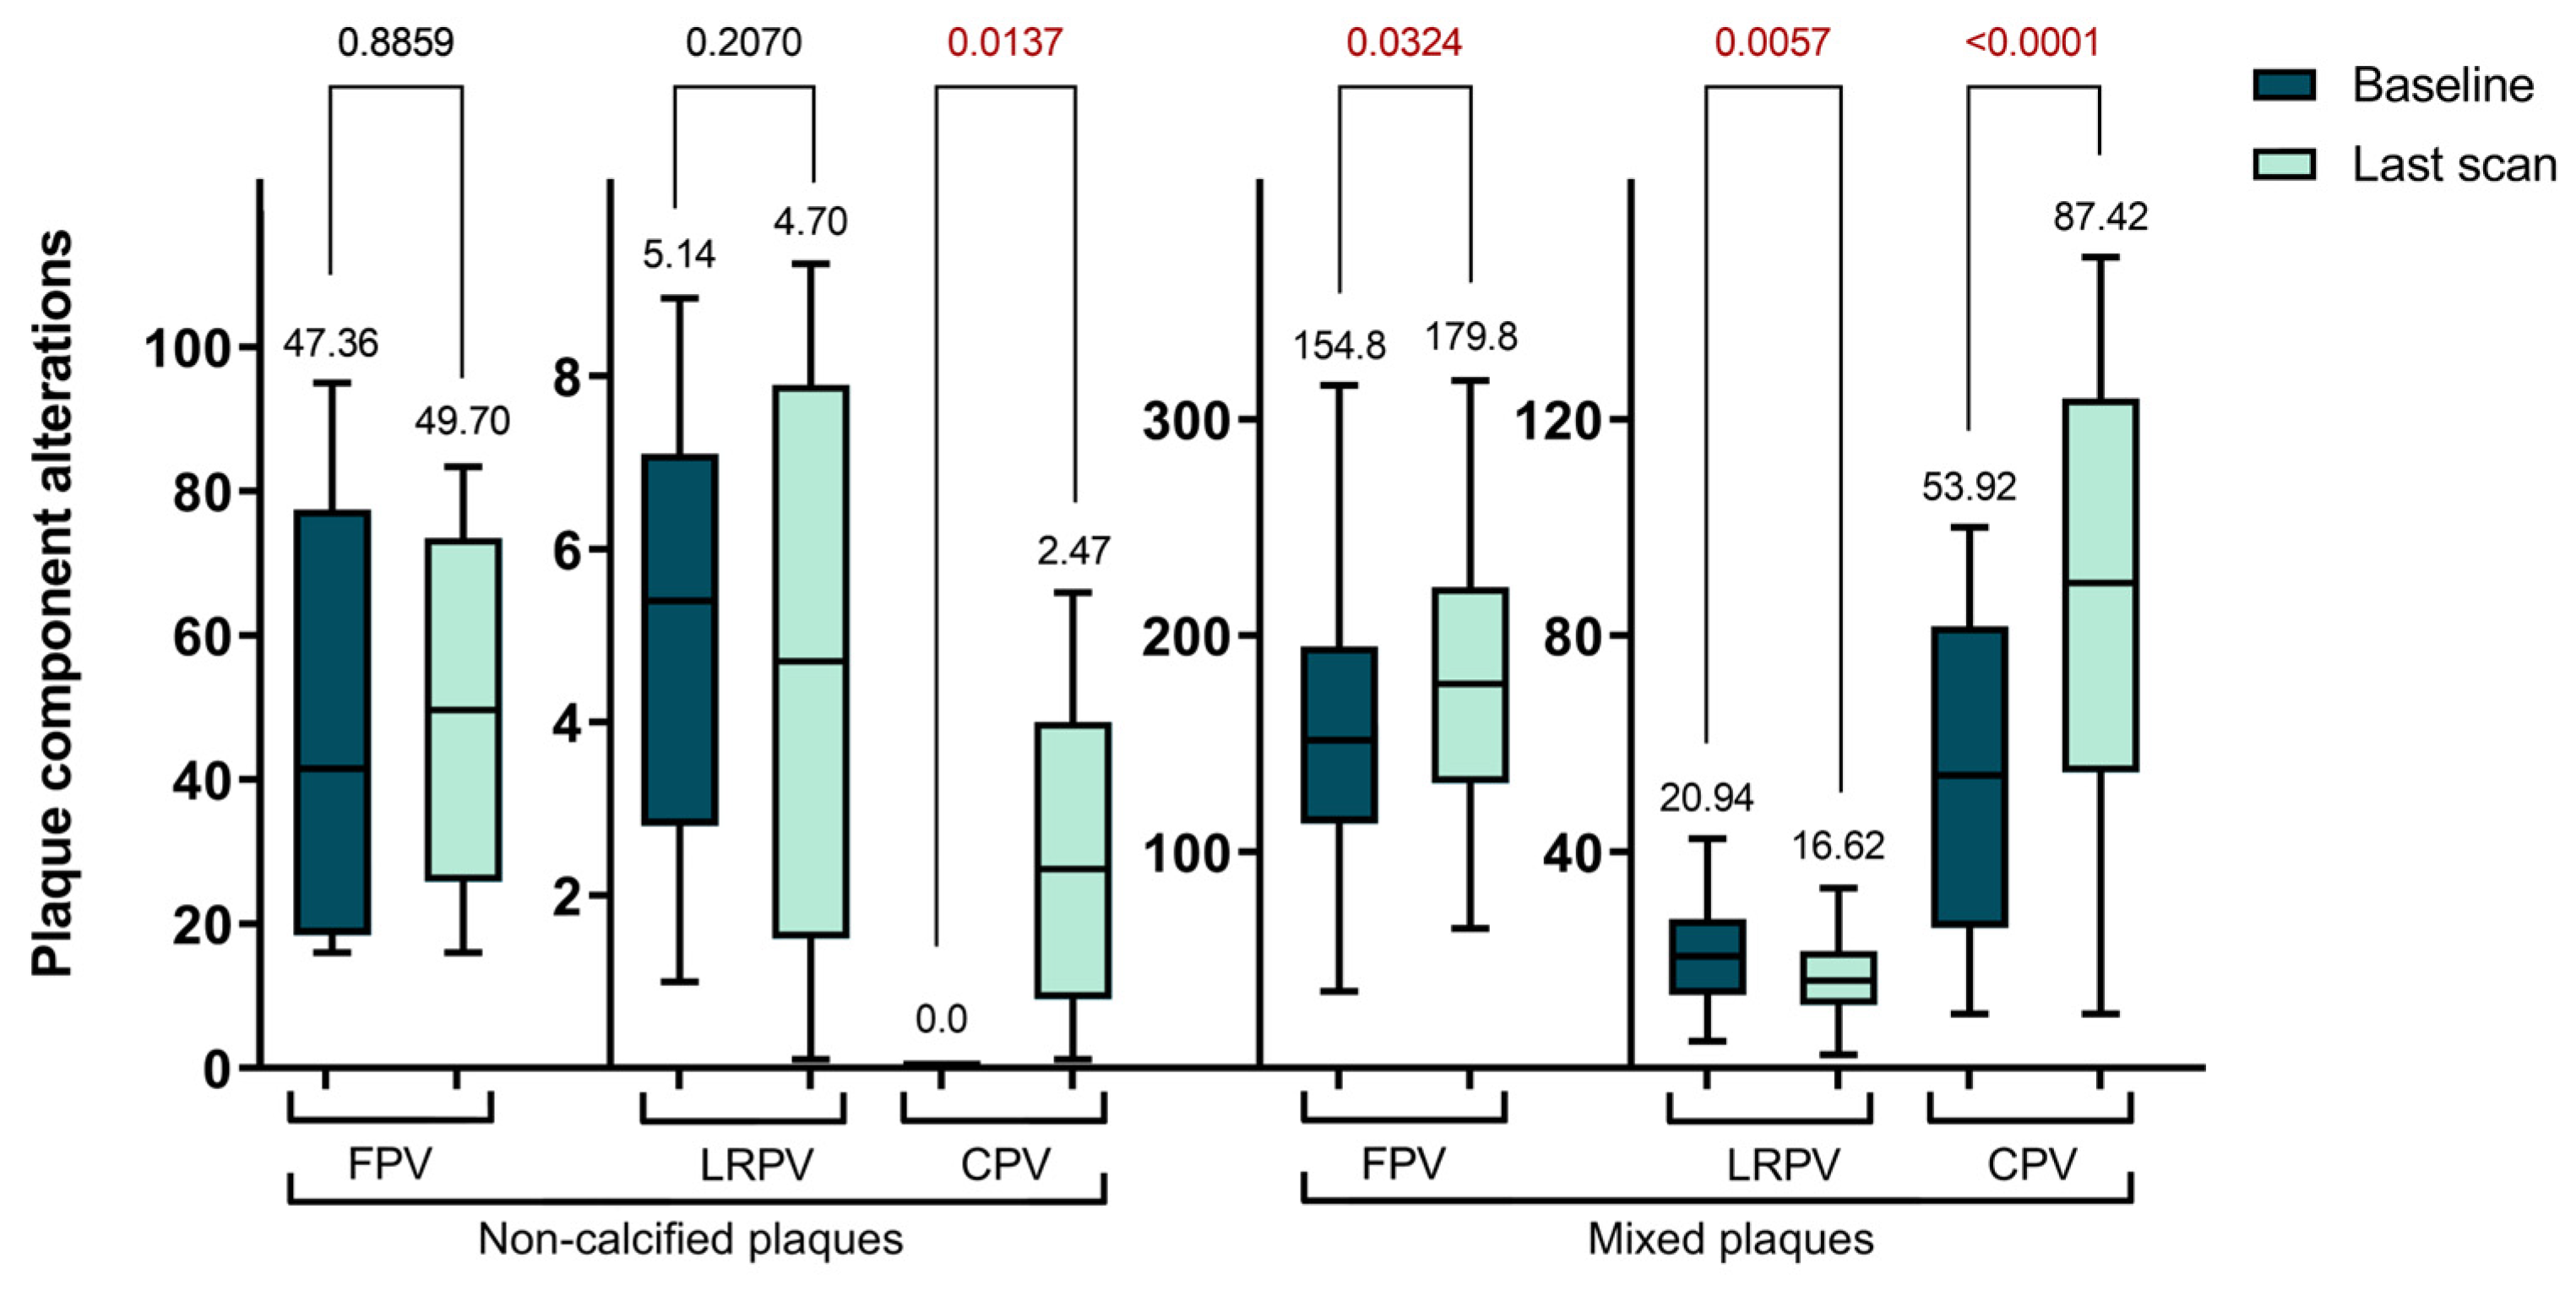
Figure 3.
A schematic illustration of a patient case showing a high baseline FAI-Score with subsequent reduction in vascular inflammation after three years of statin therapy, along with an analysis of changes in plaque composition over the same follow-up period.
Figure 3.
A schematic illustration of a patient case showing a high baseline FAI-Score with subsequent reduction in vascular inflammation after three years of statin therapy, along with an analysis of changes in plaque composition over the same follow-up period.
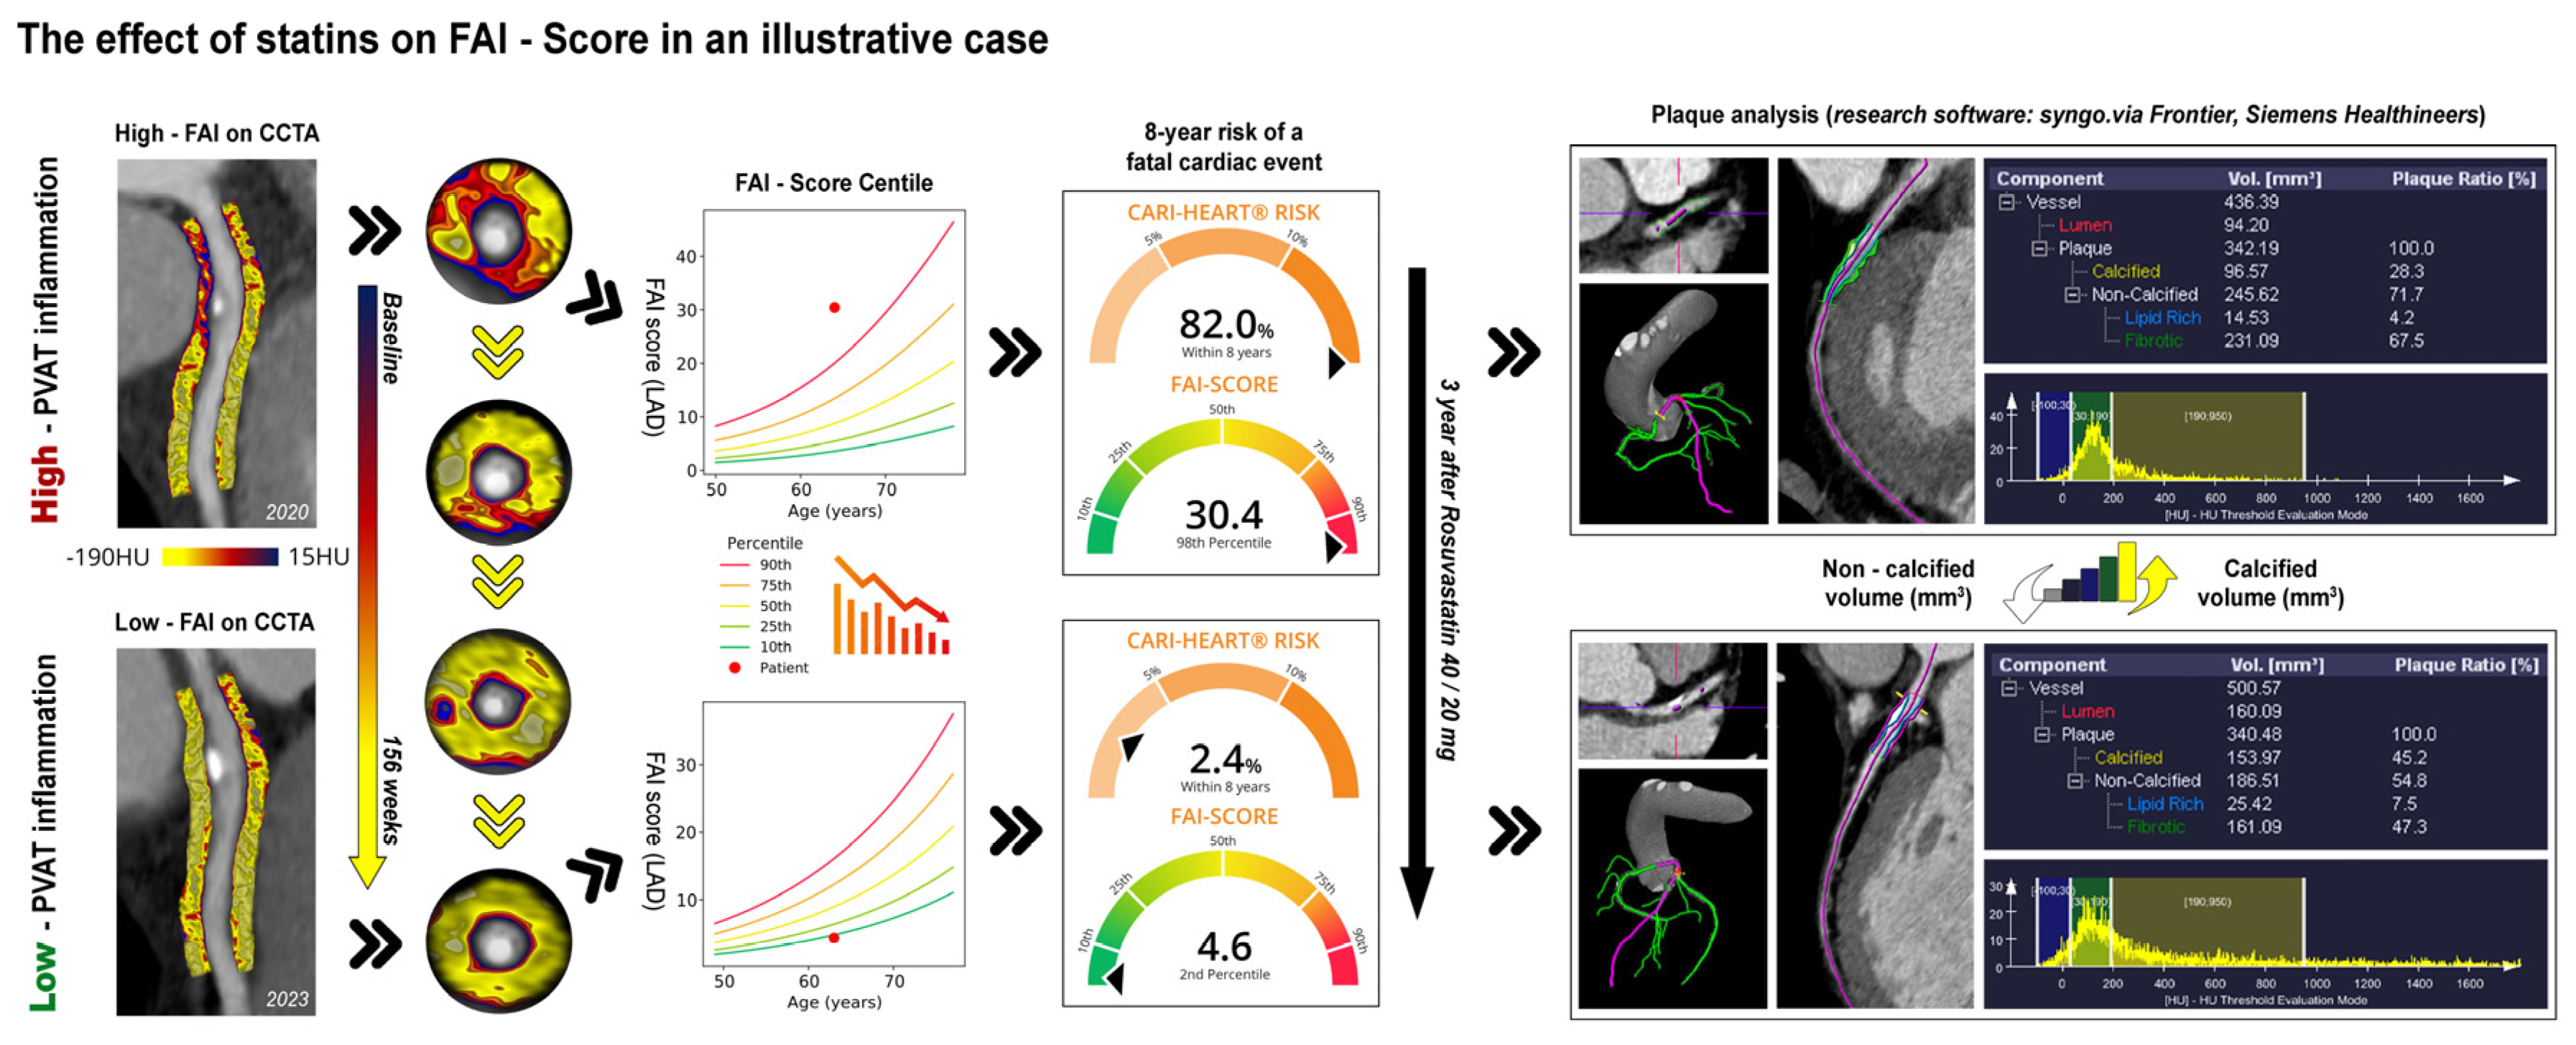
Figure 4.
Serial changes of lesion-specific PCAT-FAI before and after statin treatment during the scans.
Figure 4.
Serial changes of lesion-specific PCAT-FAI before and after statin treatment during the scans.
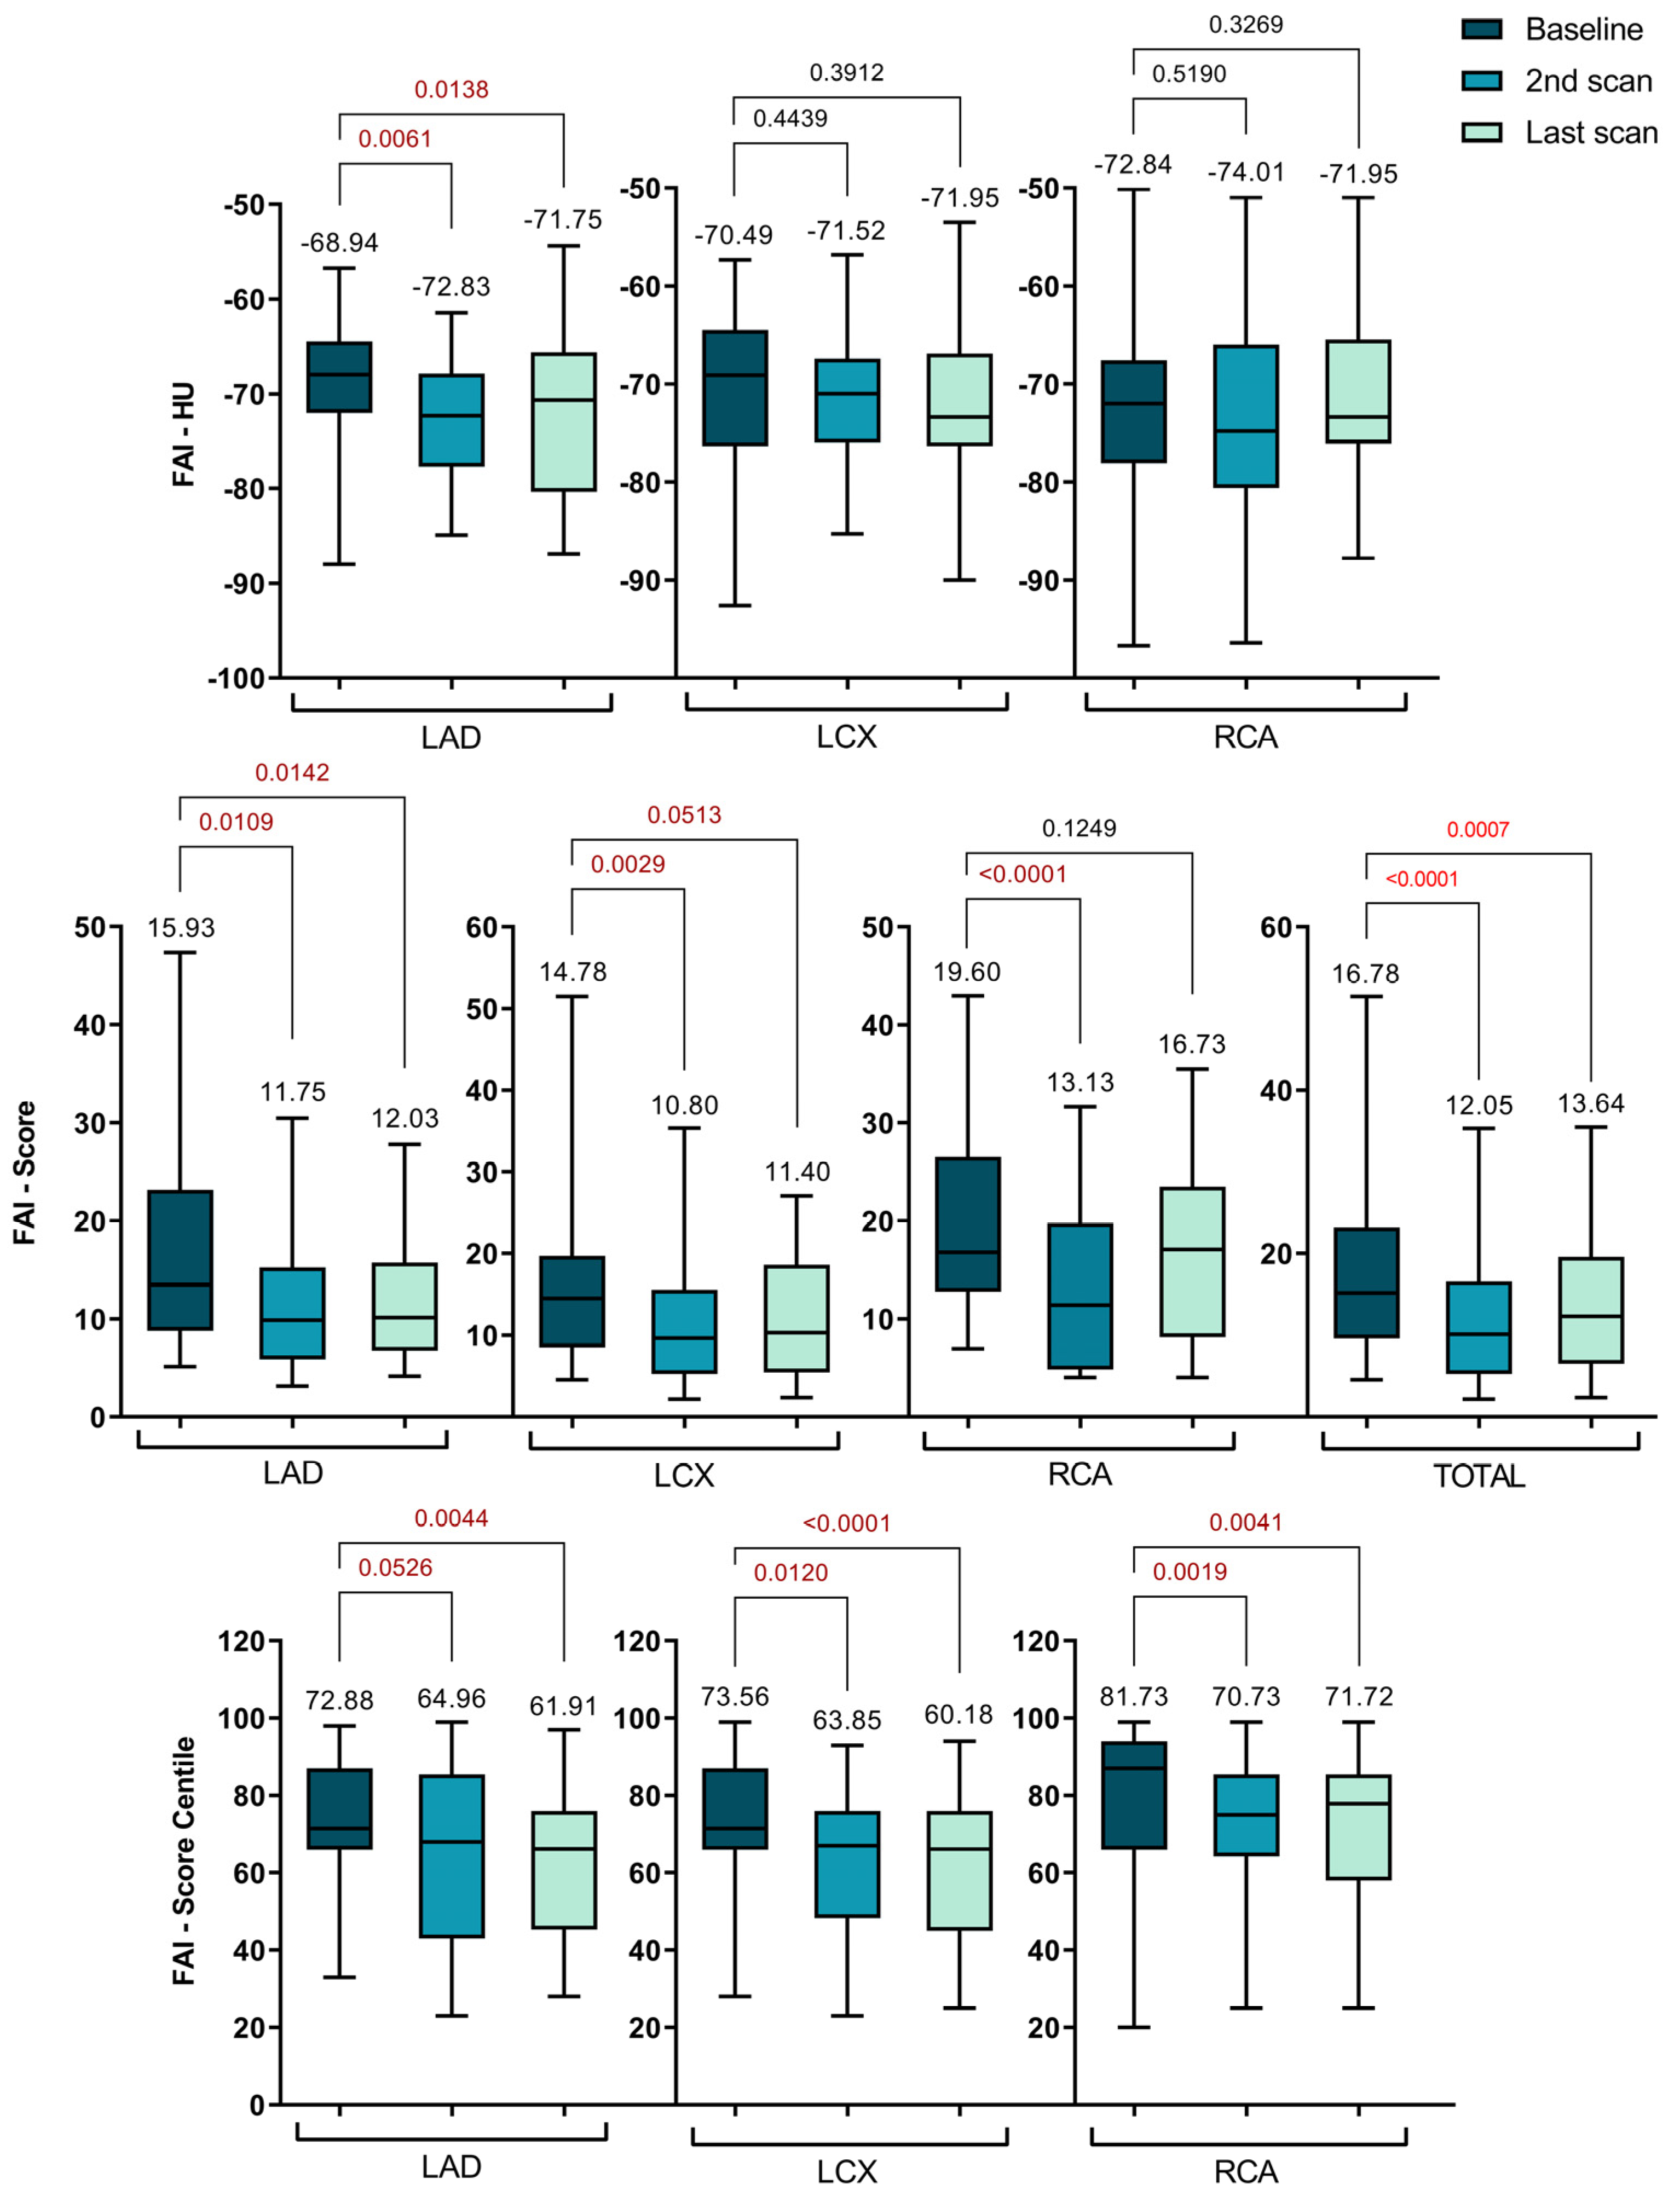
Figure 5.
Personalized CaRi-Heart® cardiovascular risk assessment.
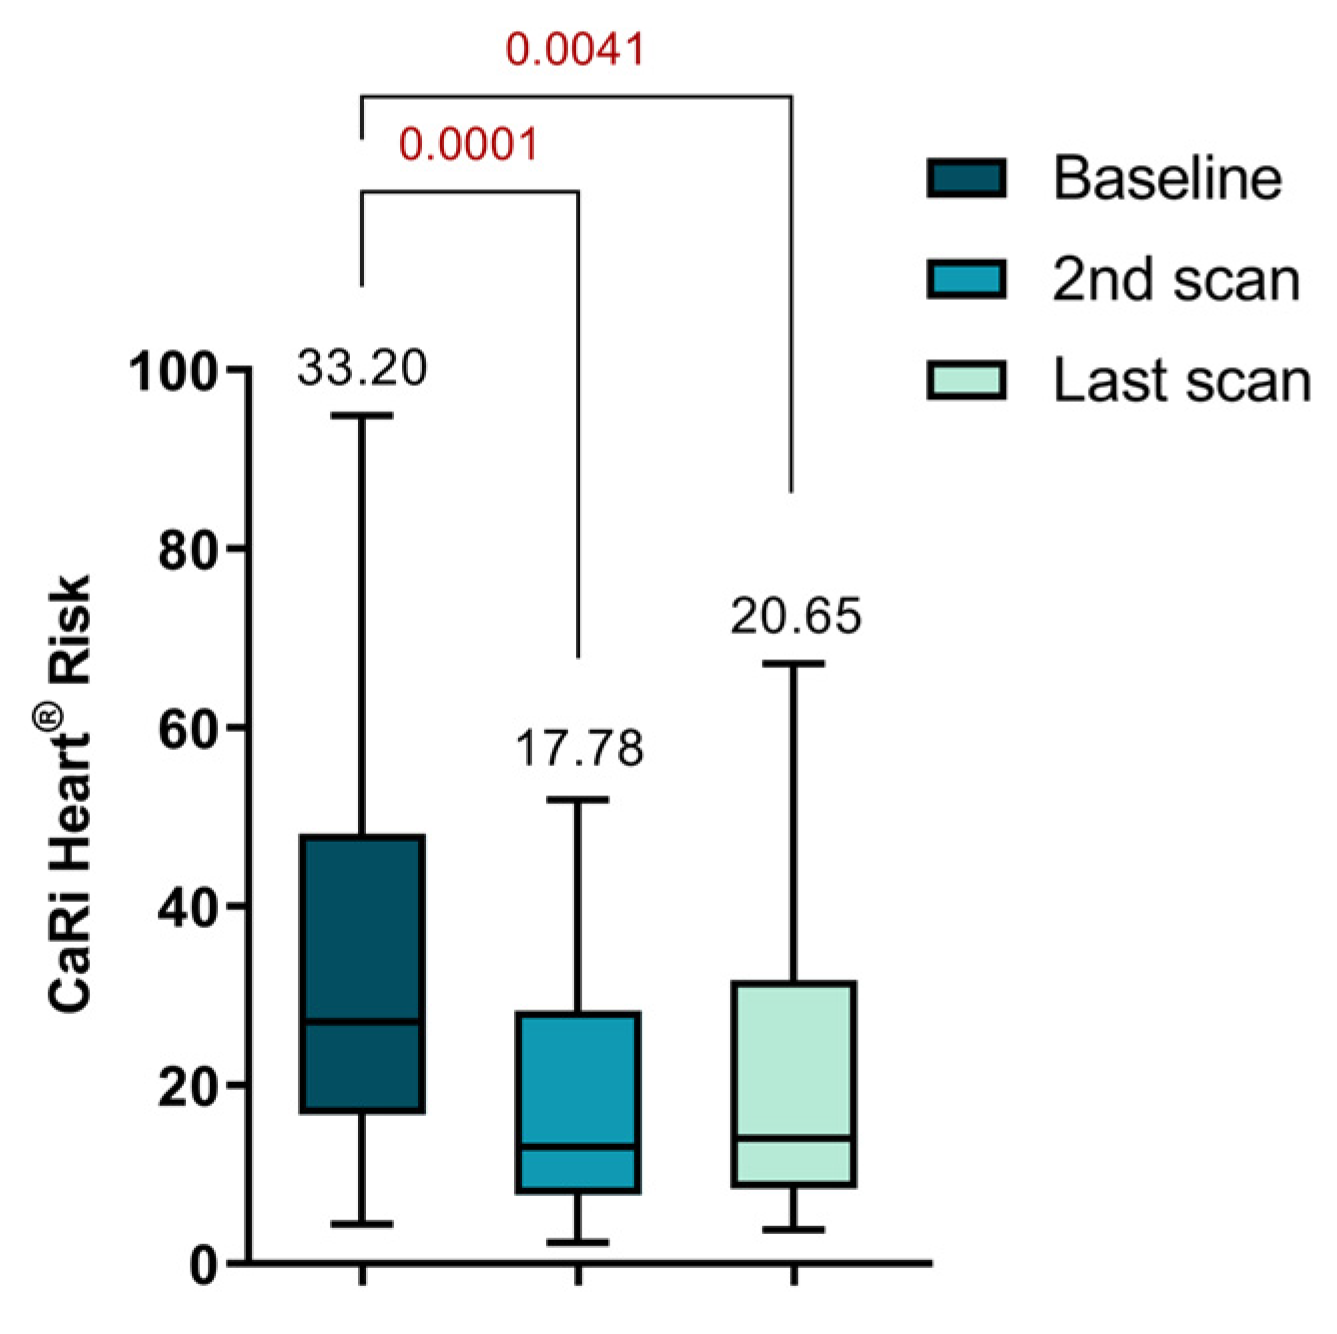
Figure 6.
Analyzing PCAT-FAI score in relation to plaque components using linear regression.
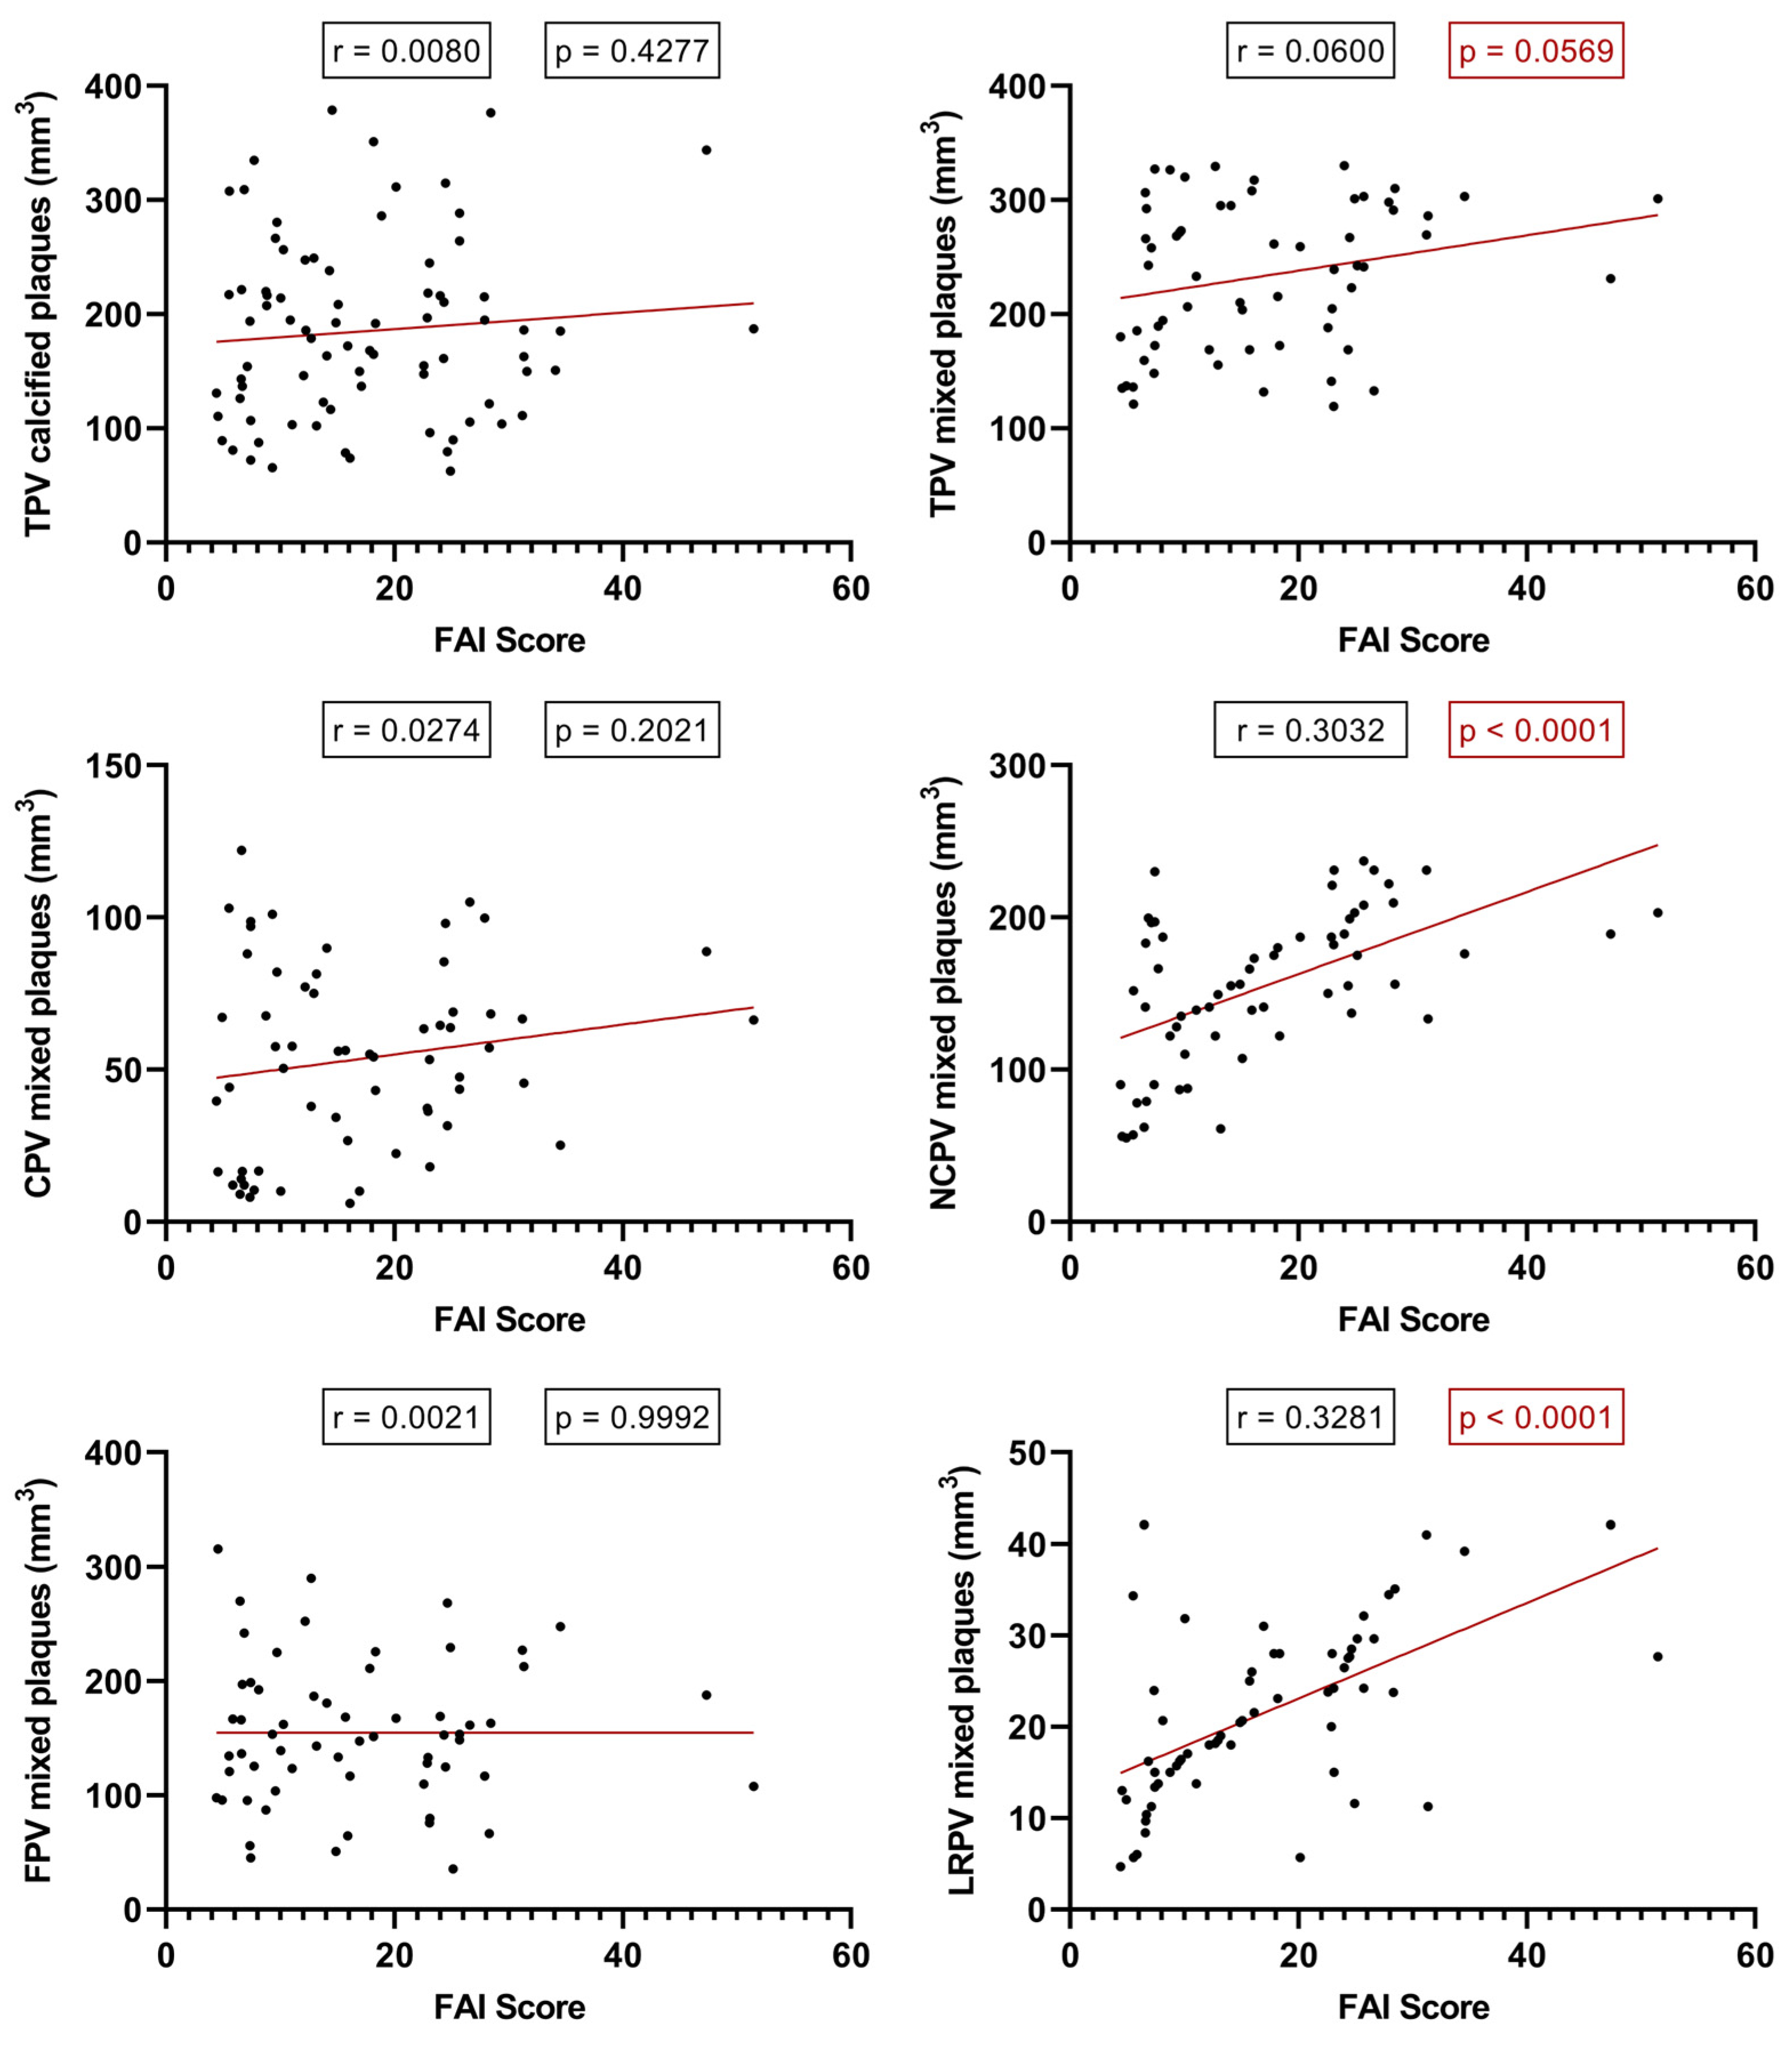
Figure 7.
Patient recruitment flowchart.
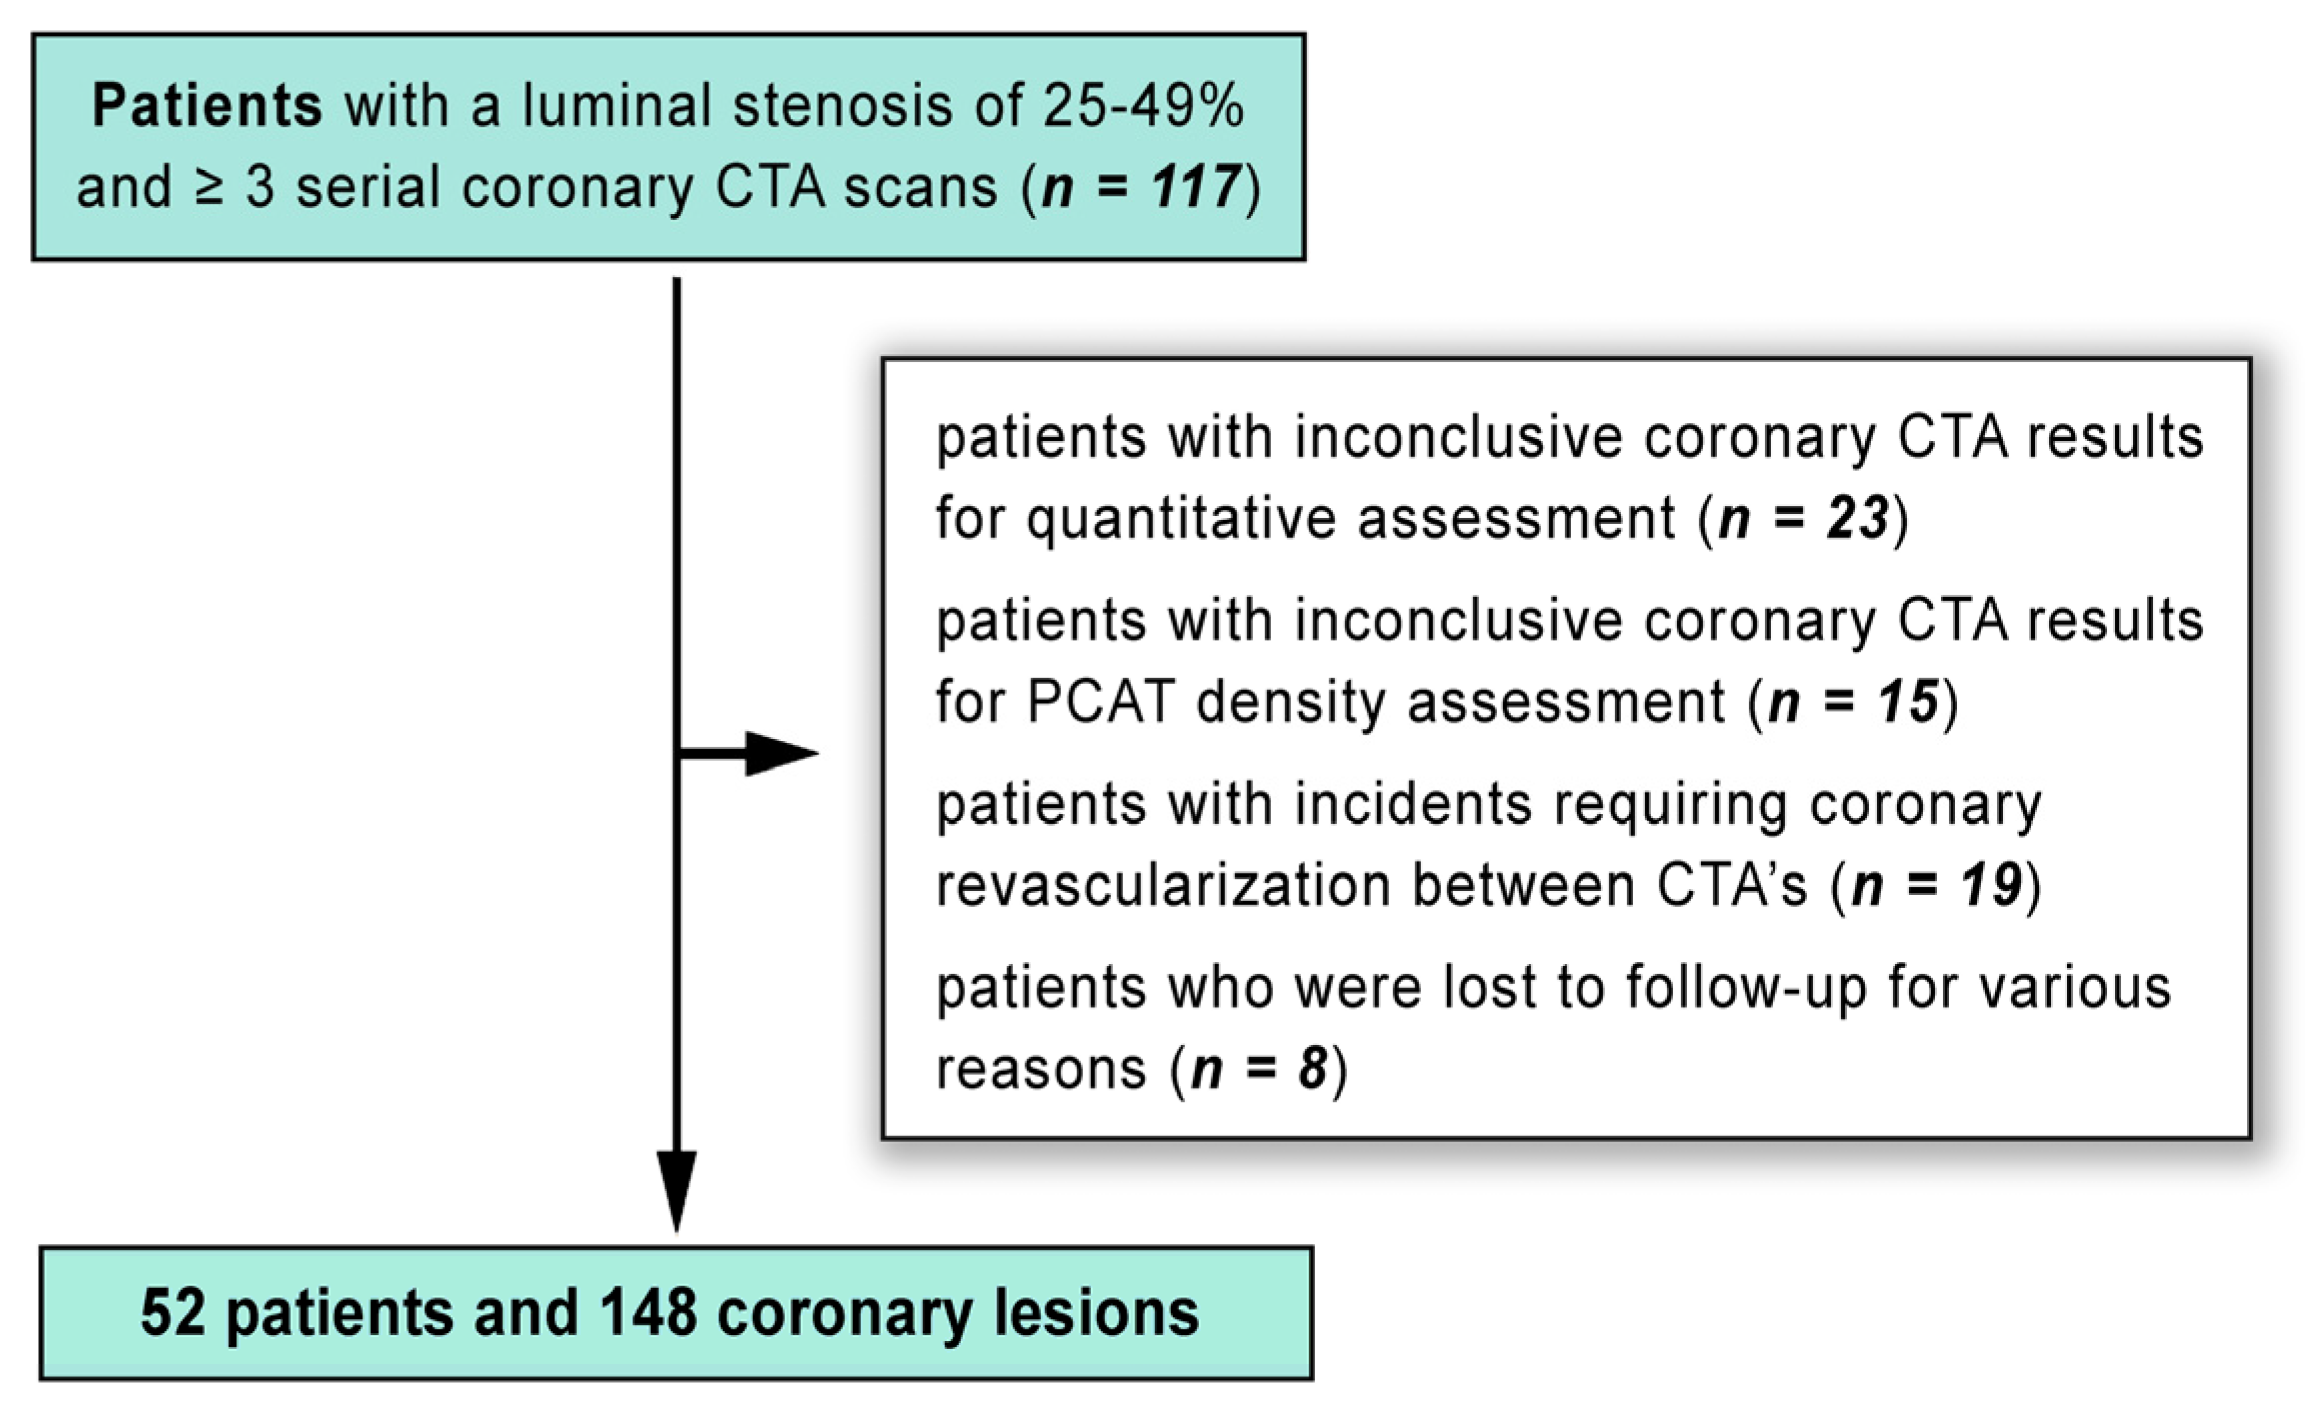

Table 1.
Clinical characteristics, comorbidities, and risk factors of the study population at baseline.
Table 1.
Clinical characteristics, comorbidities, and risk factors of the study population at baseline.
| Parameters | |
|---|---|
| Age at time of scan, year, mean ± SD | 60.43 ± 9.21 |
| Male gender, n (%) | 34 (65.38) |
| Body mass index (kg/m2), mean ± SD | 28.57 ± 4.36 |
| Time until the second CTA scan (days), mean ± SD | 372.4 ± 68.06 |
| Time until the last CTA scan (days), mean ± SD | 1103 ± 108.4 |
| LVEF 1 (%), mean ± SD | 48.21 ± 5.37 |
| Cardiovascular risk factors: | |
| Hypertension, n (%) | 44 (84.61) |
| Hypercholesterolemia, n (%) | 33 (63.46) |
| Diabetes mellitus, n (%) | 14 (26.92) |
| Smoking, n (%) | 9 (17.30) |
| Familial history of CAD 2, n (%) | 22 (42.30) |
| Plaque types: | |
| Calcified plaque, n (%) | 80 (54.06) |
| Non-calcified plaque, n (%) | 7 (4.73) |
| Mixed plaque, n (%) | 61 (41.21) |
| Lesion location: | |
| LAD 3, n (%) | 87 (58.78) |
| LCX 4, n (%) | 16 (10.81) |
| RCA 5, n (%) | 45 (30.41) |
| Calcium score, mean ± SD | 127.5 ± 72.96 |
| < 10, n (%) | 3 (5.77) |
| 10-400, n (%) | 36 (69.23) |
| > 400, n (%) | 13 (25.00) |
1 LVEF - left ventricular ejection fraction; 2 CAD - coronary artery disease; 3 LAD – left anterior descending artery; 4 LCX – left circumflex artery; 5 RCA – right coronary artery.
Table 2.
Comparison of lipid panel outcomes across various follow-up appointments.
| Lipid profile parameters | 1st visit | 2nd visit | p * | Last visit | p * |
|---|---|---|---|---|---|
| T-Cho 1 (mg/dL), mean ± SD, [95% CI] | 194.3 ± 66.76 [176.1 – 212.5] |
145.2 ± 34.7 [129.1 – 164.4] |
0.0003 | 150.7 ± 48.92 [137.3 – 164.0] |
<0.0001 |
| LDL-Cho 2 (mg/dL), mean ± SD, [95% CI] | 105.9 ± 33.97 [96.41 – 115.3] |
87.69 ± 32.99 [78.50 – 96.87] |
<0.0001 | 84.07 ± 32.16 [75.12 – 93.03] |
<0.0001 |
| HDL-Cho 3 (mg/dL), mean ± SD, [95% CI] | 38.11 ± 8.72 [35.68 – 40.53] |
47.10 ± 7.97 [44.88 – 49.32] |
<0.0001 | 50.01 ± 6.46 [48.21 – 51.81] |
<0.0001 |
| TGs 4 (mg/dL), mean ± SD, [95% CI] | 188.7 ± 66.01 [170.3 – 207.1] |
179.4 ± 59.49 [162.9 – 196.0] |
<0.0001 | 171.9 ± 53.76 [156.9 – 186.9] |
<0.0001 |
1 T-Cho – total cholesterol; 2 LDL-Cho – low-density lipoprotein cholesterol; 3 HDL-Cho – high-density lipoprotein cholesterol; 4 TGs - triglycerides
Table 3.
Comparison of plaque changes at the baseline and final follow-up appointments.
| Serial changes of plaque components | 1st Scan | Last Scan | p * |
|---|---|---|---|
| Calcified plaques (n = 80) | |||
| 1 TPV (mm3), mean ± SD, [95% CI] | 185.1 ± 78.70 [167.5 – 202.5] |
206.8 ± 86.03 [187.7 – 226.0] |
0.0773 |
| Non-calcified plaques (n = 7) | |||
| TPV (mm3), mean ± SD, [95% CI] | 57.23 ± 26.96 [32.30 – 82.16] |
55.51 ± 24.25 [33.09 – 77.94] |
0.9122 |
| 2 FPV (mm3), mean ± SD, [95% CI] | 47.36 ± 31.04 [18.65 – 76.06] |
49.70 ± 25.14 [26.45 – 72.95] |
0.8859 |
| 3 LRPV (mm3), mean ± SD, [95% CI] | 5.14 ± 2.65 [2.68 – 7.60] |
4.70 ± 3.34 [1.60 – 7.79] |
0.2070 |
| 4 CPV (mm3), mean ± SD, [95% CI] | 0 | 2.47 ± 1.89 [0.71 – 4.22] |
0.0137 |
| Mixed plaques (n = 61) | |||
| TPV (mm3), mean ± SD, [95% CI] | 237.4 ± 70.0 [219.5 – 255.4] |
256.9 ± 79.84 [236.5 – 277.4] |
0.1454 |
| 5 NCPV (mm3), mean ± SD, [95% CI] | 180.5 ± 66.81 [163.3 – 197.6] |
155.4 ± 59.51 [140.1 – 170.6] |
0.0209 |
1 TPV - total plaque volume; 2 FPV - fibrotic plaque volume; 3 LRPV - lipid-rich plaque volume; 4 CPV - calcified plaque volum; 5 NCPV - non-calcified plaque volume;.
Table 4.
Comparison of lipid panel outcomes across various follow-up appointments.
| Serial changes of lesion-specific PCAT-FAI | Baseline | 2nd scan | p * | Last scan | p * |
|---|---|---|---|---|---|
| FAI 1 HU 2 LAD, mean ± SD, (95% CI) | -68.94 ± 6.88 (-70.86/-67.03) |
-72.83 ± 6.29 (-74.58/-71.07) |
0.0061 | -71.75 ± 8.07 (-73.99/-69.50) |
0.0138 |
| FAI HU LCX, mean ± SD, (95% CI) | -70.49 ± 7.93 (-72.70/-68.28) |
-71.52 ± 7.09 (-73.50/-69.55) |
0.4439 | -71.95 ± 7.78 (-74.12/-69.78) |
0.3912 |
| FAI HU RCA, mean ± SD, (95% CI) | -72.84 ± 9.24 (-75.41/-70.20) |
-74.01 ± 9.17 (-76.57/-71.46) |
0.5190 | -71.23 ± 8.07 (-73.48/-68.98) |
0.3269 |
| FAI - Score TOTAL, mean ± SD, (95% CI) | 16.78 ± 8.76 (15.39 - 18.17) |
12.05 ± 7.88 (10.80 - 13.30) |
<0.0001 | 13.64 ± 8.00 (12.37 - 14.90) |
0.0007 |
| FAI - Score LAD 3, mean ± SD, (95% CI) | 15.93 ± 9.22 (13.36 - 18.50) |
11.75 ± 7.35 (9.70 – 13.80) |
0.0109 | 12.03 ± 6.27 (10.28 - 13.78) |
0.0142 |
| FAI - Score LCX 4, mean ± SD, (95% CI) | 14.78 ± 7.35 (12.72 - 16.85) |
10.80 ± 7.27 (8.75 – 12.84) |
0.0029 | 12.15 ± 7.51 (10.06 - 14.24) |
0.0513 |
| FAI - Score RCA 5, mean ± SD, (95% CI) | 19.60 ± 8.99 (17.10 - 22.11) |
13.13 ± 8.34 (10.80 – 15.45) |
<0.0001 | 16.73 ± 9.17 (14.17 - 19.28) |
0.1249 |
| FAI - Score Centile LAD, mean ± SD, (95% CI) | 72.88 ± 16.22 (68.37 - 77.40) |
64.96 ± 24.45 (58.16 - 71.77) |
0.0526 | 61.91 ± 17.96 (56.91 - 66.91) |
0.0044 |
| FAI - Score Centile LCX, mean ± SD, (95% CI) | 73.56 ± 15.60 (69.21 - 77.90) |
63.85 ± 16.32 (59.30 - 68.39) |
0.0120 | 60.18 ± 18.07 (55.15 - 65.21) |
<0.0001 |
| FAI - Score Centile RCA, mean ± SD, (95% CI) | 81.73 ± 13.61 (77.82 - 85.64) |
70.73 ± 18.98 (65.45 - 75.02) |
0.0019 | 71.72 ± 19.21 (66.37 - 77.07) |
0.0041 |
| CaRI Heart® Risk, mean ± SD, (95% CI) | 33.20 ± 22.07 (27.06 - 39.35) |
17.78 ± 13.41 (13.84 - 21.71) |
0.0001 | 20.65 ± 16.14 (15.96 - 25.34) |
0.0041 |
1 FAI - fat attenuation index; 2 HU - Hounsfield units; 3 LAD - left anterior descending artery; 4 LCX - left circumflex artery; 5 RCA - right coronary artery.
Disclaimer/Publisher’s Note: The statements, opinions and data contained in all publications are solely those of the individual author(s) and contributor(s) and not of MDPI and/or the editor(s). MDPI and/or the editor(s) disclaim responsibility for any injury to people or property resulting from any ideas, methods, instructions or products referred to in the content. |
© 2024 by the authors. Licensee MDPI, Basel, Switzerland. This article is an open access article distributed under the terms and conditions of the Creative Commons Attribution (CC BY) license (http://creativecommons.org/licenses/by/4.0/).
Copyright: This open access article is published under a Creative Commons CC BY 4.0 license, which permit the free download, distribution, and reuse, provided that the author and preprint are cited in any reuse.