Submitted:
03 January 2024
Posted:
04 January 2024
Read the latest preprint version here
Abstract
In this article, we combine datasets from multiple research projects and remote sensing tech-nologies to evaluate the conservation conditions of La Fortaleza de Kuelap, a pre-Hispanic monument in Peru’s northeastern Andes that suffered significant damage during historically high seasonal rains in April 2022. Our analyses seek to identify the main causes of the collapse and locate places where the monument is likely at risk of further deterioration. To do so, we model surface hydrology using a digital elevation model (DEM) derived from drone LiDAR data, re-construct a history of previous collapses, and calculate the volume of the most recent by fusing terrestrial LiDAR and photogrammetric datasets. In addition, we examine subsurface water ac-cumulation through electrical resistivity data, reconstruct the stratification of the monument from seismic refraction data, and analyze vegetation loss and ground moisture accumulation using high resolution satellite imagery. Our results point to water accumulation as the most significant source of risk for La Fortaleza’s perimeter walls. Combined with adverse contemporary conser-vation interventions and natural conditions, this led to the collapse of April 2022. This integration of analytical results demonstrates how multi-scalar and multi-instrumental approaches provide comprehensive and timely assessments of conservation needs.
Keywords:
LiDAR
; terrestrial laser scanning
; hydrological analysis
; electrical resistivity
; seismic refraction
; photogrammetry
; GIS
; near-surface geophysics
; close-range remote sensing
; risk map
; archaeology
1. Introduction
La Fortaleza de Kuelap––a large pre-Hispanic settlement constructed atop a massive walled platform at 3000 m above sea level ––is among the most impressive structures ever built by an Indigenous Peruvian society (Figure 1). Officially designated “La Fortaleza” (The Fortress) by Peru’s Ministry of Culture, it is one of several sites within the Kuelap complex, in the rainy tropical montane forests of the northeastern Andes. The monumental platform extends 550 m north-south along the crest of Cerro Barreta, with a maximum width of 150 m. Perimeter walls made of limestone blocks, weighing 300 to 2000 kg each, attain heights of 10-20 m. These walls enclose the mountain’s rocky summit and an additional 600,000 cubic meters of stone and clay fill that form a level surface for hundreds of stone structures. Late 19th century reports exaggerated La Fortaleza’s volume, estimating it at a total of 7,221,116 cubic meters, and prompting comparisons to the Great Pyramid of Cheops and allusions to the Tower of Babel [1] (p. 440-41).
Hyperbole aside, the monument strikes viewers as formidable. Atop the high platform surface, 5.11 hectares in size, a settlement of at least 420 circular habitations and five special purpose buildings fills almost the entire area [2-4]. La Fortaleza looms over a more extensive pre-Hispanic landscape today defined politically as the “Distrito de Tingo Anexo Kuelap,” where both ancient and contemporary hamlets, mortuary sites, and agricultural infrastructure spread across 450-500 hectares on a sloping plateau that juts out from Cerro Barreta and overlooks the Utcubamba River valley to the east.
Presently, Kuelap is included along with seven contemporaneous Utcubamba valley sites (Figure 2, 1-8), on Peru’s Tentative List for UNESCO World Heritage, as emblematic of “Chachapoyas culture,” a categorical name handed down from the Inka, corresponding to societies sharing a distinctive set of cultural attributes in the northeastern Andes. It is considered of outstanding universal value because it represents a most astonishing and singular achievement of a pre-Hispanic society. Further, La Fortaleza’s many stone circular dwellings unite design elements that characterize the architectural style for which the region is widely known [5]. As a major tourist destination in the Amazonas region, Kuelap is widely marketed as a “second Machu Picchu.” In 2017, the country’s first cable car was installed to afford rapid access to the site from the village of Nuevo Tingo [6], and visits boomed. Yet, as criticism mounted over the poor conditions of La Fortaleza, its main entrance or Acceso (Entryway) 1 in particular, visitor numbers fell by 2019, before the temporary closure brought about by the COVID-19 pandemic. The downward trend raised questions about the long-term sustainability of increasing tourism at the site.
The name “Chachapoyas” refers to autonomous societies living in Peru’s northeastern Andes, first conquered by the Inka, then by the Spanish. The name persisted to conveniently gloss-over differences between ethnic and kin groups in the region. Under Spanish hegemony, Chachapoyas came to fit European notions of geographic places with perceived territorial boundaries. Comentarios Reales, a popular chronicle written by “El Inca” Garcilaso de la Vega [7], reified the understanding of Chachapoyas as a place by describing its area as 50 leagues long (north-south) and 20 leagues wide (300,000 km2) based upon text provided by mestizo Jesuit Blas Valera, who grew up in the colonial town from birth in 1544 until the age of 15. Both the Inka and Spanish enlarged the province by annexing adjacent territories during their rule. By contemporary definitions, “Chachapoyas” can be considered a colonialist label. Despite a lack of sociopolitical unification, local societies are referred to as “Chachapoya” (the ‘s’ is dropped when referring to social groups, in order to de-Hispanicize the term). In any case, “Chachapoyas” is an eponym conveniently used to characterize societies deemed similar for the purposes of reference and/or imperial administration [8,9,10]. Unfortunately, we have little reliable ethnographic or ethnohistorical information to aid understanding of these groups, who experienced a rapid and nearly complete demographic collapse after their conquest [11,12], caused by European diseases, conscription by Inkas and Spaniards to fight wars, internecine violence, forced labor to bear cargo for El Dorado expeditions, and abuse by Spaniards who expected a continuing stream of tribute income despite shrinking numbers of Indigenous tributaries. Heightened violence, disease epidemics, and various forms of abuse typify sociopolitical processes at what Ferguson and Whitehead call “the violent edge of empire” [13]. This precipitous population decline allowed the tropical montane forests to quickly reclaim the land and conceal an ancient cultural landscape.
Today, seemingly invulnerable La Fortaleza faces a crisis. Between April 10th and 11th, 2022, during an anomalously high phase of the region’s heavy rainy season, a series of collapses brought down a large segment of its southern perimeter wall. Yet this was not an isolated event: our project has documented a long history of collapses, from a massive pre-Hispanic one involving the southeastern corner of the platform, to a series of other collapses documented in the last 100 years.
On March 31st 2013, a substantial, yet poorly documented collapse north of Acceso 1 (Figure 4), affected the eastern perimeter wall. It led to a restoration project; however, facing unexpected obstacles, the project was cancelled, leaving behind a massive, unfilled excavation and many mounds of exhumed construction fill that remain piled within the site to this day. According to reports from the Ministry of Culture, conservation conditions at La Fortaleza progressively worsened thereafter. Then, two earthquakes struck the region, on November 28th, 2021 (7.5 magnitude) and February 3rd, 2022 (6.5 magnitude). Mounting evidence of structural instability prompted authorities to declare La Fortaleza in emergency on February 12th. Two months later, a large segment of the monument’s southeastern perimeter wall collapsed after historically high precipitations, hastening the current crisis. Immediately, archaeologists and conservation practitioners advised that the structural deterioration and the threat of additional collapses required a pause in tourism inside La Fortaleza. Because it is the primary tourist attraction in the Amazonas region of Peru, this unavoidable decision resulted in substantial financial losses for the local and regional service economies.
With the goals of stabilizing La Fortaleza and resuming tourism, the Ministry of Culture has implemented emergency conservation measures, with three objectives: 1) immediately preventing additional collapses and mitigating ongoing structural deterioration, 2) evaluating water retention and drainage, and 3) identifying the proximate causes of structural failures. In this paper, our goal is to support these conservation efforts by systematically reviewing and analyzing existing and new datasets to identify the causes of La Fortaleza’s rapid deterioration. Specifically, we evaluate the hypothesis that the root cause of the collapses is the increasing moisture within the fill enclosed by its perimeter walls. We present a hydrological analysis of the monument’s surface, based on a Digital Terrain Model (DTM) generated from airborne LiDAR data. Integrated with the results of electrical resistivity surveys that identify pockets of high humidity within the platform’s subsurface construction fill, we use the hydrological analysis to generate a risk map. We propose that this product, and our several other observations on the conservation conditions of La Fortaleza, be used to guide short- and long-term mitigation solutions to improve its structural integrity and permit its sustainable public use. Our combined analyses demonstrate the potentials of integrating data acquired using near-surface geophysics and close-range remote sensing technologies to generate a more complete and nuanced understanding of risks that threaten La Fortaleza. Our results suggest that the current risks are the result not only of natural conditions and processes, but also well-intentioned yet ultimately damaging conservation interventions, and initiatives to reduce or eliminate the forest vegetation from the monument's surface.
In the remainder of this introduction, we summarize relevant environmental, archaeological, and historical literature, and provide additional cultural contexts with which to consider the analyses, interpretations, and conclusions to follow.
1.1. The land and the climate
The tropical Andean cloud forests and steep mountain terrain surrounding Kuelap are spectacular––these are lands of deep canyons and high mountaintops, with misty montane forest covering rugged slopes, where not deforested. While it may seem benign and majestic on sunny days, it is also subject to furious rain- and hailstorms, which can arrive with little notice––and with greater intensity during the rainy season between October and May. The effects of these storms are most violent (and dangerous) above 2,500 m above sea level, where they virtually liquify valley landscapes, swell rivers into torrents, produce flash floods, and trigger landslides. These not only impede travel but have wiped out homes and entire villages. Archaeologists refer to Chachapoyas montane forests as “Ceja de Selva” (literally “eyebrow of the Tropical Forest”), or the highland rim of Amazon rain forest. It is not possible to characterize the formation of cloud forest by describing the orogeny, atmospheric conditions, and biological systems in isolation. Its atmospheric and biological variables are interdependent, and the forest is the independent variable without which the affected area would dry-up.
La Fortaleza, our study area, is situated at UTM coordinates 18S 176537 E 9289675 N, and an elevation of 3018 m. Cerro Barreta, where Kuelap lies, is part of the Calla Calla Mountain range, which trends north and south above the Marañon River to the west, and above the Utcubamba River to the east as it descends 120 linear kilometers north-northeast to join the Marañon in the Huancabamba Depression lowlands (Figure 2). The geology of the Calla Calla range consists primarily of limestone, with karst features such as sinkholes and deep caverns. Politically, contemporary Kuelap lies in the Province of Luya near the southern boundary of Amazonas Department. Below we briefly offer some broader geographical information to place Kuelap into environmental and climatic contexts.
Langlois [14] (Figure 1, p. 221) was the first scholar to distinguish pre-Hispanic northern and southern regions of the Chachapoya culture area as delineated by Garcilaso de la Vega. Kuelap lies within the northern region, which begins in the Utcubamba headwaters and encompass the Utcubamba and Sonche river valleys. The divide’s location at latitude 6°58’ S approximates the boundary between Amazonas and La Libertad regions, as well as orogenic and geological transitions. It also coincides with a cultural boundary separating Chachapoyas architectural traditions in the north, from more varied traditions in the south, many of which do not resemble those of the Utcubamba valley. Montane and premontane forested regions on the adjacent eastern Andean slopes have harbored sociopolitical groups settled within San Martín region.
Steep topography and variable weather patterns produce a diverse mosaic of ecological zones, with a minimum of 84 of the 103 life zones of the world’s Holdridge life zone biogeographic classification system [15]. Major life zones include high-altitude grasslands (paramo/jalca), humid, and perhumid tropical montane forests, and arid forests at the lowest altitudes. Broken landscapes often thwart connectivity, and high levels of species endemism render the region a biodiversity hotspot.
Abundant precipitation surrounding northern Chachapoyas results from orogenic lift as easterly winds cross the Amazon basin and encounter the eastern Andean slopes. Condensation above 2500 masl creates an altitudinal belt of fog where forest vegetation intercepts moisture and, because transpiration exceeds evaporation, the cloud forest formation is sustained [16]. The same dense clouds flow into the Utcubamba and Marañón river valleys to envelope Kuelap and mountaintops farther south. Deforestation eliminates the key variable of transpiration, and cloud forests deteriorate as they dry up. Such conditions result in drought and endangerment of forest species, unable to adapt quickly and keep pace with biogeographical change, especially at tree lines [17].
Mean annual temperatures at these elevations are estimated from 7 to 15 °C. Annual rainfall numbers from the few meteorological stations in the region represent only vertical rainfall, not moisture resulting from the transpiration of local vegetation, which is largely responsible for the low clouds. As a result, the stations underestimate area humidity and atmospheric saturation. According to geographer K. Young [18,19], a reasonable estimate may be 2500 – 3000 mm yearly, at least between extreme events. Rainy season storms bring lightning and frequently cause landslides that have historically taken many lives, such as in the destruction of the nearby town of Tingo in 1993. Given these weather patterns, it is not surprising that La Fortaleza appears timeworn.
Evidence that the Utcubamba valley was deforested and cultivated on terraced slopes has been gathered and analyzed by Plekhov [20] and colleagues, but the extent of such landscape transformation remains unknown. A longitudinal analysis based upon ground-level fieldwork with subsurface sampling of walled and unwalled terraces allowed an estimate of terrace construction and use beginning by AD 1, which coincides with a proliferation of Early Intermediate Period occupations throughout the region [9,21]. Records of climate and environmental change analyzed by climatologists and paleoecologists provide indications of substantial regional climate change over time. Oscillations have been registered through analyses of speleothems that show signals of more humid conditions during the peak of the Medieval Climate Anomaly around AD 950, and drier conditions become the pattern around AD 1300 and the beginning of the Little Ice Age [22]. Approximate correlations of paleoenvironmental change detected in sediment cores from places such as the Lake of Condors [23] with inadequately-documented trends in cultural developments warrant future investigation. Short and long-term wet and dry periods likely provoked changes in patterns of settlement and mobility [24], as changes in moisture levels impacted natural resource distribution and locations where agriculture was possible.
The first Spanish chronicler to arrive in the Utcubamba valley with the aim of providing a first-hand description was Carmelite Friar Antonio Vasquez de Espinoza, who visited the area in 1615 [25]. His work includes references to Corregimientos and Curates, some of which he visited. However, he arrived too late to provide substantial ethnographic information as Indigenous social institutions had crumbled amidst continued depopulation. He wrote, “the country contains few Indians at present, many having died off and others gone over to the hostile region" (i.e., taken refuge in the free lands to the east in the Amazonian forests). He also observes that, “there are very rich gold mines… but for lack of labor, these are not working” (p. 404). Vasquez de Espinosa often comments that the province “is heavily wooded” (pp. 403, 405). Plekhov’s analysis of pre-Hispanic terraforming and cultivation in the once-densely-populated Utcubamba valley, combined with Vazquez de Espinosa’s description of the same landscape ca. 84 years after the Spanish incursion, illustrates the rapid tempo of population collapse and regrowth of montane forests. Regional population numbers did not rebound until the 19th century, by which time most of the depopulated Utcubamba valley would have become densely (re)forested.
Today, climate change continues to impact both landscapes and livelihoods. Weather events are expected to intensify. Climatological studies document increased temperature and rainfall in this part of Peru over the past 50 years, with trends varying seasonally and by metric [26]. At La Fortaleza, a study conducted as part of our broader research project documents an increase in precipitation over the period 1981-2022, and in particular, a historically high phase at the time of the 2022 collapse [27]. Interdisciplinary studies are documenting the upward migration of the cloud belt and considering its consequences [28,29]. Highland farmers are already struggling to schedule their planting and harvest seasons as weather patterns become less predictable.
1.2. Kuelap: First encounters
If there is such a thing as a “lost city,” Kuelap was never one of them. Upon arrival to the region in 1535, Spanish soldiers led by Captain Alonzo de Alvarado explored the countryside. From 1535 to 1540, literature including calendrical dates for particular events often contradict one another, although two documents, both probably written by Juan de Alvarado ca. 1555 and reproduced in works by Cieza de Leon [30] and Jimenez de la Espada [31], provide a sketch of significant events. By late 1536, a Spanish sortie departed north to “pacify” other groups and claim more territory for Spain. Marching northward along the Calla Calla mountain range above the Utcubamba River, the soldiers skirmished with groups that would have included the Chillao (later called the Luya-Chillao) whose ancestors were the most likely builders of Kuelap [3] (p. 141). The names “La Fortaleza” and “Kuelap” do not appear in these documents. While the name “Cuelap” appears in many colonial period documents, there is no written evidence that early Spanish colonial chroniclers knew of La Fortaleza. For this reason, Adolph Bandelier, the first professional archaeologist to visit the site and submit a report in 1893, believed it to have been abandoned before the first such invaders arrived in 1535 [32] (pp. 19-20). Early historical documents refer to Kuelap as an estancia or hacienda (both terms meaning “ranch”), and this is likely how the colonists understood the name. At the regional level, La Fortaleza evidently receded into a dim memory, but it was never “lost” and likely remained known to local people.
In 1538, the Spaniards united at their first colony at La Xalca (La Jalca) and formally divided the former Inka Province of Chachapoyas into repartimientos (rights to a specified share of Indigenous labor and land). Alonso de Alvarado claimed Kuelap along with other large repartimientos for himself [33,34] (Alvarez [1572] Document No. 6 in [33]; Biblioteca Nacional de Lima [1577], Appendix 14 in [35]). Judging La Xalca unsuitable, the Spaniards quickly relocated to Levanto, a centrally-located place controlled by Indigenous allies hypothetically belonging to a Chacha ayllu who controlled the locality. That Alvarado took Kuelap for himself indicates that he knew that the place was inhabited by a large Indigenous population and was highly regarded as productive.
Although there is no mention of Kuelap in Colonial period chronicles, publications based on research in regional and national archives show Kuelap listed as a repartimiento until the 1570s’ implementation of Viceroy Toledo’s program of Reducciones (forced relocations) when its residents were ostensibly relocated to Santo Tomás de Quillay. If the settlement of Kuelap was ever fully abandoned, it was soon repopulated. By the end of the 16th century legal records of civil affairs document the buying, selling, and transferal of properties such as Kuelap among Spanish colonists. Transactions identify Kuelap variously as “la Estancia, la Hacienda, el Fundo, and Los Corrales” de Kuelap (all terms signify “ranch”) and must refer to today’s Anexo Kuelap, where slopes east of the monument are well-suited for pasturing livestock and farming. By means of archaeological investigations, evidence of a single, remarkable 16th century violent event was uncovered at the southern end of La Fortaleza, and the finds have been analyzed and published. Toyne and Narvaez examined artifacts and skeletal remains of 106 individuals, nearly all young and middle-aged males showing unequivocal signs of death by execution [36,37]. All were victims of a mass-killing event that a few colonial period artifacts indicate took place not long after the Spanish intrusion. The authors suggest that the bloody event occurred at the time of Viceroy Toledo’s reduccion program ca. 1570. However, the calendar date remains uncertain. During this time, viceregal envoys were likely moving through the region, taking a census, and enforcing the new program. Bandelier’s suggestion that La Fortaleza was abandoned at this time might still be correct if we postulate that the victims of the killing were seeking refuge within.
In 1843, more than two and a half centuries after the invasion, civil magistrate Juan Crisóstomo Nieto [38] set out to resolve a conflict at the “Estancia de Kuelap” but returned to write about the spectacular ruins he had observed on the site. After his eventful visit, he recorded the Case number as Exp. 4347 now referring to “las tierras de la Fortaleza de Kuelap” [39]. Guided by Don Gregorio Rodriguez, who was likely the hacienda caretaker, Nieto wandered through La Fortaleza, estimated the monument’s dimensions, and recorded his observations. His report was published without much fanfare in news media in Perú and abroad and later reproduced by Modesto Basadre of Sociedad Geográfica de Lima, who republished Nieto’s original report with exaggerated editorial pronouncements declaring that La Fortaleza was nearly three times larger than that of Cheops, the Great Pyramid of Egypt [1]. Traveling explorers including Raimondi, Werthemann, Middendorf, and others visited the monument during subsequent decades. These travelers reached “Kuelap,” the hacienda that was a cluster of small houses beneath La Fortaleza [40]. A few years later, Bandelier [32] would learn that the hacienda settlement was named Lirio, which likely corresponds to the present-day village and archaeological sector of the same name (Figure 5).
At this juncture, we might ask how a monument that Basadre compared to Cheops could remain obscure for three hundred years? As previously stated, Kuelap was never “lost” in any non-colonialist sense. As noted above, Bandelier offered his opinion that La Fortaleza was abandoned prior to the Spanish incursion. He was referring to the monument and not to the hacienda lying less than one kilometer to the east [32]. Bandelier’s interpretation finds support in the lack of references to the monument by the Spanish colonists. Furthermore, the monument was so concealed by vegetation that, from the hacienda, Middendorf did not see it until La Fortaleza was pointed out to him. Then he recognized that the base of the walls lay hidden behind the forest (Figure 3), and the tops of the walls were hidden by overhanging trees [41] (p. 216). The descriptions in much of this literature include observations that hacienda residents regarded La Fortaleza as a dark and fearful place where human bones and other remains, fallen from fractured interments within the walls, lay strewn on the ground [32,38]. Residents of the hacienda below referred to La Fortaleza by various names including Muralla, Malca, Muro, and others [32,42]. Middendorf observed that villagers feared that La Fortaleza was haunted by ghosts. During his visit to Kuelap and La Fortaleza several years later, Alayza’s took special notice of La Fortaleza’s dense cover of thick vegetation [43]. His final report concluded with his personal, more visceral, opinion:
The compact forest in and around the upper part of the building gives it such a wild, strange, and sinister appearance that not without a certain fear can the traveler go into it. And this dread increases as the absolute lack of life, not even of a bird or reptile, gives animation to the somber building [43] (our translation).
Neither La Fortaleza’s “ghosts” nor its thick cloak of dense forest adequately accounts for the monument’s centuries of obscurity, although these factors must have contributed. It remains uncertain whether local villagers understood the interest that La Fortaleza might hold to more worldly “outsiders.” Nieto’s first written documentation of the monument in 1843 likely precipitated an increase in looting over subsequent decades. Late 19th and early 20th century scholars who visited Kuelap noted active looting at the site and some, like Alayza [43](p. 157), Nieto, and Don Gregorio Rodriguez, carried away human remains and grave goods as souvenirs.
Since the colonists first settled, internecine and regional conflicts among Indigenous groups swirled around the settlement for many years preceding 1570 and after Toledo’s reducciones as well. Texts from the earliest town council meetings (called Cabildos) include calls for help from coastal authorities. Residents expressed worries that Alonso de Alvarado and his military presence were needed, but he was usually engaged elsewhere fighting in wars between the Spaniards. By 1541, Alvarado had settled in Huamanga far to the south and did not return. During the mid-1540s, colonists became increasingly alarmed at the inexorable shrinking of the Indigenous population. Considering the chaos during the first colonial decades, it should not be surprising that we lack useful, first-hand descriptions of Chachapoya cultural traditions. Blas Valera was born almost 10 years after the Spanish arrival, and his cursory descriptions conveyed by Garcilazo were based on local oral histories and memories that Valera put to paper at an advanced age [8].
1.3. The Chachapoya: A brief history and archaeology
Scholarly understanding of the Indigenous history of the Utcubamba valley region relies on both documentary sources and archaeology. Unfortunately, the only eye-witnesses to events during the prolonged efforts to subjugate the Indigenous peoples under rapid sociopolitical disintegration and population decline were Spanish soldiers and their families, and a small number of landless citizens who rarely left the safety of their homes at Levanto. The most influential chronicle with text directly related to Indigenous Chachapoya history and culture is still the combined work of “El Inca” Garcilaso de la Vega [7] and Blas Valera. However, this account misleadingly characterizes the Chachapoya as a unified nation prior to Inka conquest. Documentary information published by Espinoza [33] and many others contradicts the Valera-Garcilazo narrative on several points [8]. Some scholars have described Chachapoya societies as joined in a confederacy that occasionally united against external threats. However, there is no evidence that named social groups ever joined forces on any significant scale. Furthermore, the Valera-Garcilazo account describes Inka Topa Yupanqui’s northward penetration of the region along the easternmost cordillera as a series of isolated battles fought at every major population center between Pias in the south and Levanto. Evidently, Topa Yupanqui’s invasion battled at least five independent ayllus during his northward march. The testimonies reported from mid-15th century documents published by Espinoza describe autonomous sociopolitical groups that may have had egalitarian elements.
Some archaeologists presently argue in support of a pre-Inka Chachapoyas “state” centered at Kuelap [36,44]. Lacking a contemporary theoretical framework along with peer-reviewed data to consider, especially published primary data from Kuelap, it is more likely that Chachapoyas specialists will continue to regard the region and its pre-Hispanic peoples as belonging to numerous, autonomous sociopolitical groups prior to successive Inka and European invasions [5,8,33,35]
Today, genetic evidence suggests long-term autochthony in local Indigenous populations, to the extent that their genome can be distinguished from those of highlanders and lowlanders, but with significant mixing attributable to thousands of years of families and communities entering the region. Late pre-Hispanic incursions, chaotic conquests, and immigration in more recent centuries have also been identified during rigorous genetic analyses of local and non-local populations [45-47]. Non-Quechua family and place names preserve elements of a substrate of pre-Inka local language(s) that linguists have been recovering and reconstructing, and using to hypothesize affiliations with other language groups and families [48-52].
Salient evidence of the region’s sociopolitical history before the Inka invasion consists of hundreds of archaeological sites large and small, typically located on hilltops and high ridges. These settlements consist of mostly circular stone houses with average diameters between 6 and 8 meters, clustered on terraces leveled to create space for daily activities and social interaction. The numbers of structures found within each settlement vary, but some of the largest settlements, such as Yalape, La Xalca, and Olan, lie on the eastern Utcubamba slopes, facing Kuelap, and encompass upwards of 300-500 dwellings. Some houses exhibit stone cornices, stairways, and niches, and feature structurally incorporated embellishments with carved tenoned heads, bas relief slabs, and geometric friezes using inlaid stone slabs. The variability of quality and elaboration of the stone houses probably correspond to status differences and differential abilities of their owners to muster sufficient labor and other resources [53]. While a great deal more research is needed to explore regional chronologies, regional populations were likely organized in mobile and semi-sedentary families and communities. Hilltop settlements of stone apparently increased slowly in number after AD 800 and 900, and proliferated by AD 1200, as did mortuary practices of interring the dead in cliff tombs, perhaps signaling information regarding territories [54,55,56]. Interments deep within caverns are more difficult to interpret.
Archaeological fieldwork in the region throughout the 20th century was sporadic, and useful results were relatively scarce and/or lacking critical details and precision compared to that in other Andean regions. Until the mid-20th century, most archaeologists were convinced that the presence of abandoned settlements and other cultural remains in the cloud forest of Chachapoyas could best be explained as evidence of late pre-Hispanic agricultural colonization by highland polities seeking access to forest resources [57] or society-level migrations eastward by populations responding to demographic pressures [58]. Both interpretations were built on the assumption that all eastern montane forest occupations were subsidized highland colonial enclaves. The speculations were called into question when another generation of archaeologists began to conduct systematic research and present published data [8,59]. Foreshadowing new methods and interpretations to come, Peruvian archaeologist Arturo Ruiz Estrada excavated below a house’s foundation on the northern edge of Kuelap’s Pueblo Alto sector, where he encountered a large assemblage of cultural remains predating the ubiquitous Chachapoya stone constructions [60]. The deposits of unexpectedly early remains continued several meters to bedrock, and Ruiz recovered thousands of pot sherds, burnt animal bones, stone artifacts, and uncovered a fire hearth and a buried floor. The continuity of pottery types suggests that there was no population replacement. The achievements of Ruiz were not immediately recognized, but soon other archaeologists were locating surprisingly early pottery beneath stone architecture, in middens, and on open ridgetops at similar elevations, eventually leading professional archaeologists to discard migration hypotheses.
At present, a full and nearly continuous archaeological record of human occupation dating back to the terminal Pleistocene is under development as the expansion of modern infrastructure makes many previously sites more accessible and still others are uncovered and identified as deforestation advances. This once-forested and forgotten region is currently being repopulated by peoples of varying origins. Unfortunately, a new wave of agricultural immigration is accompanied by accelerating deforestation. Archaeological and ethnohistorical information regarding Indigenous cultures in Chachapoyas remains insufficient to offer a clear view of the local pre-Hispanic cultures. The present relative lack of published primary data from Kuelap and the surrounding region enables the construction of contrasting, competing narratives that need to be demonstrated.
1.4. Description of La Fortaleza
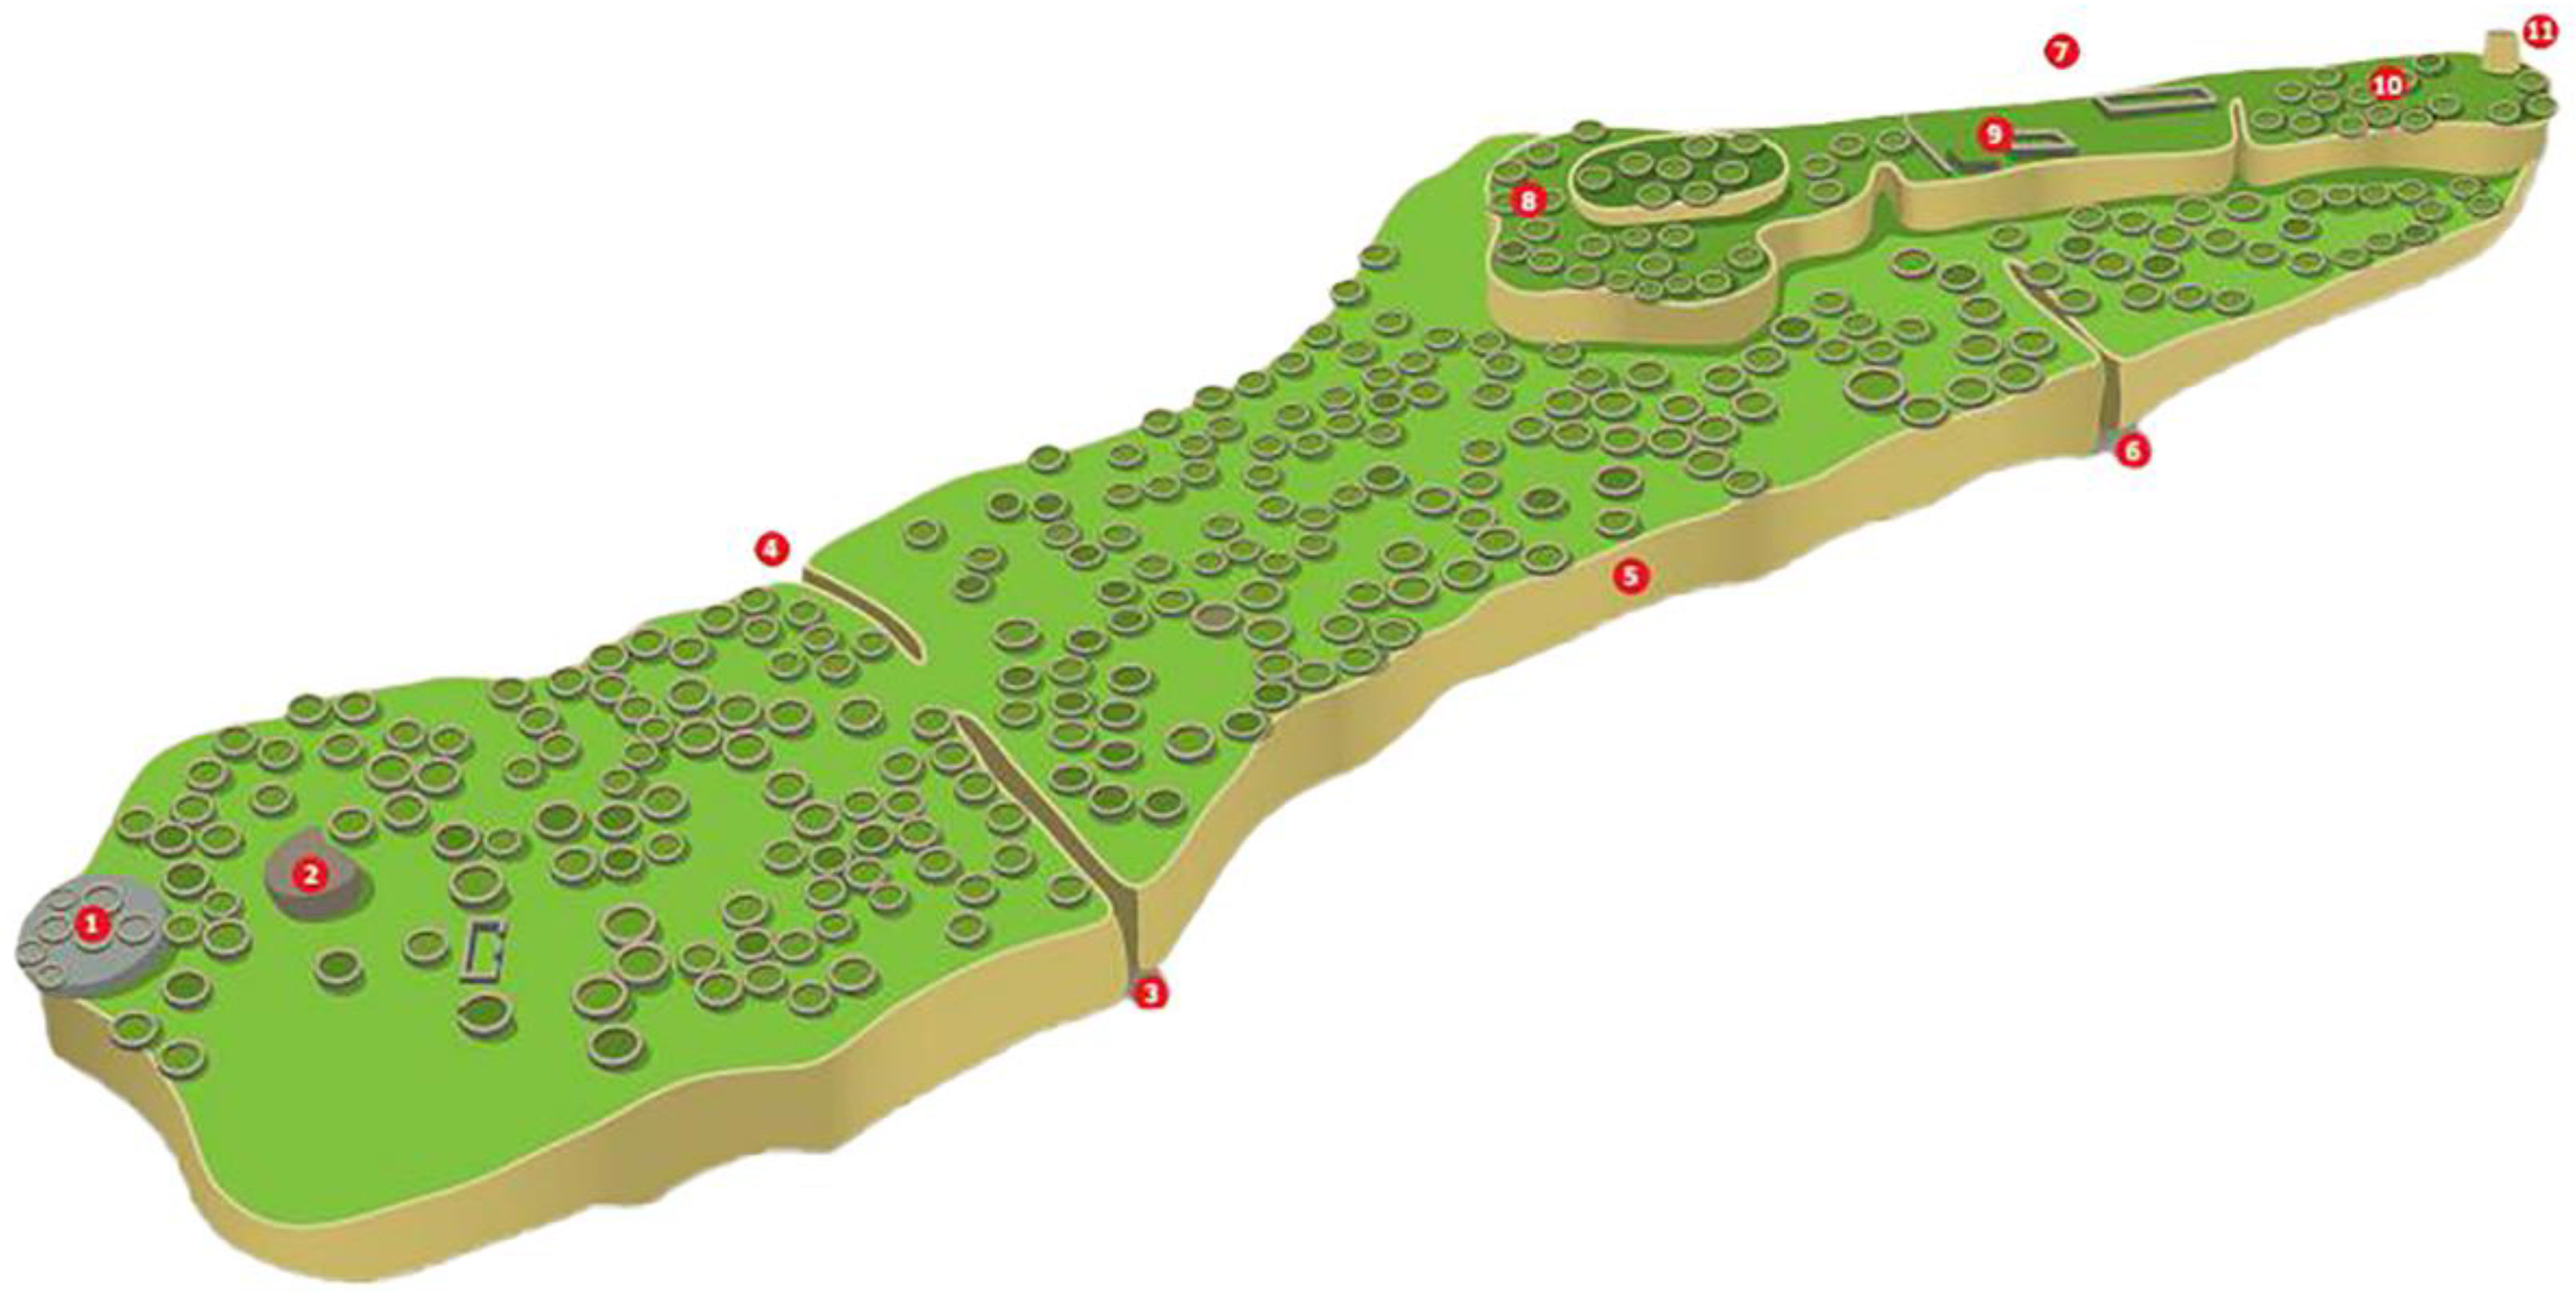
Figure 4.
An artistic rendering of La Fortaleza and its main buildings, with an impressionistic depiction of the locations of circular structures and special buildings. 1) Circular platform; 2) Main Temple / Tintero; 3) Access 1; 4) Access 2; 5) Perimeter wall; 6) Access 3; 7) Upper Town / Pueblo Alto; 8) Upper Town Southern Sector; 9) Upper Town Central Sector; 10) Upper Town Northern Sector; 11) The Turret / Torreón. Courtesy of MINCETUR Peru.
Undoubtedly the most famous archaeological monument in the Amazonas region, La Fortaleza de Kuelap shares many elements with other Chachapoya sites (Figure 4). Its ridge-top location, circular structures (often built on platforms, accessed by stairs and cantilever walkways, and decorated with friezes), and defensive affordances (which include highly restricted access points and hidden stairways) are common among regional settlements that appear to have had substantial occupations in the Late Intermediate Period (ca. 1100-1450 CE). Evaluated by both its extent (5.11 hectares, as recalculated from the current LiDAR surveys) and the number of domestic structures it contains (at least 420), the settlement atop La Fortaleza is large, but by no means larger than other prominent sites in this region, such as Purumllacta de Cheto and La Joya [5,8]. Some of its friezes are impressive, but its structures are in themselves neither larger nor greatly more elaborate than those found at other prominent sites in southern Amazonas. In addition, research conducted in smaller sites near Kuelap suggests that leveling and filling may have been common forms of landscape modeling in this territory [61]. All these characteristics––along with the ethnohistorical evidence reviewed above indicating that the region was not politically centralized before the Inka invasion––suggest that it would be inaccurate to consider La Fortaleza, and Kuelap more generally, as a “capital” site.
That said, the scale of La Fortaleza’s perimeter walls greatly exceeds that of those found at any other known walled archaeological sites in Amazonas and the monument contains several singular features. Mortuary contexts are found in particular abundance at the site, in a great diversity of contexts ––cists under house floors, above-ground open structures (chullpas), burials in La Fortaleza’s monumental walls themselves, a common grave that may correspond to a “massacre”, and cliff tombs in the adjacent Cerro Barreta [62,63]. The southern and northern ends of the site contain distinctive structures – at the south, the Templo mayor and Circular platform, which may be associated with ritual activities; in the north, the Torreón, which provides a relatively high vantage point over the adjacent slopes (Figure 7). Structures are divided between the so-called Pueblo bajo and Pueblo alto, which is separated from the remainder of La Fortaleza by another high stone wall with highly controlled access points, and which contains an area of exposed bedrock. Ruiz’s excavations in this area suggested that it may correspond to the oldest area of the site, and that it maintained particular importance during later eras. Also suggestive of the monument’s history of north to south accretion can be found in the report of the excavations conducted by Reichlen and Reichlen [64] at the south end above the main entryway and next to the Templo Mayor. They recovered only Late Horizon and Late Intermediate Period materials lying directly atop La Fortaleza’s construction fill. The Reichlens’ report findings contradict radiocarbon dates described for La Fortaleza [36], so additional research is required. Inka modifications to the site included the placement of a long, multi-doored feasting hall (typically called a kallanka) immediately atop this area of exposed bedrock, as well as the construction of a smaller such feasting hall near the Templo mayor, at the southern end of the site.
Visitors and literature now use the name “Kuelap” to refer to the tourist attraction of La Fortaleza. The extensive archaeological landscape to the east has received little archaeological attention, and communities are growing at Anexo Kuelap. Recent research on the Anexo identified abundant evidence of settlement by large and small groups from early pre-Hispanic times to the present. During the 1960s, archaeologist Arturo Ruiz explored the Anexo, and his thesis includes short descriptions of several archaeological localities, along with the results of his 1967 excavations at La Fortaleza. He estimated that the Anexo could have originally encompassed twice as many households as La Fortaleza’s total of 420 [15,16]. In recent years, archaeologists taking advantage of the area’s increasing deforestation have identified over 15 “sites” scattered across the Anexo that, together with La Fortaleza, functioned as integrated sectors within a single, expansive archaeological landscape (Figure 5). Based on his fieldwork in and around La Fortaleza, Narvaez [36] agrees that the monument and sectors below belong to one large archaeological complex. Although the passage of five centuries of human activities and recent settlement constructions have surely erased other sectors and evidence of interconnections, La Fortaleza might be more accurately considered the highest and most prominent element of a single yet very large Kuelap Archaeological Complex [32,33,34,39,42,60,65].
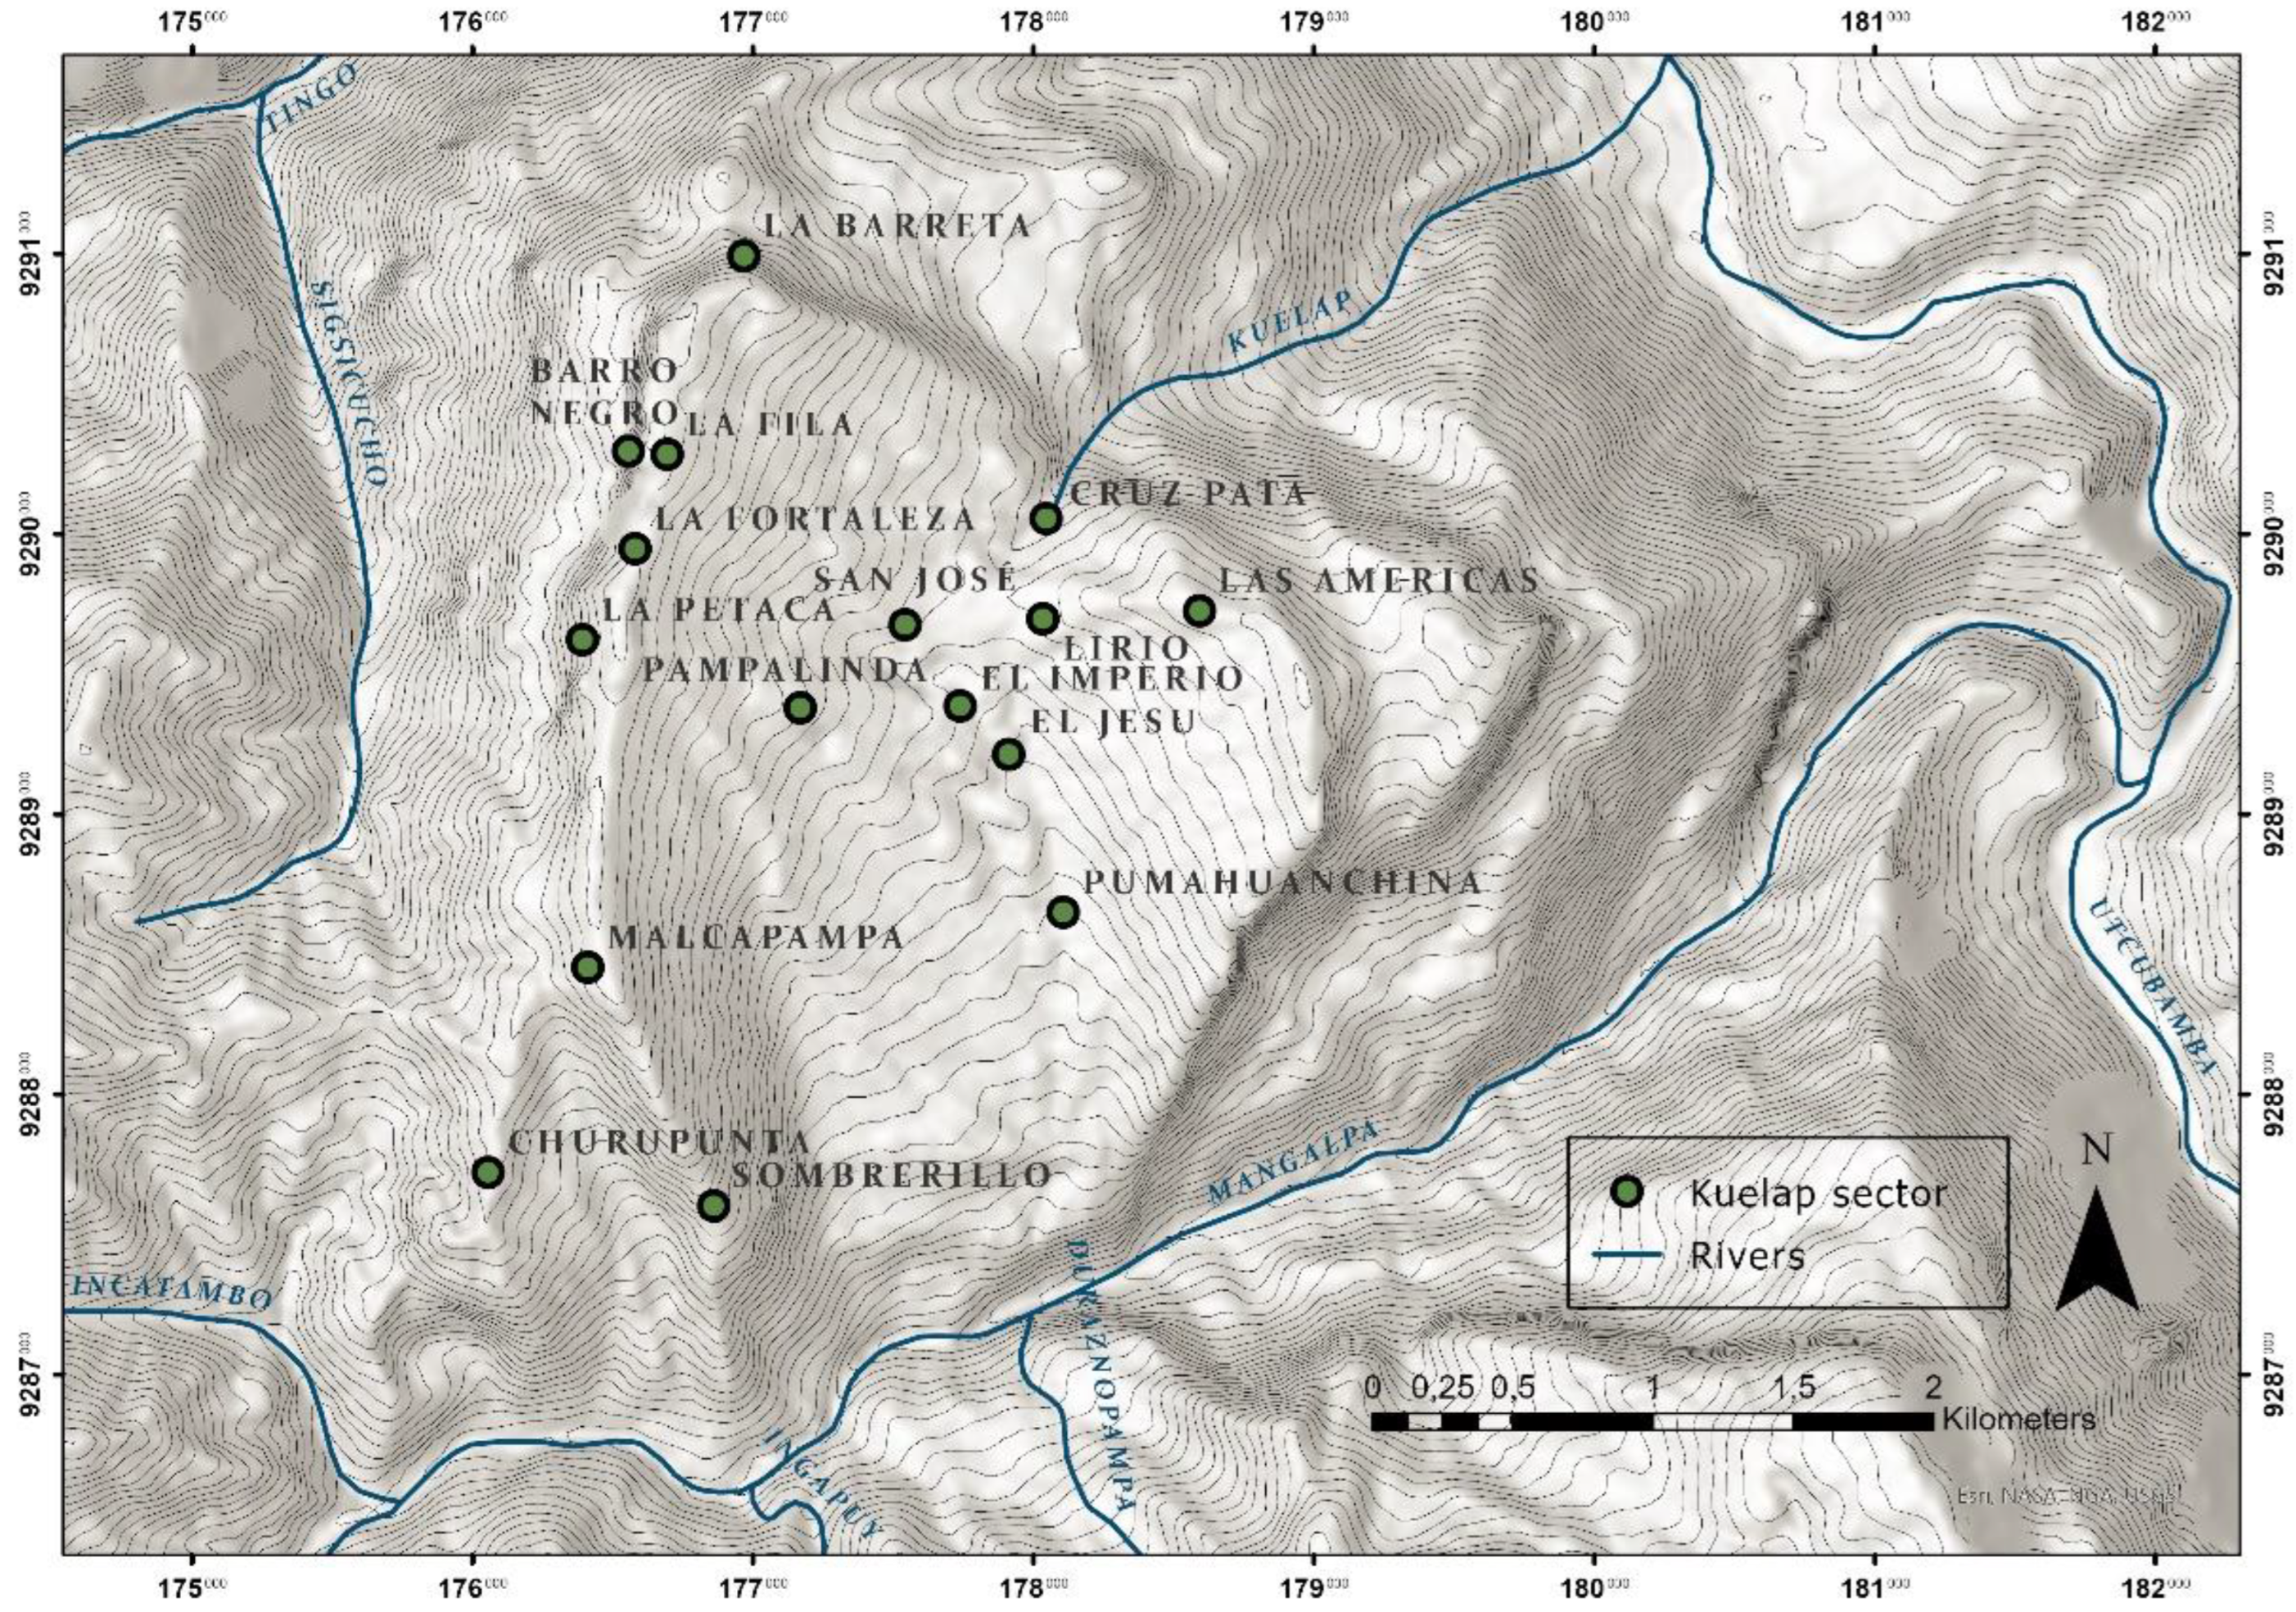
Figure 5.
Archaeological sectors identified within the Kuelap pre-Hispanic landscape. Redrawn with location data from H. Dionne [66]. UTM Zone 18S, WGS84.
Figure 5.
Archaeological sectors identified within the Kuelap pre-Hispanic landscape. Redrawn with location data from H. Dionne [66]. UTM Zone 18S, WGS84.
2. Materials
This study draws on data collected by several research teams, which we discuss in turn below (Figure 6). In the following sub-sections we present, as far as possible, the sources of these data and their acquisition and processing methods.
- Background data, collected through archival research and local interviews. They include earlier publications, reports, and photographic documentation
- Plans of the site from topographic surveys between 1985 and 2010
- Data from terrestrial laser scanning (TLS) collected between 2018 and 2022
- Data from light detection and ranging (LiDAR) systems mounted on UAVs used in 2019
- Photographs from UAV surveys collected in 2022
- Archival satellite RGB and NDWI data collected between 2005 and 2022
- Electrical resistivity tomography (ERT), Vertical Electrical Soundings (VES) and seismic refraction data collected between 2019 and 2023.
2.1. Background information on the site
Several sources of background information are relevant to this project’s goals. First are the publications left by late 19th and early 20th century travelers and visitors to Kuelap [14,32,40,43,64,67-71], which uncovers an early preoccupation and discussion over the ways to manage the conservation of the site, especially in relationship to its vegetation cover. Second are excavation and conservation reports from teams led by archaeologist Alfredo Narváez and others [36,72]. Third are reports and other documentation from the Ministry of Culture, especially those summarizing the state of conservation of specific site sectors, including readings from fissurometers (crack spies) collected since 2017 [73]. Although they do not reveal general knowledge about the deformation nature of the whole structure, they can provide useful insights into the time-related development and the current stages of displacement cycles at certain places. Fourth is information offered by inhabitants in the vicinity of La Fortaleza, who have worked on various excavation and conservation projects at the site since 1985 [73].
2.2. Plans of the site
Early visitors created the first site maps during the late 19th and early 20th centuries [32], and teams led by Narváez created more detailed maps based on a topographic survey of its structures using theodolites and total stations in the 1980’s through 2000’s [36,37]. In recent years, digital versions of the maps have been updated –– including one produced in 2009 by Plan Turistico y Cultural Peru-UNESCO (COPESCO) (Figure 7), and again in 2015 during efforts to restore Acceso 1. Their detail and accuracy are similar, and both use the UTM projection (Zone 18S) and the WGS 1984 datum.
Since the instruments available at the time required that every survey point be individually recorded (and sometimes recorded by hand), the resulting maps are very schematic and do not have the spatial resolution necessary to capture all the idiosyncrasies of the site’s individual structures, including the positions of individual stones within [61].
2.3. Terrestrial laser scanning (TLS)
Before the 2022 collapse, portions of La Fortaleza were scanned using terrestrial LiDAR (TLS), whose extremely high point densities are well-suited for documenting the vertical surfaces of standing stone architecture. In October 2019, Kucera, VanValkenburgh, and Rojas completed a partial TLS survey that documented the portion of the perimeter wall that collapsed in April 2022, as well as most of the eastern perimeter wall, Acceso 3, and Pueblo Alto. This dataset was collected with a Riegl VZ-2000 (RIEGL LMS) provided by COTECMI, a Peruvian company. Based on the technical parameters of the instrument, one can expect the best 3D accuracy of the resulting point clouds to be 3 mm at a 50 m distance for each scan position. Nevertheless, the actual accuracy must be assumed slightly higher, due to the alignment of the different scan positions and varying environmental parameters (e.g., temperature, air pressure, humidity). The applied angular resolution of 40 mdeg guarantees approximately 50 points/cm2 of average point density at the areas of interest (i.e., within the vicinity of up to 20 m of the survey path, along which the laser scanner was placed, each scan position separated by less than 15 m). Within three days, 250 scan positions were recorded, starting in the southern sector, following the visitor´s path along the west perimeter wall, entering La Fortaleza at Accesso 3, continuing to the Pueblo Alto sector, and ending in the central sector.
2.4. Drone LiDAR data
Drone LiDAR data provide a complementary source of spatial information for documenting La Fortaleza. At the time of this study, two sets of LiDAR 3D point clouds collected from drones were available to the authors. The first was acquired in August 2018 by VanValkenburgh, Rojas, and colleagues using a system based on Velodyne VLP-32 mounted on a DJI Matrice 600 Pro commercial hexacopter [61].
2.5. Digital photogrammetry
Alongside terrestrial and drone LiDAR data, we also analyzed the results of several UAV-based photogrammetric surveys conducted after the 2022 collapse, to reconstruct the damage. On April 12th, 2022, after the collapses had stopped, Roger Vigo used a DJI Mavic Mini 2, with a 1/2.3” CMOS sensor and 24 mm (35 mm format equivalent) lens that produces 4000×2250 size images. A second dataset was captured on April 30th, 2022 by Napoleon Vargas, using a DJI Mavic Air equipped with a 1/2.3” CMOS sensor and a 24 mm (35 mm equivalent) lens that produces 4056×3040 size images. Both surveys photographed and filmed the collapsed area and its surroundings on the southeastern corner of the site, before it was sheltered with protective roofing by the Ministry. A third dataset was captured on June 14th, 2022 by Contreras, using a DJI Phantom 3 equipped with a Sony EXMOR 1/2.3” CMOS sensor and a 20 mm (35 mm equivalent) lens that produces 4000×3000 size images. Contreras surveyed the whole southeastern corner of the site and, although the collapse had been already covered, it produced data suitable for high-quality IBM models of that section of La Fortaleza (Figure 22).
2.6. Satellite data
Two types of publicly available satellite data were used in this study. The first type was historical, high-resolution RGB imaging (8192×4897 pixels) from Google, acquired with the Google Earth Pro application (Figure 8). The images from July 2005, June 2012, November 2014, August 2021, and June 2022 were selected as the best illustration of the changes in the vegetation cover of La Fortaleza (Figure 13).
We also collected all cloudless Normalized Difference Water Index (NDWI) images in the last two years from the Sentinel-2 L2A satellite, that is, 11 images for the year 2021, and 10 for 2022. The NDWI is used to monitor changes related to water content in water bodies. In the case of Sentinel-2 data, this index is calculated according to the equation NDWI = (NIR - MIR)/(NIR + MIR), where: NIR – is Near Infrared band 8, and MIR – is Mid-Infrared band 12. Their resolution and central wavelength are respectively: 10 m/842 nm and 20 m/2190 nm. The time intervals between the individual images range from 2 weeks to 2 months. In the analytical section of this study, this satellite data was used to monitor seasonal and annual changes in the ground moisture of La Fortaleza.
2.7. Electrical resistivity tomography (ERT), Vertical Electrical Soundings (VES), and Seismic Refraction
Besides the remote sensing datasets described above, this study has integrated near-surface geophysics, in the form of electrical resistivity and seismic refraction surveys. In 2019, Jorge Barriga carried out for Plan COPESCO a resistivity survey around Acceso 1 [76], using the Syscal Pro resistivity meter with a multichannel pole-dipole electrode arrangement for 10 ERT transects, and Schlumberger arrangements for 11 VES [77]. In 2021, Mori carried out 3 longitudinal and 10 transversal ERT profiles (Figure 9), covering the top of La Fortaleza [78]. Mori used the ARES I 850W resistivity meter from GF Instruments, following a dipole-dipole arrangement [79]. In 2022, the Ministry of Culture contracted ALEPH Asociados for a geophysical study involving 2 longitudinal and 18 transverse ERT profiles (Figure 9), and 27 VES, with a Schlumberger Symmetric Linear tetra-electrode configuration, complementing Mori’s coverage of La Fortaleza [80].
The results of the application of ERT and VES in these three geophysical surveys are consistent and complementary to each other. Due to the quality of graphics available, the illustrations of further analyses of resistivity data in this study are based on the ERT data collected and processed by Mori (Figure 10).
In 2023, Mori developed a geo-seismic profile of La Fortaleza (Figure 11), by measuring with an array of geophone sensors, the variations in the velocity of the primary compression waves generated by 40 seismic refraction lines, evenly divided between 50 m and 100 m arrays [81]. The technique is used to interpret the depth and composition of soils and rocks, to characterize subsurface geologic conditions and stratification. With this data, Mori modeled in 3D the bedrock under the platform and estimated the size of the fill.
The reports on all these geophysical surveys contain valuable observations on the geological structure of La Fortaleza and its hydrological conditions, which are important elements for analyzing the mechanisms of the damage to its perimeter walls.
3. Methodology of the study and applied methods
As previous authors have suggested [78,82,83], we propose that the root cause for the collapse is the increasing moisture within the fill behind the perimeter walls of La Fortaleza. Hence, our methodology and applied methods were subordinated to the task of evaluating this hypothesis as the primary objective. The main study goals revolve around finding answers to these two fundamental questions: 1. Is there a correspondence between surface rainwater runoff and soil moisture?; 2. And if so, which features of the terrain micro-landscape pose the most significant threats, and in which specific places do these threats occur?
Additional questions relate to the direction of further archaeological and architectural research and the possibility of using remote sensing data. From the methodological point of view, our research process could be divided into seven steps: 1) primary data gathering; 2) primary data preprocessing; 3) processed data evaluation; 4) data postprocessing; 5) analytical phase; 6) valuation phase; 7) synthesis of results
The last step includes two components: the data that will constitute thematic layers on a proposed Kuelap GIS, and the restoration recommendations based on our results. Considering our current study and accompanying observations, the former seems to be a prerequisite for any action aimed at implementing a comprehensive solution to the conservation problems at La Fortaleza.
The following sub-sections will discuss five key areas leading to answering the two fundamental research questions posed above. The general logic of these studies, data flow, and applied methods are synthesized in the diagrams at the beginning of each subchapter.
3.1. The general plan of the site
On any archaeological site, the primary study material is its most accurate and detailed plan. This is particularly important in the event of threats to the site, even more so for one on UNESCO´s tentative list of World Heritage sites. In the COPESCO plan (Figure 7), the location, the shape, and even the existence of individual buildings differs significantly from the reality observed in the published LiDAR survey [61] and other LiDAR data [75]. These discrepancies, and at the same time, the existence of recent LiDAR surveys [84,85] urges the need for a new, more accurate, and up-to-date site plan of La Fortaleza.
Such a site plan would be the base layer in Kuelap GIS, where all the interested parties and research teams might deposit their products. Further, using TLS and close-range digital photogrammetry, this base layer would be supplemented with more detailed "stone by stone" drawings, as postulated and practiced by Kościuk [86] (pp. 11-15), [87]. Recent advances in the fusion of digital photogrammetry and TLS data render this working path even more efficient [88,89]. Figure 12 represents the data flow for the proposed Kuelap GIS general plan layers.
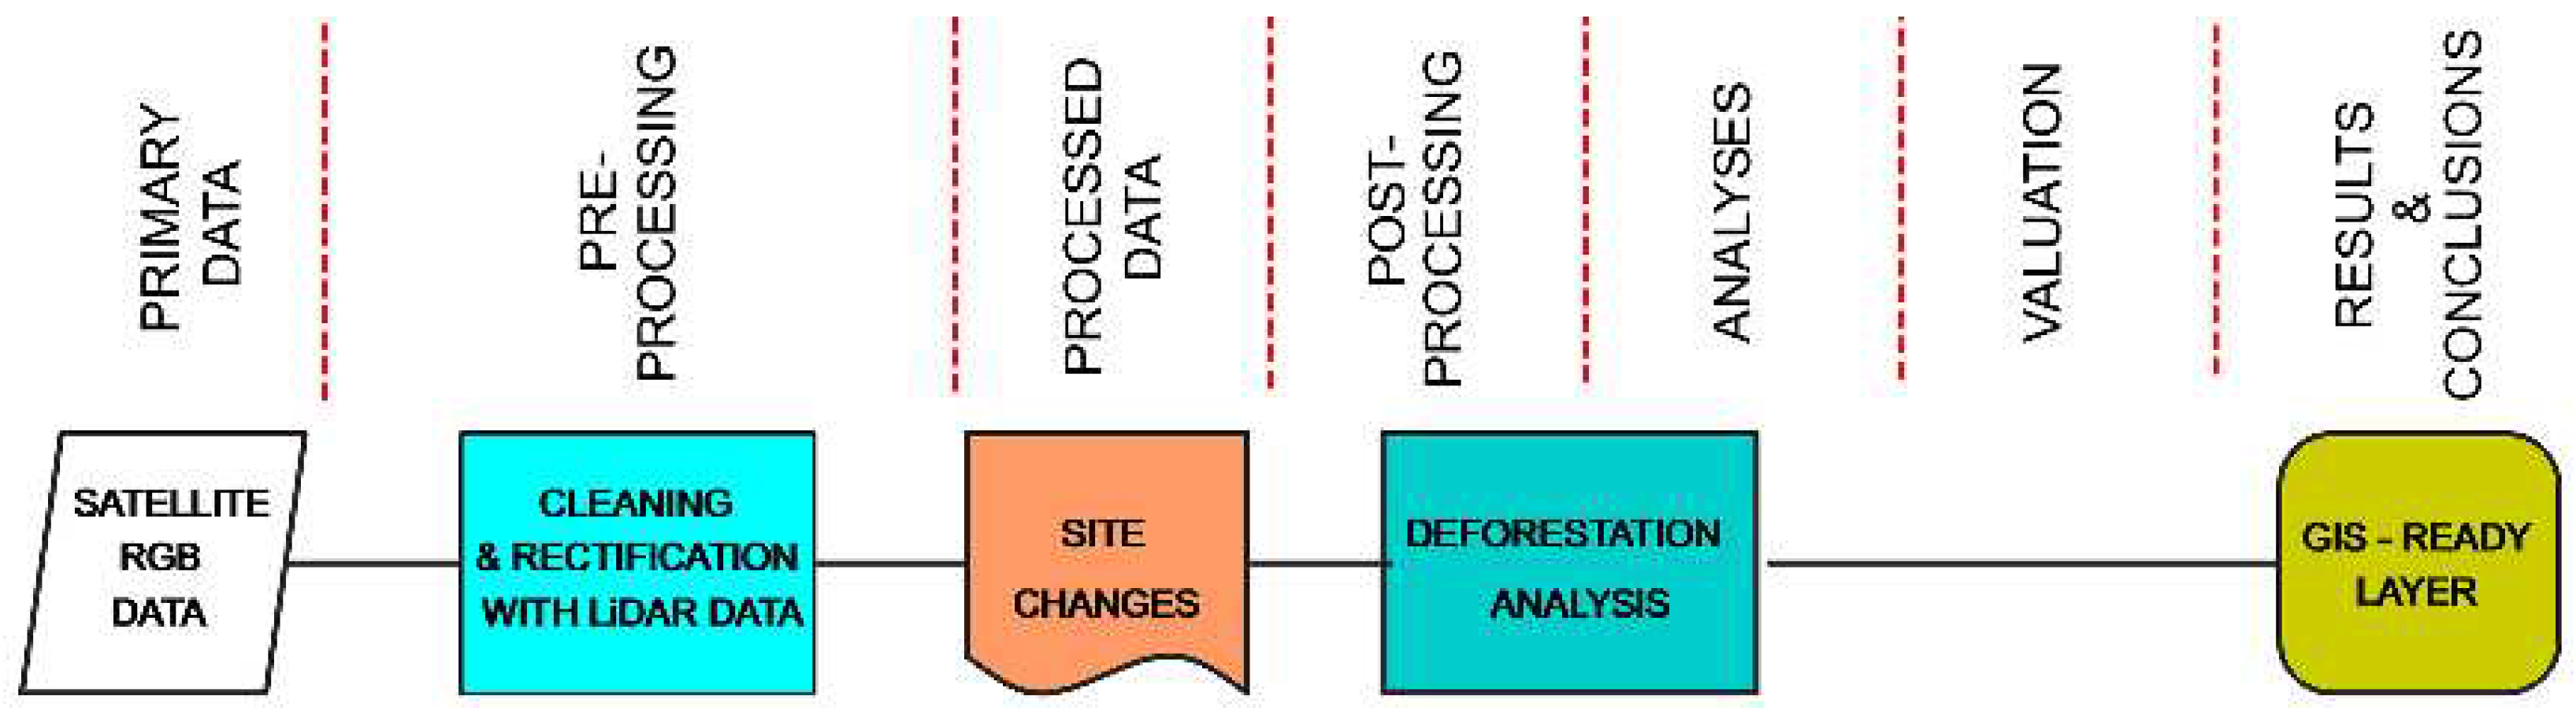
3.2. Deforestation analysis
A cursory analysis of historical satellite images available on Google Earth Pro reveals ongoing deforestation at the top of La Fortaleza (Figure 13). Even more dramatic changes can be observed by comparing the present state with aerial pictures from 2000 (Figure 1), showing that, relatively recently, most of the top of La Fortaleza was densely covered by vegetation, save for areas around the gates and the main buildings, such as Plataforma Circular, Templo Mayor, and Torreon.
A case-by-case review of the potential effects of deforestation significantly exceeds the scope of this article. Nevertheless, the data flow adopted in this study provides for the analysis of data collected so far and availability for further, more detailed research in the form of a thematic layer of the proposed Kuelap GIS System. However, Google Earth images are not precisely nadir-orientated, and their topographic projection is not consistent. Using them for quantitative analysis would require rectifying individual images based on a common template. As such, the digital terrain model (DTM) derived from UAV LiDAR data could be used for the rectification (scaling, rotation, distortion, and translation) of individual images within a suitable software environment.
Figure 14.
Diagram for deforestation analysis. Elaborated by Kościuk.
3.3. LiDAR data visualization and hydrological analysis
As already mentioned, our data source for describing the terrain and architectural remains atop La Fortaleza was the UAV LiDAR survey provided by MEDS AMSTERDAM. The primary data filtering and classification processes were conducted with ATLAS (www.theatlasgis.com), proprietary software created by MEDS AMSTERDAM (Figure 15).
The resulting data, received in *.las format, was preliminarily classified into three groups:
- "never_classified" (mostly high vegetation, but also relicts of vertical and sloping walls),
- "ground"
- "low_vegetation"
However, in such rugged terrain, full of hardly distinguishable clumps of vegetation and ruins of walls, with varying degrees of damage, an additional inspection of the 3D point cloud and reclassification was necessary. Due to the main purpose of the study, and the characteristics of the site, new classes were introduced:
- "ground and architecture"
- "vegetation on walls".
This led to the reclassification of 3D point clouds – in some cases, automatically executed in Leica Cyclone 3DR v. 2023.1 software and, in some instances, also manually. These interventions were limited to the following cases:
- automatically filtrating vertical and sloping walls, and moving them from the "never_classified" class to the new "ground and architecture" class,
- manually selecting previously unfiltered vegetation clumps and moving them from the "ground" class to the "low_vegetation" class,
- manually selecting vegetation growing on vertical and sloping walls and moving it from the "ground and architecture" class to the new "vegetation on walls" class,
- in a few instances, manually selecting parts of the "low_vegetation" class that may represent the slopes and the tops of circular hills where relics of round buildings are buried and moving them to the "ground and architecture" class.
The final 3D cloud in *.las format (WGS 1984 UTM Zone 18S), consisting only of the "ground and architecture" class, was used in ArcMap v.10.6 software function “Las Data Set To Raster Conversion Tool” to produce a DTM file of 10 cm resolution, representing the bare ground surface, which includes walls and other building remains. The steps to obtain the most detailed terrain maps as input data for the development of hydrological and risk maps are described in the following two subsections, while the whole methodology is presented on Figure 16.
3.3.1. DTM postprocessing with Relief Visualization Tool Box (RTV)
The detailed DTM file allowed the use of analytical tools built into GIS packages, and specialized tools for detecting buildings and archaeological features. We used the Relief Visualization Toolbox v.2.0 [90], a standalone application that further processes the DTM files. The choice of analytical tools included:
However, there is no single and straight rule for which visualization modes will most effectively detect and emphasize the desired features [97] (p. 288); [93] (p. 47). Due to the diverse nature of the features in the given study area, it is a matter of many trials, using different algorithms with different settings. In our case, the most effective were unidirectional hill-shading (HS), multidirectional hill-shading (MHS), slope gradient (SG), and openness-positive (OPEN-POS). Each represents different aspects and features of the terrain in question (Figure 17). Important additional information that characterizes the area's landscape is supplied by hypsometry (Figure 17 HYPSO). However, the most detailed information was brought up by using a special Mixer mode built into the RVT, allowing for the combination (with a certain degree of transparency) of up to five different basic visualization modes (Figure 17 VAT).
The results of all the visualization modes listed here have been used as thematic layers both in the GIS system and in the form of raster references in CAD projects. Depending on the needs, it allows changing the background against which individual problems are analyzed.
3.3.2. Hydrological analysis based on DTM
Past mitigation activities in the southern sector of La Fortaleza, and more precisely, the installation of various drainage systems, indicate that the infiltration of rainwater into the fill was understood since the 1980s as one of the main causes of deterioration [98]. However, the authors have not found hydrological analyses simulating rainwater runoff at the site, nor technical documentation of the existing drainage systems, considering, for instance, calculations of all the rainwater flows, slopes, or the diameters of drainage pipes.
Drainage projects require certain hydrological analyses as input data, which can be conducted based on the detailed DTMs produced from UAV LiDAR survey, which show the relief of the terrain of La Fortaleza along with all its extant architectural remains. On this basis, the main elements of the hydrological system can be determined:
- slope gradient, which, along with other parameters, will indicate the proportion between surface runoff and infiltration into the ground (Figure 18 A),
- local depressions, where rainwater can only evaporate or soak into the ground (Figure 18 B),
- boundaries of individual water catchments and their areas - necessary as input data for calculations of the drainage system (Figure 18 C),
- main rainwater runoff lines (Figure 18 D).
3.4. Comparison of ERT data with the results of hydrological analyses
To study the possible relationships between precipitation at La Fortaleza and threats to the monument, we have integrated our data from hydrological analyses with the results of geophysical surveys (Figure 19), specifically, the ERT readings collected by Mori [78], (Figure 20).
All ERT profiles were plotted on the hydrological analysis maps to allow for direct comparison between modeled hydrological risks and evidence of increased humidity (Figure 20).
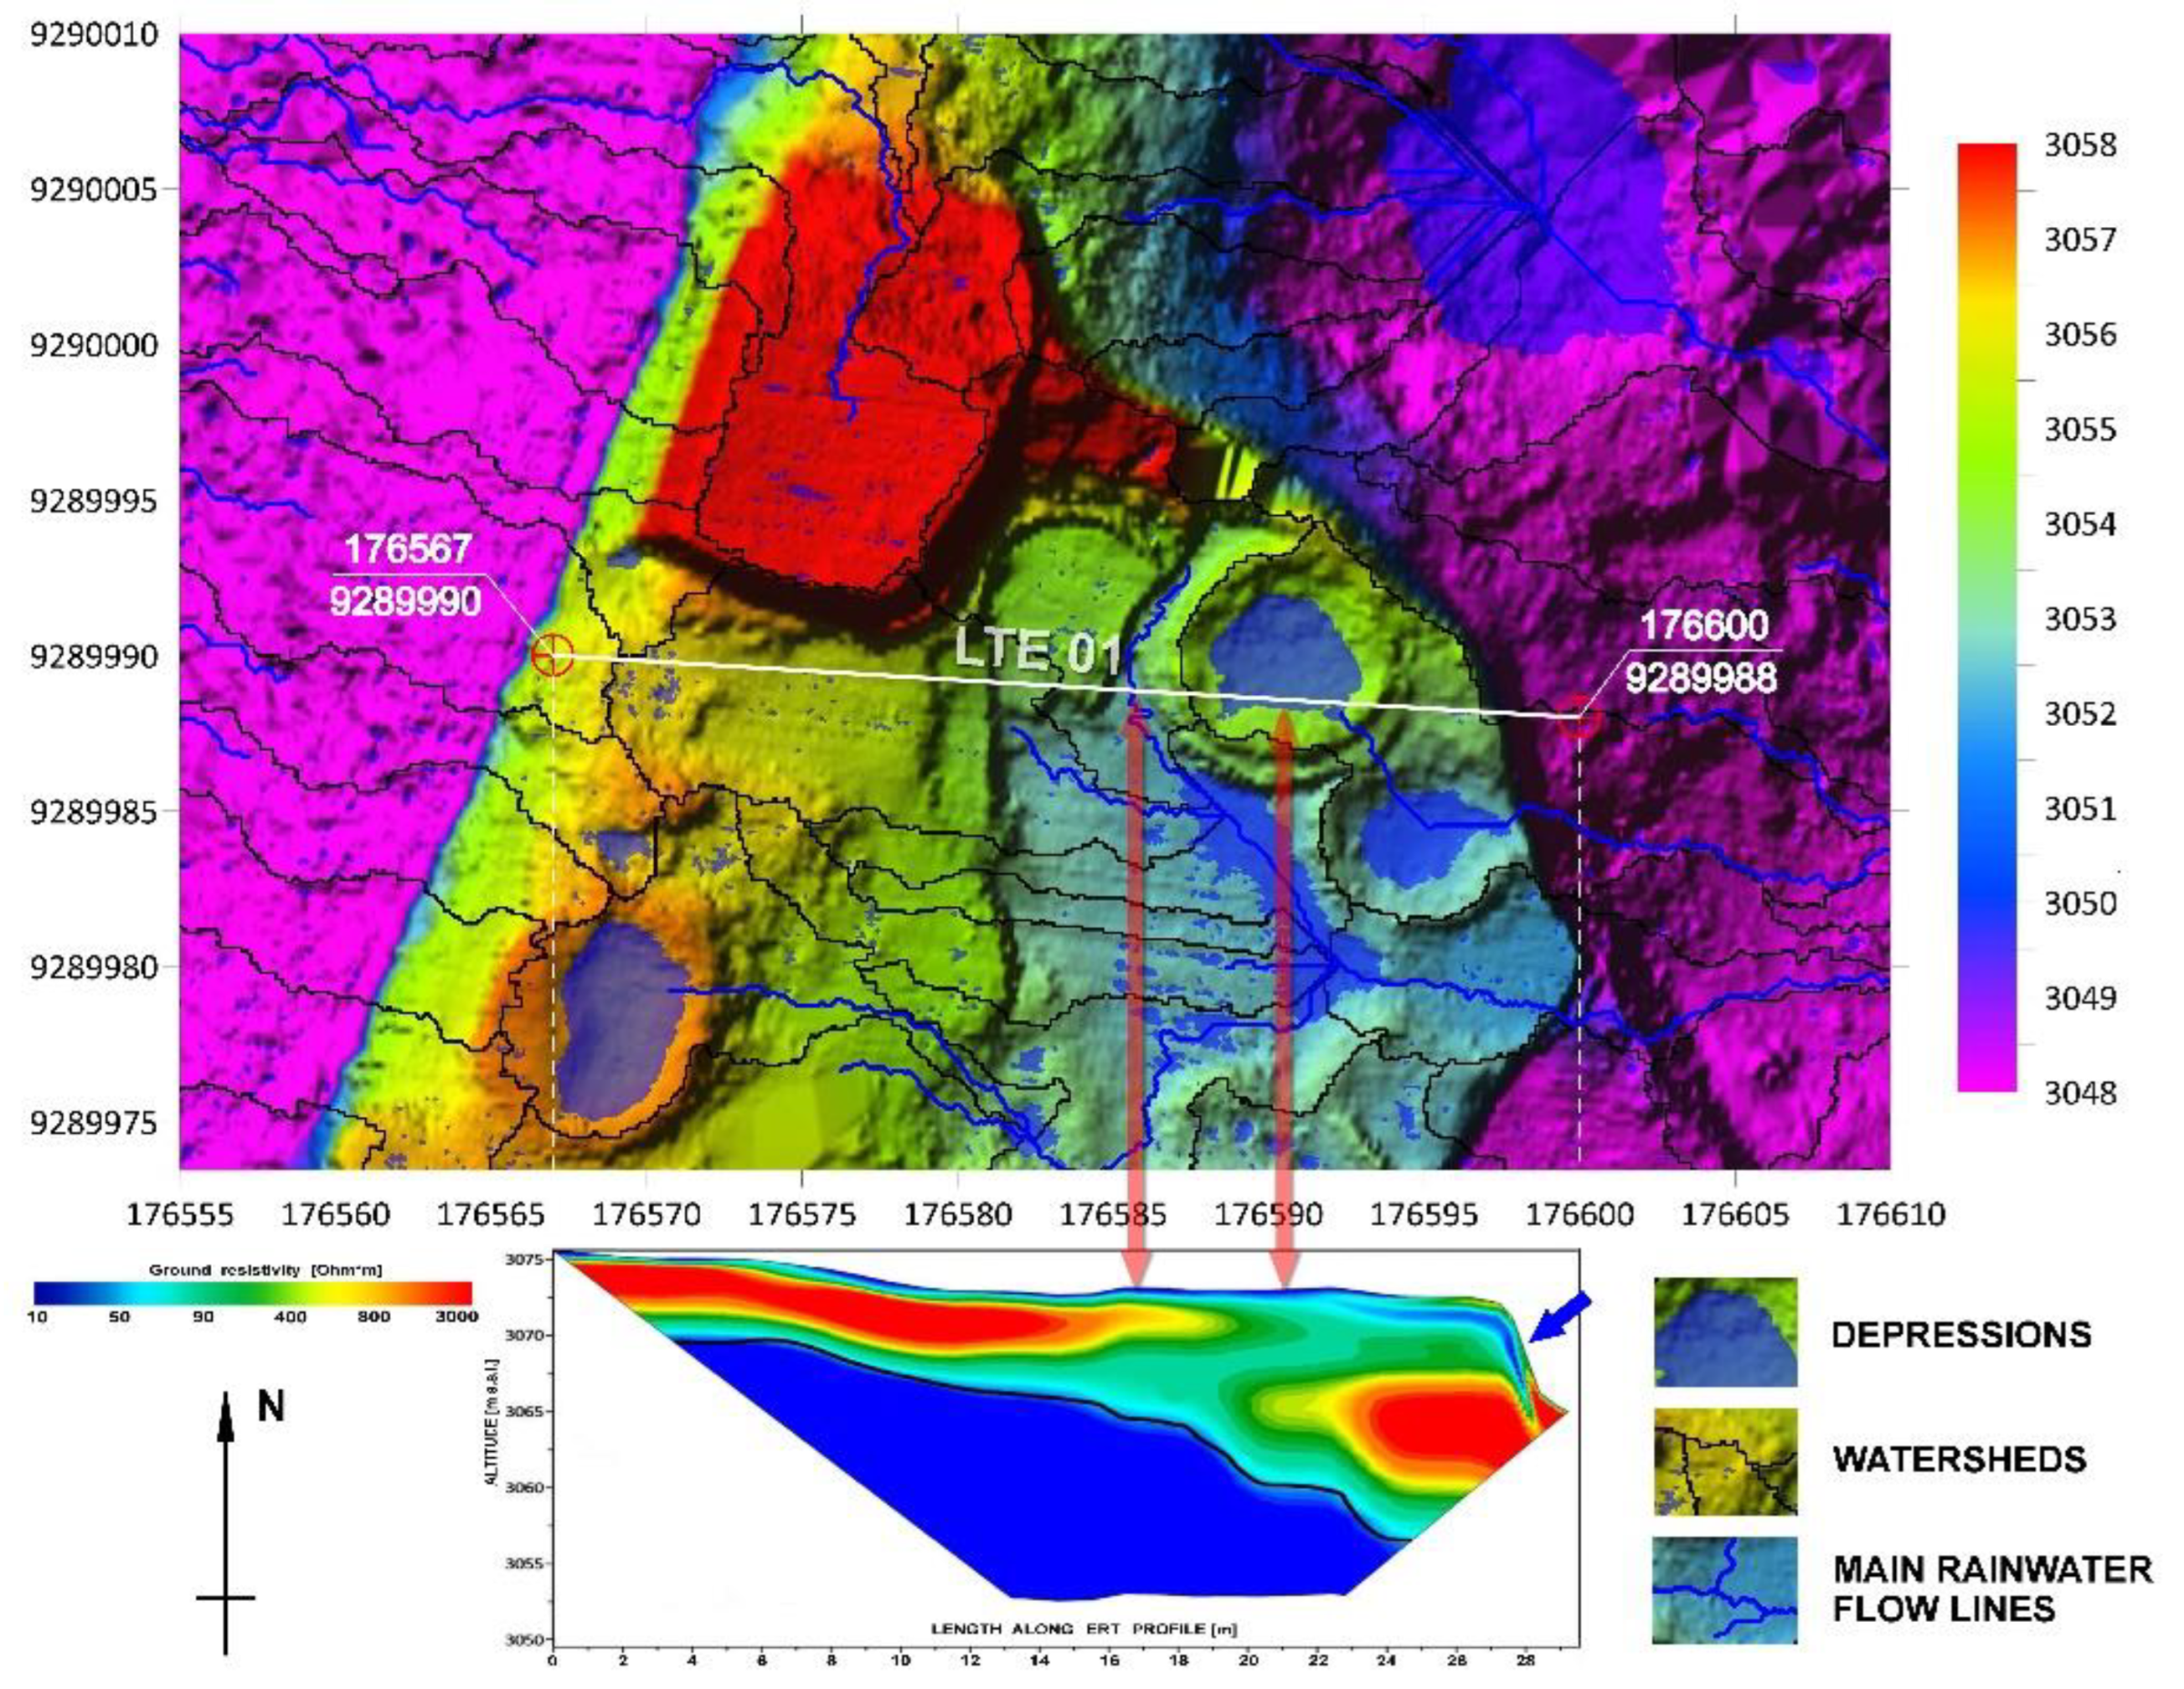
Figure 20.
ERT LTE 01 profile plotted against the background of hydrological analysis on a hypsometric map: the red arrow on the left shows the coincidence between a rainwater runoff line and a zone of increased humidity; the right red arrow shows the influence of a local depression on the increase in soil moisture; the blue arrow points to the increased humidity of the structured fill behind the perimeter wall of La Fortaleza. Hydrological analysis by Dąbek; ERT profile by Mori; hypsometry and data assembling by Kościuk.
3.5. Stratigraphy of La Fortaleza using seismic refraction
The measured variations in the velocity of the primary compression waves (Vp) generated by the seismic refraction lines were processed using the applications SeisImager2D, version 3.3 and Easy Refract, version 20.4.518, to generate 2D geoseismic profiles of La Fortaleza (Figure 11). To estimate the volume of the existing construction fill, the resulting stratification was reclassified into two major strata: the construction fill, composed of limestone blocks and argillaceous clay plus the topsoil, as a single unit, and the underlying limestone bedrock (Figure 21). To estimate the difference between both strata Mori used the application Oasis Montaj, version 9.3, to model in 3D and in high resolution the current surface of La Fortaleza’s platform and of the bedrock, using as a point of contact with the bedrock a Vp speed of 2000 m/s. Finally, the 3D surfaces of the bedrock and the current surface were analyzed in AutoDesk Civil 3D 2023, and from the difference between both, the volume of the existing construction fill was calculated at approximately 600,000 m3.
3.6. Fusion of Image-Based Modeling (IBM), ALS and TLS data
No pre-collapse “stone by stone” documentation of the perimeter wall that collapsed in April 2022 wall exists, but fortunately, Kucera, VanValkenburgh, and Rojas collected TLS data in 2019, which we combined with IBM and ALS data. The detailed examination of these integrated datasets allowed us to produce results that are crucial to understand the reasons for the collapse: 1) detailed “stone by stone” plans, 2) techno-morphological analysis, and 3) multitemporal deformation studies.
These data will be of great importance in formulating conservation guidelines specifying the scope and treatment methods for the collapsed parts of the perimeter walls of La Fortaleza. We are referring both to the data available for this study, and, above all, to any other data documenting the condition of the walls before April 2022.
3.6.1. Detailed “stone by stone” plans
Recent advances in the fusion of digital photogrammetry and TLS data offered by AgiSoft Metashape 2.0.4 render this working path even more efficient [88,89]. Given a sufficient overlap between TLS and photogrammetry projects, and supplying well-spaced and equally distributed ground control points, such integrated documentation can provide a fast and accurate source for a more detailed study (Figure 22).
Another approach to combining photogrammetric and TLS data for restoration documentation is to use their 2D deliverables. Figure 23 explains the data flow for this method particularly efficient when documenting the facades of any walls as well as the ground plans of the site. In both cases, such integrated data (2D drawings and/or 3D models) can be used as a base for any conservation or restoration purposes.
3.6.2. Techno-morphological studies
Although there are many studies of Inka masonry [99-105], save for Protzen's research on the evidence of construction phases in Ollantaytambo [103] (pp. 241-256) and his study on the sequence of laying stone blocks at Sacsayhuaman’s retaining walls [101] (Figure 37, p. 181), in-depth techno-morphological approaches have only been adopted recently [106,107]. Even less can be said about the use of such approach concerning Chachapoya masonry. One of the reasons for this situation is the lack of sufficiently accurate “stone by stone” documentation of the remains of Chachapoya buildings. The approach proposed above (a fusion of digital photogrammetry and TLS data) may change this situation in the case of the straight portions of walls. However, most Chachapoyas constructions are oblong or circular, making this method difficult to apply. Unrolling the faces of inclined walls of an irregular plane is a time time-consuming task, demanding a lot of additional data and computer power. Nevertheless, there are methods that quickly give results good enough for our purposes. Many modern applications, both photogrammetric (for example AgiSoft MetaShape) and those operating on TLS data (for example Leica Cyclone 3DR v. 2023.1), have built-in modules for unrolling cylindrical surfaces.
Even a relatively complicated curved wall can be divided into sections with an approximately constant radius. Since the inclination of these walls rarely exceeds 10 degrees, it gives the chance to use a cylindrical surface as a good enough estimate of such a fragment of the wall. The next step is to use one of the applications mentioned above, unrolling subsequent sections of the wall, and stitching them into one image. Depending on the software used and the input data, this method can be used either on 3D mesh models or directly on 3D point clouds. The resulting unrolled “pseudo-ortho” image can be used as a raster reference on any 2D CAD program for further vectorization, delimiting zones of special interest, and calculating their area. Finally, it can be also used for techno-morphological studies.
3.6.3. Deformation analysis based on multitemporal hybrid data
One should have also in mind the use of multi-temporal data. Data from two different measurement epochs (for example before and after the collapse) can also help reconstruct the chain of events that led to this catastrophe [108,109]. An analysis of the perimeter wall deformations 'on the eve' of a disaster can be particularly indicative. Such analysis will require two steps:
- referencing data from both epochs into a common coordinate system,
- cleaning the 3D point cloud data from vegetation growing on the wall and any moving objects.
The first step determines the credibility of the analysis. Poor matching of the compared 3D point clouds may result in an incorrect estimate of deformations that may have occurred between two surveys distant in time. The second step is equally important. If the 3D point cloud is not effectively cleansed of data representing vegetation, analyses (usually Cloud2Mesh comparison) will mostly show changes in vegetation cover. However, cleaning 3D clouds from vegetation is very challenging, especially when the background is an inclined stone wall made of heterogeneous blocks with a variable angle of inclination and a complex distribution. This requires either labor-intensive manual cleaning of the cloud, or specific filtration methods adequate to this situation.
In the case of the April 2022 perimeter wall collapse, we fortunately had three sets of data collected before the disaster and one data set acquired directly after the collapse. Two of them were aerial LiDAR surveys (ALS) from 2018 and 2019 collected by MEDS AMSTERDAM and VanValkenburgh et al. [61]. Georeferencing of both was based only on GPS data and no ground control points (GCP) were set for either survey. Besides, the resolution of the 3D point clouds representing the perimeter wall greatly exceeded 1 cm. All this, and the difficulties in clearing the point cloud from data representing the vegetation growing on the walls, did not allow for an effective analysis of deformations that could have occurred between these two surveying epochs.
The third pre-collapse data were from the TLS survey carried out in 2019 and referenced to existing geodetic points in the area with known coordinates. The resolution of these data was not worse than 1 cm. Unfortunately, also in this case, deformation cross-analyses between both sets of ALS data and the TLS data did not bring satisfactory results. Therefore, it can be concluded that in this case, ALS data are not suitable for multitemporal deformation analyses.
We also had a fourth set of data at our disposal - pictures taken from a drone collected by Roger Vigo the day after the collapse of the perimeter wall in April 2022. Due to concerns for the safety of the pilots and their equipment, no ground control points (GCP) were placed for the first two UAV surveys of the collapsed area of La Fortaleza. GCP are crucial for the correct scaling and georeferencing of the resulting IBM models. Also, only GCP guarantee identifying possible distortions. To overcome this problem, five control points were defined using the TLS data from 2019. Distinct points (cracks, edges of stones), which are detectable and distinguishable in both TLS and IBM data, have been defined in RiscanPro 2.14.1, and exported in the respective projection (WGS84 UTM 18S).
In general, the resolution of an IBM model is defined by the sensor used, the average working distance, and the number and quality of images. Thus, a high number of images taken from various positions and distances is preferable. The data available from the two UAV surveys conducted before the collapse was covered sums up to only 25 images, resulting in a rough model –- of great value nevertheless, as it predates the later covering of the area, and enables an estimation of the collapsed volume. For the processing, Agisoft Metashape 1.7.2 was used, using the control points previously defined in the TLS dataset from 2019, at a resolution of 1 cm. This results in a positioning accuracy of 2 to 3 cm for each of the five defined control points. Their positioning accuracy is also linked to the resolution of the single images. During processing, it was observed that this accuracy is well below 5 cm, which enables sufficient comparability with the TLS dataset. After exporting the control points to IBM, the respective points were identified manually within single images, and the two datasets were matched.
To georeference the TLS model, eleven control points (Riegl 5 cm cylinder, retro targets) were placed within the vicinity of Acceso 1 and measured using an RTK GNSS system. An initial geographic localization of the single scan positions was gained by an onboard GNSS antenna atop the scanner. During the processing of the TLS data, in RiscanPro 2.14.1, georeferencing was based on control points and automated extraction of reference planes for the geometric alignment of single scan positions. The final accuracy of the absolute positioning of the model thus depends on the accuracy and precision of the given geodetic survey. The quality and density of the collected data allow for a crisp rendering of individual stones within La Fortaleza. These data secure calculating the impact of the 2022 collapse and provide an essential reference for its future reconstruction.
The outline of the collapsed area was marked in 3D and the point clouds were reduced to the surfaces enclosing the collapsed volume. The resulting point clouds – namely TLS data from 2019 and the post-collapse IBM data from 2022 at a resolution of 5 cm - were exported to Geomagic Wrap 2021, to render and calculate the volume of the collapse. Both point clouds were merged and triangulated to create a solid mesh according to the processing routines of the software. Merged point clouds were first resampled to an overall 5 cm resolution and noise reduction was applied. After triangulation, the surface of the volume was smoothed to remove spikes and further noise. Finally, the size of the enclosed volume was calculated. Keeping in mind an overall positioning error of approximately 5 cm, one might suggest an average error of the volume estimation of roughly 5%.
4. Results and discussion
Based on the above-described methodology and the methods used in this interdisciplinary study, we have obtained several useful results that clarify not only the current state but also the past of La Fortaleza.
4.1. Background data, ground-truthing, and stratigraphy
Our review of background information and the ground-truthing of features detected in our remote sensing surveys reveal ongoing stability problems at La Fortaleza, reported since the late 19th century. We have begun to document the long history of collapses on the perimeter wall [73]. Obviously, this history is very incomplete, and more populated for the past 100 years. Nevertheless, we have evidence, which will be discussed in detail on section 4.5.3, of a massive pre-Hispanic collapse, involving an area of at least 1750 m2 on the eastern half of the Southern Sector of La Fortaleza (Figure 24 B). Photographs published in the reports of various explorers and visitors [14,32,40,64,69,71] reveal that, between 1910 and 1933, a large collapse occurred on the east perimeter wall of the Southern Sector, just north of Acceso 1 (Figure 24 D). The above-mentioned 2013 collapse affected the eastern perimeter wall north of Acceso 1 (Figure 24 E). Finally, the April 2022 collapse (Figure 24 A), which occurred during an exceptional period of precipitation [27].
This fragmented history of collapses at La Fortaleza reveals the fragile state of the perimeter wall, and indicates that its structural instabilities long predate the 2022 crisis, affecting mostly the southeastern quarter, despite decades of conservation efforts. One important reason for this is the shape of the underlying limestone bedrock: it has been characterized by inclinations or dips towards the east (Figure 25) [27,72,82] and south (Figure 21), which Mori modeled for this research processing seismic refraction data. The combination of these two dips in the underlying limestone, the low permeability of this type of rock, and the high rates of rainfall infiltration of the layers above [84], create geotechnical conditions that strongly influence the geomorphological processes and groundwater circulation at La Fortaleza, favoring a trend for the preferential distribution of sub-surface water towards its southeast quadrant. To this characterization one must add topographical conditions resulting in surface rainwater flowing mainly towards the eastern perimeter walls.
4.2. The problem of deforestation at La Fortaleza
Background research reveals two at least partially successful initiatives to clear-cut Kuelap’s trees and shrubs during the late 19th century, and a successful clear-cut during the mid-20th century. Satellite image research at La Fortaleza (Figure 14) has permitted the documentation of a significant change in its forestation between 2005 and 2022. As shown by the comparison in Figure 26, the area covered with tall vegetation has decreased by approximately 30%. Whereas the management of heritage sites must seek a compromise between protecting the built heritage and preserving its environmental context [110], the change observed may have well affected the permeability and absorptivity of the ground.
A site’s guidelines for the protection of the built heritage and its natural environment may conflict, depending on the priorities adopted. Limiting our considerations to the protection of built heritage only, a distinction should be made between the vegetation growing on walls and that growing in open spaces between them. Roots penetrating and expanding cracks in the walls accelerate their destruction. This is particularly important in climate zones where the temperatures can drop below zero, as in La Fortaleza, freezing the water accumulated in such cracks and, consequently, weakening the structure of the walls. On the other hand, every conservation practitioner can cite examples when growing root systems integrate with wall masonry, and become an important force that can stabilize a wall. This applies particularly to walls laid on earth or clay mortar, or dry masonry constructed without any mortar. Therefore, it is even recommended that:
“No attempt should be made to remove woody root systems from within the masonry of the monument until the plants have died and a decision can be taken on the best way of dealing with them. In some cases, it may be less damaging to leave the dead root systems within the walls than to dig them out.” [110] (p. 45).
Thus, while vegetation growth on the walls should generally be prevented, in the case of large trees already firmly rooted in the wall structure, a thorough analysis of the potential effects of their removal is recommended. Such analysis should also include the chemical interaction between the vegetation and the building materials. This applies in particular to sedimentary rocks (mainly sandstones and limestones), such as those found in La Fortaleza [2,111].
The problem is equally complicated for trees growing in the open spaces between the walls. Much depends on the soil conditions, especially structure and compaction, and periodic variability of moisture, but mostly on the individual properties of each tree species. It is generally thought that trees, especially the configuration of their root systems, can accelerate the rate of rainwater infiltration into the ground [112]. However, depending on the characteristics of individual species, they can reduce the depth of rainwater penetration. Much depends on the form of the root system (tangled, spreading, or heart-shaped) and the structure of the root matter (coriaceous and compact or spongy).
Another factor to consider, this time in both cases (the vegetation growing directly upon the walls, as well as in between them), is the mechanical impact of wind on high vegetation. As Mori presented during one of the group discussions, the wind affecting the tree crowns can result in the displacement of the tree trunk up to several centimeters at its very base near the ground. Depending on the type of soil, this causes temporary or permanent deformations of the ground and increased infiltration of rainwater. Again, the final effect will depend on many factors; wind speed and the spread of the tree crown and its height (forces affecting the posture of the trunk), the tree species (its mechanical properties and the type of root system), as well as the already mentioned mechanical properties of the soil. The probability of these trees toppling can be mitigated by nurturing and managing forest islands at selected locations on La Fortaleza’s surface. Management would entail fostering the development of ecological systems that provide more structural support and greater resilience for each tree.
Thus, each case requires a separate interdisciplinary analysis of the potential effects of the removal of vegetation before such an action is recommended. On the contrary, Alvarez, despite a lack of in-depth and interdisciplinary studies about the topic, recommended a complete removal of the vegetation of La Fortaleza, which he considered damaging to the heritage structures and with a negative incidence on the processes of drainage, infiltration, and insolation [82] (p. 54). However, before removing trees wholesale, it is necessary to research the soil’s specificity, the tree species at La Fortaleza, and the characteristics of their root system. Determining whether the trees are grubbed up or cut down, is also essential. The infiltration rate of rainwater into the ground will probably increase in either case. The drying (shrinking) and then rotting root system left by tree cutting would be a convenient path for rainwater to penetrate the deeper layers of the fill, especially in the case of trees with taproot systems. Tree grubbing, in turn, disturbs the soil structure, and rainwater penetrates more easily on loosened soil layers. In both cases, therefore, there is an unfavorable change in the hydric balance – less water flows over the ground surface, and more water soaks in.
In addition, after deforestation comes the problem of secondary growth, because forests naturally regenerate after disturbances of human origin. The effects of deforestation and the dangers of secondary growth are issues beyond the scope of this article that, given its importance for the conservation of La Fortaleza, will require separate botanical research.
4.3. Hydrological analysis
The purpose of these analyses is to use a “hydrologically correct” continuous, high-resolution terrain model (DTM) to delimit the margins and size of catchment areas, directions, and accumulations of the surface flow network. Hydrographic analyses in a GIS environment allow also for determining the catchment areas in relation to the drained area. Depending on the needs and scale of the study, analysis parameters, such as the classification of the slope gradient or the size of the catchment area, can be freely modified. All of them (Figure 27) constitute the basic input for further analysis and studies including the development of risk maps illustrating the impact of precipitation on La Fortaleza. The software package SURFER v. 22.3.185 [113] has been used additionally for preparing these input data. Later, it was used to produce contour lines and cross-sections through the terrain.
When plotting the results of geophysical surveys (ERT data) over the hydrological maps, we found good alignment between the two sources of information, in that the layers of soil lying below local depressions and main rainwater runoff lines have a higher level of humidity, as measured by a lower electrical resistivity value (Figure 20).
4.4. Risk maps
Evaluating our proposal about the significant impact of precipitation on the stability of the structured fill and perimeter walls of La Fortaleza required the preparation of a cumulative map with three essential risk elements:
The cumulative results are shown in Figure 28 d. These results are qualitative, not quantitative, due to a lack of detailed data on the absorptivity of soil, infiltration rate, the nature of the ground surface, and the surface water runoff rate dependent on it. In a future study, it will be possible to calculate the exact hydric balance using these parameters and the existing calculation of the area of individual catchments. Due to the lack of such data, we have conservatively calculated only five risk classes. Nevertheless, the presented cumulative risk map is a useful planning tool that can guide the mitigation solutions necessary to improve La Fortaleza’s structural integrity and permit its sustainable public use.
Satellite data, and more specifically, the Normalized Difference Water Index (NDWI), shed some additional light on this problem. As already mentioned in section 2.6, NDWI data allows for the estimation of soil moisture content. Such data, analyzed year after year, even if only qualitatively (Figure 29) can be confronted with hydric balance calculations.
4.5. Results of multitemporal studies on the area of the April 2022 collapses
During our studies, special attention was paid to the area of the April 2022 collapses. Several useful observations concerning the present conditions and the past of La Fortaleza were obtained by using different multitemporal data sets and methodological approaches.
4.5.1. Technomorphological study of the perimeter wall collapse in April 2022
In April 2022, a series of five subsequent collapses brought down a large segment of the southern perimeter wall of La Fortaleza (Figure 30A,B). The first collapse, late in the afternoon of April 10th, occurred almost directly west of the margins of the portion of the southern perimeter wall repointed with modern mortar. Nearly 12 meters of wall collapsed, and only two to four lower courses of stone blocks remained in situ (Figure 30C, 1). The total area of the damage was ca. 116 m2 but the further 80 m2 of wall facing has been structurally affected. This led to subsequent collapses, progressing mainly towards the east, and the total area of destruction increased to almost 285 m2 (Figure 30C, 2), including nearly 85 m2 of the repointed portion of the wall (Figure 30C, 4). Since the mean thickness of the stone wall is ca. 0.68 m, as calculated from 15 randomly chosen façade blocks, this results in ca. 193 m3 of fallen wall face.
Thanks to pre-collapse TLS data collected by Kucera, VanValkenburgh and Rojas and to the unrolling of the resulting 3D model, it was possible to reconstruct the arrangement of blocks in the missing part of the wall and propose the first estimates of techno-morphological studies (Figure 30D).
This section of the perimeter wall is extremely non-homogeneous and individual fragments can be easily distinguished. They may correspond to a complex sequence of technological and/or chronological phases (Figure 30D, 5). At the current stage of research, it is not possible to determine the chronology of events leading to the development of a Harris matrix for this wall, as in the proposed methodology for techno-morphological studies [107] (Figure 17.5; 17.15; 17.19). Despite this, several observations have been collected, which are interesting from the point of view of Chachapoya building techniques.
Within the analyzed area of the wall, four separate kinds of stonework can be distinguished. The first represents coursed masonry (Figure 30D, 5). Stone blocks there, typically 24-48 cm high, are well-shaped and laid in almost horizontal two to four courses. There is a clear tendency to use blocks of similar height within one layer. These uniform fragments of stonework occur mainly in the upper eastern section of the analyzed wall and the lower western section. Their length in the western part is up to 16 meters, and in the eastern part, it exceeds 22 meters. This part of the masonry can be interpreted as the result of the activity of a larger, well-organized group of skilled stonemasons. Perhaps these are remains of the primary construction phase. The other fragments of this stonework type are irregularly scattered over the remaining part of the analyzed wall. They occur in sections approximately 3.5 meters long, which may correspond to the width of the front work of a small stonemason team. For now, we cannot determine whether these are the remains of the primary phase of construction or repairs done by better-skilled stonemasons.
Sections of coursed masonry border with fragments of uncoursed stonework (Figure 30D, 7). Here, the adjacent blocks have different heights, ranging between 13 and 65 cm. Such type of stonework occurs in sections 0.6-1.3 meters high and 2.5-5 meters long, and can be interpreted either as belonging to the primary phase, but executed by less skilled stonemasons, or as secondary repairs.
What attracts the most attention are long sections of the wall, usually built from one layer of ashlars (Figure 30D, 8). Their lengths range from several to a dozen or so meters and they usually overlap fragments of coursed and uncoursed masonry. The height of the stone blocks used in these layers varies greatly - from flat slabs only 9 cm thick to ashlars over 35 cm high; however, within one layer, the differences in the height of the blocks are small, so that their upper surface forms a common plane. We interpret these layers as leveling layers, merging the underlying stonework fragments and equalizing the upper working surface. The average vertical distance between such layers is about 0.8 meters, but extreme values range from 0.5 to 1.2 meters. This corresponds to the height to which even a heavier stone block can be comfortably lifted. The vertical distribution of these layers probably corresponds to the stages of building the perimeter wall. Work would have been carried out on the inside of the wall, and as it progressed, the backfill would have been raised to minimize the height to which the stone blocks had to be lifted. This interpretation allows for a more precise distinction about the origins of uncoursed masonry. If it is adjacent to fragments of coursed masonry and at the same time covered with a leveling layer, we can assume that it belongs to the original construction phase, but was built by less skilled masons. Otherwise, they would probably be traces of repairs.
The last distinguishable type of stonework is randomly scattered small irregular patches (Figure 30D, 9). Their width varies between 1 and 2 meters, and their height usually does not exceed 1.5 meters. The choice of stone materials is random and their horizontal joints do not correspond with bordering fragments of masonry. These are either less careful filling of gaps left between larger sections of works, or traces of ad hoc repairs. The concentration of these patches on the margins of the collapse from April 2022 (Figure 30D, 10) marks a zone where there may have been previous problems with the stability of the perimeter wall, and the whole wall section was already weakened.
Figure 30.
The area of the perimeter wall collapse on April 2022: (A) the southern perimeter wall after the first collapse of April 10th (Photo: N. Anazco); (B) the same area after the subsequent series of collapses (Photo: R. Vigo); (C) margins of the collapses, TLS data by Kucera, VanValkenburgh and Rojas, 3D modeling and surface unrolling by Kościuk; (D) techno-morphological study, elaborated by Kościuk; (1) collapsed part of the wall; (2) damaged and unstable part of the wall resulting from the 1st collapse on April 10th; (3) part of the wall repointed with modern mortar; (4) part of the repointed wall fallen down in subsequent collapses; (5) margins of technological and/or chronological phases; (6) coursed masonry; (7) uncoursed masonry; (8) leveling layers; (9) patches of irregular masonry; (10) zones of vertical concentration of patches; (11) perimeter wall; (12) collapsed parts of the perimeter wall; (13) main rainwater flow lines; (14) subsidiary rainwater flow lines; (15) minor rainwater flow lines; (16) modern drainage disposing water just behind the perimeter wall.
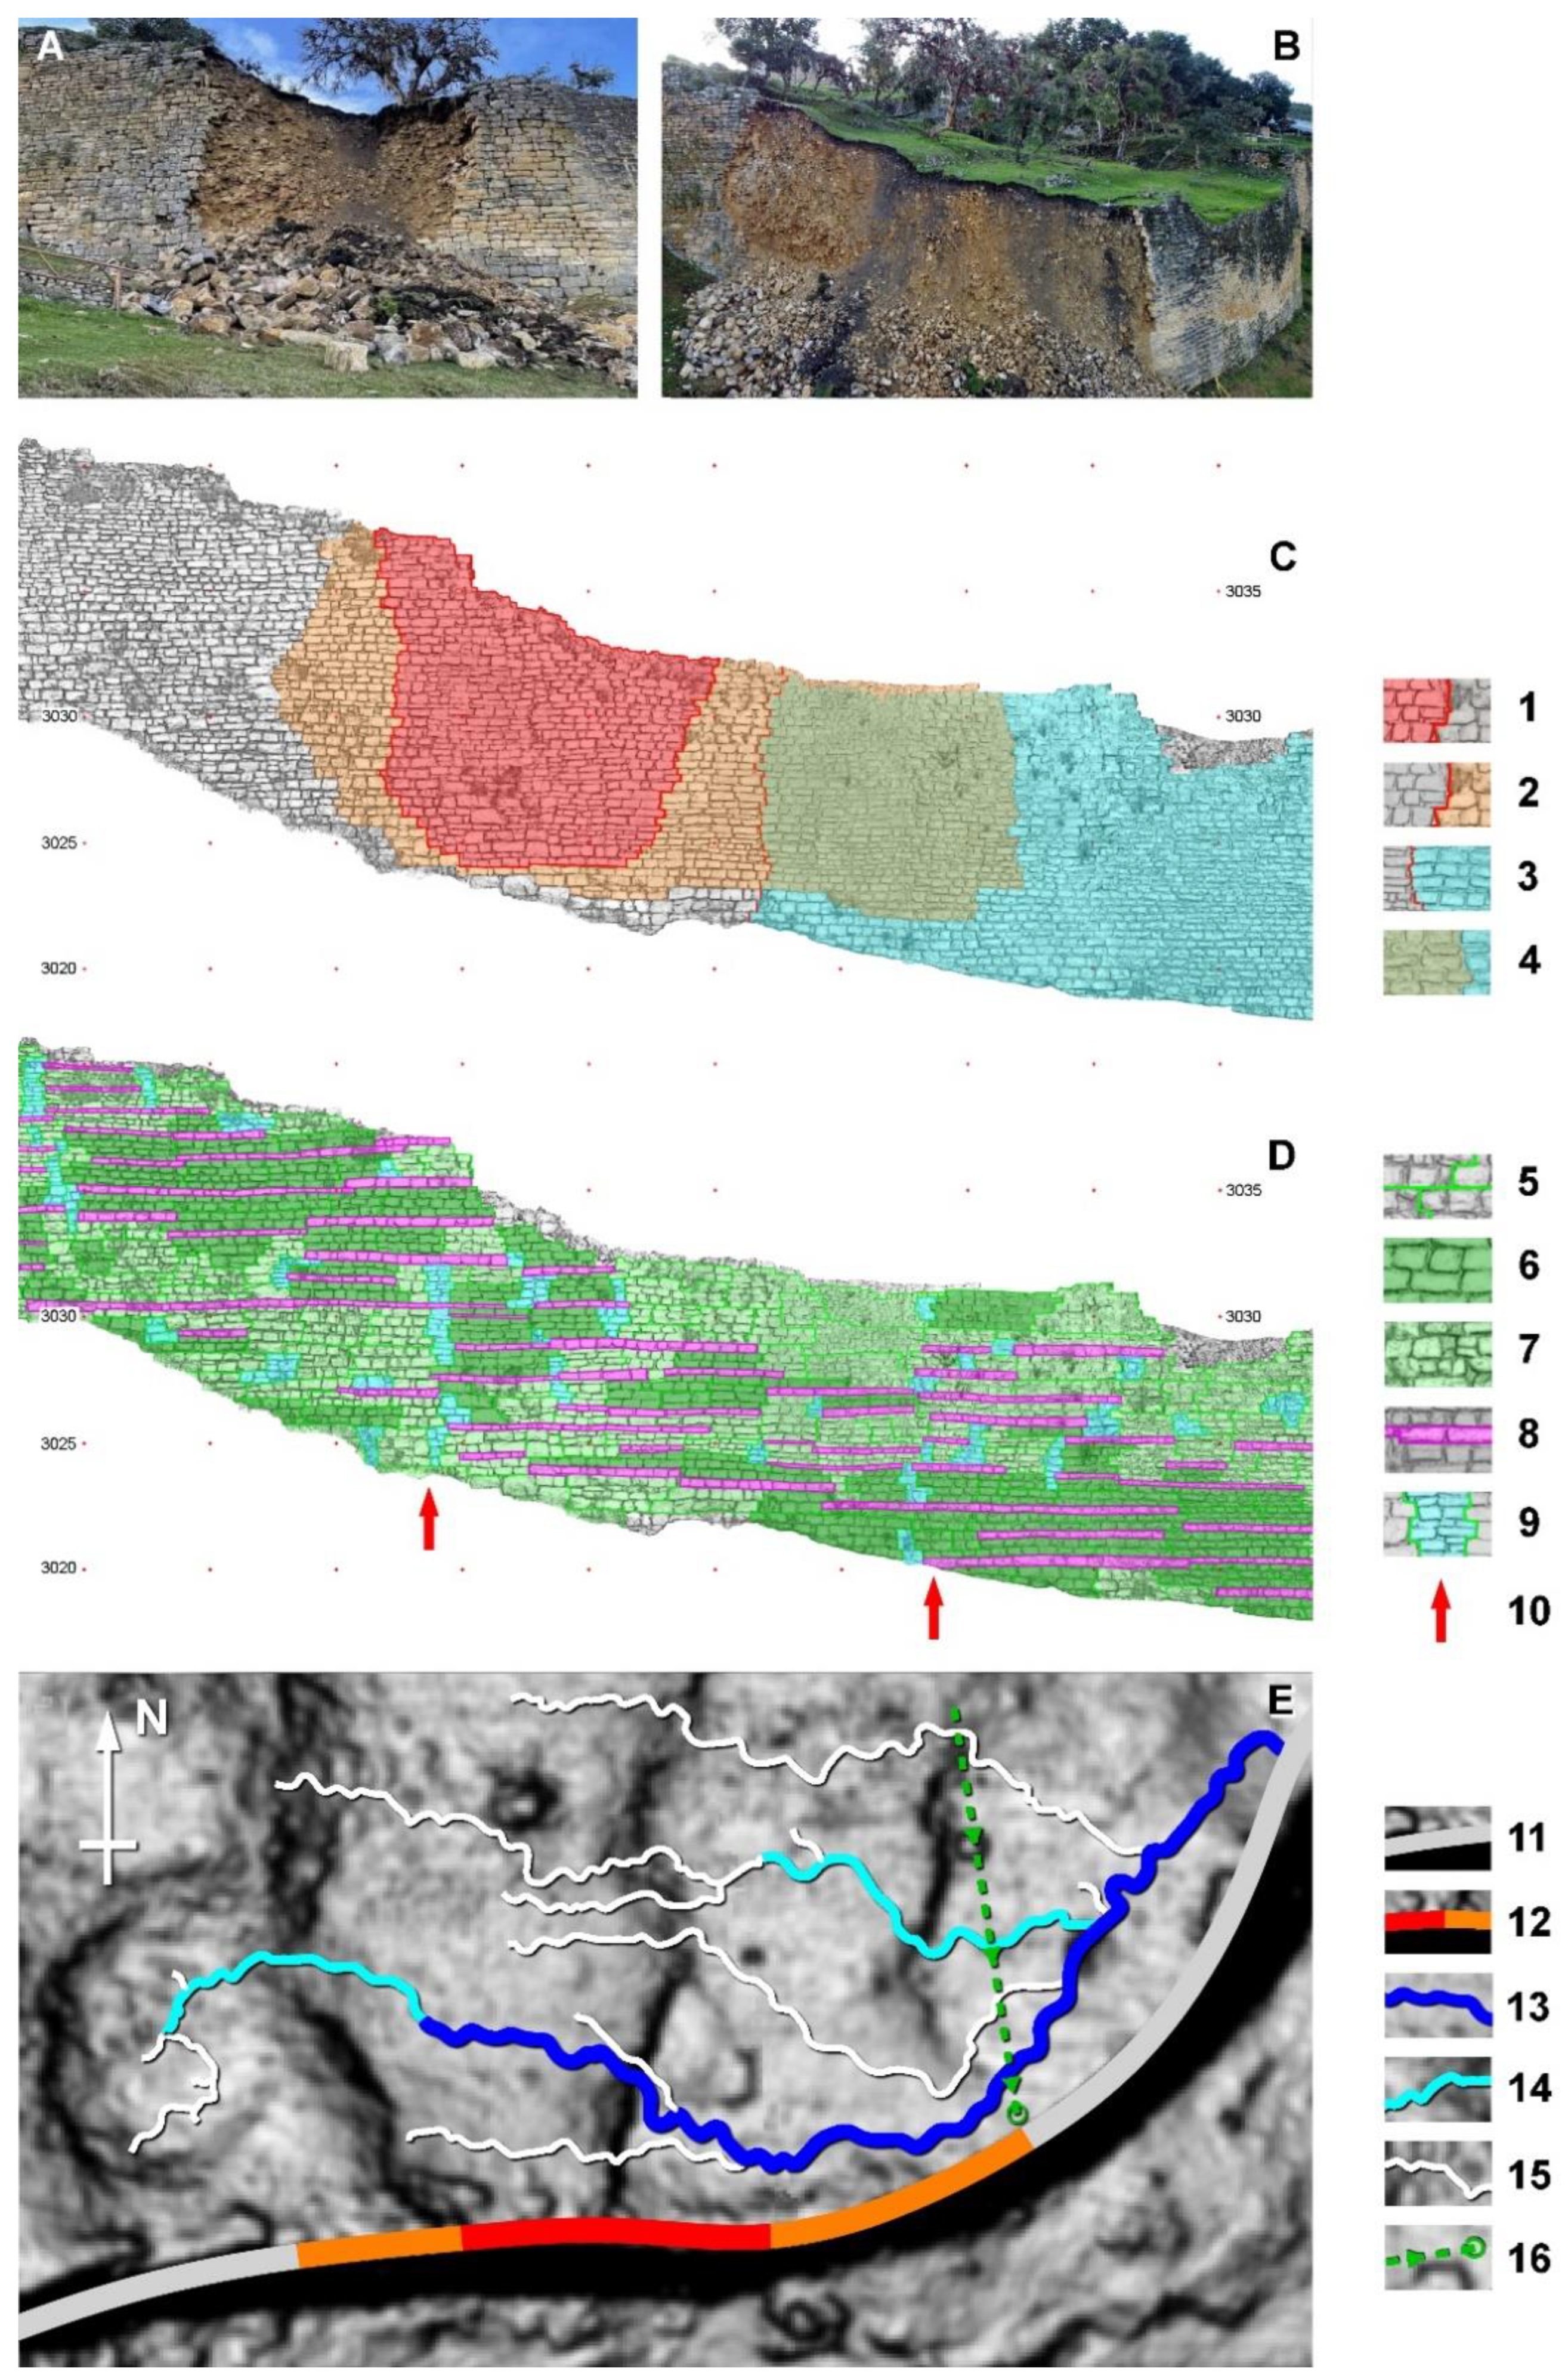
Thus, some preliminary conclusions can be drawn about the causes of the April 2022 collapse from the perspective of techno-morphological studies. Besides the above-mentioned historical circumstances, and the conditions of the interior layers of the platform, attention must be paid to the local topography of this section of La Fortaleza (Figure 30E). The most devastating factor for slope failures is rainfall infiltration [114,115]. In the area that collapsed in 2022, unfavorable slopes resulted in the concentration of the main rainwater flowlines along the perimeter wall (Figure 30E, 13), causing water seepage into the deeper layers of the fill, the degradation of the angle of natural ground slope (the greatest angle at which the ground can stay balanced on a slope), and consequently, an increase in the pressure of the platform’s fill against the perimeter wall.
These unfavorable historical, sub-surface and surface conditions were additionally compounded by a modern drainage system that had ceased to function due to the lack of maintenance (Figure 30E, 16). The outlet of the drainage collecting rainwater from almost 2000 m2 was placed directly behind the perimeter wall, and because it had fallen into disrepair, its leakage increased the pressure of the moist ground. Water stains on the still-standing parts of walls (Figure 22 and Figure 30B) indicate that the pipe leaked a significant amount of water in this area.
4.5.2. Estimations of the collapsed volume
Thanks to an analysis based on TLS data from the period before the collapse and IBM data collected immediately after it (Section 3.6.3), Kucera was able to calculate the volume of the collapsed part of the perimeter wall of La Fortaleza (Figure 31). These calculations and estimations result in an overall mass movement of 466.3 ± 25 m3. Additionally, using Kościuk's calculations regarding the volume of the stone masonry component of the fallen structure, the volume of the fill that slid together with the wall face would be approximately 273 ± 25 m3. These calculations, even if only approximate and subject to an error of at least 5%, can be very useful in planning future reconstruction works.
4.5.3. An attempt to reconstruct the pre-Hispanic sequence of events in this area
This area is labeled Las Terrazas in site plans, and described as terraced and sunken in relation to Templo Mayor, with no buildings, due to its ritual function [116]. Yet, there is evidence, on the eastern end of this sector, of a large pre-Hispanic collapse involving an area of approximately 210 m2 (Figure 33, 3). The surface signs of destruction, recorded on photographs and LiDAR-based DTMs, indicate that a section of the perimeter wall, longer than the 2022 collapse, and its corresponding construction fill, collapsed in pre-Hispanic times, involving at least 1250 m3. The evidence for this interpretation is described below.
This section of the southeastern perimeter wall was partially rebuilt in pre-Hispanic times, leaving marked differences between the original and rebuilt segments: a dissimilar height between the two sections in the top of the wall (Figure 32C, Figure 22); technomorphological differences in stonework between the sections (Figure 32A,B); a zig-zagging vertical interface between the sections (Figure 32C,D); a leveling layer that separated the intact and rebuilt sections (Figure 32D–E), and protruding portions of construction.
Behind this portion of the perimeter wall lies Las Terrazas, where the surface of La Fortaleza is evidently much lower than zones to the west (red colors in Figure 33A) and north (yellow, green colors in Figure 33A). In this surrounding higher ground, which we call here Area I, well-preserved relics of Chachapoya round buildings and one rectangular construction are visible. Las Terrazas can be subdivided into two: Its upper part, Area II (yellow, green, and cyan colors in Figure 33A), shows previously unknown circular depressions, probably the remains of Chachapoya buildings (Figure 33, 4), and some straight edges with a northwest orientation that appear to be archaeological excavations [84,117]. The steep step between Area I and Area II in the northwest corner of Las Terrazas was secured in the past by 1.5 m high retaining walls, to hold the ground under a rectangular building interpreted as Inka in origin (Figure 33A). It indicates that this pre-Hispanic collapse occurred before Inka renovations of the area. Thus, some walls in Area II are from the Chachapoyas and/or Inka occupations, while others, as indicated by their stonework, are from the contemporary research and conservation works. Their precise distinction requires detailed field examination and the analysis of the reports from these interventions.
Data from Kucera shows that the angle of the splinter wedge of the collapse of April 2022 is around 57 degrees (Figure 33B 1) as opposed to the 11-degree slope of the platform’s surface in Area II (Figure 33C 3), or loose landslide debris at the foot of the 2022 collapse, which accumulated at an angle of 26 degrees (Figure 33B 2). Therefore, the current slope of 11 degrees in Area II cannot be understood as the result of a landslide. These values are characteristic: the splinter wedge angle in the range of 55 +/- 10 degrees is also visible on other collapses in Kuelap, and the slopes in a range of 10 degrees are typical in many areas of La Fortaleza’s surface. Kucera’s data shows also that the horizontal extension of the splinter wedge is in the range of 4.2 meters (Figure 33B).
The lowest zone, Area III, located on the eastern end of Las Terrazas (blue, navy-blue colors in Figure 33A), has no clear traces of earlier buildings. As detailed above, its perimeter wall was once rebuilt. If we assume this indicates that a collapse occurred in this place in the past, and that the split wedge angle was identical, then the horizontal extent of the landslide would be 6.5 meters, approximately. Thus, its hypothetical margins will coincide with the visible ground edge of the deepest part of Area III (Figure 33A). These are probably traces of the edge of a landslide that was not fully refilled (or the settled loose refill) when the perimeter wall was partially rebuilt. It seems this collapse further extended to the north, potentially threatening buildings standing there and in immediately adjacent areas.
Area II also requires additional analysis. As already stated, it slopes eastwards at a safe angle of 11°, lowering the possibility of past landslides in the area. However, there are numerous ground imprints of the foundations of circular buildings (Figure 33A, 4). Save for one circular imprint on the north margin between Area II and Area III, they are generally too removed from Area III to have been swept away by the proposed pre-Hispanic collapse. Thus, they can be interpreted alternatively as evidence of the intentional lowering of the terrain along with the demolition of buildings that may have stood on the site. Before the abandonment of La Fortaleza, this part of the platform had no buildings and, contrary to the ritual interpretation often offered for Las Terrazas, it was probably considered endangered, and was vacated.
A basic question concerns the timing of these events. Although the final answer will only be possible after more detailed archeological research, we put forward a tentative sequence. The superposition of Inka constructions over dismantled Chachapoya buildings, differentiated by stratigraphy and their stonework, indicates the renovation of the northwest part of Area II dates to the Inka occupation. Since these renovations were concentrated on the northwest corner of Area II, a circular ground imprint on the north margin between areas II and III would not be a demolition but a Chachapoya building affected by the collapse of Area III (Figure 33, 4). Thus, the pre-Hispanic collapse in Area III would date to Chachapoya times. The intentional lowering of Area II may result from earthworks (moving the soil or shaping the terraces) carried out there, which might have taken place during the Inka occupation. This may have coincided with Inka construction activity in the central part of Pueblo Alto. Some of the fill material possibly removed from Area II (estimated as less than 5000 m3) could have been used even in pre-Inka times to fill the landslide in Area III (probably not more than 1250 m3), and the rest, together with material from the possible demolition of buildings, may have been used for the Inka works in Pueblo Alto. Additionally, in modern times, the site was further reshaped by archaeological investigations carried out there. Dating the reconstruction of the perimeter wall after its collapse (Figure 32) remains uncertain, although the minimal variation in the type of stonework between the original and the rebuilt sections suggests it was done by Chachapoya masons.
Figure 33.
The region of the April 2022 collapse in the southeast corner of La Fortaleza: (A) hypsometric plan; (B) profile B-B (data by Kucera); (C) profile C-C; (1) collapsed part of the perimeter wall; (2) horizontal extent of the April 202 collapse; (3) horizontal extent of hypothetical pre-Hispanic collapse and its northern extension; (4) ground imprints from dismantled or destroyed circular buildings; (5) profile locations; (6) preserved surface of the La Fortaleza platform; (7) splinter wedge; (8) loose landslide debris; (9) slope inclination angles. Elaborated by Kościuk.
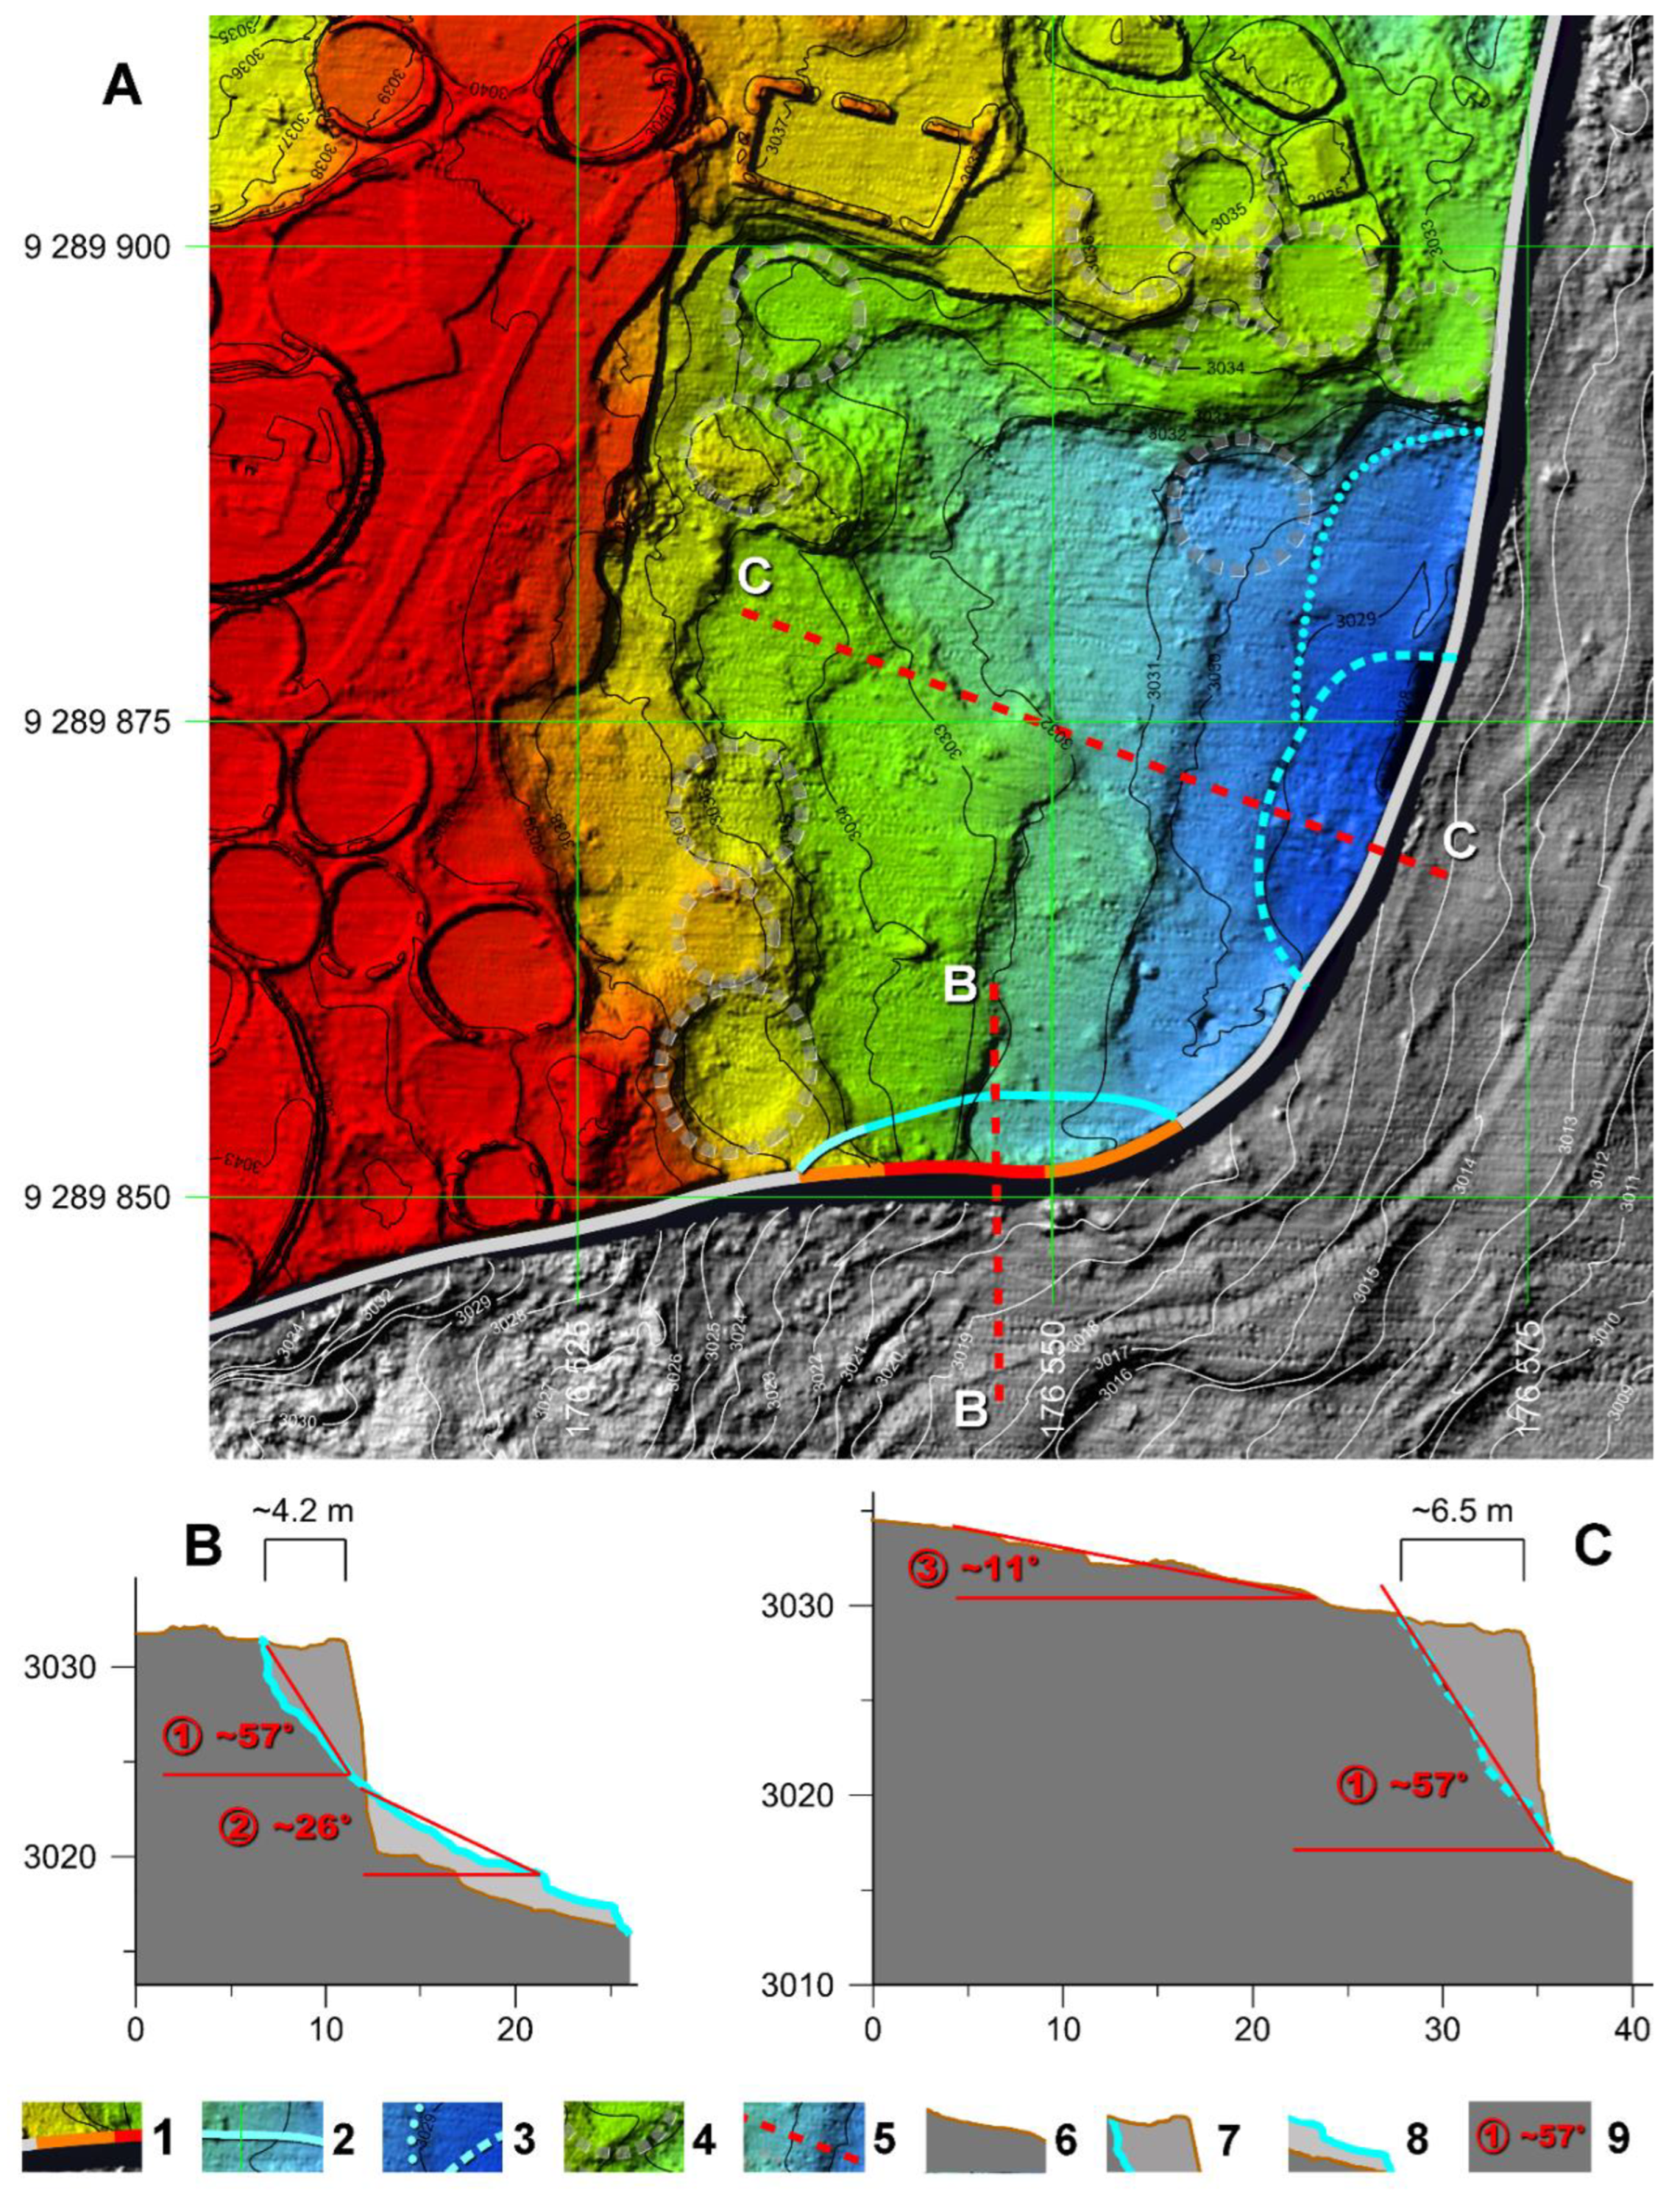
The research described in this section reveals stability problems in this part of La Fortaleza since pre-Hispanic times. Despite ancient and contemporary attempts to solve them, the problems continued up to the present and were an important structural factor in the collapse of the southern perimeter wall of 2022.
4.6. Problem of contemporary repointing of the perimeter wall
From the restoration and aesthetic points of view, the decision to repoint the retaining walls of La Fortaleza is at least questionable. According to the principles of conservation, modern treatments applied to the historical structure of a wall should use methods and materials similar to the original ones, and should not change the visual appearance of the monument. Meanwhile, the repointed facades of La Fortaleza resemble modern river embankments more than the original stonework of the Chachapoyas, who used clay-earth mortars. Of course, over time, such mortars were washed out and eroded by the wind.
Attention should also be paid to the properties of the contemporary mortar used for the repointing between stone blocks at La Fortaleza. Its grain size curve (Figure 34B) differs considerably from the original mortar (Figure 34A). It corresponds more to the characteristics of clay-loam soils (Figure 34C) than to the recommendations for building mortars (Figure 34E).
In the original mortar, approximately 20% of the grains are in the range of ca. 5-40 mm. This fraction is practically absent in the mortar used for conservation. Here, approximately 75% are grains smaller than 5 mm, half of which are smaller than 0.5 mm. Unlike the original one, this grain composition results in a very tight mortar, which prevents rainwater that infiltrated into the ground behind the retaining wall from seeping through. This effect of eliminating unsightly streaks on the face of the wall may be aesthetically desirable, but it leads to the accumulation of water behind the retaining wall, as revealed by the differences in water percentage measurements on the mortar samples [84]. The moist, plasticized soil begins to press on the retaining wall, which may result in its collapse. So, it is not surprising that the collapse of April 2022 happened on the border between the repointed and original zones (Figure 34C).
The lime present in the mortar used for restoration increases its strength. Again, there are two conflicting requirements. On one hand, a stronger repointing mortar strengthens the wall. On the other hand, it is a basic rule that the mortar should have significantly lower strength than the material used to build the wall. Otherwise, an unfavorable stress distribution occurs, and the material cracks. The cracks in stone blocks observed in January 2022 may be the result of such a phenomenon (Figure 35A).
Considering all the aesthetic, restoration, and technical concerns mentioned above, the methods used in the conservation of Machu Picchu walls would be more recommended. A slightly moist clay-earth mortar is used there, firmly compacted in the joints between the blocks (Figure 35B). Even so, in the case of the nearly 20-meter-high perimeter walls of La Fortaleza and the unfavorable precipitation conditions, it is advisable to leave every second vertical joint open. This will enable the natural evacuation of the rainwater that might accumulate behind the perimeter wall. However, it means consenting to some unsightly stains developing on the walls. Proper micro-landscaping on the top of La Fortaleza and a well-designed drainage system can minimize these undesirable effects. The priority should be to keep the walls of La Fortaleza in good technical condition, with their visual appearance consistent with historical truth.
5. Conclusions
The results of this study highlight the benefits associated with the integrated use of data obtained through various remote sensing techniques. We have validated our main hypothesis that the root cause for the collapse suffered by La Fortaleza under anomalously high seasonal rains on April 2022 was the increasing moisture within the fill enclosed by its perimeter wall. To test this hypothesis, we integrated data from multiple research projects applying a variety of close-range remote sensing and near-surface archaeogeophysical technologies to address two fundamental questions: Is there a correspondence between surface rainwater runoff and soil moisture? And, if so, which features of the terrain micro-landscape pose significant risk, and in which specific places do these threats occur? In doing so, we have arrived to the following conclusions for La Fortaleza:
- hydrological studies based on LiDAR data, confronted with topographical risks and the results of electrical resistivity surveys, confirm that the layers lying below local depressions and main rainwater runoff lines tend to have a higher level of humidity;
- the resulting risk maps point to several primary flow lines running along (and thus, infiltrating water into) the perimeter walls. Not surprisingly, the 2022 collapse occurred on such a location under historically high precipitation conditions. Thus, the risk maps can guide mitigation interventions to improve La Fortaleza’s structural integrity and permit its sustainable public use;
- the results of a seismic refraction survey additionally point out the fact that the pressure of groundwater on the perimeter walls is intensified by the unfavorable arrangement of internal layers that are impermeable to water infiltration.
- hydrological and deforestation analysis based on satellite imagery draws attention to the problem of high vegetation covering La Fortaleza, and the need for its in-depth analysis in specific local conditions, which will determine the necessary balance between threats and benefits related to the deforestation of the platform;
- the integration of IBM and TLS data creates a platform for a techno-morphological analysis, providing a better understanding of the perimeter wall structure around the area of the April 2022 collapse, and shedding light on the chronology of events;
- multitemporal IBM and TLS data allows a reconstruction of the arrangement of stone blocks in the collapsed part of the perimeter wall, revealing the coincidence between the margins of the collapse, pre-Hispanic repairs, and contemporary repointing.
- the coincidence between the margins of the collapse and those of repointing draws attention to the questionable, from the point of view of the principles of monument restoration, contemporary use of a tight and strong conservation mortar, which prevents rainwater infiltrated into the ground from seeping through;
- the use of multitemporal IBM and TLS data allowed for the calculation of the volume of the recent collapse, providing a basis for the realistic planning of future restoration;
- combined data from IBM, TLS, LiDAR, and ground-truthing allow us to identify a pre-Hispanic collapse in the area later affected on April 2022, showing that the adverse sub-surface conditions in Las Terrazas sector of La Fortaleza may have been at play for centuries, leading to its abandonment and to the instability seen at present;
- unfavorable historical, subsurface and surface conditions for rainwater drainage, repointing with a tight mortar, a non-functioning modern drainage system, and anomalously high precipitation in the weeks prior created “perfect storm” conditions for a collapse in a particular location of the southern perimeter wall of La Fortaleza.
Altogether, our study demonstrates the potential of combining data acquired using multiple remote sensing technologies, collected by multiple teams on separate research projects during different research seasons, to analyze and interpret such a multifactorial dilemma. These tools allow us to generate a more complete and nuanced understanding of history, present conditions, and potential risks that threaten this and other monuments and archaeological landscapes constructed in per-humid environments, by now regularly subjected to extreme climatic conditions.
Two additional issues should be highlighted. First, archaeological sites as important as La Fortaleza should be monitored on an ongoing basis. Currently, one of the most effective methods is the combination of high-resolution IBM and TLS, a simple way to detect in advance possible structural deformations and take appropriate remedial steps. Such sites should also have detailed "stone by stone" documentation prepared by professionals who understand the structures being documented. As this case study has shown, carrying out conservation works based on schematic plans can lead to serious mistakes of interpretation and practice.
Second, more studies are required to make strategic decisions regarding archaeological sites located in such complex and difficult conditions as La Fortaleza. Even if such studies are available, it is not advisable to apply the resulting solutions immediately on a large scale. It is safer to use small test areas where possible failures will not have dramatic consequences. The Kuelap Complex, which includes several pre-Hispanic sites other than La Fortaleza, would be a good "testing-ground", where some areas are treated experimentally and conservators develop a full understanding of how to conserve them without inadvertently triggering their deterioration. Thus, future research must avoid validating the development of other sites for tourism using only our current knowledge. High ceja de selva sites are a challenge to conservators, and more data is required on how to manage the infiltration of rainwater and the quick growth and spread of vegetation.
Author Contributions
Conceptualization, I.G. and J.K.; methodology, I.G. and J.K.; investigation, I.G., J.K., W.Ch., P.V., B.C., P.D., M.K., N.M., G.R., S.S., J.C and C.R.; resources, I.G.; writing—original draft preparation, I.G., J.K., W.Ch. and P.V.; writing—review and editing, I.G., W.Ch. and P.V.; visualization, I.G., J.K., W.Ch., B.C., P.D., M.K., N.M, G.R., S.S., J.C.; supervision, I.G.; project administration, I.G.; funding acquisition, I.G. All authors have read and agreed to the published version of the manuscript.
Funding
Publication fees, postprocessing of LiDAR data, DTM creation, hydrological, deforestation and satellite image analysis, risk maps, and fusion of IBM and TLS were supported by funds from Instituto de Investigaciones Arqueologicas (IDARQ), of Lima, Peru. The research on background information and the reconstruction of a past sequence of events in the collapsed area was supported by the “Unites States Ambassador’s Fund for Cultural Preservation 2023.” Drone LiDAR data collected by Righetti and colleagues in 2019 was supported by MEDS AMSTERDAM. Drone LiDAR data collected by VanValkenburgh et al in 2018 was supported by Grant HJ-044R-17 from the National Geographic Society. The collection of terrestrial LiDAR data by VanValkenburgh, Kucera and Rojas in 2019 was supported by funding from Brown University and the Ludwig Boltzmann Institute for Archaeological Prospection and Virtual Archaeology. Seismic refraction data collected by Mori was supported by Ministerio de Cultura del Peru. Some of the analyses and simulations were performed on the software and computer facilities of the Laboratory of 3D Scanning and Modeling at the Department of History of Architecture, Arts and Technology (Wroclaw University of Science and Technology), and the Department of Environmental Protection and Development (Wrocław University of Environmental and Life Sciences). The work also received substantive and logistical support from the Centre of Andean Studies in Cusco.
Data Availability Statement
Data cannot be shared to unauthorized persons because of laws protecting Peruvian cultural heritage. The data presented may be available to researchers who meet the criteria for access to confidential data on request from the corresponding author.
Acknowledgments
Special thanks to the Ministry of Culture of Peru and the Director of Proyecto de Investigacion Arqueologica Kuelap, Jose Bastante, for their permission and kind assistance with this research project. Congresspeople Edward Malaga and Mery Infantes provided invaluable contacts with regional authorities. Jindley Vargas, president of Frente de Defensa de los Intereses de la Provincia de Chachapoyas, offered logistical support for our photogrammetric surveys. We have received support in kind from Ivan Bardales, major of Nuevo Tingo and Hotel Pumaurco in Chachapoyas. We are grateful for aerial photographs from Gordon Wiltsie and Martin Chumbe, and drone photographs from Roger Vigo and Napoleon Vargas.
Conflicts of Interest
The authors declare no conflicts of interest.
References
- Basadre, M. Torre de Babel en el Perú. Boletín de la Sociedad Geográfica de Lima 1892, 1, 440–448. [Google Scholar]
- Bradley, R. The architecture of Kuelap; Columbia University: 2005.
- Narváez, A. Kuélap: una ciudad fortificada en los Andes nor-orientales de Amazonas, Perú. Arqueología de la Arquitectura, 1987; 115–142. [Google Scholar]
- Von Hagen, A. Pueblo de las Nubes. Chachapoyas: El Reino Perdido, AFP Integra, Lima, 2002; 24. [Google Scholar]
- Guengerich, A. Settlement organization and architecture in late intermediate period Chachapoyas, Northeastern Peru. Latin American Antiquity 2015, 26, 362–381. [Google Scholar] [CrossRef]
- Mincetur. Sistema de información Estadística de Turismo. Available online: http://datosturismo.mincetur.gob.pe/appdatosturismo/Content2.html (accessed on 04/08/2023).
- De la Vega, G. Comentarios Reales de los Incas; 2021 1609.
- Church, W.; Guengerich, A. La (re) construcción de Chachapoyas a través de la historia e histografía. Boletin de arqueología PUCP, 2017; 5–38. [Google Scholar]
- Guengerich, A.; Church, W. Una mirada hacia el futuro: nuevas direcciones en la arqueología de los Andes nororientales. In Que fue Chachapoyas? Aproximaciones Interdisciplinarias en el estudio de los Andes Nororientales del Peru, Church, W., Guengerich, A., Eds.Mauricio, A.C., Ed.; Boletin de arqueología PUCP; Pontificia Universidad Catolica del Peru: Lima, 2017; Volume 2, pp. 313–334.
- Zevallos, J. Introducción a la etnohistoria de Chachapoyas. Kuelap (Boletin del INC/Amazonas), 1987. [Google Scholar]
- Cook, N.D. Population data for Indian Peru: sixteenth and seventeenth centuries. Hispanic American Historical Review 1982, 62, 73–120. [Google Scholar] [CrossRef]
- Cook, N.D. Demographic Collapse: Indian Peru, 1520–1620; Cambridge University Press: 2004; p. 324.
- Ferguson, R.B.; Whitehead, N.L. The violent edge of empire. In War in the tribal zone: Expanding states and indigenous warfare, Ferguson, R.B., Whitehead, N.L., Eds.; School of American Research Advanced Seminar Series; School of American Research Press: Santa Fe, New Mexico, 1992; pp. 1–30.
- Langlois, L. Utcubamba: investigaciones arqueológicas en el valle de Utcubamba (Departamento de Amazonas, Perú); Impr. del Museo Nacional: 1939.
- Bonavia, D. The role of the ceja de selva in the cultural development of pre-Columbian Peru. In The Inca World: The Development of Pre-Columbian Peru, AD 1000–1534, Minelli, L., Ed.; University of Oklahoma Press: Norman, 2000; pp. 121–131. [Google Scholar]
- Young, B.; Young, K.R.; Josse, C. Vulnerability of tropical Andean ecosystems to climate change. In Climate change and biodiversity in the tropical Andes, Herzog, S.K., Martinez, R., Jørgensen, P.M., Tiesse, H., Eds.; Scientific Committee on Problems of the Environment (SCOPE), Inter-American Institute for Global Change Research (IAI): 2011; pp. 170–181.
- Rehm, E.M.; Feeley, K.J. The inability of tropical cloud forest species to invade grasslands above treeline during climate change: potential explanations and consequences. Ecography 2015, 38, 1167–1175. [Google Scholar] [CrossRef]
- Young, K.R. Annual precipitation at Kuelap. 2023.
- Young, K.R.; León, B. Peru’s humid eastern montane forests: An overview of their physical settings, biological diversity, human use and settlement, and conservation needs; Centre for Research on the Cultural and Biological Diversity of Andean Rainforests (DIVA): 1999; pp. 1–97.
- Plekhov, D. Terraced Landscapes: The Historical Ecology of Agricultural Infrastructure. Brown University, 2022.
- Church, W.; Valle, L. Gran Pajatén y su contexto en el paisaje prehispánico Pataz-Abiseo. In Que fue Chachapoyas? Aproximaciones Interdisciplinarias en el estudio de los Andes Nororientales del Peru, Church, W., Guengerich, A., Eds.Mauricio, A.C., Ed.; Boletin de arqueología PUCP; Pontificia Universidad Catolica del Peru: Lima, 2017; Volume 2, pp. 57–93. [Google Scholar]
- Bush, M.B.; Mosblech, N.A.S.; Church, W. Climate change and the agricultural history of a mid-elevation Andean montane forest. The Holocene 2015, 25, 1522–1532. [Google Scholar] [CrossRef]
- Matthews-Bird, F.; Valencia, B.G.; Church, W.; Peterson, L.C.; Bush, M. A 2000-year history of disturbance and recovery at a sacred site in Peru’s northeastern cloud forest. The Holocene 2017, 27, 1707–1719. [Google Scholar] [CrossRef]
- Åkesson, C.M.; Matthews-Bird, F.; Bitting, M.; Fennell, C.-J.; Church, W.B.; Peterson, L.C.; Valencia, B.G.; Bush, M.B. 2,100 years of human adaptation to climate change in the High Andes. Nature ecology & evolution 2020, 4, 66–74. [Google Scholar]
- Vázquez de Espinosa, A. Description of the Indies (c. 1620), reprint ed.; Smithsonian Institution Press: 1968; Volume 102, p. 862.
- Newell, F.L.; Ausprey, I.J.; Robinson, S.K. Spatiotemporal climate variability in the Andes of northern Peru: Evaluation of gridded datasets to describe cloud forest microclimate and local rainfall. International journal of climatology 2022, 42, 5892–5915. [Google Scholar] [CrossRef]
- Lasaponara, R.; Masini, N. MT-InSAR remote sensing technique to assess conservation conditions of Kuelap; 2; Ministerio de Cultura: Lima, 31-03-2023 2023; p. 43.
- Lutz, D.A.; Powell, R.L.; Silman, M.R. Four decades of Andean timberline migration and implications for biodiversity loss with climate change. PloS One 2013, 8, e74496. [Google Scholar] [CrossRef]
- Mata-Guel, E.O.; Soh, M.C.K.; Butler, C.W.; Morris, R.J.; Razgour, O.; Peh, K.S.H. Impacts of anthropogenic climate change on tropical montane forests: an appraisal of the evidence. Biological Reviews 2023, 1200–1224. [Google Scholar] [CrossRef]
- de Cieza de Leon, P. The Discovery and Conquest of Peru; Duke University Press: 1999 [1553]; p. 520.
- Jimenez de la Espada, M. Relaciones geográficas de Indias: Perú; Martínez Carreras, J.U., Ed.; Ediciones Atlas: Madrid, 1965 [1897]; p. 661.
- Bandelier, A.F.A. The Indians and aboriginal ruins near Chachapoyas in Northern Peru; New York, 1907 [1893]; p. 51.
- Espinoza Soriano, W. Los señoríos étnicos de Chachapoyas y la alianza hispano-chacha: siglos XV-XVI. Revista Histórica 1967, 30, 224–333. [Google Scholar]
- Ruiz Estrada, A. Alonso de Alvarado: Primer propietario de Kuelap El Clarin January 24 2020.
- Schjellerup, I.; Quipuscoa, V.; Espinoza, C.; Peña, V.; Sørensen, M.K. The Chilchos Valley Revisited: Life Conditions in the Ceja de Selva, Peru; The National Museum of Denmark: Copenhagen, 2005; Volume 2, p. 424. [Google Scholar]
- Narváez, A. Kuelap: Centro del poder politico y religioso de los Chachapoyas. In Los Chachapoyas, Kaufmann, F., Ed.; Arte y Tesoros del Antiguo Peru; Banco de Credito del Peru: Lima, 2013; pp. 87–159. [Google Scholar]
- Toyne, M.; Narváez, A. The Fall of Kuélap: Bioarchaeological Analysis of Death and Destruction on the Eastern Slopes of the Andes. In Embattled Bodies, Embattled Places Scherer, A.K., Verano, J., Eds.; Dumbarton Oaks Research Library and Collection: Washington, D.C, 2014; pp. 341–364. [Google Scholar]
- Nieto, J.C. La Fortaleza de Kuelap. El Peruano 1843.
- Goicochea Gallardo, J.R. Catalogo Causas Civiles- Republica Partido de Chachapoyas 1821–1900 Siglo XX. 2010, I.
- Middendorf, E.W. Peru; Beobachtungen und Studien über das Land und seine Bewohner während eines 25 Jährigen Aufenthalts; R. Oppenheim: Berlin, 1893. [Google Scholar]
- Middendorf, E.W. Das hochland von Peru; Robert Oppenheim: Berlin, 1895. [Google Scholar]
- Raimondi, A. Notas de viajes para su obra "El Perú"; Imprenta Torres Aguirre: Lima, 1942 [1860]; Volume I, p. 1078. [Google Scholar]
- Alayza, J. Expedicion Organizada por el Señor Alayza, Prefecto de Amazonas, á Indicación de la Sociedad Geográfica de Lima, Para Hacer Nuevos Estudios de la Fortaleza de Cuelap. Boletín de la Sociedad Geográfica de Lima 1892, II, 153–160. [Google Scholar]
- Guillén, S.; Narváez, A. Los Chachapoya: la gente de los bosques de las nubes. In Perú prehispánico: un estado de la cuestión, Castillo, L.J., Mujica, E., Eds.; Colección Qillqa Mayu; Ministerio de Cultura, Dirección Desconcentrada de Cultura de Cusco: Cusco, 2018; pp. 269–302. [Google Scholar]
- Barbieri, C.; Sandoval, J.R.; Valqui, J.; Shimelman, A.; Ziemendorff, S.; Schröder, R.; Geppert, M.; Roewer, L.; Gray, R.; Stoneking, M.; et al. Enclaves of genetic diversity resisted Inca impacts on population history. Scientific Reports 2017, 7, 17411. [Google Scholar] [CrossRef]
- Guevara, E.K.; Palo, J.U.; Översti, S.; King, J.L.; Seidel, M.; Stoljarova, M.; Wendt, F.R.; Bus, M.M.; Guengerich, A.; Church, W.B. Genetic assessment reveals no population substructure and divergent regional and sex-specific histories in the Chachapoyas from northeast Peru. Plos One 2020, 15, e0244497. [Google Scholar] [CrossRef]
- Guevara, E.K.; Palo, J.U.; Sajantila, A.; Guillén, S. Explorando dinámicas poblacionales ancestrales en el noreste peruano: marcadores uniparentales de ADN en los Chachapoyas modernos. Boletín de Arqueología PUCP 2017, 127–158. [Google Scholar] [CrossRef]
- Jolkesky, M.P.D.V. Estudo arqueo-ecolinguístico das terras tropicais sul-americanas. 2016.
- Valqui, J.; Ziemendorff, M. Vestigios de una lengua originaria en el territorio de la cultura chachapoya. Letras (Lima) 2016, 87, 5–32. [Google Scholar] [CrossRef]
- Ziemendorff, M.; Ziemendorff, S.; Culqui, J.V. Observaciones metodológicas sobre el estudio de lenguas extintas en el nororiente peruano: el caso del chacha. Letras (Lima) 2023, 94, 16–32. [Google Scholar] [CrossRef]
- Culqui, J.J.V.; Ziemendorff, M.; Ziemendorff, S.; Oisel, G. Consideraciones histórico-lingüísticas acerca del topónimo Kuélap. INDIANA-Estudios Antropológicos sobre América Latina y el Caribe 2023, 40, 131–154. [Google Scholar]
- Urban, M. Linguistic and cultural divisions in pre-Hispanic Northern Peru. Language Sciences 2021, 85, 101354. [Google Scholar] [CrossRef]
- Guengerich, A. The architect’s signature: The social production of a residential landscape at Monte Viudo, Chachapoyas, Peru. Journal of Anthropological Archaeology 2014, 34, 1–16. [Google Scholar] [CrossRef]
- Crandall, J.M. The Eschatology of the Chachapoya: Spaces of Death in the Northern Andes. Baessler-Archiv 2012, 60, 39–55. [Google Scholar]
- Epstein, L.; Toyne, J.M. When space is limited: A spatial exploration of pre-Hispanic Chachapoya mortuary and ritual microlandscape. In Theoretical approaches to analysis and interpretation of commingled human remains, Osterholtz, A.J., Ed.Martin, D.L., Ed.; Bioarchaeology and Social Theory; Springer: 2016; pp. 97–124.
- Muscutt, K. Warriors of the Clouds: A Lost Civilization of the Upper Amazon of Peru; University of New Mexico Press: Albuquerque, 1998. [Google Scholar]
- Bonavia, D.; Ravines, R. Las fronteras ecológicas de la civilización Andina. Amaru 1967, 61–69. [Google Scholar]
- Kauffmann Doig, F. Chachapoyas Culture; Roberto Gheller, D. Editores: Lima, Perú, 2017.
- Guengerich, A. La diversidad local frente a la «Cultura Chachapoya» en la arquitectura doméstica. Boletín de Arqueología PUCP 2017, 207–230. [Google Scholar] [CrossRef]
- Ruiz Estrada, A. La alfareria de Cuelap: Tradicion y cambio. Universidad Nacional Mayor de San Marcos, Lima, 1972.
- VanValkenburgh, P.; Cushman, K.C.; Castillo Butters, L.J.; Rojas Vega, C.; Roberts, C.B.; Kepler, C.; Kellner, J. Lasers without lost cities: Using drone lidar to capture architectural complexity at Kuelap, Amazonas, Peru. Journal of Field Archaeology 2020, 45, S75–S88. [Google Scholar] [CrossRef]
- Ruiz Estrada, A. Sobre las formas de sepultamiento prehispánico en Kuelap, Amazonas. Arqueología y Sociedad 2009, 41–56. [Google Scholar] [CrossRef]
- Toyne, M.; Narváez, A. A bioarchaeological analysis of burials from Kuelap; an exploration of patterns in morphology and lifestyle. 2017.
- Reichlen, H.; Reichlen, P. Recherches archéologiques dans les Andes du Haut Utcubamba: deuxième rapport de la Mission Ethnologique Française au Perou Septentrional. Journal de la Société des Américanistes 1950, 39, 219–246. [Google Scholar] [CrossRef]
- Ruiz Estrada, A. La alfarería de Kuelap: tradición y cambio; Avqi Ediciones: Lima, 2009; p. 172. [Google Scholar]
- Dionne, H. Indicateurs géographiques et culturels de la culture Chachapoya dans le secteur de Kuelap : archéologie spatiale et évaluation du potentiel archéologique. Université du Québec à Chicoutimi, Chicoutimi, Québec, 2021.
- Raimondi, A. El Perú; Imprenta del estado: Sociedad Geográfica de Lima, 1874; Volume 1. [Google Scholar]
- Wertheman, A. Ruinas de la fortaleza de Cuelap. Boletín de la Sociedad Geográfica de Lima 1892, II, 147–160. [Google Scholar]
- Kieffer, P. Excursion a Cuelap: Departamento de Amazonas - Perú, Fragmentos de las notas del P. Ph. Kieffer; Libr. Francesa Científica E. Rosay, 1910.
- Langlois, L. Las ruinas de Cuelap. Boletín de la Sociedad Geográfica de Lima 1934, 51, 20–34. [Google Scholar]
- Horkheimer, H. Algunas consideraciones acerca de la arqueologia en el valle del Utcubamba. In Proceedings of the II Congreso Nacional de Historia del Peru, Lima; 1958; pp. 71–101. [Google Scholar]
- Narváez, A. Kuélap Guía de visita, 2da ed.; Mincetur: 2018.
- Contreras, J. Historia Clinica de Kuelap; World Monuments Fund Peru: Lima, Mayo 2023; p. 55. [Google Scholar]
- Righetti, G.; Serafini, S.; Brondi, F.; Church, W.; Garnero, G. Sotto le Nuvole, sotto la Foresta: applicazioni Tecnologiche Lidar e di Intelligenza Artificiale per Nuove prospettive nel Sito monumentale di Kuelap-Perú. Archeomatica 2020, 11, 6–13. [Google Scholar]
- Righetti, G.; Serafini, S.; Brondi, F.; Church, W.B.; Garnero, G. Survey of a Peruvian Archaeological Site Using LiDAR and Photogrammetry: A Contribution to the Study of the Chachapoya. In Proceedings of the International Conference on Computational Science and Its Applications - ICCSA 2021, Cham; 2021; pp. 613–628. [Google Scholar]
- Barriga, J. Estudio Geofisico: Tomografia Electrica y Sondeo Electrico Vertical; Plan COPESCO Nacional: Lima, March 19 2019; p. 46.
- Martorana, R.; Capizzi, P.; D’Alessandro, A.; Luzio, D. Comparison of different sets of array configurations for multichannel 2D ERT acquisition. Journal of Applied Geophysics 2017, 137, 34–48. [Google Scholar] [CrossRef]
- Mori, N. Investigaciones geofísicas integradas en sitios arqueológicos: caso de estudio Fortaleza de Kuelap. Universidad Nacional de Ingenieria, Lima, 2021.
- Orellana, E. Prospeccion geoelectrica en corriente continua, 2 ed.; Ediciones Paraninfo: Madrid, 1981; Volume 1, p. 578. [Google Scholar]
- ALEPH Asociados. Elaboración del expediente técnico para la intervención del Acceso 1, bóveda y estructuras adyacentes en el Complejo Arqueológico Kuélap, región Amazonas; Ministerio de Cultura del Peru: Lima, 2022; p. 19. [Google Scholar]
- Mori, N. Contratación de servicio para la determinación de la estratigrafía del área nuclear de la Zona Arqueológica Monumental de Kuélap; Ministerio de Cultura: Lima, 2023; p. 429. [Google Scholar]
- Alvarez, J. Estudio análisis prospectivo de seguridad física en geotecnia, geodinámica externa e hidrogeología del Acceso 1 y estructuras adyacentes; Ministerio de Comercio Exterior y Turismo. Plan COPESCO Nacional. Unidad de Ejecucion de Obras: Lima, March 15 2017; p. 208. [Google Scholar]
- Rodríguez, R.; Giraldo, E.; Cueva, E.; Sánchez, E.; Cornejo, T. Geología del cuadrángulo de Chachapoyas (13-h); INGEMMET: Lima, 2012; p. 142. [Google Scholar]
- UNESCO. Hoja de ruta para la intervencion sistematica e interdisciplinaria que conlleve a la recuperacion y conservacion sostenible del sitio arqueologico Fortaleza de Kuelap; UNESCO: Lima, 2022; p. 204. [Google Scholar]
- Vilcapoma, O. Informe tecnico de levantamiento lidar: Sitio arqueologico de Kuelap; World Monuments Fund Peru: Lima, 2023; p. 9. [Google Scholar]
- Kościuk, J. Peters Grossmann's sense of field drawings and its legacy. Bulletin de la Société d'Archéologie Copte 2022, submitted for print on 24.10 2022, special issue dedicated to the memory of Dr. Peter Grossmann, Available at: https://www.academia.edu/95676907/PETER_GROSSMANNS_SENSE_OF_FIELD_DRAWINGS.
- Kościuk, J. Architectural Survey and Recording. In Athribis I. General Site Survey, El-Sayed, R., El-Masry, Y., Eds.; Institut Français d’Archéologie Orientale: Cairo, Egypt, 2012; Volume 1, pp. 94–96; Volume 92, plates IX-XIa-b, XII-XVIII.
- Fawzy, H.E.-D. 3D laser scanning and close-range photogrammetry for buildings documentation: A hybrid technique towards a better accuracy. Alexandria Engineering Journal 2019, 58, 1191–1204. [Google Scholar] [CrossRef]
- Agisoft. Agisoft Metashape User Manual. Professional Edition, Version 2.0; 2023; pp. 31, 37–38. Available online at: https://www.agisoft.com/pdf/metashape-pro_32_30_en.pdf (accessed: 28.01.2022).
- Kokalj, Ž.; Zakšek, K.; Oštir, K. Application of sky-view factor for the visualisation of historic landscape features in lidar-derived relief models. Antiquity 2011, 85, 263–273. [Google Scholar] [CrossRef]
- Crutchley, S.; Crow, P. The Light Fantastic: Using airborne lidar in archaeological survey; English Heritage: Swindon, 2010; p. 43. [Google Scholar]
- Devereux, B.J.; Amable, G.S.; Crow, P. Visualisation of LiDAR terrain models for archaeological feature detection. Antiquity 2008, 82, 470–479. [Google Scholar] [CrossRef]
- Bennett, R.; Welham, K.; Hill, R.A.; Ford, A. A comparison of visualization techniques for models created from airborne laser scanned data. Archaeological Prospection 2012, 19, 41–48. [Google Scholar] [CrossRef]
- Challis, K.; Kokalj, Z.; Kincey, M.; Moscrop, D.; Howard, A.J. Airborne lidar and historic environment records. Antiquity 2008, 82, 1055–1064. [Google Scholar] [CrossRef]
- Zakšek, K.; Oštir, K.; Kokalj, Ž. Sky-view factor as a relief visualization technique. Remote sensing 2011, 3, 398–415. [Google Scholar] [CrossRef]
- Kennelly, P.J.; Stewart, A.J. General sky models for illuminating terrains. International Journal of Geographical Information Science 2014, 28, 383–406. [Google Scholar] [CrossRef]
- Challis, K.; Forlin, P.; Kincey, M. A generic toolkit for the visualization of archaeological features on airborne LiDAR elevation data. Archaeological Prospection 2011, 18, 279–289. [Google Scholar] [CrossRef]
- Medina, G. El drenaje como medio de conservacion de La Fortaleza de Kuelap. Licenciatura, Universidad Nacional de Ingenieria, Lima, 1999.
- Bengtsson, L.B. Prehistoric stonework in the Peruvian Andes: A case study at Ollantaytambo; Göteborg University: Göteborg, Sweden, 2000; p. 220. [Google Scholar]
- Gasparini, G.; Margolies, L. Inca architecture; Indiana University Press: Bloomington, 1980; p. 350. [Google Scholar]
- Protzen, J.-P. Inca quarrying and stonecutting. The Journal of the Society of Architectural Historians 1985, 44, 161–182. [Google Scholar] [CrossRef]
- Protzen, J.-P. Inca stonemasonry. Scientific American 1986, 254, 94–105. [Google Scholar] [CrossRef]
- Protzen, J.-P. Inca Architecture and Construction at Ollantaytambo; Oxford University Press: New York, Oxford, 1993; p. 303. [Google Scholar]
- Protzen, J.-P.; Nair, S. Who taught the Inca stonemasons their skills? A comparison of Tiahuanaco and Inca cut-stone masonry. The Journal of the Society of Architectural Historians 1997, 56, 146–167. [Google Scholar] [CrossRef]
- Protzen, J.-P.; Nair, S. The Stones of Tiahuanaco: A Study of Architecture and Construction; Cotsen Institute of Archaeology Press: Los Angeles, 2013; p. 264.
- Gavazzi, A. Tecnomorfología de la llaqta inka de Machupicchu. Materiales, métodos y resultados del levantamiento arquitectónico y paisajístico. In Machupicchu. Investigaciones interdisciplinarias, Astete, F., Bastante, J., Eds.; GD Impactos: Lima, 2020; Volume 1, pp. 353–381. [Google Scholar]
- Kościuk, J.; Bastante, J.M. In a Search for Inca Construction Process Logistics. Case Studies of Four Structures from the Llaqta Machu Picchu. In Machu Picchu in Context: Interdisciplinary Approaches to the Study of Human Past, Ziółkowski, M., Masini, N., Bastante, J.M., Eds.; Springer Nature: 2022; pp. 555–581.
- Neuner, H.; Holst, C.; Kuhlmann, H. Overview on current modelling strategies of point clouds for deformation analysis. Allgemeine Vermessungs-Nachrichten: AVN; Zeitschrift für alle Bereiche der Geodäsie und Geoinformation 2016, 123, 328–339. [Google Scholar]
- Wojtkowska, M.; Kedzierski, M.; Delis, P. Validation of terrestrial laser scanning and artificial intelligence for measuring deformations of cultural heritage structures. Measurement 2021, 167, 108291. [Google Scholar] [CrossRef]
- Fawcett, R. Treatment of vegetation at monuments. In The Conservation of Architectural Ancient Monuments in Scotland. Guidance on Principles, Fawcett, R., Ed.; Historic Scotland: Longmore House, Salisbury Place, Edinburgh, 2001; pp. 44–47. [Google Scholar]
- Narváez, A. Proyecto Kuelap Informe Final: Noviembre 1985 - Marzo 1986; Instituto Nacional de Cultura: 1986; p. 98.
- Benegas, L.; Ilstedt, U.; Roupsard, O.; Jones, J.; Malmer, A. Effects of trees on infiltrability and preferential flow in two contrasting agroecosystems in Central America. Agriculture, Ecosystems & Environment 2014, 183, 185–196. [Google Scholar] [CrossRef]
- GoldenSoftware https://www.goldensoftware.com/products/surfer., 2022.
- Chatterjee, D.; Murali Krishna, A. Effect of slope angle on the stability of a slope under rainfall infiltration. Indian Geotechnical Journal 2019, 49, 708–717. [Google Scholar] [CrossRef]
- Muenchow, J.; Brenning, A.; Richter, M. Geomorphic process rates of landslides along a humidity gradient in the tropical Andes. Geomorphology 2012, 139, 271–284. [Google Scholar] [CrossRef]
- Narváez, A. Kuélap: una ciudad fortificada en los Andes nor-orientales de Amazonas, Perú. In Arquitectura y arqueología: pasado y futuro de la construcción en el Perú, Rangel Flores, V., Ed.; Museo Bruning: Chiclayo, 1988; pp. 115–142. [Google Scholar]
- Haynes, H. Utilizing Geographic Information Systems to Explore the Mortuary Landscape at Kuelap, Peru. Masters, University of Central Florida, Orlando, 2022.
Figure 1.
Aerial photograph of La Fortaleza, Spring 2000 - Copyright Gordon Wiltsie.
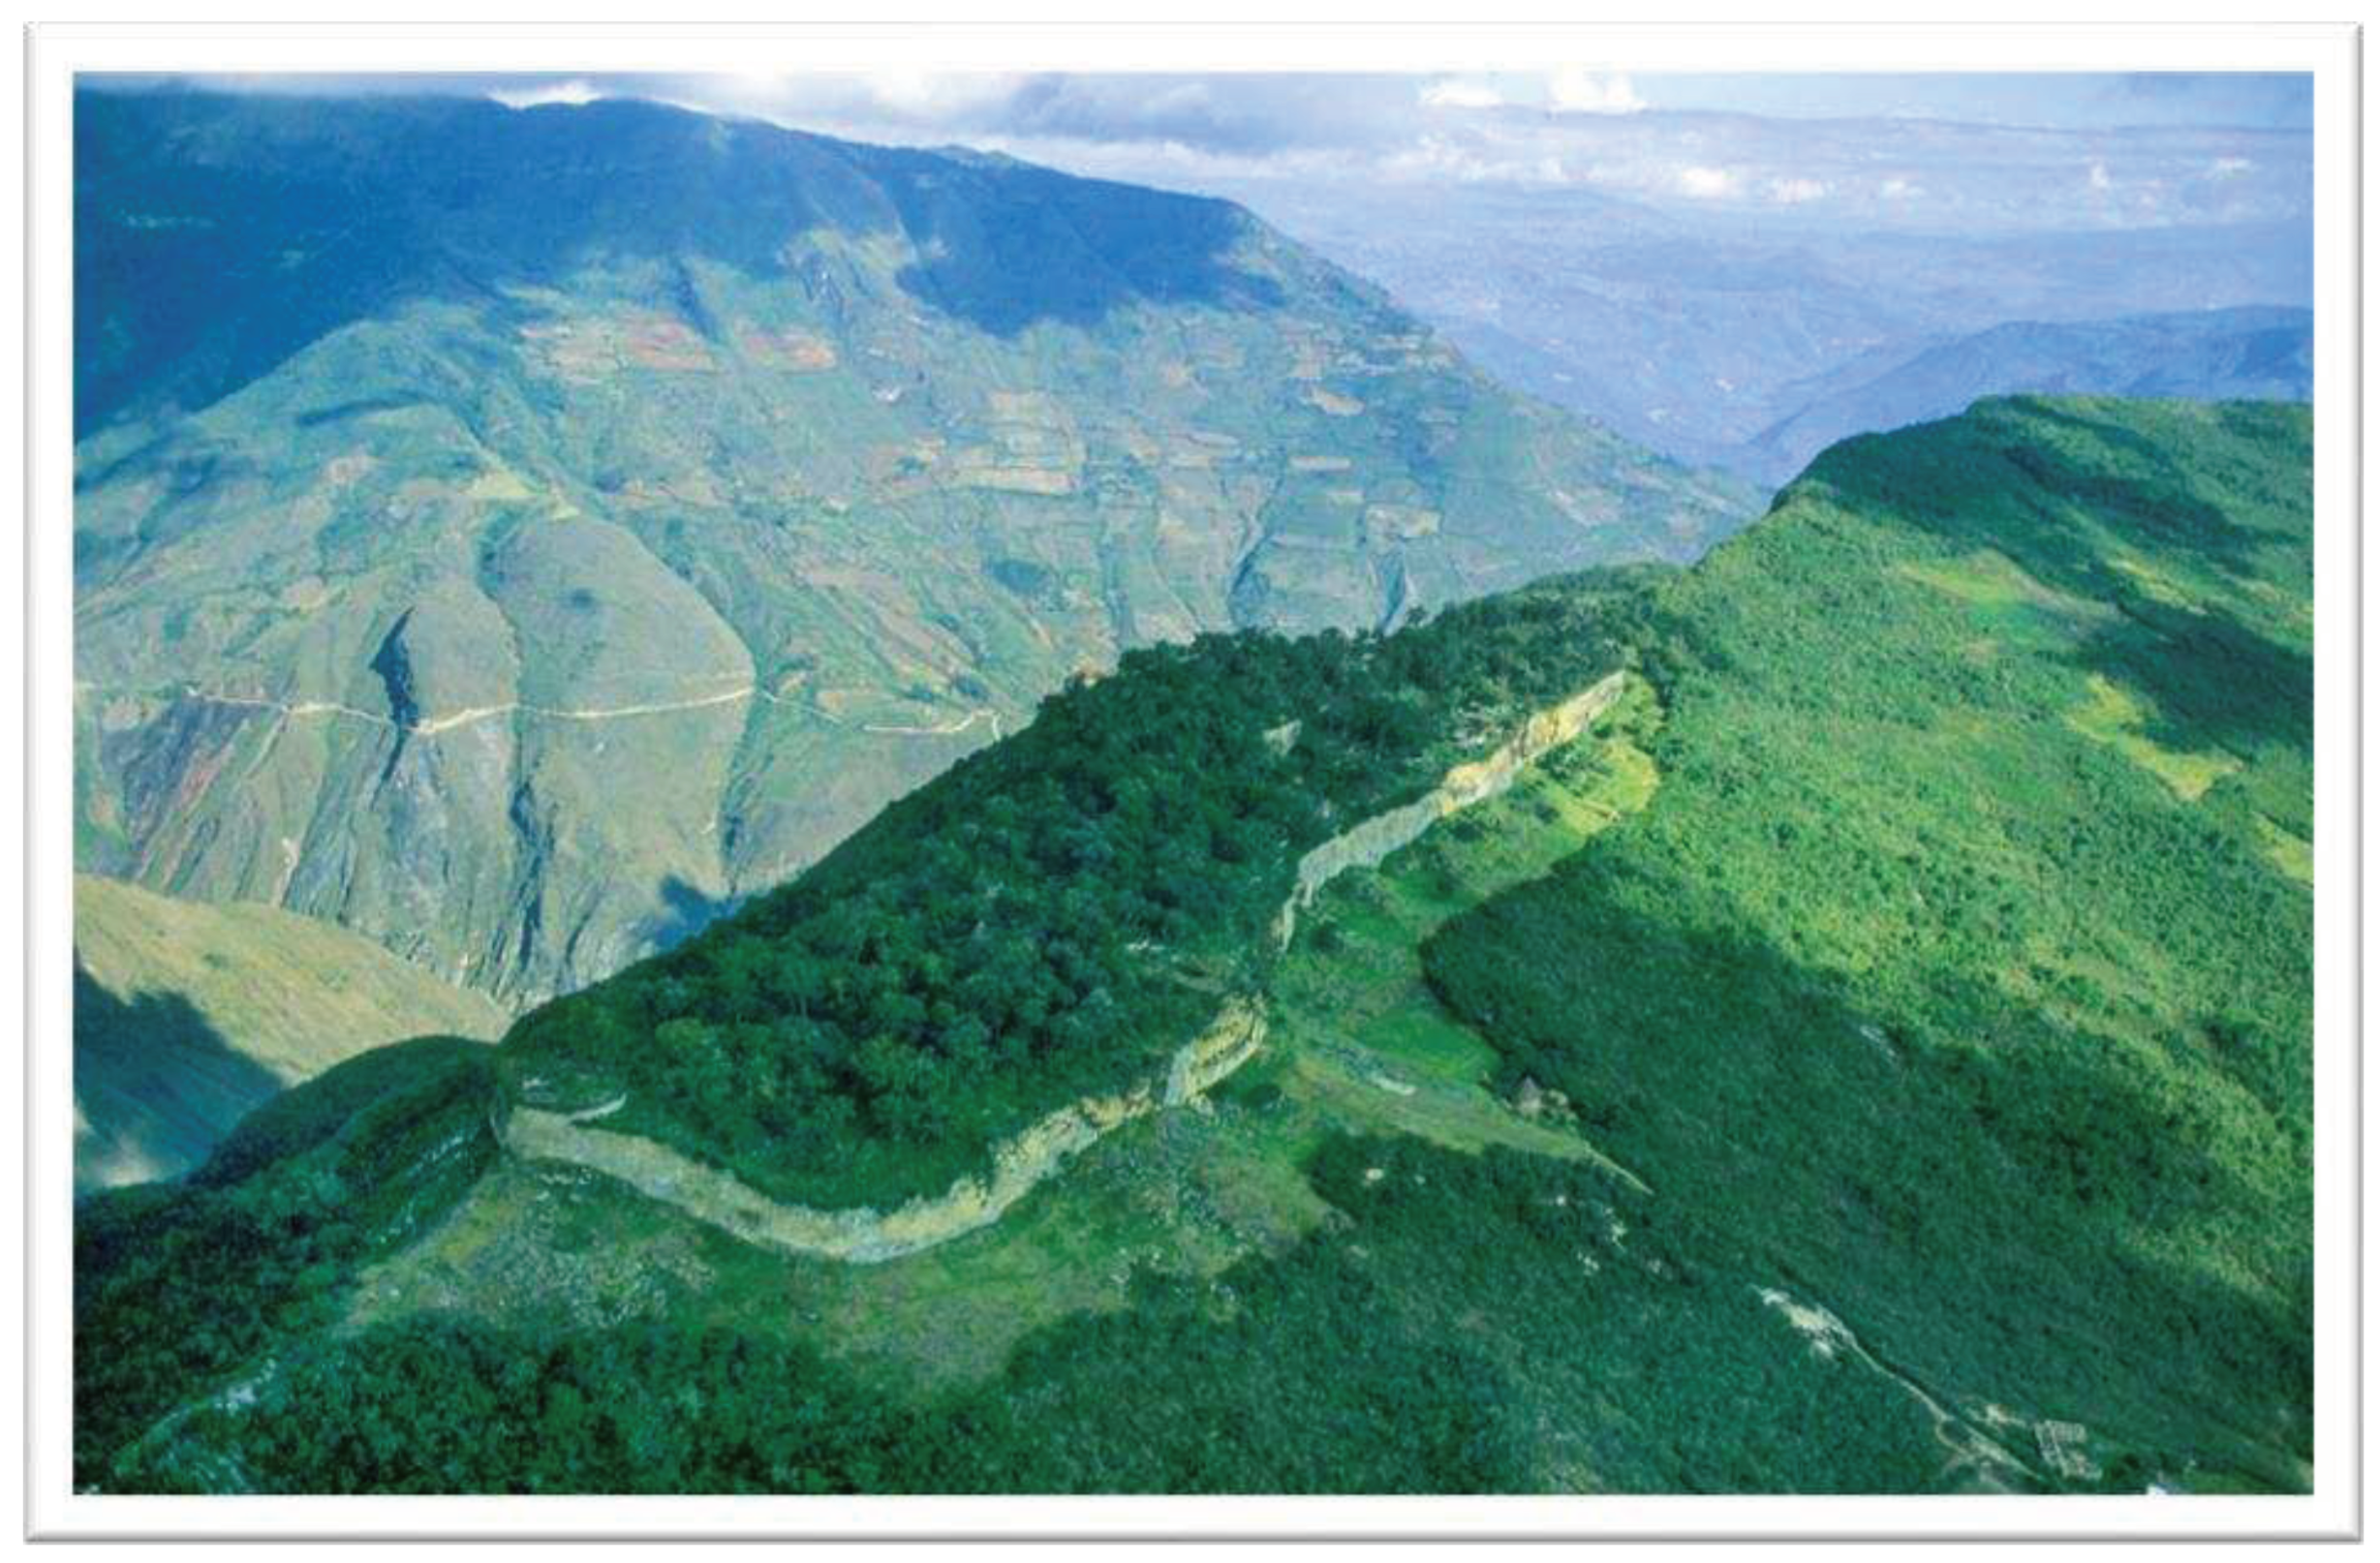
Figure 2.
Map of sites in and around the Utcubamba valley and the northern Chachapoyas region. 1. Kuelap, 2. La Jalca/Ollape, 3. Yalape, 4. Macro, 5. Cerro Olan, 6. Revash, 7. Karajia, 8. Lake of the Condors, 9. Lamud Urco, 10. Cerro Huancas, 11. Congon (Vilaya), 12. Purumllacta de Cheto, 13. Levanto, 14. Mayno, 15. Monte Viudo, 16. La Joya, 17. Balsas, 18. Cochamba, 19. Pirka-Pirka, 20 Inticancha.
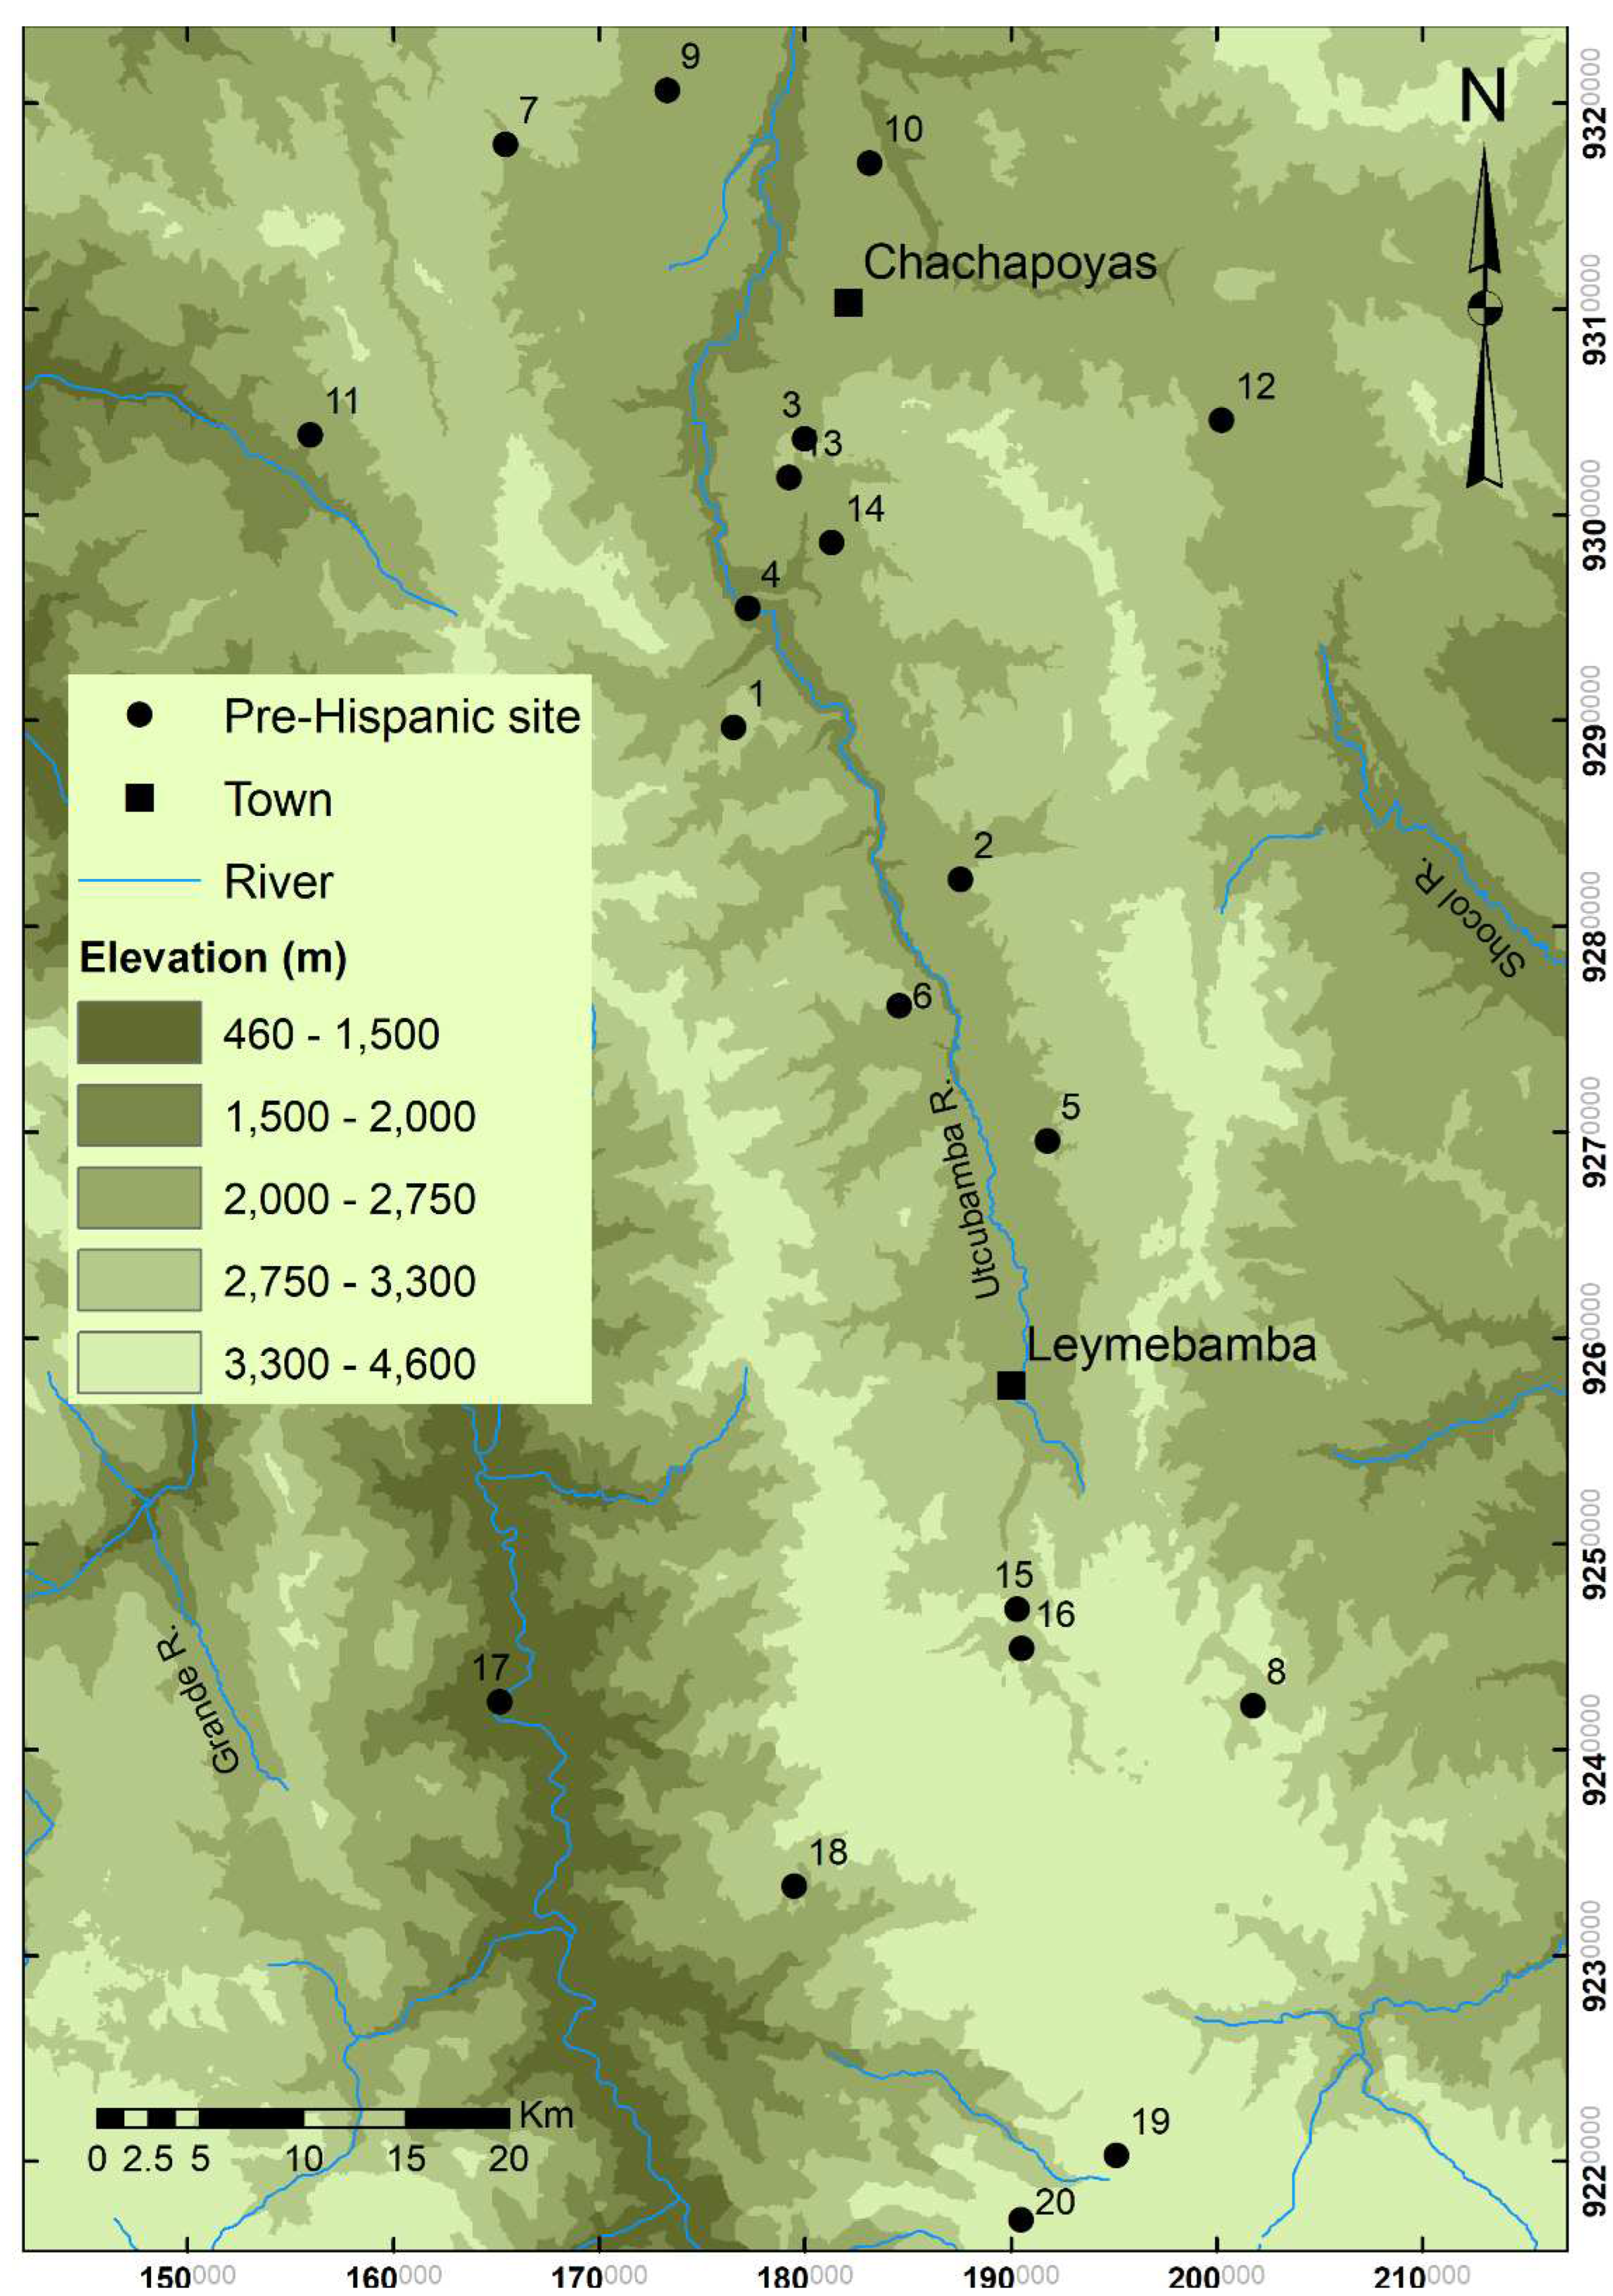
Figure 3.
Photograph of La Fortaleza taken by Middendorf [40].
Figure 3.
Photograph of La Fortaleza taken by Middendorf [40].
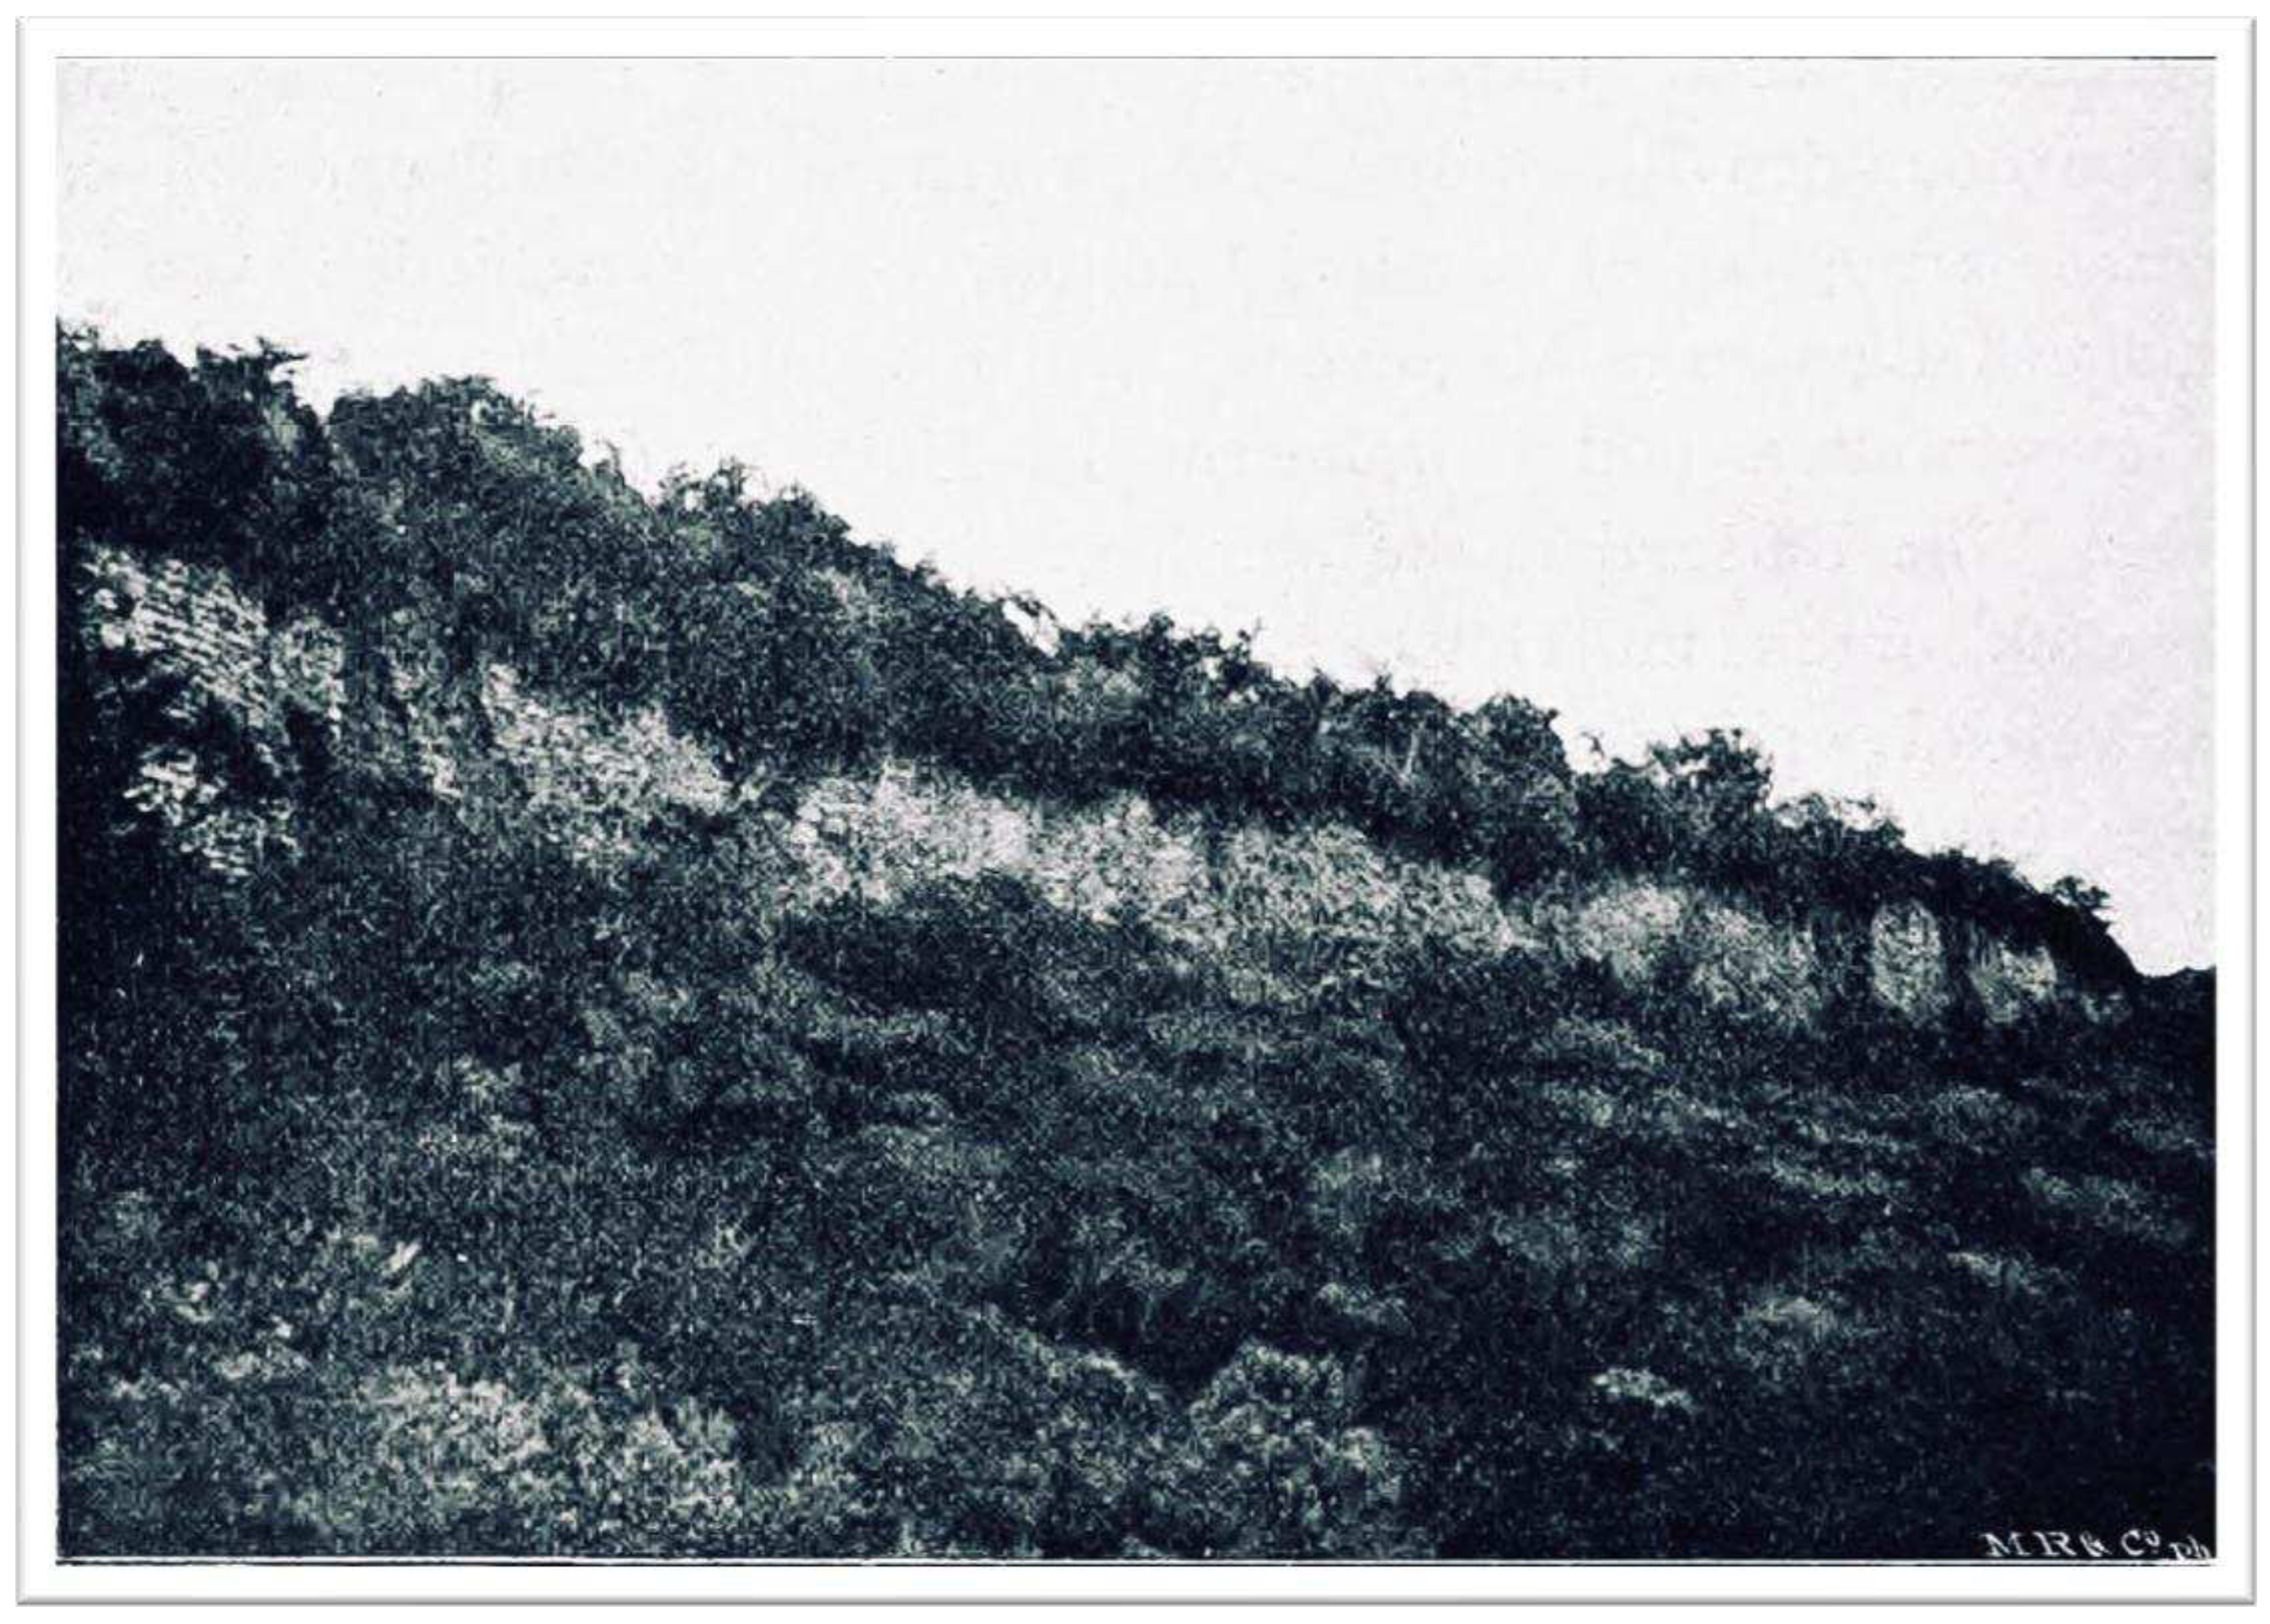
Figure 6.
Schematic diagram of different data sources and their further processing. Elaborated by Kościuk.
Figure 6.
Schematic diagram of different data sources and their further processing. Elaborated by Kościuk.
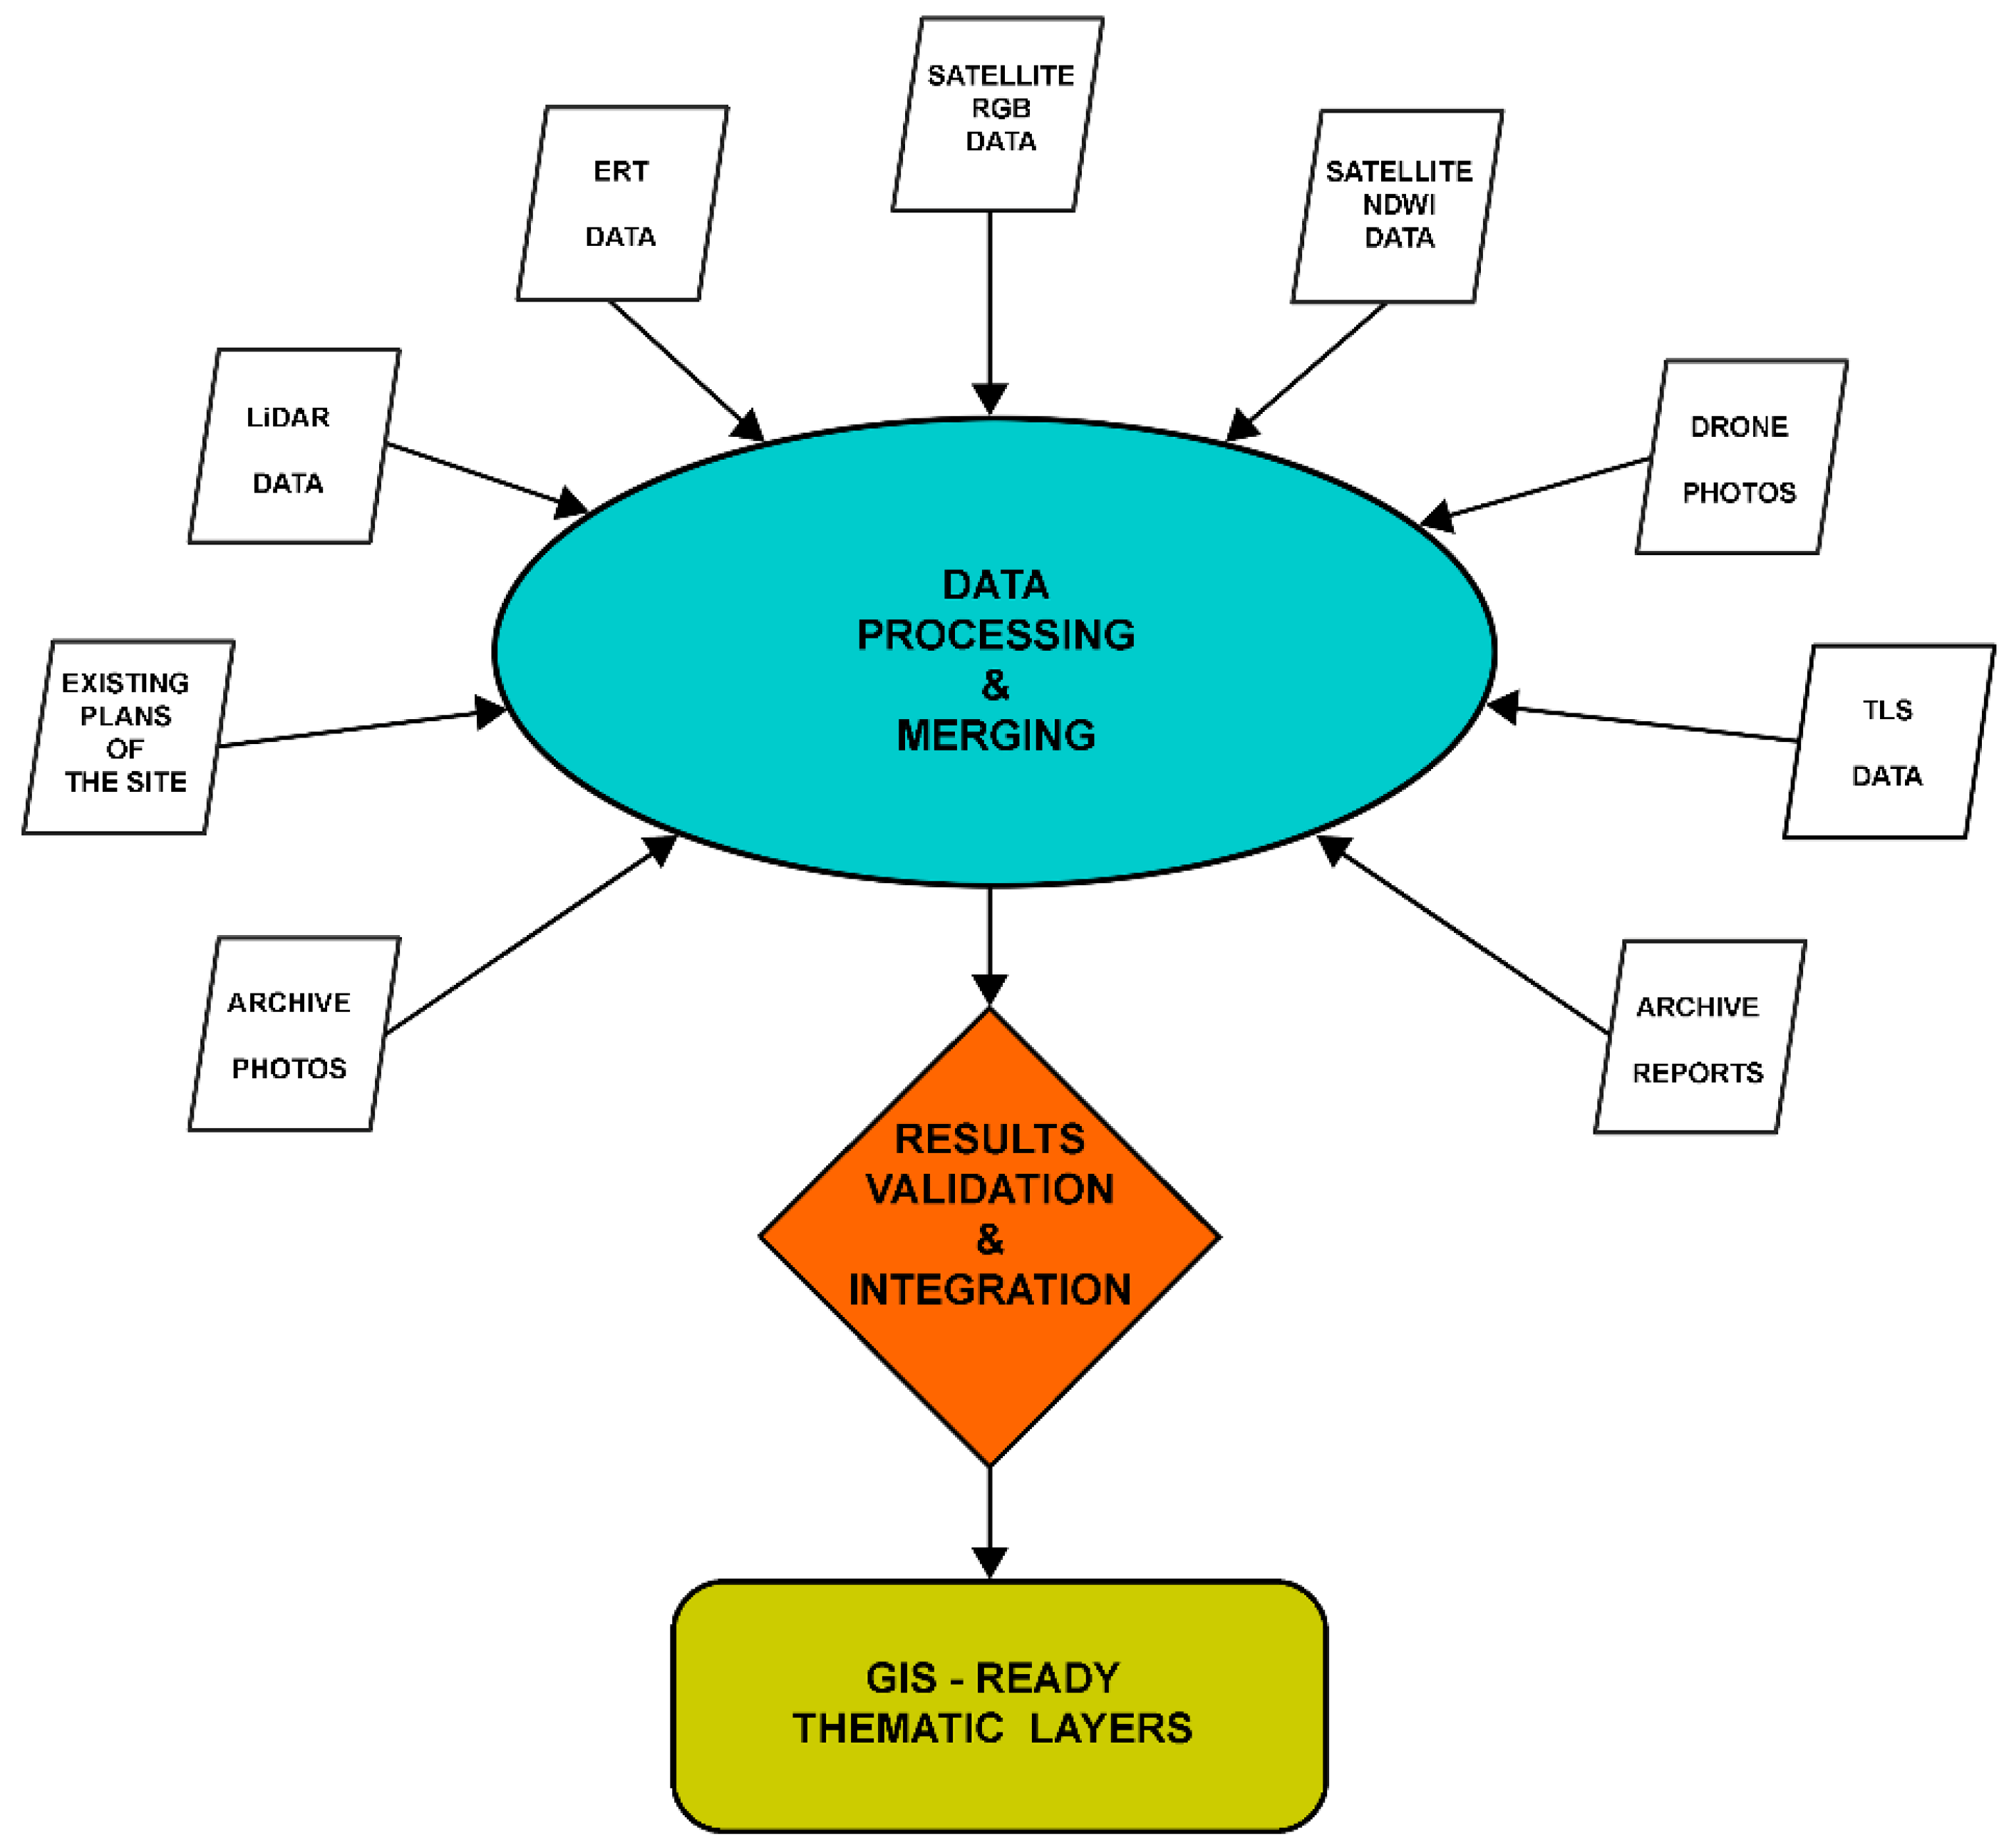
Figure 7.
One of the CAD plans available to the authors. Source COPESCO 2015, courtesy of the Ministry of Culture of Peru.
Figure 7.
One of the CAD plans available to the authors. Source COPESCO 2015, courtesy of the Ministry of Culture of Peru.
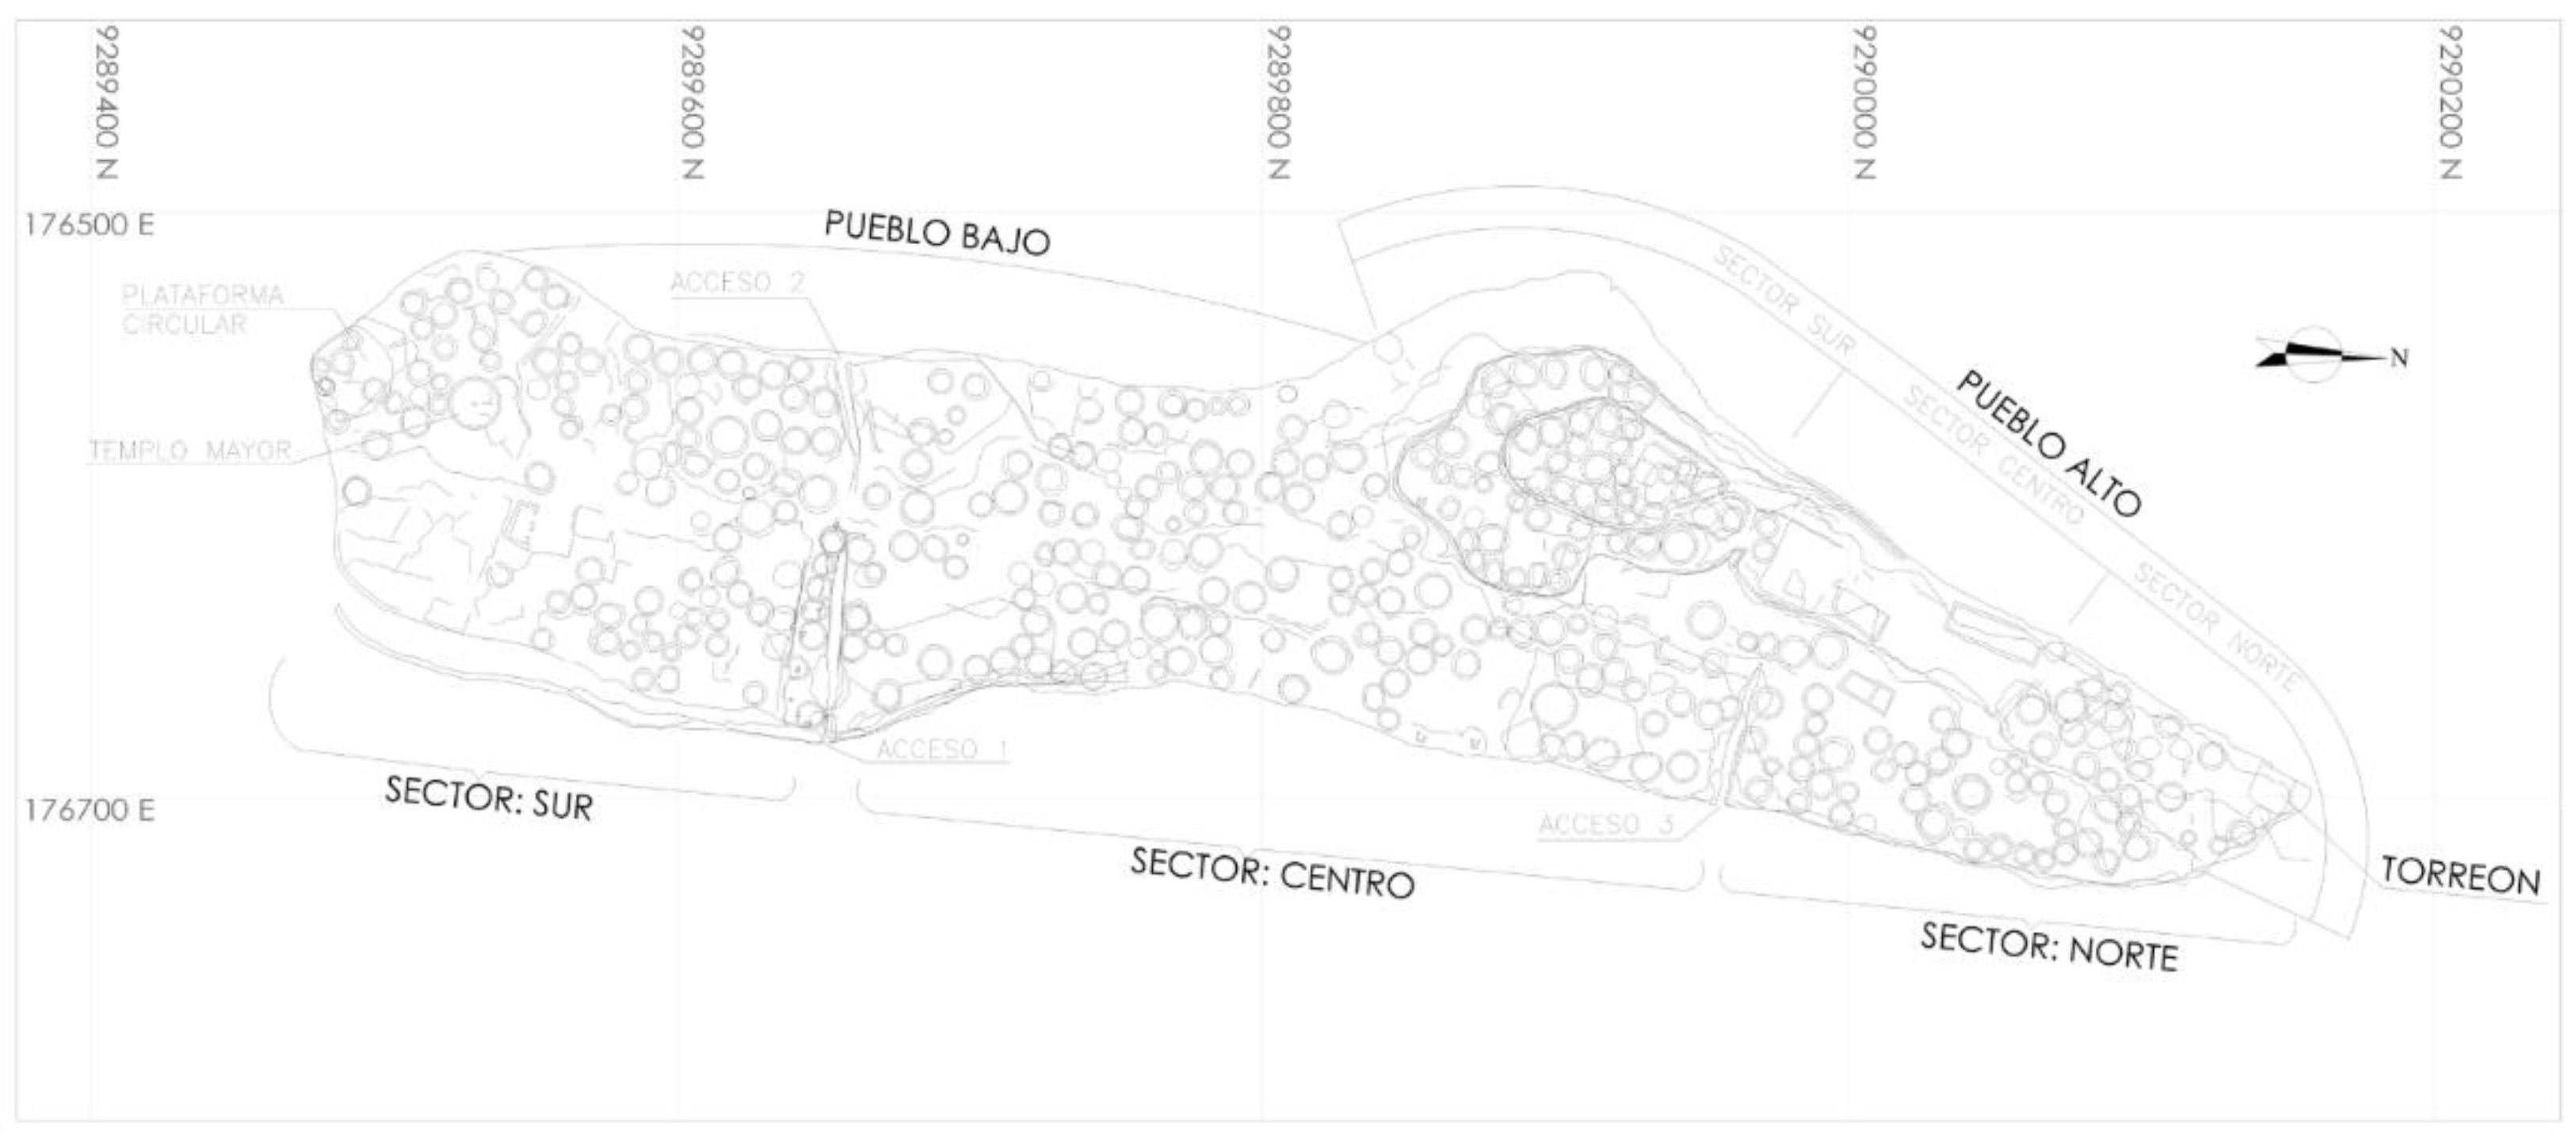
Figure 8.
La Fortaleza on a Google Earth Pro image from June 2022 (source: Google Earth ©).
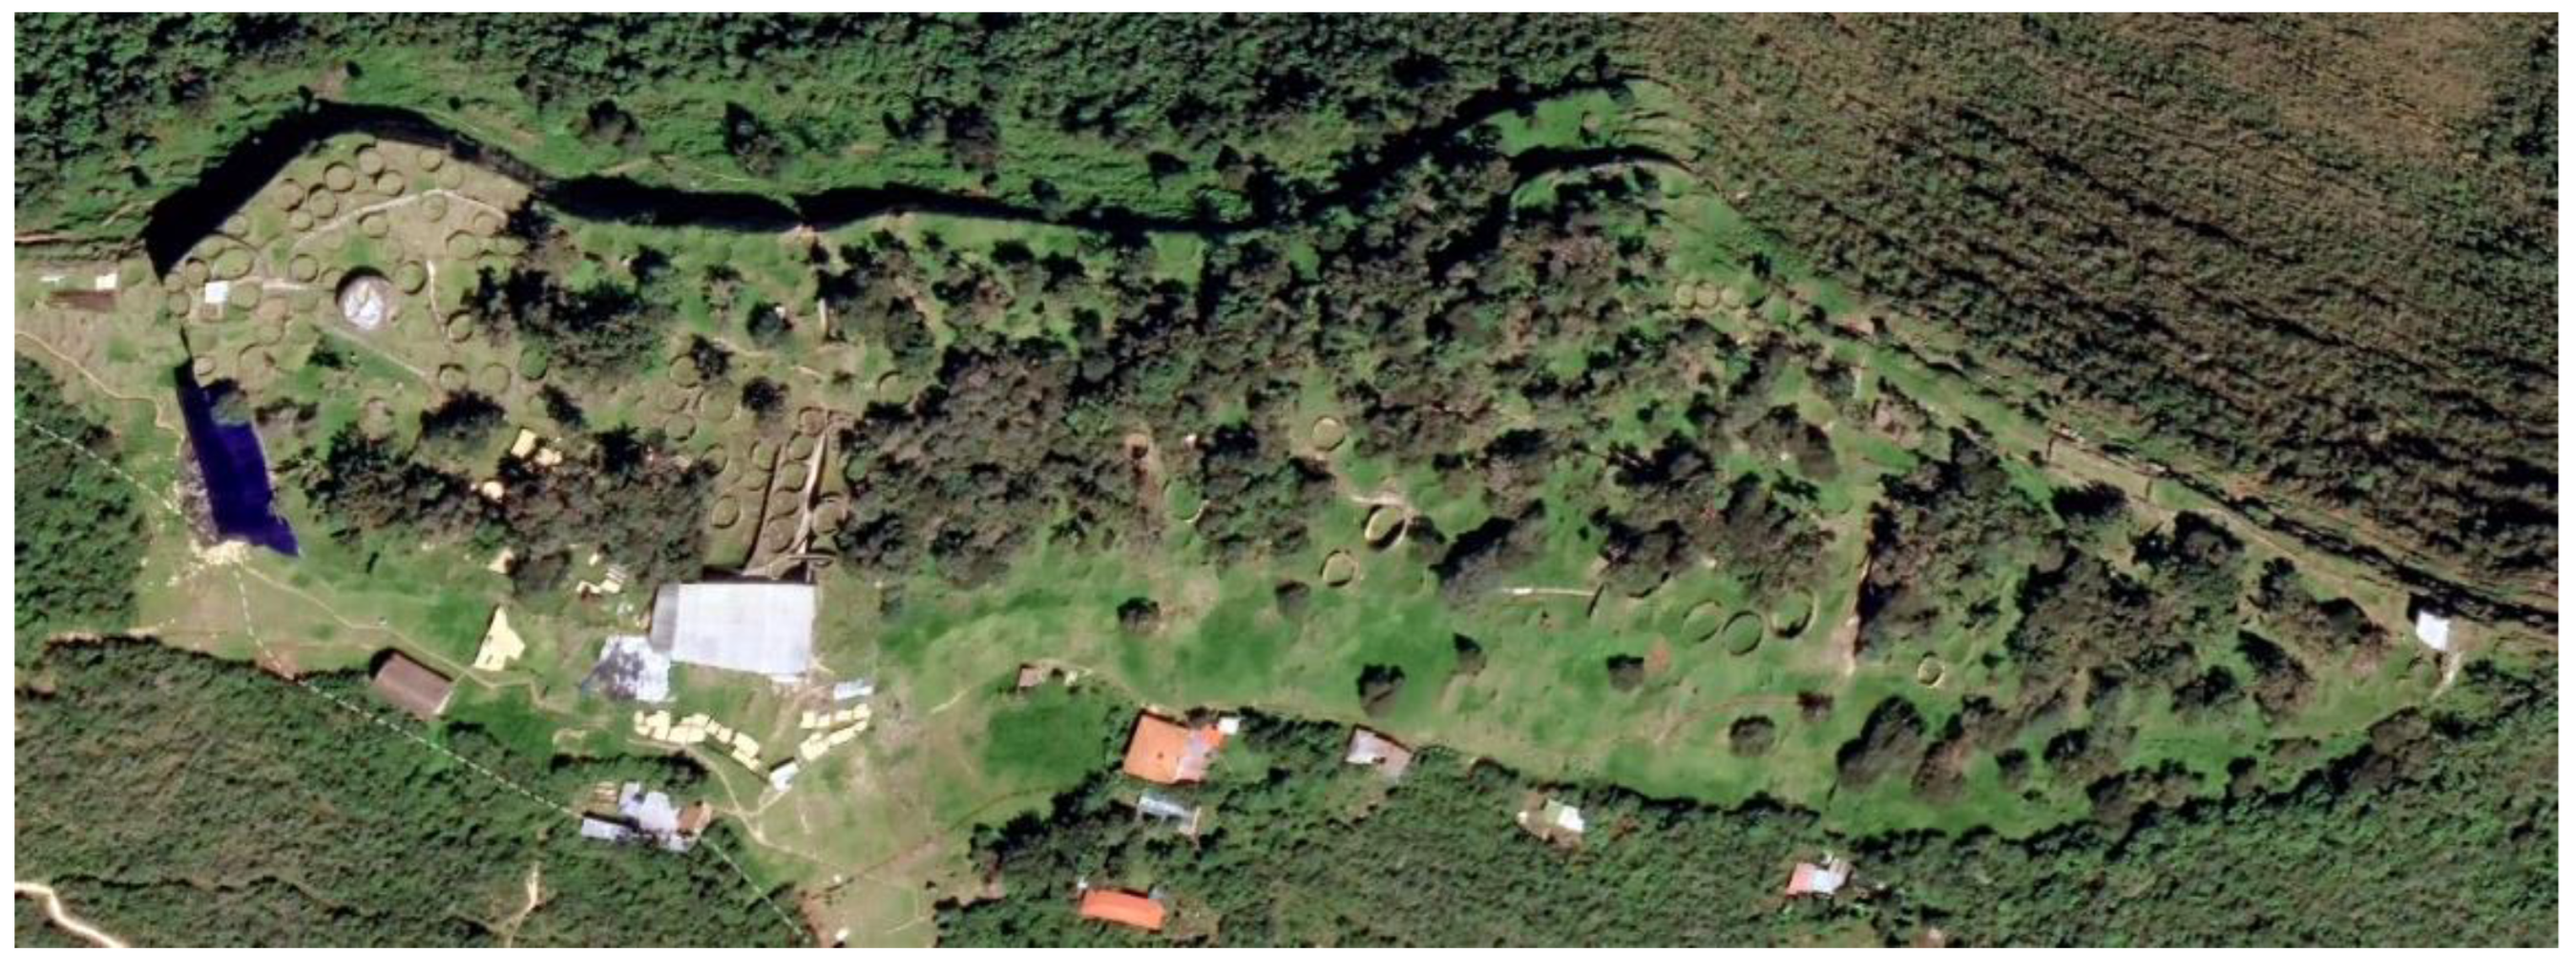
Figure 9.
Location of geoelectrical profiles. Blue – ALEPH Asociados [80]; Red – Mori [78]. Data assembled by Kościuk.
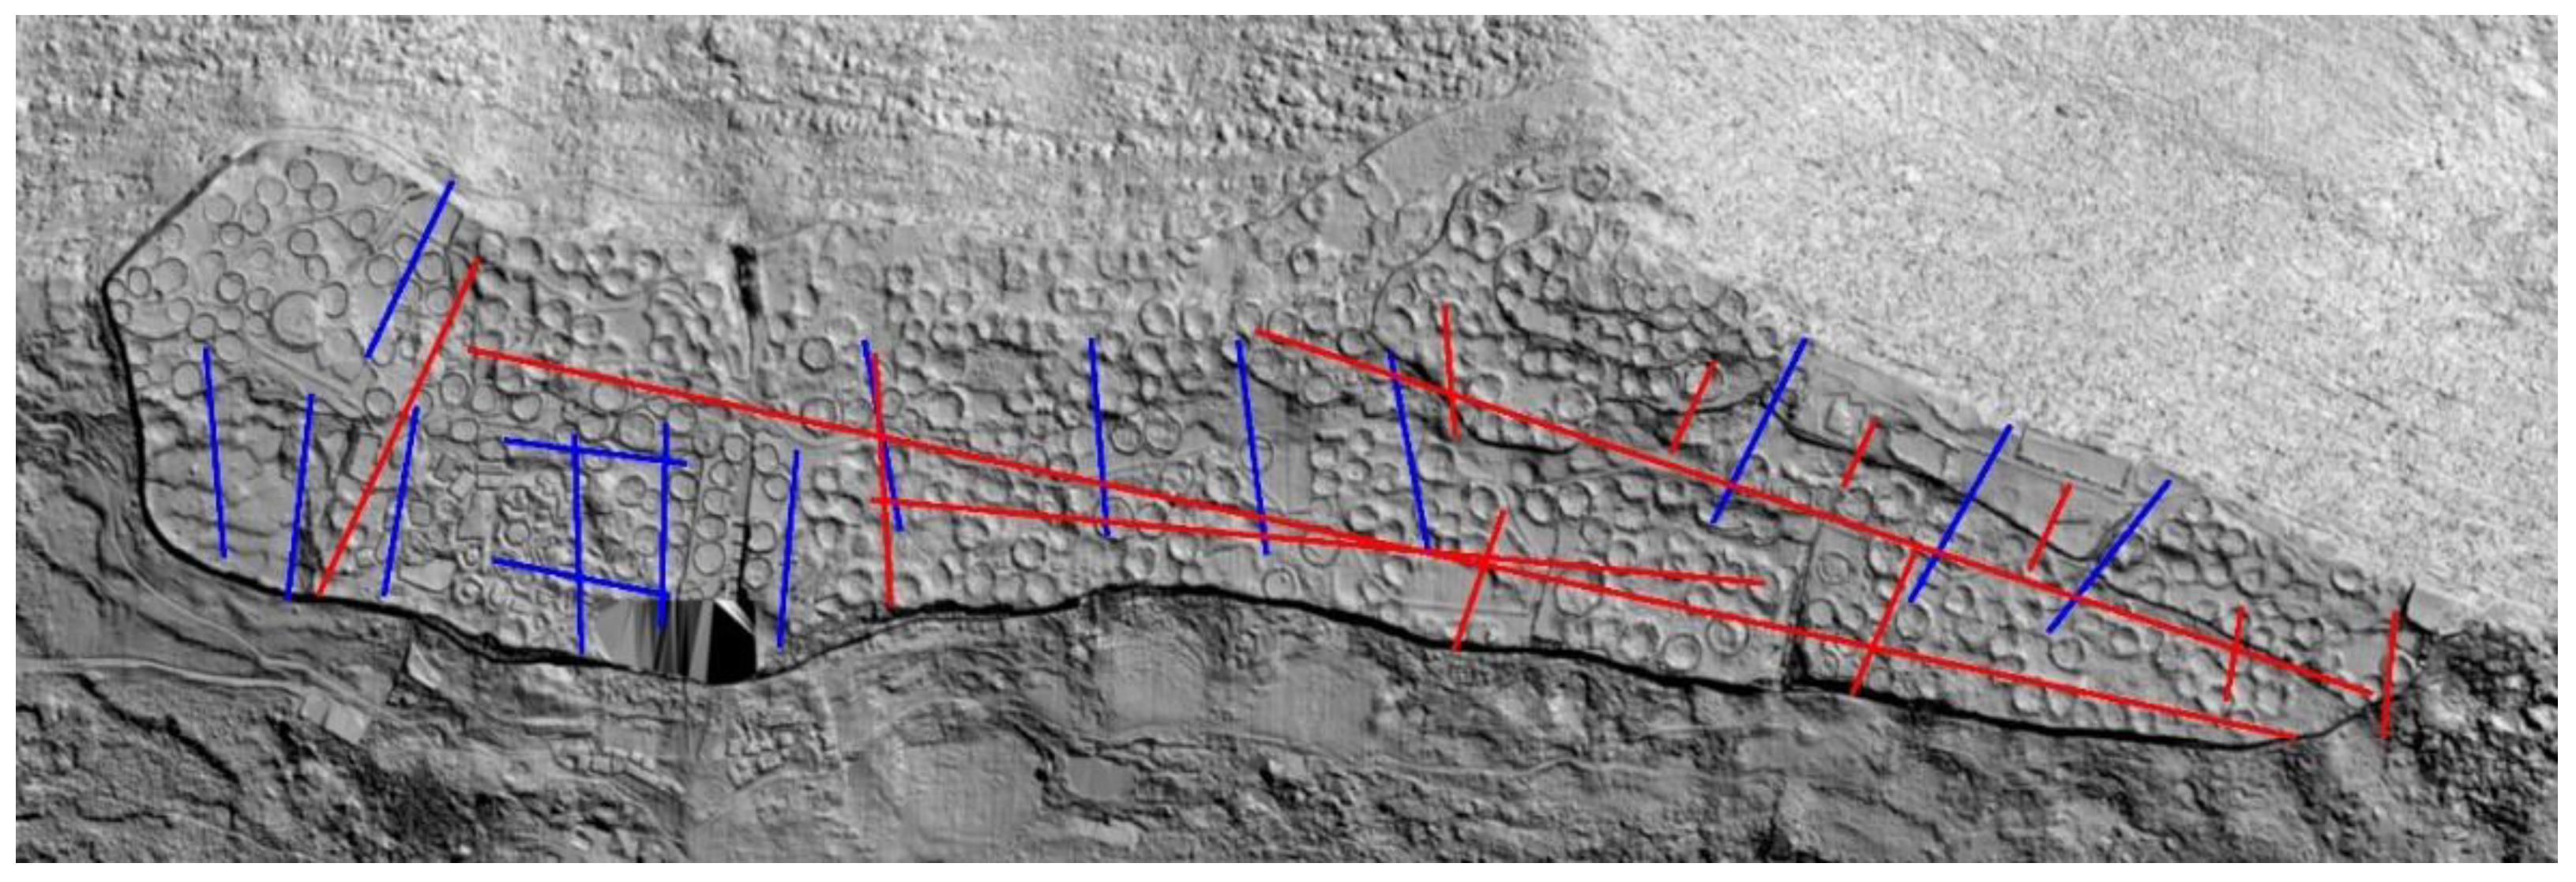
Figure 10.
Example of composite ERT profile, incorporating results from transects LTE-1 through LTE-6 (Mori [78]).
Figure 10.
Example of composite ERT profile, incorporating results from transects LTE-1 through LTE-6 (Mori [78]).
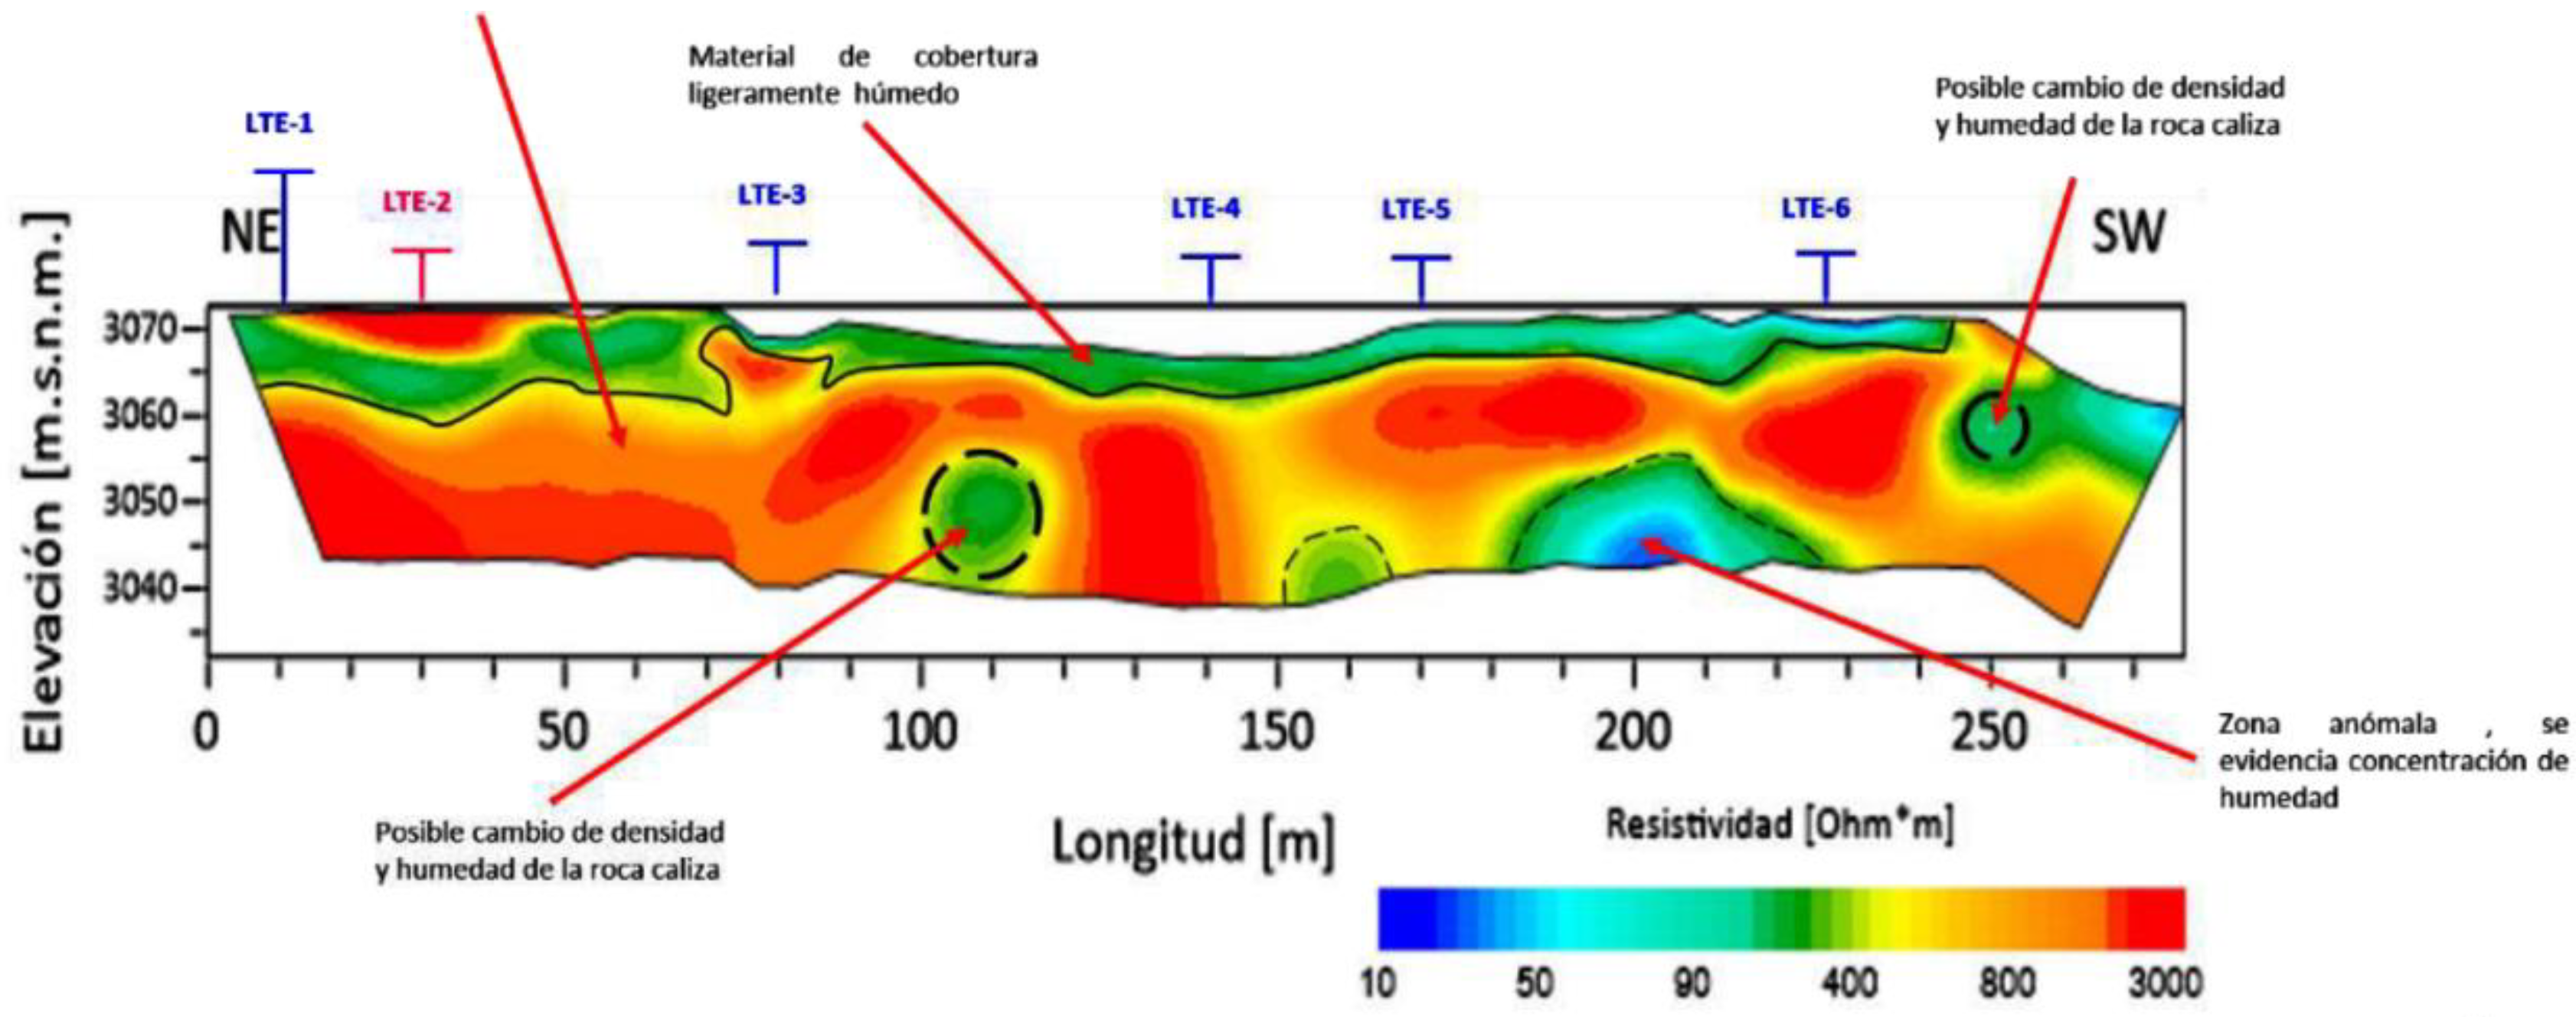
Figure 11.
Geo-seismic profile LS-03, representative of La Fortaleza (Mori [81]).
Figure 11.
Geo-seismic profile LS-03, representative of La Fortaleza (Mori [81]).
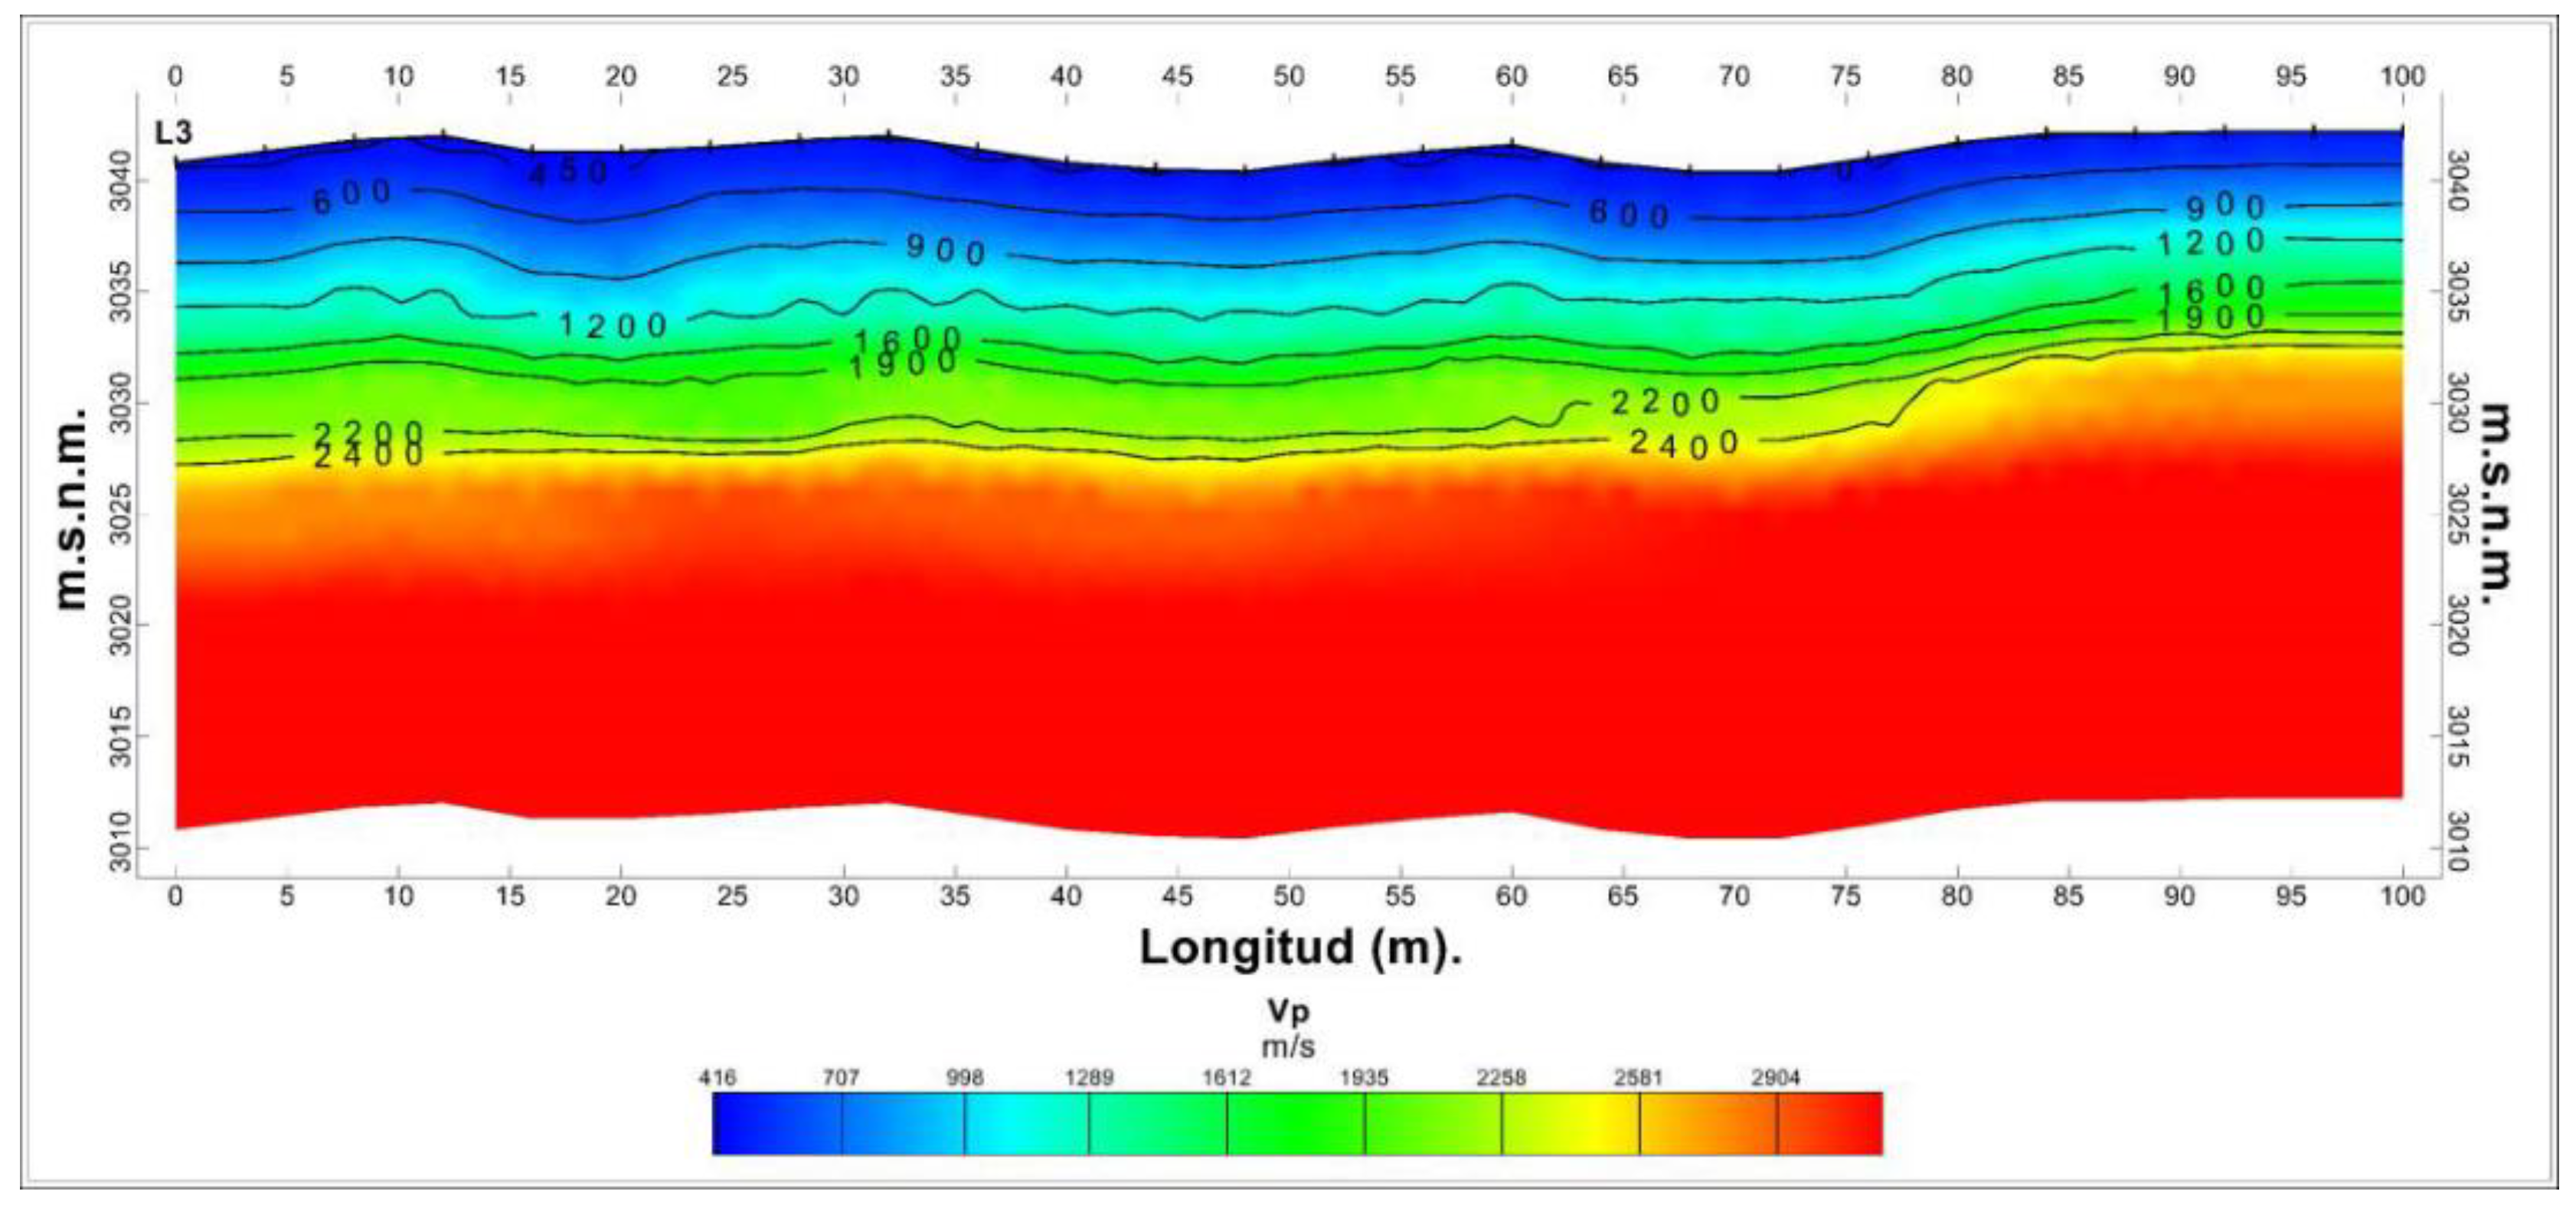
Figure 12.
Diagram for postulated Kuelap GIS general plan layers. Elaborated by Kościuk.
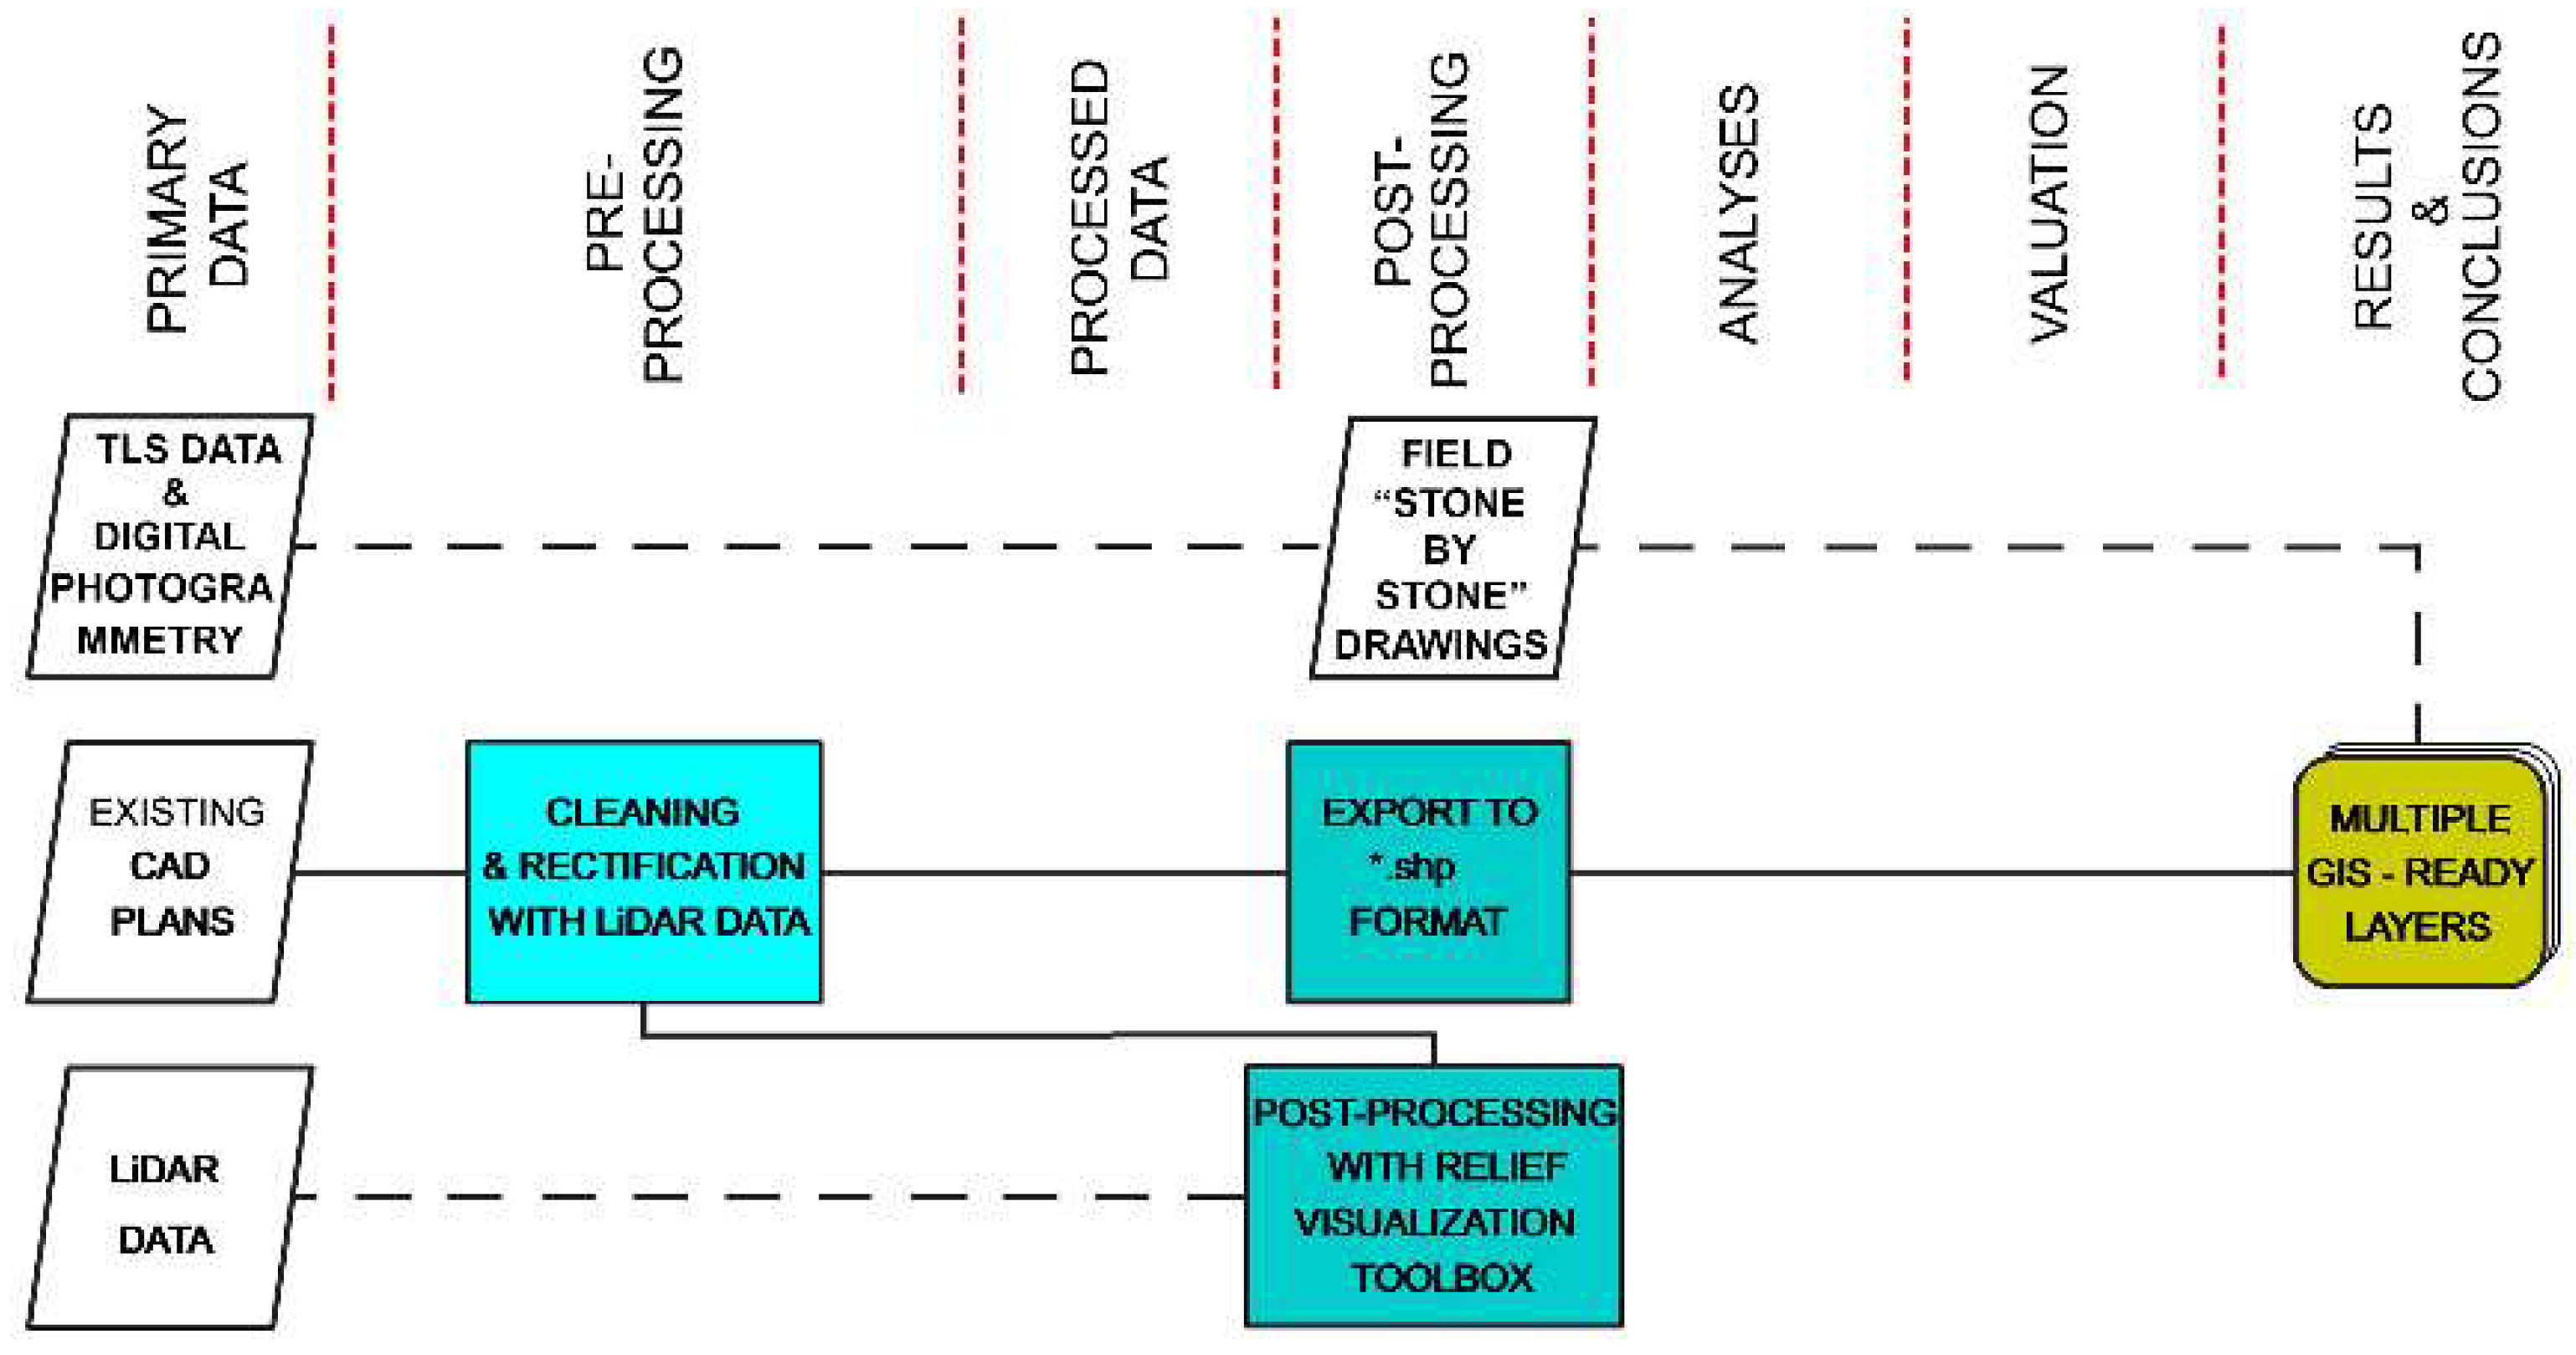
Figure 13.
Gradual deforestation of La Fortaleza between 2005 and 2022 (source: Google Earth ©), and the hillshaded bare ground and architecture 3D model based on UAV LiDAR data. Data source: MEDS AMSTERDAM, data assembled by Kościuk.
Figure 13.
Gradual deforestation of La Fortaleza between 2005 and 2022 (source: Google Earth ©), and the hillshaded bare ground and architecture 3D model based on UAV LiDAR data. Data source: MEDS AMSTERDAM, data assembled by Kościuk.
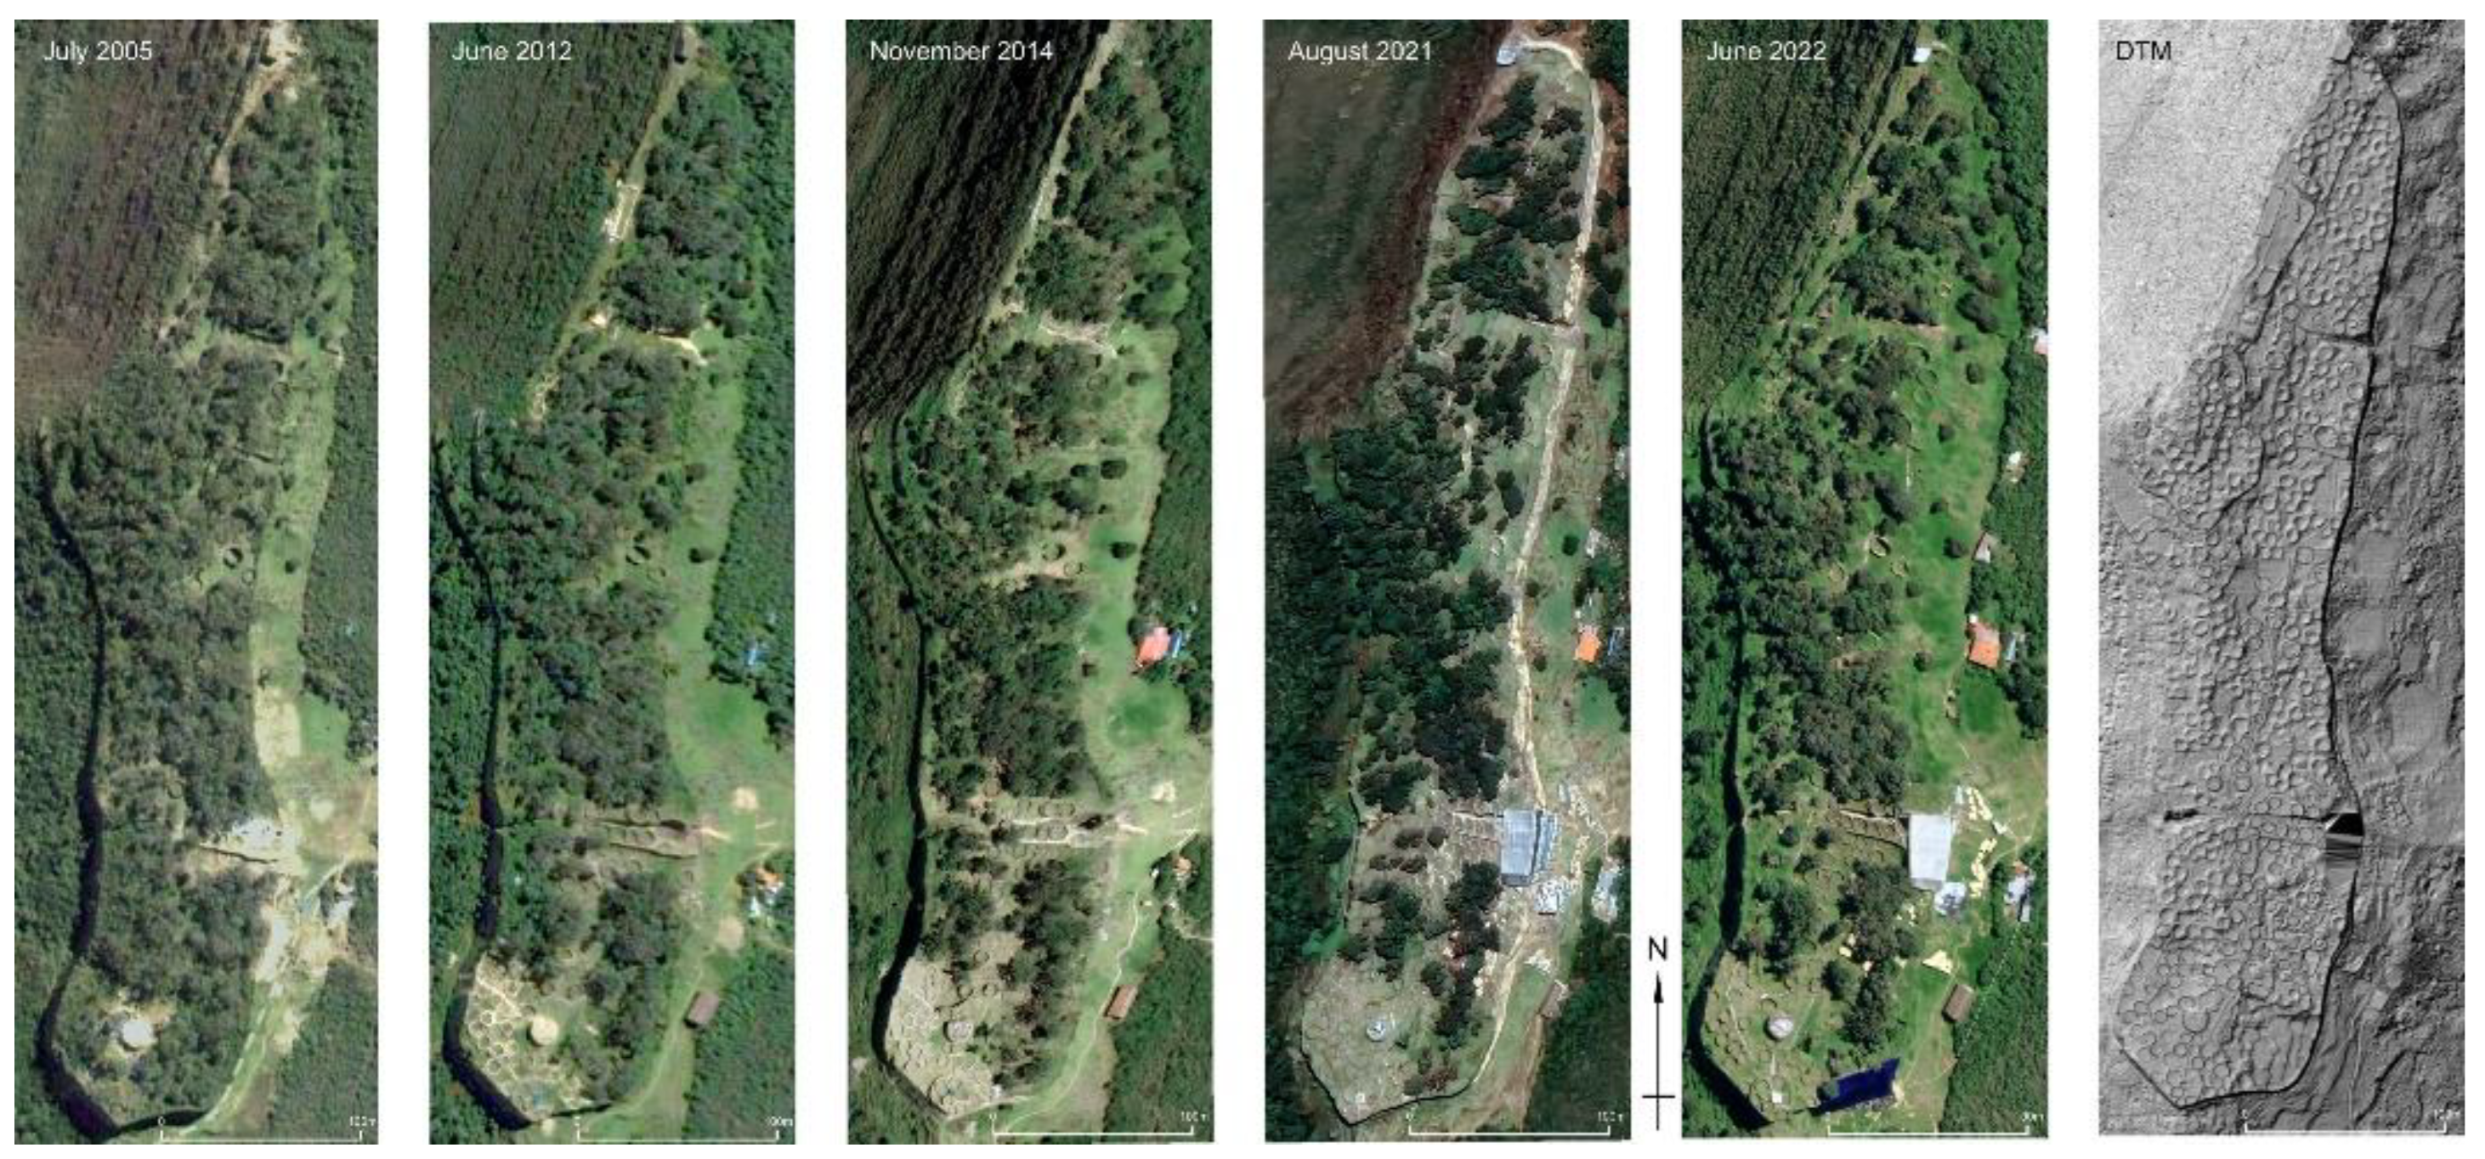
Figure 15.
Filtered and classified LiDAR data covering La Fortaleza. Data previously reported by Righetti et al. [74,75].
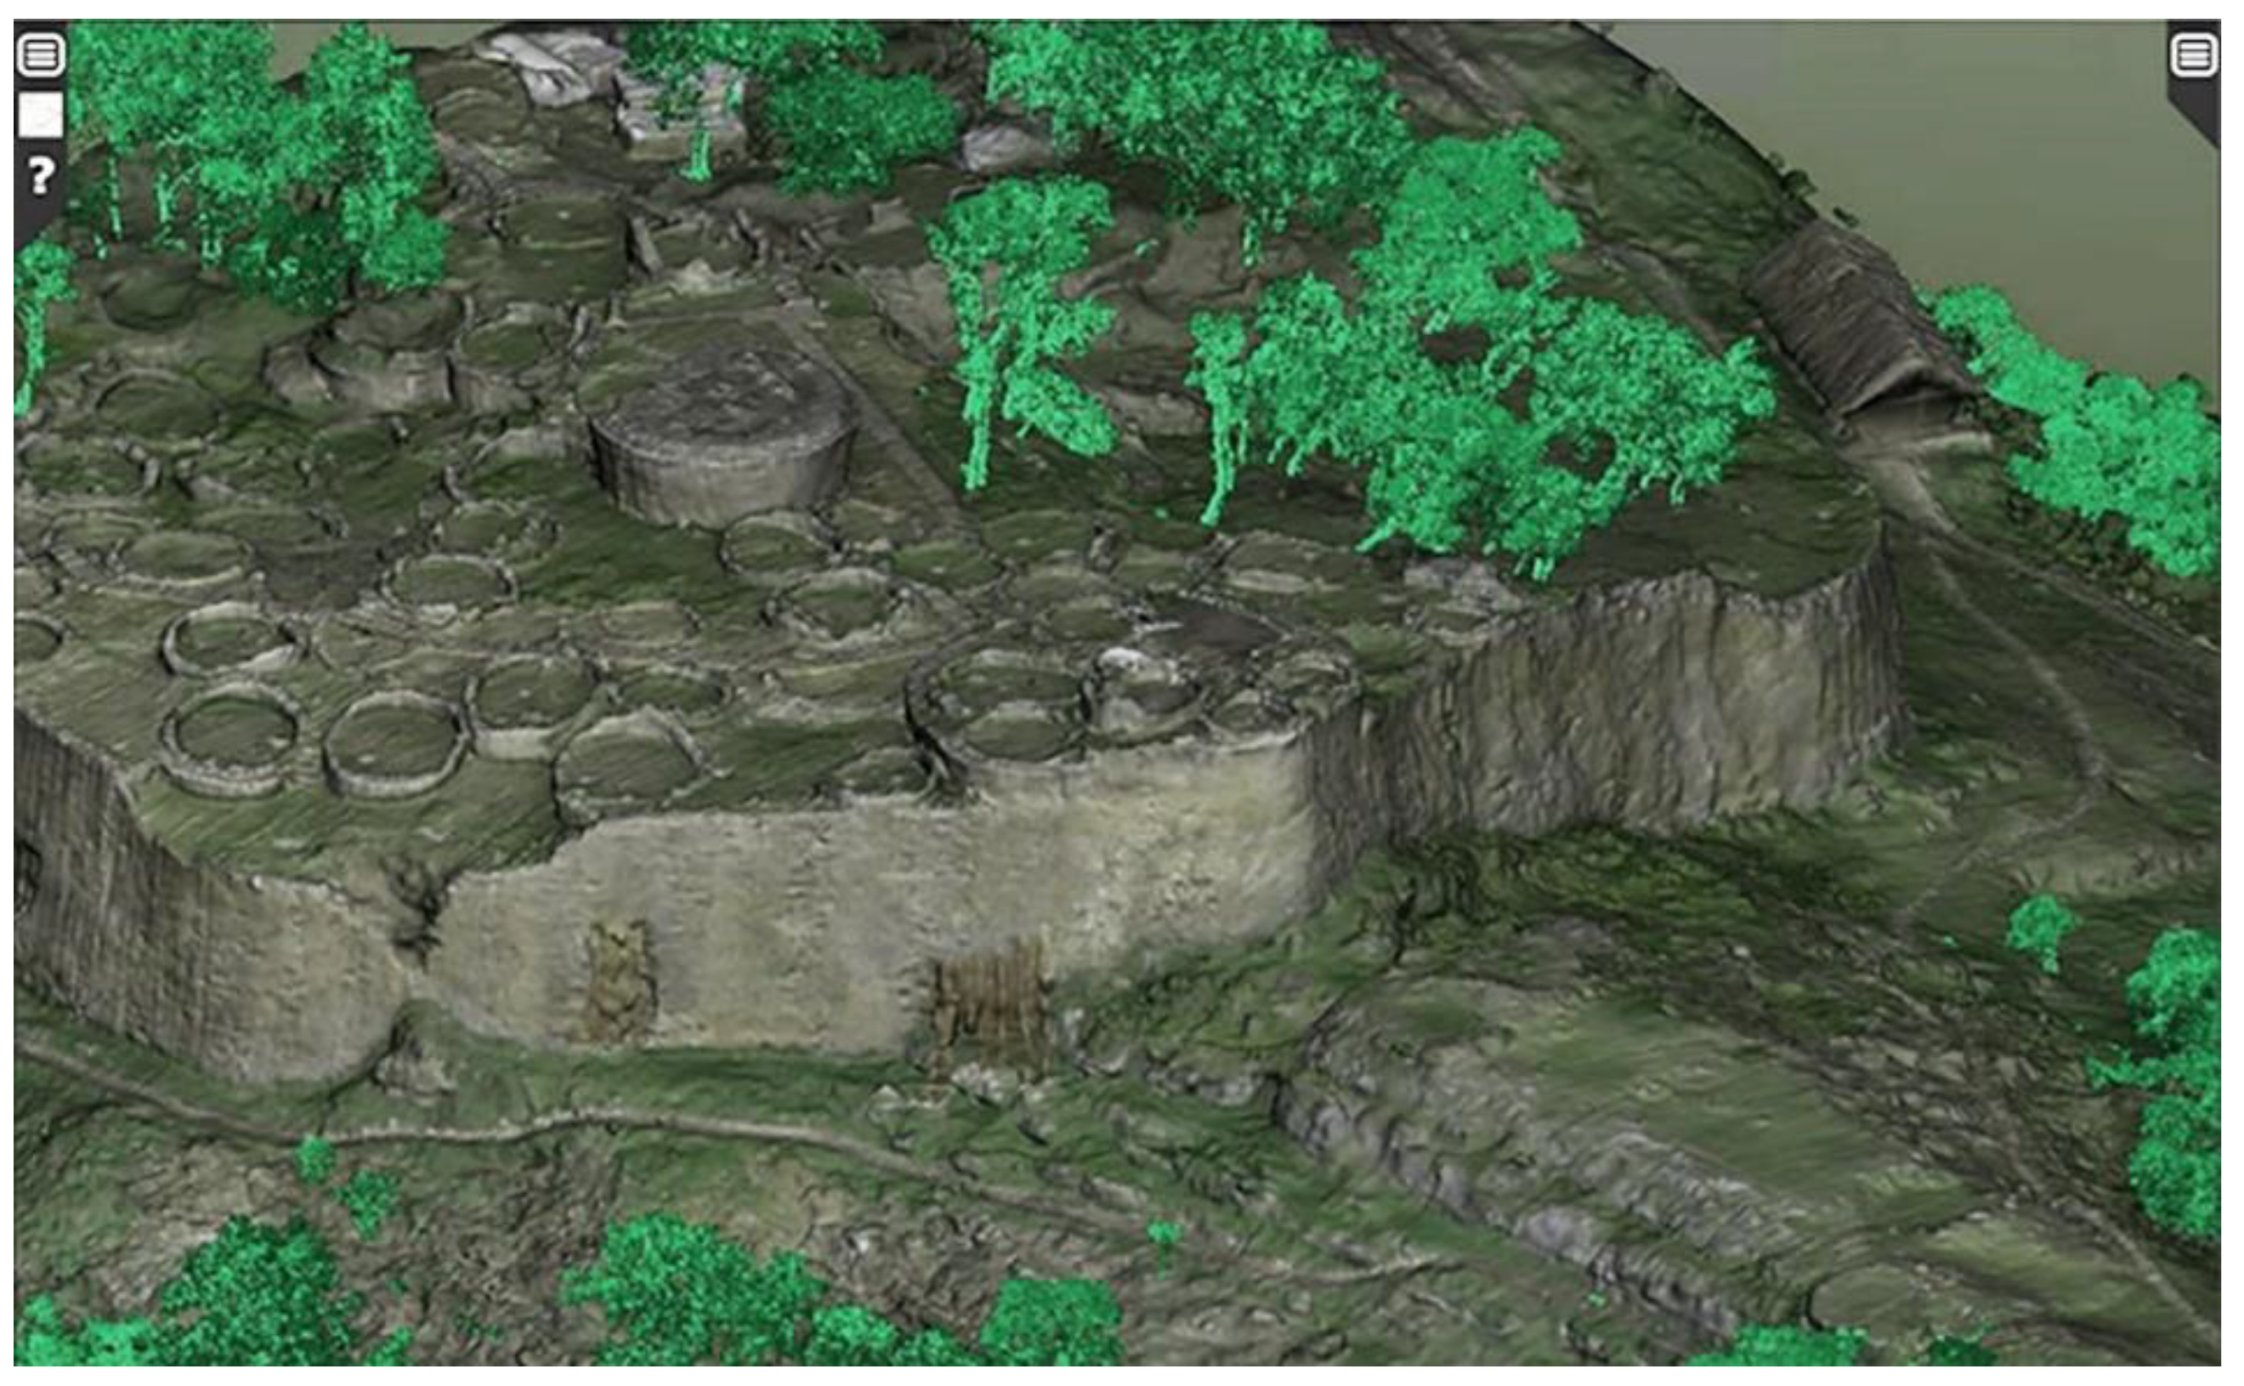
Figure 16.
Diagram for LiDAR data visualization and hydrological analysis. Elaborated by Kościuk.
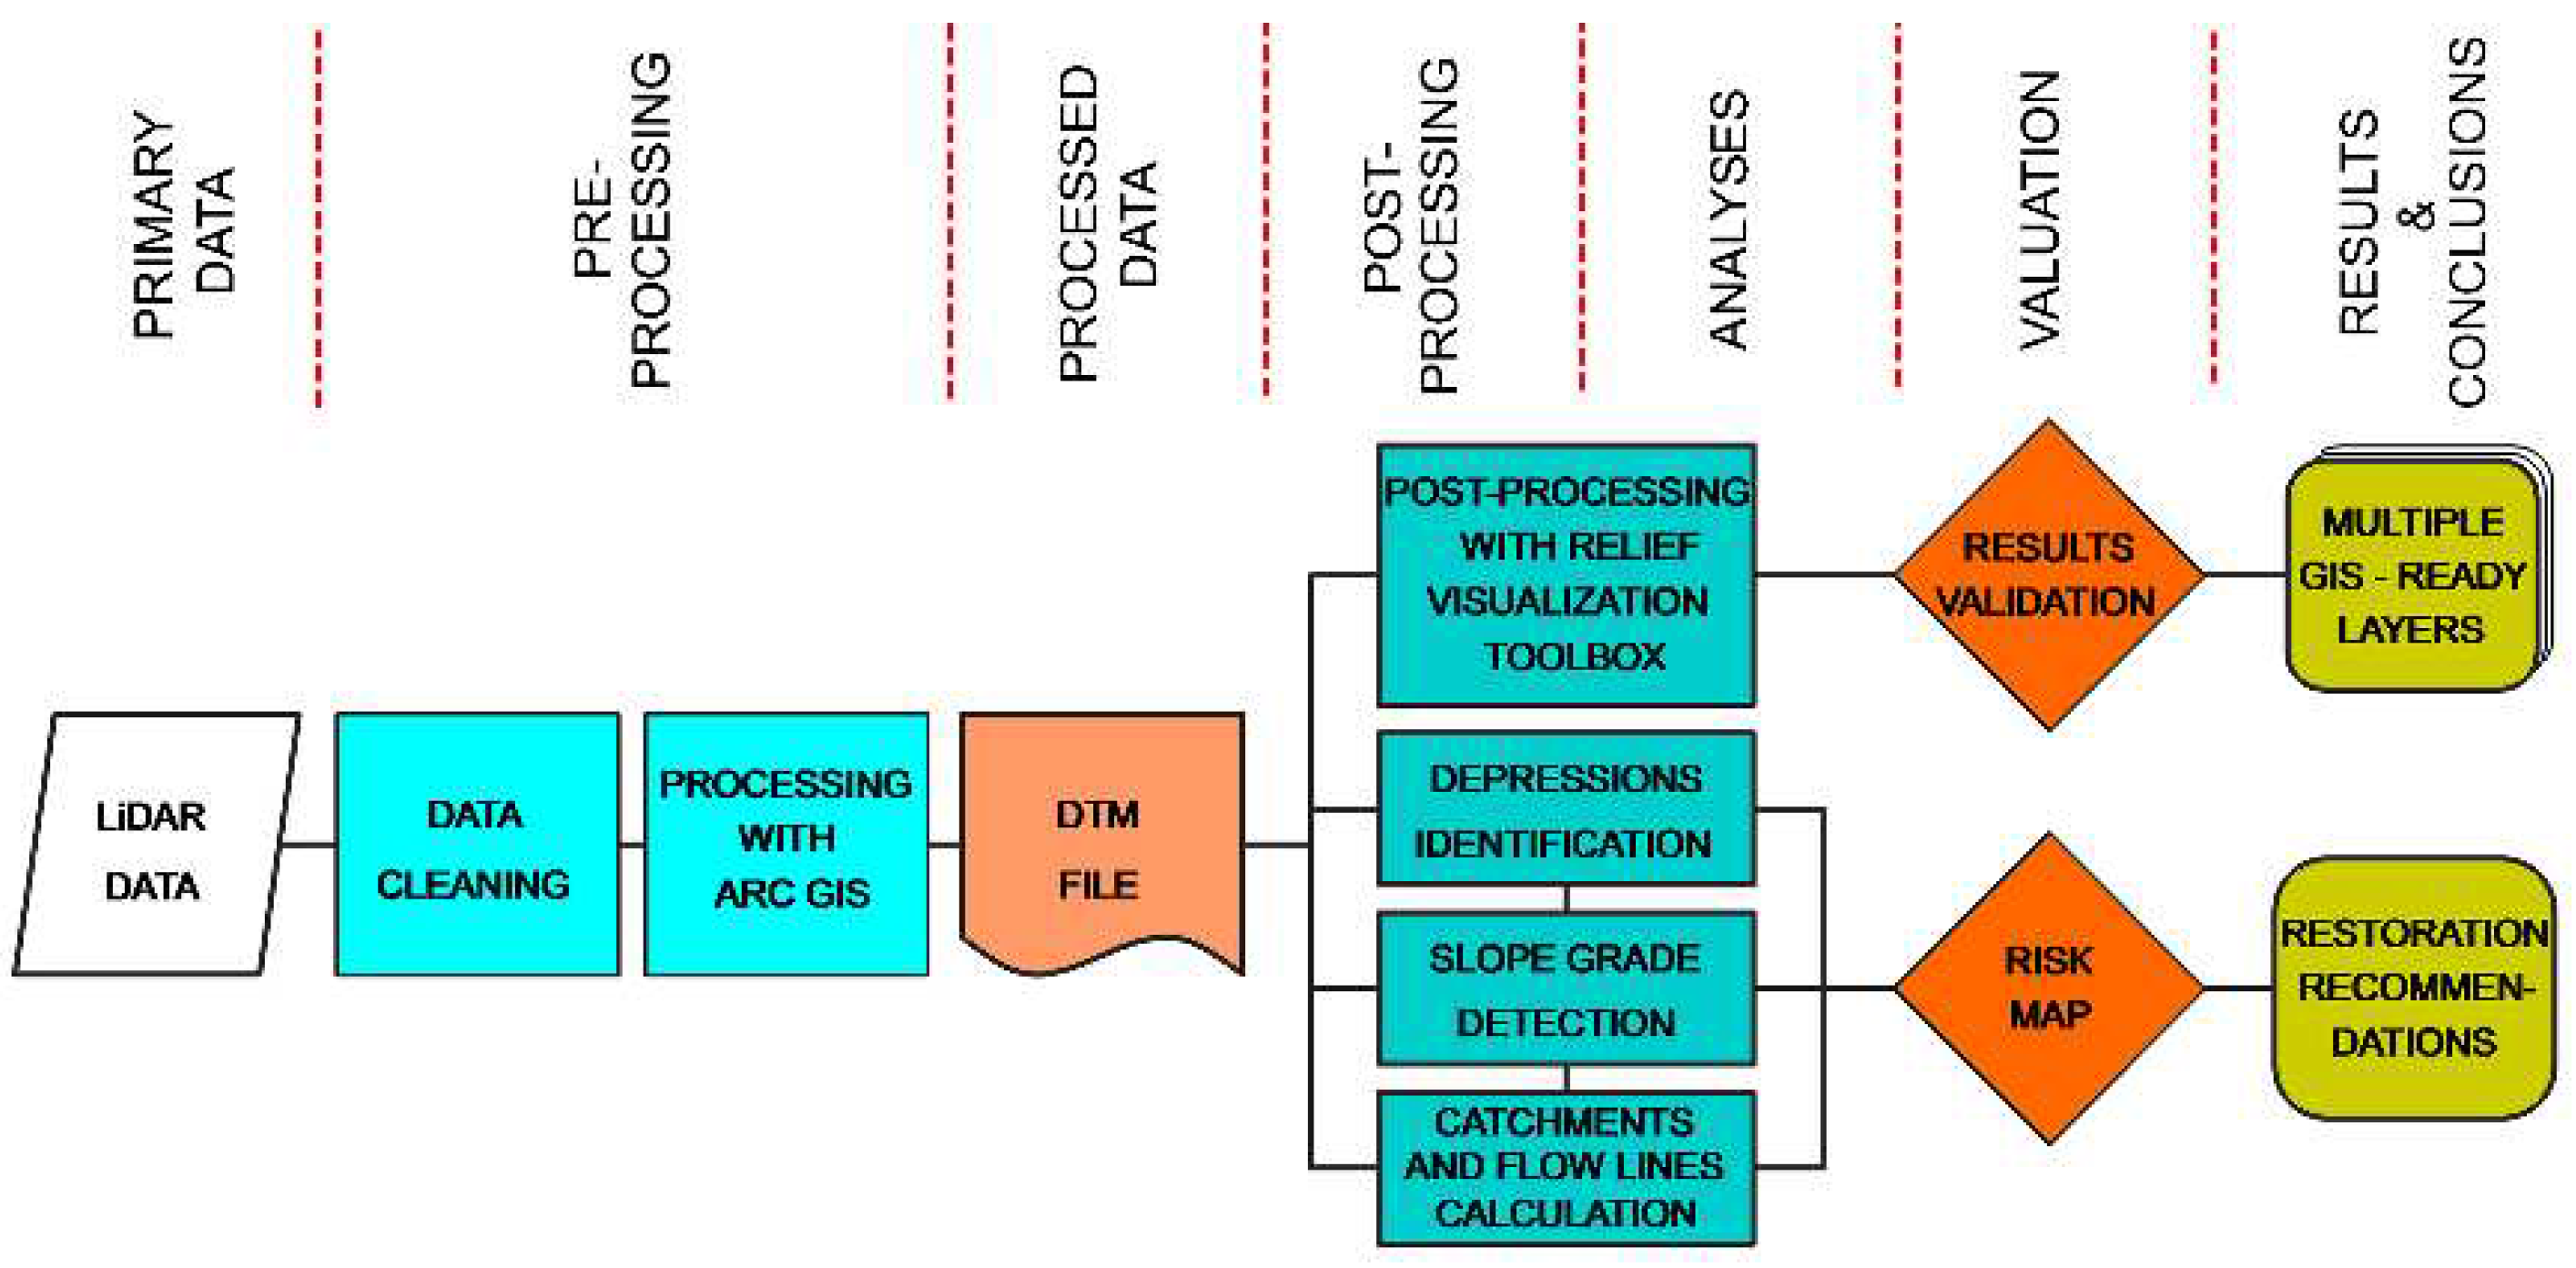
Figure 17.
Examples of different visualization modes of LiDAR data: (DTM) 10 cm resolution digital terrain model; HS - unidirectional hill-shading (azimuth 315°, vertical 35°); (MHS) multidirectional hill-shading (8 directions, vertical 30°); (SG) slope gradient (no parameters required); (OPEN-POS) openness-positive (search radius 10 pixels, 16 search directions); (HYPSO) 5cm resolution 3D model colored with elevation data; (VAT) general terrain Archaeological Mixer (sky-view factor, multiplication 25% opacity blending mode; openness-positive, overlay 50% blending mode; slope gradient, luminosity 50% blending mode; analytical hill shading, normal blending mode 100%). Based on LiDAR data from MEDS AMSTERDAM, prepared by Ćmielewski and Kościuk.
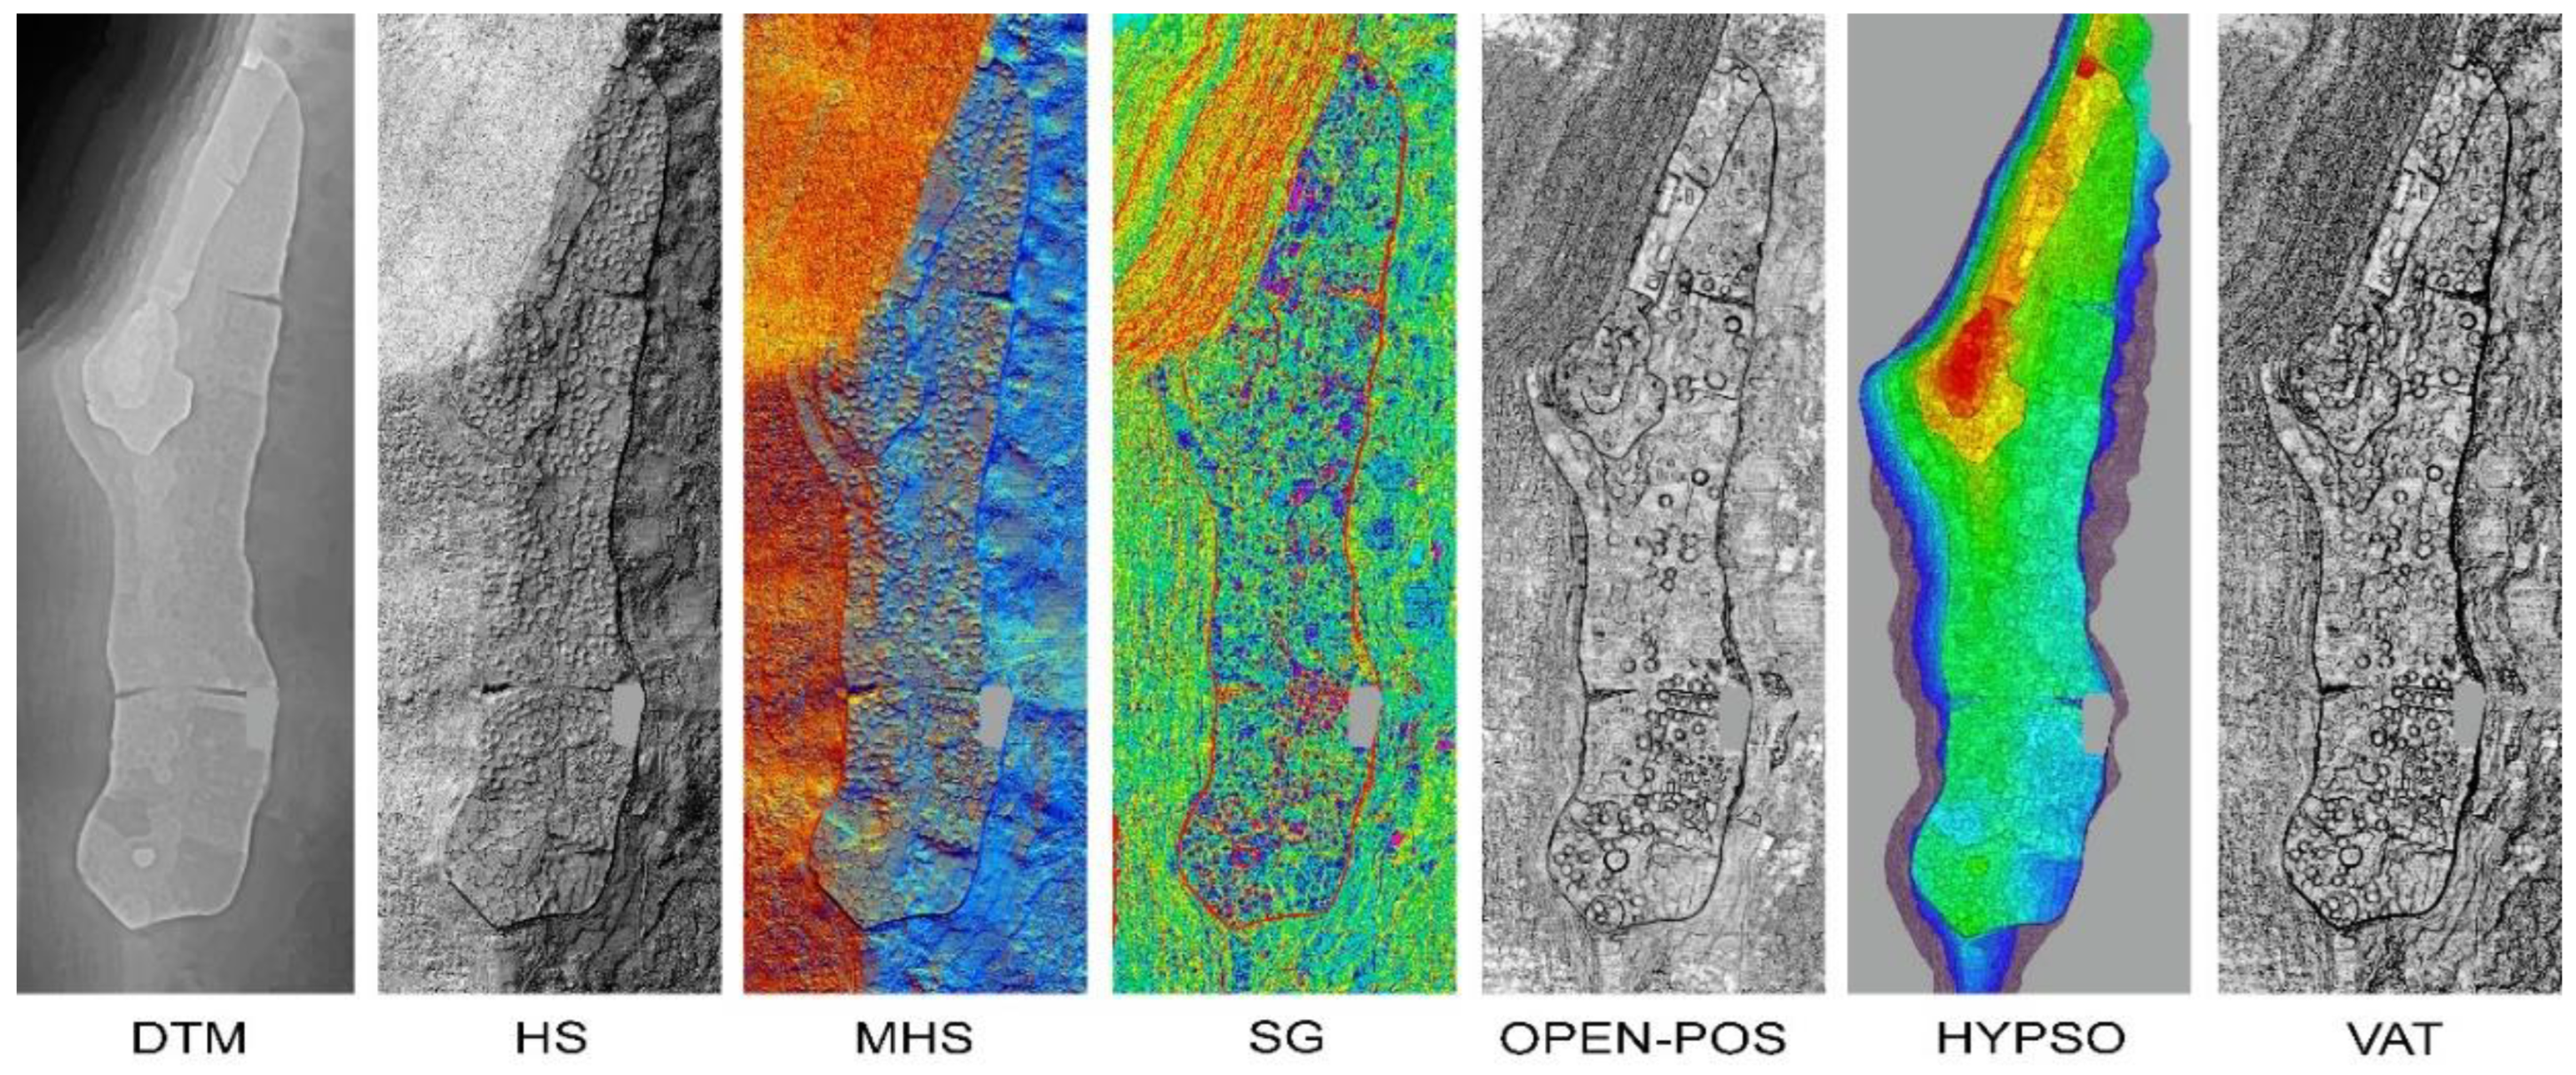
Figure 18.
Samples of hydrological analyses for the southernmost part of La Fortaleza: (A) slope gradient; (B) local depressions; (C) boundaries of water catchments; (D) rainwater runoff lines. Hydrological analysis by Dąbek; data assembling by Kościuk.
Figure 18.
Samples of hydrological analyses for the southernmost part of La Fortaleza: (A) slope gradient; (B) local depressions; (C) boundaries of water catchments; (D) rainwater runoff lines. Hydrological analysis by Dąbek; data assembling by Kościuk.
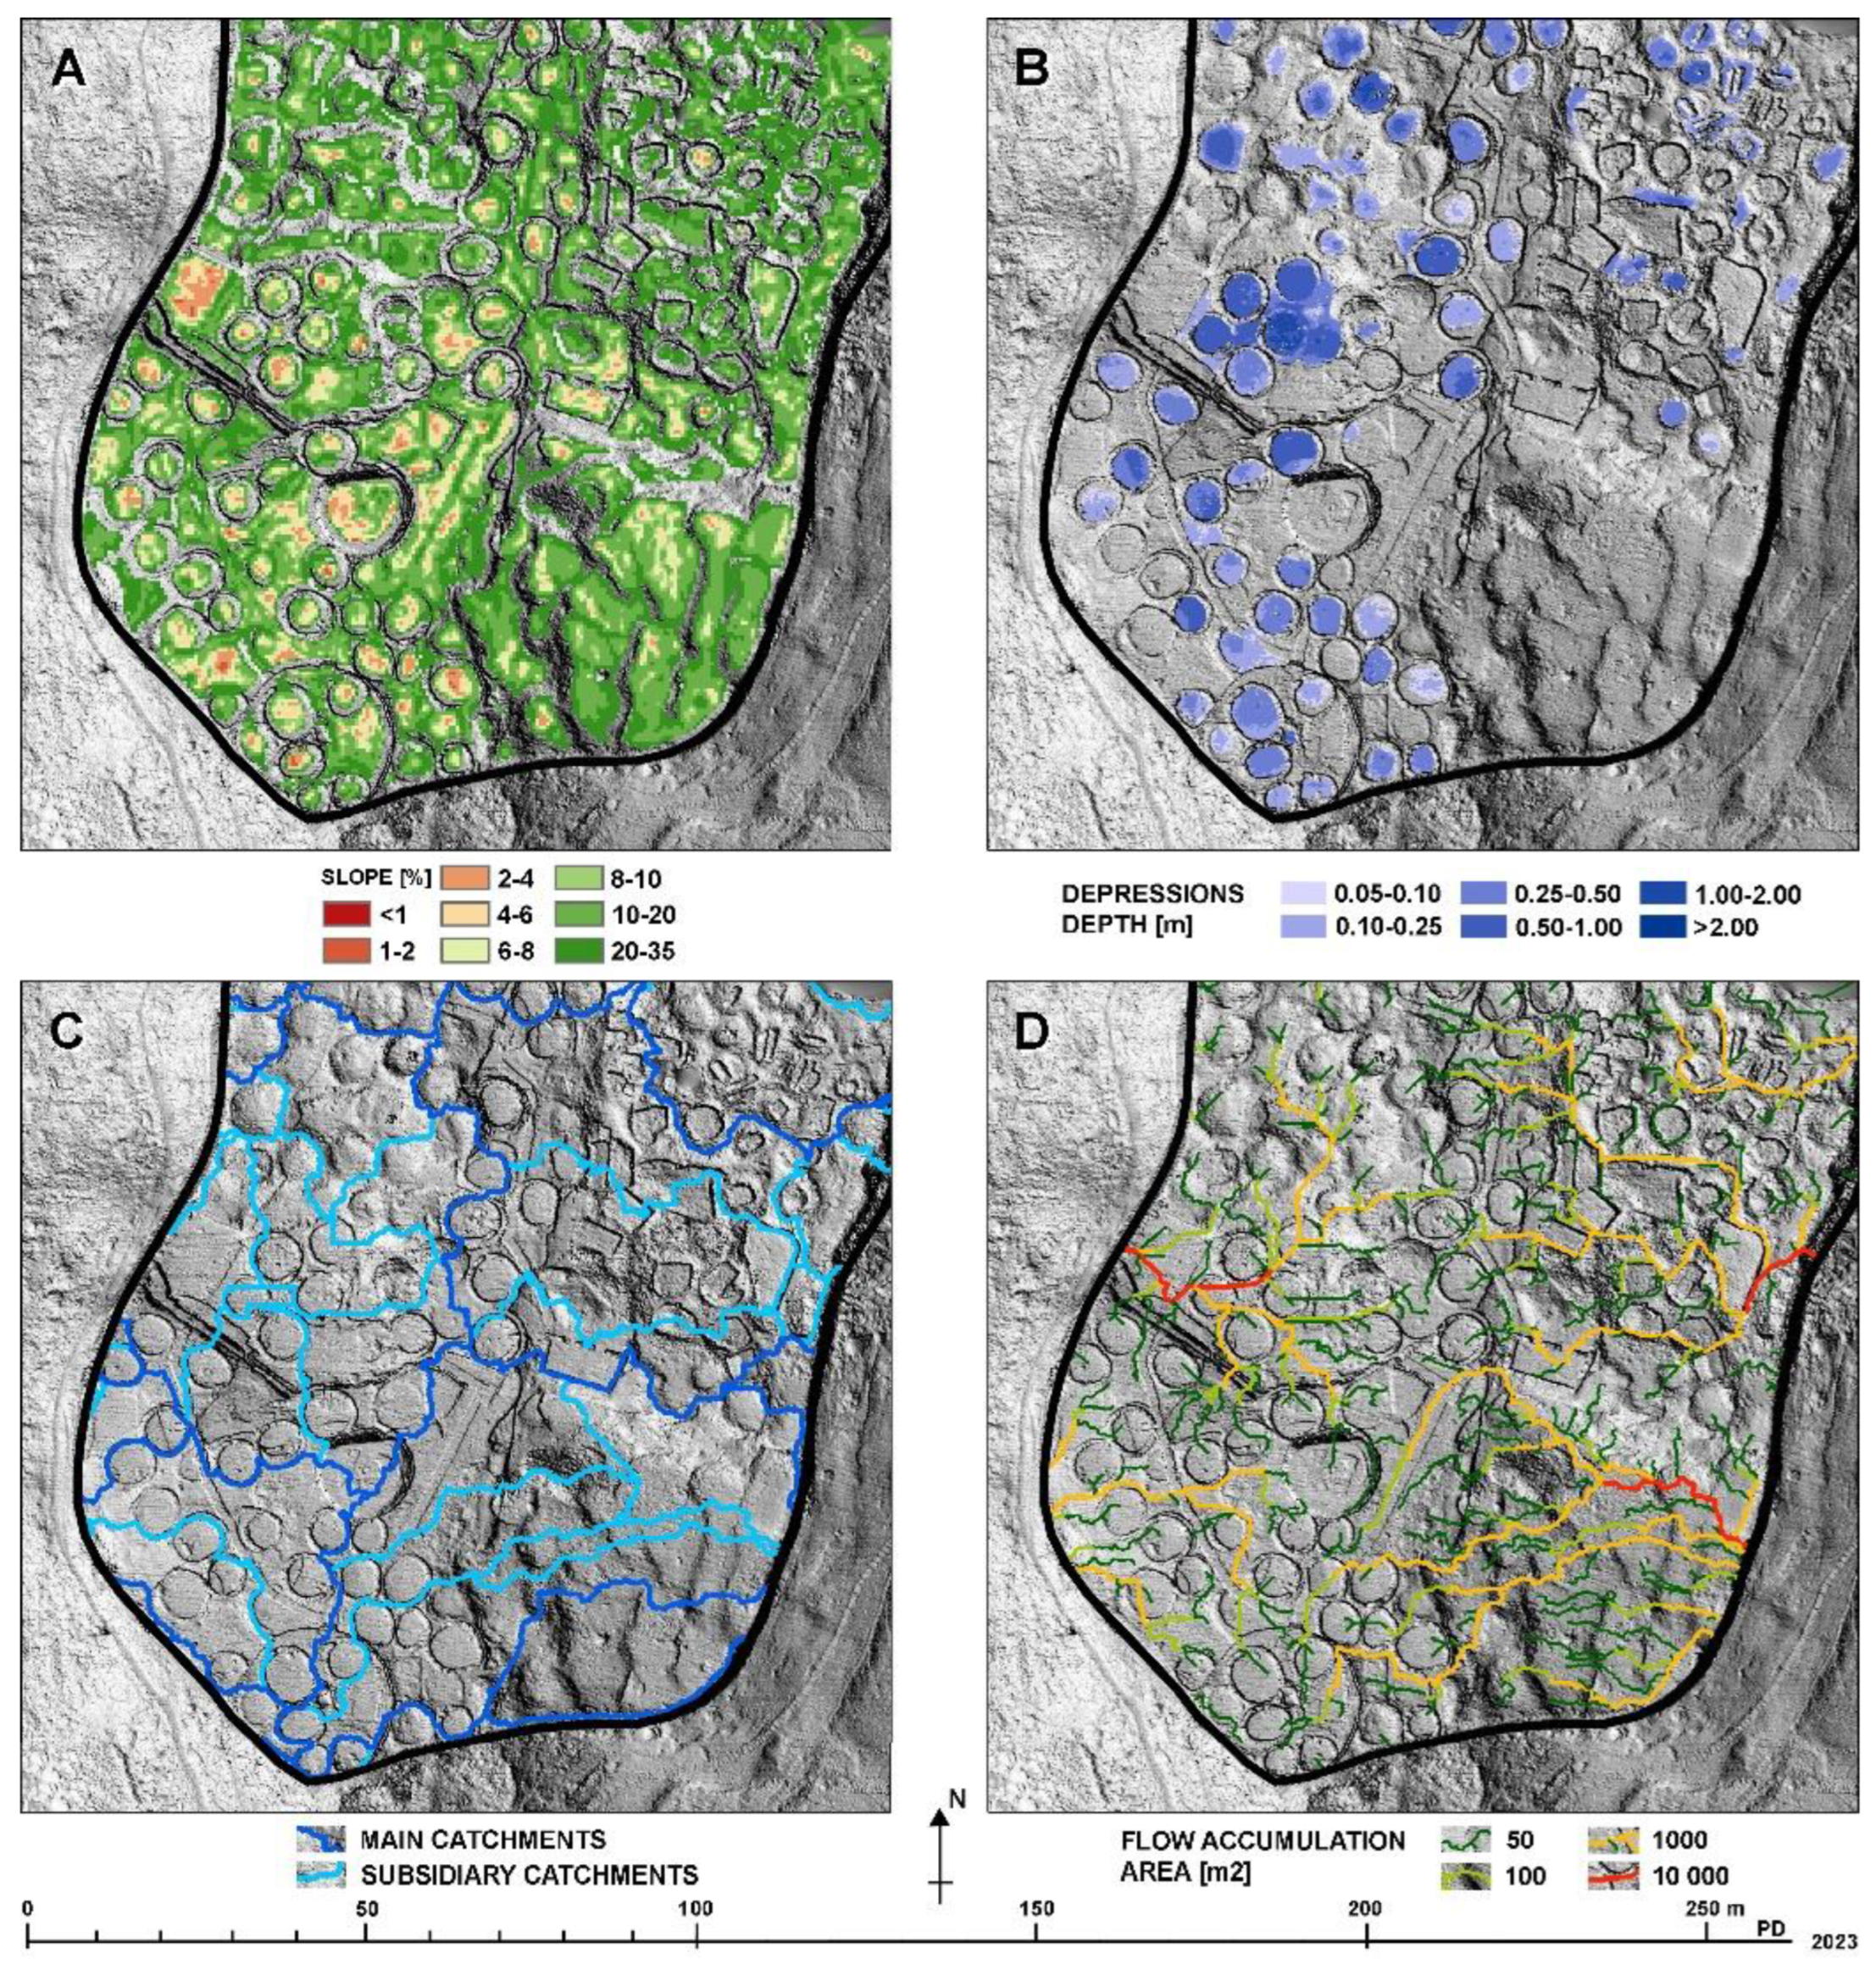
Figure 19.
Diagram for comparing ERT data with hydrographic analyses. Elaborated by Kościuk.
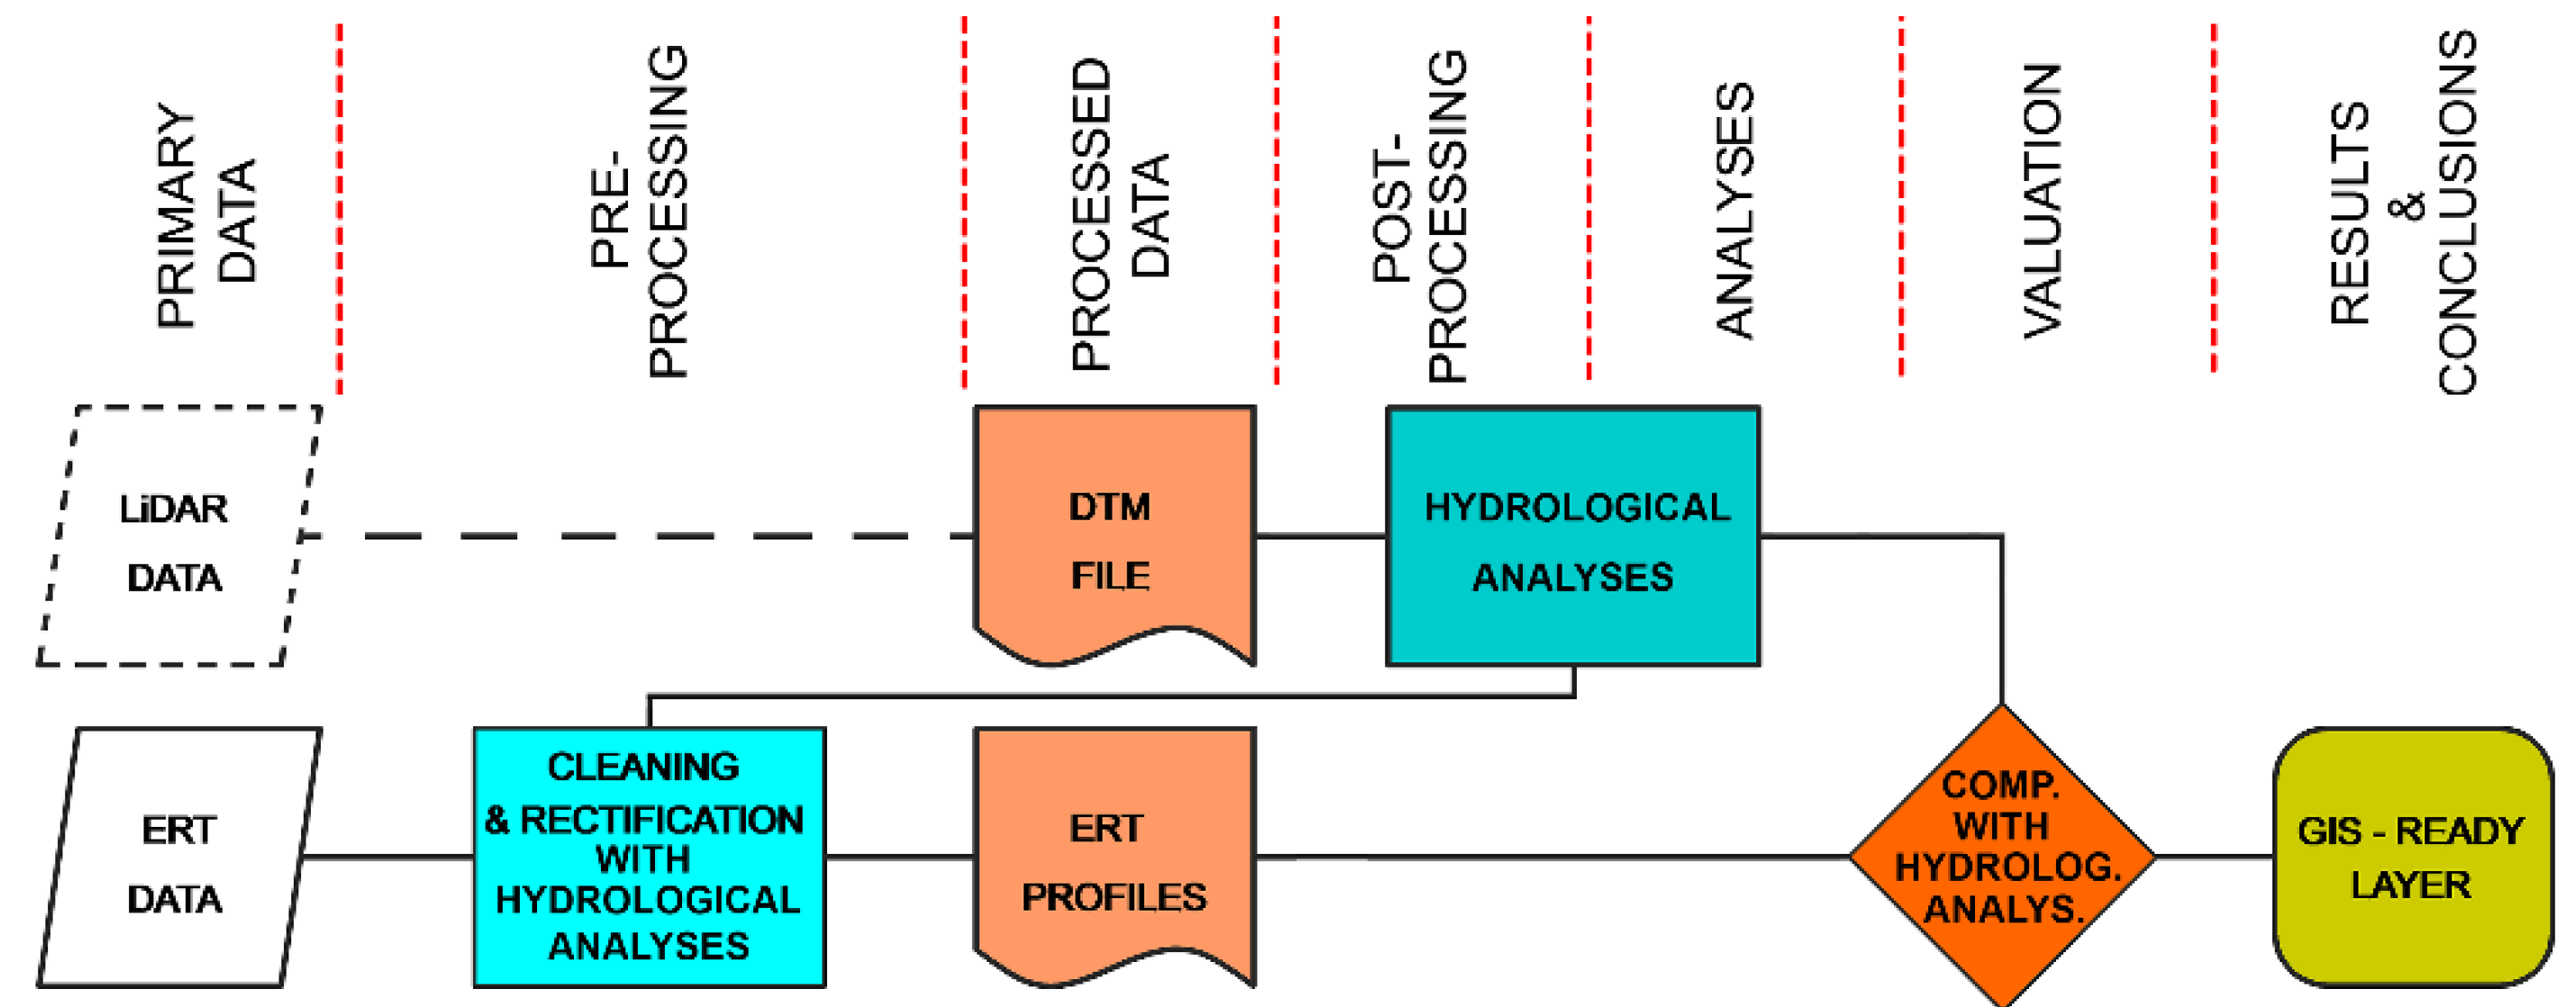
Figure 21.
Stratigraphic sections of La Fortaleza based on the processing of seismic refraction data. 1) Construction fill; 2) Limestone bedrock; A) Longitudinal section. B) – L) Transversal sections.
Figure 21.
Stratigraphic sections of La Fortaleza based on the processing of seismic refraction data. 1) Construction fill; 2) Limestone bedrock; A) Longitudinal section. B) – L) Transversal sections.
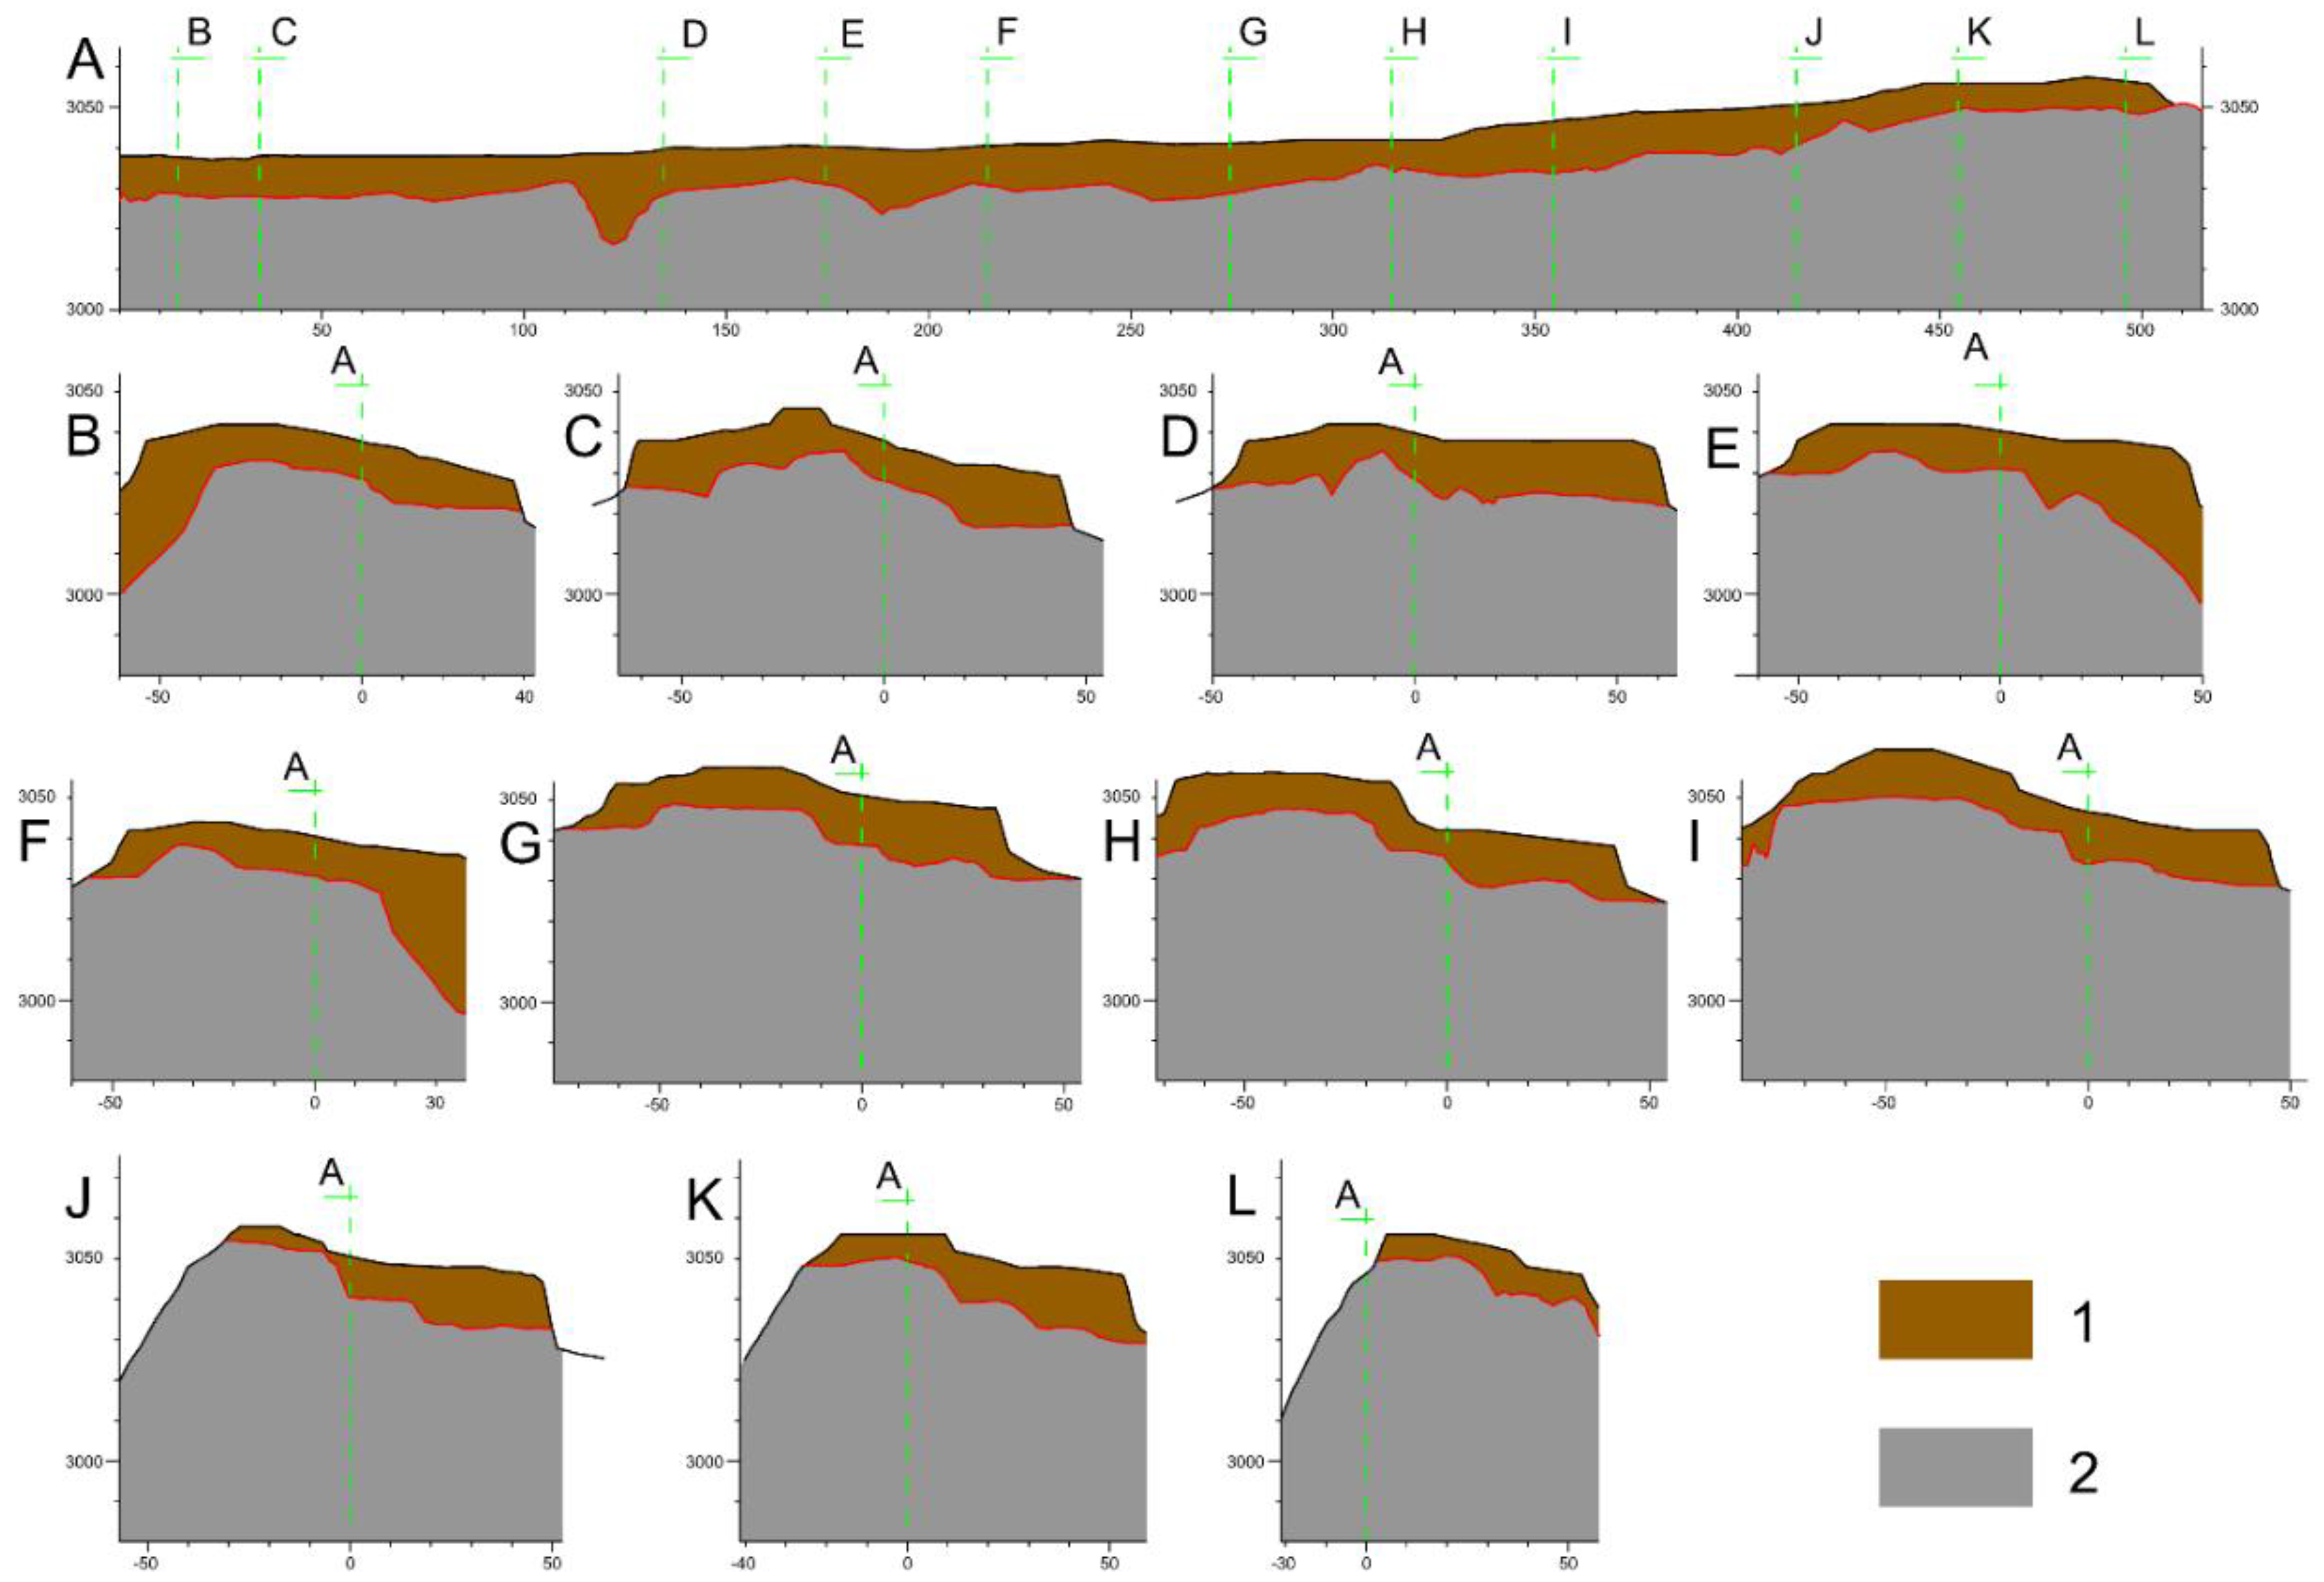
Figure 22.
Sample of the fusion of digital photogrammetry and TLS data at the southeastern corner of La Fortaleza’s perimeter wall. Blue lines - overlap between TLS and photogrammetric projects; green crosses - ground control points for photogrammetric project. TLS 3D point cloud data from Kucera, VanValkenburgh and Rojas. Elaborated by Kościuk.
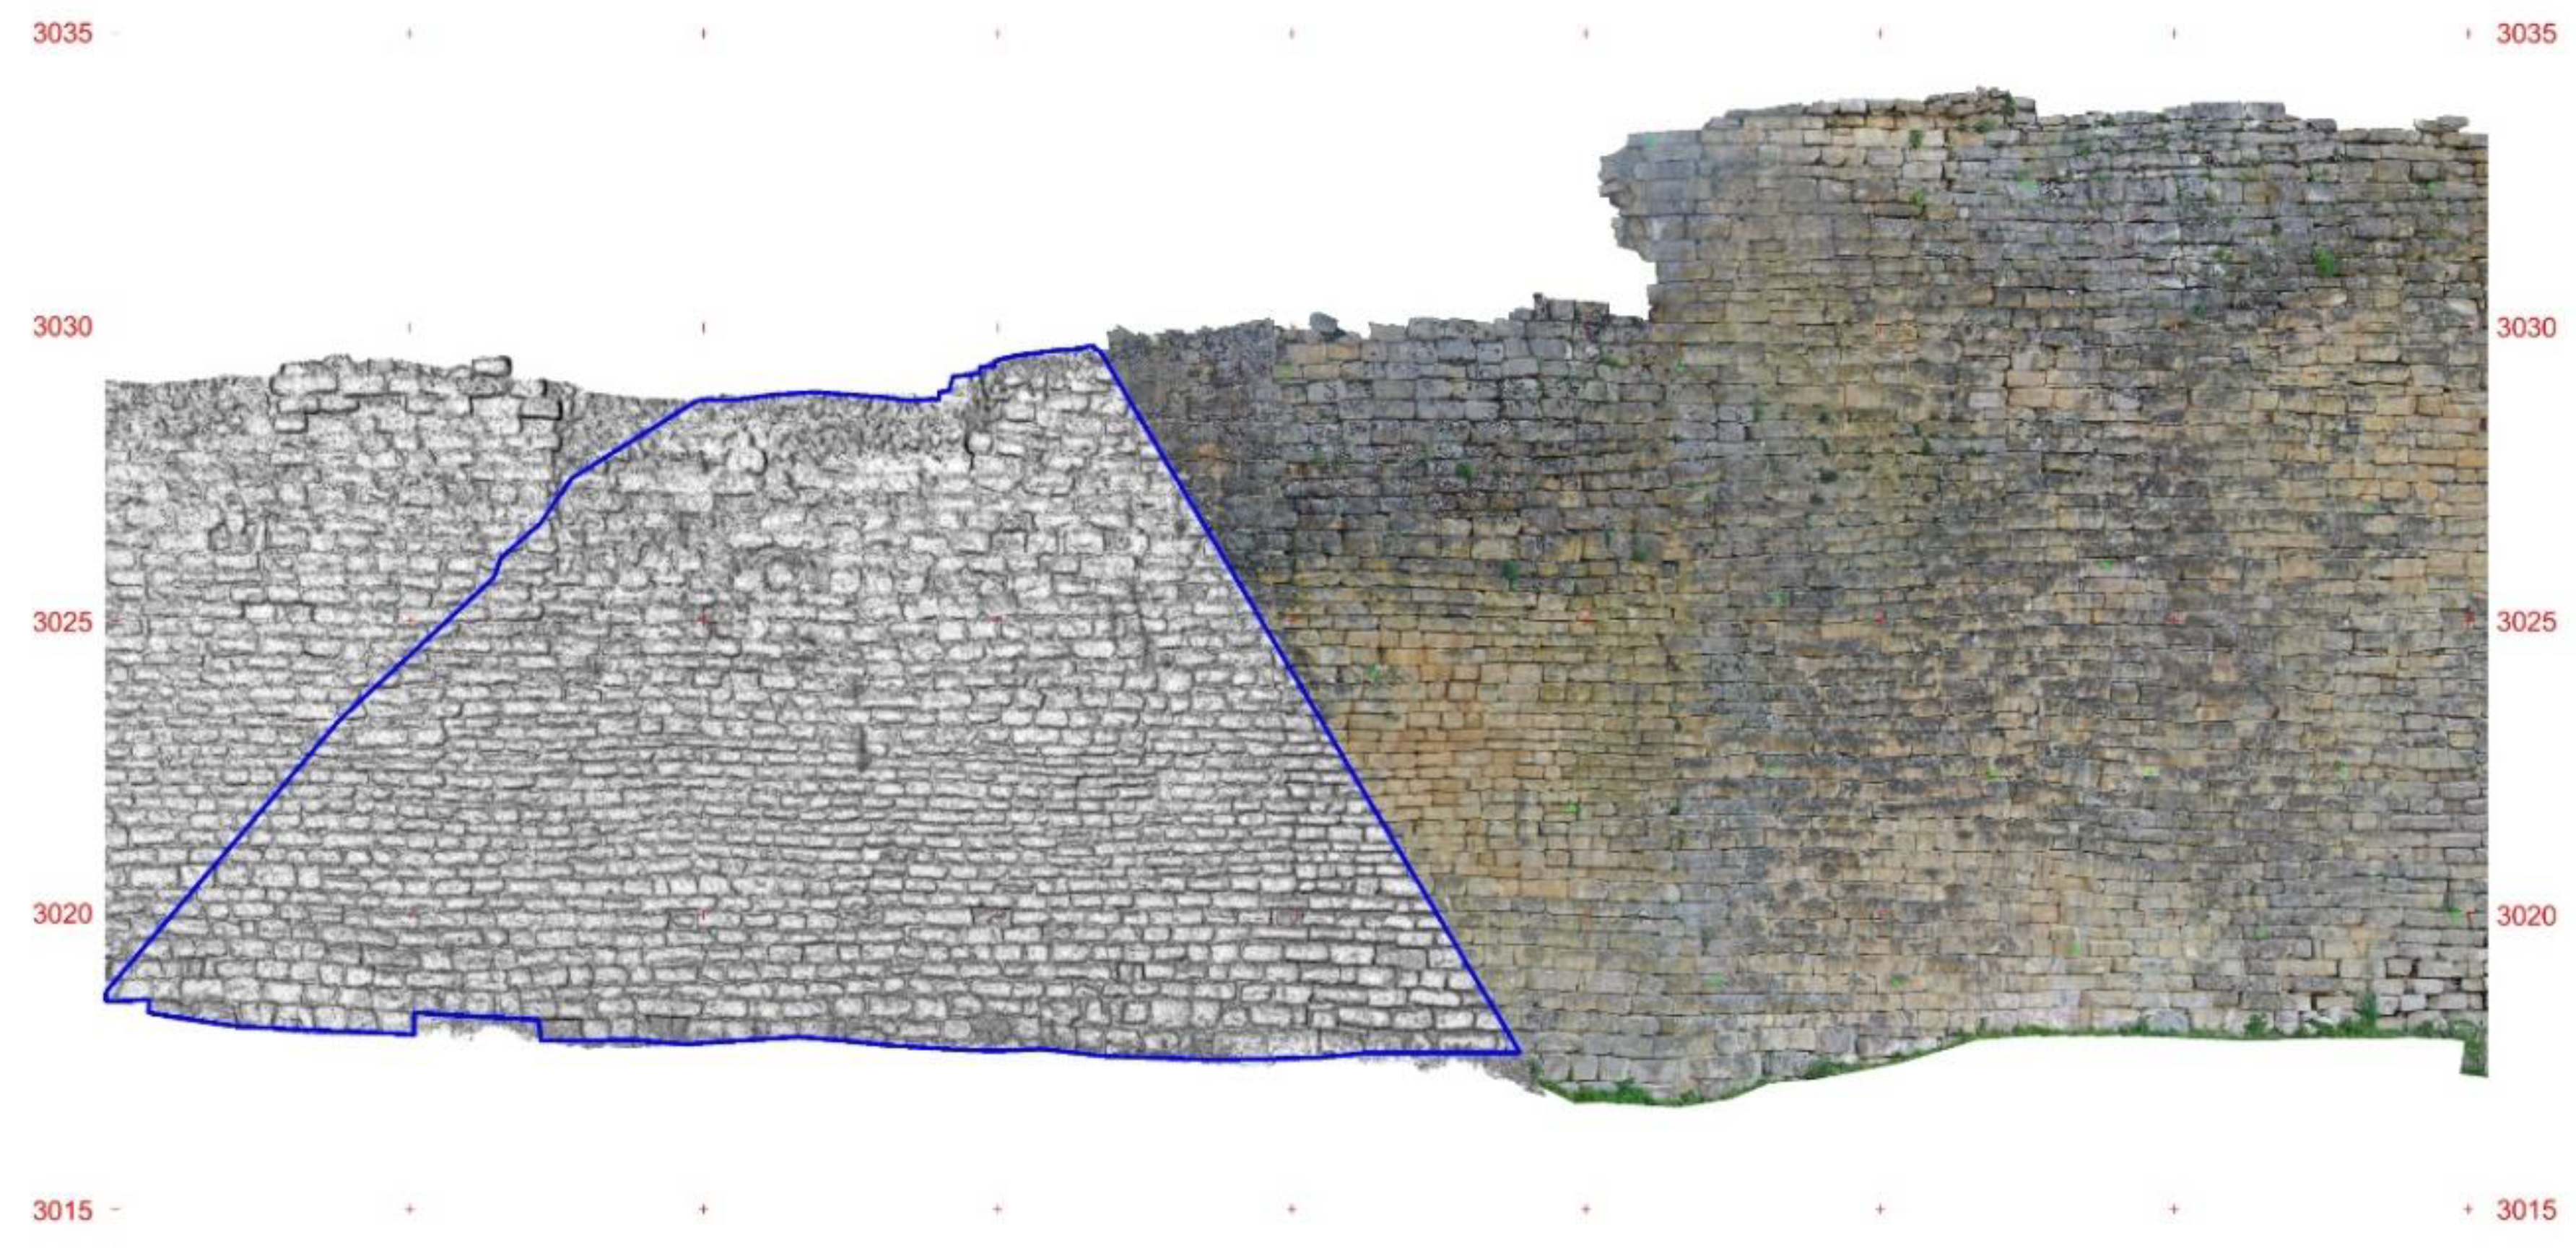
Figure 23.
Diagram for detailed plans for reconstruction purposes and restoration recommendations. Elaborated by Kościuk.
Figure 23.
Diagram for detailed plans for reconstruction purposes and restoration recommendations. Elaborated by Kościuk.
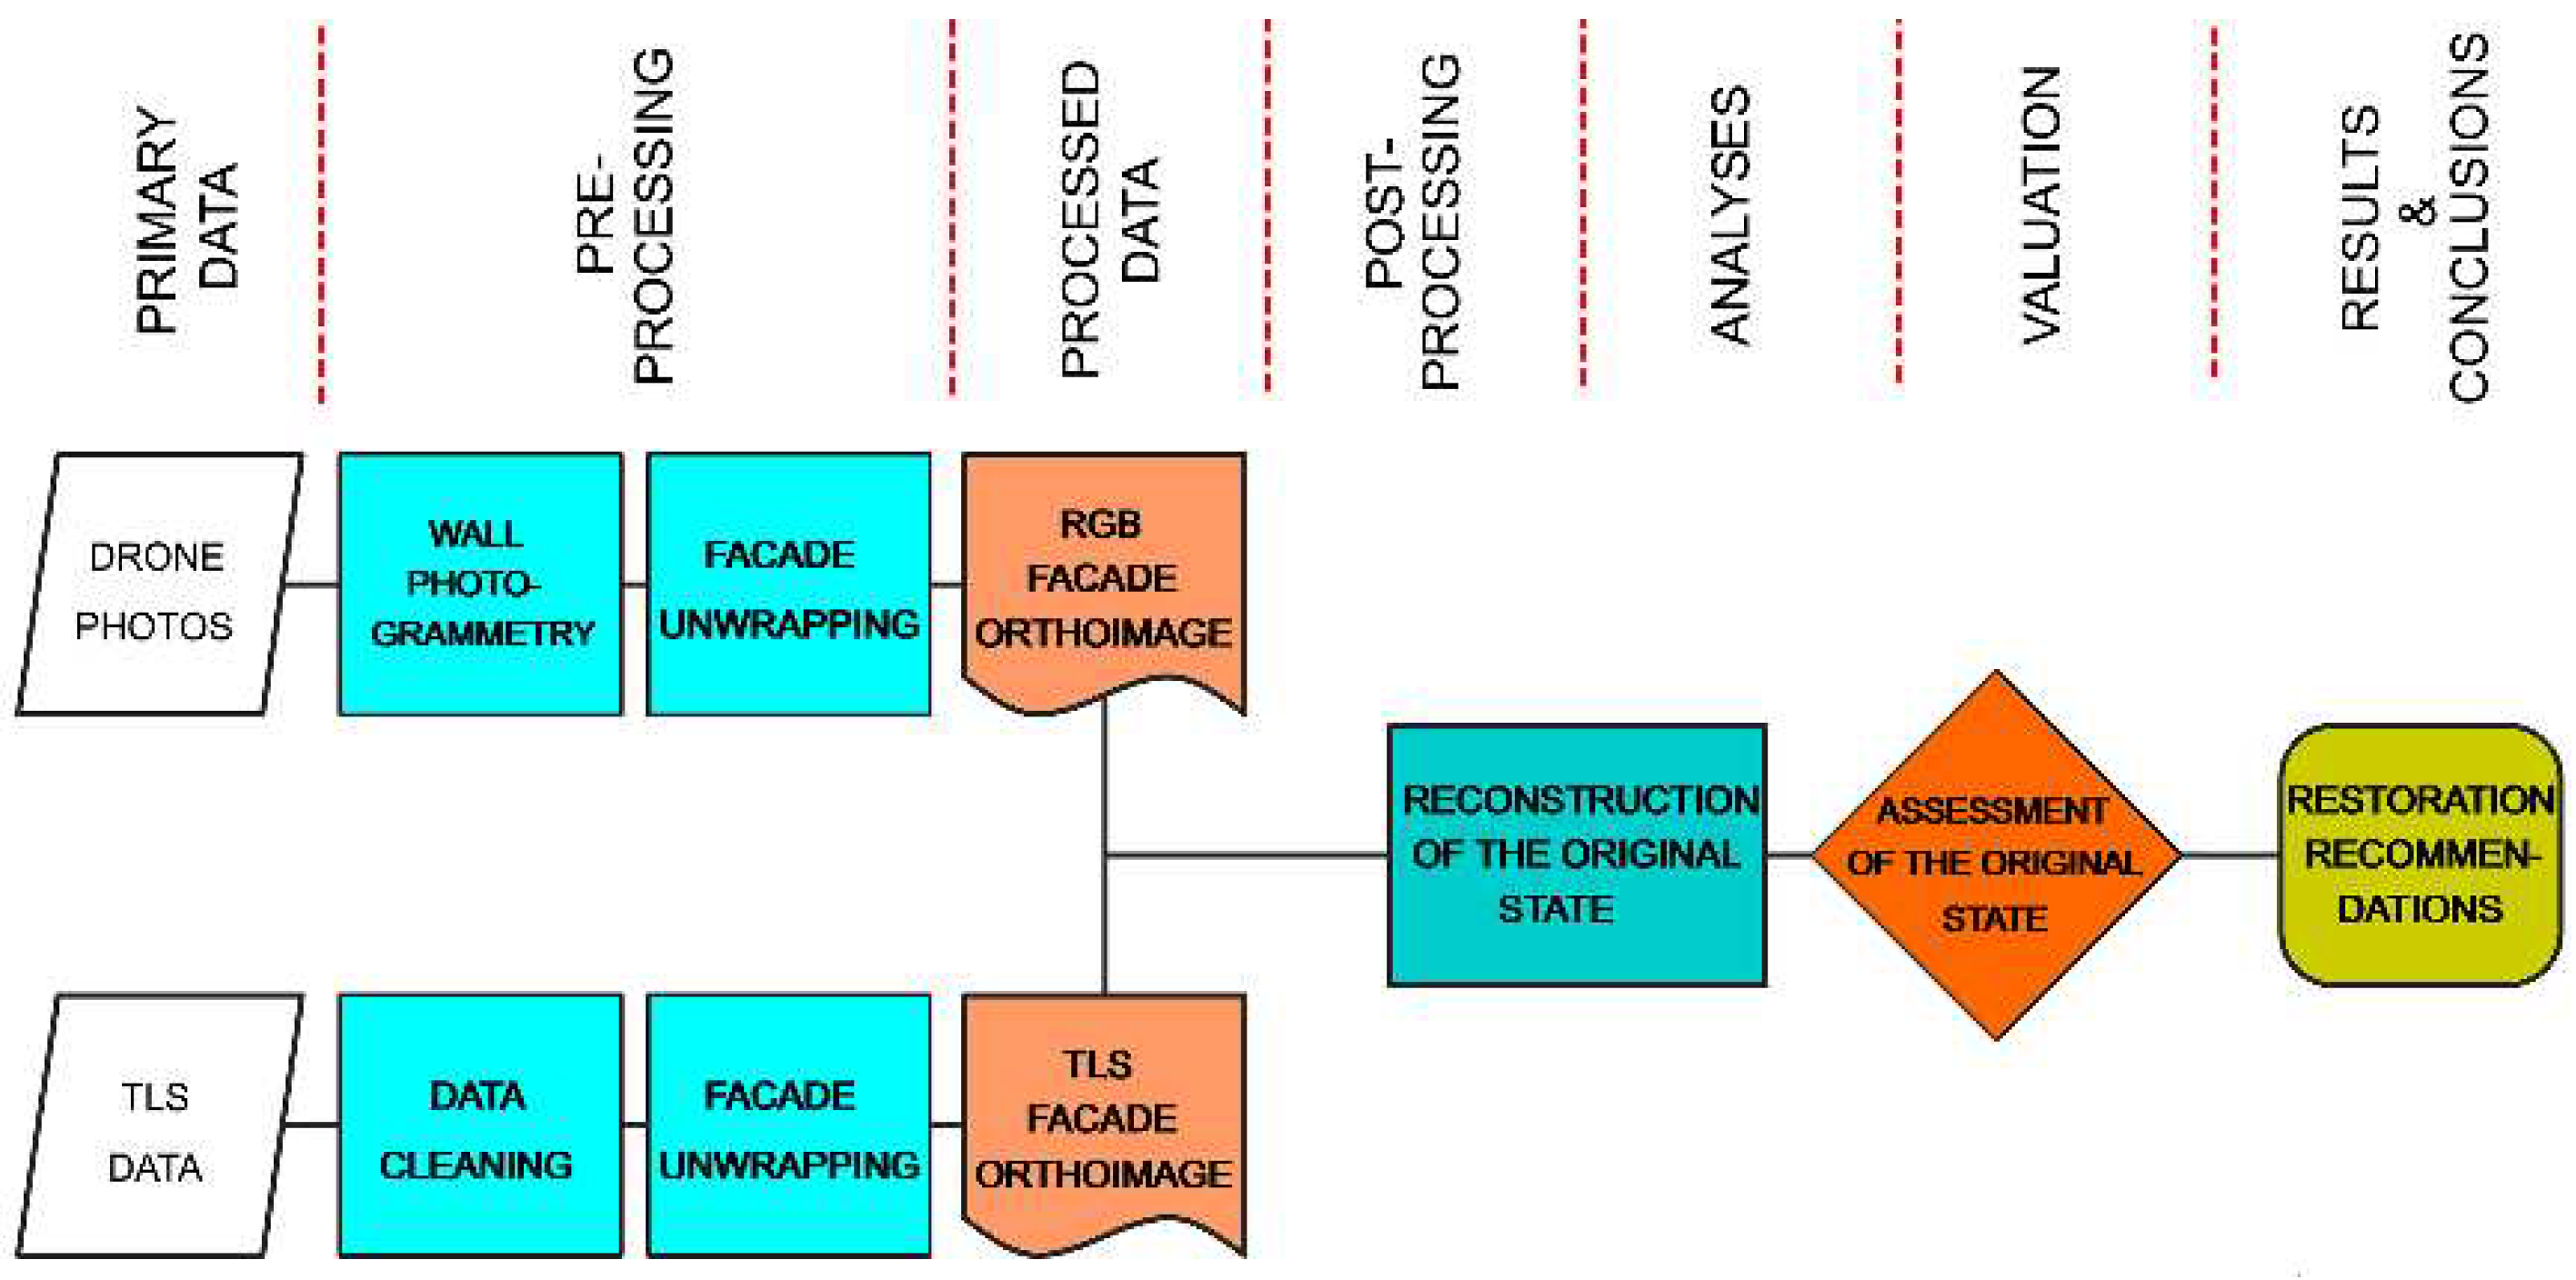
Figure 24.
Aerial view of La Fortaleza in 1995, indicating some episodes of collapse recently documented. A) 10-11th of April, 2022; B) Pre-Hispanic collapse and repair; C) June-July 2023; D) 1910-1933; E) April 2013. F) Date unknown. Photograph by M. Chumbe.
Figure 24.
Aerial view of La Fortaleza in 1995, indicating some episodes of collapse recently documented. A) 10-11th of April, 2022; B) Pre-Hispanic collapse and repair; C) June-July 2023; D) 1910-1933; E) April 2013. F) Date unknown. Photograph by M. Chumbe.
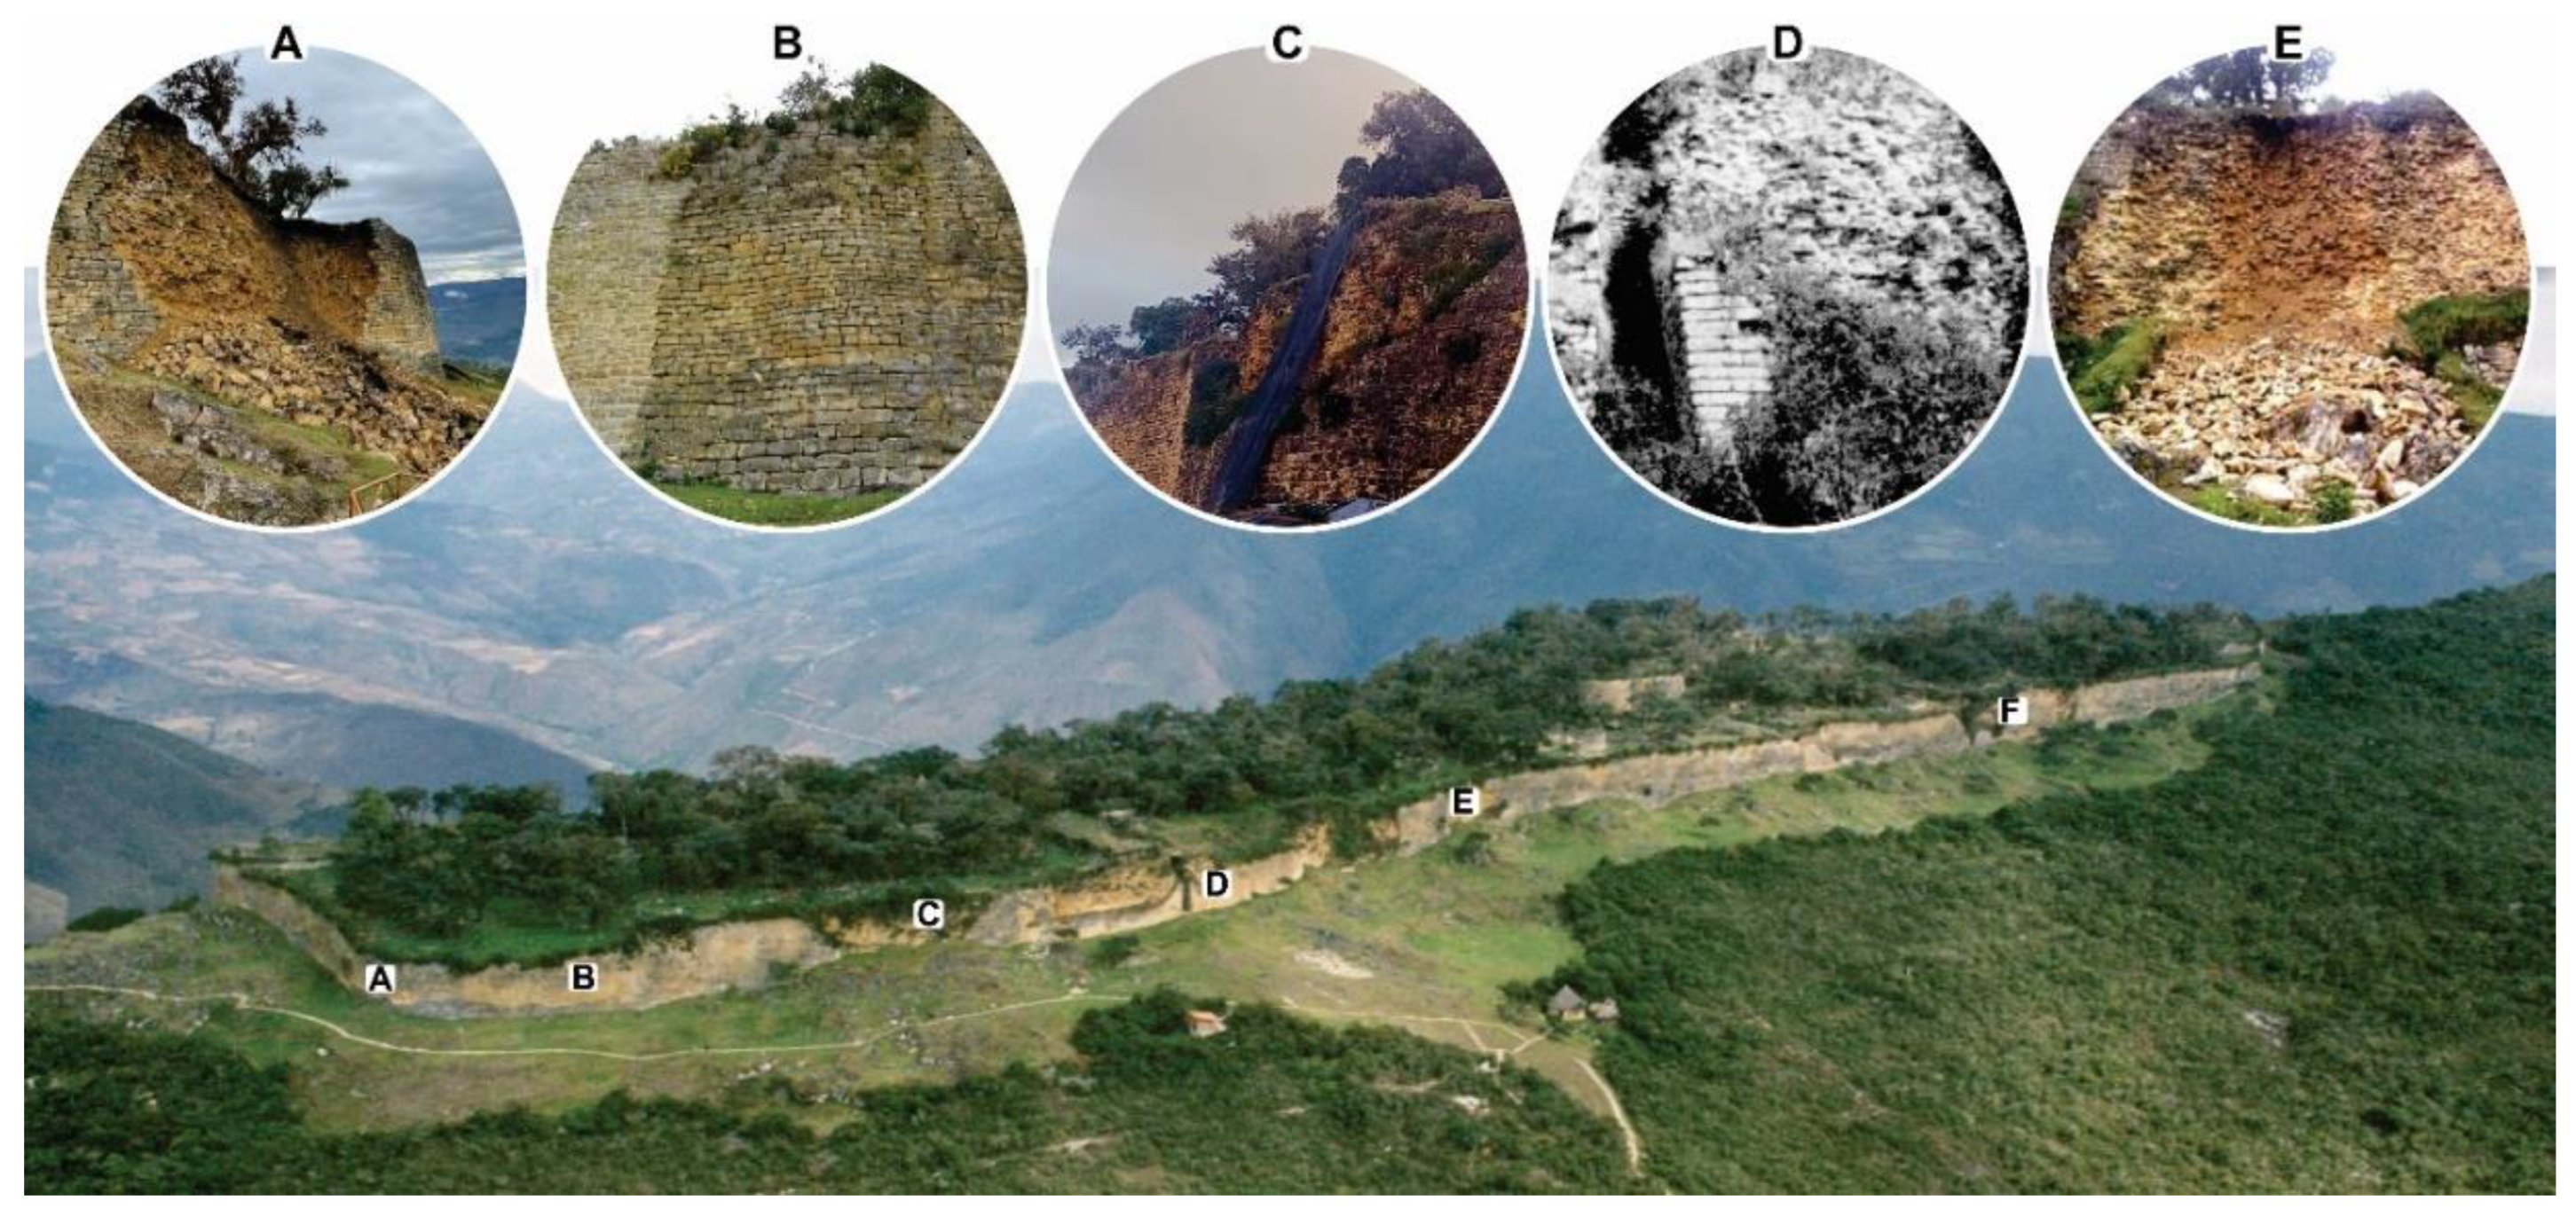
Figure 25.
3D model of the surface of the limestone bedrock underneath La Fortaleza de Kuelap.
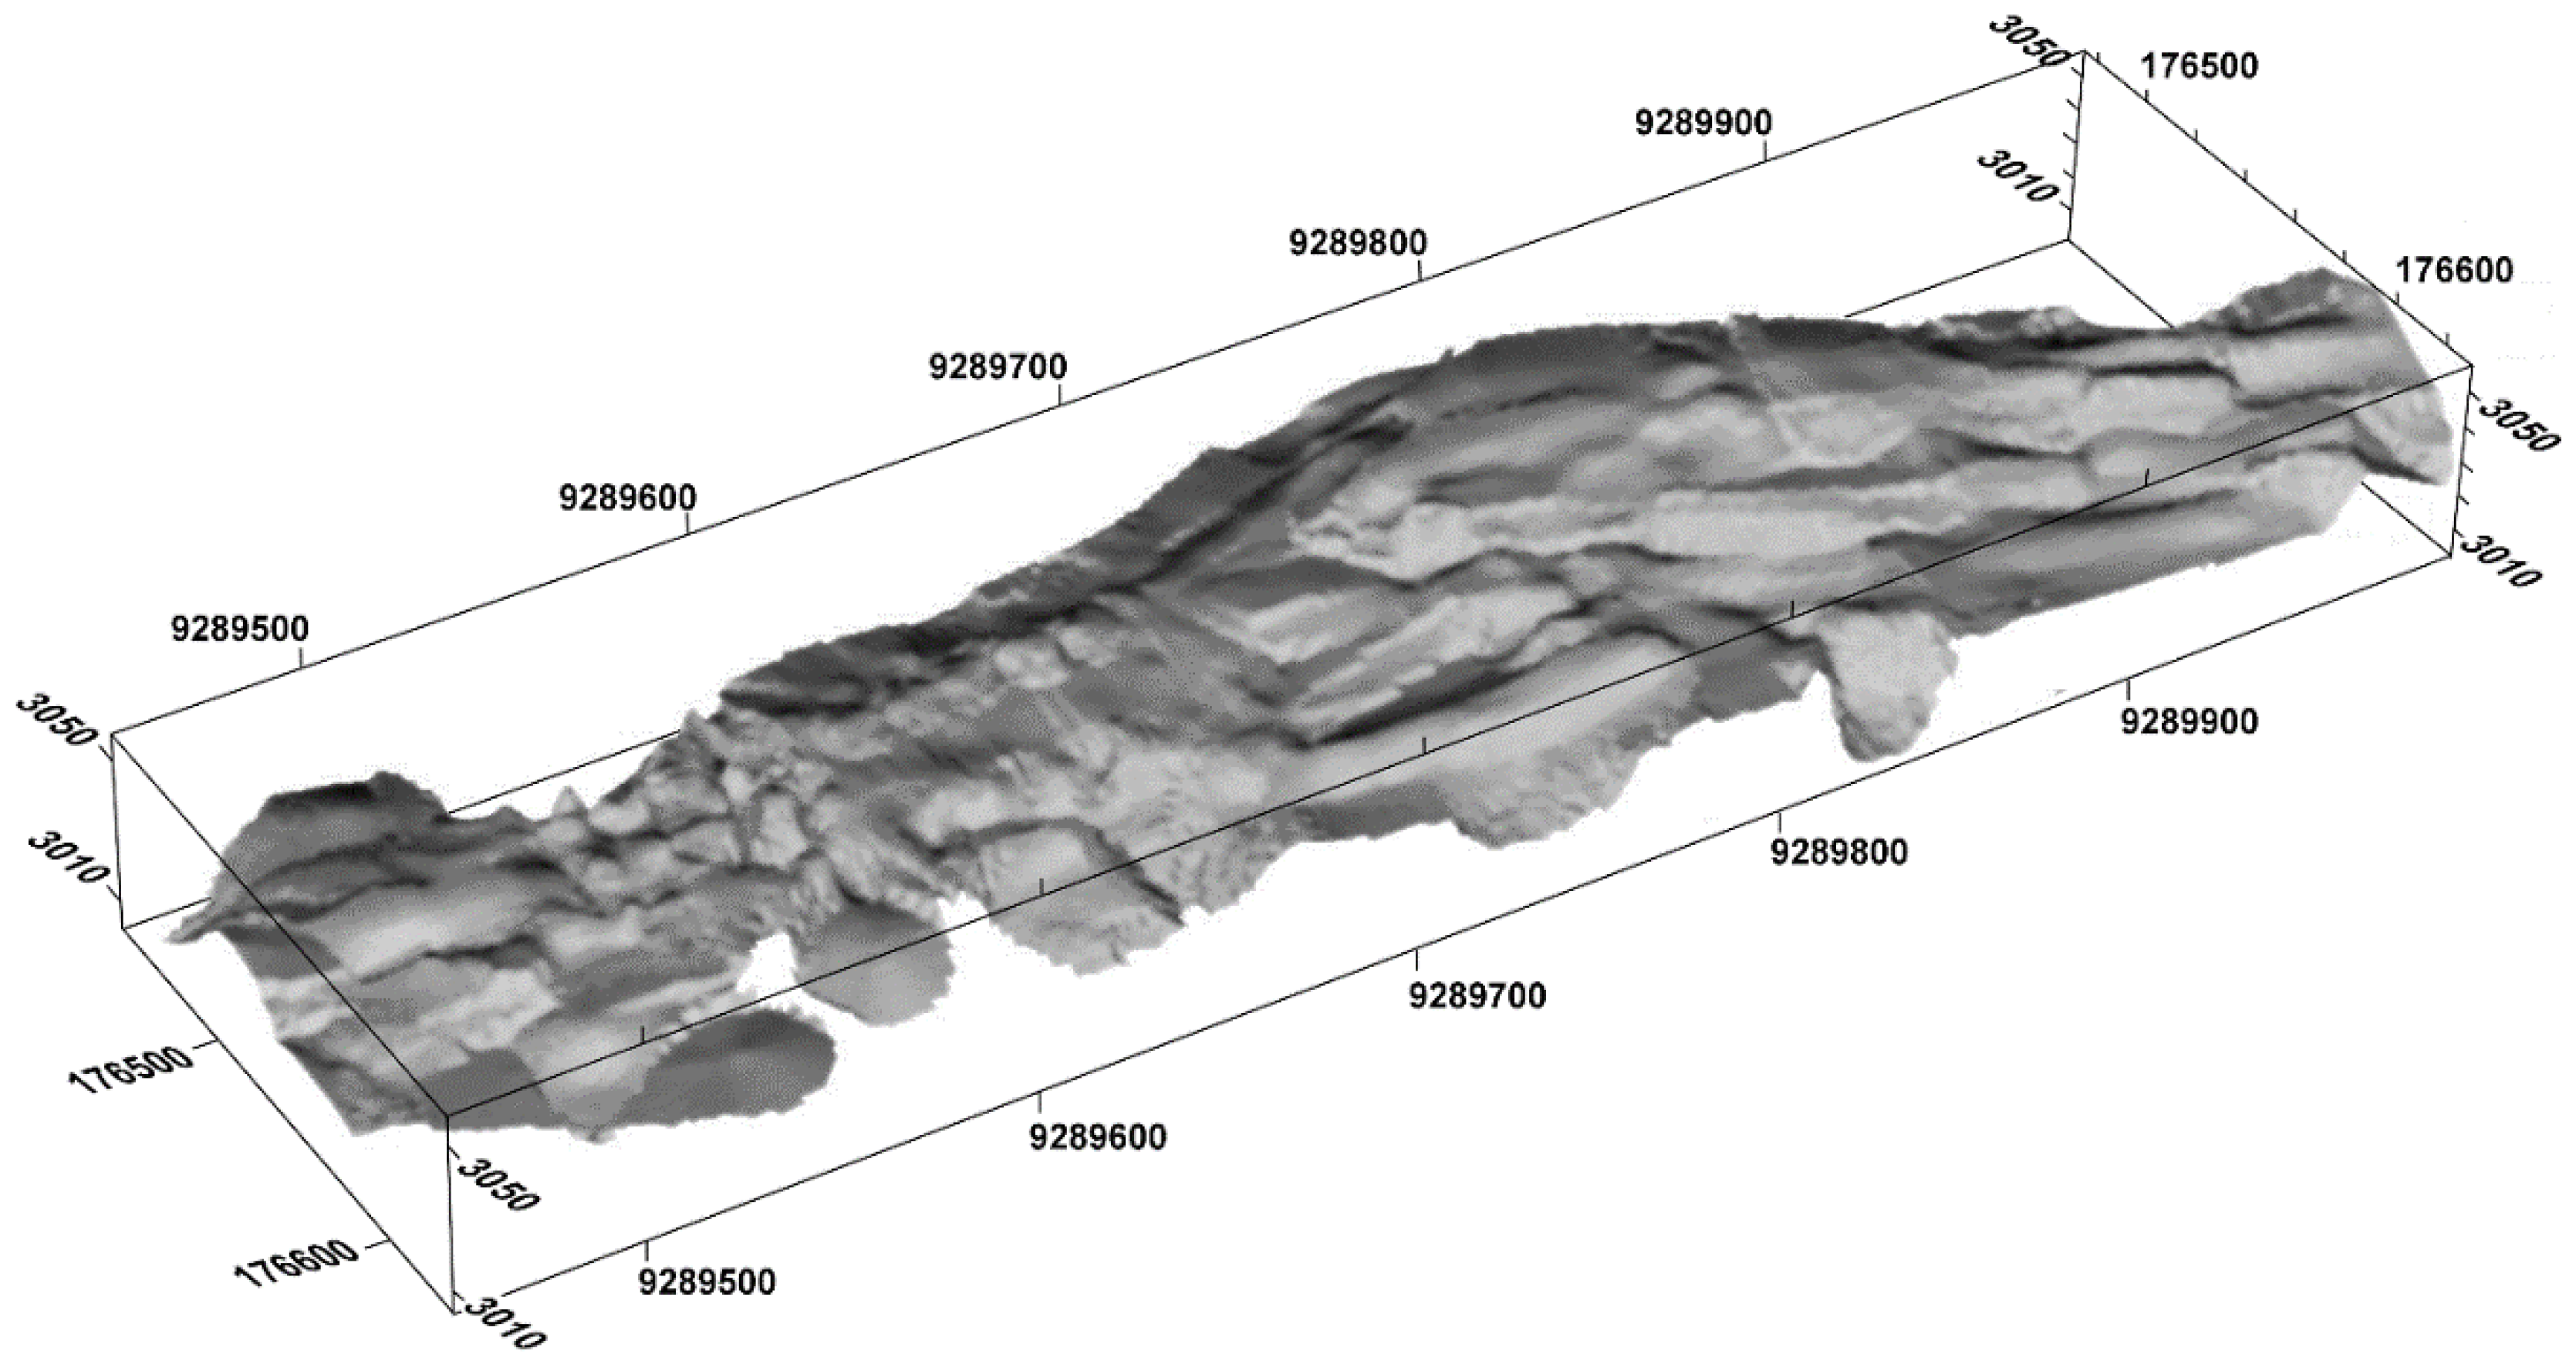
Figure 26.
Deforestation at La Fortaleza between 2005 and 2022: (a) High vegetation extent in 2005; (b) High vegetation extent in 2022; (c) Changes in high vegetation extent between 2005 and 2022. Prepared by Kościuk.
Figure 26.
Deforestation at La Fortaleza between 2005 and 2022: (a) High vegetation extent in 2005; (b) High vegetation extent in 2022; (c) Changes in high vegetation extent between 2005 and 2022. Prepared by Kościuk.
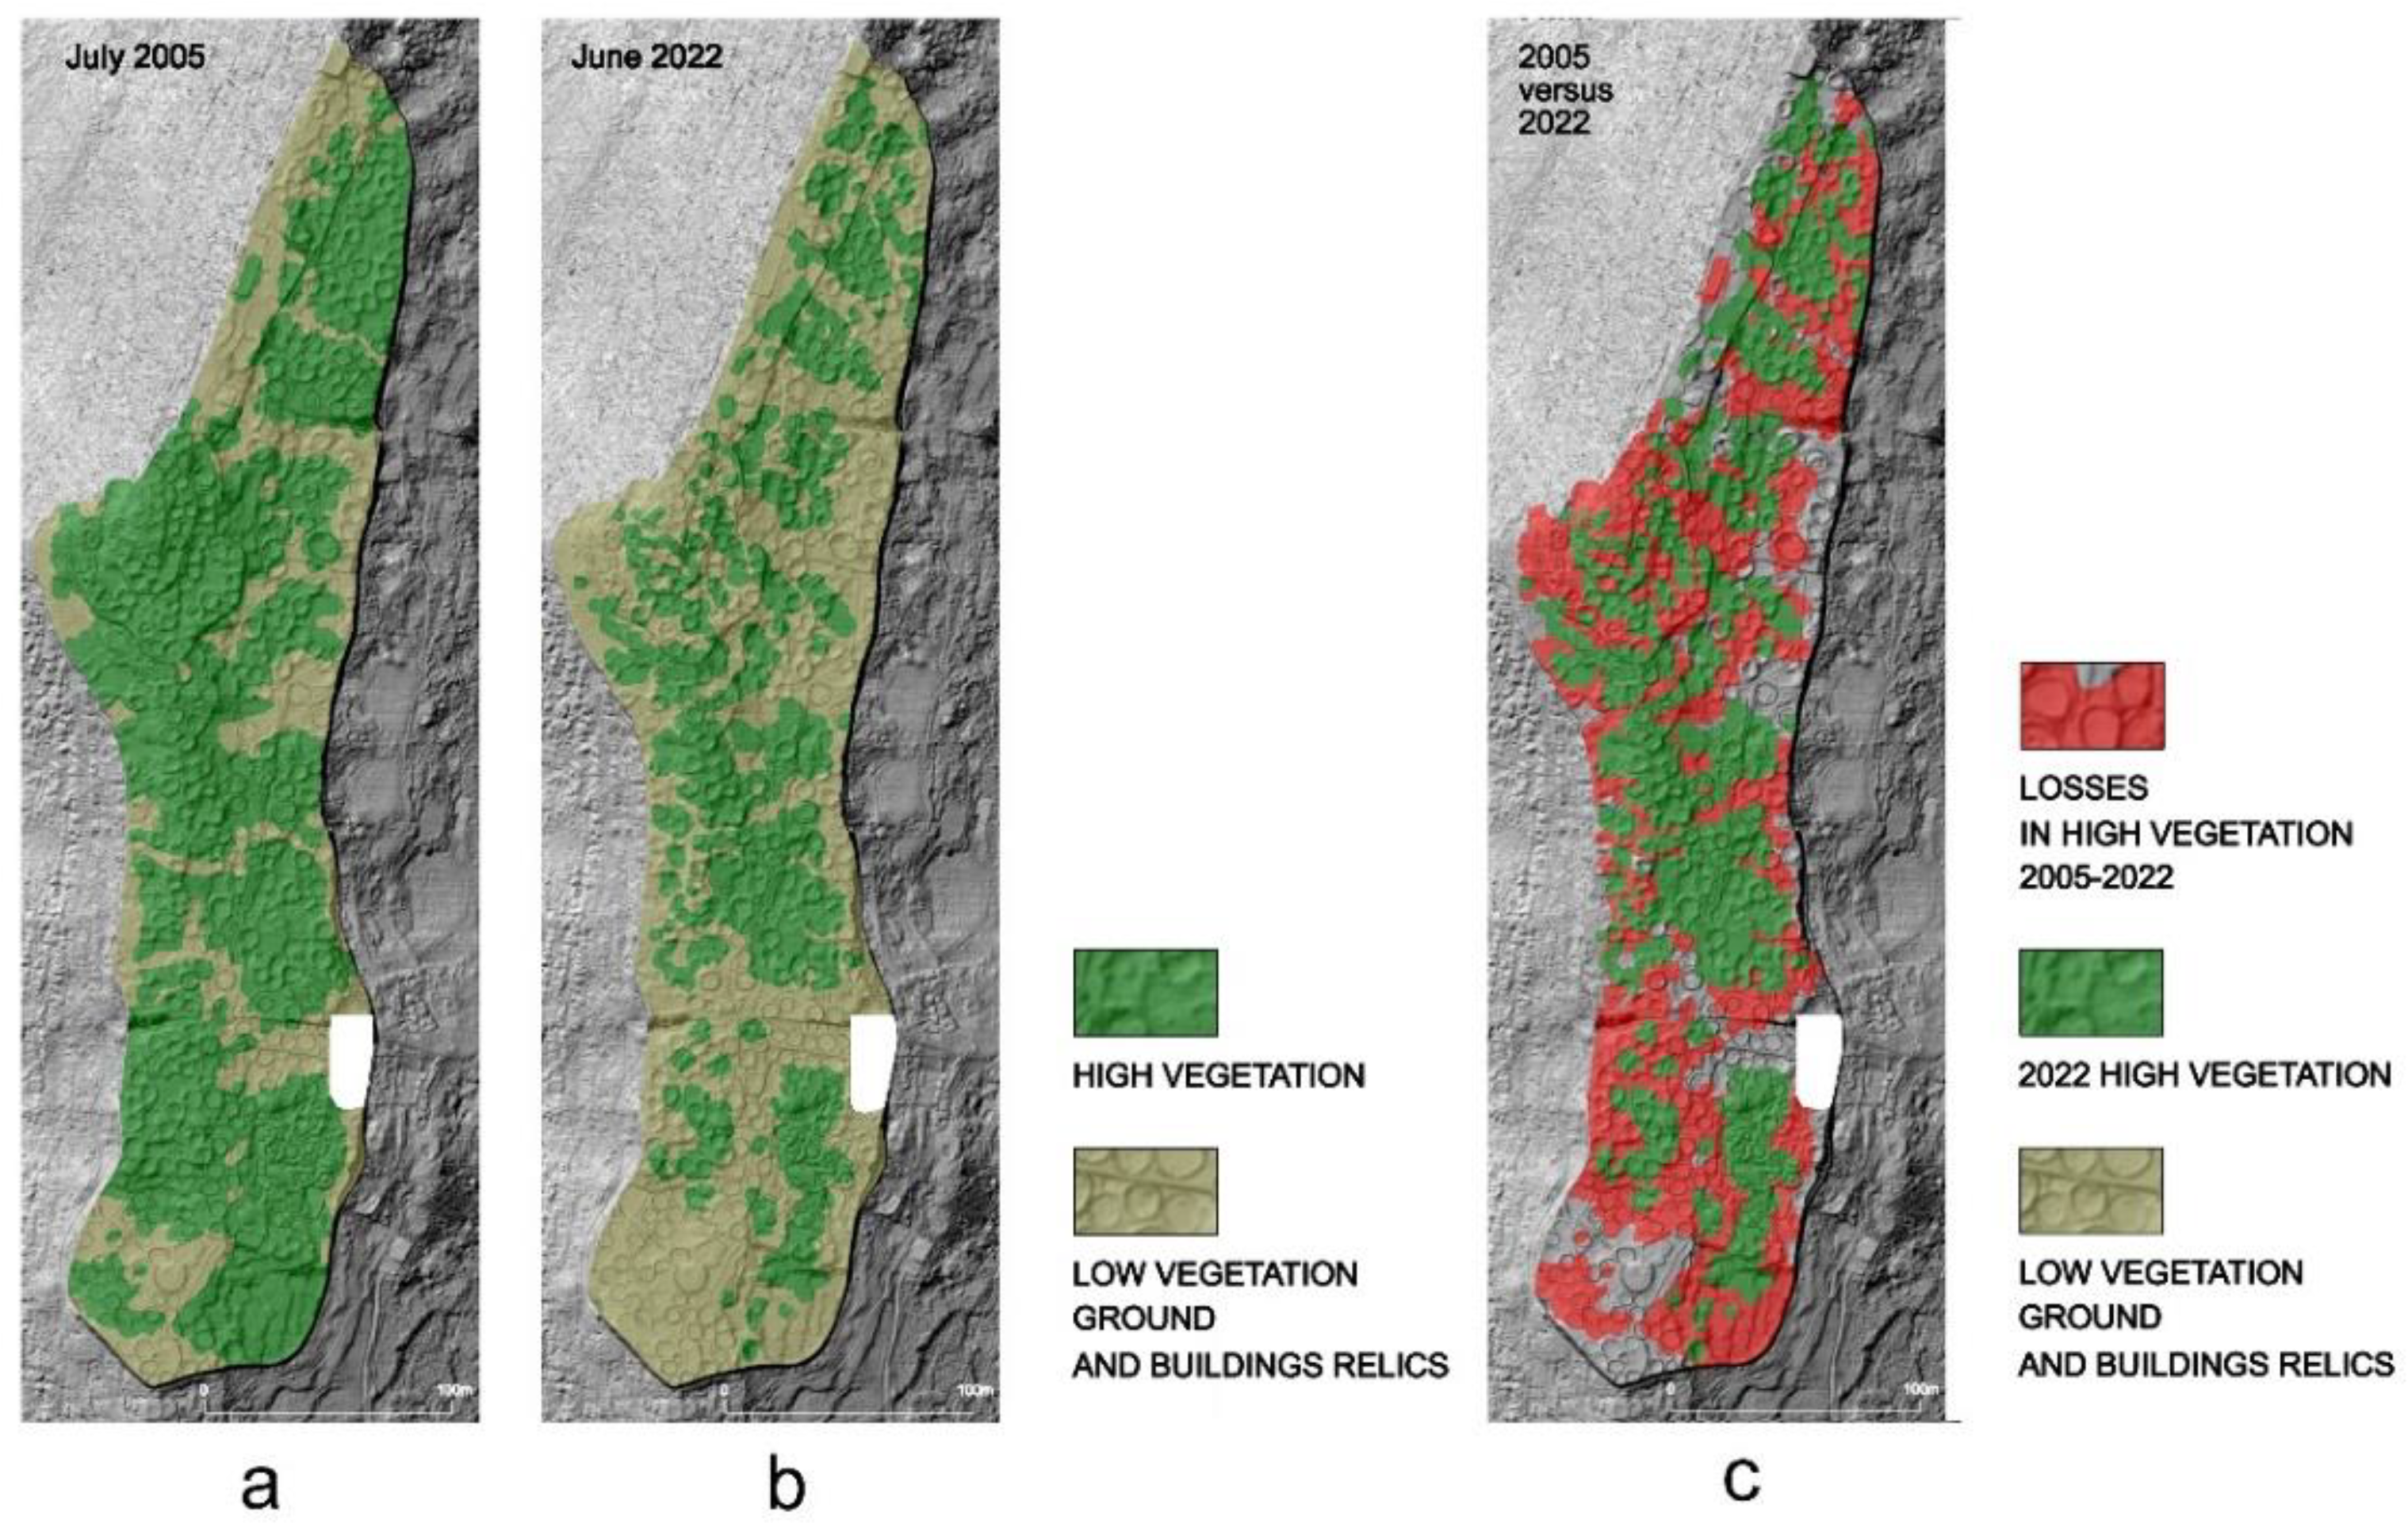
Figure 27.
Hydrological analysis based on DTM: (a) local depressions; (b) primary and subsidiary catchments; (c) rainwater flow accumulation lines (the intensity of the colors represents the catchment size from which rainwater is drained); (d) depressions, catchments, and flow lines superimposed on a hillshaded 3D model; (e) the same as (d) but with the hypsometric model in the background. Prepared by Dąbek and Kościuk.
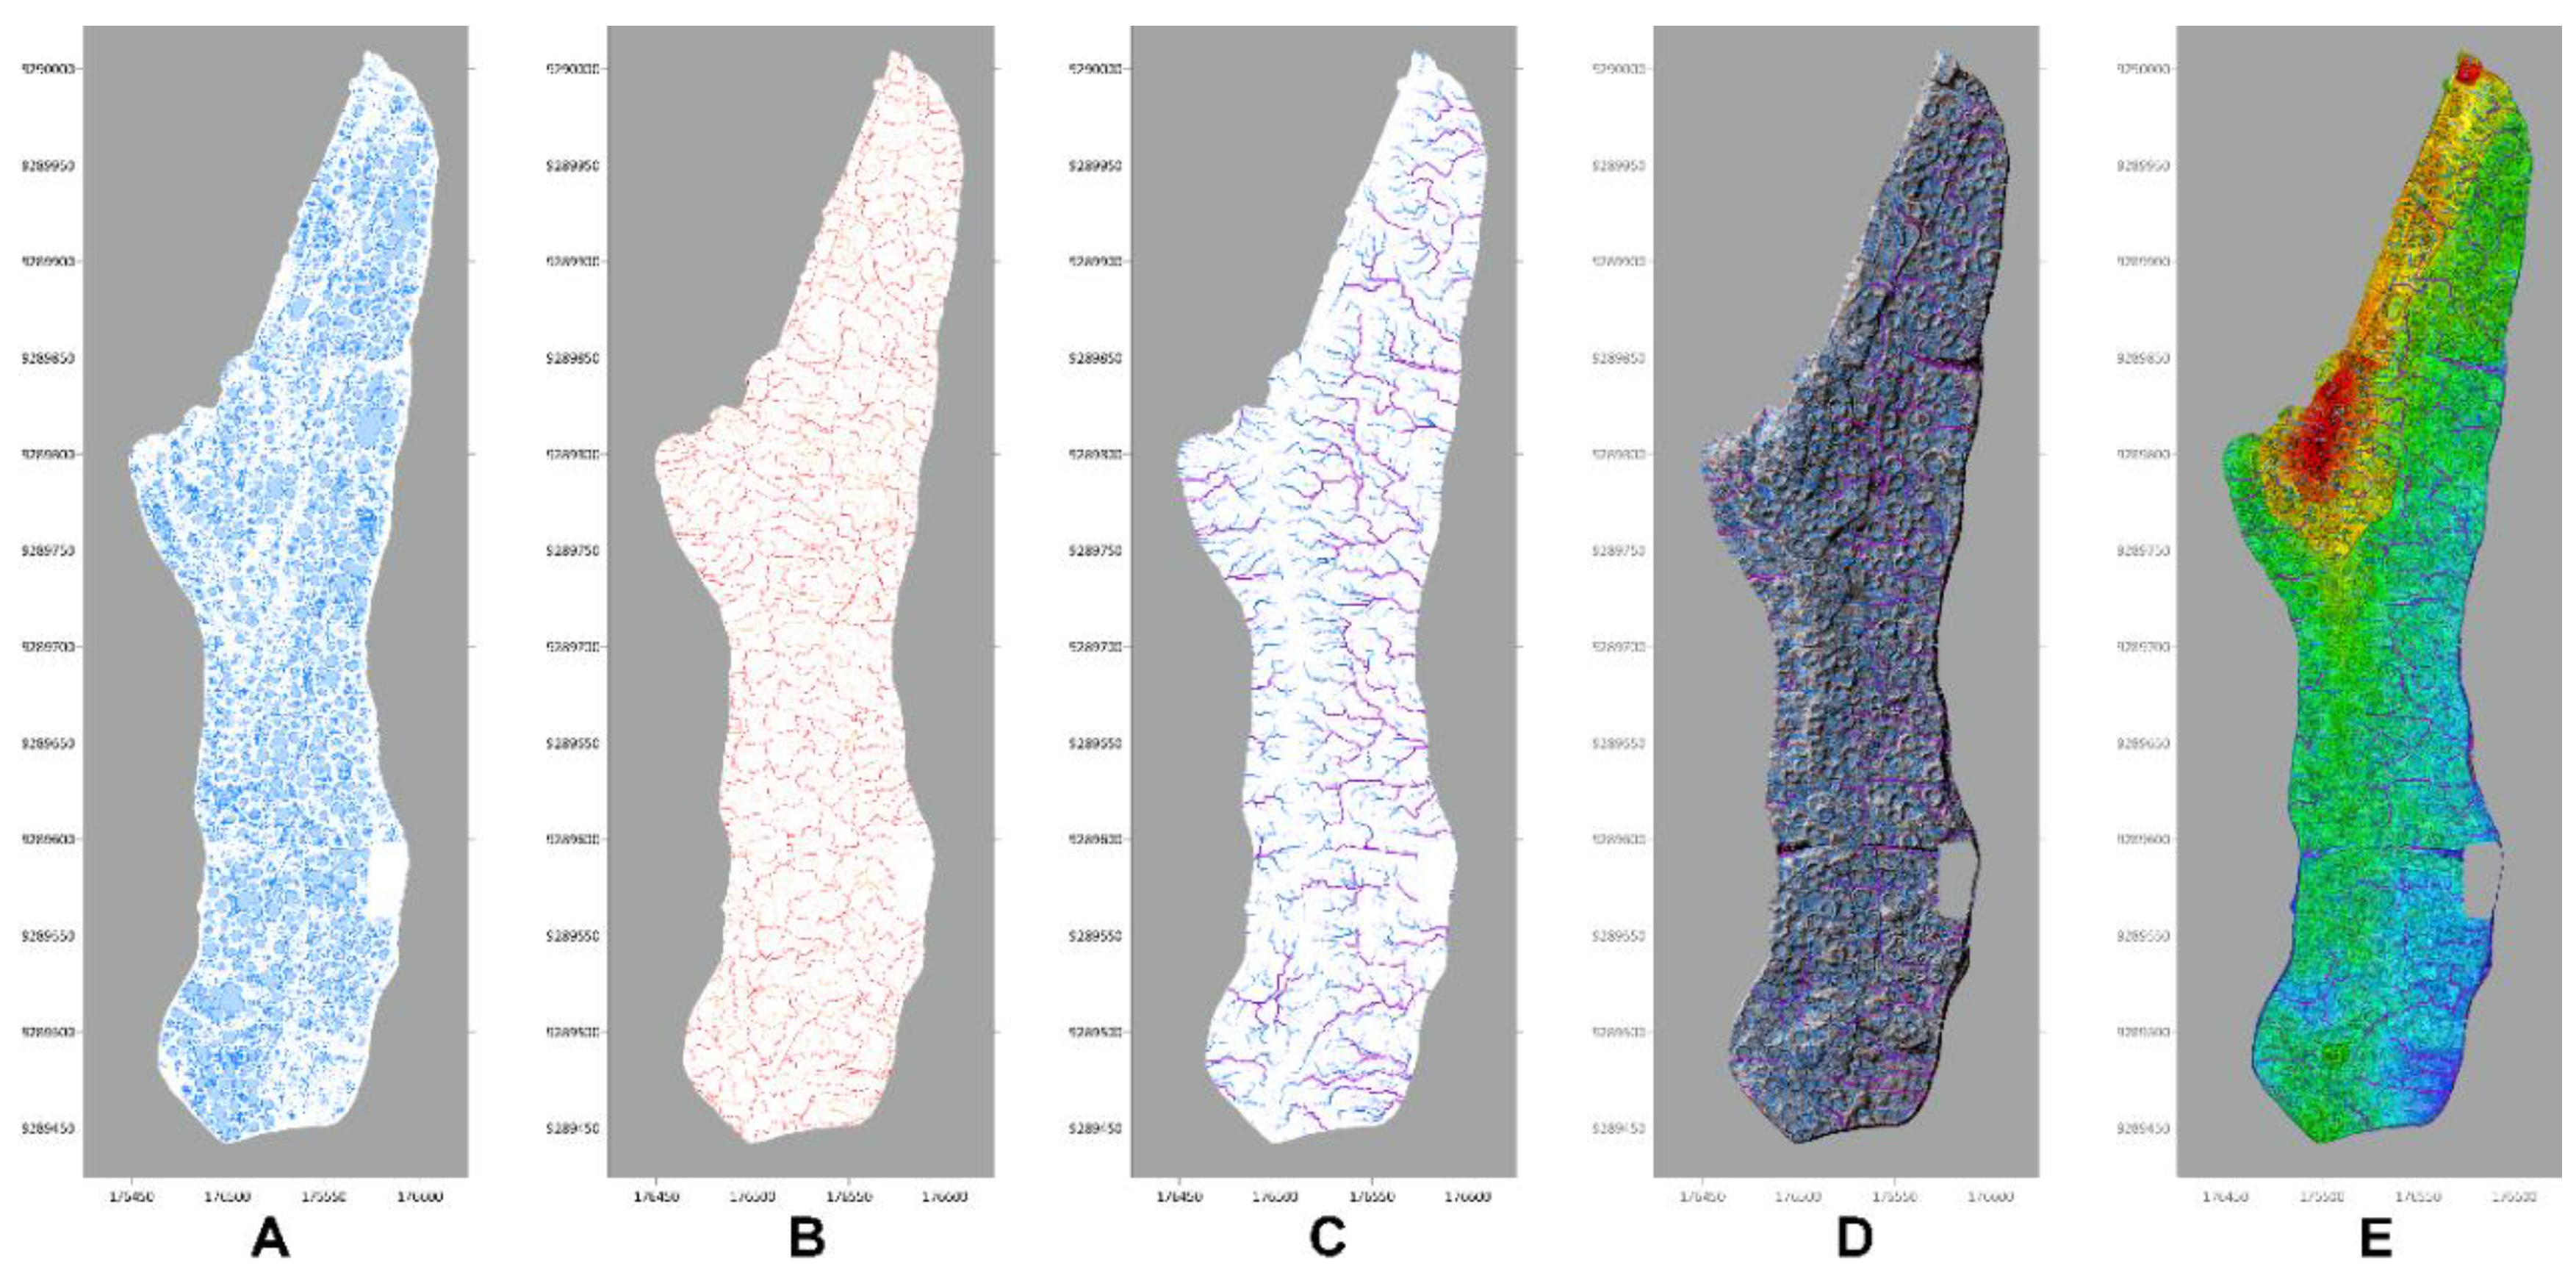
Figure 28.
Risk maps caused by precipitation, with terrain relief in the background: (a) Depressions; (b) Rainwater flow accumulation lines; (c) Terrain with an average slope of less than 5%; (d) Accumulated risks. Prepared by Kościuk.
Figure 28.
Risk maps caused by precipitation, with terrain relief in the background: (a) Depressions; (b) Rainwater flow accumulation lines; (c) Terrain with an average slope of less than 5%; (d) Accumulated risks. Prepared by Kościuk.
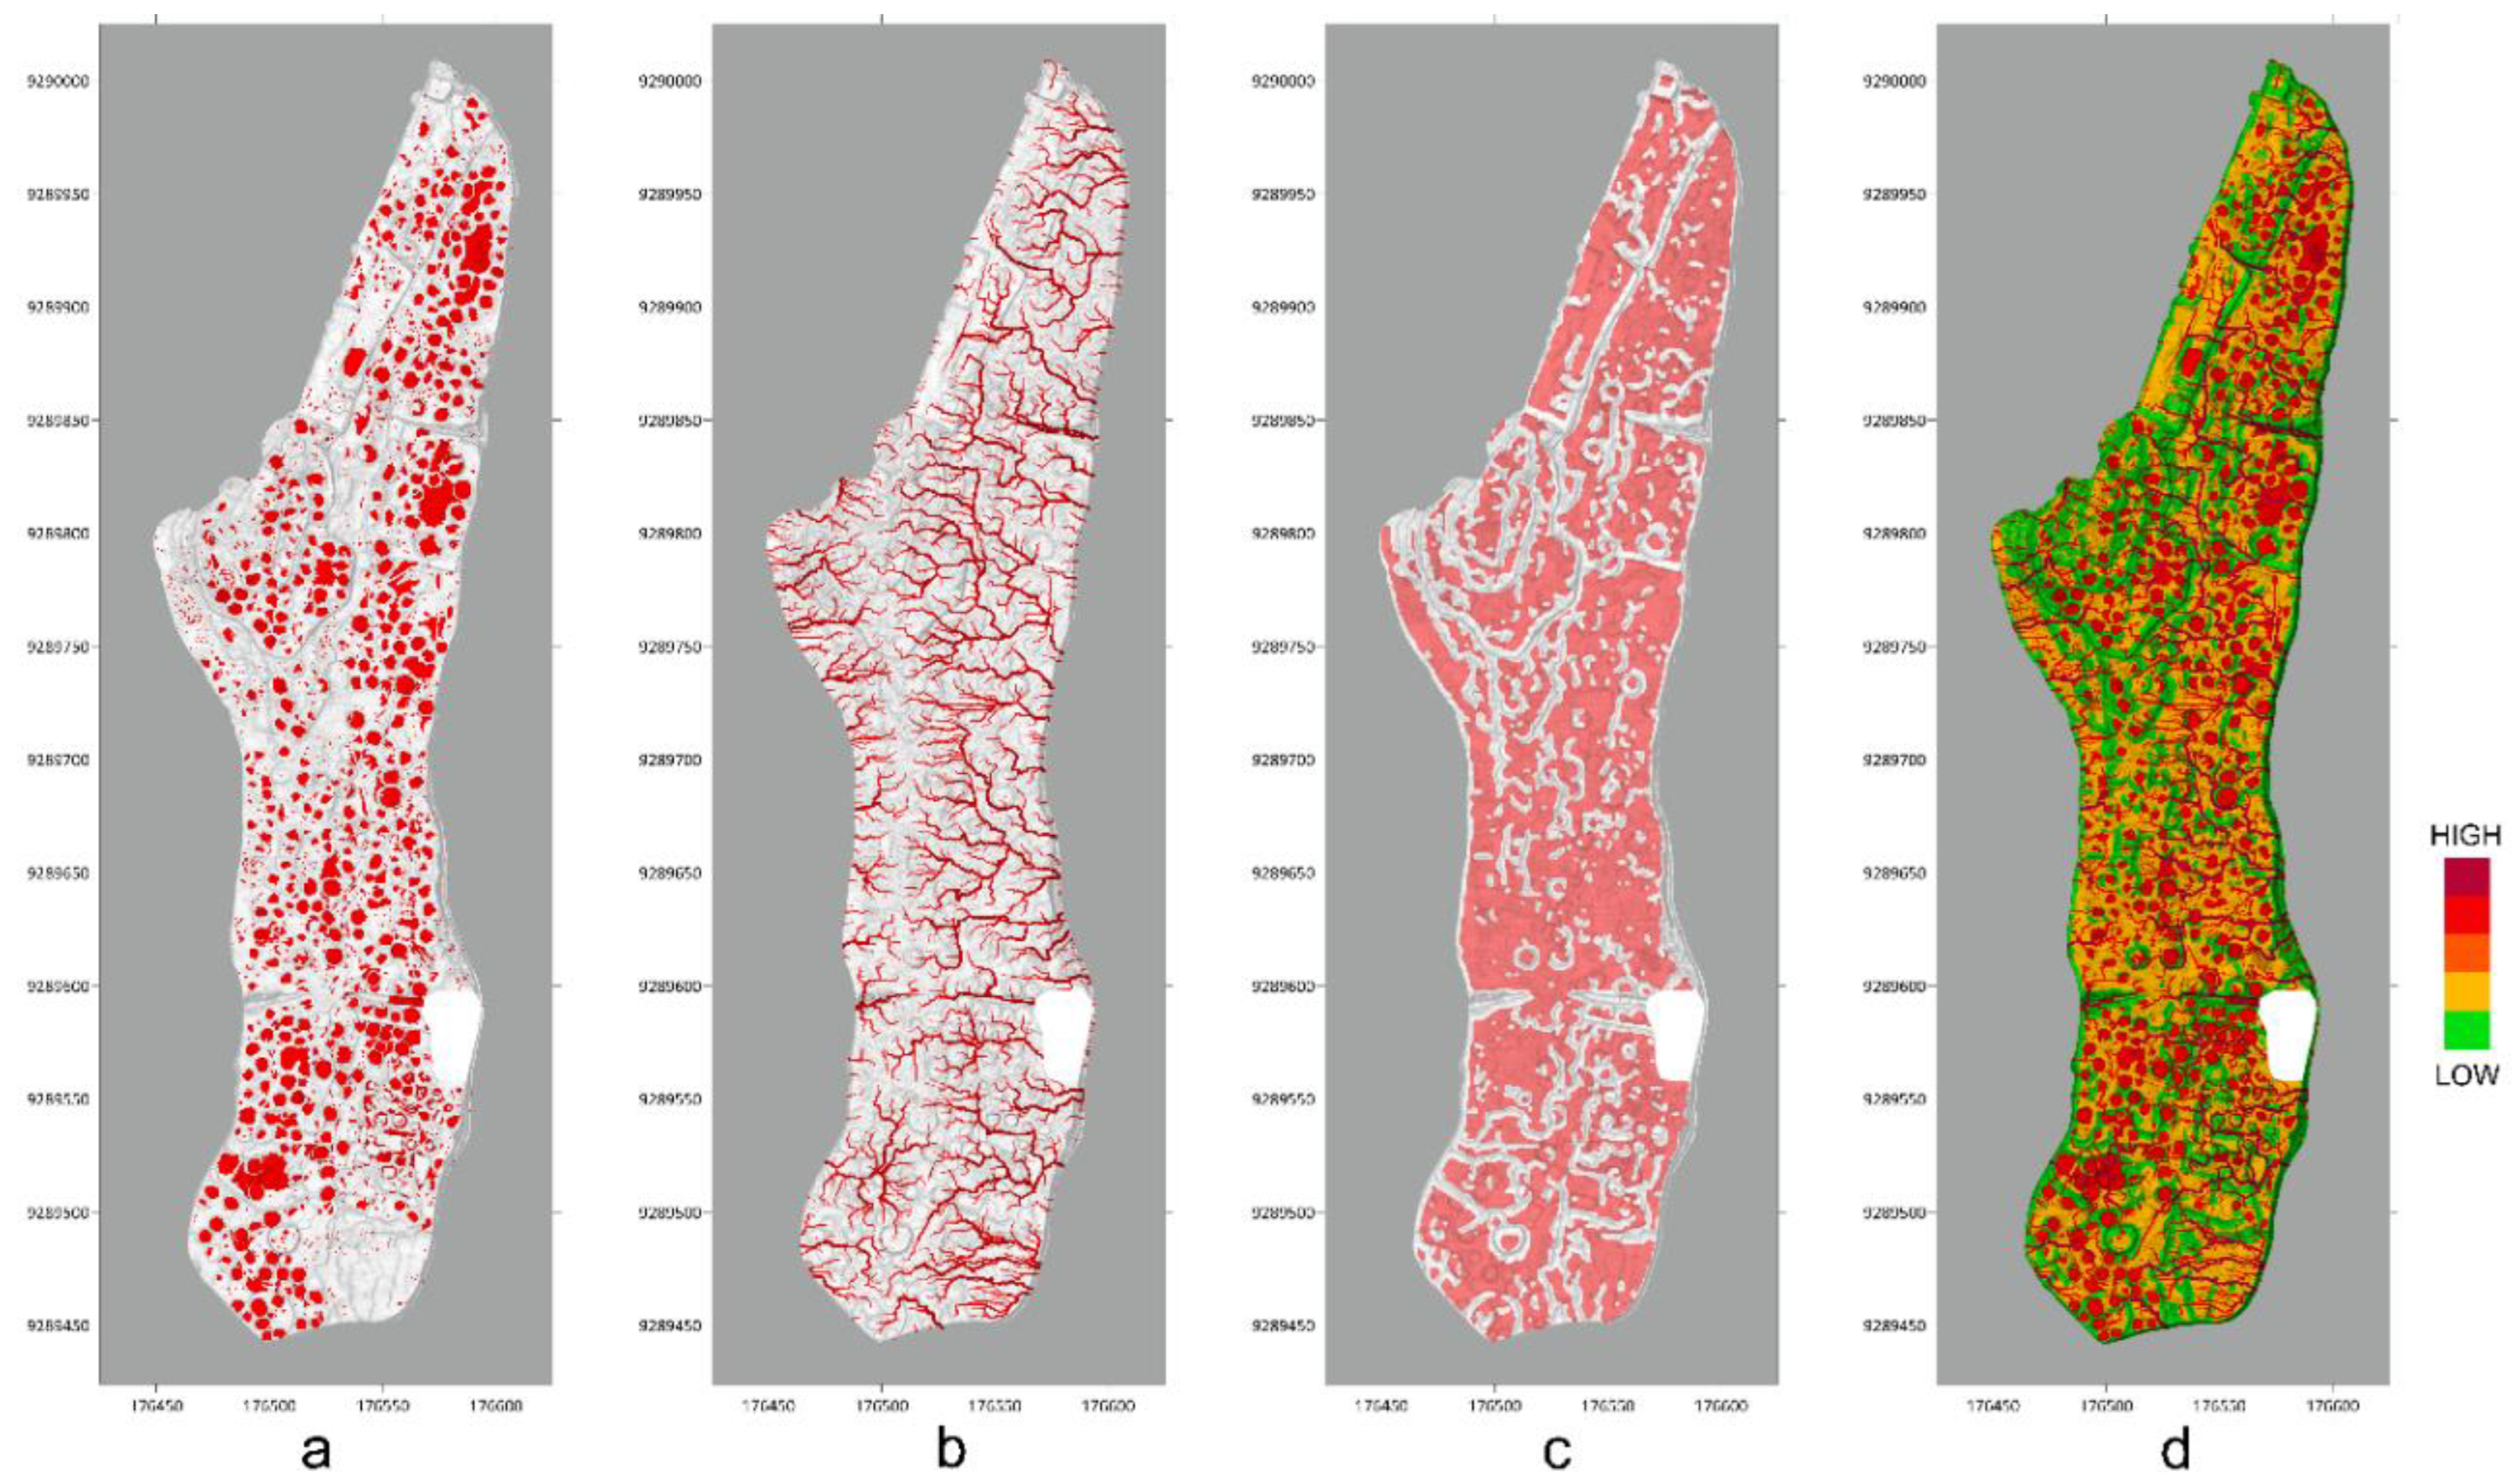
Figure 29.
Ground moisture analysis based on Normalized Difference Water Index (NDWI). Primary data source: Sentinel-2 L2A satellite. Prepared by Kościuk.
Figure 29.
Ground moisture analysis based on Normalized Difference Water Index (NDWI). Primary data source: Sentinel-2 L2A satellite. Prepared by Kościuk.
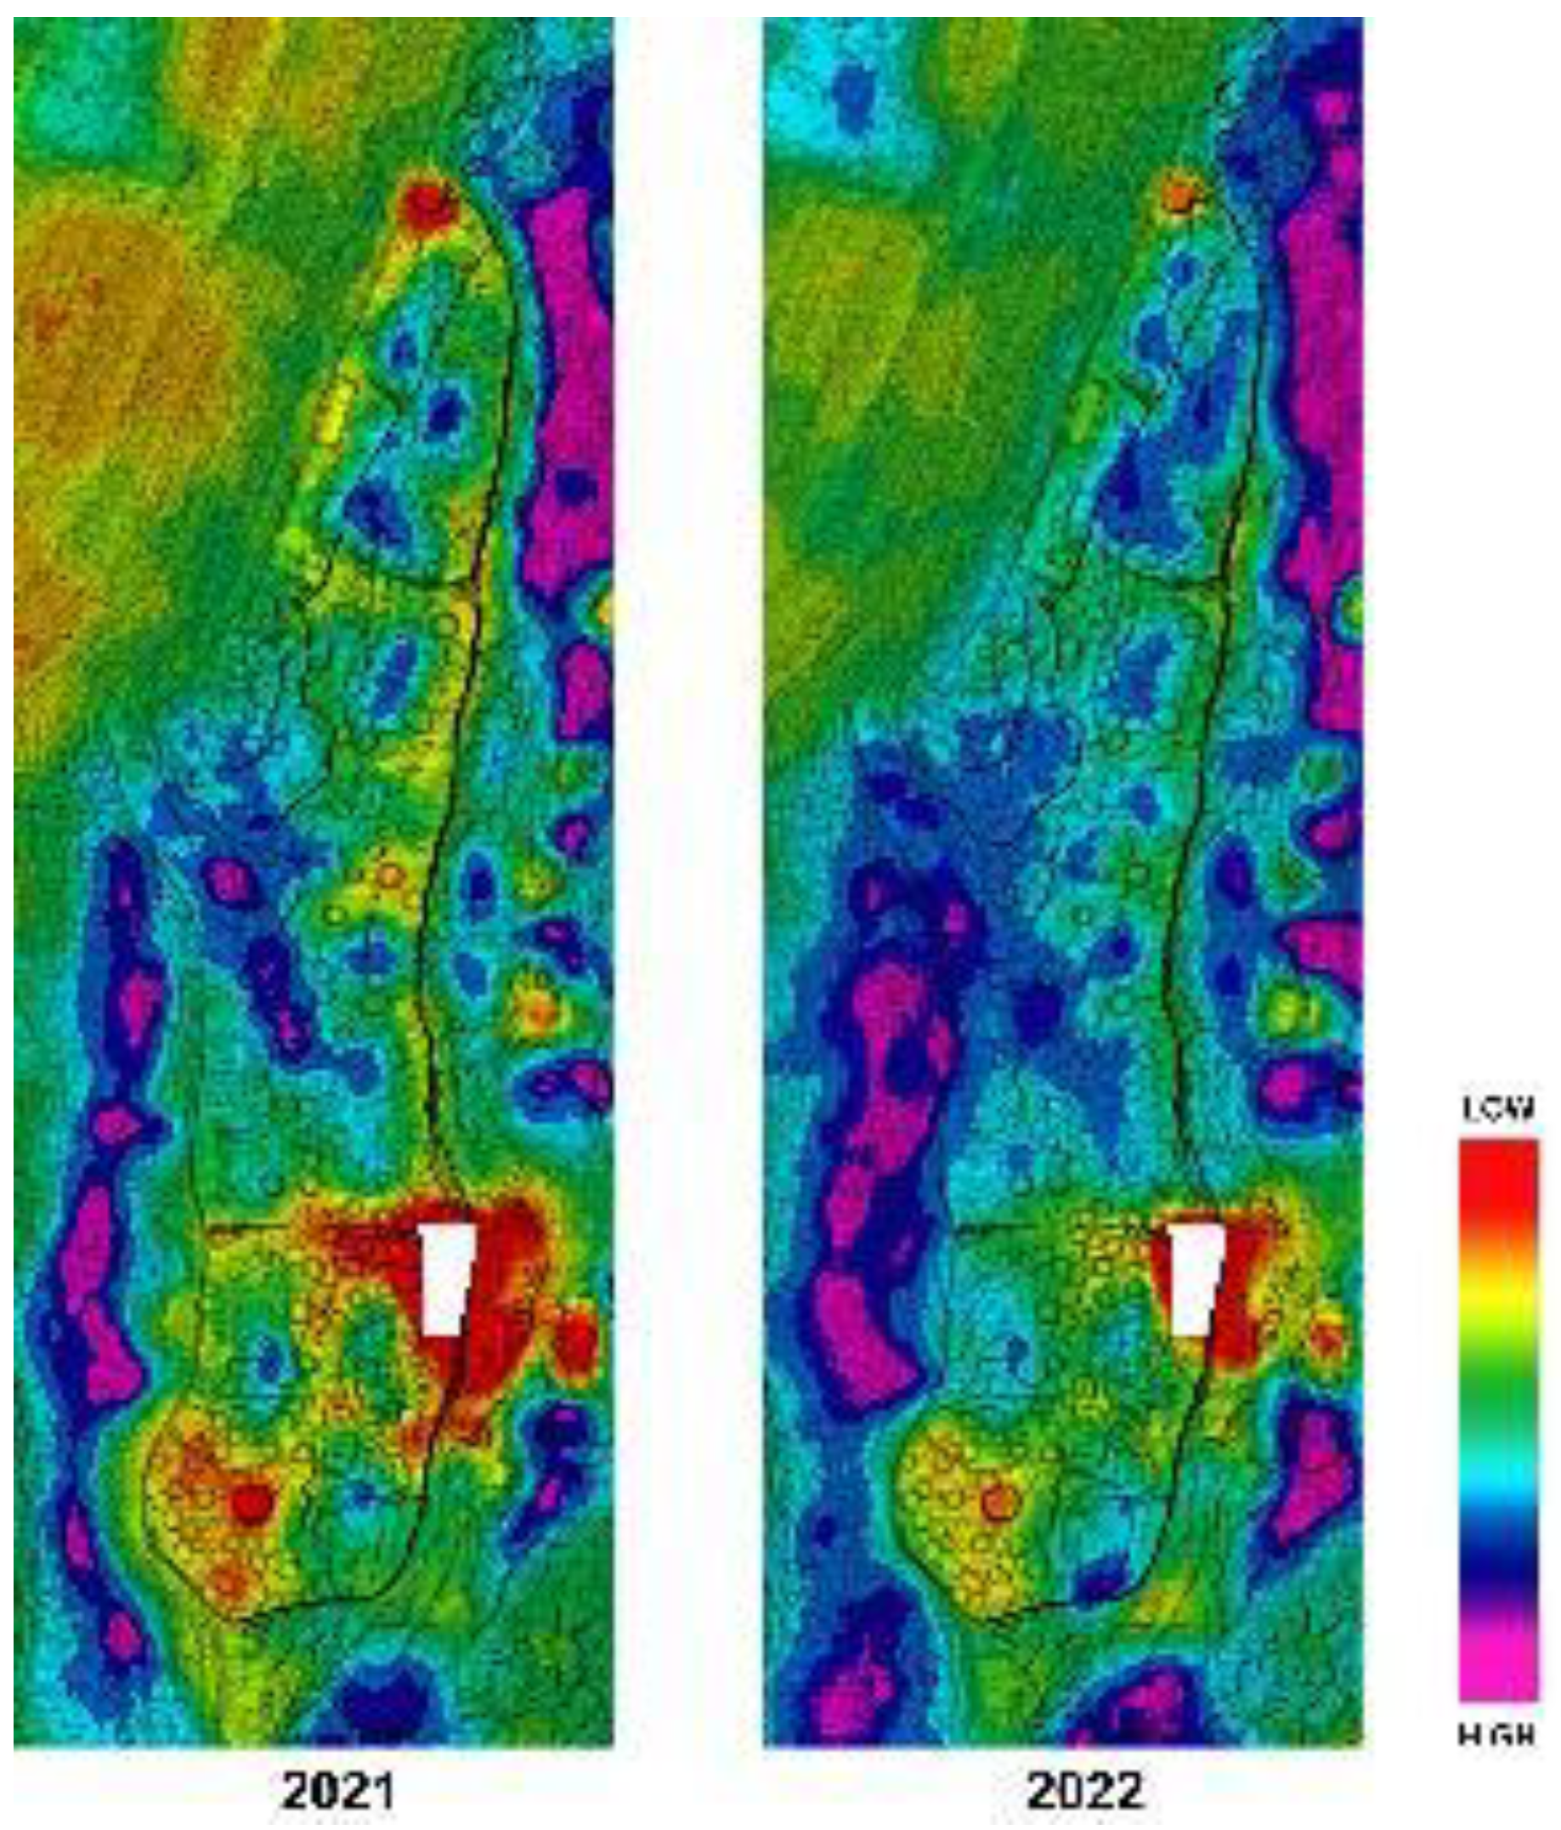
Figure 31.
Integrated TLS, ALS, and IBM model of the collapsed perimeter wall (red outline) and corresponding debris (green outline) on the southeastern corner of La Fortaleza, centered on the collapsed area. The indicated control points are derived from TLS data from 2019 by Kucera, VanValkenburgh and Rojas. Prepared by Kucera. Image data courtesy of R. Vigo and N. Vargas.
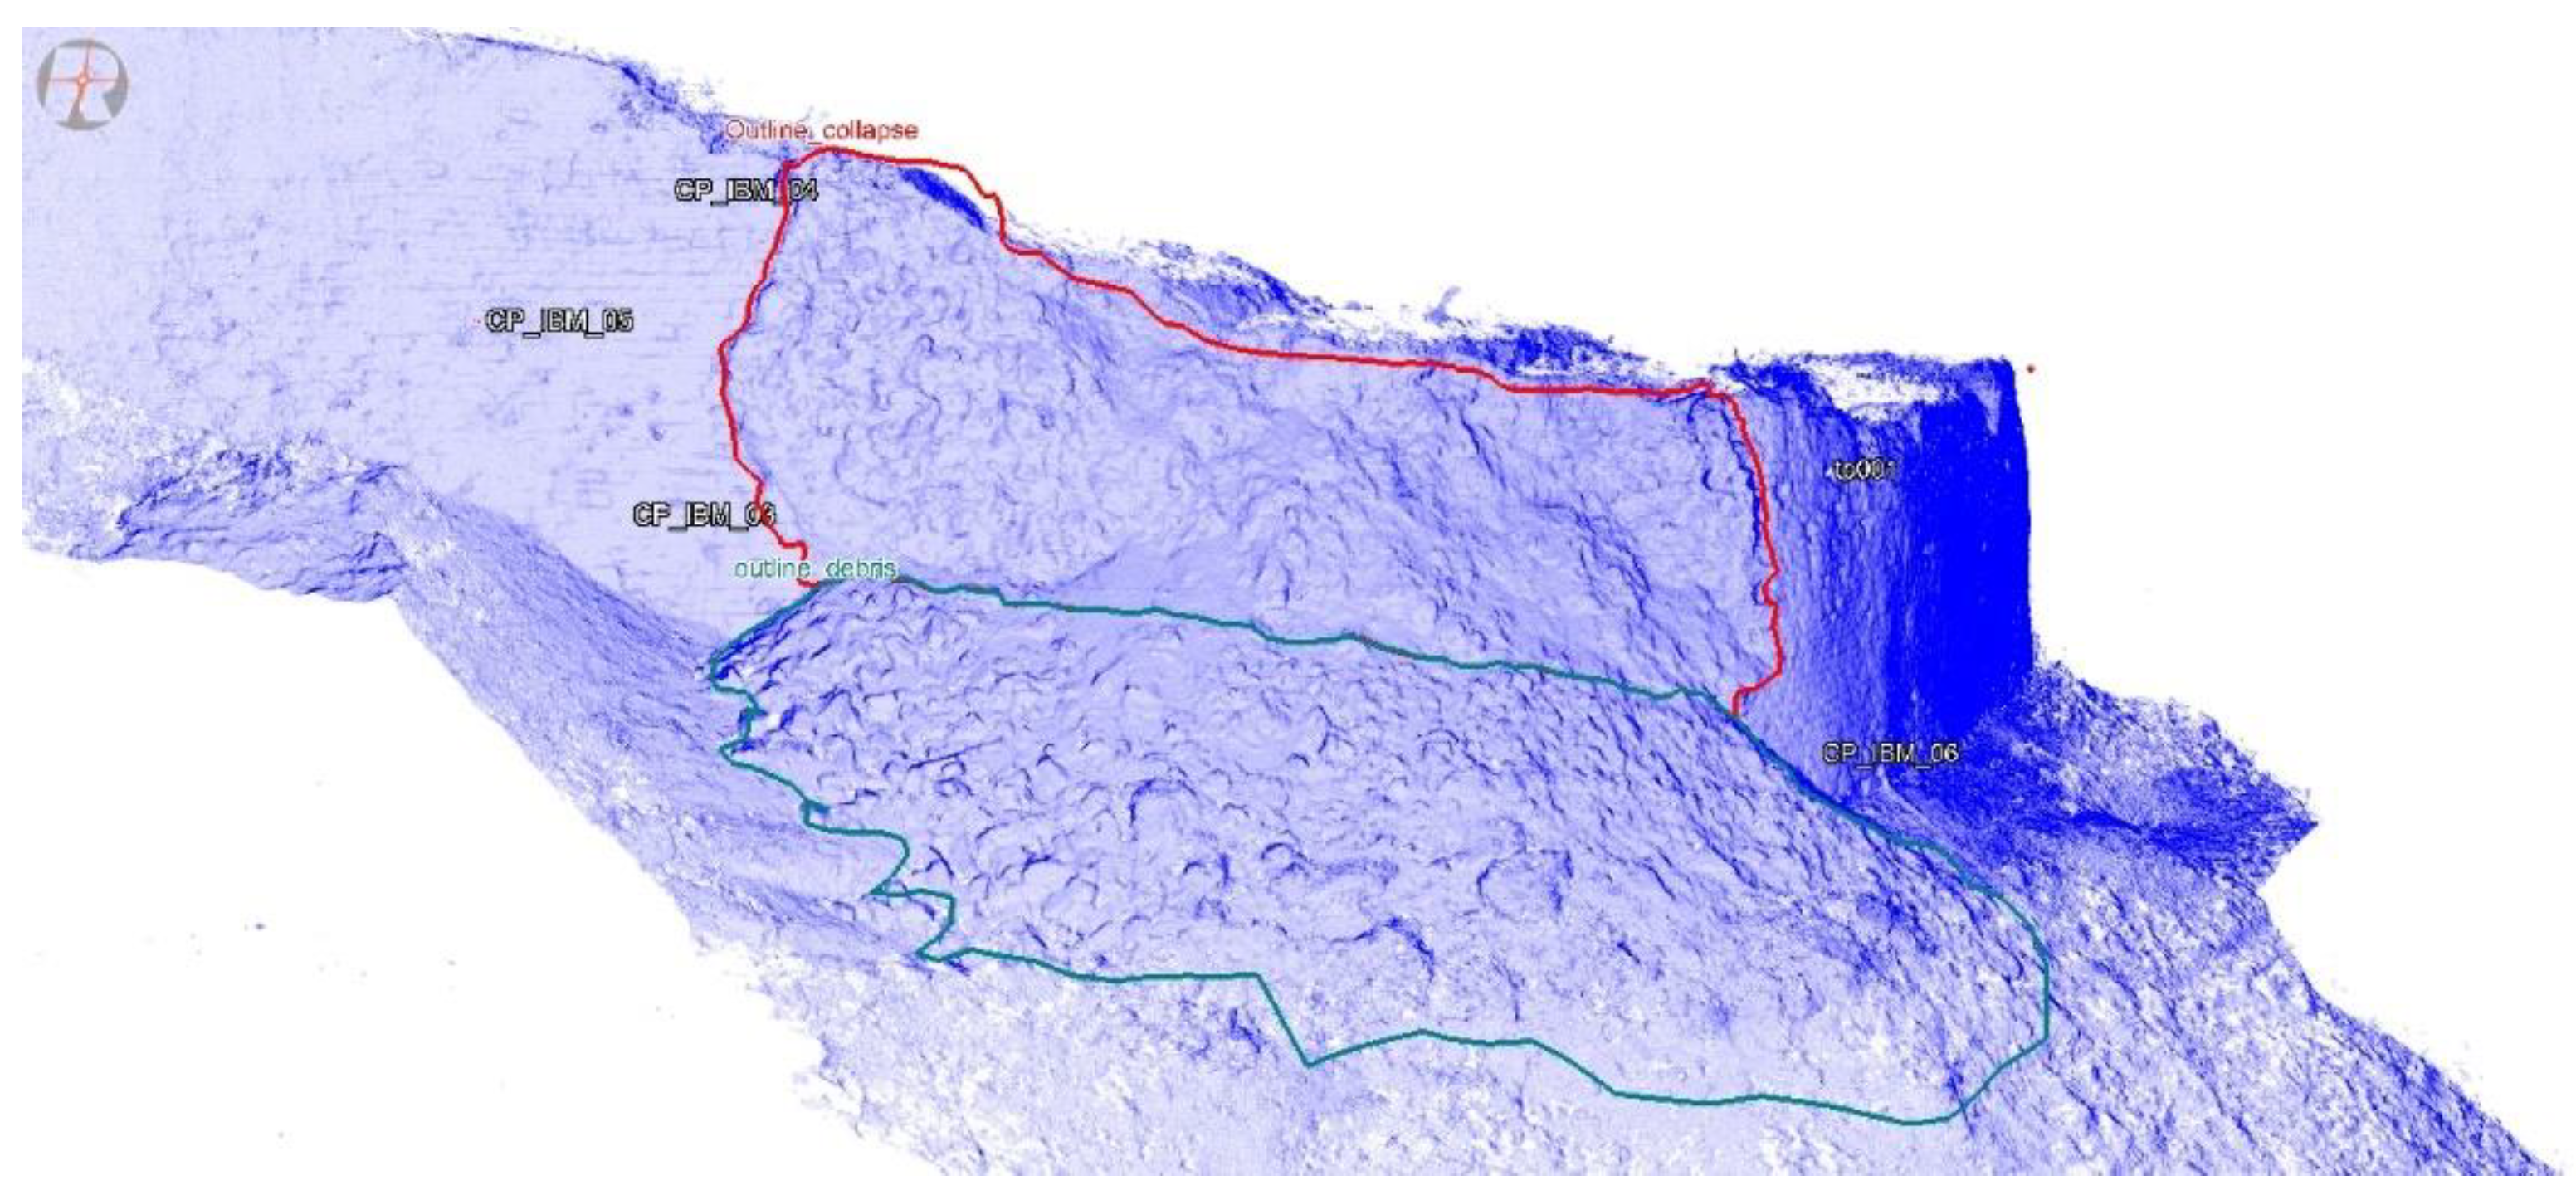
Figure 32.
Evidence of pre-Hispanic collapse and rebuilding on the southeastern perimeter wall of La Fortaleza. A) perimeter wall in its original height and condition (notice the original eaves at the top of the wall); B) partially rebuilt perimeter wall, with stonework different from A; C); difference in wall height between original and rebuilt sections; C-D) zig-zagging vertical margin between the original (A) and rebuilt (B) perimeter wall sections; D-E) horizontal margin between the original (A) and rebuilt (B) perimeter wall sections, or leveling layer; F) rebuilt perimeter wall, with conservation mortar added by repointing. Photograph by Church (2007).
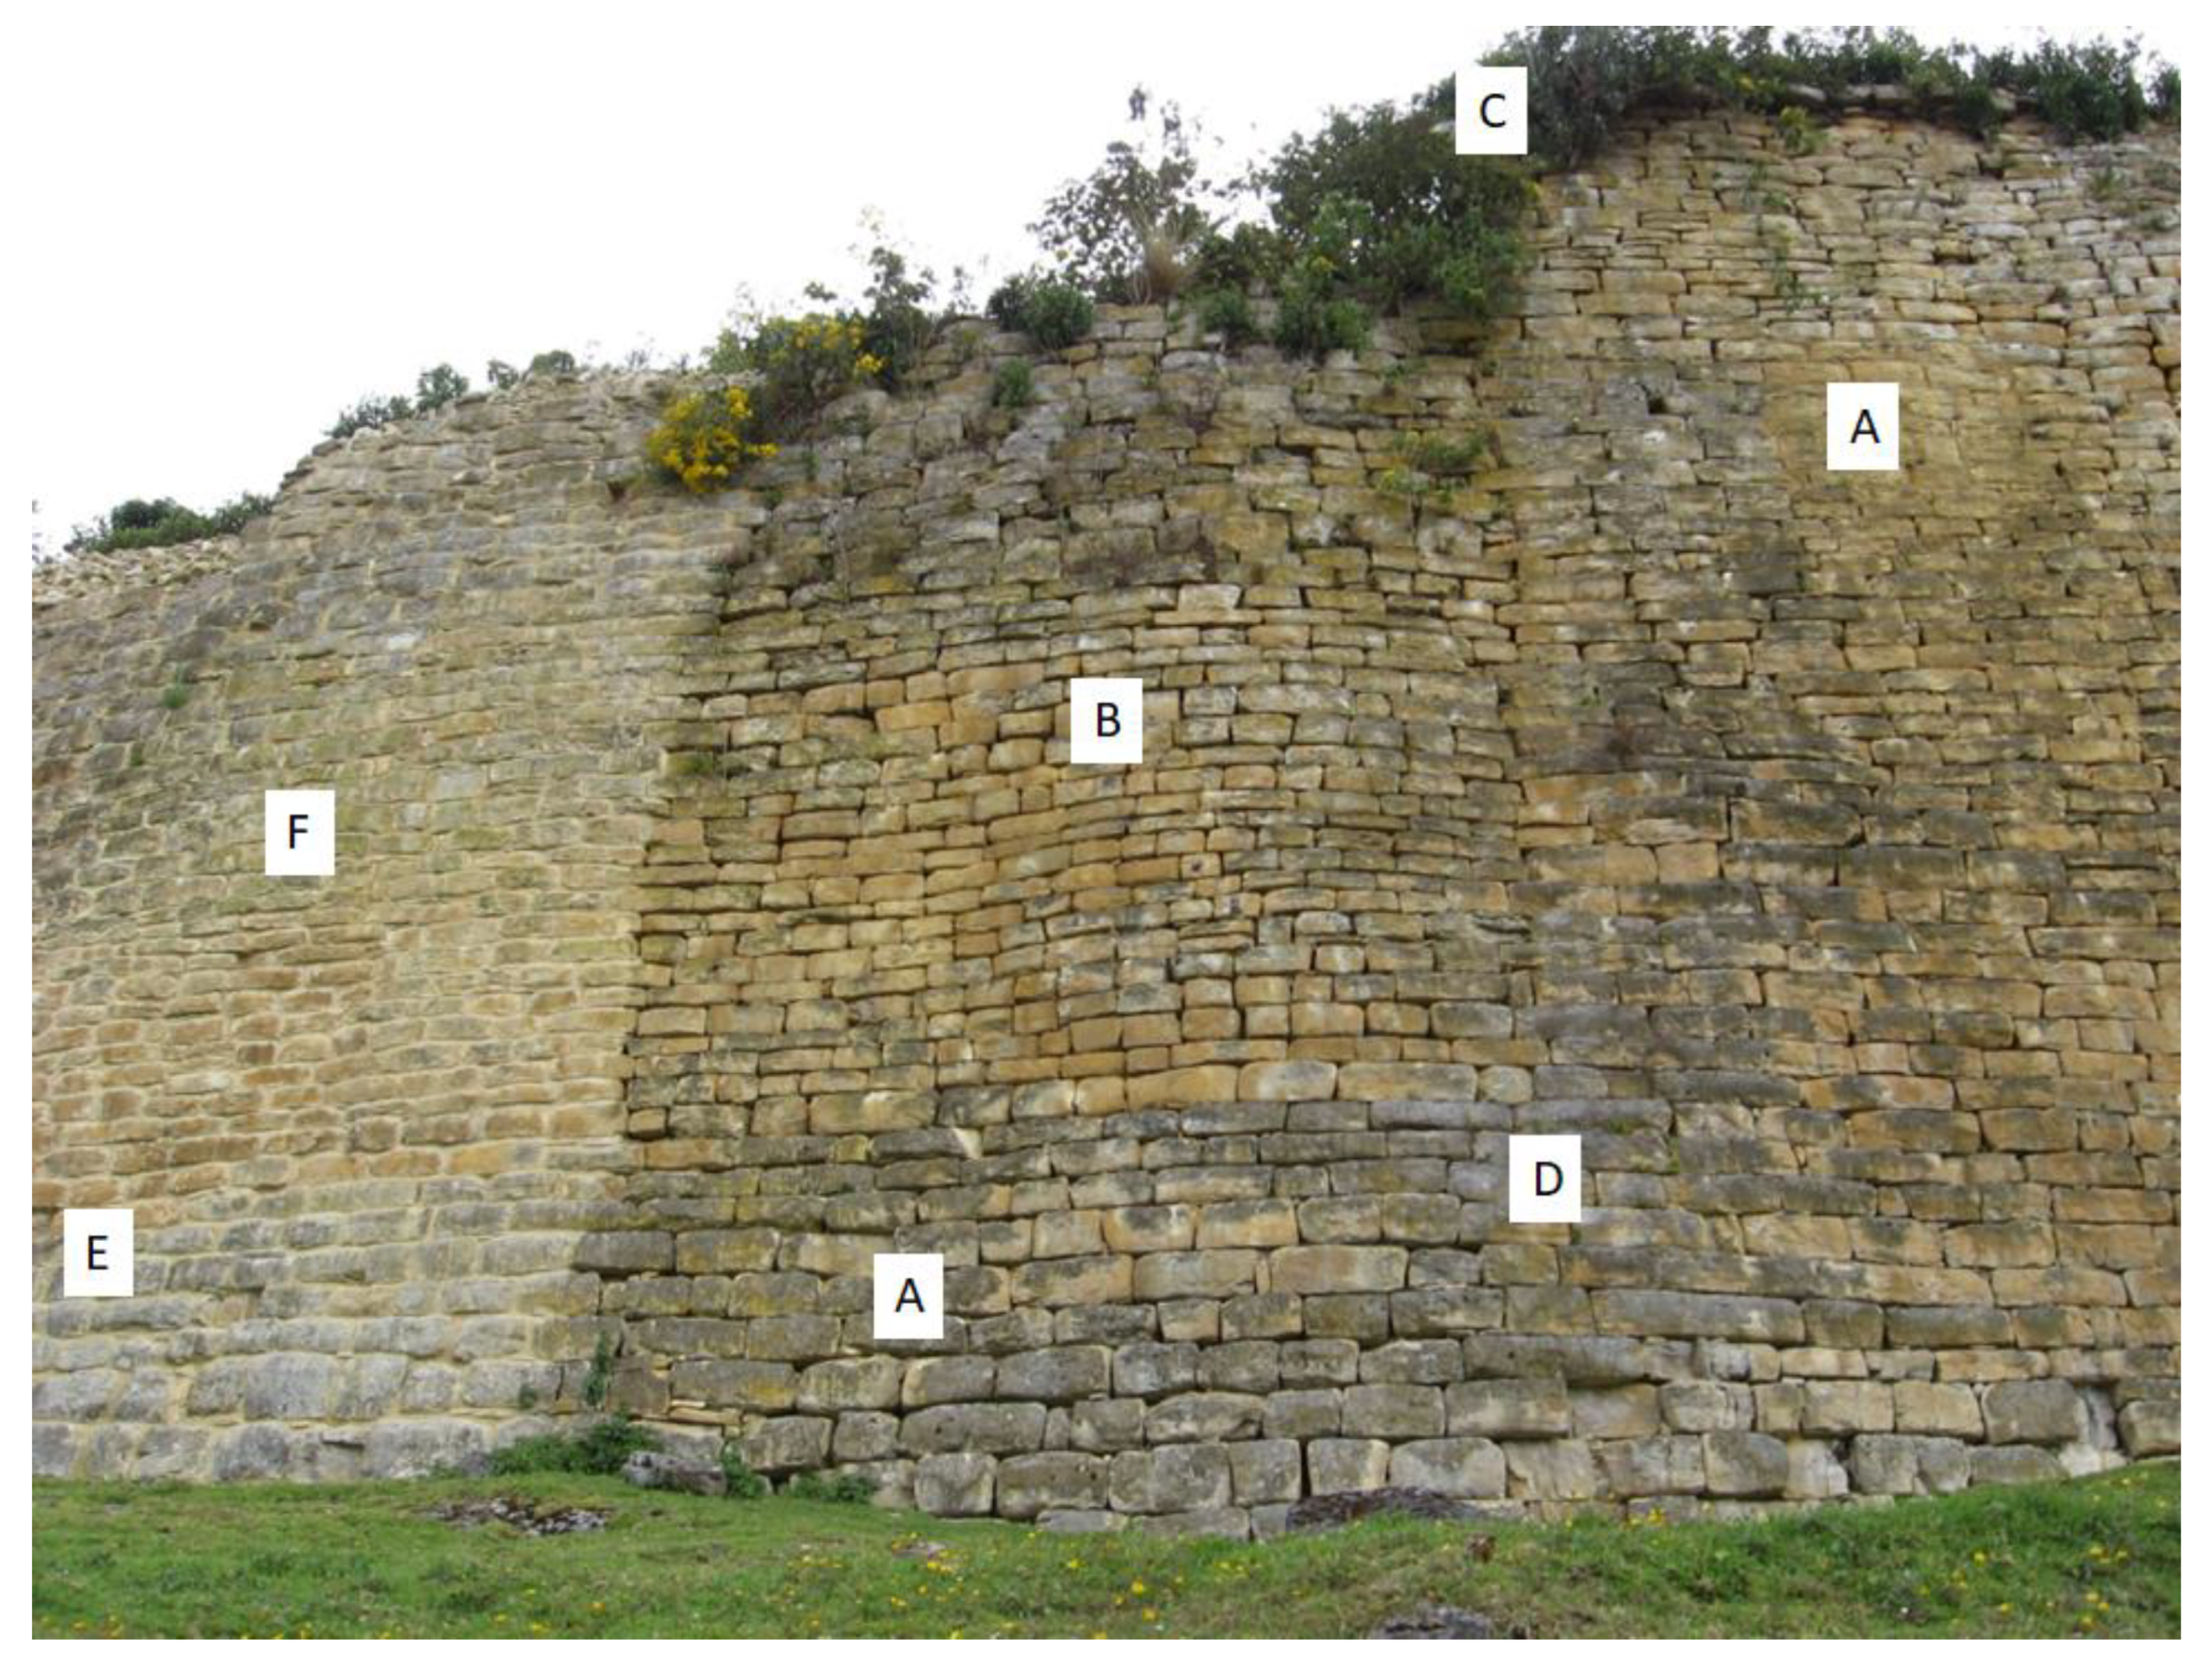
Figure 34.
Comparison of grain size curves; (A) average of samples of the original mortar used in the construction of La Fortaleza's walls*; (B) modern mortar used for conservation of La Fortaleza’s walls*; (C) typical grain size curves of sandy-clay soil and loam-clay soil; (D) typical grain size curves of sandy-clay soil and sandy-gravel soil; (E) typical grain size curves recommended for modern construction mortars. *Source data from UNESCO (2022). Elaborated by Kościuk.
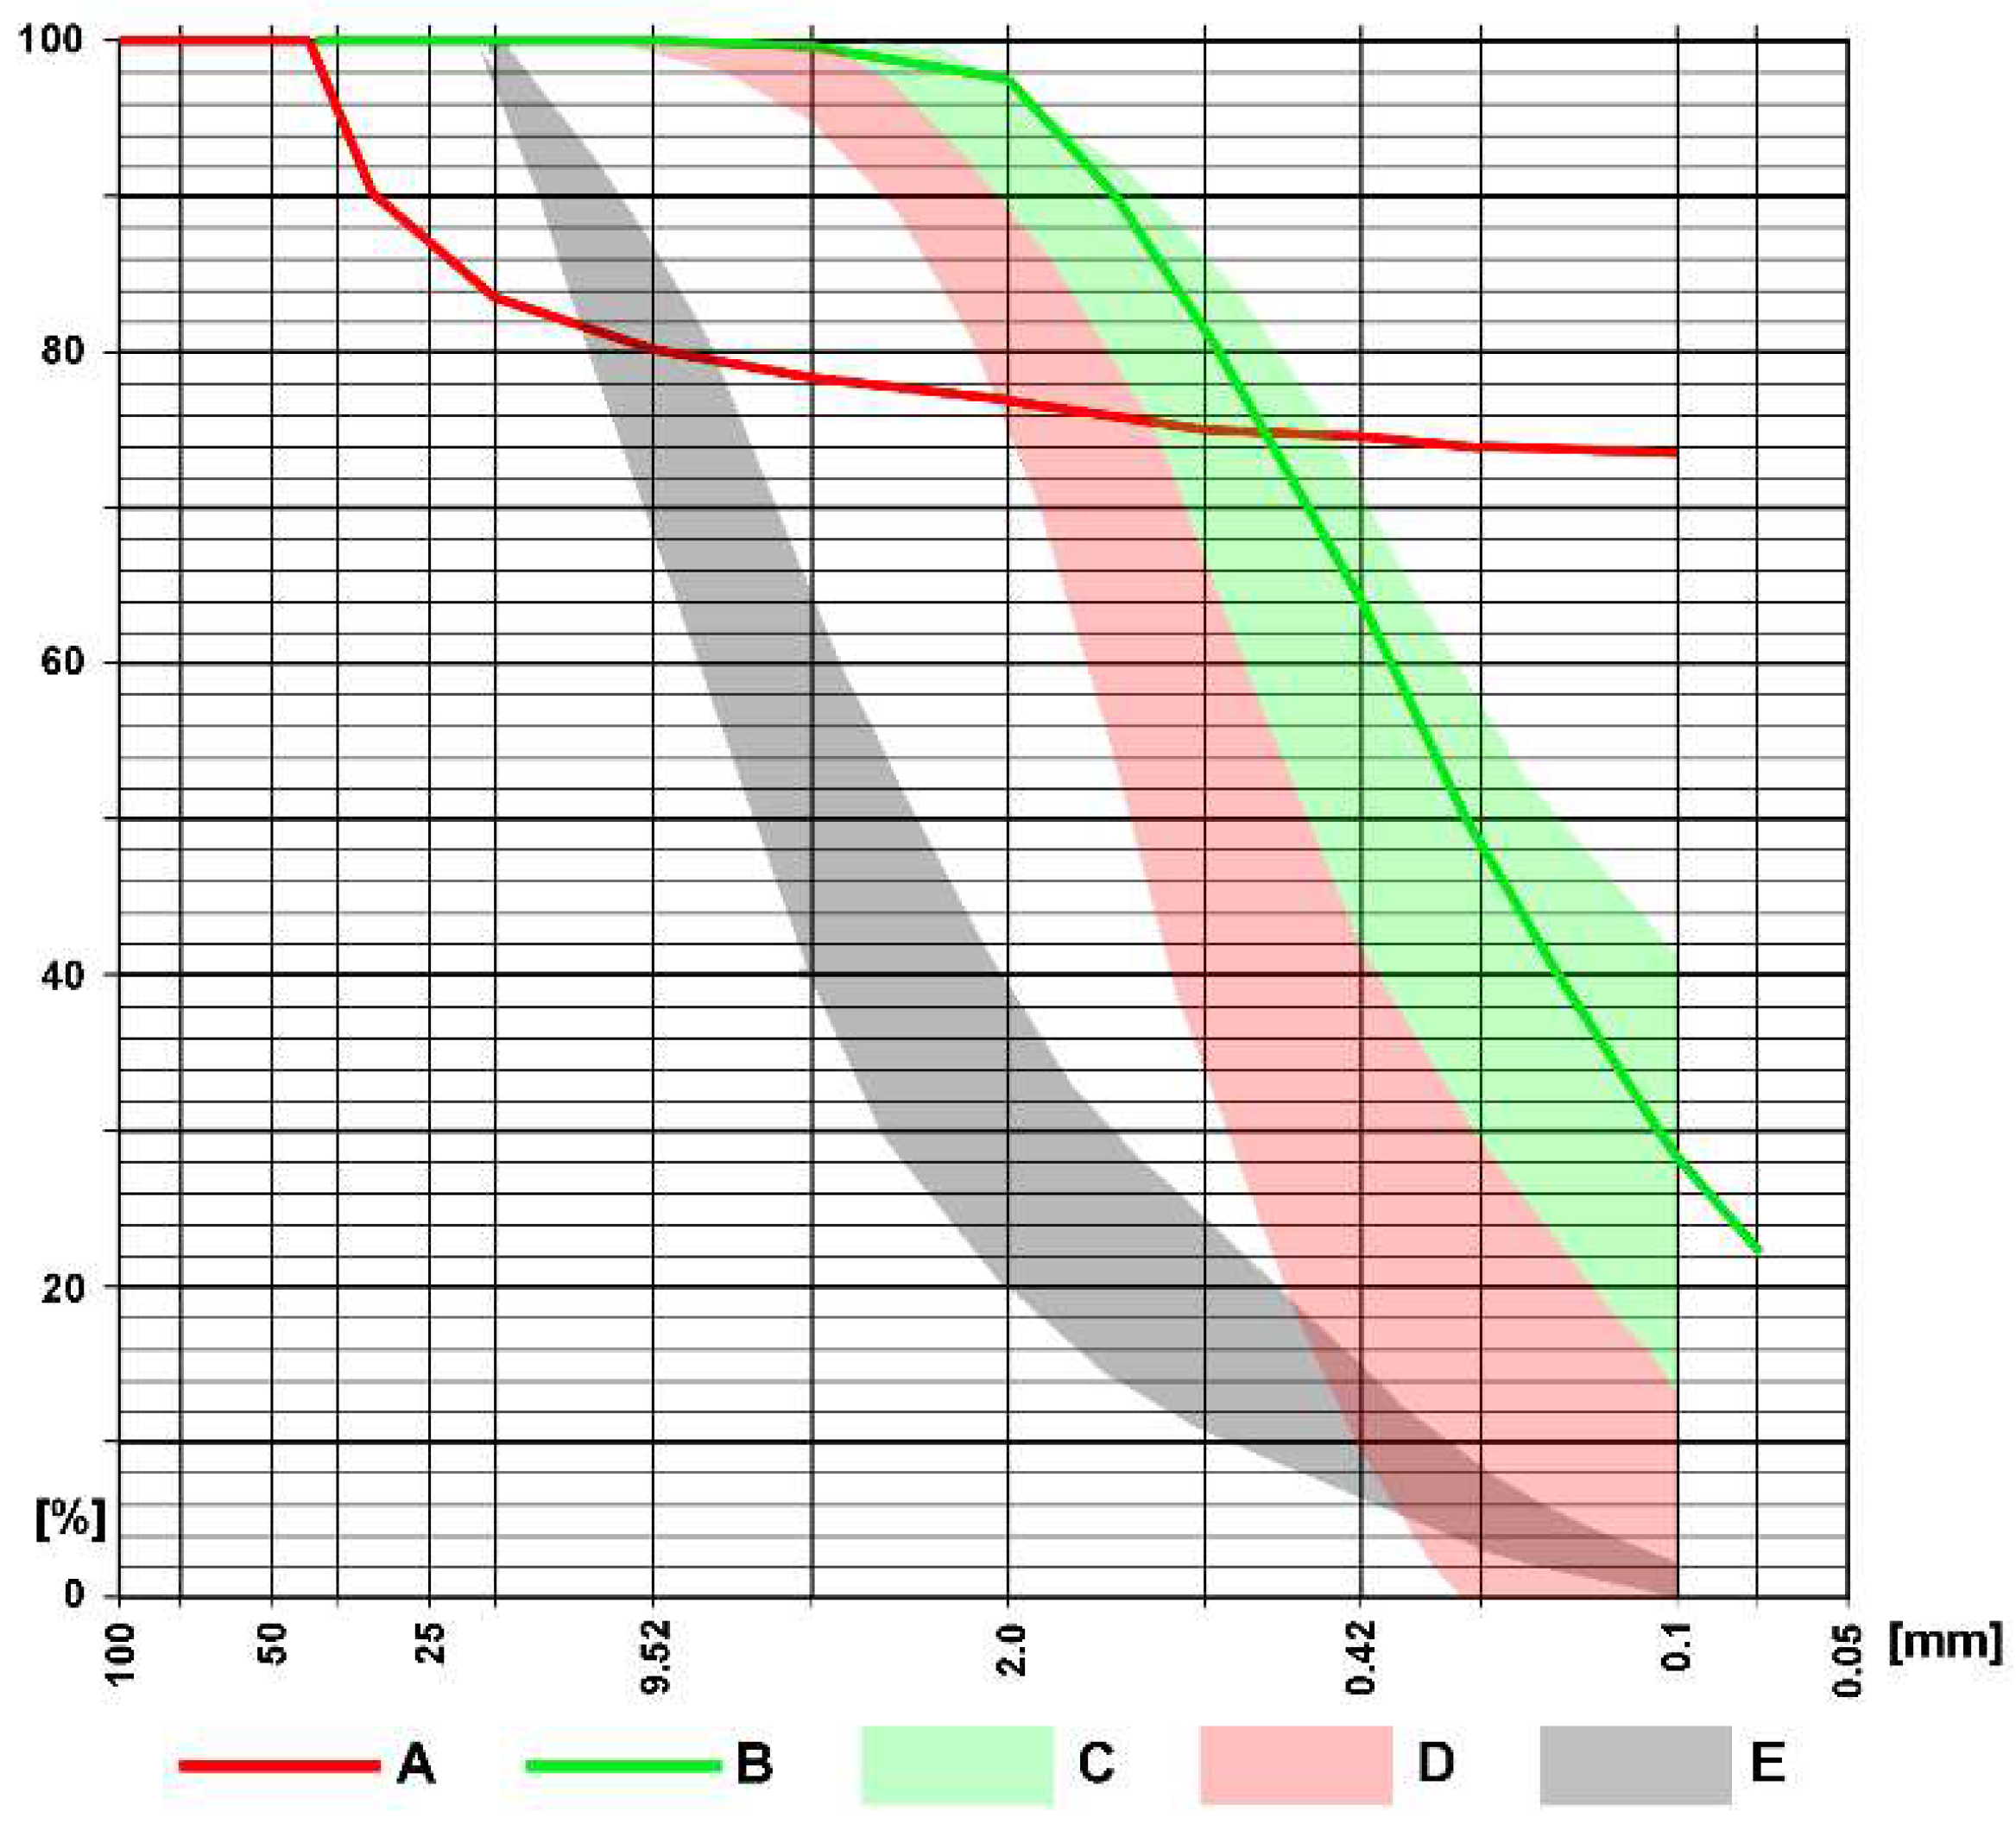
Figure 35.
(A) Cracks (red arrows) in the stone blocks of the La Fortaleza retaining wall observed in February 2020. Photo by Kościuk; (B) Machu Picchu. An example of repointing a wall using clay-earth mortar. Photo by Kościuk.
Figure 35.
(A) Cracks (red arrows) in the stone blocks of the La Fortaleza retaining wall observed in February 2020. Photo by Kościuk; (B) Machu Picchu. An example of repointing a wall using clay-earth mortar. Photo by Kościuk.
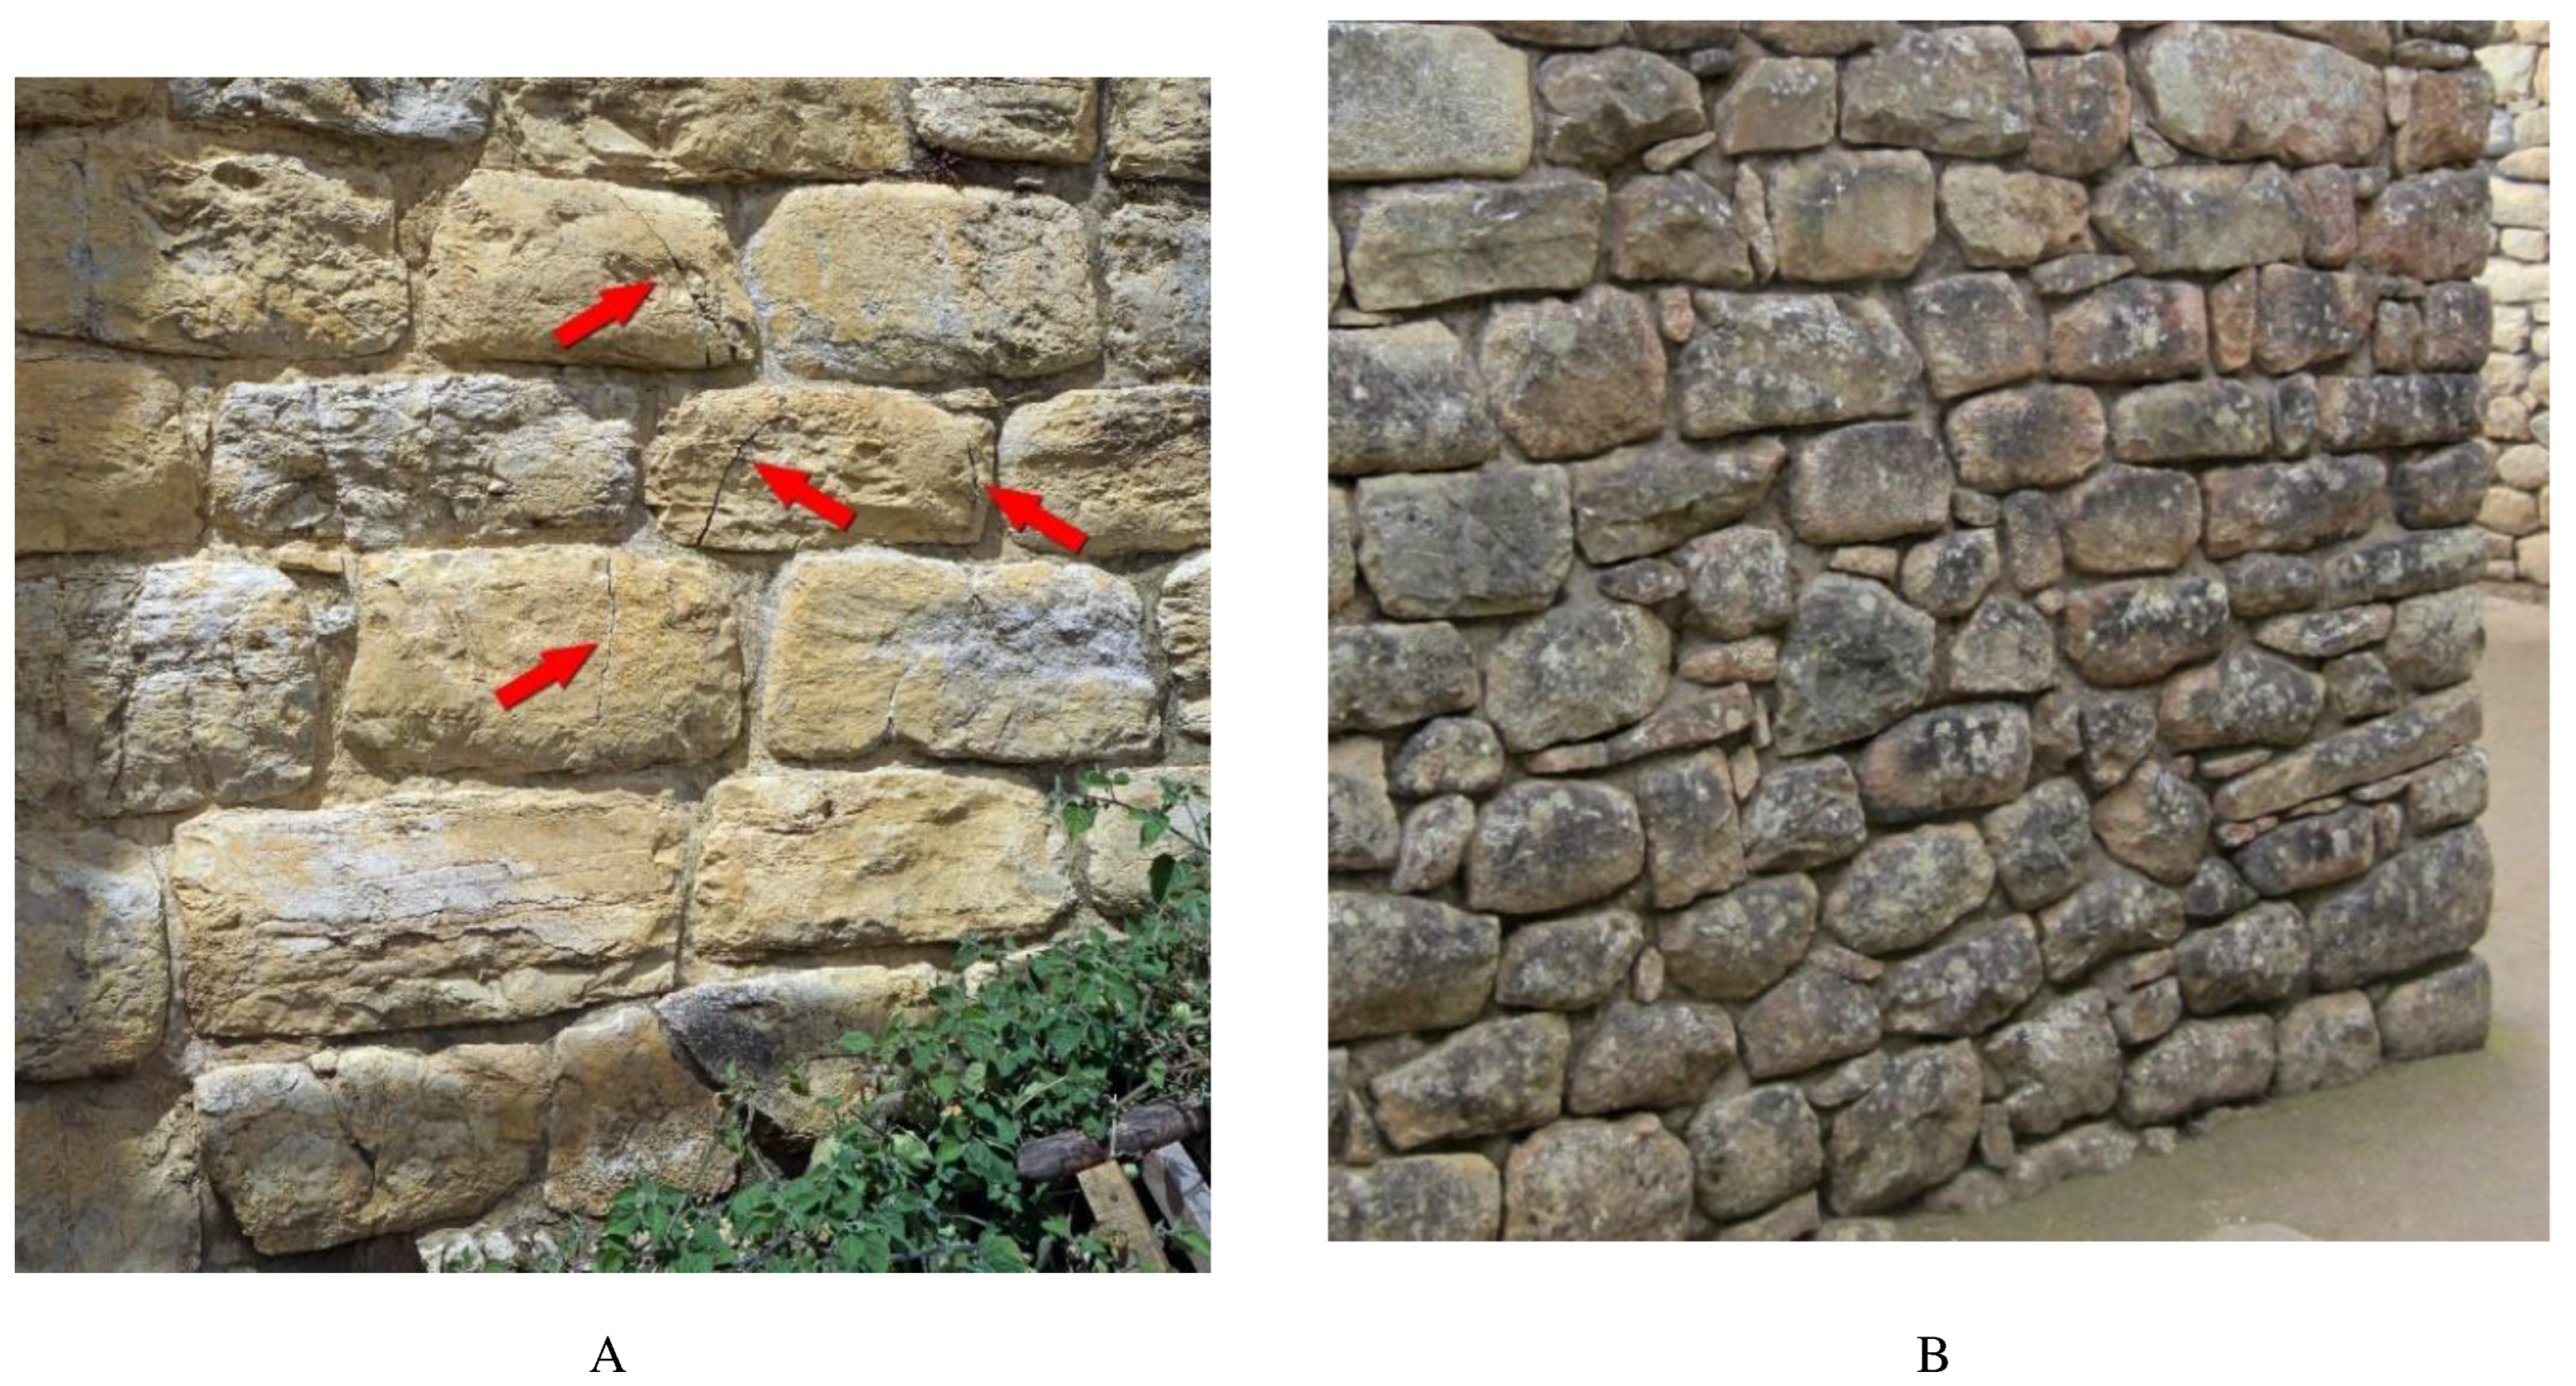
Disclaimer/Publisher’s Note: The statements, opinions and data contained in all publications are solely those of the individual author(s) and contributor(s) and not of MDPI and/or the editor(s). MDPI and/or the editor(s) disclaim responsibility for any injury to people or property resulting from any ideas, methods, instructions or products referred to in the content. |
© 2024 by the authors. Licensee MDPI, Basel, Switzerland. This article is an open access article distributed under the terms and conditions of the Creative Commons Attribution (CC BY) license (http://creativecommons.org/licenses/by/4.0/).
Copyright: This open access article is published under a Creative Commons CC BY 4.0 license, which permit the free download, distribution, and reuse, provided that the author and preprint are cited in any reuse.


