Submitted:
03 January 2024
Posted:
04 January 2024
You are already at the latest version
Abstract
AliAmbra is a project developed to explore and promote high-quality catches of the Amvrakikos Gulf GP to Artas’ wider regions. In addition, this project aimed to implement an integrated plan of action, to form a business identity with high-added value and achieve integrated business services adapted to the special characteristics of the area. The action plan for this project was to actively search for new markets, create a collective identity for the products, promote their quality and added value, engage in gastronomes and tasting exhibitions, dissemination and publicity actions, as well as enhance the quality of the products and markets based on the customer needs. The primary focus of this publication is to observe and analyze the data retrieved from various tasting exhibitions of the AliAmbra project, with a target goal of improving customer experience and product quality.
Keywords:
Grammatical evolution
; Computational Intelligence
; Neural networks
; Feature Construction
; Data Analysis
; Recommendation System
1. Introduction
In recent years, there has been a growing emphasis on sustainable and high-quality catches from regional areas, aiming to not only preserve local ecosystems but also to create business opportunities with a distinctive identity and added value.
The AliAmbra project stands as a noteworthy initiative, specifically focusing on the exploration and promotion of premium catches from the Amvrakikos Gulf, extending its reach to the broader regions of Artas. The core objective of the project is to establish an integrated plan of action, fostering a business identity characterized by high-added value and tailored services that align with the unique features of the area.
Figure 1.
AliAmbra Project Logo.

This paper centers its attention on scrutinizing and interpreting data obtained from various tasting exhibitions associated with the AliAmbra project. The overarching goal is to enhance product quality, contribute to the ongoing action plan of AliAmbra on improving the quality of the products [2], and ultimately elevate the customer experience [3,4]. The methodology employed involves a comprehensive analysis of survey data collected during gastronomic events facilitated by the project, utilizing Google Forms to gather insights into both demographic information and product evaluations.
Furthermore, the publication extends its inquiry into the development of a robust recommendation system based on the acquired data. A pivotal aspect of this research is the incorporation of data-driven and model-driven algorithms to optimize the recommendation system’s efficacy. The model-driven analysis focused on the application of several ML/DL algorithms. The algorithms explored are MLP BFGs [5], RBF [6], GenClass [7], NNC [8], and FC [9]. Through this multifaceted approach, the paper seeks not only to contribute valuable insights to the AliAmbra project but also to advance the broader understanding of the application of diverse algorithms in optimizing recommendation systems for projects of similar nature and scope.
Similar studies on the improvement or assessment of the quality of food products using machine learning or deep learning techniques have shown promising results. Computer Vision is also one of many ways to determine or help improve the quality of food products. One study applied convolutional neural networks [10] in food reviews to classify the quality of products using images as inputs, this task was achieved by segmenting the contents of the plate into multiple sections. Another similar study [11] used Computer Vision to analyze the color of coffee beans and classify their quality. In addition, machine learning is capable of assessing the quality of products through large-scale reviews with the assistance of demographic data or food product data. Two studies mention the use of ML algorithms, one focused on the association of demographic data and food choice motives [12] and the other focused on food quality assessment [13].
Moreover, machine learning techniques have also applied to food safety models [14,15], food sales prediction [16,17], evaluation of food quality [18,19], food security [20,21] etc.
The latter sections thoroughly convey the process of each analysis. Materials and Methods, Section 2, discusses the methodologies, tools, and techniques used in each analysis. Section 3 clarifies the development of our dataset, including the structure. Finally, Section 4 expands the analysis by inspecting and visualizing the results of the models with the developed dataset.
2. Materials and Methods
This section will begin with the basic principles of Grammatical Evolution and a full example of producing valid expressions and continue with a full description of the methods used to effectively evaluate the data collected during the execution of the project.
Furthermore, this section covers information about the tools applied in the analysis of this project including the methodologies applied to the model and data-driven analysis.
2.1. Grammatical Evolution
Grammatical evolution [22] is a genetic algorithm with integer chromosomes. Genetic algorithms was proposed by John Holland [23] and they are considered as biologically inspired algorithms. The algorithm produces potential solutions of an optimization problem randomly and these solutions are gradually altered in a series of iterations through the application of the genetic operators of selection, crossover and mutation [24,25]. Genetic algorithms have been used in a series of real - world problems, such as electromagnetic problems [26], combinatorial problems [27], water distribution problems [28], neural network training [29,30] etc. The main advantage of genetic algorithms is that thet can be easily parallelized [31,32] using programming techniques such as MPI [33] or OpenMP [34]. The chromosomes in the Grammatical Evolution represent production rules of the provided BNF (Backus–Naur form) grammar [35]. Any BNF grammar G can be defined as the set , where
- N denotes the set of non terminal symbols of the underlying grammar.
- T stands for the set of terminal symbols, where .
- The terminal symbol S is named start symbol of the grammar.
- P is a finite set of production rules in the form or .
The Grammatical Evolution starts from the symbol S and produces valid programs, expressed only with terminal symbols, selecting production rules from the grammar. The production rules are selected using the following procedure:
- Read the next element V from the chromosome that is being processed.
- Get the rule: Rule = V mod R, where R is the total number of production rules for the current non – terminal symbol.
As an example, consider the grammar of Figure 2 used to produce valid expressions in C - like programming language.
Also, consider the chromosome and . The steps to produce the final string (x2+cos(x3)) are outlined in Table 1
The Grammatical Evolution has been used in a variety of problems such as as function approximation [36,37], solution of trigonometric equations [38], automatic music composition of music [39], neural network construction [40,41], creating numeric constraints [42], video games [43,44], estimation of energy demand [45], combinatorial optimization [46], cryptography [47] etc. Recent extensions of the Grammatical Evolution procedure include the Structured Grammatical Evolution [48,49], parallel implementations [50,51], the Probabilistic Grammatical Evolution variant [52], the Multi-Objective Grammatical Evolution approach [53] etc.
2.2. Construction of Classification Rules
A basic technique that will be used in conducting the experiments is that of constructing classification rules using Grammatical Evolution. This method was initially proposed in [7] and the corresponding software was described in the [54]. This technique constructs classification rules with the assistance of Grammatical Evolution. The main steps of the used method are provided below.
-
Initialization Step
- (a)
- Set with the number of chromosomes that will participate.
- (b)
- Set the total number of allowed generations .
- (c)
- Produce randomly chromosomes. Each chromosome is considered as a set of integer values representing production rules of the underlying BNF grammar.
- (d)
- Define as the used selection rate, with .
- (e)
- Define as the used mutation rate, with .
- (f)
- Read the train set for the corresponding dataset.
- (g)
- Set iter=0.
-
Fitness calculation Step
- (a)
-
For do
- i
- Create a classification program . As an example of a classification program consider the following expression:
- ii
- Compute the fitness value as
- (b)
- End For
-
Genetic operations step
- (a)
- Selection procedure. The chromosomes are sorted initially according to their fitness values. The first chromosomes with the lowest fitness values are copied to the next generation. The rest of the chromosomes are replaced by offsprings produced during the crossover procedure.
- (b)
- Crossover procedure: For every pair of produced offsprings two chromosomes are selected from the current population using the tournament selection. The process of tournament selection has as follows: Firstly, create a group of randomly selected chromosomes from the current population and the individual with the best fitness in the group is selected. These chromosomes will produce the offsprings and using one point crossover. An example of one point crossover is shown in Figure 3.
- (c)
- Perform the mutation procedure. In this process a random number is drawn for every element of each chromosome and it is altered randomly if .
-
Termination Check Step
- (a)
- Set
- (b)
- If terminate else goto step 2.
2.3. Neural Network Construction
Another technique that makes the most of Grammatical Evolution is the production of artificial neural networks using it [8]. This technique can simultaneously construct the optimal structure of an artificial neural network and also estimate the values of the network weights minimizing the training error. The steps used in neural network construction are listed below.
-
Initialization Step
- (a)
- Set as as the number of chromosomes.
- (b)
- Set as the total number of generations allowed.
- (c)
- Produce randomly chromosomes, as a series of production rules expressed in integer format.
- (d)
- Set the selection rate and the mutation rate .
- (e)
- Read the associated train set .
- (f)
- Set iter=0.
-
Fitness calculation Step
- (a)
-
For do
- i
- Construct an artificial neural network . The neural networks constructed by this procedure are in the form:where d stands for the dimension of the input dataset and H denotes the number of processing nodes in the neural network. The function stands for the sigmoid function:
- ii
- Compute the corresponding fitness value as
- (b)
- End For
-
Genetic operations step
- (a)
- Selection procedure. Initially the chromosomes are sorted according to their associated fitness values. The first chromosomes with the lowest fitness values are transferred to the next generation without changes. The rest of the chromosomes are replaced by offsprings produced during the crossover procedure.
- (b)
- Crossover procedure. For each pair of newly added chromosomes two parents are selected using tournament selection. The new chromosomes are created using one point crossover.
- (c)
- Perform the mutation procedure. In this process a random number is drawn for every element of each chromosome and it is altered randomly if .
-
Termination Check Step
- (a)
- Set
- (b)
- If terminate else goto step 2.
2.4. Feature Construction with Grammatical Evolution
The Grammatical Evolution was also used as the base to construct artificial features from the original one for classification and regression problems [9]. The artificial features that create this procedure will be evaluated using a Radial Basis Function (RBF) network [6]. The RBF network has an extremely fast and efficient training procedure with the incorporation of the K-means [55] method and additionally RBF networks has been used with success in a variety of problems, such as physics problems [56,57], estimation of solutions for differential equations [58,59], robotics [60], chemistry [61] etc. The procedure of creating artificial features is divided in a series of steps listed subsequently.
-
Initialization Step
- (a)
- Set the number of chromosomes .
- (b)
- Set the total number of allowed generations .
- (c)
- Produce randomly chromosomes as random sets of integer.
- (d)
- Set the selection rate and the mutation rate .
- (e)
- Set as F the number of artificial features that will be constructed by the procedure.
- (f)
- Read the train set .
- (g)
- Set iter=0.
-
Fitness calculation Step
- (a)
-
For do
- (i)
- ProduceF artificial features from the original ones of the dataset.
- (ii)
- The original training set TR is mapped to a new one using the artificial features produced. Denote this new training set as .
- (iii)
- Train an RBF network using the set .
- (iv)
- Compute the fitness value as
- (b)
- End For
-
Genetic operations step
- (a)
- Selection procedure. Chromosomes are sorted based on the fitness of each one. The first will be transferred without changes to the next generation, while the rest will be replaced by chromosomes created in the crossover process.
- (b)
- Crossover procedure: For every pair of produced offsprings two chromosomes are selected using tournament selection. These chromosomes will be the parents for two new offsprings and created with one-point crossover.
- (c)
- Mutation procedure. For each element of every chromosome a random number . if then this element is altered.
-
Termination Check Step
- (a)
- Set
- (b)
- If terminate else goto step 2.
2.5. Statistical Analysis
The statistical analysis was to calculate the frequency of occurrences of all entries. Data visualization was achieved using Python libraries that are capable of generating interactable pie charts as a web application.
The frequency calculation for each entry was achieved by counting each occurrence of an entry for each question. The following formula was used to calculate the frequencies of every answer separately.
Figure 4. Where n is the total number of answers, references the index and value of a given answer to a question. x represents the given answer we want to count. evaluates as 1 if is equal to x, otherwise as 0.
Once every frequency for each answer and each question is calculated, the data is prepared to be visualized with the help of graphing libraries.
2.6. Plotting Libraries
Streamlit is a highly capable open-source framework [62], that allows users to deploy web applications exceedingly fast and easily in Python. It is compatible with many modern third-party frameworks and was created for data scientists, as well as ML, DL, and computer vision engineers. Furthermore, Streamlit has been a perfect use case for our analysis, not only for the visualization of our data but also for the interaction data charts. Plotly is a high-level low-code graphing library [63], that allows users to create interactive graphs from their data. Plotly is fully supported by Streamlit, allowing users to build professional dashboards under the influence of their data. Seaborn [64] is a high-level Python data visualization library based on Matplotlib. Seaborn was primarily used to plot the prediction data results of the models we reviewed.
3. Datasets & Data Retrieval
The development of our dataset was instigated once we had completed a large portion of the data retrieval. We retrieved data from a total of eight different exhibitions/locations.
It was earlier mentioned, that we received data by interacting with each customer in the tasting exhibitions. The information retrieved was demographic data, alongside graded products and general questions involving the experience they’ve had and their preferences.
The data retrieval was achieved with the assistance of the members of the AliAmbra project. Google Forms allowed us to build a very simple and fast survey to use. Our members approached each individual once they had tasted each or some of the samples and were provided with several questions about the experience they had with the products.
Prior to the processing of the dataset by the models, we made sure to clean and process any dormant values, to remove possible casualties and improve the model’s performance. Any sample that wasn’t tasted by the customers was attributed as a NULL value (0). Finally, we made sure to convert the data to numerical values, for the models to detect successfully.
3.1. Survey Structures
There were two types of surveys used in the exhibitions. The first survey included mostly data for a thorough visualization and statistical analysis. We retrieved a total of 366 entries. The second survey included data appropriate for prediction and recommendation systems. Both surveys included timestamps which allowed us to differentiate the locations of each exhibition that every entry was retrieved from. The structure of the first survey included general questions involving the experience they’ve had with the products, as well as questions referring to each product, how much they liked it, and what they enjoyed the most about it.
The samples included in the first survey are the following
- (1)
- Beetroot risotto with smoked eel
- (2)
- Fried Sardine
- (3)
- Fish croquettes with mullet
- (4)
- Sea bream Ceviche with lemon cream and pickled fennel

Table 2.
First survey structure. Includes two grading questions repeated for each sample and two general questions. Data retrieval locations: Neoxori Arta 06/11/2023 GP, Kommeno Arta 08/04 GP, Koronisia Arta 08/18 GP, Bigla Artas 08/19 GP, Skoufa Plazza Artas 09/21 GP, Saint Dimitris Plazza Arta 09/22 GP, Zerva Plazza Arta 09/23 GP.
| General Questions | Answers | Description | |
| Which Sample did you enjoy the most? | Sample_Name | The name of the sample | |
| Do you prefer modern or traditional recipes? | Traditional, Modern, Both, None | ||
| Grading Questions | Answers | Description | |
| Sample Rating | Didn’t like it, Neutral, Liked it a bit, Liked it, Liked it a lot | How much did the customer like the sample. Repeated for each sample. | |
| What did you enjoy the most? | Taste, Cooking method, Appearance | Multiple choice question | |
The structure of the second survey included three demographic questions and five questions involving the grading of the products within the exhibitions. The structure of the survey included three demographic data questions and five questions for each product that took place in the exhibition.
The samples included in the second survey are the following
- (1)
- Grilled Eel
- (2)
- Baked Eel
- (3)
- Grilled Sea Bream
- (4)
- Grilled Chub
- (5)
- Sardine
Table 3.
Second survey structure. Includes three demographic questions and five sample grading questions. Data retrieval locations: Psathotopi Artas 10/15 GP.
Table 3.
Second survey structure. Includes three demographic questions and five sample grading questions. Data retrieval locations: Psathotopi Artas 10/15 GP.
| Demographic Questions | Sample Rows | Description |
|---|---|---|
| Gender | Male or Female | Gender of each customer |
| Age | 15-25, 26-35, 36-45, 46-55, 56-65, 66-75 | Age of each customer |
| Marital Status | Married, Not-married | The marital status of each customer |
| Product Grading Questions | Sample Rows | |
| Grilled eel | 1=not at all, 5=a lot | |
| Baked eel | 1=not at all, 5=a lot | |
| Grilled Sea Bream | 1=not at all, 5=a lot | |
| Grilled Chub | 1=not at all, 5=a lot | |
| Sardine | 1=not at all, 5=a lot | |
The second survey is an equivalent of the first, however, the products displayed in the exhibition were different compared to the previous ones. For the general questions of the second survey, it focused on the demographic data, to analyze and determine the preferences of the masses based on the person.
4. Results
4.1. Experimental Results
We conducted a thorough experiment by breaking down the structure of the second survey into two different phases. For the first phase, we used the models mentioned previously to predict the customer preferences using only demographic data. For the second phase, we made the models to predict the customer preferences using the demographic data, including the rest of the products as class features for each entry.
The experiments were executed 30 times for all used methods and in each experiment different seed was seed for the random number. To execute the experiments the freely available QFc software [65] was used and it is available from https://github.com/itsoulos/QFc/ (accessed on 7 December 2023). The results are validated using the 10 - fold cross validation method. The execution machine eas an AMD Ryzen 5950X with 128GB of RAM, running Debian Linux and the programs were compiled using the GNU C++ compiler. The values for the parameters of the used methods are shown in Table 4 and the results for the first phase of the experiments are outlined in Table 5 and for the second phase in Table 6 respectively. In the tables with the experimental results the following applies:
- The column DATASET denotes the tested preference.
- The column GENCLASS refers to the application of the GenClass method, used to construct classification rules using a Grammatical Evolution guided procedure.
- The column NNC stands for the application of the neural network constrcution method analyzed previously.
- The column FC2 refers to the application of the Feature Construction method of subSection 2.4 to the dataset.
- In the experimental tables an additional row was added with the title AVERAGE. This row contains the average classification error for all datasets.
Table 4.
The values of the experimental parameters
| PARAMETER | MEANING | VALUE |
|---|---|---|
| Number of chromosomes | 500 | |
| Maximum number of allowed generations | 200 | |
| Selection rate | 0.90 | |
| Mutation rate | 0.05 | |
| H | Number of processing nodes | 10 |
| F | Constructed features (Feature Construction method) | 2 |
Table 5.
Experiments for the first phase: Demographic data-based dataset preferences
| DATASET | MLP | RBF | GENCLASS | NNC | FC2 |
|---|---|---|---|---|---|
| Grilled eel | 25.11% | 27.89% | 18.00% | 21.67% | 22.22% |
| Baked eel | 23.78% | 33.56% | 26.22% | 23.11% | 25.67% |
| Grilled Sea Bream | 33.22% | 40.67% | 36.45% | 37.34% | 32.00% |
| Grilled Chub | 30.22% | 35.00% | 30.78% | 31.45% | 28.00% |
| Sardine | 30.22% | 35.00% | 31.55% | 26.33% | 28.00% |
| AVERAGE | 28.51% | 34.45% | 28.60% | 27.98% | 24.87% |
Table 6.
Experiments for the second phase: Dataset with the demographic data counting the rest of the Product Preferences
Table 6.
Experiments for the second phase: Dataset with the demographic data counting the rest of the Product Preferences
| DATASET | MLP | RBF | GENCLASS | NNC | FC2 |
|---|---|---|---|---|---|
| Grilled eel | 17.11% | 13.22% | 15.67% | 18.22% | 15.00% |
| Baked eel | 28.56% | 27.89% | 22.67% | 23.00% | 20.00% |
| Grilled Sea Bream | 25.45% | 26.78% | 24.22% | 20.89% | 19.56% |
| Grilled Chub | 20.44% | 17.22% | 16.89% | 16.45% | 14.33% |
| Sardine | 14.22% | 20.44% | 19.66% | 16.44% | 16.22% |
| AVERAGE | 21.16% | 21.11% | 19.82% | 19.00% | 17.02% |
4.2. Data Visualization
This section includes visualizations of the analysis applied to the exhibition data, using streamlit [62], plotly [63], and seaborn [64].
4.2.1. Prediction Results
In this section, we present the experimental findings derived from the analysis of the first Table 5 and second Table 6 phases. We utilized the box plot In the current section, the experiment results of the first Table 5 and second Table 6 are plotted using box plots to visualize and better understand the prediction results
Figure 5.
FC2 displays a smaller overall gap and a lower classification error compared to the other model results, meaning that FC2 performed best for the first phase using only the demographic data. On the other hand, the Radial Basis Function (RBF), displays the highest classification error and gap with two visible outliers, compared to the other models. In other words, it displays the least favorable performance in terms of two visible outliers.
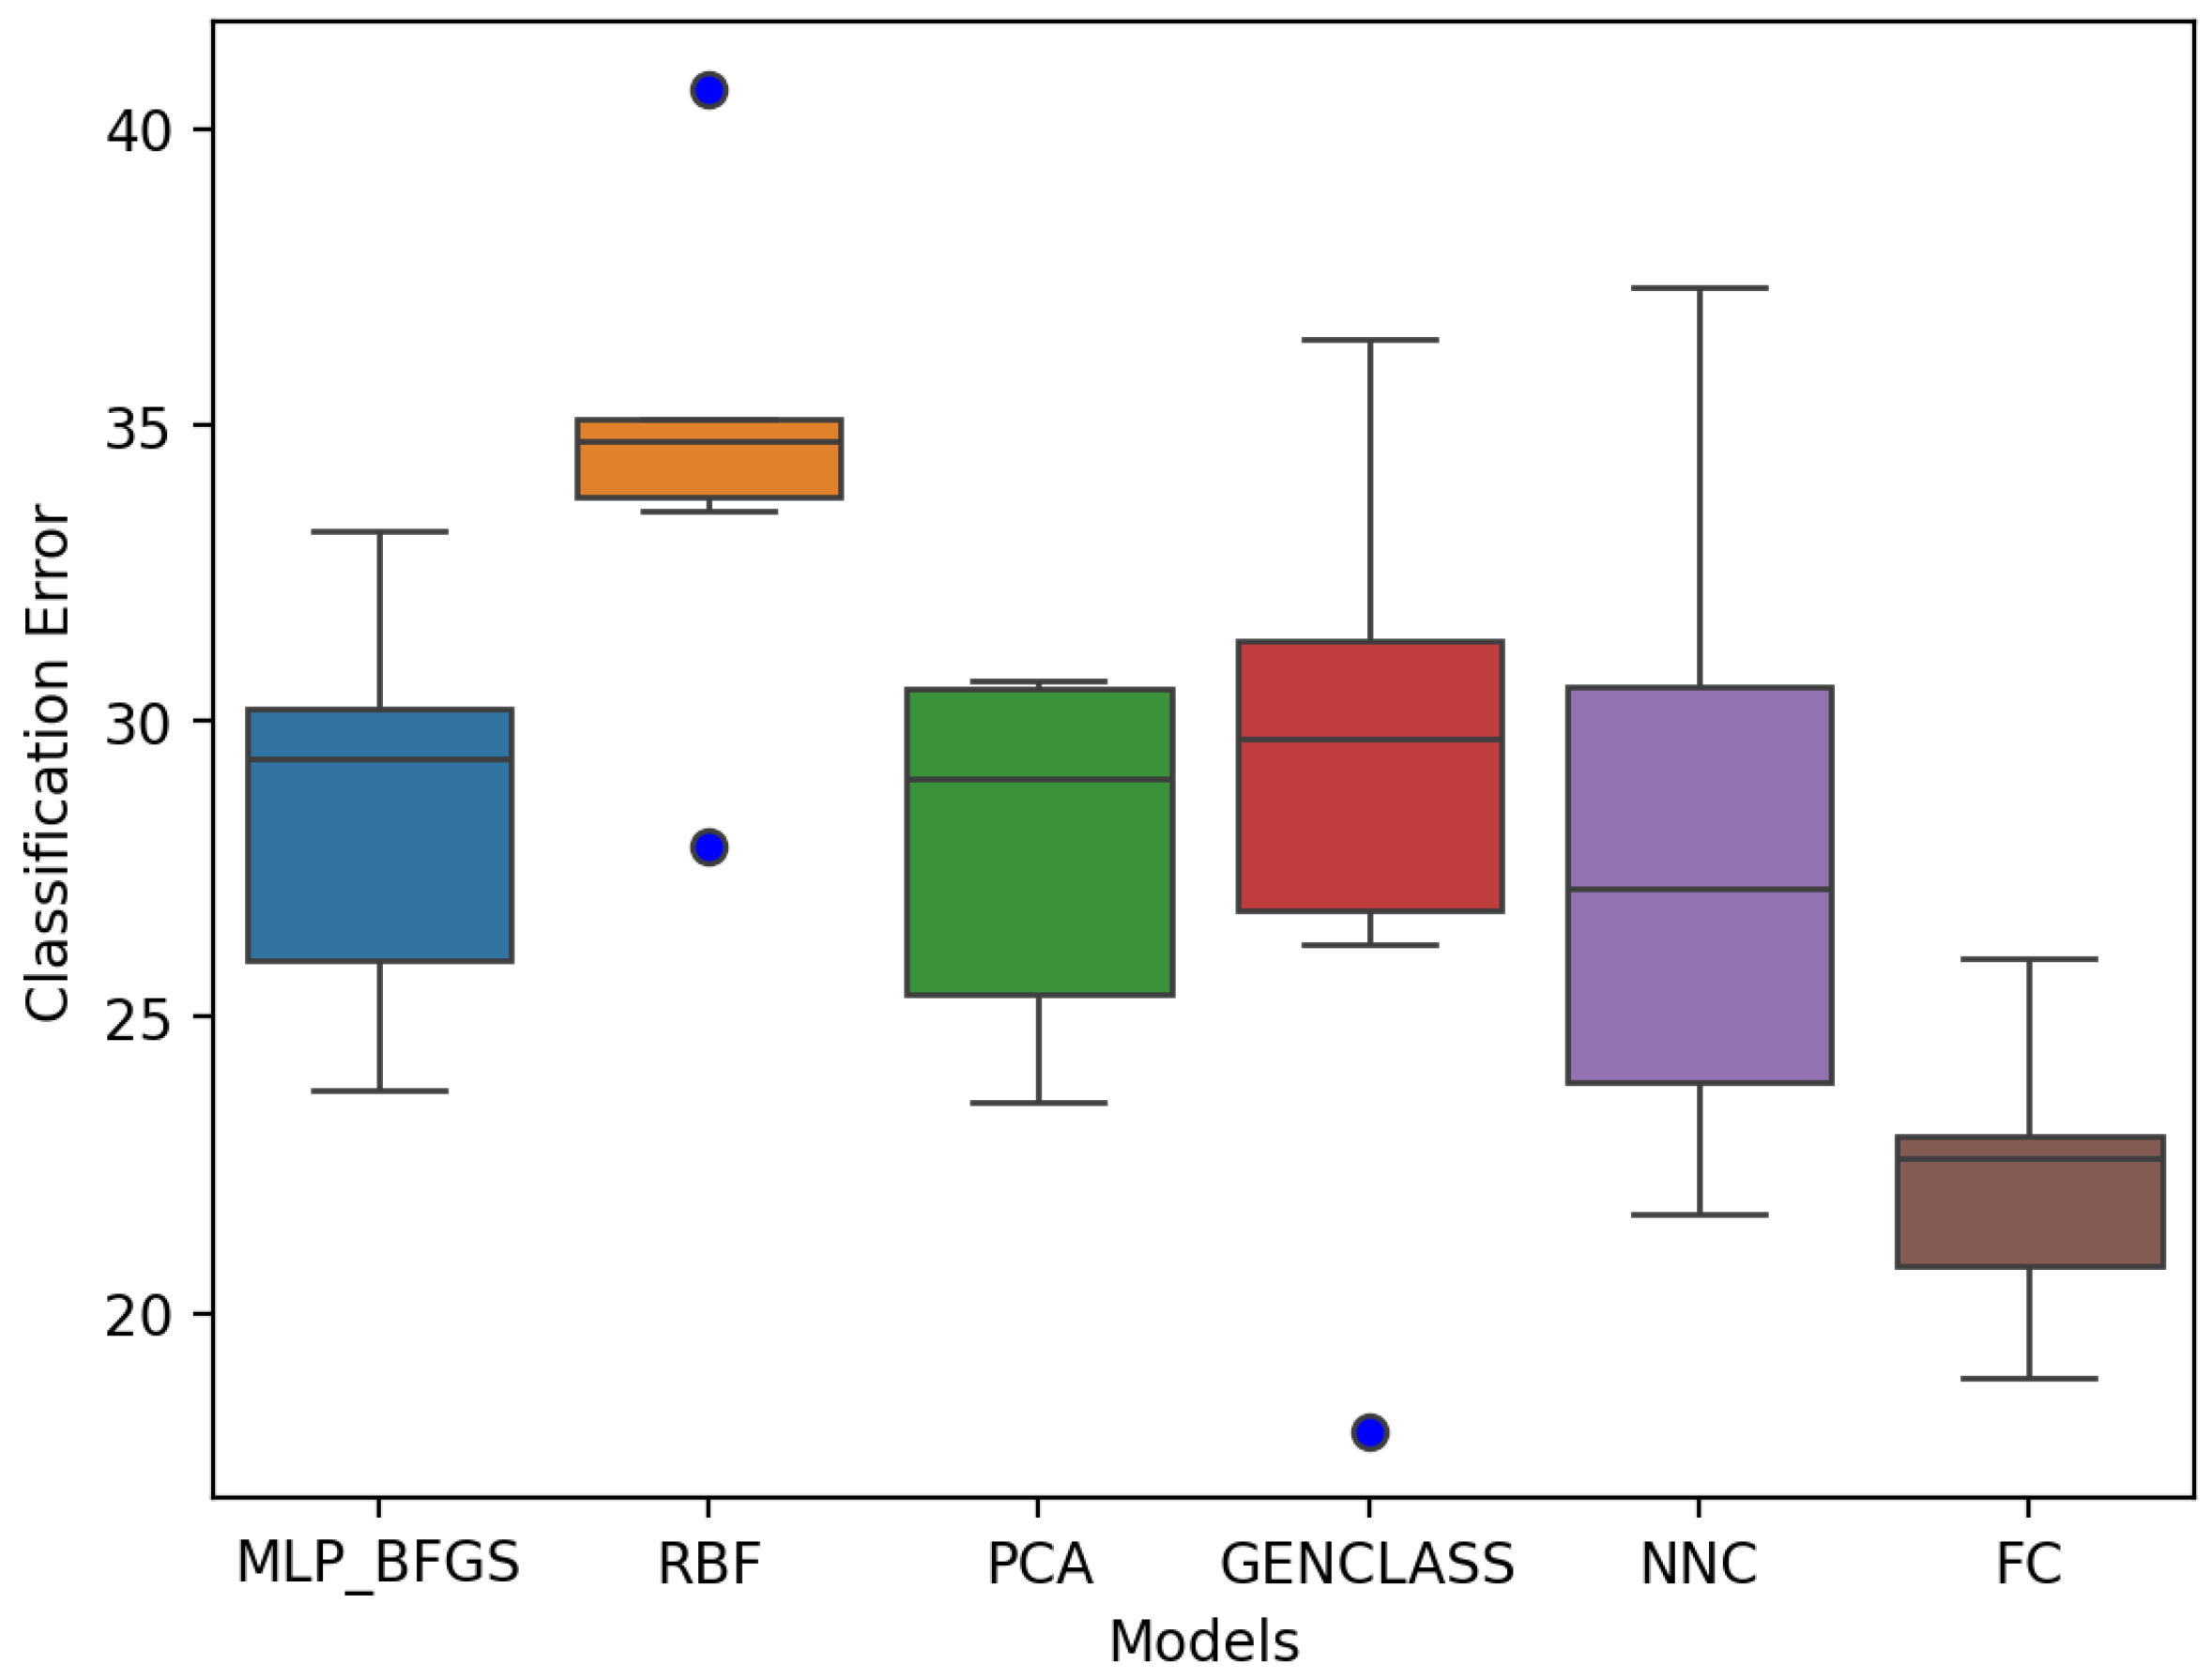
Figure 6.
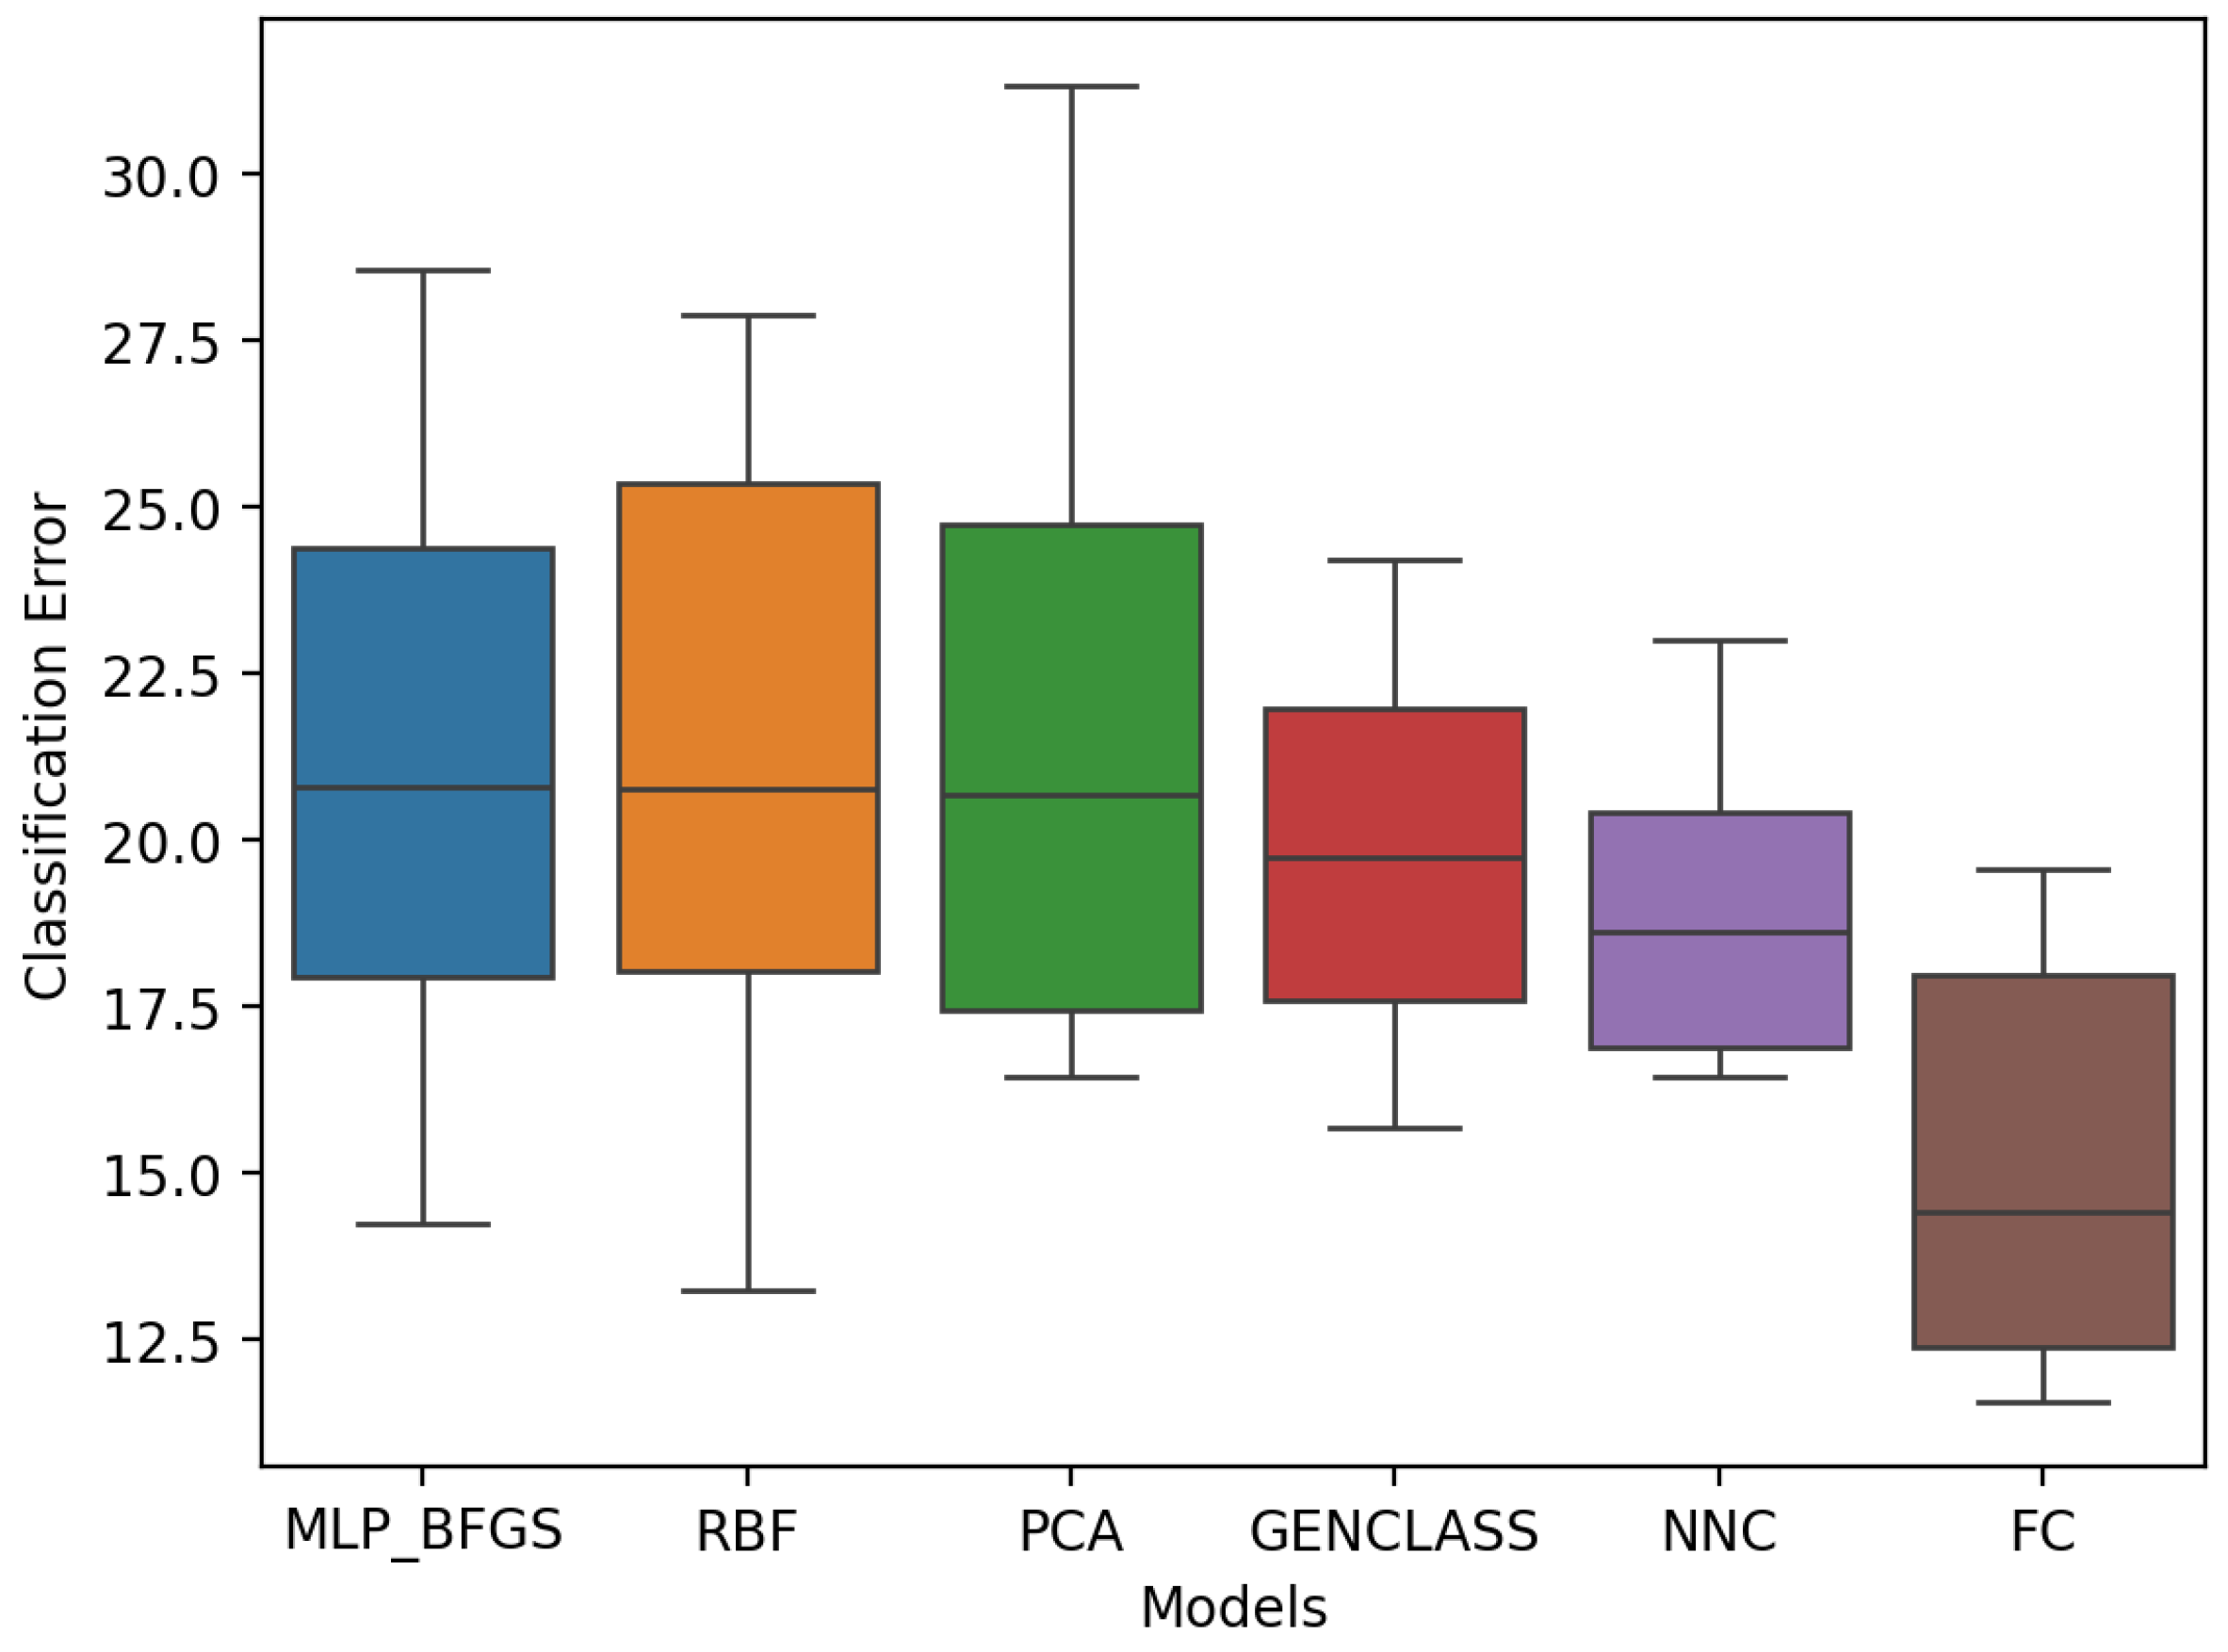
In the second phase, the results display a better distribution among the models compared to the first phase Figure 5. FC2 demonstrates superior performance, displaying a more favorable overall range and median classification error than the other models. MLP BFGS, RBF, and PCA present a rather suboptimal performance, with the overall range and median classification error much higher compared to the other models, however, NNC appears to perform well in terms of the distribution between each product.
Figure 6.
In the second phase, the results display a better distribution among the models compared to the first phase Figure 5. FC2 demonstrates superior performance, displaying a more favorable overall range and median classification error than the other models. MLP BFGS, RBF, and PCA present a rather suboptimal performance, with the overall range and median classification error much higher compared to the other models, however, NNC appears to perform well in terms of the distribution between each product.
4.2.2. Data Analysis
The first survey contained a total of 366 entries for all exhibitions. The second survey contained 39 entries that were retrieved in only one exhibition.
The data analysis results of the first survey are as follows.
Figure 7.
General Question results of the first survey.
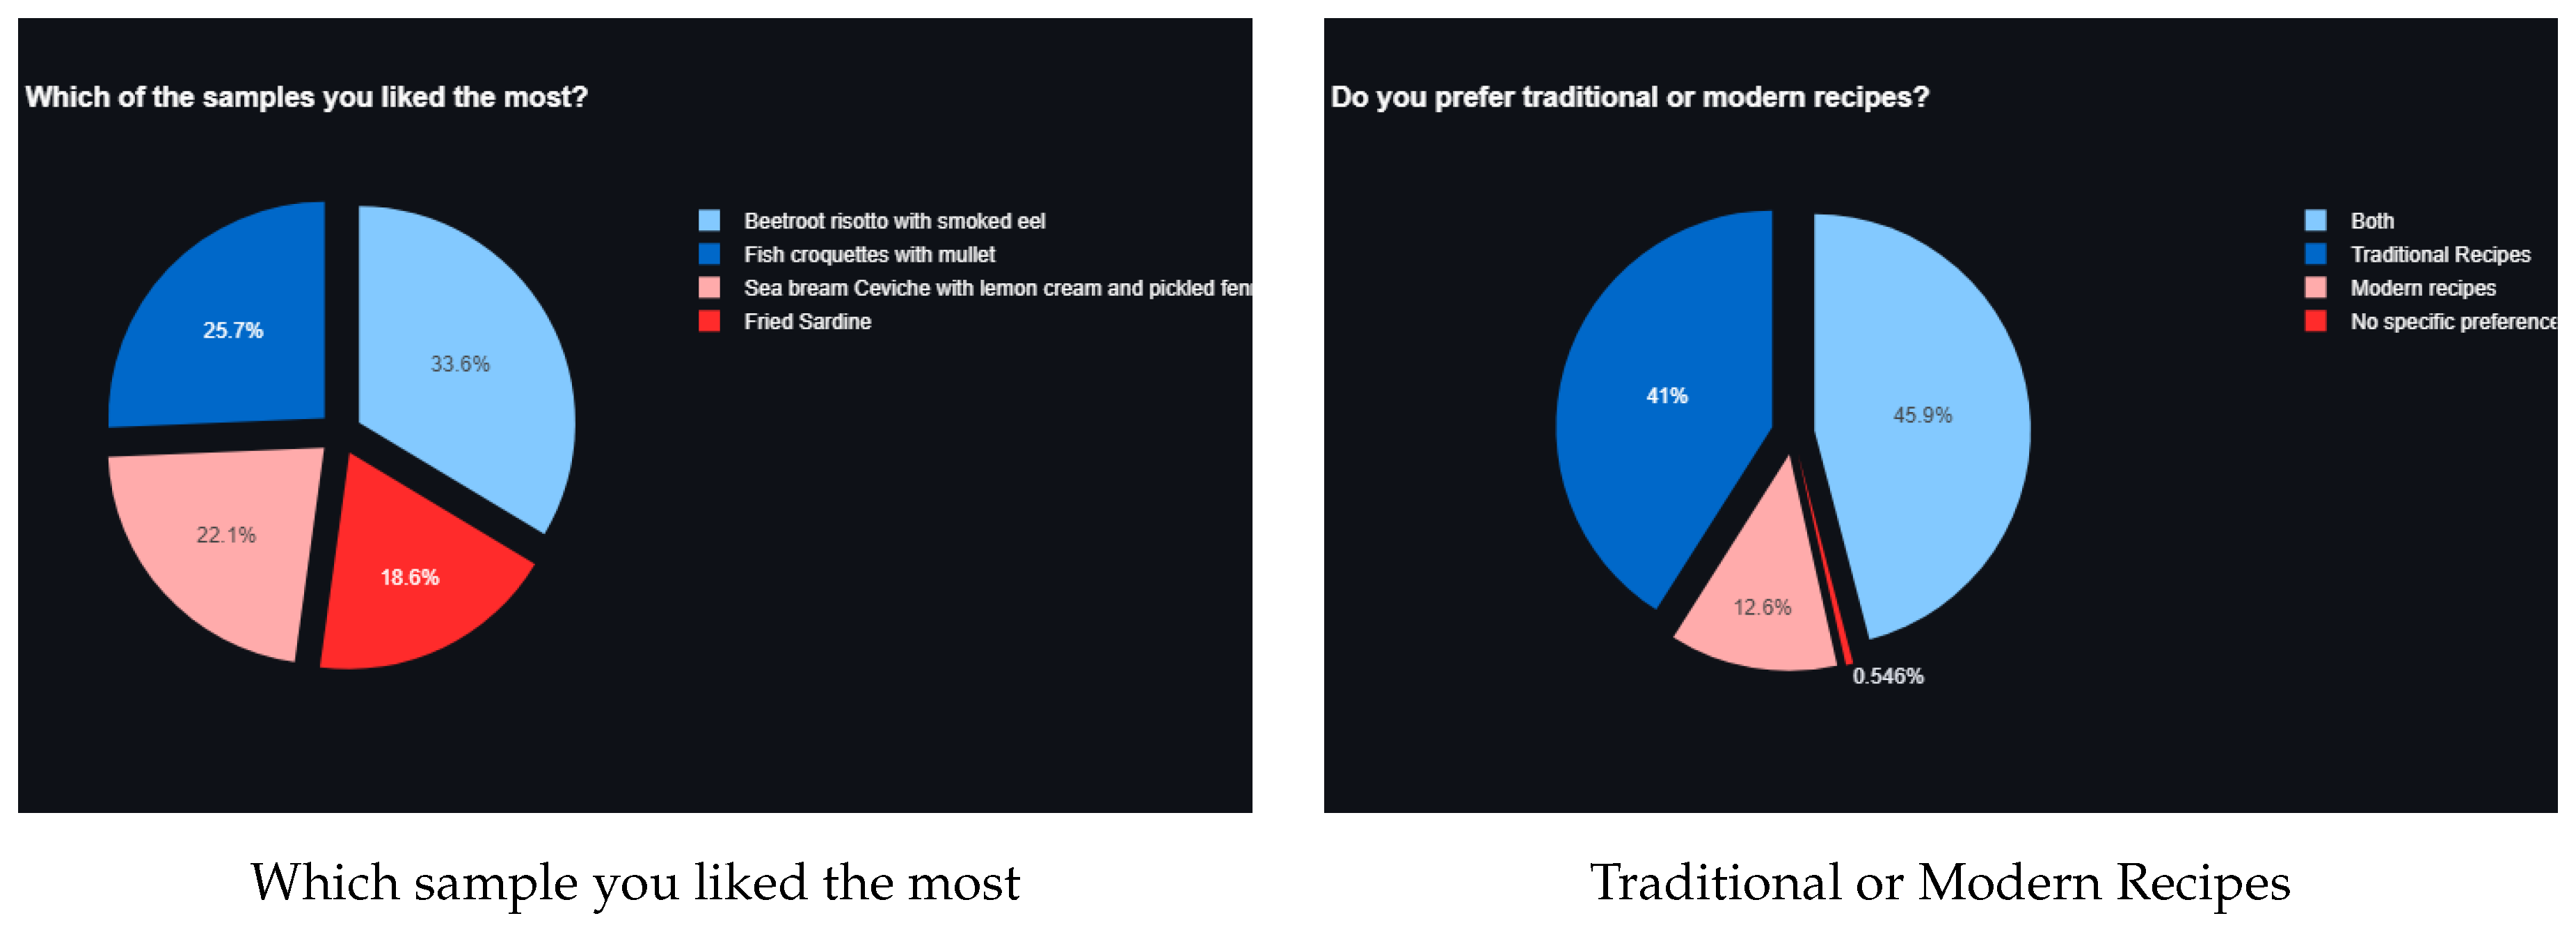
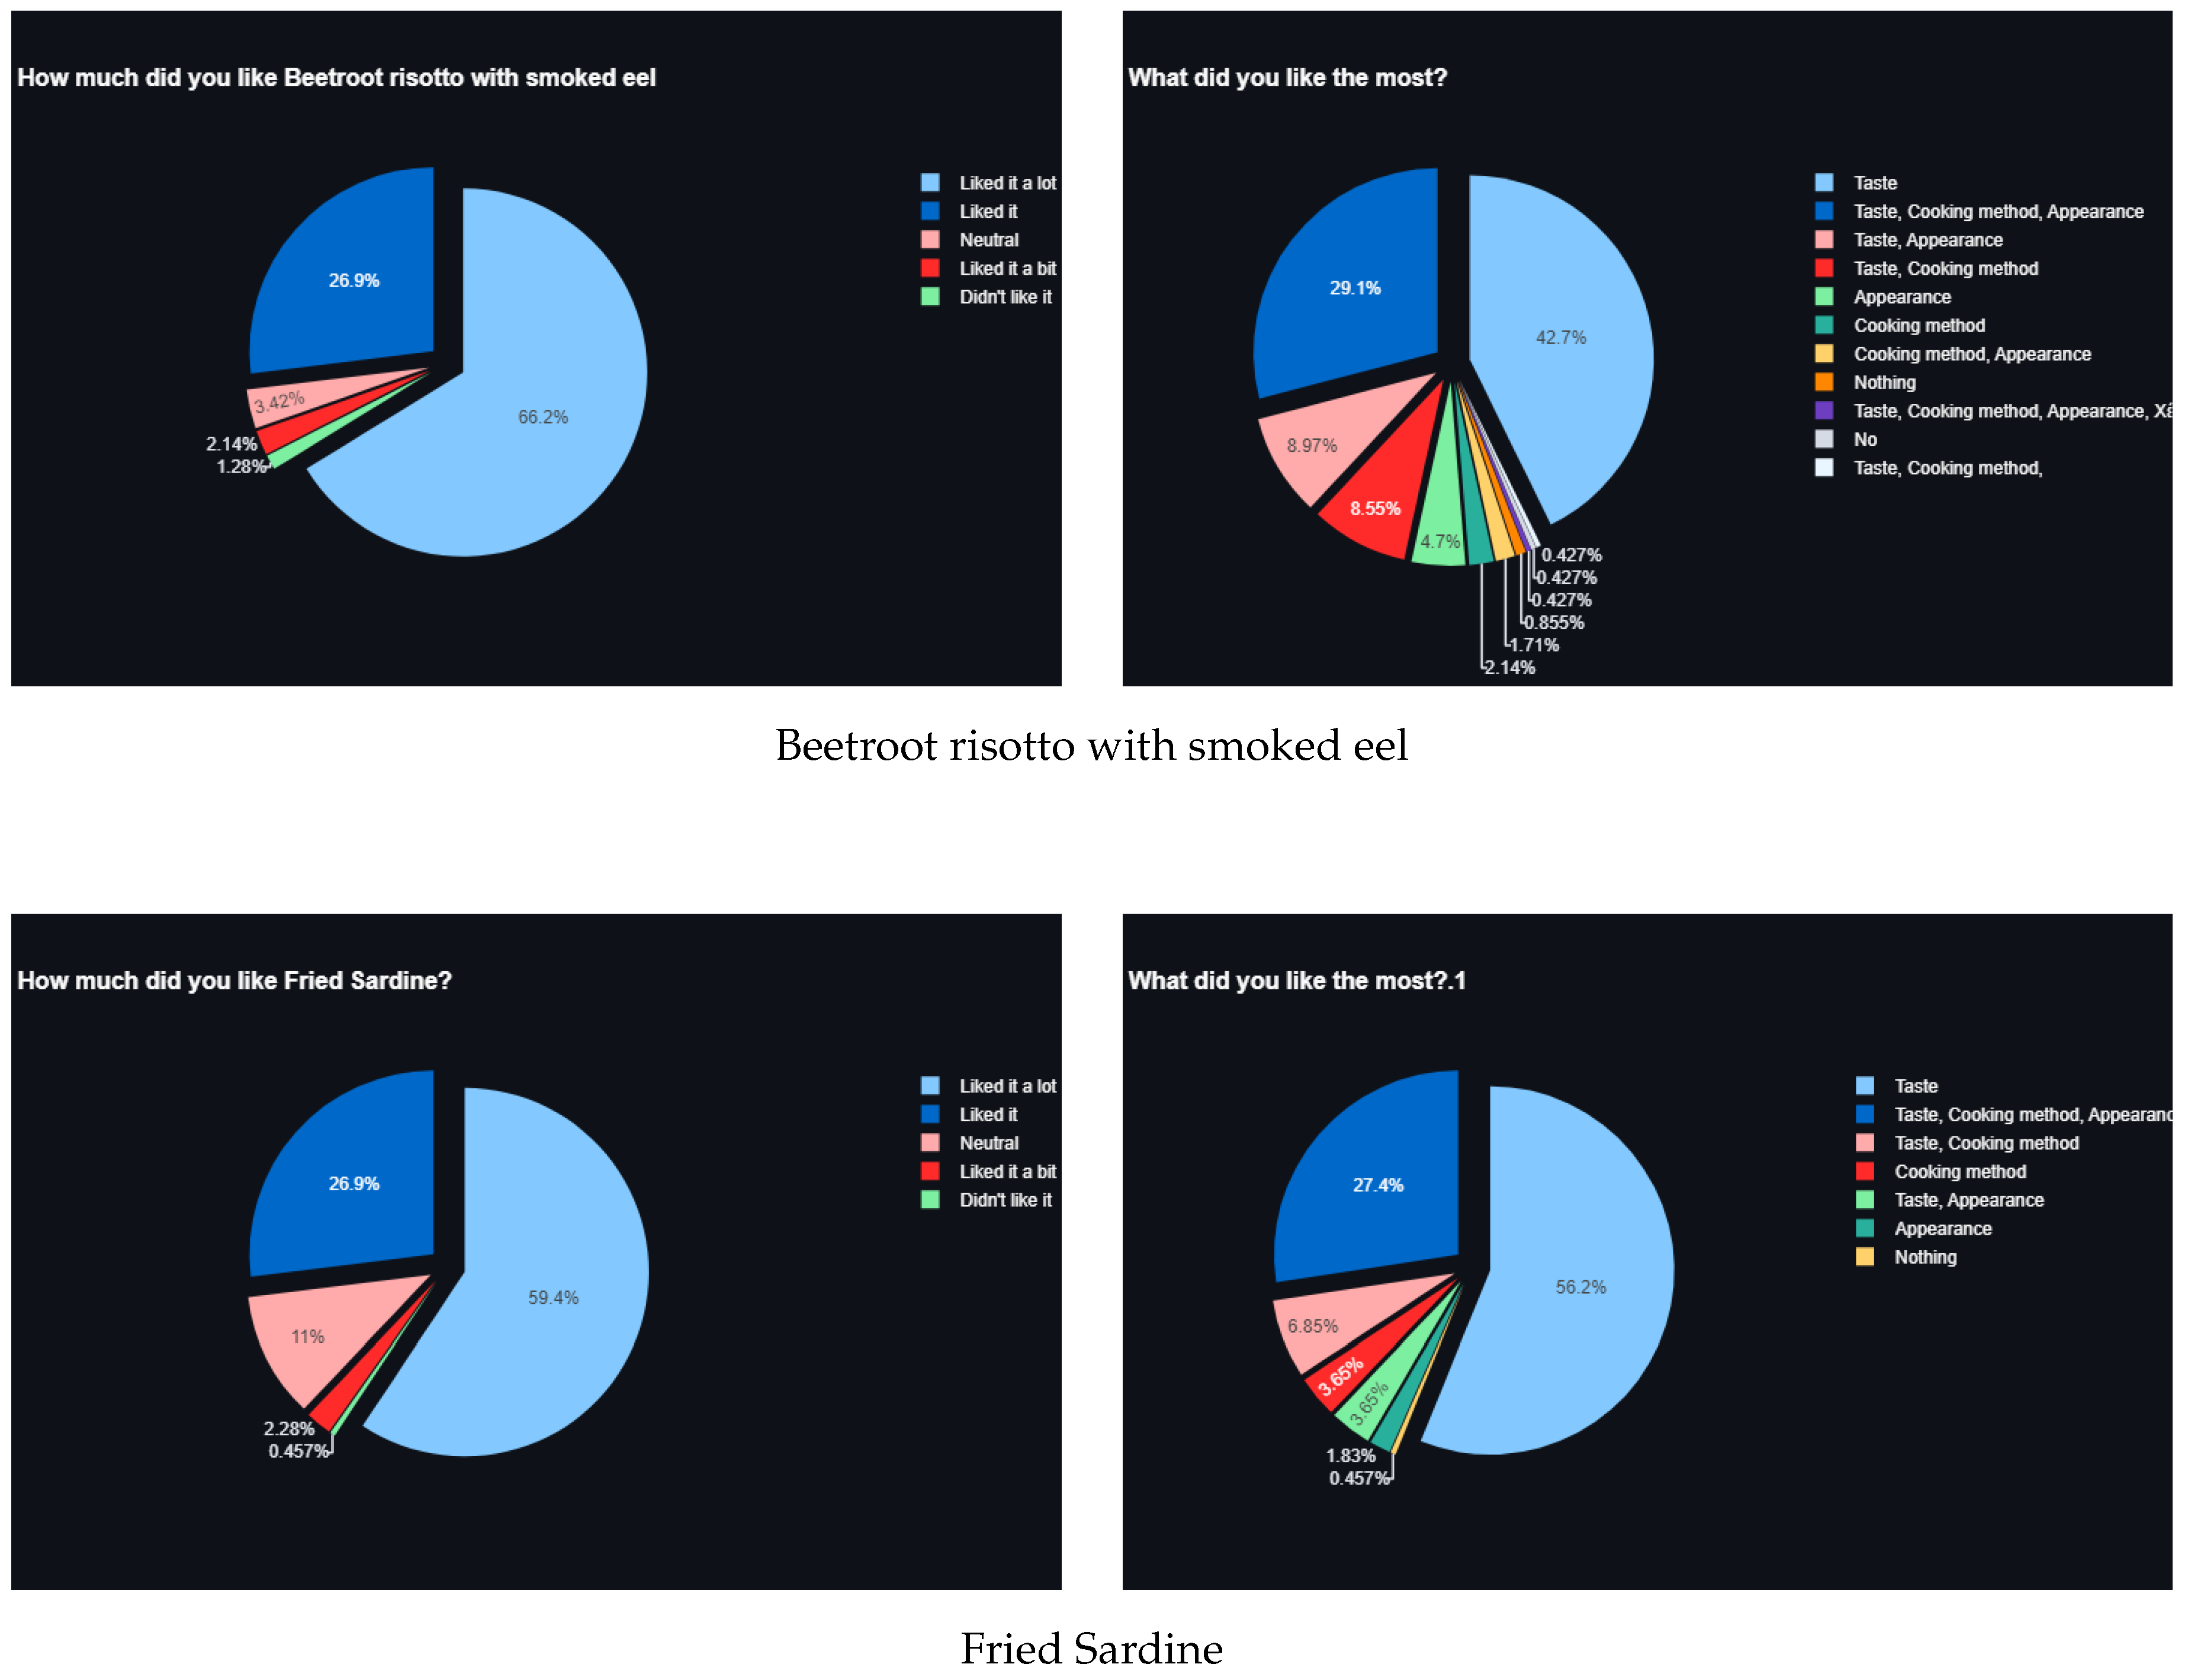
Figure 8.
Sample question results of the first survey.
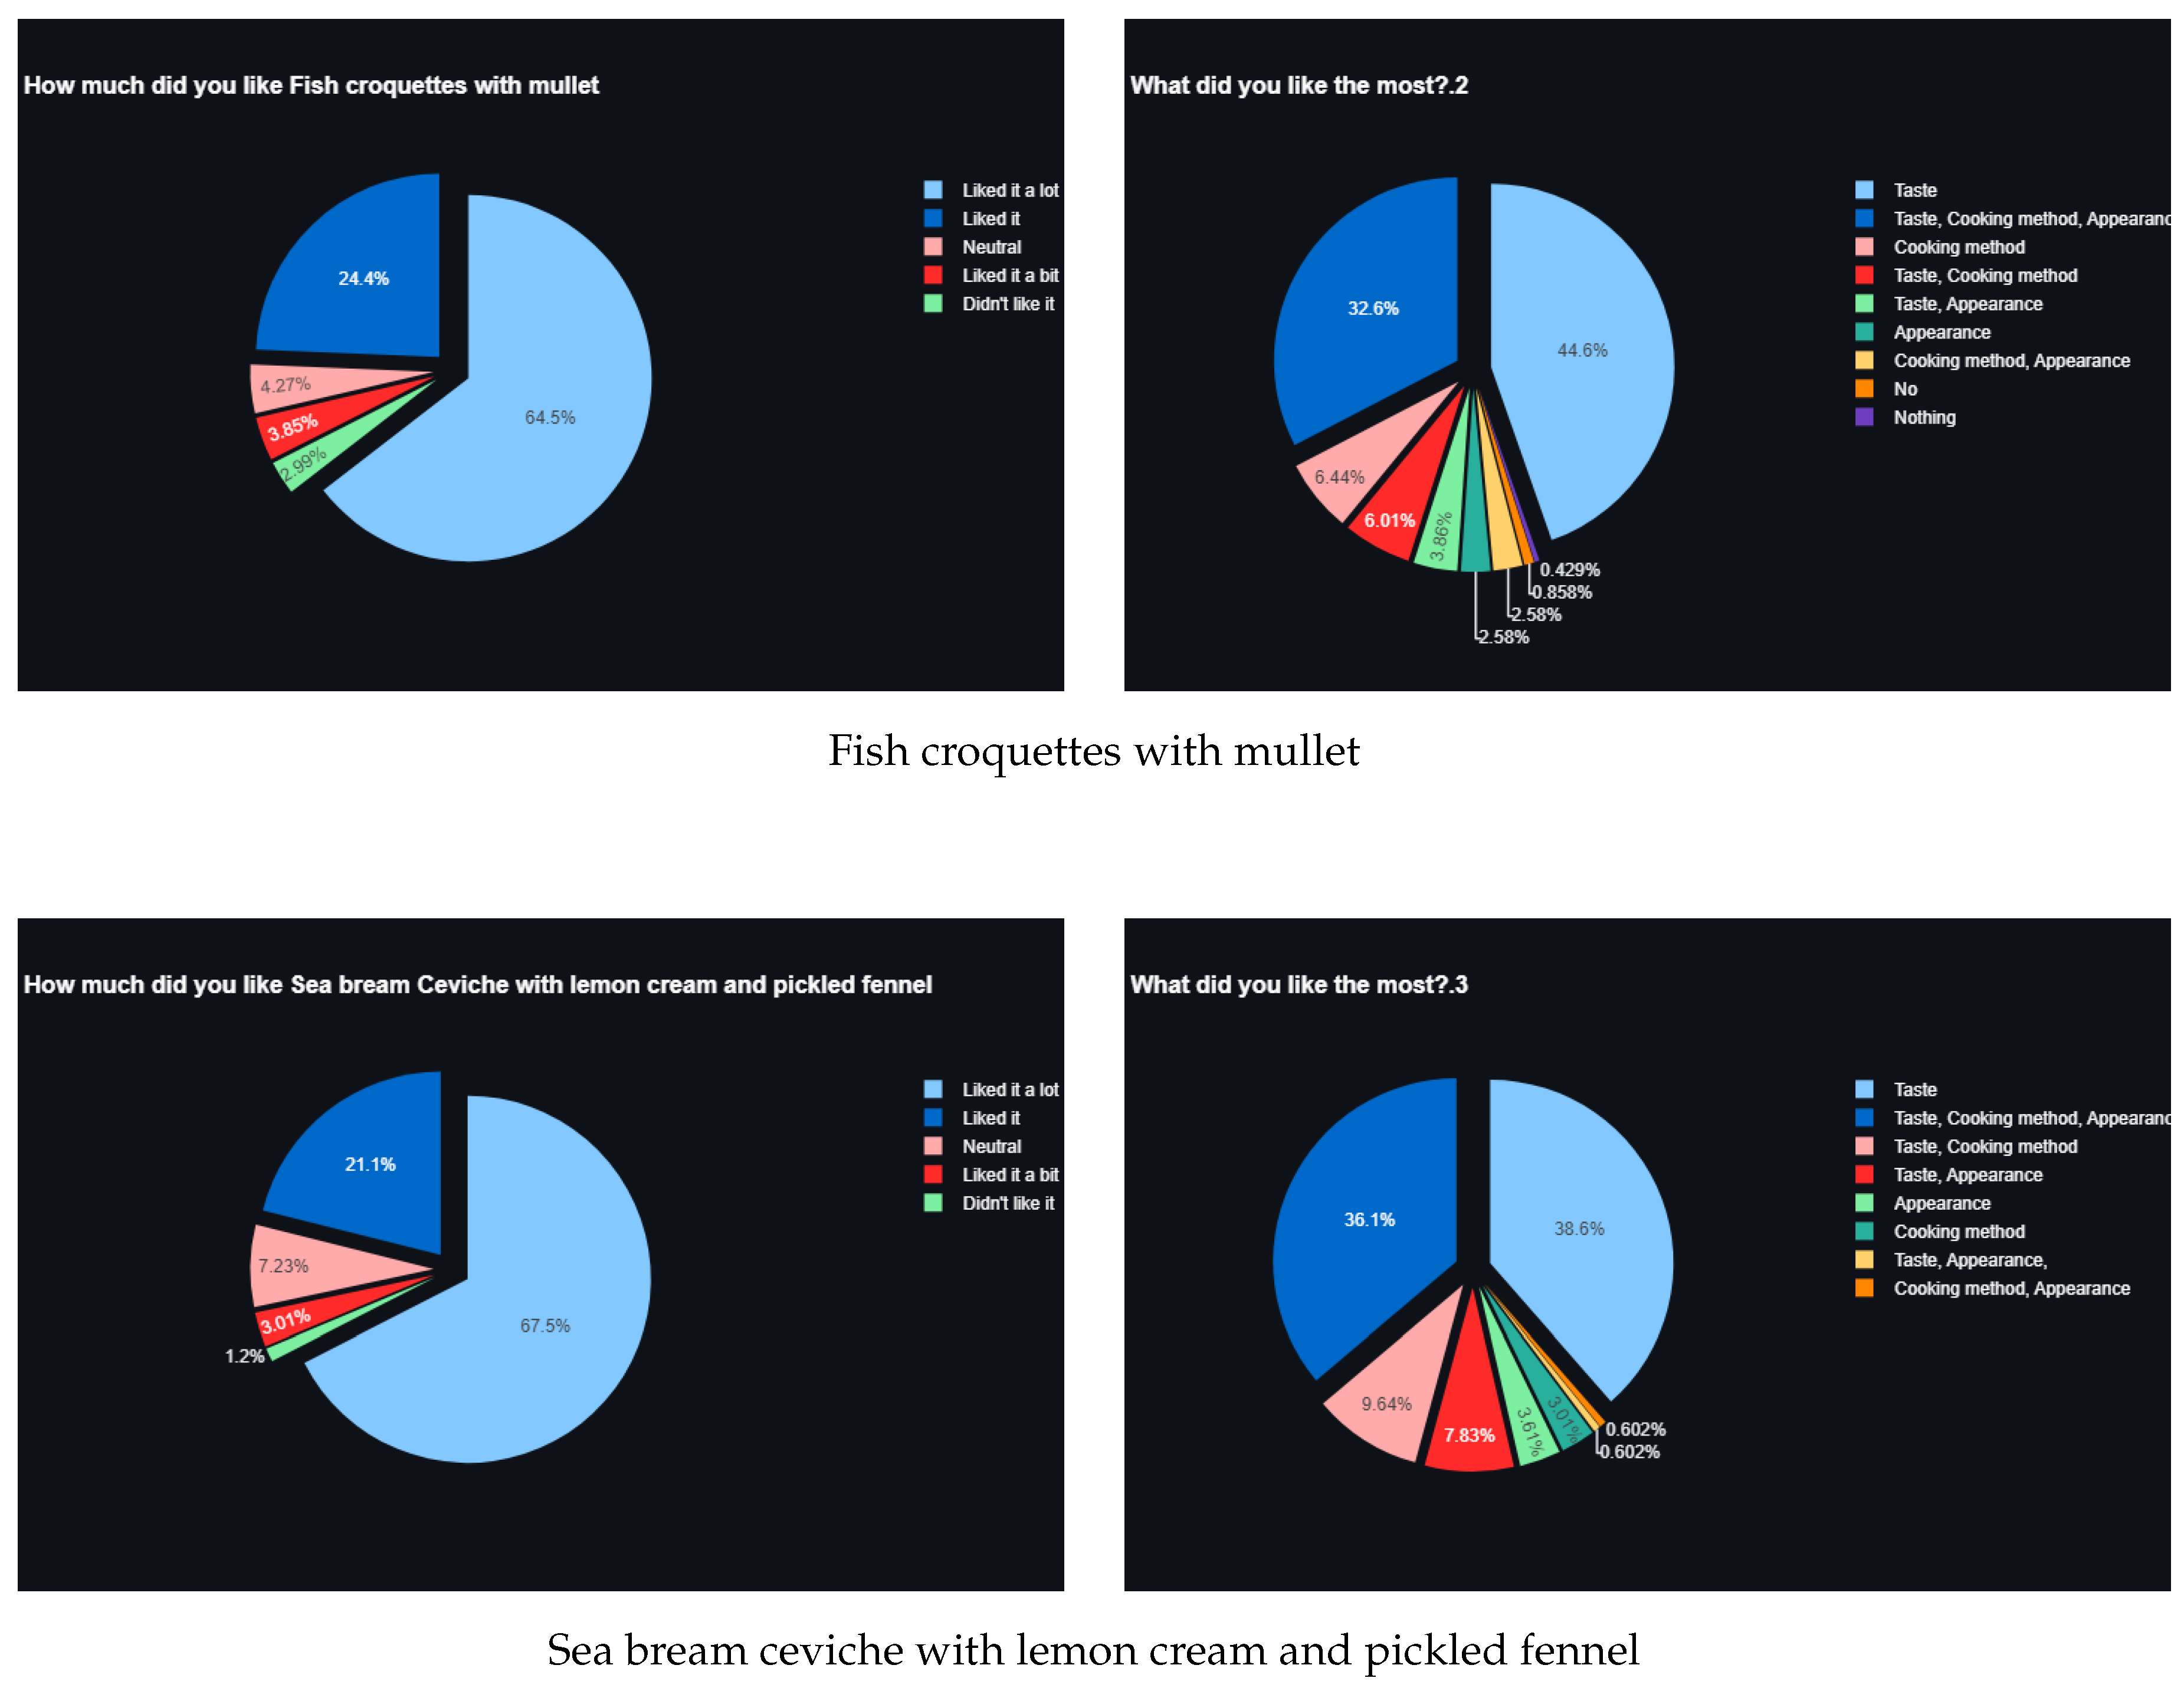
With this analysis we can observe the most liked product, including what they liked the most for that product. We can also observe the preferences of the mass by analyzing the data entries of the question "Do you like traditional or modern recipes?"
The data analysis results of the second survey are as follows.
Figure 9.
Demographic question results of the second survey.
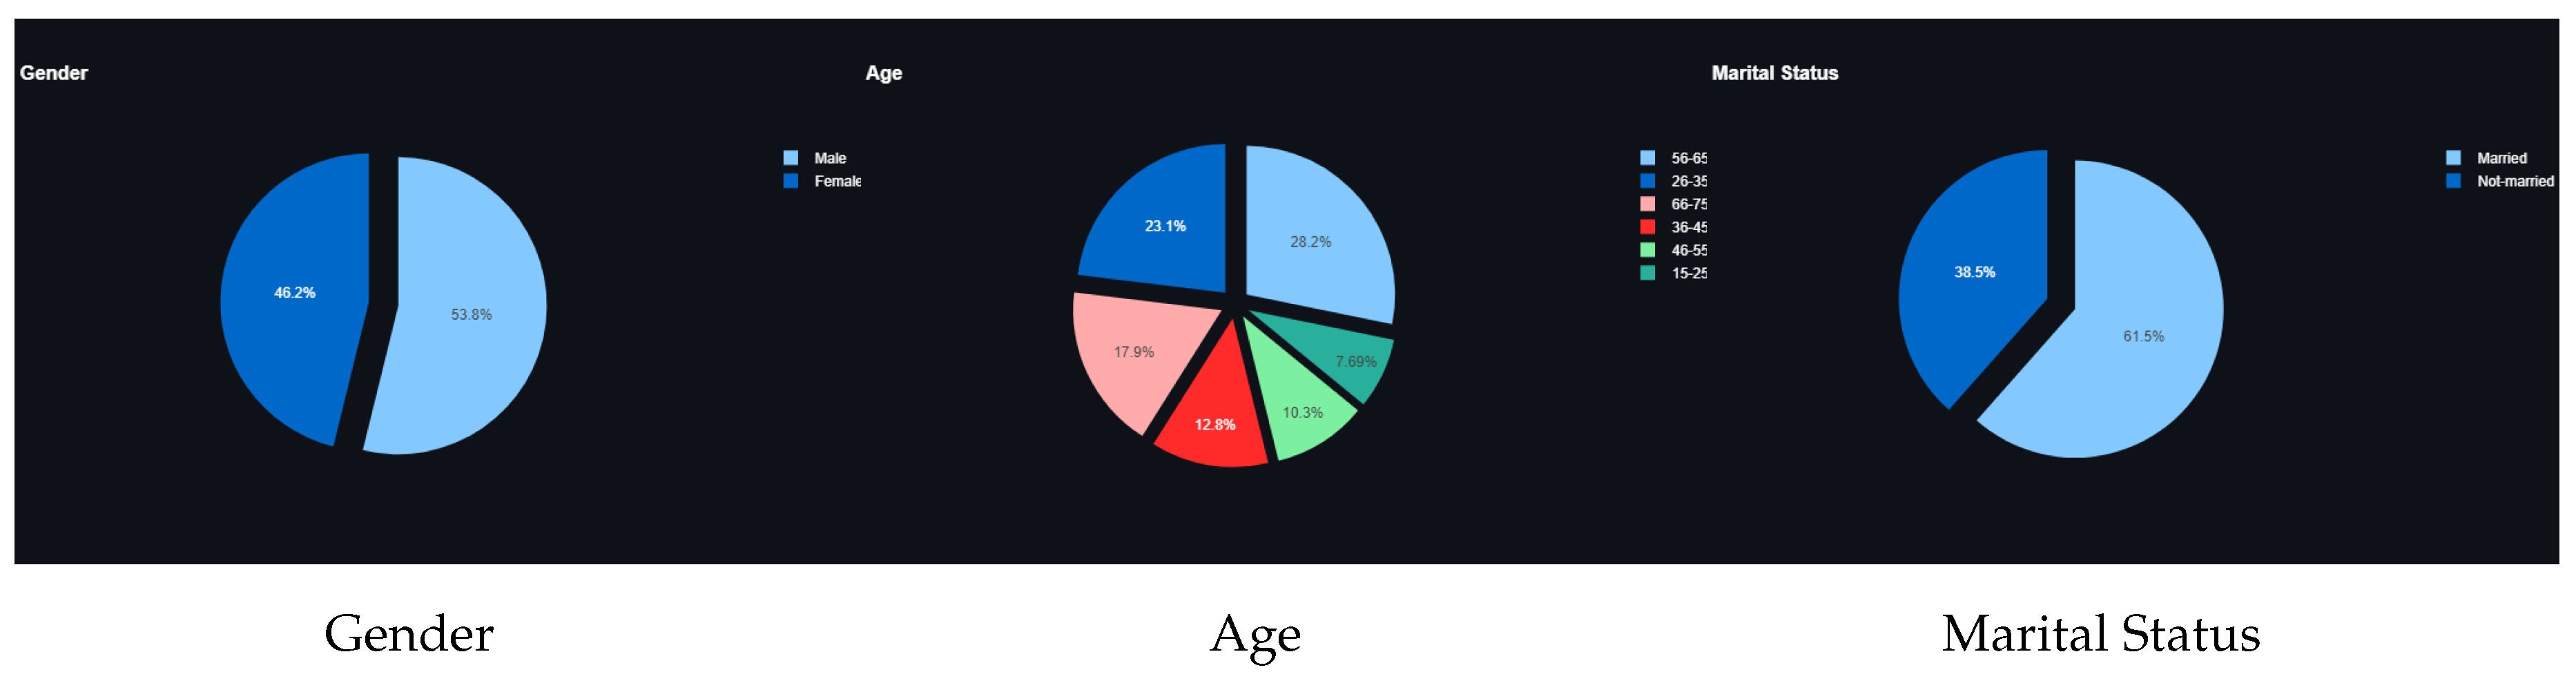
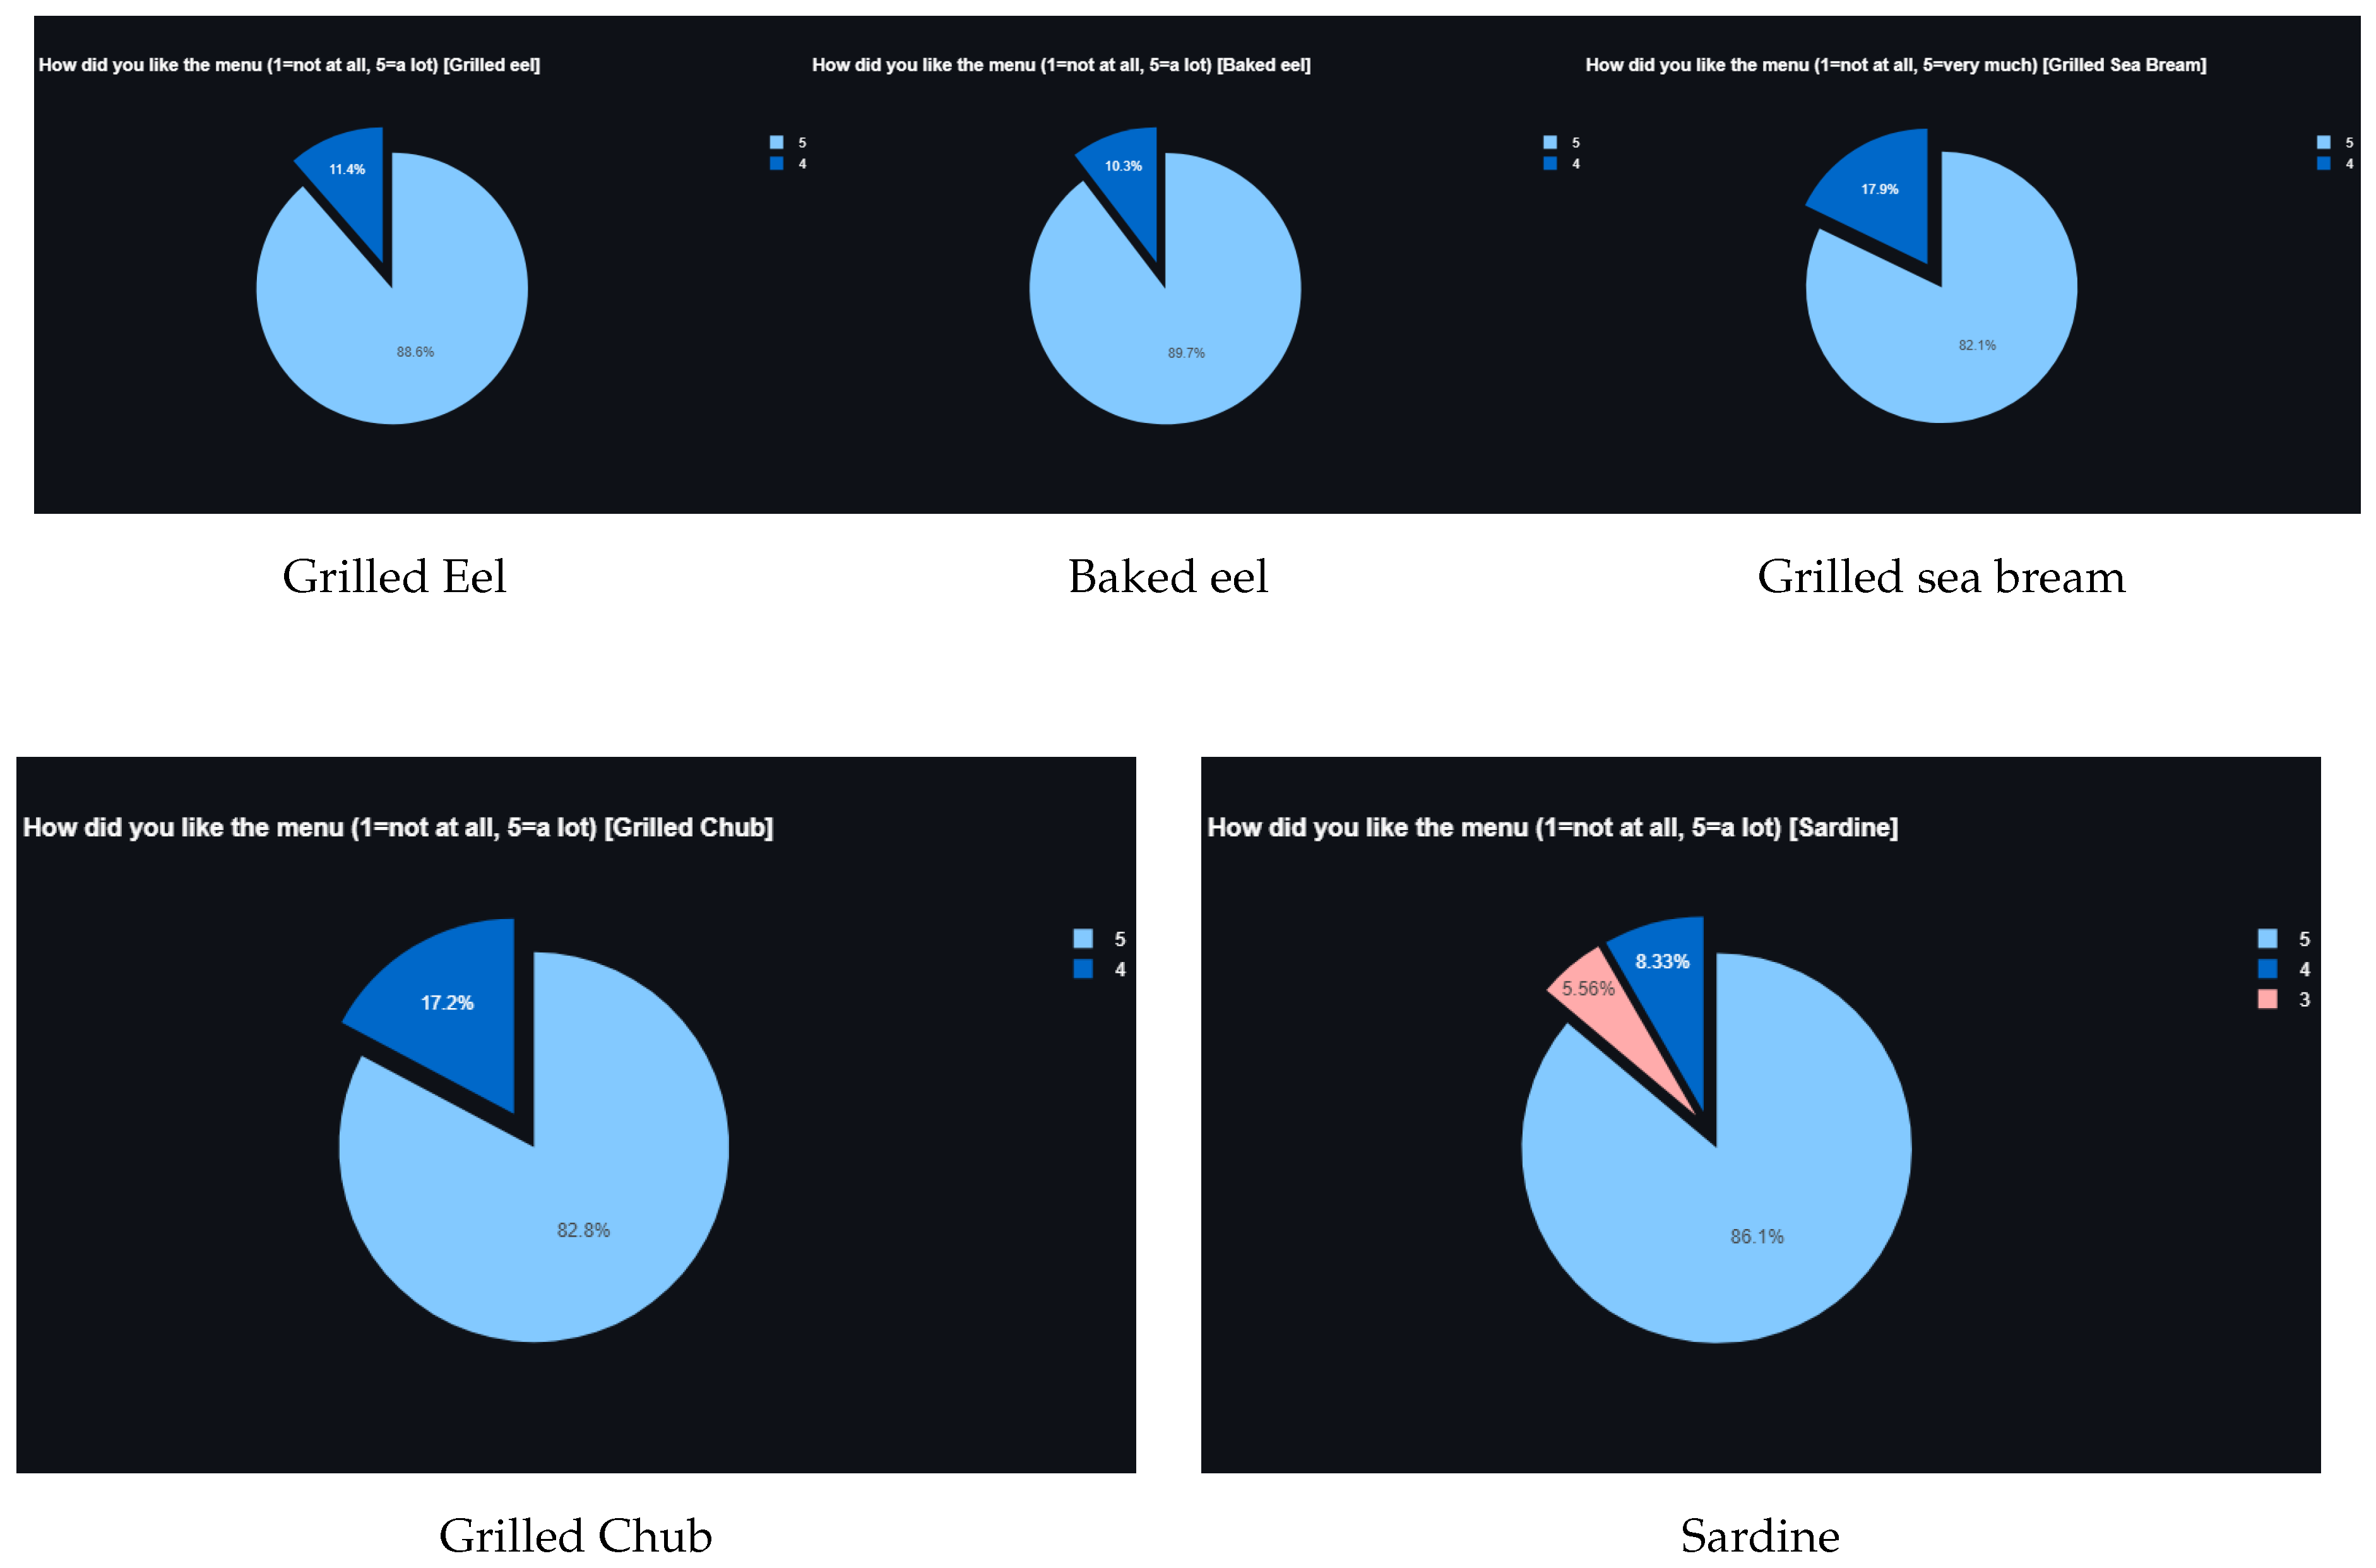
Figure 10.
Second survey sample question results.
5. Conclusions
AliAmbra focused on the promotion of the products produced by high-quality catches of the Amvrakikos Gulf, as a research team, we focused on a thorough analysis of the data retrieved from each exhibition. In addition, we developed a recommendation system to determine a person’s preferences for the products displayed in the exhibitions, based on their demographic data.
Each experiment focused on the production of different results. In our model-driven analysis, we found a strong correlation between each customer with their demographic data and preferences for each product, as we can observe in the previous plotted results Figure 5 and Figure 6. We determined that FC2 performed best compared to the rest of the models. In our data-driven analysis, we were able to observe the preferences of the mass for each individual question. We found that each analysis contributed to a different conclusion, in demand for the project.
Based on the analysis that was executed, it can be concluded that the best-fitting algorithm for the development of the project AliAmvra is FC2 [9]. FC2 performed best in both phases, where only the demographic data or all of the data, was used to recommend a customer a product they would consider.
In order to see more normalized data results in the model-driven analysis, we have determined to retrieve more data on the second survey
6. Future Work
To get more accurate results from our model-driven analysis, more data will need to be retrieved using the second survey with the demographic data. This can be achieved with future exhibitions that can take place with the AliAmvra project.
After our analysis, we have acknowledged that in order to improve the accuracy of our model-driven analysis, it is vital that we proceed to retrieve more data through the second survey. This can be accomplished by conducting future exhibitions as part of the AliAmvra project.
Institutional Review Board Statement
Not applicable.
Informed Consent Statement
Not applicable.
Data Availability Statement
Not applicable.
Conflicts of Interest
The authors declare no conflict of interest.
References
- Knowledge of Intelligent Computing Laboratory (KIC). AliAmvra. https://www.aliamvra.gr/en/aliamvra/, 2023.
- Misztal, A., Product improvement on the basis of data analysis concerning customer satisfaction; 2010; pp. 287–291.
- Alkerwi, A.; Vernier, C.; Sauvageot, N.; Crichton, G.E.; Elias, M.F. Demographic and socioeconomic disparity in nutrition: application of a novel Correlated Component Regression approach. BMJ Open 2015, 5. [Google Scholar] [CrossRef] [PubMed]
- Mishan, M.; Amir, A.L.; Supir, M.; Kushan, A.; Zulkifli, N.; Rahmat, M. Integrating Business Intelligence and Recommendation Marketplace System for Hawker Using Content Based Filtering. 2023, pp. 200–205. [CrossRef]
- Nawi, N.M.; Ransing, M.R.; Ransing, R.S. An Improved Learning Algorithm Based on The Broyden-Fletcher-Goldfarb-Shanno (BFGS) Method For Back Propagation Neural Networks 2006. 1, 152–157. [CrossRef]
- Pushpa, C.N.; Patil, A.; Thriveni, J.; Venugopal, K.R.; Patnaik, L.M. Web page recommendations using Radial Basis Neural Network technique. 2013 IEEE 8th International Conference on Industrial and Information Systems, 2013, pp. 501–506. [CrossRef]
- Tsoulos, I.G. Creating classification rules using grammatical evolution. International Journal of Computational Intelligence Studies 2020, 9, 161–171. [Google Scholar] [CrossRef]
- Tsoulos, I.; Gavrilis, D.; Glavas, E. Neural network construction and training using grammatical evolution. Neurocomputing 2008, 72, 269–277, Machine Learning for Signal Processing (MLSP 2006) / Life System 28 Modelling, Simulation, and Bio-inspired Computing (LSMS 2007). [Google Scholar] [CrossRef]
- Gavrilis, D.; Tsoulos, I.G.; Dermatas, E. Selecting and constructing features using grammatical evolution. Pattern Recognition Letters 2008, 29, 1358–1365. [Google Scholar] [CrossRef]
- Zhou, L.; Zhang, C.; Liu, F.; Qiu, Z.; He, Y. Application of Deep Learning in Food: A Review. Comprehensive Reviews in Food Science and Food Safety 2019, 18, 1793–1811, [https://ift.onlinelibrary.wiley.com/doi/pdf/10.1111/1541-4337.12492]. [Google Scholar] [CrossRef] [PubMed]
- Przybył, K.; Gawrysiak-Witulska, M.; Bielska, P.; Rusinek, R.; Gancarz, M.; Dobrzański, B.; Siger, A. Application of Machine Learning to Assess the Quality of Food Products;Case Study: Coffee Bean. Applied Sciences 2023, 13. [Google Scholar] [CrossRef]
- Vorage, L.; Wiseman, N.; Graca, J.; Harris, N. The Association of Demographic Characteristics and Food Choice Motives with the Consumption of Functional Foods in Emerging Adults. Nutrients 2020, 12. [Google Scholar] [CrossRef]
- Anwar, H.; Anwar, T.; Murtaza, S. Review on food quality assessment using machine learning and electronic nose system. Biosensors and Bioelectronics: X 2023, 14, 100365. [Google Scholar] [CrossRef]
- IZSTO.; Ru, G.; Crescio, M.; Ingravalle, F.; Maurella, C.; UBESP.; Gregori, D.; Lanera, C.; Azzolina, D.; Lorenzoni, G.; Soriani, N.; Zec, S.; DSCB.; Berchialla, P.; Mercadante, S.; ZETA.; Zobec, F.; Ghidina, M.; Baldas, S.; Bonifacio, B.; Kinkopf, A.; Kozina, D.; Nicolandi, L.; Rosat, L. Machine Learning Techniques applied in risk assessment related to food safety. EFSA Supporting Publications 2017, 14, 1254E, [https://efsa.onlinelibrary.wiley.com/doi/pdf/10.2903/sp.efsa.2017.EN-1254]. [CrossRef]
- Deng, X.; Cao, S.; Horn, A.L. Emerging Applications of Machine Learning in Food Safety. Annual Review of Food Science and Technology 2021, 12, 513–538. [Google Scholar] [CrossRef] [PubMed]
- Liu, X.; Ichise, R. Food Sales Prediction with Meteorological Data — A Case Study of a Japanese Chain Supermarket. Data Mining and Big Data; Tan, Y., Takagi, H., Shi, Y., Eds.; Springer International Publishing: Cham, 2017; pp. 93–104. [Google Scholar]
- Tsoumakas, G. A survey of machine learning techniques for food sales prediction. Artificial Intelligence Review 2019, 52, 441–447. [Google Scholar] [CrossRef]
- Jiménez-Carvelo, A.M.; González-Casado, A.; Bagur-González, M.G.; Cuadros-Rodríguez, L. Alternative data mining/machine learning methods for the analytical evaluation of food quality and authenticity – A review. Food Research International 2019, 122, 25–39. [Google Scholar] [CrossRef]
- Han, J.; Li, T.; He, Y.; Gao, Q.; others. Using Machine Learning Approaches for Food Quality Detection. Mathematical Problems in Engineering 2022, 2022.
- Sood, S.; Singh, H. Computer vision and machine learning based approaches for food security: A review. Multimedia Tools and Applications 2021, 80, 27973–27999. [Google Scholar] [CrossRef]
- Zhou, Y.; Lentz, E.; Michelson, H.; Kim, C.; Baylis, K. Machine learning for food security: Principles for transparency and usability. Applied Economic Perspectives and Policy 2022, 44, 893–910, [https://onlinelibrary.wiley.com/doi/pdf/10.1002/aepp.13214]. [Google Scholar] [CrossRef]
- O’Neill, M.; Ryan, C. Grammatical Evolution. IEEE Transactions on Evolutionary Computation 2001, 5, 349–358. [Google Scholar] [CrossRef]
- Holland, J.H. Genetic algorithms. Scientific american 1992, 267, 66–73. [Google Scholar] [CrossRef]
- Goldberg, D.E. Cenetic Algorithms in Search. Optimization, Machine Learning 1989.
- Michalewicz, Z. Genetic Algorithms+ Data Structures= Evolution Programs. Springer-Verlag, 1999. Google Scholar Google Scholar Digital Library Digital Library 1999.
- Haupt, R.L. An introduction to genetic algorithms for electromagnetics. IEEE Antennas and Propagation Magazine 1995, 37, 7–15. [Google Scholar] [CrossRef]
- Grefenstette, J.; Gopal, R.; Rosmaita, B.; Van Gucht, D. Genetic algorithms for the traveling salesman problem. Proceedings of the first International Conference on Genetic Algorithms and their Applications. Psychology Press, 2014, pp. 160–168.
- Savic, D.A.; Walters, G.A. Genetic algorithms for least-cost design of water distribution networks. Journal of water resources planning and management 1997, 123, 67–77. [Google Scholar] [CrossRef]
- Leung, F.H.F.; Lam, H.K.; Ling, S.H.; Tam, P.K.S. Tuning of the structure and parameters of a neural network using an improved genetic algorithm. IEEE Transactions on Neural networks 2003, 14, 79–88. [Google Scholar] [CrossRef]
- Sedki, A.; Ouazar, D.; El Mazoudi, E. Evolving neural network using real coded genetic algorithm for daily rainfall–runoff forecasting. Expert systems with applications 2009, 36, 4523–4527. [Google Scholar] [CrossRef]
- Cantú-Paz, E.; Goldberg, D.E. Efficient parallel genetic algorithms: theory and practice. Computer Methods in Applied Mechanics and Engineering 2000, 186, 221–238. [Google Scholar] [CrossRef]
- Liu, Y.Y.; Wang, S. A scalable parallel genetic algorithm for the generalized assignment problem. Parallel computing 2015, 46, 98–119. [Google Scholar] [CrossRef]
- Graham, R.L.; Shipman, G.M.; Barrett, B.W.; Castain, R.H.; Bosilca, G.; Lumsdaine, A. Open MPI: A high-performance, heterogeneous MPI. 2006 IEEE International Conference on Cluster Computing. IEEE, 2006, pp. 1–9.
- Dagum, L.; Menon, R. OpenMP: an industry standard API for shared-memory programming. IEEE computational science and engineering 1998, 5, 46–55. [Google Scholar] [CrossRef]
- Backus, J.W. The syntax and semantics of the proposed international algebraic language of the Zurich ACM-GAMM Conference. IFIP Congress, 1959.
- Ryan, C.; Collins, J.; Neill, M.O. Grammatical evolution: Evolving programs for an arbitrary language. Genetic Programming; Banzhaf, W., Poli, R., Schoenauer, M., Fogarty, T.C., Eds.; Springer Berlin Heidelberg: Berlin, Heidelberg, 1998; pp. 83–96. [Google Scholar]
- O’Neill, M.; Ryan, C. Evolving Multi-line Compilable C Programs. Genetic Programming; Poli, R., Nordin, P., Langdon, W.B., Fogarty, T.C., Eds.; Springer Berlin Heidelberg: Berlin, Heidelberg, 1999; pp. 83–92. [Google Scholar]
- Ryan, C.; O’Neill, M.; Collins, J.J. Grammatical Evolution: Solving Trigonometric Identities. In proceedings of Mendel 1998: 4th International Mendel Conference on Genetic Algorithms, Optimisation Problems, Fuzzy Logic, Neural Networks, Rough Sets; Technical University of Brno, Faculty of Mechanical Engineering: Brno, Czech Republic, 1998; pp. 111–119.
- Ortega, A.; Alfonso, R.S.; Alfonseca, M. Automatic composition of music by means of grammatical evolution. APL Conference, 2002.
- de Campos, L.M.L.; de Oliveira, R.C.L.; Roisenberg, M. Optimization of neural networks through grammatical evolution and a genetic algorithm. Expert Systems with Applications 2016, 56, 368–384. [Google Scholar] [CrossRef]
- Soltanian, K.; Ebnenasir, A.; Afsharchi, M. Modular Grammatical Evolution for the Generation of Artificial Neural Networks. Evolutionary Computation 2022, p. 291–327. [CrossRef]
- Dempsey, I.; O’Neill, M.; Brabazon, A. Constant Creation in Grammatical Evolution. International Journal of Innovative Computing and Applications 2007, 1, 23–38. [Google Scholar] [CrossRef]
- Galván-López, E.; Swafford, J.M.; O’Neill, M.; Brabazon, A. Evolving a Ms. PacMan Controller Using Grammatical Evolution. Applications of Evolutionary Computation; Di Chio, C., Cagnoni, S., Cotta, C., Ebner, M., Ekárt, A., Esparcia-Alcazar, A.I., Goh, C.K., Merelo, J.J., Neri, F., Preuß, M., Togelius, J., Yannakakis, G.N., Eds.; Springer Berlin Heidelberg: Berlin, Heidelberg, 2010; pp. 161–170. [Google Scholar]
- Shaker, N.; Nicolau, M.; Yannakakis, G.N.; Togelius, J.; O’Neill, M. Evolving levels for Super Mario Bros using grammatical evolution. 2012 IEEE Conference on Computational Intelligence and Games (CIG), 2012, pp. 304–311. [CrossRef]
- Martínez-Rodríguez, D.; Colmenar, J.M.; Hidalgo, J.I.; Villanueva Micó, R.J.; Salcedo-Sanz, S. Particle swarm grammatical evolution for energy demand estimation. Energy Science and Engineering 2020, 8, 1068–1079. [Google Scholar] [CrossRef]
- Sabar, N.R.; Ayob, M.; Kendall, G.; Qu, R. Grammatical Evolution Hyper-Heuristic for Combinatorial Optimization Problems. IEEE Transactions on Evolutionary Computation 2013, 17, 840–861. [Google Scholar] [CrossRef]
- Ryan, C.; Kshirsagar, M.; Vaidya, G.; Cunningham, A.; Sivaraman, R. Design of a cryptographically secure pseudo-random number generator with grammatical evolution. Scientific Reports 2022, 12, 8602. [Google Scholar] [CrossRef] [PubMed]
- Lourenço, N.; Pereira, F.B.; Costa, E. Unveiling the properties of structured grammatical evolution. Genetic Programming and Evolvable Machines 2016, 17, 251–289. [Google Scholar] [CrossRef]
- Lourenço, N.; Assunção, F.; Pereira, F.B.; Costa, E.; Machado, P., Structured Grammatical Evolution: A Dynamic Approach. In Handbook of Grammatical Evolution; Ryan, C.; O’Neill, M.; Collins, J., Eds.; Springer International Publishing: Cham, 2018; pp. 137–161. [CrossRef]
- Russo, I.L.; Bernardino, H.S.; Barbosa, H.J. A massively parallel Grammatical Evolution technique with OpenCL. Journal of Parallel and Distributed Computing 2017, 109, 333–349. [Google Scholar] [CrossRef]
- Dufek, A.S.; Augusto, D.A.; Barbosa, H.J.C.; da Silva Dias, P.L., Multi- and Many-Threaded Heterogeneous Parallel Grammatical Evolution. In Handbook of Grammatical Evolution; Ryan, C.; O’Neill, M.; Collins, J., Eds.; Springer International Publishing: Cham, 2018; pp. 219–244. [CrossRef]
- Mégane, J.; Lourenço, N.; Machado, P. Probabilistic Grammatical Evolution. Genetic Programming; Hu, T., Lourenço, N., Medvet, E., Eds.; Springer International Publishing: Cham, 2021; pp. 198–213. [Google Scholar]
- Pereira, P.J.; Cortez, P.; Mendes, R. Multi-objective Grammatical Evolution of Decision Trees for Mobile Marketing user conversion prediction. Expert Systems with Applications 2021, 168, 114287. [Google Scholar] [CrossRef]
- Anastasopoulos, N.; Tsoulos, I.G.; Tzallas, A. GenClass: A parallel tool for data classification based on Grammatical Evolution. SoftwareX 2021, 16, 100830. [Google Scholar] [CrossRef]
- MacQueen, J.; others. Some methods for classification and analysis of multivariate observations. Proceedings of the fifth Berkeley symposium on mathematical statistics and probability. Oakland, CA, USA, 1967, Vol. 1, pp. 281–297.
- Teng, P. Machine-learning quantum mechanics: Solving quantum mechanics problems using radial basis function networks. Physical Review E 2018, 98, 033305. [Google Scholar] [CrossRef]
- Jovanović, R.Ž.; Sretenović, A.A. Ensemble of radial basis neural networks with k-means clustering for heating energy consumption prediction. FME Transactions 2017, 45, 51–57. [Google Scholar] [CrossRef]
- Mai-Duy, N. Solving high order ordinary differential equations with radial basis function networks. International Journal for Numerical Methods in Engineering 2005, 62, 824–852. [Google Scholar] [CrossRef]
- Sarra, S.A. Adaptive radial basis function methods for time dependent partial differential equations. Applied Numerical Mathematics 2005, 54, 79–94. [Google Scholar] [CrossRef]
- Vijay, M.; Jena, D. Backstepping terminal sliding mode control of robot manipulator using radial basis functional neural networks. Computers & Electrical Engineering 2018, 67, 690–707. [Google Scholar]
- Shankar, V.; Wright, G.B.; Fogelson, A.L.; Kirby, R.M. A radial basis function (RBF) finite difference method for the simulation of reaction–diffusion equations on stationary platelets within the augmented forcing method. International Journal for Numerical Methods in Fluids 2014, 75, 1–22. [Google Scholar] [CrossRef]
- Streamlit • A faster way to build and share data apps.
- Inc., P.T. Collaborative data science 2015.
- Waskom, M.L. seaborn: statistical data visualization. Journal of Open Source Software 2021, 6, 3021. [Google Scholar] [CrossRef]
- Tsoulos, I.G. QFC: A Parallel Software Tool for Feature Construction, Based on Grammatical Evolution. Algorithms 2022, 15. [Google Scholar] [CrossRef]
- Murtagh, F. Multilayer perceptrons for classification and regression. Neurocomputing 1991, 2, 183–197. [Google Scholar] [CrossRef]
- Powell, M. A tolerant algorithm for linearly constrained optimization calculations. Mathematical Programming 1989, 45, 547–566. [Google Scholar] [CrossRef]
Figure 2.
An example BNF grammar, used to produce expressions in a C - like programming language. The numbers in parentheses denote the sequence number of the corresponding production rule to be used in the selection procedure described above. The variable N denotes the dimensionality of the problem.
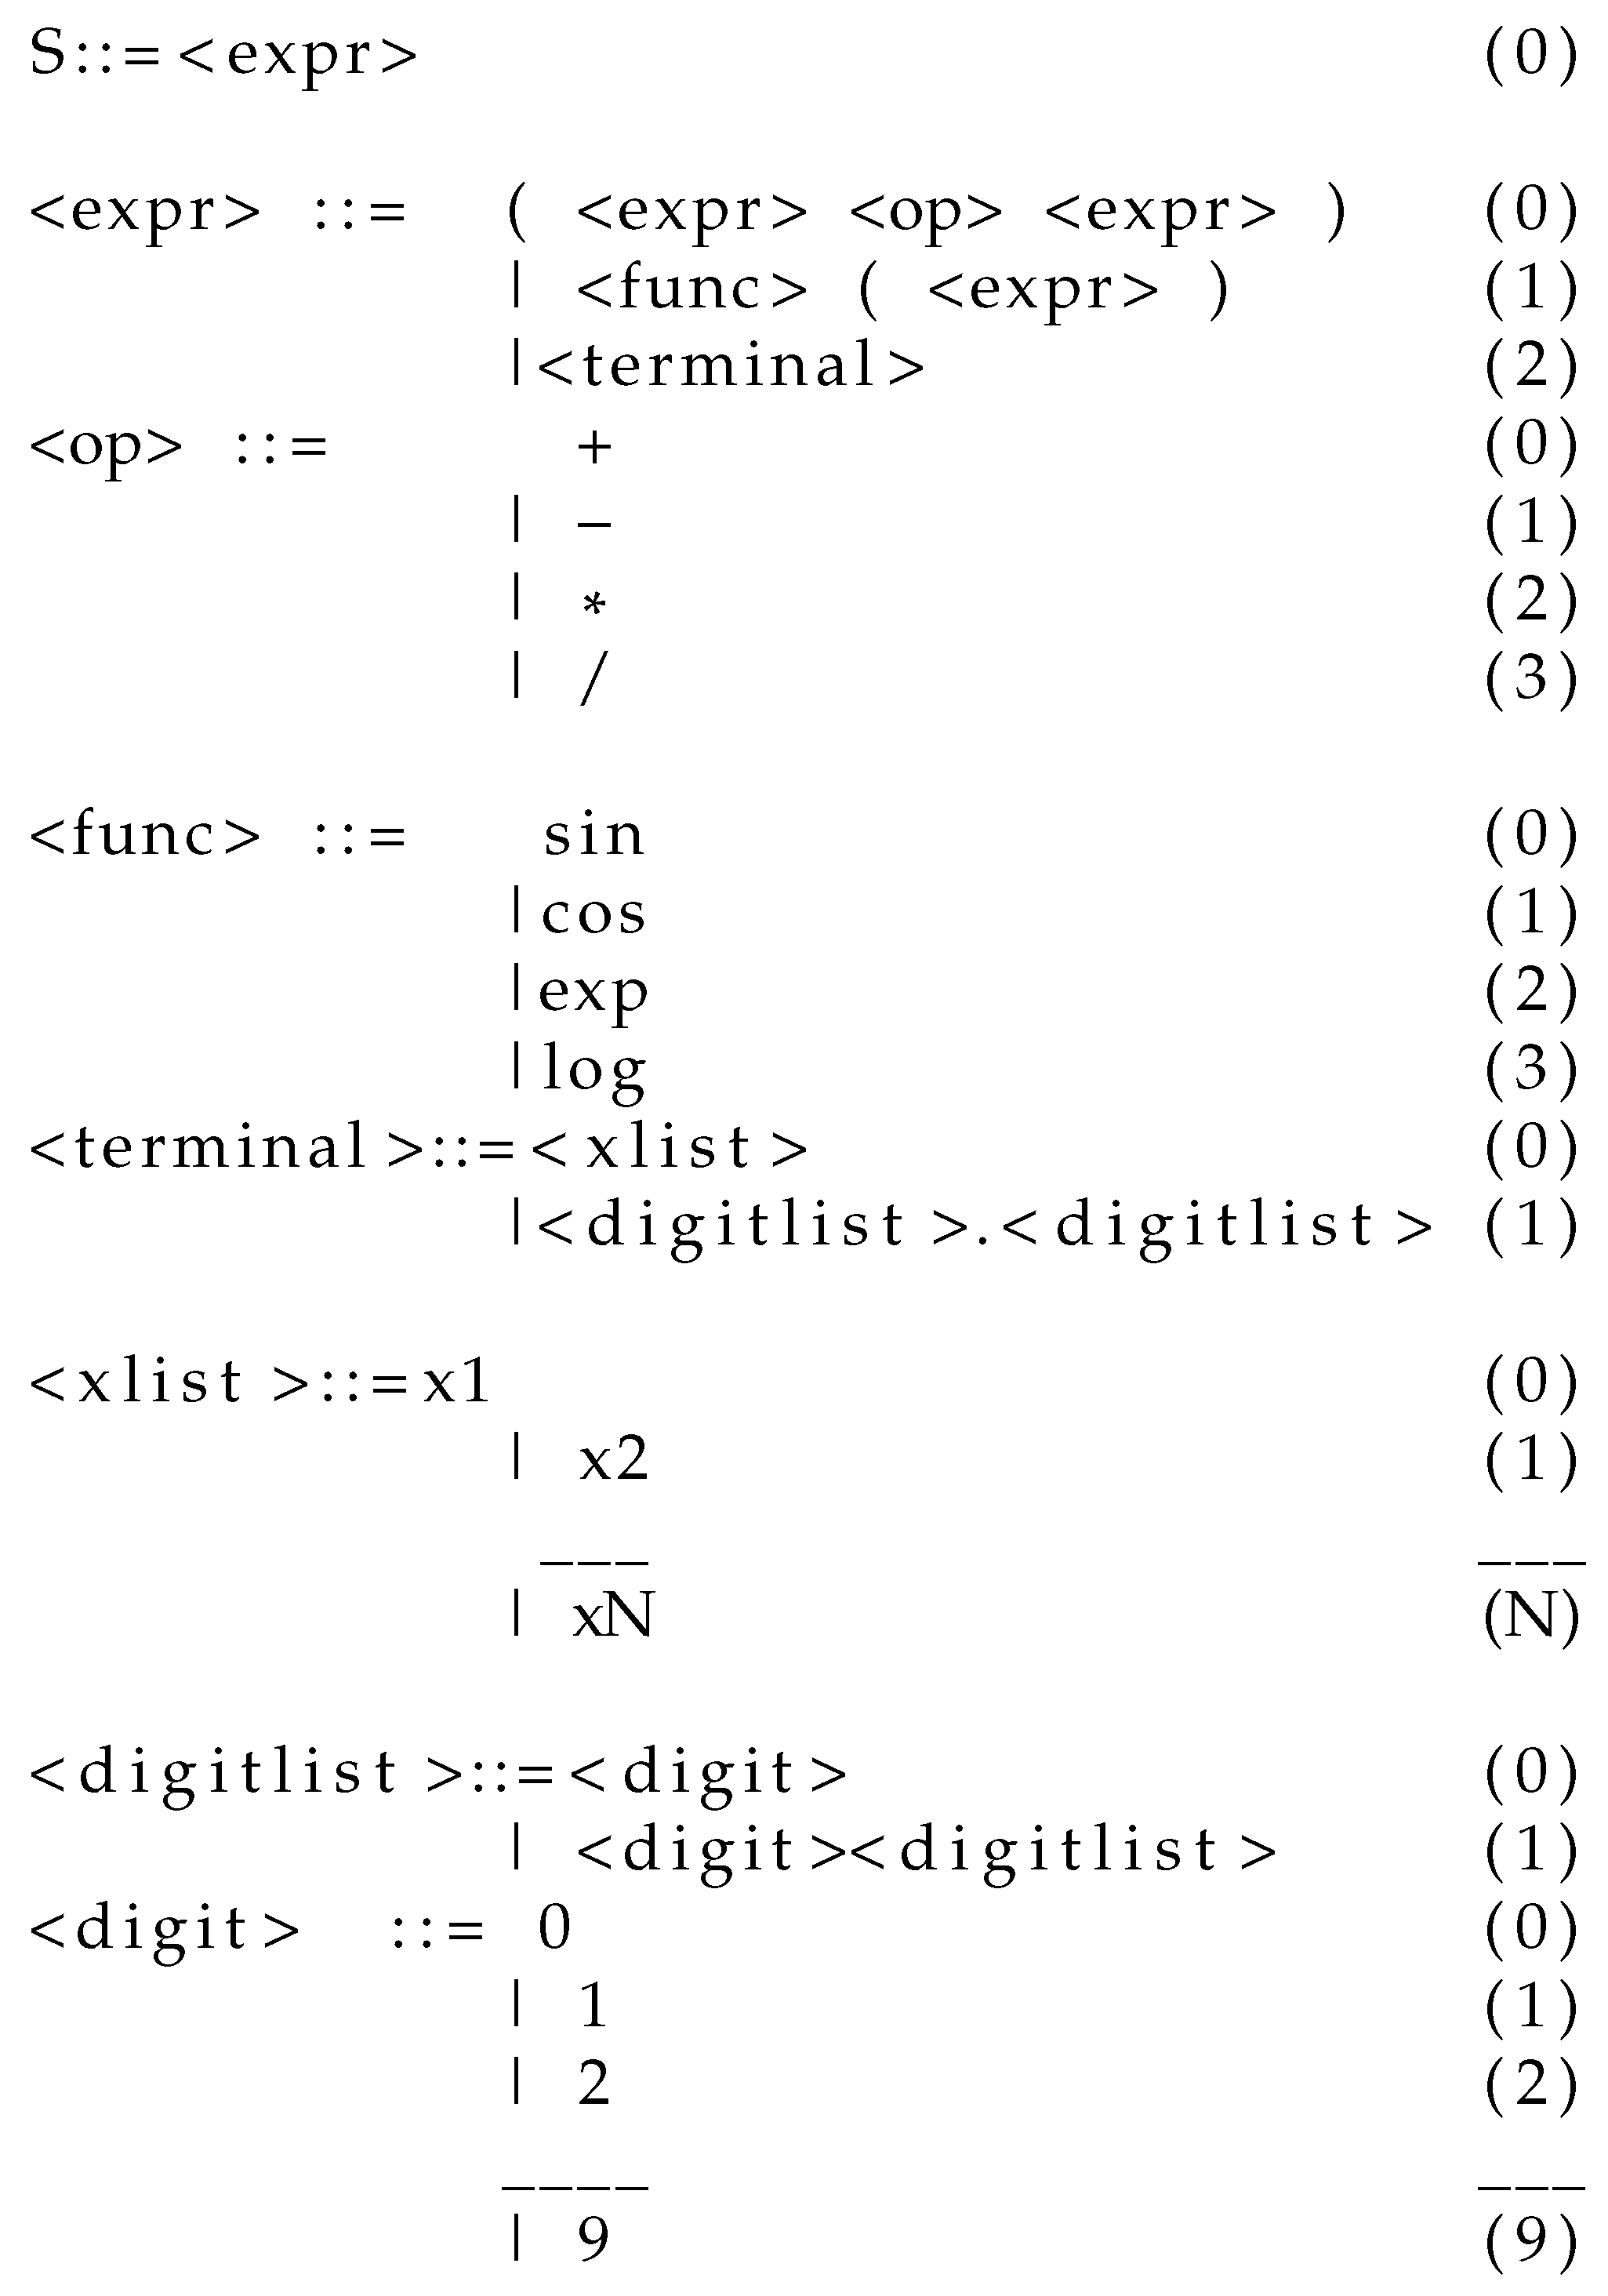
Figure 3.
An example of the one point crossover procedure.
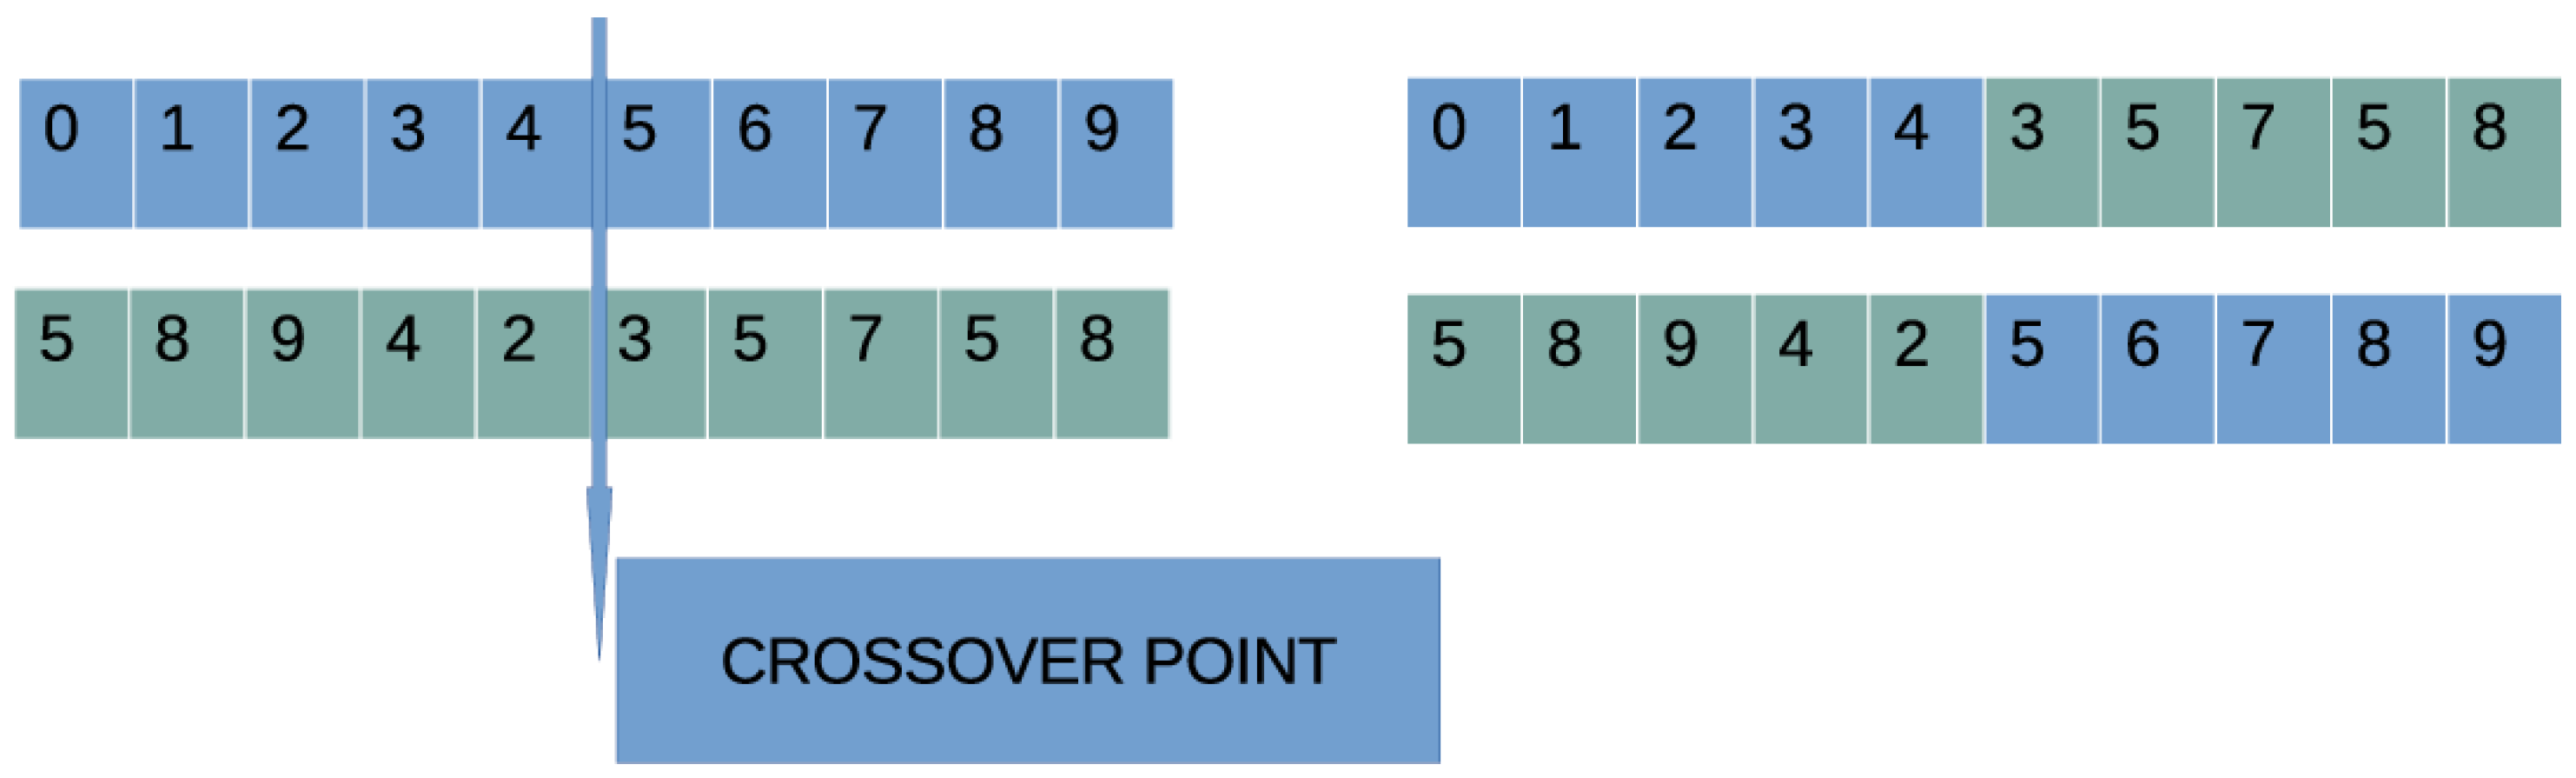
Table 1.
Example of production.
| String | Chromosome | Operation |
| <expr> | 9,8,6,4,16,10,17,23,8,14 | 9 mod 3=0 |
| (<expr><op><expr>) | 8,6,4,16,10,17,23,8,14 | 8 mod 3=2 |
| (<terminal><op><expr>) | 6,4,16,10,17,23,8,14 | 6 mod 2=0 |
| (<xlist><op><expr>) | 4,16,10,17,23,8,14 | 4 mod 3=1 |
| (x2<op><expr>) | 16,10,17,23,8,14 | 16 mod 4=0 |
| (x2+<expr>) | 10,17,23,8,14 | 10 mod 3=1 |
| (x2+<func>(<expr>)) | 17,23,8,14 | 17 mod 4 =1 |
| (x2+cos(<expr>)) | 23,8,14 | 23 mod 3=2 |
| (x2+cos(<terminal>)) | 8,14 | 8 mod 2=0 |
| (x2+cos(<xlist>)) | 14 | 14 mod 3=2 |
| (x2+cos(x3)) |
Disclaimer/Publisher’s Note: The statements, opinions and data contained in all publications are solely those of the individual author(s) and contributor(s) and not of MDPI and/or the editor(s). MDPI and/or the editor(s) disclaim responsibility for any injury to people or property resulting from any ideas, methods, instructions or products referred to in the content. |
© 2024 by the authors. Licensee MDPI, Basel, Switzerland. This article is an open access article distributed under the terms and conditions of the Creative Commons Attribution (CC BY) license (http://creativecommons.org/licenses/by/4.0/).
Copyright: This open access article is published under a Creative Commons CC BY 4.0 license, which permit the free download, distribution, and reuse, provided that the author and preprint are cited in any reuse.


