2. Materials and Methods
Vitamin C (ascorbic acid) is a micronutrient with a very important role in the well-functioning of the human organism, being involved in over 300 metabolic functions [
2,
20,
22,
31].
The sustainability of vitamin C is explained through its capacity to destroy and neutralize free radicals and oxidative stress [
5,
6], taking part in a series of redox reaction at cellular level [
28]. It has an anti-infectious protection role [
1,
7], it acts beneficially to combat Helicobacter pylori [
2]; it prevents cancer incidence [
1,
10,
24], having anti-inflammatory [
9,
10], antiangiogenic [
8,
15,
19,
23,
24,
34,
36], and anti-tumoral [
1,
3] properties; it participates in the synthesis of the bile acids, it prevents the development of coronary diseases and atherosclerosis [
2,
3,
4,
5,
6,
7,
8,
9,
10,
11,
12,
13,
14,
15,
16,
17,
18,
19,
20]; it diminishes the level of reactive protein C [
15,
16,
17,
18,
19,
20]; it facilitates the elimination of heavy metals from the organism by neutralizing them [
2,
3,
4,
5,
6,
7,
8,
9,
10,
11,
12,
13,
15,
16,
17,
18,
19,
20,
21,
22,
23,
24,
25,
26,
27,
28,
29,
30]. It plays an important part in stimulating the biosynthesis of stress adjusting hormones, being involved in the production of antistress hormones and of interferon (an important protein of the immune system) [
2]; it sustains the functioning of the adrenal gland [
2], and it participates in the collagen metabolism [
1,
7,
21,
28,
32].
The classical diseases determined by a lack of vitamin C is scurvy, which develops due to the role played by the vitamin in the post-translational modification of collagen. An excessive intake of vitamin C can cause diarrhea, abdominal bloating, over-absorption of iron, hyperoxaluria (in dialyzed patients), and hemolysis (in patients with a deficit of glucoses-6- phosphate dehydrogenase). A tolerable upper intake level for vitamin C is equal to 2000 mg/day and it was established by the Council for Food and Nutrition in 2000 [
4].
The recommendations for the vitamin C intake are given in the Dietary Reference Intake (DRI) developed by the Food and Nutrition Council (FNB) from the Medicine Institute (IOM) of the National Academies. The Recommended Daily Dose, the average daily intake to satisfy the nutritional need of almost all healthy individuals and which is often used to plan nutritive adequate diets for individuals and which varies according to age and sex is of 90 mg for men and 75 mg for women (with an extra adding of 35 mg for smokers). For these doses the bio-availability of vitamin C is of almost 100% [
14].
A genetic mutation prevents humans from synthetizing vitamin C [
33,
34,
35] from fructose as plants do. For this reason, the level of this vitamin in the human organism depends entirely on the exogen vitamin sources [
1,
2,
3,
11,
12,
13,
14,
15,
16,
17,
18,
19,
20,
21,
22,
23,
24,
25,
30,
31,
32,
33,
34,
35], which include fruit and vegetables [
7].
The fruit and the vegetables being a primary source of the diet with vitamin C, the plasmatic level of vitamin C is considered a good surrogate or predictor of vitamin C intake. The correlation can be affected / influence by the presence of external factors such as: the bio-availability of the vitamin, the absorption conditions, stress, the food processing degree and the conservation period or even certain errors in the reporting the level of vitamin C [
4,
8,
14].
The purpose of the study is to follow the effect of the intake of vitamin C obtained from a diet rich in fruit and vegetables or following the administration of vitamin C supplements on the level of vitamin C in the plasma.
The plasma level of vitamin C was studied by corelating the intake of fruit and vegetables with a different level of vitamin and linking it with the frequency of consumption. Other factors which can influence the eating habits of the subjects were monitored as well [
4,
8,
14,
27].
2.1. The subject
Out of the 70 recruited patients, 42 participants took part in this study. Research consists in achieving an optimal level of plasma vitamin C, both by consuming fruits and vegetables, or even by consuming vitamin C-based supplements. These people were chosen on the basis of certain selection criteria which were applied during several stages.
First, a questionnaire on the subjects eating habits was launched. The questionnaire included questions referring to the current health state, personal psychological antecedents, pathological personal antecedents, hereditary and collateral antecedents, habits concerning the consumption of various pleasure substances, present treatment and physical activity. The questionnaire was used to launch the first information referring to the intention to carry out a study with all the necessary details included.
During the second stage, the individuals who consumed fruits with a minimum or a maximum (bell peppers, black currants, parsley, kiwi, Brussels sprouts, cabbage, cauliflower, lemon, papaya, grapefruit, spinach, and broccoli) content of vitamin C or who often consumed vegetables with a vitamin C content (lettuce, mango, melon, peas, potatoes, and tomatoes) were selected. Another selection criterion was the one resulted after transposing the questionnaire answers on the consumption of vegetables and fruit following which, the intake of food with vitamin C had to reach a minimum value of 30 points.
During the third stage, the selected individuals were contacted. They were offered additional information on the study and those who agreed to take part in were subjected to a thorough informing concerning the study, but also the influence of vitamin C on the organism. These individuals were also informed on vitamin C avitaminosis, vitamin C insufficiency and the consequences of hypervitaminosis C.
During the fourth stage, the anthropometric measures were carried and the appointment for the first sampling was made. This was attended by 42 people. Before the first sampling, in order to determine plasma vitamin C, a new detailed verbal explanation about what the involvement in the research was given. The subjects signed an informed consent.
The group of volunteers was formed of 20 women and 22 men with ages between 20 and 45 years old (34.19±7.68), who were in good health and were not under any medical treatment during the selection process.
2.2. The stage of the study
I. The first sampling was carried out after the subjects’ selection.
II. During the two weeks, from the sampling moment until the arrival of the results, the recommended diet was put into practice by taking into account both the food with a high content of vitamin C and the results of the anthropometric measures of the people involved. Furthermore, it was procured the necessary of 1000 mg of vitamin C with extended release (out of which a daily dose of ½, meaning 500 mg, was recommended to be taken). The terms of the followed diet, the fruit were consumed either for breakfast or as snack and the vegetables were introduced in the diet, especially during the main meals, but also during dinner, were presented. According to the dietician’s recommendation, a basic diet of 2000 kcal/day was established. The diet contained both food items with a high content of vitamin C, and frequently consumed food items with vitamin C and the necessary macronutrients. The diet was composed on the basis of the principles found in “The Healthy Eating Guide”, coordinated by M.M. and which was subsequently adapted in a direct proportional manner with the number of calories needed by each participant and which was established on the basis of the anthropometric measures (the 500 mg portion of vitamin C being kept).
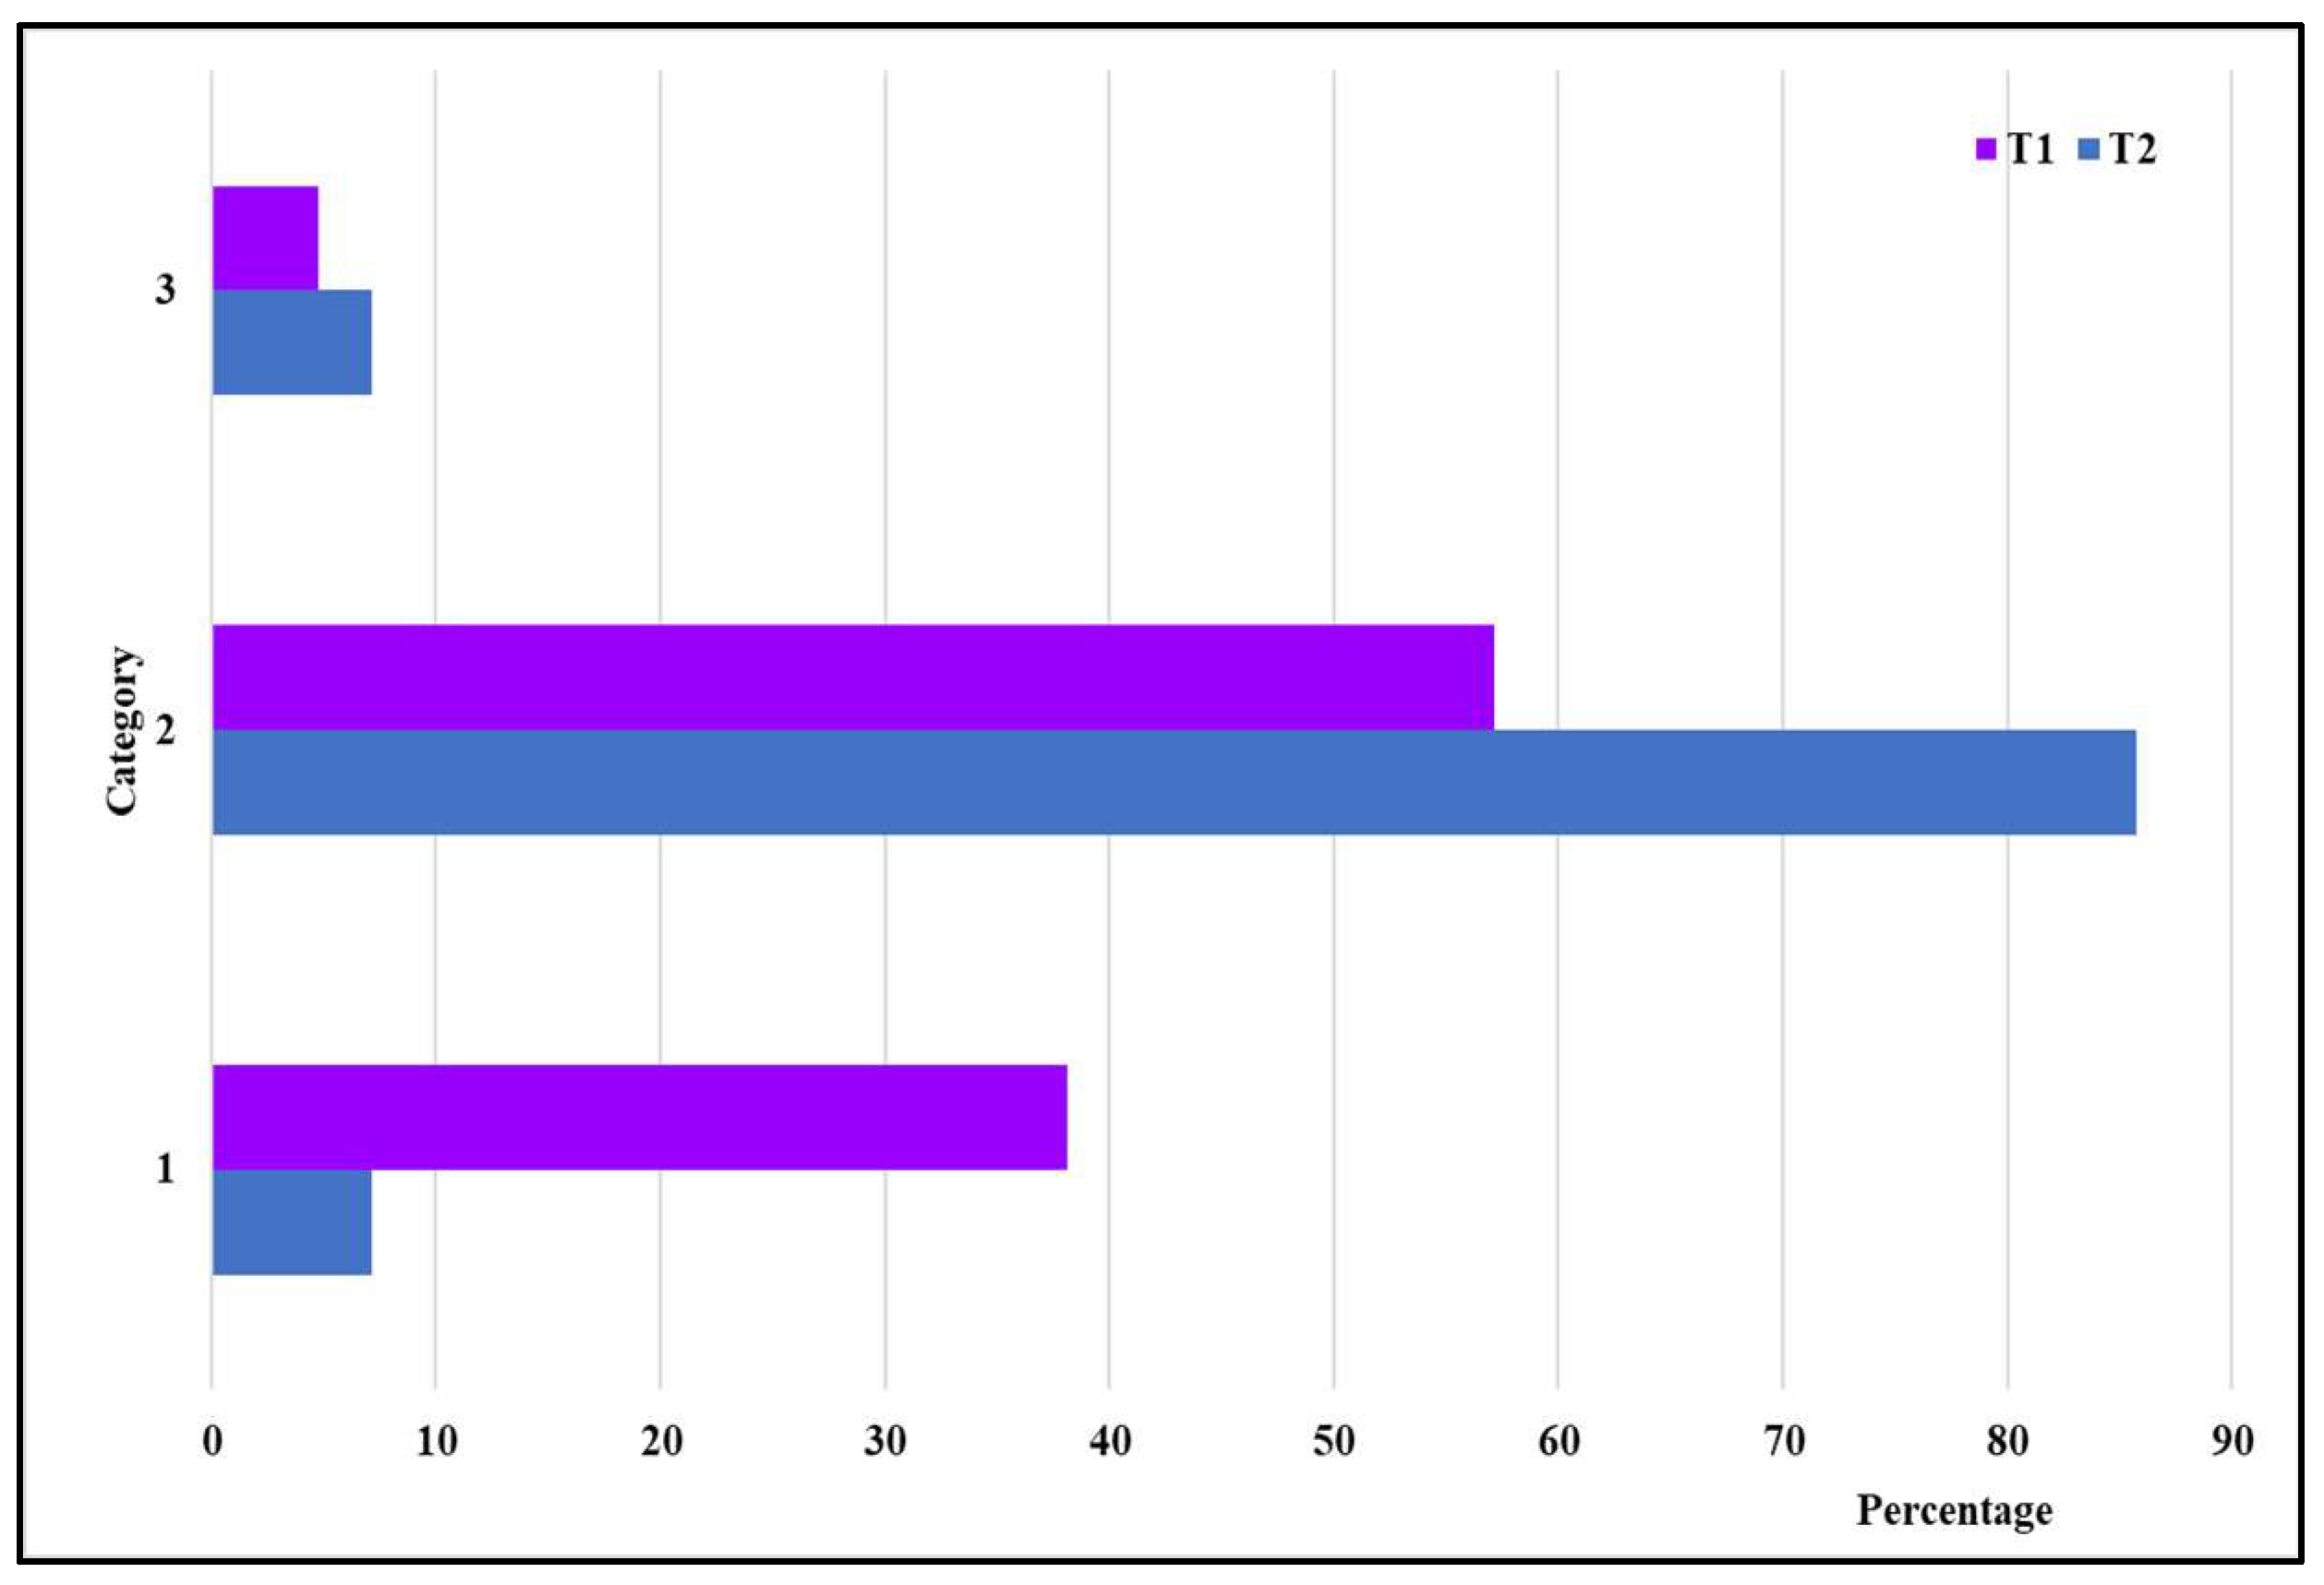
III. On the basis of the first determination concerning the level of the plasma vitamin C, three categories of results were observed:
- category 1 with a plasma vitamin C level between 1 and 5.8 mg/L; these values are under the level of the reference minimum value, being at the lower end of the reference value level.
- category 2 with a plasma vitamin C level between 6.5 and 12.2 mg/L; these values represent an average level of the plasma level of vitamin C belonging to the individuals involved in the study; they also represent a normal value when compared with the reference value level.
- category 3 with a plasma vitamin C level of 16 mg/L; this value is above the maximum level of the reference value.
IV. On the basis of the first results concerning the plasma vitamin C level and of the observation of values on categories, a discussion was carried out between a nutritionist, a dietician and the attending physician about the result of the analysis and the possible recommendations.
V. The participants were informed individually on the values of vitamin C in their plasma and they were explained which were their possibilities to increase the level of vitamin C in their organism. They were also explained each variant, the advantages and disadvantages of each proposal, and the effects of a possible increase or decrease in the level of the plasma vitamin C level. This was followed by an individual discussion with the subjects concerning their individual option for obtaining vitamin C by making dietary changings, takins food supplements, both or none.
VI. To establish the groups, both the analysis results and the personal preferences were taken into account. It was also taken into account the fact that one had to consider the therapeutic need of individuals who had reference values which were either too low or too high. On the basis of these aspects three groups were established (
Figure 1):
- Group I – people who were given a specific diet; 14 people were included in this group
- Group II - people who were administered a food supplement with Vitamin C 500 mg with slow absorption; 14 people were included in this group
- Group III – people who were given a specific diet, but who were also administrated a food supplement with Vitamin C. Vitamin C supplement 500 mg with slow abortion; 14 people were included in this group.
VII. During the study, the subjects had the liberty to renounce to their involvement on condition that they announced their intention. This aspect was important because it highlighted the stability to be involved in the project and the personal intention to follow a diet or to follow the administration of food supplements, accordingly.
VIII. The second determination of vitamin C occurred at about 5 months after the first sampling, according to the participants’ availability and possibility to take part in the experiment. There was a difference of several days in the subjects’ sampling process.
IX. After the second sampling, during the 10 to 12 days necessary for the results to arrive, an individual discussion with the participants was carried out. It focused on the way the diet was followed, how the food supplements were administrated. An anthropometric measurement was also carried out and the participants filled-in a questionnaire concerning food intake during the study period.
X. During the last stage, the data and the results obtained throughout the study were analyzed in such a way so as to prevent the disclosure of the personal data belonging to the subjects involved in the present study.
The study was carried out in accordance with the instruction given at the Helsinki Declaration and all the procedures which involve human subjects were approved by the Human Research Ethics Committee.
2.3. Determination of Vitamin C level in plasma
The samples were collected either at the general practitioner’s private office in Arad, Romania or in a laboratory of medical analysis located in Arad, Romania, according to the possibility and the preference shown by each subject. The samples collected at the doctor’s private office were collected by the staff belonging to the medical analysis laboratory which ensured the optimum transport conditions. The actual determination of the plasma level of vitamin C was carried out in Germany and the results were delivered after 10 to 12 days after the moment of the sample collection.
The method used to determine the level of the vitamin C in the plasma was the High-Pressure Liquid Chromatography (HPLC) by complying to the analysis protocols in the medical analysis laboratories [
8,
17,
18,
27].
The volunteers were asked to avoid alcohol consumption 24 hours before the sampling process [
17]. Synevo Laboratories. References specific to the work technology used [2010. Ref Type: Catalogue].
One ml of venous blood was collected from the subjects à jeun (they subjects did not eat anything prior to the blood collection). The blood was collected in vacutainer collection containers which contained lithium heparinate as an anticoagulant. After sampling, the plasma was separated through spinning and it coagulated immediately (it stable one month if kept at temperature of -20°C); the recipients were covered with an aluminum wrap to protect it from light; in the case of the sample collected outside the laboratory, they were transported in the recipient for the frozen samples. The samples, in which a highly hemolyzed, lipemic or unfrozen, unprotected from light specimens were observed, were rejected [
17].
The reference values are comprised between 4.6 and 14.9 mg/L [
17].
Plasma values of <3 mg/L point out deficiencies of vitamin C and a concentration of < 0.2 mg/L suggest the presence of scurvy. Low plasmatic levels appear in malabsorption, alcoholism, pregnancy, hyperthyroidism, kidney failure, and in smokers.
Limits and interferences may appear after the ingestion of ascorbic acid. The plasmatic values increase rapidly in 1 or 2 hours and reach a maximum concentration after 3 or 6 hours from consumption. The testing of the people who use vitamin supplements may indicate a higher plasmatic level of the vitamin [
18].
2.4. Statistical analyses
All statistical analyses were performed using IBM SPSS Software version 27.0.0.0 (IBM Corp., New York, USA). The discrete variables were presented as the median respectively the minimum and maximum values. The continuous variables were expressed as mean and standard deviation (SD). The use of non-parametric tests was decided upon because the size of the population sample was too small and / or the observed data did not meet the assumptions about the population sample. The Kruskal-Wallis Test was performed to analyze how significant the differences between the studied variables were. A p value of < 0.05was considered to highlight important differences.
4. Discussion
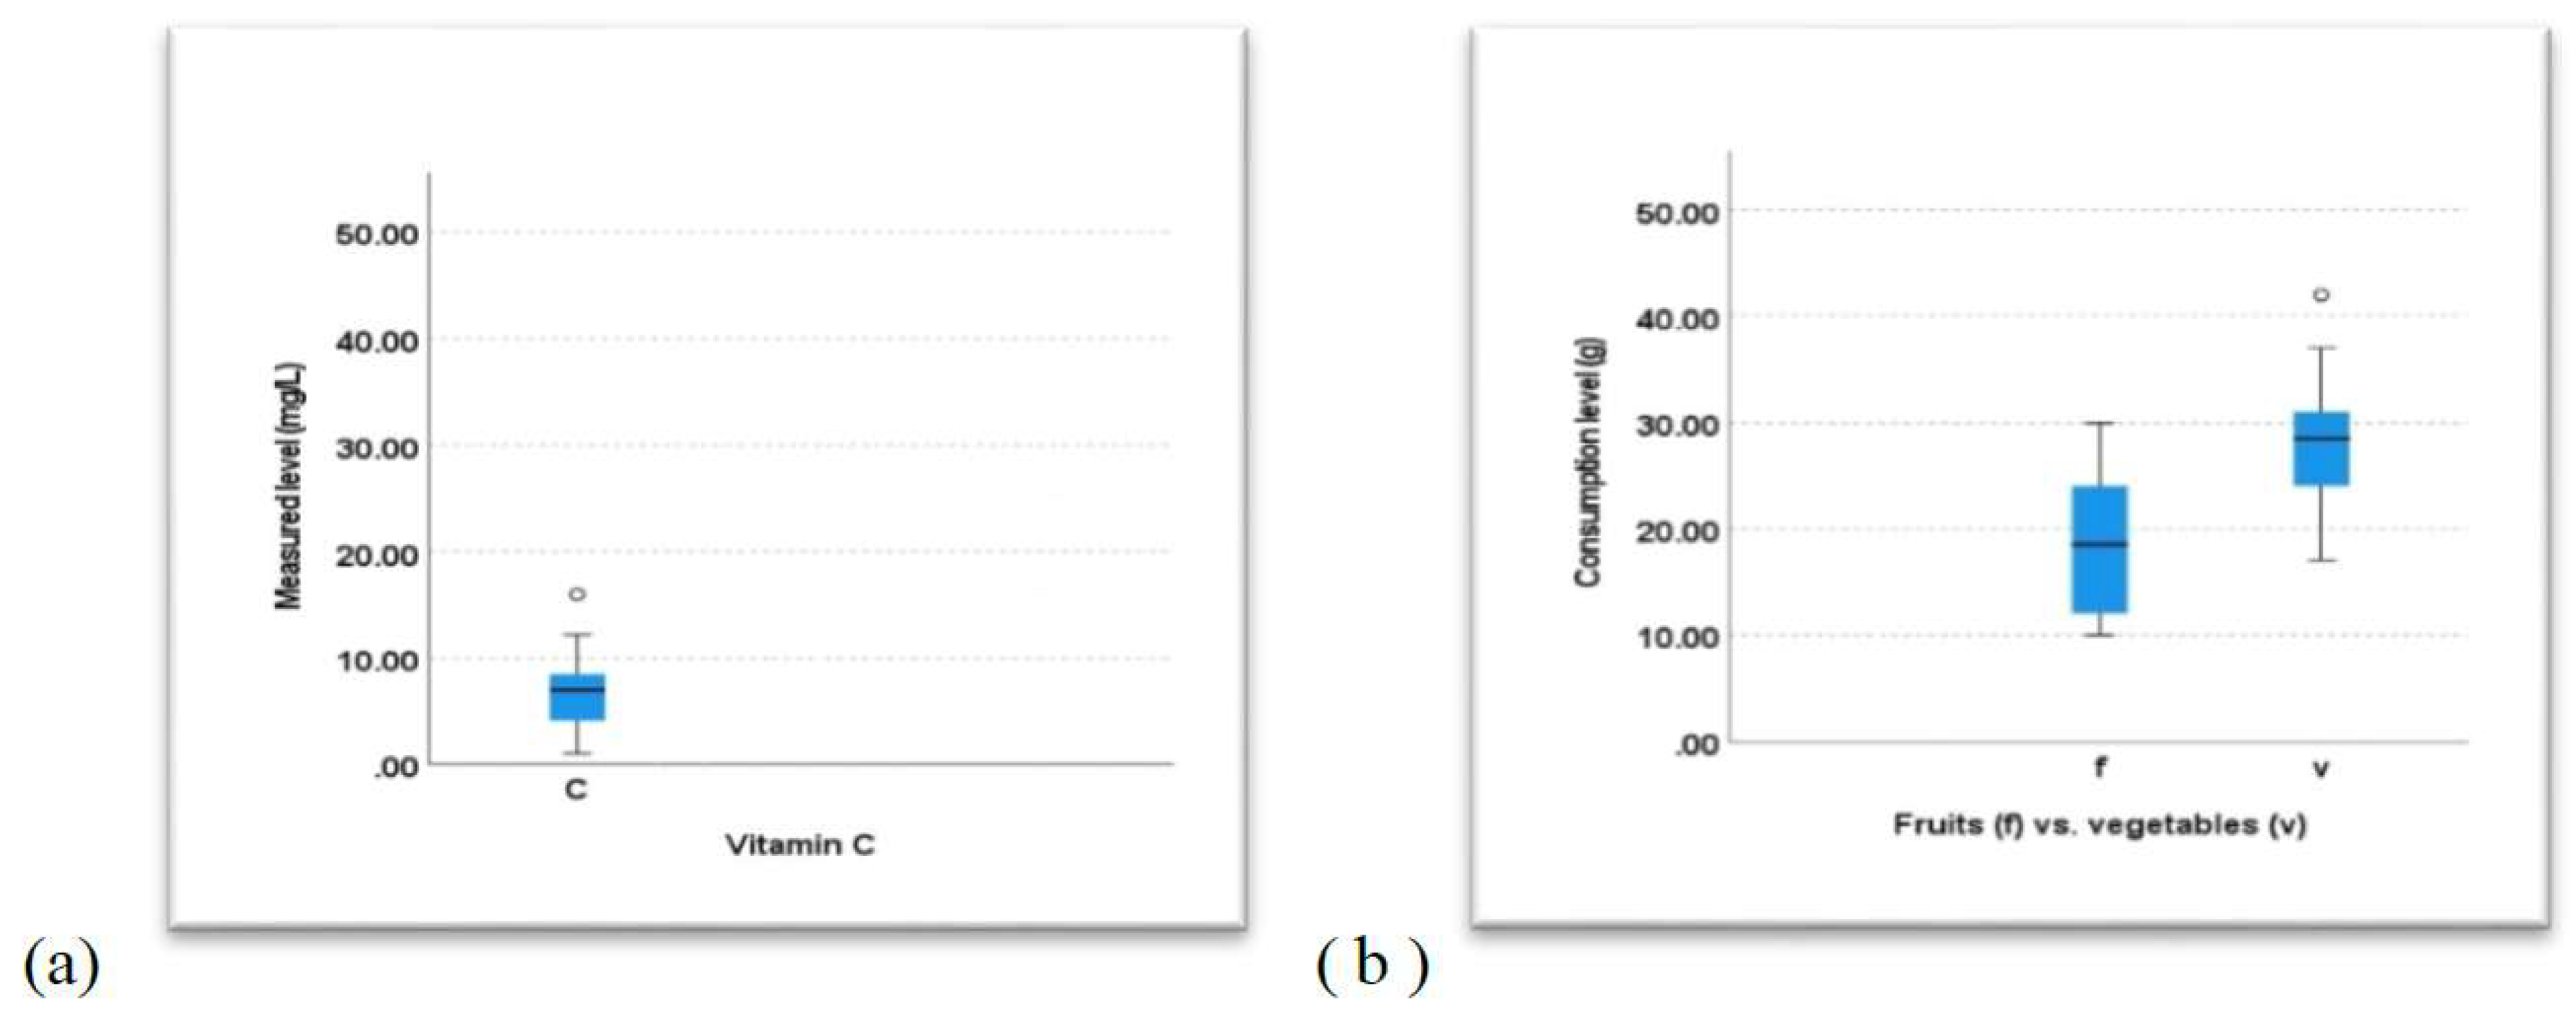
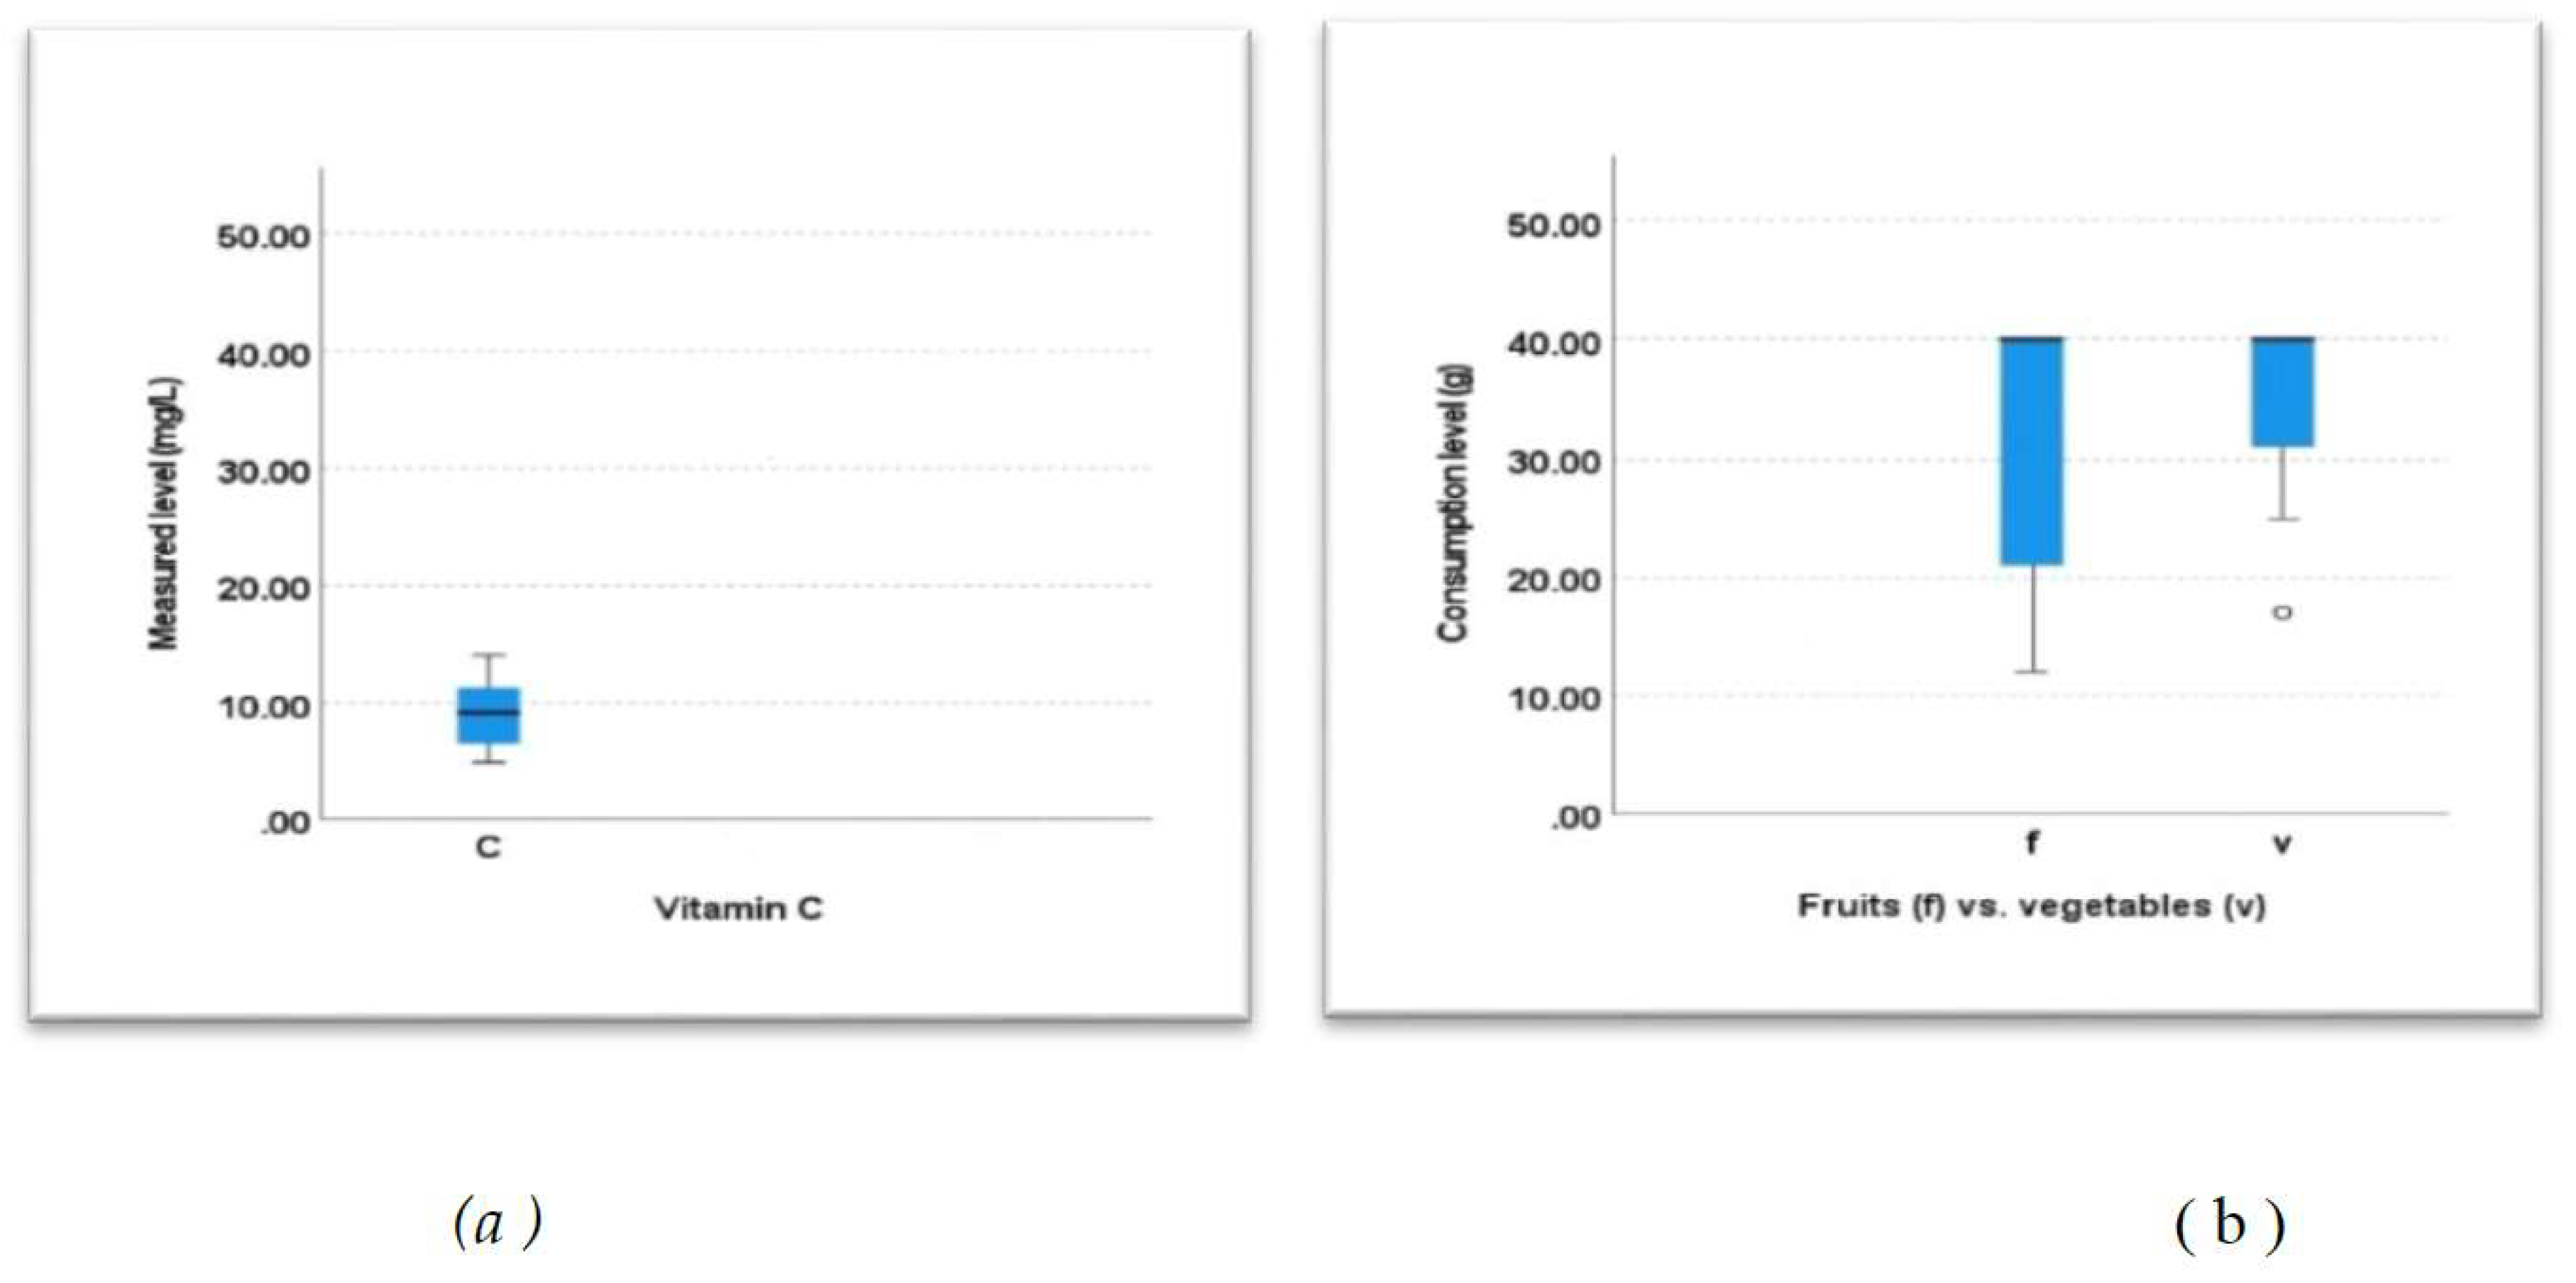
The results of the first plasma determination of vitamin C are comprised between 1.0 and 16.0, while the results of the 2nd plasma vitamin C determination are comprised between 4.9 and 14.1 (
Figure 1,
Figure 2,
Figure 4,
Figure 5).
The period between the two analyzes is of around 5 months, with an insignificant margin of error, during which there was a considerable increase in the plasma vitamin C level in 72.73% of the people involved, represented by a total increase of 36.59% in the plasma vitamin C level, although 9.09% of people maintained their plasma vitamin C level while 18.18% had a decrease in their plasma vitamin C level.
It is worth pointing out that 14 people agreed to integrate a proper diet into their daily life, other 14 people opted for both diet and additional vitamin C consumption, and 14 people opted strictly for the consumption of food supplements. During the discussions with the subjects, it was observed that the aspect was due to the general belief that it is an easier option to solve health problems by consuming food supplements and medicine, than by making an effort to change one’s eating habits and lifestyle.
The maintenance and decrease of the plasma vitamin C level, in most people, can also be the result of the fact that the vitamin C content in food is not stable. Most fruit and vegetables are harvested before ripening, so they do not benefit from all the nutritional elements, which would accumulate from soil, rain and sun action. Moreover, groups of vegetables and fruit (especially those consumed in the area and during the period of the study) are grown in greenhouses. Therefore, not enough vitamin C accumulates in the respective food items, or they are stored for a longer period of time. This aspect leads to the loss of vitamin C from the food items.
One of the decreases in the plasma vitamin C level was due to the fact that one person did not administer vitamin C for personal reasons. This aspect was reported only at T2.
The majority of people who opted for vitamin C intake from food supplements had a considerable increase in the plasma vitamin C level. In addition, the subjects who opted for both the diet and the additional consumption of vitamin C from food supplements had considerable increases in the plasma vitamin C level (
Figure 1).
This increase is due to a high intake of vitamin C either from food or dietary supplements or both. It can also be the result of the intervention made by nutrition specialists, who gave the right recommendations to each person and offered support throughout the study.
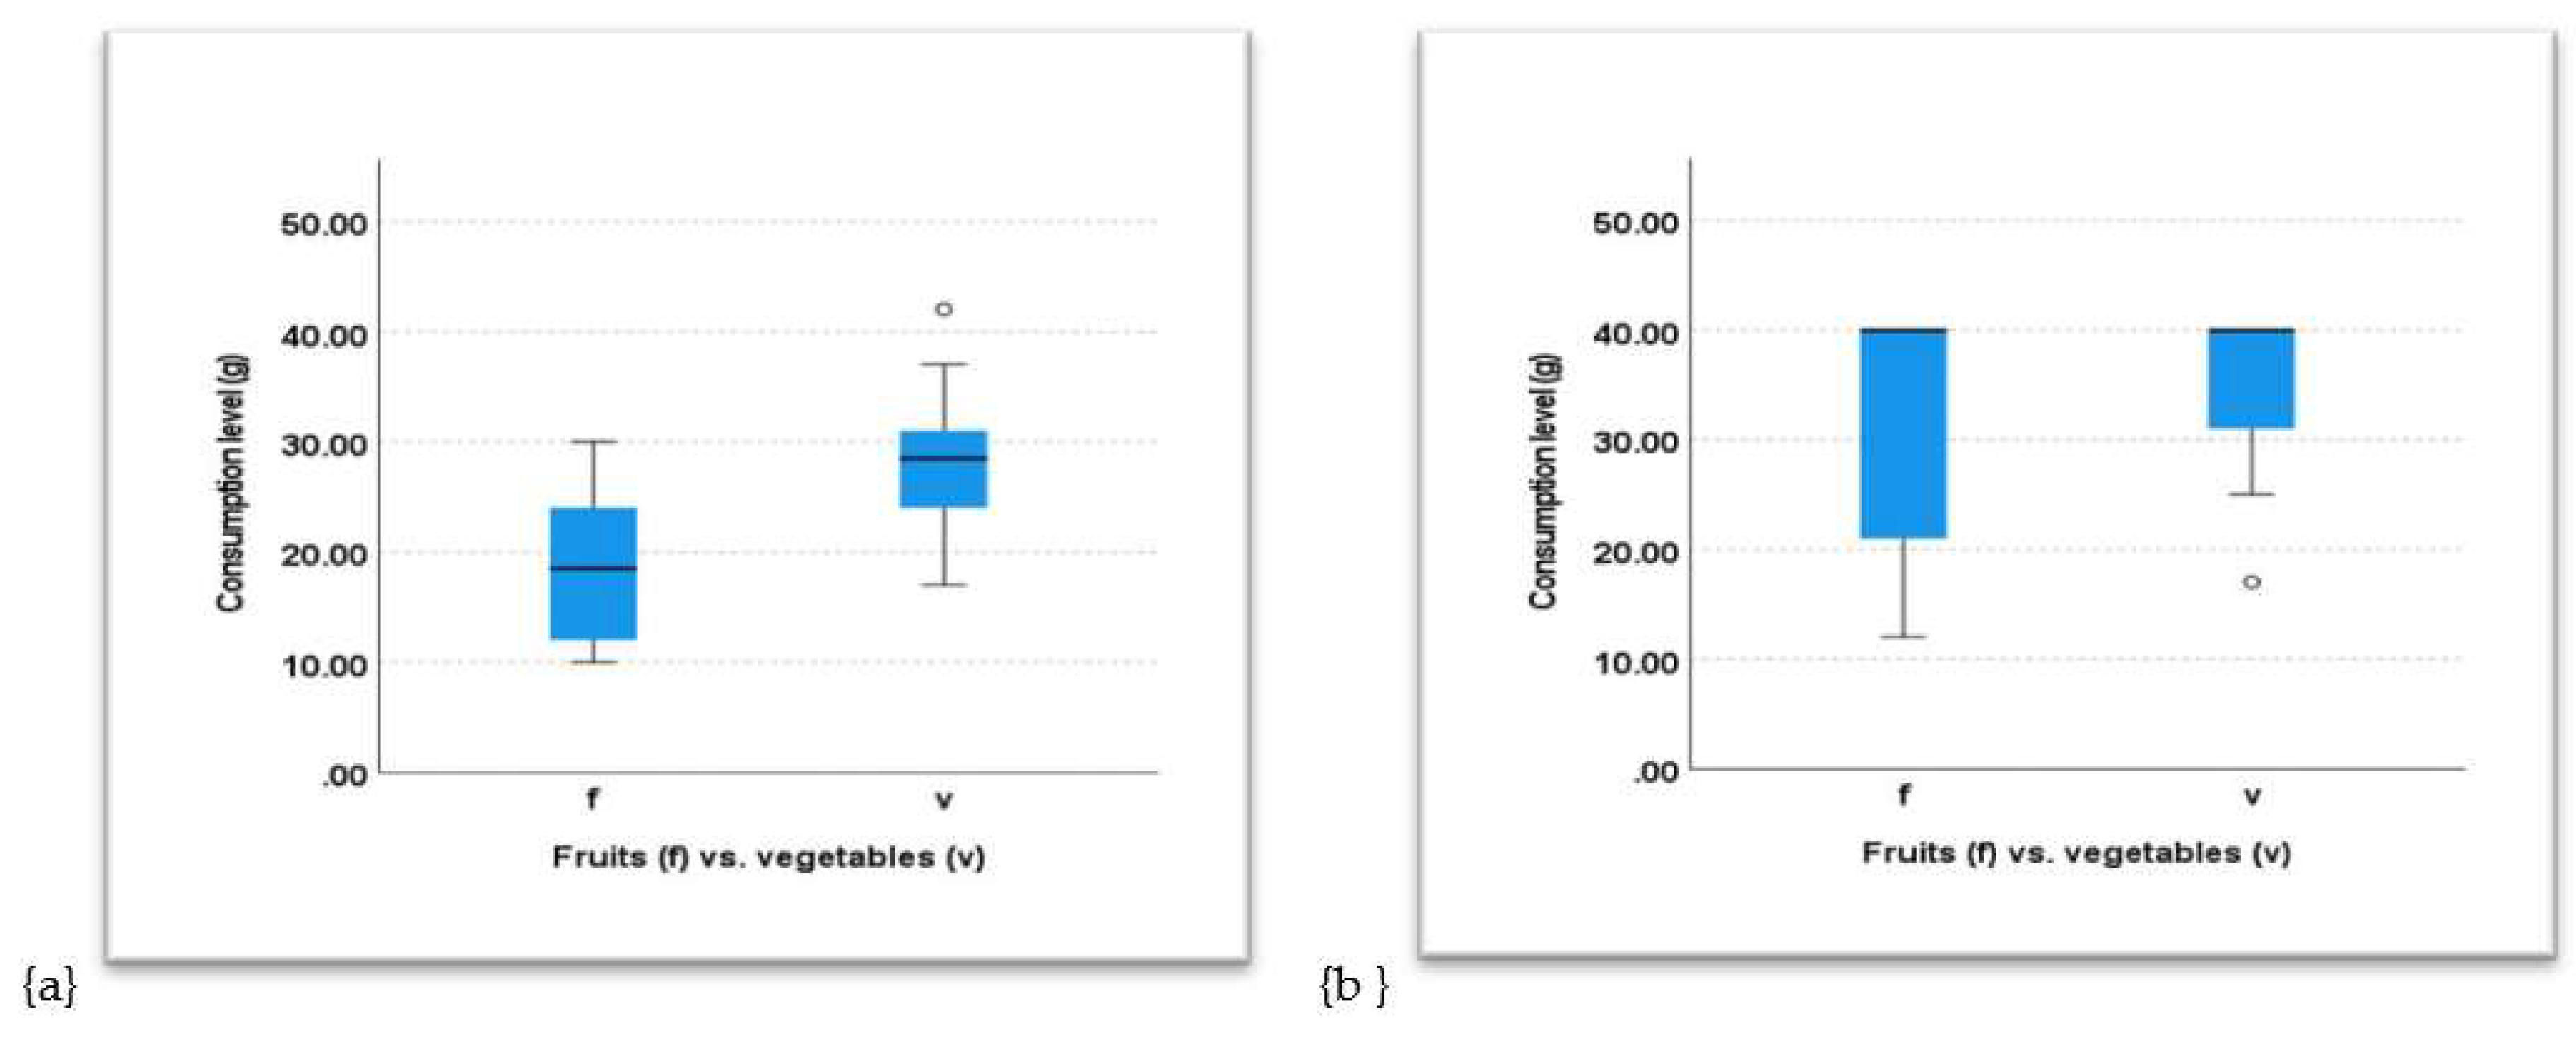
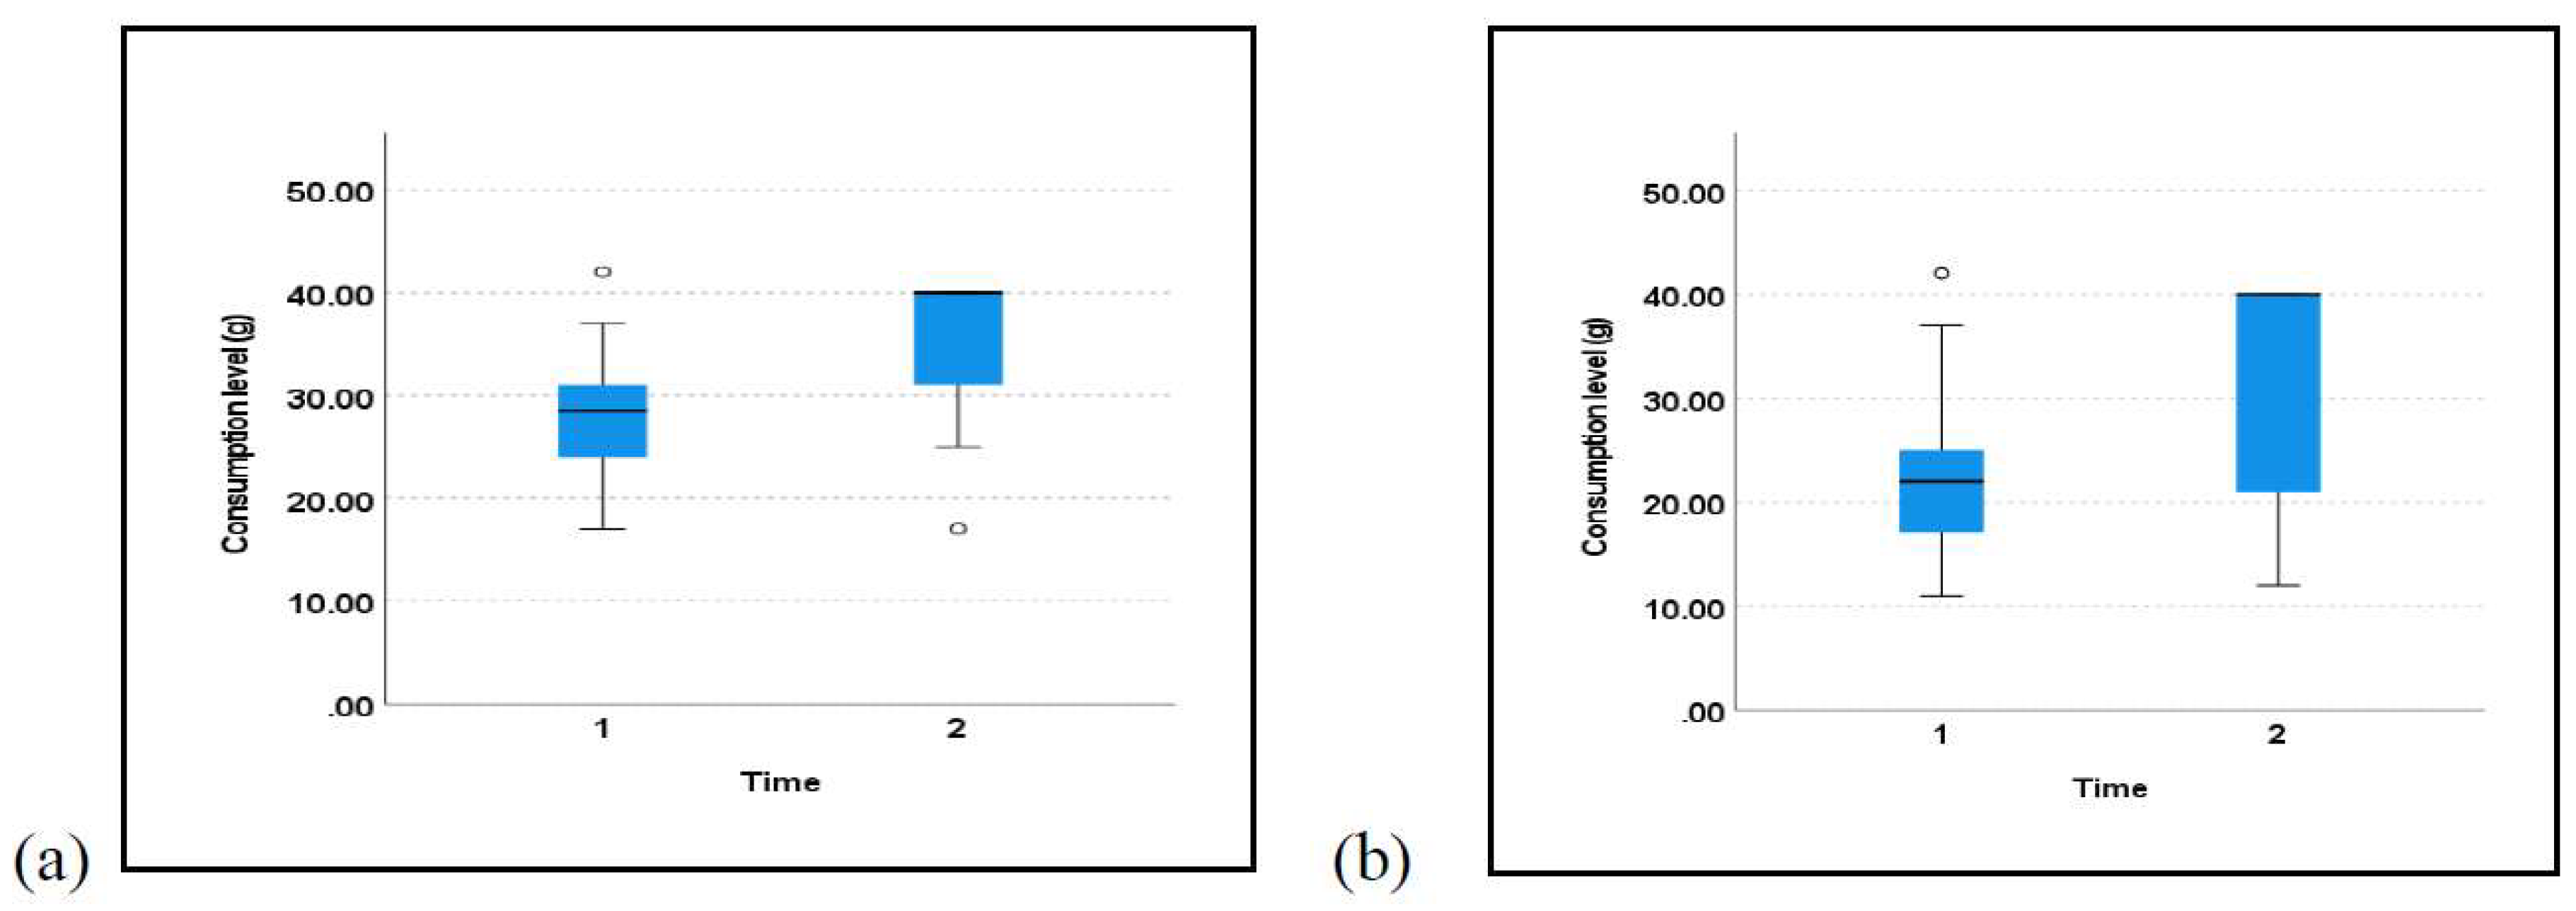
Although most people prefer fruit, their consumption is reduced both at breakfast and lunch. They are usually served as a snack. Fruit was initially consumed a maximum of 1-2 times a day, and 50% of the people questioned admitted to have never consumed certain fruit. It was also identified that 50% of those questioned had a low fruit consumption. During the study, fruit consumption increased considerably, due to diet recommendations and explanations provided by the dietician (
Figure 6-a).
Habits related to vegetable consumption
At the beginning of the study, raw vegetables were consumed by a smaller percentage of people in comparison with fruit. Furthermore, their consumption was higher during main meals, most subjects refusing to serve vegetables as a snack. The majority of people consume vegetables once or twice a day. Among the subjects questioned, 41% have never consumed or very rarely consumed raw vegetables. In most cases, vegetables are prepared for consumption through thermal preparations, an aspect that can lead to the loss of vitamin C content in food.
Figure 6-b comparatively presents the consumption of vegetables between the two questionnaires. Statistically, a significant difference was found between the consumption ofthe mentioned fruits in the two moments (p< 0.001).
Figure 6.
a/b.Comparative consumption of fruit-a/vegetable-b with high Vitamin C content, at the moment of the two questionnaires delivery.
Figure 6.
a/b.Comparative consumption of fruit-a/vegetable-b with high Vitamin C content, at the moment of the two questionnaires delivery.
The subjects’ favorite fruit were oranges, tangerines and lemons. The exotic fruit such as papaya and mango as well as strawberries which were out of season (
Table 2) registered low consumption values.
The preferred vegetables with a high content of vitamin C were bell peppers and tomatoes (mainly consumed raw), potatoes, cabbage, parsley, and peas (consumed in cooked form, included in the main meals), of which parsley and cauliflower were eaten with an increased frequency (
Table 3).
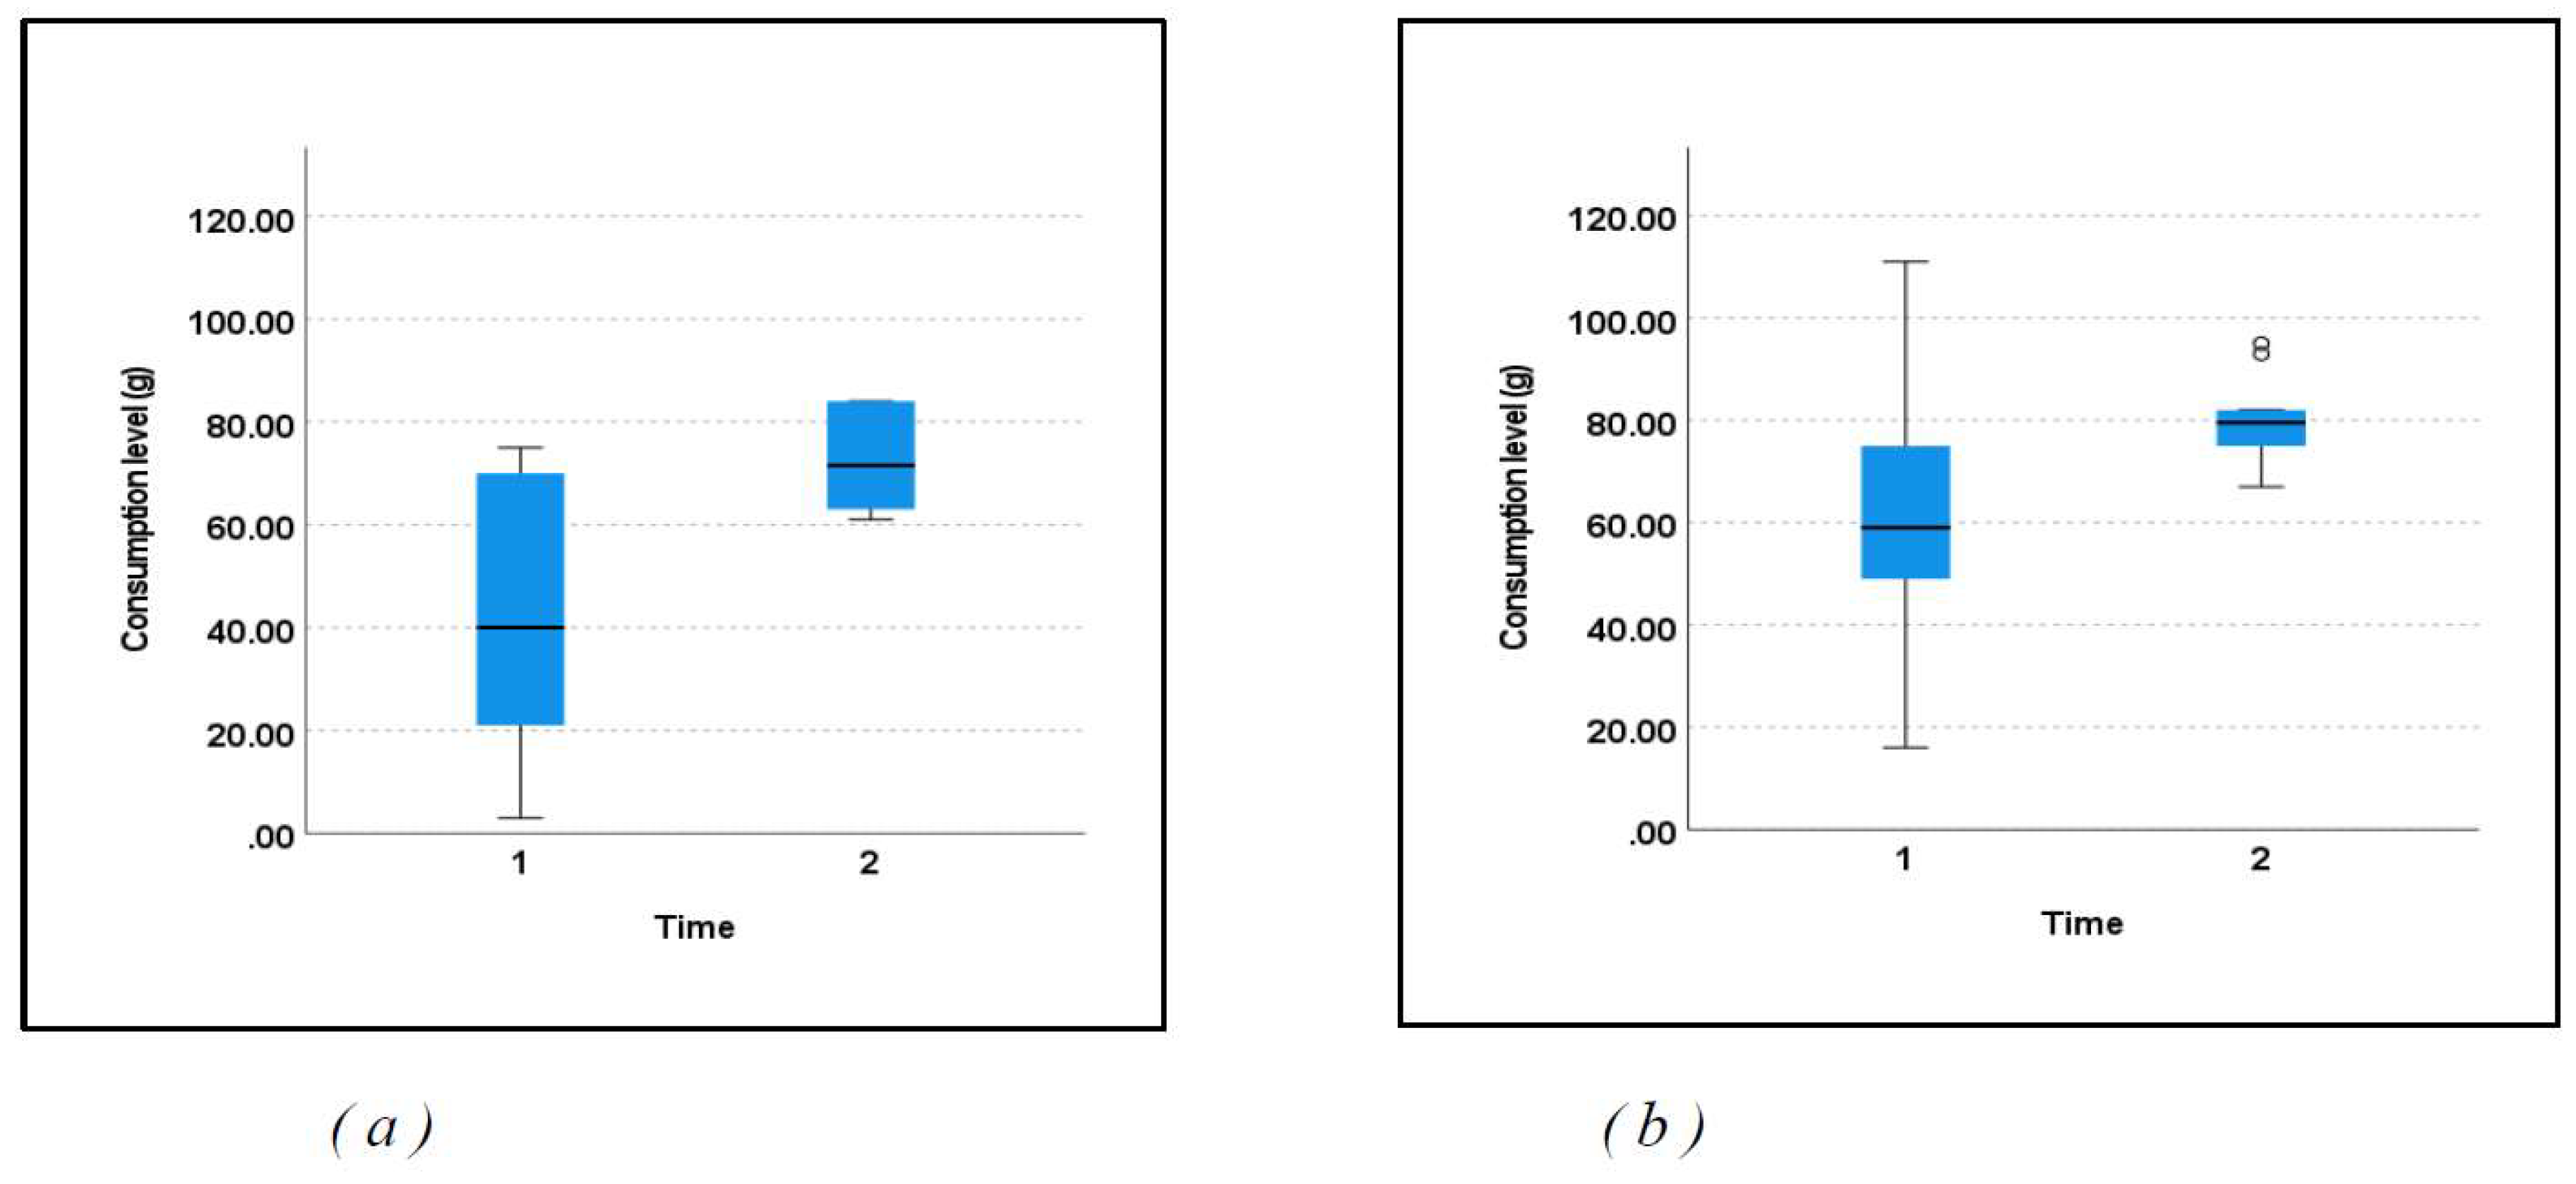
Figure 7-a comparatively presents the consumption of fruits with high vitamin C content between T1 and T2. A significant difference was found between the consumption of the previously mentioned fruits in the two moments (p= 0.009).
Figure 7-b comparatively presents the consumption of vegetables with high vitamin C content between T1 and T2. A significant difference was found between the consumption of the mentioned vegetables in the two moments (p= 0.026).
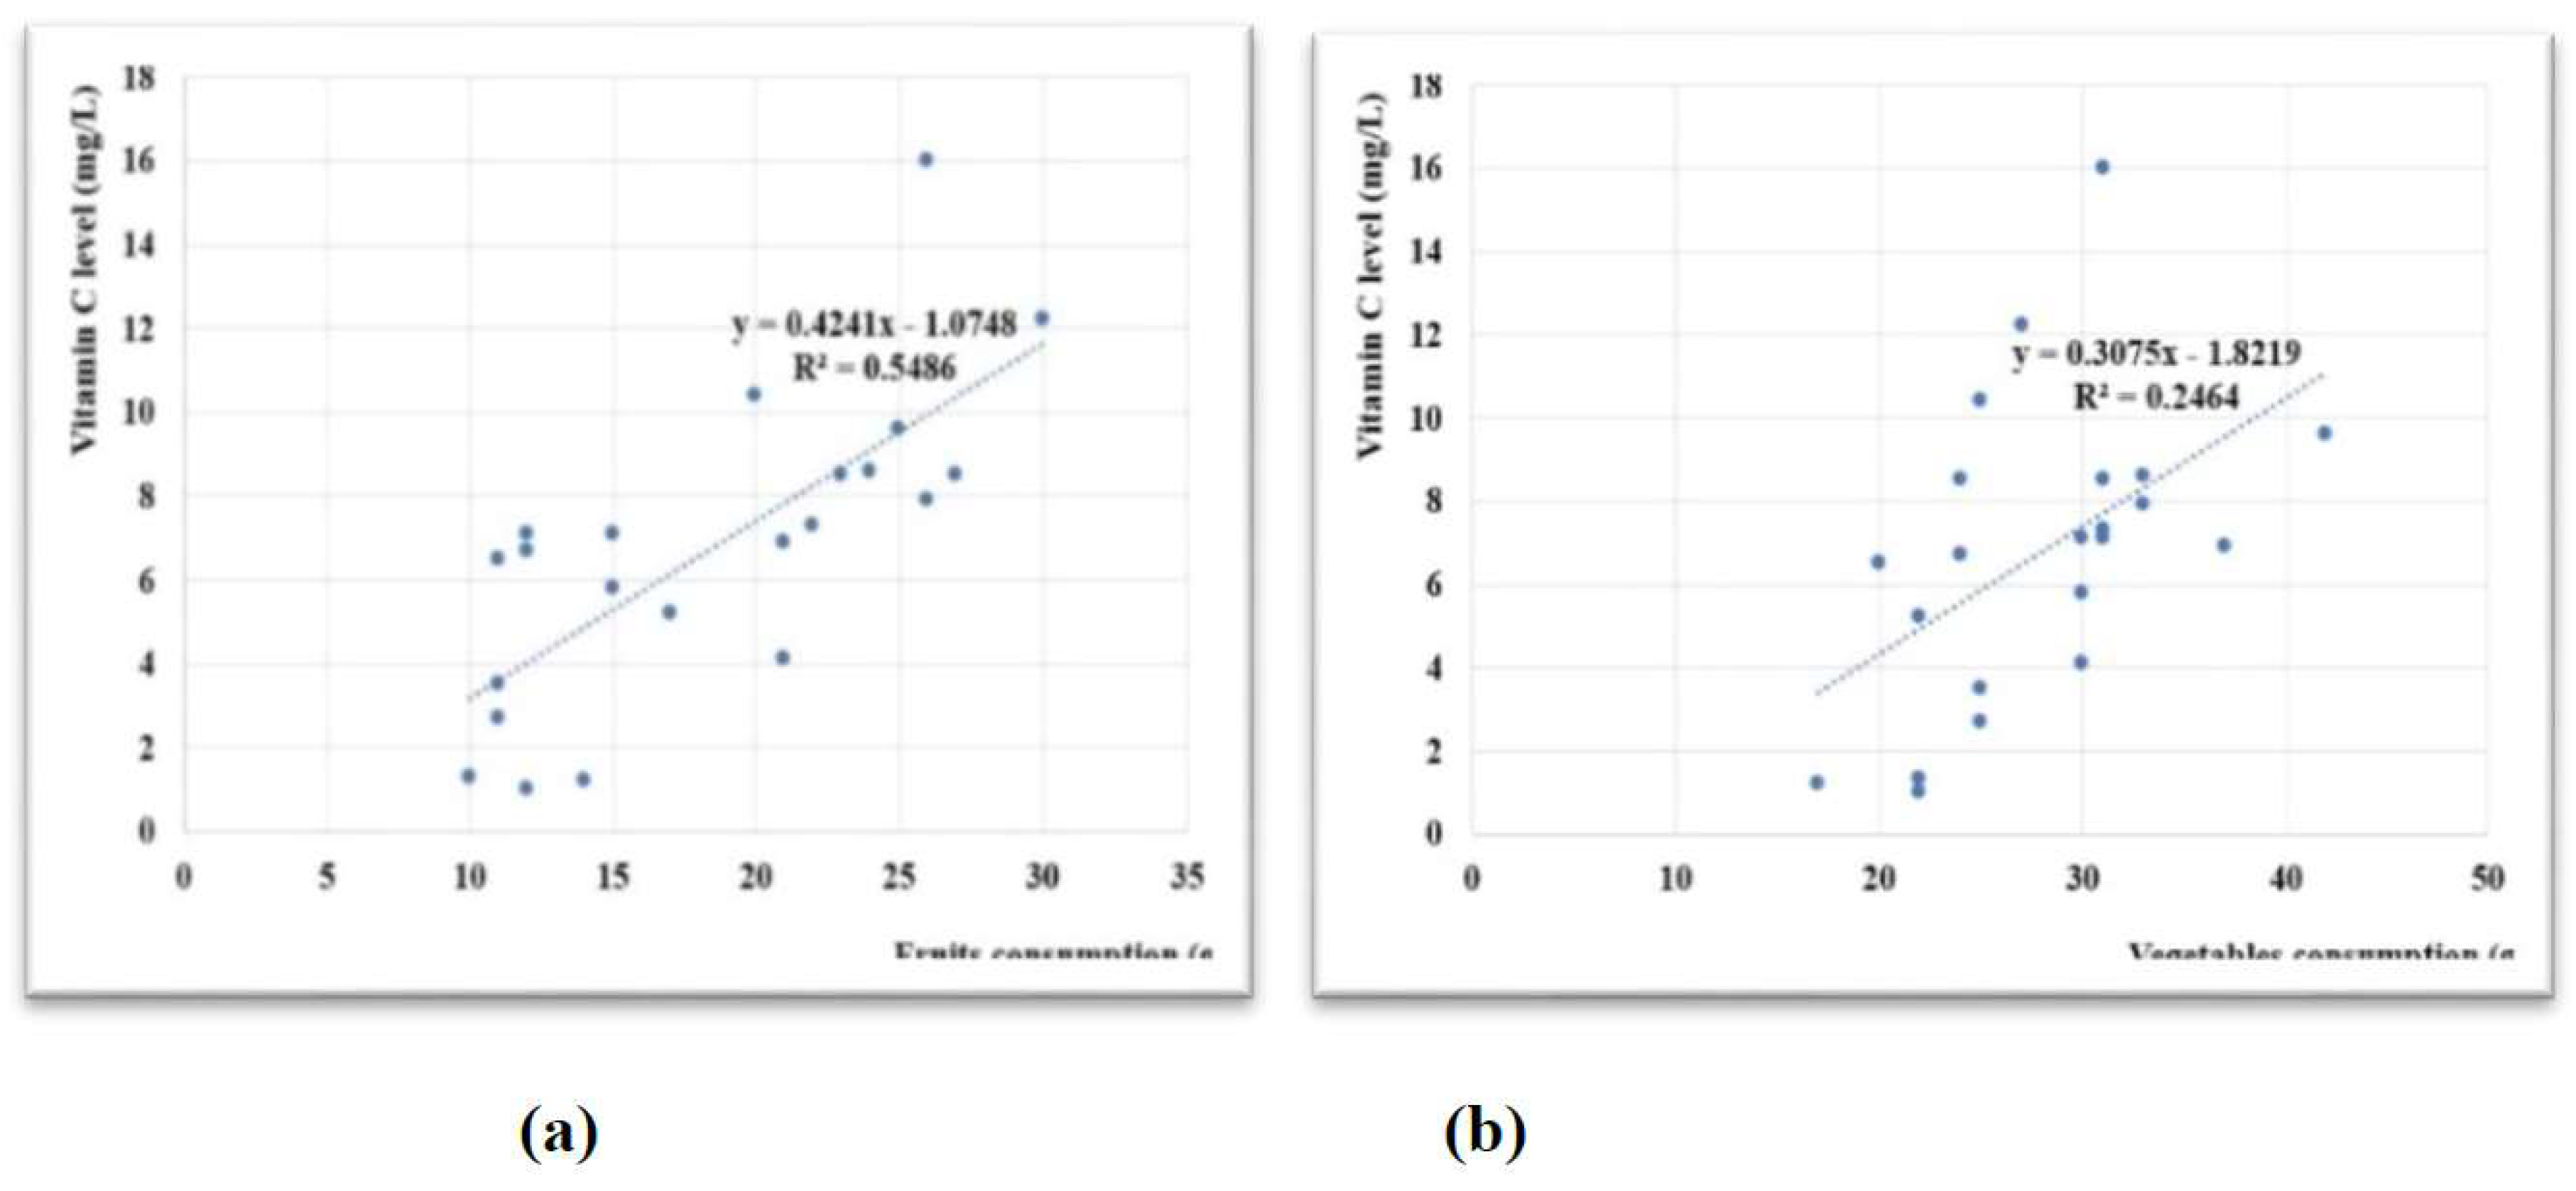
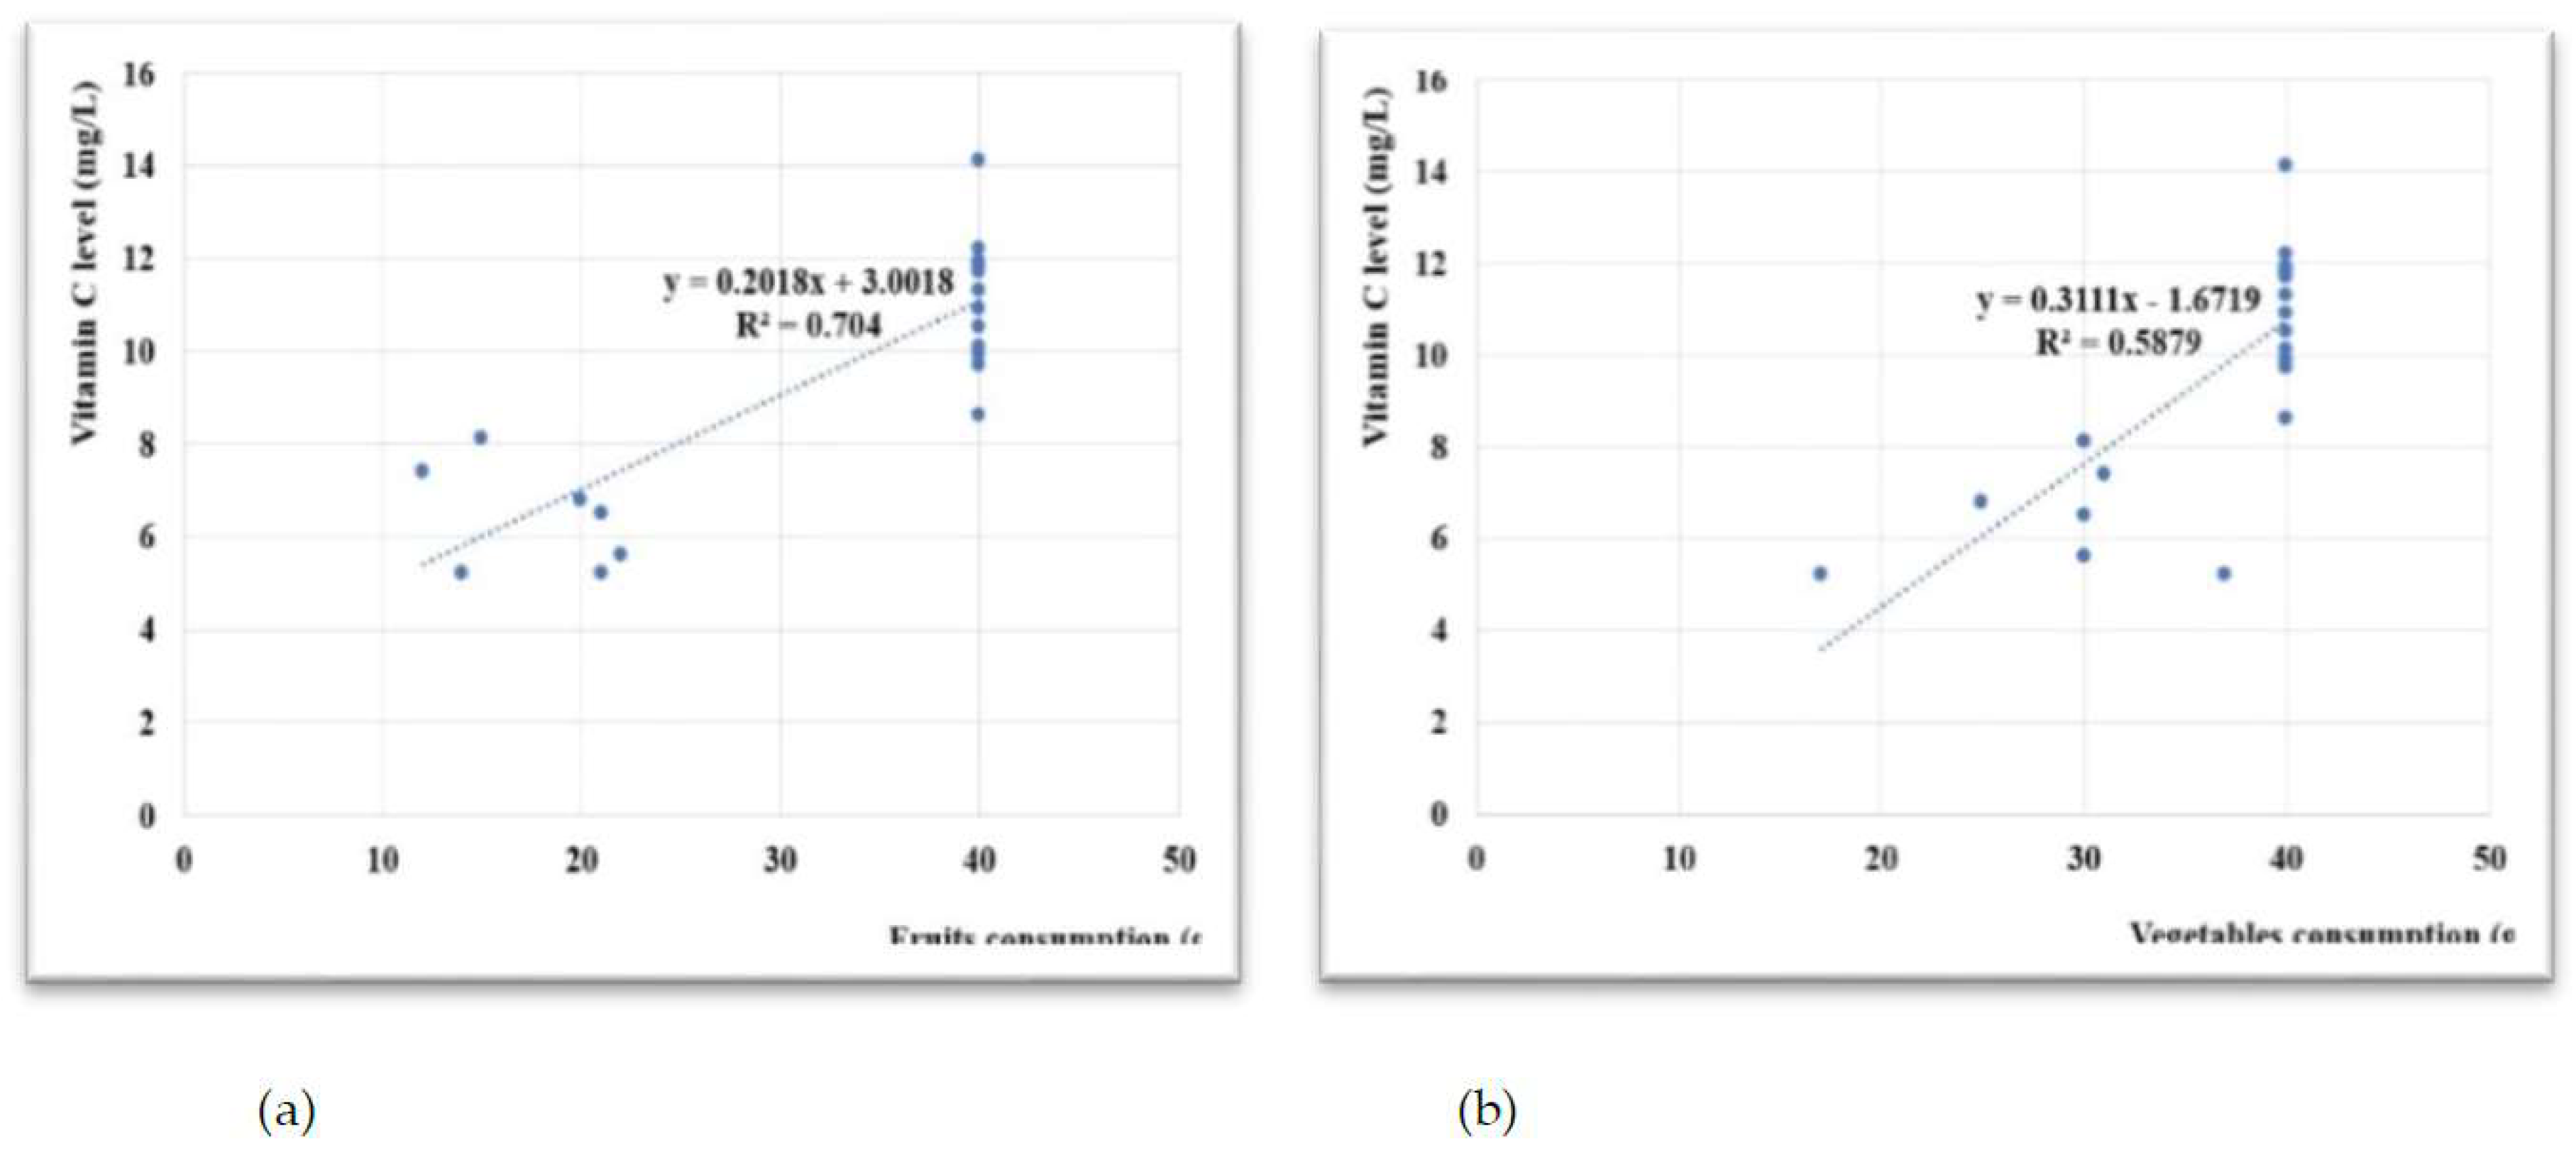
Table 4 presents a statistical correlation between the plasma vitamin C level and the consumption of fruits and vegetables at the beginning and at the end of the research.
The values in
Table 4 present a strong correlation between the consumption of fruits and the level of plasma vitamin C at the beginning of the research and a medium correlation between the consumption of vegetables and the level of plasma vitamin C. At the end of this study, there were found significant strong correlations between the consumption of fruits and vegetables and the level of vitamin C. All these results demonstrate that the consumption of fruits and vegetables which have a high content of vitamin C lead to enhanced levels of this vitamin in human plasma.
Figure 8.
Correlations between the consumption of (a) fruits and (b) vegetables vs. the vitamin C level at T1.
Figure 8.
Correlations between the consumption of (a) fruits and (b) vegetables vs. the vitamin C level at T1.
Figure 8 and
Figure 9 reveal positive correlations between the consumption of fruits and vegetables and the discovered vitamin C levels.
Some subjects consumed certain fruit and/or vegetables in higher amounts while barely or not at all consuming the others. This aspect changed for most individuals, once with the intervention of the nutritionist, who recommended reducing the consumption of some frequently consumed foods and the intake increase of other fruit and vegetables, thus diversifying the diet of the subjects involved in the study.
It was also observed that women have higher concentration of plasma vitamin C than men. However, the reasons of this observation need further elucidation studies. The results of the study point out that the lower plasma vitamin C concentrations in men compared to women, can be explained due to the higher fat-free mass in men. A special characteristic can be made by a varied series of potential factors such as age, anthropometric variables, the body composition (the total antioxidant status), the intake of vitamin C, lifestyle, the consumption of alcohol, smoking and the physical activity level [
16].
A very slightly increased trend towards the consumption of fruits and vegetables was found at women from Group I and III, but the differences between the men and women was not significantly (p= 0.104). No important difference was also found between men and women in the case of the vitamin C plasma levels for the entire group (42 subjects).
5. Conclusion
1.Although people who consumed minimum quantity of fruit and vegetables were chosen for the study, it was identified that the individuals had plasma vitamin C below the reference level (10% avitaminosis C, 28% hypovitaminosis C, 57% in normal limits and almost 5% hypervitaminosis C).
2. Following the study, a considerable increase in the plasma vitamin C level was achieved, in 72.73% of the subjects. Thus, it was obtained a more appropriate integration within the reference values. This is represented by a 36.59% increase in plasma vitamin C.
3. The diet group had a smaller increase in plasma vitamin C, and a significant decrease in certain individuals. The group with supplements had a greater increase in plasma vitamin C level and a small decrease in certain individuals. The group following a diet based on supplements had a significant increase in plasma vitamin C levels while no decreases were recorded. In conclusion, vitamin C associated with a proper diet can achieve the therapeutic objectives in a shorter time, than the separate prescription of various diets or supplements, even in healthy people. These aspects can indicate that food no longer has the same vitamin C content, raising an alarm signal about the way in which these food items are produced.
4. Following the study, a capping of the plasma vitamin C level was observed, which may indicate that the surplus of vitamin C is eliminated from the body through urine, but may also highlight a resistance of the body towards the accumulation of the vitamin C. However, further studies are needed in this field.
The plasma vitamin C level is very little influenced by the general daily consumption of products with a high vitamin C content. This aspect that may be due to: the frequency and number of products consumed and which have a high vitamin C content; the eating habits, the way the food is consumed (raw or thermally prepared) as well as the production and supply chain.
Instead, the plasma vitamin C level can be influenced by long-term diet, with regular consumption of food items containing vitamin C. In most cases it can also be influenced by the consumption of food supplements, thus obtaining faster results. However, the best results regarding the increase of plasma vitamin C levels can be obtained by associating a healthy diet with the consumption of vitamin C food supplements.
Since the adequate consumption of vitamin C (and vitamins in general) is very important, it is important to choose suitable food sources that ensure an adequate exogenous intake. In this sense, there is a need to educate the population and its orientation towards local producers and towards products that are as natural as possible, harvested when mature, grown in gardens or open air, but also towards specialists in the field of nutrition and dietetics, who can offer suitable recommendations and necessary support.
