Submitted:
30 December 2023
Posted:
03 January 2024
You are already at the latest version
Abstract
Diving decompression theory hypothesizes inflammatory processes as a source of micronuclei which could increase related risks. Therefore, we tested 10 healthy, male divers. They performed 6-8 dives with a maximum of two dives per day at depths ranging from 21 to 122 msw with CCR mixed gas diving. Post-dive VGE were counted by echocardiography. Saliva and urine samples were taken before and after each dive to evaluate to evaluate inflammation: ROS production, lipid peroxidation (8-iso-PGF2), DNA damage (8-OH-dG), cytokines (TNF-, IL-6, and neopterin). VGE exhibits a progressive reduction followed by an increase (p<0.0001) which parallels in-flammation responses. Indeed, ROS, 8-iso-PGF2, IL-6 and neopterin increases from 0.19 ± 0.02 to 1.13 ± 0.09 μmol.min−1 (p<0.001); 199.8 ± 55.9 to 632.7 ± 73.3 ng.mg-1 creatinine (p<0.0001); 2.35 ± 0.54 to 19.5 ± 2.96 pg.ml-1 (p<0.001); and 93.7 ± 11.2 to 299 ± 25.9 μmol·mol−1 creatinine (p=0.005), respectively. The variation after each dive was held constant around 158.3 ± 6.9% (p = 0.021); 151.4 ± 5.7% (p <0.0001); 176.3 ± 11.9% (p<0.0001); and 160.1 ± 5.6% (p<0.001), respectively. When oxy-inflammation reaches a certain level, it exceeds hormetic coping mechanisms allowing second-generation micronuclei substantiated by an increase of VGE after an initial continuous decrease consistent with a depletion of “first generation” pre-existing micronuclei.
Keywords:
Decompression physiology
; Venous gas emboli (VGE)
; Human
; Reactive oxygen species (ROS)
; Oxidative stress
; Inflammation
; DCS
; Hormesis
; Acute Phase Reactants
1. Introduction
Although SCUBA (self-contained underwater breathing apparatus) diving procedures have become safer over time, decompression sickness (DCS) remains a risk, that can be life threatening. Its pathophysiology is traditionally viewed as related to gas bubble formation during and following ascent, due to ambient pressure drop [1]. Then, the primary mechanisms of bubble production is related to the number and size of preexisting endothelial gas micronuclei also called static metabolic bubbles (SMB) [2]. However, the inconsistent presence of bubbles in human studies indicates the need for more dedicated research on their generation and their evolution over several consecutive days [3,4,5]. More, the exact pathophysiological mechanisms linking Vascular Gas Emboli (VGE) to DCS are still unclear. Therefore, additional pathological mechanisms contributing to the occurrence of DCS might be involved [6,7]. For example, functional changes in vascular wall as shown by impaired flow mediated dilation (FMD), endothelial microparticles or oxidative stress following the dive have been linked to the presence of VGE [8,9,10,11] but also to something called “decompression stress” without significant VGE presence, involving the direct effect of hydrostatic pressure or oxy-inflammation [12,13]. Nonetheless, the exact involvement of each of those mechanisms contributing to DCS remains unclear. It is however generally accepted that the absence of detectable VGE post-dive is correlated with a very low probability of DCS [6,14].
These discrepancies have also prompted investigations focused on inflammatory pathways [15,16,17,18]. Also, our previous data after one week of diving using closed circuit rebreathing (CCR) apparatus [3,4,19] mandate to investigate the inflammatory bubble production hypothesis (see Figure 1). This latter hypothesis is based on a “first and second hit” mechanism that cannot be considered fully subordinate to gas supersaturation. Indeed, this second mechanism is thought to be related to a pro-inflammatory/oxidative response following diving probably mediated by the presence/generation of microparticles (MPs) [20]. These MPs which are increased by repetitive and deep dives may enlarge on decompression as any of micronuclei. More, actual data suggest that some of them possess enzyme activity which provides a nucleation site for bubble formation (second generation micronuclei) [21,22,23]. Because MPs are more numerous and possess higher NOS2 concentrations post-dive somewhat in proportion to dive repetition and probably depth, this implies a greater potential for bubble nucleation and greater risk for bubble-induced vascular damage after such dives [22]. It should be noted that given the micro-dimensions of MPs, these “second-generation” bubbles related to MPs would still be below the detection limits of current ultrasound technology. Nevertheless, this mechanism could be at the root some adverse effects of repetitive deep diving since these non-visible bubbles can be fed by inert gas accumulation and form measurable VGE (Vascular Gas Emboli) [20].
The inflammatory response is of particular interest in the setting of deep CCR technical open water diving due to oxygen partial pressure variation as shown by the increase of IL-1β and NOS2 during repetitive deep CCR dives recently reported [20,22]. Indeed, CCR diving differs from typical SCUBA diving because exhaled gas is recycled (“re-breathed”) after carbon dioxide removal and oxygen supplementation. Although CCR diving is often done with custom-mixed gases adapted to the time and depth planned, rather than air (see Table 1), to decrease the risks of oxygen toxicity and nitrogen narcosis, oxygen partial pressure is kept within narrow limits using oxygen sensors around 1.3 ATA. Therefore, it must be reminded that we recently demonstrated different cellular reactions and microparticles production in humans exposed to different levels of oxygen partial pressure [13]. Interestingly, a partial pressure of 1.4 ATA was shown to influence MP production levels [13,24,25].
Since the use of CCR with “hypoxic” breathing mixture allows the diver to reach much deeper depths than traditional open circuit divers, we wanted to consolidate our data on bubble evaluation and spirometry after deep dives (Over 100m depth). Indeed, respiratory efficiency has been proposed as a mean by which gas exchange and thus bubble production may be influenced [5,27]. Moreover, CCR diving allows us to eliminate some of the confounding variables posed by breathing air. Therefore, we wanted to investigate how several days of intensive deep diving interfere with bubble production as well as oxidative and inflammatory markers. To the best of our knowledge, such a set of measurements in a group of divers as never been performed and follows some of our previous works. This description of VGE evolution through the week, in parallel with previously published inflammatory reactions [19] and spirometry [3,5,27] may add to the understanding of diving physiopathology.
2. Materials and Methods
This is an observational field-study conducted in accordance with the Declaration of Helsinki [28], and approved by the Academic Ethical Committee of Brussels (B200-2020-088).
2.1. Population
After obtention of full written informed consent, 10 non-smoking, experienced divers (all males; mean age 44 ± 10 years; body mass index 24 ± 3.1 kg/m2, minimum certification “Hypoxic Trimix CCR diving” according to European norm EN 14153-2 or ISO 24801-2 with at least 300 logged dives) were recruited for this study (see Table 1).
None of the participants had a history of previous of DCS. All of them were in overall good health with regular but not excessive physical activity (aerobic exercise one to three times a week). No severe cardiac abnormalities were detected during the pre-inclusion medical assessment. However, some of them were under medication such as statins (n=2), anti-hypertensive medication (n=2), and sulfonylureas for blood sugar control (n=2). Nonetheless, all participants held a valid medical clearance for diving at the time of the study.
Finally, they were instructed to abstain from any physical activity and diving for 72 h [10] prior to the experimental protocol. Alcohol intake was prohibited before diving.
2.2. The Dives
Dives were conducted from a 36-m dive boat based out of Hurghada—Egypt over a 6-day period with two dives a day (surface interval of 3 to 4 h) on day 1, and 2, followed by 4 days with a single dive at increasing depth up to 100 msw deep or beyond (Table 2). Weather conditions were good with daily air temperature between 25 and 30 °C, and surface water temperature between 24 and 28 °C.
All divers used JJ-CCRs rebreather (JJ-CCR ApS, Presto, Denmark) equipped with an integrated multi-gas decompression computer Petrel 2 (Shearwater Research Inc, Richmond, BC, Canada). with build-in ZHL-16C algorithm, to incorporate the readings from the CCR O2 cells to calculate decompression requirements. These calculations were made based on a trimix diluent (A mixture containing Oxygen, Helium and Nitrogen in various proportion) customized according to depth and a fixed O2 set point at depth and for the ascent at 1.3 ATA. During the decompression phase, O2 set point was manually increased when arriving at a depth of 6 msw to be between 1.5 and 1.6 ATA (i.e., breathing 100% O2).
For safety reason, divers also carried 3–4 off-board (“bail-out”) dive tanks to allow an independent return to the surface in the event of CCR failure. These “stage cylinders” (or “stages”) contained either trimix, nitrox or pure oxygen depending on the decompression planning (Figure 2).
During the dive, divers used their diving computer to manage the decompression requirements. However, based on experience and utilization of dive-planning software, most participants had a fair idea of the required total dive time and final stop time for a given bottom time. Each diver had the liberty to personalize their own decompression schedule as desired, by selecting a different “conservatism” by means of gradient factors (GF), determining maximum allowed supersaturation limits for the deep and shallow parts of the dive. In general, bottom time was planned on estimated decompression obligation rather than gas requirements. It must be stressed out that it was not the purpose of the research team to recommend any specific diving procedure. Its only aim was to monitor divers and provide an insight of their post-dive physiological status and VGE dynamics. Therefore, the research team did not comment any of diver’s choices even if most of dives can be categorized as an “extreme exposure” according to the DCIEM decompression tables. Therefore, it was the decision of any diver to participate or not to each dive, which was not the case. These choices are resumed in Table 2.
2.3. Spirometry Measurements
Spirometry parameters (including FVC, FEV1, PEF, and FEF25-75) were taken at rest the first day before any dive and 30 min after each dive. They were recorded outside the water using a portable spirometer (Spirobank II Smart; MIR Medical International Research Srl, Rome, Italy) according to GLI standards (Global Lung Initiative 2017 for Caucasian adults [29]). All measurements are resting measurements, they were obtained by a trained operator with subjects being seated erect and not wearing diving suit. The reported values are the best of three eligible tests.
2.4. Bubble Analysis
Although imperfect, it is now accepted that research projects can use VGE data as a surrogate endpoint for decompression stress [14,30]. According to current recommendations, cardiac echography is the gold standard for VGE detection [31]. During field studies, bubbles are usually detected in the right atrium, and graded according to different systems. In this study, during an apical 4 chamber view, echocardiographic VGE signals over the 1 min recording were evaluated by frame-based bubble counting as described by Germonpré et al [32].
Using two-dimensional echocardiography technique by two operators (CB, CL) and two echocardiography machines (M9, Mindray, Echomedic, Ghent, Belgium and Sonosite M-Turbo, FUJIFILM Sonosite Inc, Amsterdam, The Netherlands), five measurements were taken post-dive. In this study, during an apical 4 chamber view, echocardiographic VGE signals were evaluated by frame-based bubble counting as described by Germonpré et al [32]. They were made at rest (without flexion) and following active provocation by two deep knee bends (with flexion (noted FLEX in the graphs)). In total, 5 videos of 15 cardiac cycles were recorded for each dive at 15 minutes post dive, 30, 45, 60 and 120 minutes. Post-dive measurements were taken after surfacing but allowing limited time for divers undressing and storing their rebreathers (CCR). They were coming back and forth to the echography station for measurements. This was made possible because the groups of divers were divided in three to four sections that were not entering the water at the same time and were therefore not surfacing together. Every echocardiographic measurement had a duration of around 60-90 seconds.
At a later stage, these recordings were reviewed to analyze 10 consecutive frames in end-diastolic/protosystolic position and perform a formal bubble counting procedure. Then, the VGE peak count per heartbeat were averaged over these 10 frames, the resulting number was rounded to the closest digit and kept as final result. The counting was performed independently twice by two trained scientists acquainted with the method used (CB, CL). The numbers of VGE considered for calculation were those that reached consensus.
2.5. Saliva and Urine Measurements
Previously reported data [19] on microparticle production after a week of deep CCR diving gave us a clear view of increasing inflammatory response along the diving week. Therefore, to evaluate the building up inflammatory process and inert gas intake in a supersaturated environment we collected saliva, and urinary samples before and after each dive.
Saliva samples were collected by Salivette® (Sarstedt, Nümbrecht, Germany). after subjects were instructed on the correct use of these devices. Approximately 1 mL of saliva was obtained and used to determine levels of Reactive Oxygen Species (ROS), and tumor necrosis factor (TNF-α).
Urine samples were collected by the participants, voluntary voiding in a sterile container and used to determine level of interleukin-6 (IL-6), lipid peroxidation (8-isoprostane (8-iso-PGF2)), DNA damage (8-OH-2-deoxyguanosine (8-OH-dG)) creatinine and neopterin concentrations.
Biofluids were stored at 4 °C in a cooler on board and then then stored in multiple aliquots at − 20 °C until assayed [33]. All biological measurements were made according to the manufacturer’s instructions by previously described methods [33,34,35,36].
Reactive Oxygen Species (ROS) production rate measurement was performed by an Electron Paramagnetic Resonance (EPR) X-band spectrometer (E-Scan-Bruker® BioSpin, GmbH, MA, USA). The ROS production rate was calculated from the EPR spectra saliva samples. All spectra were collected by adopting the same acquisition parameters and handled by the standardly supplied by Bruker® software (Win EPR System, V. 2.11). All data were, in turn, converted in absolute concentration levels (μmol·min−1).
Lipid peroxidation (8-iso-PGF2) and DNA damage (8-OH-dG) were assessed in urineby competitive immunoassay (Cayman Chemical, Ann Arbor, MI, USA) measuring concentration in ng.mg-1 creatinine and pg.mg1 creatinine, respectively. Both biomarkers concentrations were determined using a standard curve. Samples and standards were spectrophotometrically (Infinite M200, Tecam, Austria) read at a wavelength between 405 and 420 nm and at 412 nm, and 420 nm respectively.
TNF-α, and IL-6, saliva concentrations were determined by using ultrasensitive ELISA immunoassays kits (R&D Systems, Minneapolis, MN, USA). The assays were based on a double-antibody sandwich technique. Sample concentrations were determined spectrophotometrically for TNF-α at 412 nm, and for IL-6 at 450 nm (Infinite M200, Tecam, Austria).
The determinations were assessed in duplicate, and the inter-assay coefficient of variation was in the range indicated by the manufacturer.
Creatinine and neopterin concentrations were measured by an isocratic high-pressure liquid chromatography (HPLC) method.
2.6. Statistical Analysis
All statistical tests were performed using a standard computer statistical package, GraphPad Prism version 9.00 for MacOS (GraphPad Software, San Diego, CA, USA).
Normality of data was verified by means of Kolmogorov-Smirnoff or Shaphiro-Wilk tests allowing us to assume a Gaussian distribution. Since each diver is his own control, data were analyzed using one-way repeated measures ANOVA with Dunnet multiple comparison or Tukey post-hoc test if the Gaussian distribution was not ascertained, Friedman with Dunn’s post-test was preferred.
Taking the first pre-dive measurement as 100 %, spirometry and biological changes were calculated at the end of each dive, allowing an appreciation of the magnitude of change rather than the absolute values. If the Gaussian distribution could be assumed, our sample mean was compared to the hypothetical mean of 100% using a One-sample t-test otherwise a Wilcoxon Signed Rank test was preferred.
A threshold of p < 0.05 was considered statistically significant. All data are presented as mean ± standard error on the mean (SEM).
3. Results
There were no incidents of divers breaching their decompression profile as calculated by their dive computers. None of them developed any symptoms of DCS. All divers flew home safe and sound more than 48 h after the last dive.
The following results refer to recording made after the 21 man-dives performed at 100m depth and beyond whose basic parameters can be found in Table 3.
The first Interesting feature is that none of the measurements, VGE production, spirometry changes or biological analysis (but for IL-6), are correlated to the exposure factor (EF) defined according to Hempleman’s formula as the product of [37], nor to the bubble grade when possible. Nonetheless, with a mean EF of 96 ± 6 (>25), all the analyzed dives must be considered as exceptional exposure.
3.2. Spirometry Evolution
The results obtained after the last deep dive (8th) at a depth of 118 ± 3.5 msw was compared to the baseline measurements (100%), which were taken on the first day of the cruise before any dive (Figure 5). At the end of week, FVC, FEV1, PEF and FEF25-75 were decrease by 4.8 ± 8.3%, 4.3 ± 7.3%, 3 ± 10.5%, 1.8 ± 9.6% respectively. Only the FEV1/FC ratio was increased by 0.6 ± 2.8%. Although these differences by the end of the diving week were not statistically significant, the FVC’s trend exhibited an almost significant decrease with the repetition of dives (p=0.055).
Figure 2.
Evolution of respiratory parameters after a week of cumulated deep diving with CCR (8 dives). Percentual changes of spirometry parameters. Pre-dive values are taken as reference (100%). (Data are expressed as mean ± SD; ns: not significant, Wilcoxon matched-pair rank signed test).
Figure 2.
Evolution of respiratory parameters after a week of cumulated deep diving with CCR (8 dives). Percentual changes of spirometry parameters. Pre-dive values are taken as reference (100%). (Data are expressed as mean ± SD; ns: not significant, Wilcoxon matched-pair rank signed test).
3.2. Post-Dive Vascular Gas Emboli Evolution
Results of the echocardiographic frame-based bubble counting (BBs per Heartbeat) are shown in Figure 3, Figure 4 and Figure 5.
Given that all 100 msw-dives showed the same VGE production chronological pattern, we present the deepest dive (Maiden wreck) as an example (Figure 3). Independently of the time of measurement, VGE production is increased by 25 ± 140% after active provocation by two deep knee bends (p between 0.01 and 0.0002, Wilcoxon matched-pair rank signed test), but for the last measurement at 120 minutes (p= 0.14, Wilcoxon matched-pair rank signed test). VGE peaked between 45- and 60-minutes post-dive (p=0.03, Friedman test with Dunn’s post-test).
On the pooled analysis (Figure 3), it was possible to quantify the mean bubble count per cardiac cycle. At rest and after active provocation by two deep knee bends, it was respectively 2 ± 2 and 4 ± 5 at 15 min (p=0.0005), 3 ± 2 and 6 ± 4 at 30 min (p<0.0001), 3 ± 2 and 7 ± 6 at 45 min (p=0.0001), 2 ± 3 and 6 ± 6 at 60 min (p=0.0002), and 1 ± 2 and 3 ± 4 at 120 min (p=0.0002). The difference between the rest and flex conditions is highly significant (Wilcoxon matched-pair rank signed test). Difference between times of measurement was highly significant both at rest (p=0.0006, Friedman test) and flex condition (p=0.0008, Friedman test). The 45 minutes post-dive measurement was significantly different from the other measurements in both conditions (p=0.08, Dunn’s post-test).
Finally, these dives to 100 meters and beyond are part of a much broader program during the whole week. Therefore, the same measurements were done after each first dive of the day to give an appreciation of the magnitude of change in VGE production across time (Figure 5). Evolution is characterized by a reduction in VGE production from day 1 to day 5, before increasing again on day 6. However, only the day 5 measurement was statistically significant from all other measurement (p<0.0001, Friedman test with Dunn’s post-test).
3.3. Post-Dive Biological Parameters
The absolute-, relative-variation and time course of the oxidative-stress related parameters (mean ± SEM) are displayed in Figure 6.
The ROS production rate significantly increased through the diving week from 0.19 ± 0.02 to 1.13 ± 0.09 μmol.min−1 after the last dive (p < 0.001, one-way RM-ANOVA). When we consider the deepest dive from 89 msw and beyond, the pre- and post-dive difference is significant (one-way RM-ANOVA). With respect to the baseline values, each dive is followed by a significant mean increase of the production rate equal to 158.3 ± 6.9% (p = 0.021, One-sample t-test). However, there is no difference between each daily increase (p=0.21, one-way RM-ANOVA). Finally, we observe a progressive build-up of ROS which is highly correlated to the time-course (R2 0.98, p<0.0001).
Lipid peroxidation evaluated through 8-iso-PGF2 exhibited the same pattern as ROS from 199.8 ± 55.9 to 632.7 ± 73.3 ng.mg-1 creatinine after the last dive (p<0.0001; one-way RM-ANOVA). The increase after each dive is held constant and equal to 151.4 ± 5.7% (p <0.0001, One-sample t-test). Correlation with time course is also significant (R2 0.79, p=0.002).
DNA damage also exhibits a similar pattern but for the build-up through the diving week (R2 0.10, p=0.52). Indeed, 8-OH-dG increases from 1.07 ± 0.21 to 8.33 ± 0.6 ng.mg-1 creatinine after the last dive (p<0.001; one-way RM-ANOVA). The increase after each dive is held constant around 190.4 ± 15.6% (p <0.001, One-sample t-test). However, no progressive build-up was exhibited by DNA damage.
Inflammation response was evaluated through the measurement of IL-6, TNF-α and neopterin. Although TNF-α plays an important role in the inflammatory response by activating the expression some proinflammatory genes and the leukocyte adhesion to vessels [38], no significant changes were observed in the present study. Indeed, with respect to the baseline values, each dive is followed by slight variation of 101.4 ± 0.3% (p=0.07, One-sample t-test) from 37.1 ± 2.9 to 41.4 ± 3.4 pg.ml-1 (p=0.42; one-way RM-ANOVA). Therefore, only IL-6 and neopterin are shown on Figure 7.
The proinflammatory state is confirmed by both the increase of neopterin from 93.7 ± 11.2 to 299 ± 25.9 μmol·mol−1 creatinine (p=0.005; one-way RM-ANOVA) and IL-6 from 2.35 ± 0.54 to 19.5 ± 2.96 pg.ml-1 (p<0.001; one-way RM-ANOVA) after the last dive. The variation after each dive was held constant around 160.1 ± 5.6% and 176.3 ± 11.9% respectively (p<0.001 and p <0.0001 respectively, One-sample t-test). These variations were responsible for a progressive linear build-up strongly correlated with time-course (R2 0.85, p<0.0001 and R2 0.79, p=0.002, respectively).
4. Discussion
Although the exact sequence of events leading to DCS is not fully elucidated yet, it is acknowledged that DCS is a multifactorial pathology. Indeed, it involves several physiological pathways such as inflammation [11], coagulation [39] or vascular dysfunction [40] that unite to produce what is called decompression stress. Nowadays research projects use VGE data as a surrogate endpoint to evaluate decompression stress [14,30]. Although VGE detection techniques improve (from acoustic Doppler to visual 2D echocardiography to second harmonics echocardiography), there obviously is a size limit below which no VGE will be detected [1,41]. The limits of the sensibility of VGE detection methods imply that small, undetected VGE (less than 22 micrometer [42]) might pass the pulmonary vasculature (which acts as a bubble ‘filter’ [43]) and exert influence in the arterial vascular bed. Therefore, the limitations associated with VGE grade as a surrogate indicator of decompression stress may explain some possible misinterpretation. Hence the need of secondary endpoints.
For instance, a reduction in ventilatory flow has been reported repeatedly after wet scuba diving [44]. This reduction appears to be more marked in divers with impaired ventilatory function, as indicated by a greater decrease in PEF in divers with history of asthma compared with control divers [45]. Consistent with existing data in the literature, we found that VFC, FEV1, PEF and FEF 25-75 were lower after the dive, with a magnitude similar to that previously reported [3]. It is also demonstrated that this reduction increased with exposure. Therefore, we can hypothesize that this can be partly related to VGE circulating across the lung filter. Alternatively, divers using constant partial pressure of oxygen CCRs for multi-day, multi-dive expeditions could potentially experience cumulative oxygen exposures above the current recommended limits. However, it has already been suggested that oxygen toxicity seems not to be a primary factors neither after a single dive [46] nor after repeated dives over an 8 to 12 days period [47].
According to our results, VGE production pattern over time suggests a biphasic mechanism. Indeed, VGE start forming during the off gassing of tissues in the decompression (ascent) phase of a dive and are believed to result from the triggering of bubble precursors (nuclei) into growth. The precise mechanism of micronuclei formation is still debated, with possible sites being located on facilitating endothelial surface regions with surfactants, hydrophobic surfaces, or crevices [1,41,48,49] (see Figure 1). However, the presumed micronuclei-originated VGE production is consistent with the observation that a certain form of “acclimatization” to decompression stress seems to exist, with a higher probability of VGE for the first dives after a period of non-diving [4,49,50]. This is consistent with the progressive reduction of VGE production (depletion of pre-existing micronuclei) even in the presence of provocative dive to 100 msw and beyond.
However, previous studies have also pointed out a significant inter-subject variability to VGE for a same diving exposure [51]. There is also a large intra-individual variation, indicating that diving time and nitrogen pressure are not the only determinants of VGE formation. Indeed, oxidative stress is not necessarily a manifestation of toxicity and organ damage, but it seems to be involved in the pro-inflammatory effects response to diving among humans.
Normally, in response to tissue injury, non-immune and immune cells released cytokines such as IL-1β, TNF-α or interferon-γ (IFN-γ), which in turns are important for the expression of inflammatory mediators such as prostaglandins, leukotrienes, platelet-activating factor or IL-6 [52]. However, TNF-α was not modified in the present study. Nonetheless, based on lipid peroxidation, and IL-6, our results suggest this proinflammatory response is well present requiring alternatives hypothesis.
Firstly, studies with human have demonstrated that during the high-pressure phase and before decompression, there are elevations in microparticles (MPs) number and those expressing filamentous (F-) actin on the membrane surface [22,53]. Similar responses occur in a murine DCS model. Although their pathophysiological role in diving remains unclear if MPs are purified and injected into naïve mice, they cause a similar collection of symptoms as seen in decompressed mice [11,22,23]. Finally, it has also to be reminded that a previous study demonstrated that some individuals may exhibit a more exuberant NOS2 or IL-1β production, such that nucleation-site-carrying MPs generate more VGE in response to diving [19].
Secondly, with a PpO2 setpoint between 1.3 and 1.6 ATA, exposure to constant hyperoxia cannot be separated from CCR diving, may led to those significant increases. Indeed, hyperbaric hyperoxia has been associated to an increase in oxidative stress leading to nuclear factor (erythroid-derived 2)-like 2 (NRF2) and nuclear factor-kappa B NF-κB activation, accompanied by the synthesis of glutathione (GSH) [54]. These pathways have already been considered in Scuba diving [55,56] and seem to be mediated through the expression of nitric oxide (NO), whose enzymes are at the forefront of ROS signaling system [57]. Indeed, NO has a potent biphasic effect on NF-κB activity and possesses the ability to both up- and down-regulate the expression of a number of proinflammatory proteins, including IL-6 [58]. Also, maintaining IL-6 levels in a physiological range are necessary to keep inflammatory responses in control [59]. Since, the expression of IL-6 is mainly regulated by the activation of NF-κB [60], which is dependent on oxygen levels and ROS production, we can hypothesize that the oxy-inflammation is at the system’s core of decompression [61,62]. This hypothesis is also supported by 8-iso-PGF2 increase, which depends on the availability of hydroxyl radicals and by neopterin measurements. This is consistent with former studies demonstrating that 8-iso- PGF2 is increased during hyperoxic oral breathing [63], which was the case during this study. Neopterin is synthesized by human IFN-g-stimulated macrophages and is indicative of a proinflammatory status, paralleling the increase of ROS which depends on PpO2.
Finally, it is interesting to note that despite a constant daily variation, we observe a progressive build-up of ROS and 8-iso-PGF2 while this is not the case for DNA damage. This suggests that the complex endogenous antioxidant system including enzymes such as superoxide dismutase, GSH and catalase is exceeded [64]. Therefore, we can assume that these different mechanisms may combine themselves and when oxy-inflammation reaches a certain level, it exceeds hormetic coping mechanisms.
This study represents a field observation and has some important limitations for which further investigation is needed to confirm the results. The main limitation of the present study is obviously the relatively small number of participants although more participants would be difficult to analyze in a timely manner. Moreover, the participants were not homogenous or necessarily similar in body composition (age, weight, fat/lean mass distribution) and were not tested to be “consistent bubblers” before the experiments (this would have required at least three extra identical “control” dives [65]). On the other hand, this study builds on established modern methods of evaluation of decompression stress and current theories of VGE generation. The measured effects are consistent with the theoretical rationale and do not require complicated new hypotheses. Finally, the equipment used for these experiments are readily available, inviting other research groups to repeat the study.
5. Conclusions
This study emphasizes the role of oxy-inflammation that could explain the latter increase of VGE production after the deepest dive at the end of the week. Indeed, above a certain level of inflammation than can be reached along the repetition of dives, some hormetic controlling mechanisms are exceeded and the ensuing MP’s serve as second-generation micronuclei increasing the risk of decompression illness. Since this study demonstrated that all modification were not related to the exposure and that little non-significant alteration was present in spirometry, it must be hypothesized that decompression risk is related to the capacity of dealing with the acute phase reactants. Although difficult to perform due to the provocative aspect of deep diving, larger studies are encouraged to confirm these results.
Author Contributions
All authors listed have made a substantial, direct, and intellectual contribution to the work, and approved it for publication: Conceptualization: CB, CL, PL, FG; Investigation, CL, CB, SMS, AV; Formal analysis, CB, PL, PG, FT, CL, FG, SMS, AV,PW; Writing, PL, PG, CB, FT, PW, SMS, AV; Review and editing, PL, CL, FT, PW, FG, CB. All authors have read and agreed to the published version of the manuscript.
Funding
This research received financial support from DAN Europe and DAN USA (grant N° Apocaliptrip 2023 DAN-ISEK-2023-CBal). The sponsors had no role in the design and conduct of the study; collection, management, analysis, and interpretation of the data; preparation, review, or approval of the manuscript; and the decision to submit the manuscript for publication.
Institutional Review Board Statement
This study was conducted in accordance with the Declaration of Helsinki and approved by the Bio-Ethical Committee for Research and Higher Education, Brussels under reference B 200-2020-088 on 10/10/2020.
Informed Consent Statement
Informed consent was obtained from all subjects involved in the study.
Data Availability Statement
The datasets used and analyzed during the current study are available from the corresponding author on reasonable request.
Acknowledgments
Authors are grateful to volunteer participants who accepted to give their time and gently offered themselves for measurements, Mr Faisal Khalaf owner of Red Sea Explorers, Hurgada, Egypt: (https://www.redseaexplorers.com) together all crew members for hosting and helping us during the expedition, DAN (USA and Europe) for supporting our expedition.
Conflicts of Interest
The authors declare no conflict of interest.
References
- Papadopoulou, V.; Tang, M.-X.; Balestra, C.; Eckersley, R.J.; Karapantsios, T.D. Circulatory bubble dynamics: From physical to biological aspects. Adv. Colloid Interface Sci. 2014, 206, 239–249. [CrossRef]
- Imbert, J.-P.; Egi, S.M.; Germonpré, P.; Balestra, C. Static Metabolic Bubbles as Precursors of Vascular Gas Emboli During Divers’ Decompression: A Hypothesis Explaining Bubbling Variability. Front. Physiol. 2019, 10, 807. [CrossRef]
- Gouin, E.; Balestra, C.; Orsat, J.; Dugrenot, E.; L’her, E. Pulmonary Effects of One Week of Repeated Recreational Closed-Circuit Rebreather Dives in Cold Water. Medicina 2022, 59, 81. [CrossRef]
- Balestra, C.; Guerrero, F.; Theunissen, S.; Germonpré, P.; Lafère, P. Physiology of repeated mixed gas 100-m wreck dives using a closed-circuit rebreather: a field bubble study. Eur. J. Appl. Physiol. 2021, 122, 515–522. [CrossRef]
- Dugrenot, E.; Balestra, C.; Gouin, E.; L’her, E.; Guerrero, F. Physiological effects of mixed-gas deep sea dives using a closed-circuit rebreather: a field pilot study. Eur. J. Appl. Physiol. 2021, 121, 3323–3331. [CrossRef]
- Mollerlokken, A.; Gaustad, S. E.; Havnes, M. B.; Gutvik, C. R.; Hjelde, A.; Wisloff, U.; Brubakk, A. O., Venous gas embolism as a predictive tool for improving CNS decompression safety. Eur J Appl Physiol 2012, 112, 401-9. [CrossRef]
- Vann, R. D.; Butler, F. K.; Mitchell, S. J.; Moon, R. E., Decompression illness. Lancet 2011, 377, 153-64. [CrossRef]
- Brubakk, A.O.; Duplancic, D.; Valic, Z.; Palada, I.; Obad, A.; Bakovic, D.; Wisløff, U.; Dujic, Z. A single air dive reduces arterial endothelial function in man. J. Physiol. 2005, 566, 901–906. [CrossRef]
- Lambrechts, K.; Pontier, J. M.; Balestra, C.; Mazur, A.; Wang, Q.; Buzzacott, P.; Theron, M.; Mansourati, J.; Guerrero, F., Effect of a single, open-sea, air scuba dive on human micro- and macrovascular function. Eur J Appl Physiol 2013, 113, 2637-45. [CrossRef]
- Obad, A.; Palada, I.; Valic, Z.; Ivančev, V.; Baković, D.; Wisløff, U.; Brubakk, A.O.; Dujić, . The effects of acute oral antioxidants on diving-induced alterations in human cardiovascular function. J. Physiol. 2007, 578, 859–870. [CrossRef]
- Thom, S.R.; Yang, M.; Huang, S.; Milovanova, T.N.; Brugniaux, J.V.; Coombs, G.B.; Barak, O.F.; Dujic, Z.; Sekhon, M.S.; Ainslie, P.N.; et al. Microparticles initiate decompression-induced neutrophil activation and subsequent vascular injuries. J. Appl. Physiol. 2011, 110, 340–351. [CrossRef]
- Thom, S.R.; Bennett, M.; Banham, N.D.; Chin, W.; Blake, D.F.; Rosen, A.; Pollock, N.W.; Madden, D.; Marroni, A.; Balestra, C.; et al. Association of microparticles and neutrophil activation with decompression sickness. J. Appl. Physiol. 2015, 119, 427–434. [CrossRef]
- Balestra, C.; Arya, A. K.; Leveque, C.; Virgili, F.; Germonpre, P.; Lambrechts, K.; Lafere, P.; Thom, S. R., Varying Oxygen Partial Pressure Elicits Blood-Borne Microparticles Expressing Different Cell-Specific Proteins-Toward a Targeted Use of Oxygen? Int J Mol Sci 2022, 23, 7888. [CrossRef]
- Doolette, D.J. Venous gas emboli detected by two-dimensional echocardiography are an imperfect surrogate endpoint for decompression sickness. Diving Hyperb Med. 2016, 46, 4–10.
- Francis, T.J.; Pearson, R.R.; Robertson, A.G.; Hodgson, M.; Dutka, A.J.; Flynn, E.T. Central nervous system decompression sickness: latency of 1070 human cases. Undersea and Hyperbaric Med. 1988, 15, 403–17.
- Bigley, N.J.; Perymon, H.; Bowman, G.C.; Hull, B.E.; Stills, H.F.; Henderson, R.A. Inflammatory Cytokines and Cell Adhesion Molecules in a Rat Model of Decompression Sickness. J. Interf. Cytokine Res. 2008, 28, 55–63. [CrossRef]
- Martin, J.D.; Thom, S.R. Vascular leukocyte sequestration in decompression sickness and prophylactic hyperbaric oxygen therapy in rats. Aviat Space Environ Med. 2002, 73, 565–9.
- Mitchell, S.J.; Bennett, M.H.; Moon, R.E. Decompression Sickness and Arterial Gas Embolism. New Engl. J. Med. 2022, 386, 1254–1264. [CrossRef]
- Arya, A.K.; Balestra, C.; Bhopale, V.M.; Tuominen, L.J.; Räisänen-Sokolowski, A.; Dugrenot, E.; L’her, E.; Bhat, A.R.; Thom, S.R. Elevations of Extracellular Vesicles and Inflammatory Biomarkers in Closed Circuit SCUBA Divers. Int. J. Mol. Sci. 2023, 24, 5969. [CrossRef]
- Arya, A.K.; Balestra, C.; Bhopale, V.M.; Tuominen, L.J.; Räisänen-Sokolowski, A.; Dugrenot, E.; L’her, E.; Bhat, A.R.; Thom, S.R. Elevations of Extracellular Vesicles and Inflammatory Biomarkers in Closed Circuit SCUBA Divers. Int. J. Mol. Sci. 2023, 24, 5969. [CrossRef]
- Arya, A.K.; Balestra, C.; Bhopale, V.M.; Tuominen, L.J.; Räisänen-Sokolowski, A.; Dugrenot, E.; L’her, E.; Bhat, A.R.; Thom, S.R. Elevations of Extracellular Vesicles and Inflammatory Biomarkers in Closed Circuit SCUBA Divers. Int. J. Mol. Sci. 2023, 24, 5969. [CrossRef]
- Bhopale, V.M.; Ruhela, D.; Brett, K.D.; Nugent, N.Z.; Fraser, N.K.; Levinson, S.L.; DiNubile, M.J.; Thom, S.R. Plasma gelsolin modulates the production and fate of IL-1β-containing microparticles following high-pressure exposure and decompression. J. Appl. Physiol. 2021, 130, 1604–1613. [CrossRef]
- Thom, S.R.; Bhopale, V.M.; Yu, K.; Yang, M. Provocative decompression causes diffuse vascular injury in mice mediated by microparticles containing interleukin-1β. J. Appl. Physiol. 2018, 125, 1339–1348. [CrossRef]
- Balestra, C.; Virgili, F.; Simona, M.-S., Oxygen Variations. 1 ed.; MDPI: Basel, 2023; p 170.
- Balestra, C.; Mrakic-Sposta, S.; Virgili, F., Oxygen Variations-Insights into Hypoxia, Hyperoxia and Hyperbaric Hyperoxia - Is the Dose the Clue? International Journal of Molecular Sciences 2023, 24, 13472. [CrossRef]
- Arieli, R. Taravana, vestibular decompression illness, and autochthonous distal arterial bubbles. Respir. Physiol. Neurobiol. 2018, 259, 119–121. [CrossRef]
- Bosco, G.; Rizzato, A.; Quartesan, S.; Camporesi, E.; Mrakic-Sposta, S.; Moretti, S.; Balestra, C.; Rubini, A. Spirometry and oxidative stress after rebreather diving in warm water. Undersea Hyperb. Med. 2018, 45, 191–198. [CrossRef]
- World Medical, A., World Medical Association Declaration of Helsinki: ethical principles for medical research involving human subjects. JAMA 2013, 310, 2191-4. [CrossRef]
- Stanojevic, S.; Graham, B.L.; Cooper, B.G.; Thompson, B.R.; Carter, K.W.; Francis, R.W.; Hall, G.L. Official ERS technical standards: Global Lung Function Initiative reference values for the carbon monoxide transfer factor for Caucasians. Eur. Respir. J. 2017, 50, 1700010. [CrossRef]
- Balestra, C.; Germonpré, P.; Rocco, M.; Biancofiore, G.; Kot, J. Diving physiopathology: the end of certainties? Food for thought. Minerva Anestesiol. 2019, 85, 1129–1137. [CrossRef]
- Møllerløkken, A.; Blogg, S.L.; Doolette, D.J.; Nishi, R.Y.; Pollock, N.W. Consensus guidelines for the use of ultrasound for diving research. Diving Hyperb Med 2016, 46, 26–32.
- Germonpré, P.; Papadopoulou, V.; Hemelryck, W.; Obeid, G.; Lafère, P.; Eckersley, R.J.; Tang, M.-X.; Balestra, C. The use of portable 2D echocardiography and 'frame-based' bubble counting as a tool to evaluate diving decompression stress. Diving Hyperb Med 2014, 44, 5–13.
- Giacon, T.A.; Bosco, G.; Vezzoli, A.; Dellanoce, C.; Cialoni, D.; Paganini, M.; Mrakic-Sposta, S. Oxidative stress and motion sickness in one crew during competitive offshore sailing. Sci. Rep. 2022, 12, 1–11. [CrossRef]
- Bosco, G.; Giacon, T.A.; Paolocci, N.; Vezzoli, A.; Della Noce, C.; Paganini, M.; Agrimi, J.; Garetto, G.; Cialoni, D.; D’alessandro, N.; et al. Dopamine/BDNF loss underscores narcosis cognitive impairment in divers: a proof of concept in a dry condition. Eur. J. Appl. Physiol. 2022, 123, 143–158. [CrossRef]
- Mrakic-Sposta, S.; Gussoni, M.; Moretti, S.; Pratali, L.; Giardini, G.; Tacchini, P.; Dellanoce, C.; Tonacci, A.; Mastorci, F.; Borghini, A.; Montorsi, M.; Vezzoli, A., Effects of Mountain Ultra-Marathon Running on ROS Production and Oxidative Damage by Micro-Invasive Analytic Techniques. PLoS One 2015, 10, e0141780. [CrossRef]
- Mrakic-Sposta, S.; Vezzoli, A.; D’Alessandro, F.; Paganini, M.; Dellanoce, C.; Cialoni, D.; Bosco, G. Change in Oxidative Stress Biomarkers During 30 Days in Saturation Dive: A Pilot Study. Int. J. Environ. Res. Public Health 2020, 17, 7118. [CrossRef]
- Balestra, C.; Cialoni, D.; Buzzacott, P.; Hemelryck, W.; Papadopoulou, V.; Pieri, M.; Marroni, A., Chapter 1: Recreationnal diving today: decompression habits, DAN Europe database insights. In The Science of Diving. , Balestra, C.; Germonpré, P., Eds. LAP Lambert Academic Publishing: Saarbrücken, 2014; pp 13-36.
- Jarosz-Griffiths, H.H.; Holbrook, J.; Lara-Reyna, S.; McDermott, M.F. TNF receptor signalling in autoinflammatory diseases. Int. Immunol. 2019, 31, 639–648. [CrossRef]
- Lambrechts, K.; de Maistre, S.; Abraini, J. H.; Blatteau, J. E.; Risso, J. J.; Vallee, N., Tirofiban, a Glycoprotein IIb/IIIa Antagonist, Has a Protective Effect on Decompression Sickness in Rats: Is the Crosstalk Between Platelet and Leukocytes Essential? Front Physiol 2018, 9, 906. [CrossRef]
- Mazur, A.; Lambrechts, K.; Wang, Q.; Belhomme, M.; Theron, M.; Buzzacott, P.; Guerrero, F. Influence of decompression sickness on vasocontraction of isolated rat vessels. J. Appl. Physiol. 2016, 120, 784–791. [CrossRef]
- Papadopoulou, V.; Eckersley, R.J.; Balestra, C.; Karapantsios, T.D.; Tang, M.-X. A critical review of physiological bubble formation in hyperbaric decompression. Adv. Colloid Interface Sci. 2013, 191-192, 22–30. [CrossRef]
- Hills, B.A.; Butler, B.D. Size distribution of intravascular air emboli produced by decompression. Undersea Biomed Res. 1981, 8, 163–70.
- Carturan, D.; Boussuges, A.; Burnet, H.; Fondarai, J.; Vanuxem, P.; Gardette, B. Circulating Venous Bubbles in Recreational Diving: Relationships with Age, Weight, Maximal Oxygen Uptake and Body Fat Percentage. Int. J. Sports Med. 1999, 20, 410–414. [CrossRef]
- Pougnet, R.; Henckes, A.; Mialon, P.; Lucas, D.; Pougnet, L.; Garlantézec, R.; Lodde, B.; Dewitte, J.-D., Evolution of the ventilatory function of professional divers over 10 years. Undersea Hyperb Med 2013, 40, 339-43. [CrossRef]
- Edge, C., The effect of scuba diving on airflow obstruction in divers with asthma. Diving Hyperb Med 2016, 46, 120-1.
- Ooij, P.J.A.M.V.; A Van Hulst, R.; Houtkooper, A.; Van Der Weide, T.J.S.; Sterk, P.J. Lung function before and after oxygen diving: a randomized crossover study. Undersea Hyperb Med. 2012, 39, 699–707.
- Fock, A.; Harris, R.; Slade, M. Oxygen exposure and toxicity in recreational technical divers. Diving Hyperb Med. 2013, 43, 67–71.
- Papadopoulou, V.; Evgenidis, S.; Eckersley, R.J.; Mesimeris, T.; Balestra, C.; Kostoglou, M.; Tang, M.-X.; Karapantsios, T.D. Decompression induced bubble dynamics on ex vivo fat and muscle tissue surfaces with a new experimental set up. Colloids Surfaces B Biointerfaces 2015, 129, 121–129. [CrossRef]
- Arieli, R.; Arieli, U.; Marmur, A. Bubble size on detachment from the luminal aspect of ovine large blood vessels after decompression: The effect of mechanical disturbance. Respir. Physiol. Neurobiol. 2015, 216, 1–8. [CrossRef]
- Zanchi, J.; Ljubkovic, M.; Denoble, P.J.; Dujic, Z.; Ranapurwala, S.; Pollock, N.W. Influence of Repeated Daily Diving on Decompression Stress. Int. J. Sports Med. 2013, 35, 465–468. [CrossRef]
- Papadopoulou, V.; Germonpré, P.; Cosgrove, D.; Eckersley, R.J.; Dayton, P.A.; Obeid, G.; Boutros, A.; Tang, M.-X.; Theunissen, S.; Balestra, C. Variability in circulating gas emboli after a same scuba diving exposure. Eur. J. Appl. Physiol. 2018, 118, 1255–1264. [CrossRef]
- Hirano, T., IL-6 in inflammation, autoimmunity and cancer. Int Immunol 2021, 33, 127-148. [CrossRef]
- Brett, K.D.; Nugent, N.Z.; Fraser, N.K.; Bhopale, V.M.; Yang, M.; Thom, S.R. Microparticle and interleukin-1β production with human simulated compressed air diving. Sci. Rep. 2019, 9, 1–8. [CrossRef]
- Fratantonio, D.; Virgili, F.; Zucchi, A.; Lambrechts, K.; Latronico, T.; Lafère, P.; Germonpré, P.; Balestra, C. Increasing Oxygen Partial Pressures Induce a Distinct Transcriptional Response in Human PBMC: A Pilot Study on the “Normobaric Oxygen Paradox”. Int. J. Mol. Sci. 2021, 22, 458. [CrossRef]
- Cialoni, D.; Brizzolari, A.; Samaja, M.; Pieri, M.; Marroni, A. Altered Venous Blood Nitric Oxide Levels at Depth and Related Bubble Formation During Scuba Diving. Front. Physiol. 2019, 10, 57. [CrossRef]
- Theunissen, S.; Guerrero, F.; Sponsiello, N.; Cialoni, D.; Pieri, M.; Germonpré, P.; Obeid, G.; Tillmans, F.; Papadopoulou, V.; Hemelryck, W.; et al. Nitric oxide-related endothelial changes in breath-hold and scuba divers. Undersea Hyperb Med. 2013, 40, 135–44.
- Burtenshaw, D.; Hakimjavadi, R.; Redmond, E.M.; Cahill, P.A. Nox, Reactive Oxygen Species and Regulation of Vascular Cell Fate. Antioxidants 2017, 6, 90. [CrossRef]
- Connelly, L.; Palacios-Callender, M.; Ameixa, C.; Moncada, S.; Hobbs, A. J., Biphasic Regulation of NF-κB Activity Underlies the Pro- and Anti-Inflammatory Actions of Nitric Oxide. J Immunol 2001, 166, 3873–81. [CrossRef]
- Stoner, L.; Lucero, A.A.; Palmer, B.R.; Jones, L.M.; Young, J.M.; Faulkner, J. Inflammatory biomarkers for predicting cardiovascular disease. Clin. Biochem. 2013, 46, 1353–1371. [CrossRef]
- Brasier, A. R., The nuclear factor-kappaB-interleukin-6 signalling pathway mediating vascular inflammation. Cardiovasc Res 2010, 86, 211-8. [CrossRef]
- Mrakic-Sposta, S.; Vezzoli, A.; Garetto, G.; Paganini, M.; Camporesi, E.; Giacon, T.A.; Dellanoce, C.; Agrimi, J.; Bosco, G. Hyperbaric Oxygen Therapy Counters Oxidative Stress/Inflammation-Driven Symptoms in Long COVID-19 Patients: Preliminary Outcomes. Metabolites 2023, 13, 1032. [CrossRef]
- Brizzolari, A.; Bosco, G.; Vezzoli, A.; Dellanoce, C.; Barassi, A.; Paganini, M.; Cialoni, D.; Mrakic-Sposta, S. Seasonal Oxy-Inflammation and Hydration Status in Non-Elite Freeskiing Racer: A Pilot Study by Non-Invasive Analytic Method. Int. J. Environ. Res. Public Health 2023, 20, 3157. [CrossRef]
- Levenez, M.; Lambrechts, K.; Mrakic-Sposta, S.; Vezzoli, A.; Germonpré, P.; Pique, H.; Virgili, F.; Bosco, G.; Lafère, P.; Balestra, C. Full-Face Mask Use during SCUBA Diving Counters Related Oxidative Stress and Endothelial Dysfunction. Int. J. Environ. Res. Public Health 2022, 19, 965. [CrossRef]
- Leveque, C.; Sposta, S.M.; Theunissen, S.; Germonpré, P.; Lambrechts, K.; Vezzoli, A.; Bosco, G.; Lévénez, M.; Lafère, P.; Guerrero, F.; et al. Oxidative Stress Response Kinetics after 60 Minutes at Different (1.4 ATA and 2.5 ATA) Hyperbaric Hyperoxia Exposures. Int. J. Mol. Sci. 2023, 24, 12361. [CrossRef]
- Germonpré, P.; Balestra, C. Preconditioning to Reduce Decompression Stress in Scuba Divers. Aerosp. Med. Hum. Perform. 2017, 88, 114–120. [CrossRef]
Figure 1.
Schematic representation of actual Bubbles development theories during decompression phases. In supersaturated tissues and plasma, pre-existing “seeds” are needed to develop gas phase circulating vascular gas emboli (VGE). Those pre-existing micro-nuclei and other micronucleation sites (Active hydrophobic spots (AHS)) are considered “first generation micronuclei”. Once in circulation they can either be eliminated by the lungs (bubbles “filter”) or keep on growing while being fed by surrounding gas supersaturation. Another theory of Bubbles development is related to the Inflammatory response due to Oxygen partial pressure variation (Oxy-inflammation) or white blood cells elicited microparticles (MPs). Those MPs can contain gas and expand their volume as other micronuclei. They can also strip out some debris of the AHS which can also act as micronuclei. Another parameter to consider is the flow velocity that can be reduced in terminal vessels where even very small gas emboli can increase their volume and provoke ischemia since the longer time the longer “feeding” opportunity to increase volume and trigger some terminal vessel embolization that can fit some symptoms like for instance cerebellar or inner ear decompression diseases [26].
Figure 3.
VGE production pattern based on the example of the last dive of the week (Maiden wreck, 101-122 msw). The two conditions (rest and flex) are for every time point 15, 30, 45, 60, 120 minutes after diving. (Data are presented as means ± SEM; n=9; ns: not significant, *: p<0.05, **: p<0.01, ***: p<0.001; Wilcoxon matched-pair rank signed test for intra-time comparison, Friedman test for inter-time comparison).
Figure 4.
Pooled analysis of VGE Production of all 100 msw-dives (n=21). Results are presented as pre-post graphs for every individual. The two conditions (rest and flex) are shows for every time point 15, 30, 45, 60, 120 minutes after diving. (Data are presented as means ± SEM; ns: not significant, ***: p<0.001, ****:P<0.0001; Wilcoxon matched-pair rank signed test for intra-time comparison, Friedman test for inter-time comparison).
Figure 5.
Evolution of VGE peak after the first dive of the day across the whole week. Total bubble count per heartbeat is calculated for every first dive of the day and every diver. (Data are expressed as means ± SEM; ns: not significant, **: p<0.01, ***: p<0.001; Friedman with Dunn’s post-test).
Figure 5.
Evolution of VGE peak after the first dive of the day across the whole week. Total bubble count per heartbeat is calculated for every first dive of the day and every diver. (Data are expressed as means ± SEM; ns: not significant, **: p<0.01, ***: p<0.001; Friedman with Dunn’s post-test).
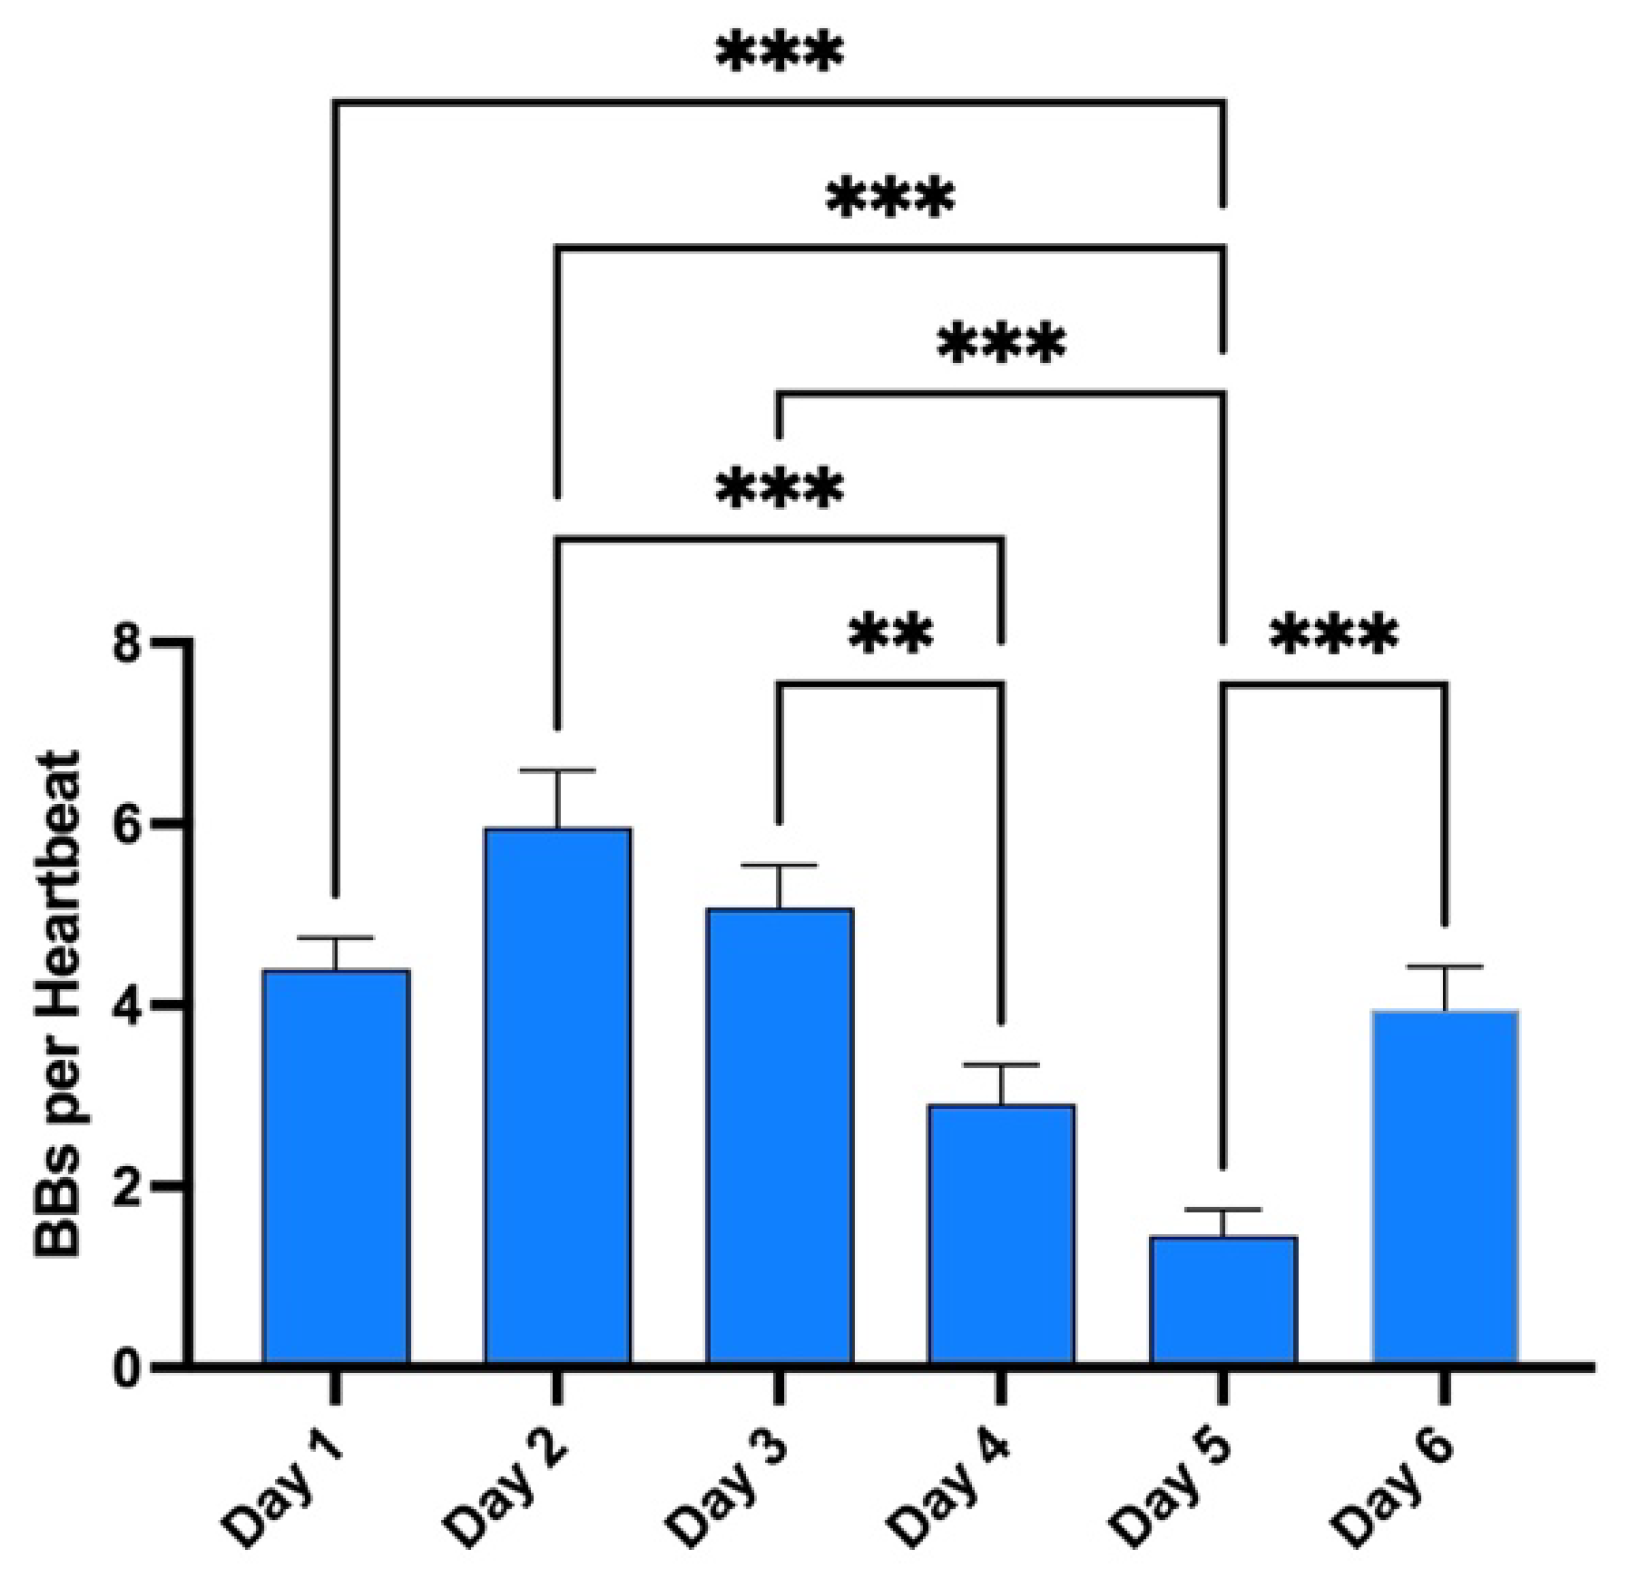
Figure 6.
Oxidative stress: Absolute-, relative-variation and time course of: (A) Reactive Oxygen Species (ROS) production rate (μmol·min−1), (B) lipid peroxidation (8-iso-PGF2; ng.mg-1 creatinine), (C) DNA damage (8-OH-dG pg.mg-1 creatinine) before and after each dive. (Data are expressed as mean ± SEM; * p < 0.05, ** p < 0.01, *** p < 0.001, one-way RM-ANOVA with Tukey’s post-test or One-sample t-test).
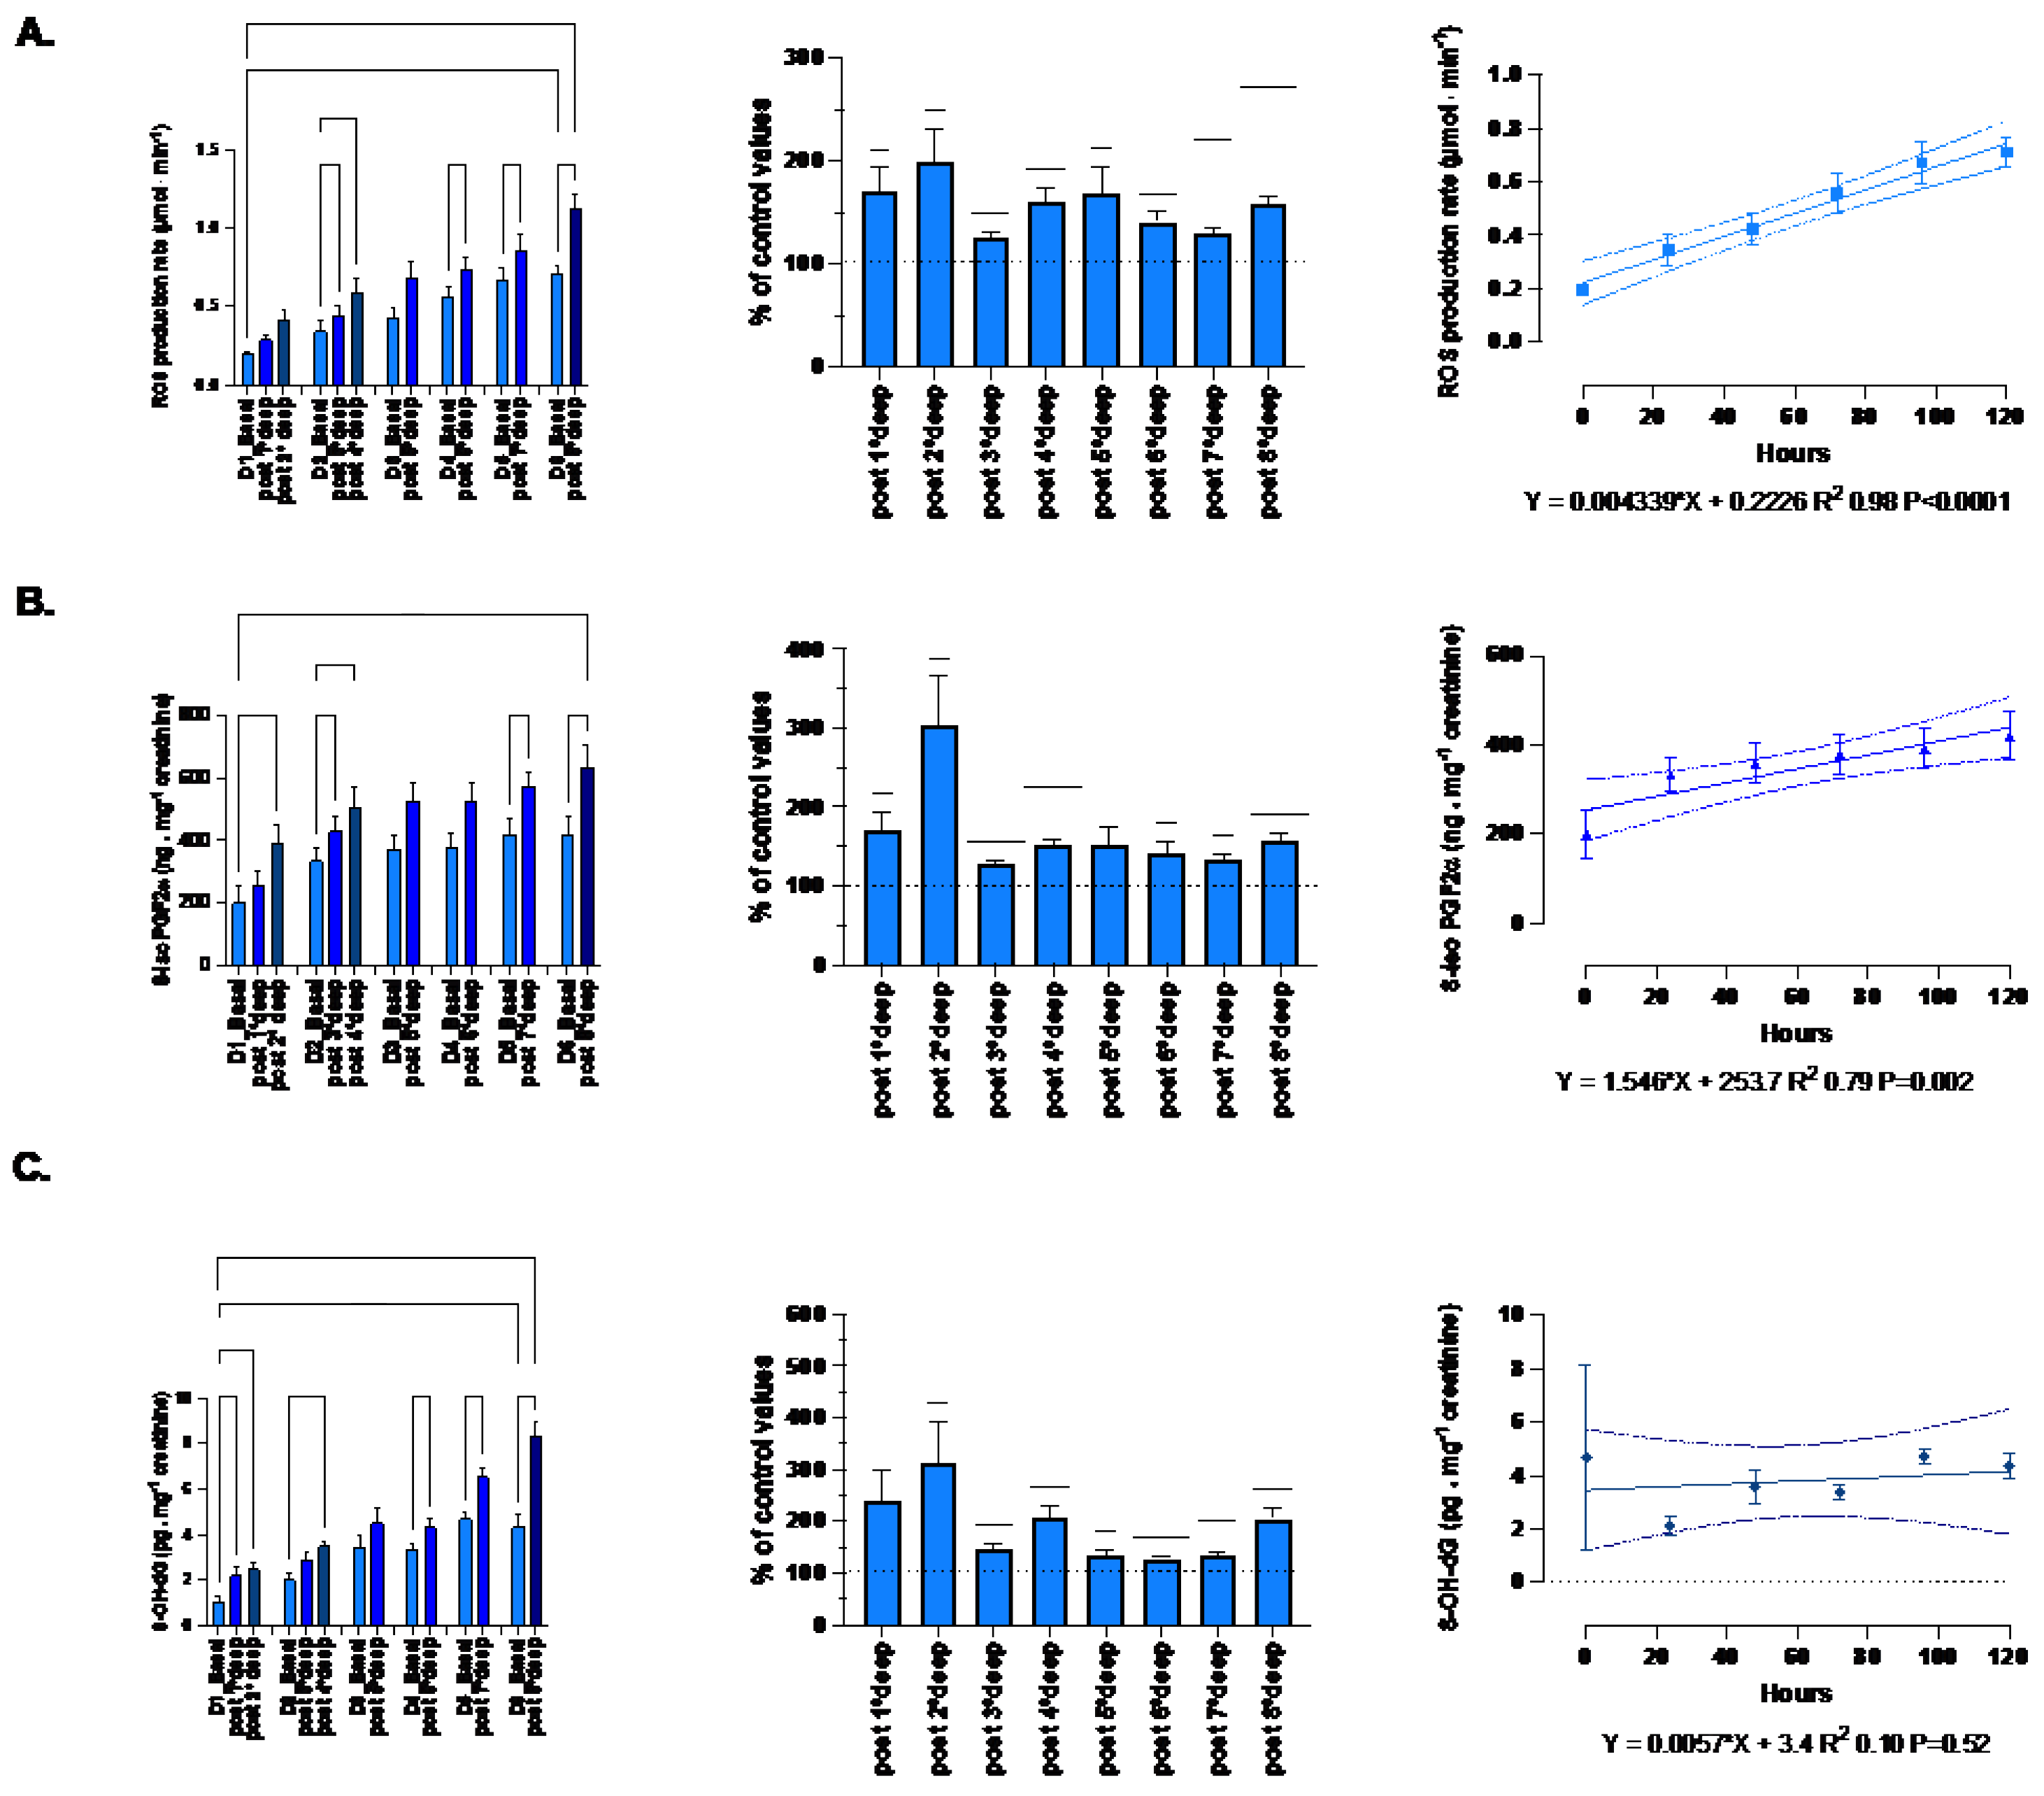
Figure 7.
Inflammation: Absolute-, relative-variation, time course of: (A) Neopterin (μmol·mol−1 creatinine) (B) Interleukin (IL)-6 (pg.ml-1), before and after each dive. (Data are expressed as mean ± SEM; * p < 0.05, ** p < 0.01, *** p < 0.001, one-way RM-ANOVA with Tukey’s post-test or One-sample t-test).
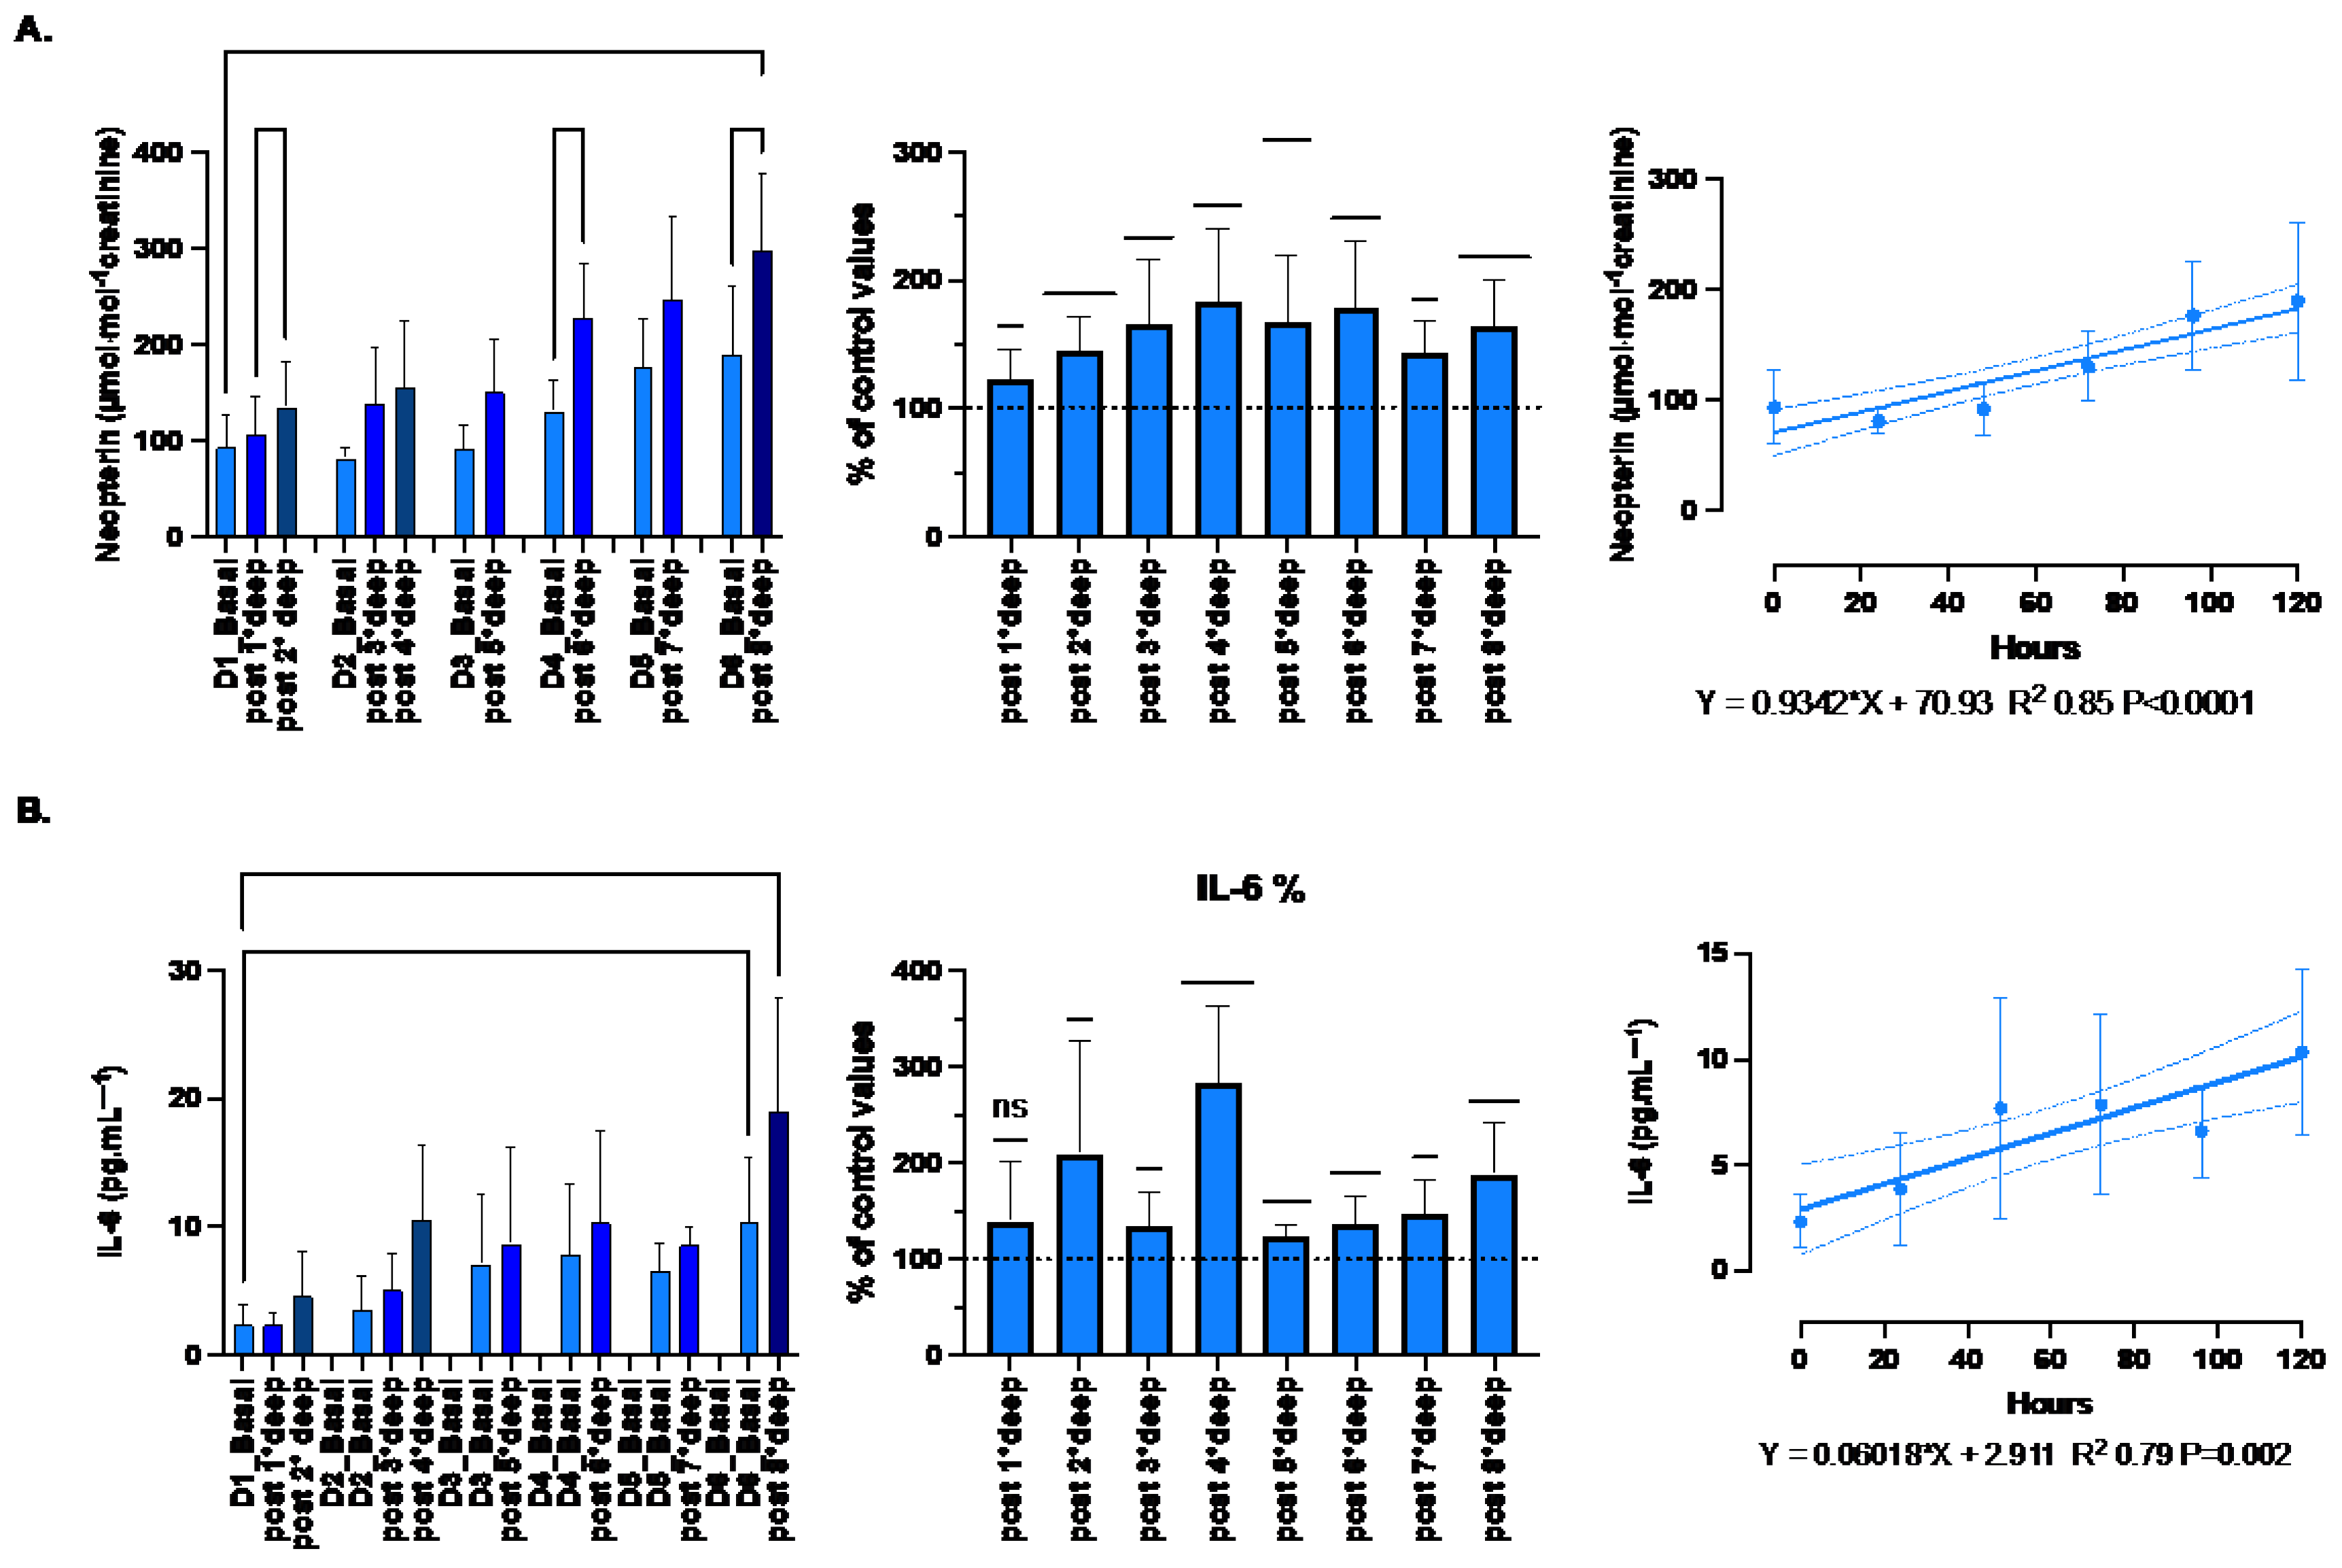

Table 1.
Subjects’ characteristics before the first dive (BMI: Body Mass Index, BF: Body Fat).
| Diver 1 | Diver 2 | Diver 3 | Diver 4 | Diver 5 | Diver 6 | Diver 7 | Diver 8 | Diver 9 | Diver 10 | Mean [Range] | |
| Age | 58 | 27 | 44 | 54 | 33 | 50 | 43 | 54 | 46 | 35 | 44 [27-58] |
| Weight (Kg) | 66 | 76.5 | 81 | 72.9 | 76 | 83.2 | 79 | 75.3 | 91 | 68 | 77 [66-91] |
| Height (cm) | 180 | 183 | 173 | 181 | 193 | 181 | 172 | 178 | 175 | 178 | 179 [172-193] |
| BMI (Kg/m2) | 20.4 | 22.8 | 27.1 | 22.2 | 20.4 | 25.4 | 26.7 | 23.8 | 29.7 | 21.5 | 24 [20.4-29.7] |
| BF (%) | 15.0 | 18.9 | 25.5 | 16.2 | 18.3 | 24.9 | 24.0 | 17.8 | 23.3 | 14.6 | 19.9 [14.6-25.5] |
| Experience (years) | 13 | 13 | 29 | 40 | 10 | 36 | 21 | 19 | 26 | 16 | 22 [10-40] |
| Experience (dives) | 800 | 1000 | 10,000 | 1500 | 600 | 5480 | 1800 | 700 | 700 | 7000 | 2958 [600-10,000] |
| Max depth (msw) | 100 | 116 | 124 | 120 | 131 | 136 | 125 | 100 | 100 | 116 | 117 [100-136] |
Table 2.
Summary of the week schedule (Day/dive, Dn.dn). Number of divers involved in each dive, Diluent Mixes composition using a helium/O2 analyzer (ATA PRO, Analox, UK), Gradient Factors (Low (GF-L) and High (GF-H)), depth and dive duration (Runtime). Results are presented as mean and [min-max].
Table 2.
Summary of the week schedule (Day/dive, Dn.dn). Number of divers involved in each dive, Diluent Mixes composition using a helium/O2 analyzer (ATA PRO, Analox, UK), Gradient Factors (Low (GF-L) and High (GF-H)), depth and dive duration (Runtime). Results are presented as mean and [min-max].
| D1.d1 | D1.d2 | D2.d1 | D2.d2 | D3.d1 | D4.d1 | D5.d1 | D6.d1 | |
| Divers (n) | 7 | 9 | 8 | 7 | 8 | 9 | 8 | 9 |
| Oxygen (%) | 12 [6-22] | 13 [6-15] | 11 [6-15] | 11 [6-15] | 8 [6-12] | 8 [6-13] | 8 [6-13] | 7 [6-8] |
| Helium (%) | 63 [20-88] | 63 [49-88] | 71 [49-88] | 77 [49-88] | 74 [58-88] | 76 [59-88] | 77 [59-88] | 75 [70-88] |
| GF-L | 47 [45-55] | 46 [30-55] | 46 [30-55] | 46 [30-55] | 46 [30-55] | 46 [30-55] | [27-58] | 46 [30-55] |
| GF-H | 84 [80-90] | 81 [70-90] | 81 [70-90] | 81 [70-90] | 81 [70-90] | 81 [70-90] | 81 [70-90] | 81 [70-90] |
| Depth (msw) | 68 [66-71] | 47 [37-76] | 55 [26-86] | 26 [21-32] | 85 [67-88] | 89 [69-105] | 90 [69-105] | 111 [100-122] |
| Time (min) | 129 [105-161] | 71 [58-159] | 87 [74-198] | 46 [42-48] | 135 [51-225] | 103 [71-127] | 111 [68-134] | 196 [107-280] |
Table 3.
Depth, Runtime, and diluent mixture composition of the analyzed dives.
| Depth (msw) | Time (min) | Oxygen (%) | Helium (%) | |
| 102 | 135 | 6 | 88 | |
| 103 | 157 | 6 | 76 | |
| 105 | 156 | 8 | 73 | |
| 100 | 127 | 6 | 78 | |
| 102 | 125 | 6 | 76 | |
| 102 | 127 | 10 | 70 | |
| 100 | 84 | 13 | 59 | |
| 101 | 67 | 6 | 88 | |
| 102 | 125 | 6 | 76 | |
| 102 | 127 | 10 | 70 | |
| 100 | 84 | 13 | 59 | |
| 100 | 107 | 6 | 88 | |
| 122 | 250 | 9 | 75 | |
| 122 | 280 | 7 | 79 | |
| 103 | 116 | 10 | 70 | |
| 102 | 120 | 13 | 59 | |
| 122 | 206 | 8 | 72 | |
| 118 | 240 | 10 | 68 | |
| 102 | 190 | 7 | 81 | |
| 101 | 190 | 7 | 81 | |
| 121 | 261 | 8 | 77 | |
| Mean | 106,3 | 155,9 | 8,3 | 74,4 |
| SEM | 1.9 | 13.4 | 0.5 | 1.9 |
Disclaimer/Publisher’s Note: The statements, opinions and data contained in all publications are solely those of the individual author(s) and contributor(s) and not of MDPI and/or the editor(s). MDPI and/or the editor(s) disclaim responsibility for any injury to people or property resulting from any ideas, methods, instructions or products referred to in the content. |
© 2024 by the authors. Licensee MDPI, Basel, Switzerland. This article is an open access article distributed under the terms and conditions of the Creative Commons Attribution (CC BY) license (http://creativecommons.org/licenses/by/4.0/).
Copyright: This open access article is published under a Creative Commons CC BY 4.0 license, which permit the free download, distribution, and reuse, provided that the author and preprint are cited in any reuse.


