Submitted:
29 December 2023
Posted:
03 January 2024
You are already at the latest version
Abstract
The evaluation of tourism sustainability has become of paramount importance for researchers and decision-makers to better protect tourist destinations, especially with the continuous increase in the number of tourists and visitors that alter the natural components of the environment and degrade ecosystems. Therefore, the use of geographical data is of great significance, particularly in environmental monitoring and land management, due to its ease of use and availability. However, calculating composite indices for sustainability involves several steps and requires a basic understanding of existing models. This article describes the development and design of a package of plugins in QGIS that serves as an easy-to-use tool for processing and automatically calculating economic, environmental, social indices, and the overall index of tourist sustainability. These plugins have been built in Python and designed as QGIS software plugins.
Keywords:
evaluation
; stakeholders
; model
; indicators
; tourist sustainability plugins
; QGIS
1. Introduction
Every year, and according to the Ministry of Tourism and Handicrafts and the Social and Solidarity Economy [1] (MTAESS), the city of Tangier in Morocco attracts a considerable number of visitors, both national and international. Despite the economic prosperity it experiences, the city faces intense pressure on its natural and cultural resources, leading to unpredictable consequences for long-term tourism activity. To mitigate these repercussions, the application of the concept of sustainable development in the tourism sector remains essential. Sustainable tourism, as defined by [2] the World Tourism Organization (UNWTO), involves the judicious use and preservation of natural, economic, and cultural resources for genuine sustainable development, ensuring their long-term viability. The concept of sustainability in tourism requires careful monitoring and thorough evaluation. This is aimed at better understanding the encountered problems and their impacts on the sustainability of a tourist area. It is crucial to assess accurately in order to determine the necessary interventions, thereby providing decision-makers with effective decision-making tools. This idea is gaining momentum, reflected in the growth of research in the field, particularly on the principles and practices of sustainability assessment, as illustrated by references such as UNWTO [3], 2023 [4] Ko, TG (2005) [5].
Our proposal consists of a set of plugins dedicated to the assessment and monitoring of sustainable development in local tourist destinations. This set of plugins is primarily based on a participatory approach grounded in the consent of stakeholders acting in the local territory. These stakeholders oversee the sustainability of natural and cultural resources in their area. Therefore, they are involved in choosing the indicators, their standards, weights, and specified tolerances.
Subsequently, these data constitute the elements of a tailored simple model. This model relies on the indicator approach, considered as the cornerstone in creating composite indices and an overall index of a compact and significant nature. Finally, it incorporates Geographic Information Systems (GIS), notably the new plugin that provides a visual and conversational interface for inputting data, running the model, and visualizing results on dynamic and interactive maps. A thorough diagnosis stimulates decision-makers to make appropriate and effective decisions.
Indeed, to assess sustainability, it is crucial to develop a model that employs scientific mathematical tools and an appropriate theoretical concept to comprehend, analyze, and interpret data. An overview of the methods and approaches developed for assessing tourism sustainability is available in the instructional document [6]. Furthermore, other approaches, although they do not provide a specific model, have been significant in evaluating tourism sustainability, as exemplified by H. Mohamed et al [6] and E.-D. Rachid et al [7], J. G. M. Steenbruggen et al [8], and R. Clift et al [9].
Most of the mathematical models examined for sustainability are based on the open indicator theory, as presented in A. Saltelli et al [10], Y. Fu et al [11], F. Franceschini et al [12]. In general, an indicator can be both a measure and a tool for assessing sustainability, effectively used in sustainable development planning to measure performance and encourage positive changes. The main characteristic of an indicator lies in its ability to summarize, concentrate, and condense the complexity of data into a manageable and meaningful quantity of information, as mentioned in [13]. According to another perspective shared by H. Opschoor [14], the use of sustainability indicators goes beyond simply describing a tourist site, providing normative measures of the gap between the current state of sustainability and the desired reference state.
In the process of modeling tourism sustainability, the concept of an index is integrated to reflect potential interactions and influences among the designed indicators. Furthermore, composite indicators or indices are increasingly recognized as useful tools for decision-making and public communication in areas such as the economy, environment, and society, as mentioned in R. K. Singh et al [6] and F. J. Blancas et al [15].
The methodology for constructing a composite indicator, as described by N. Michela et al [16], involves several steps, including the selection and aggregation of relevant indicators, handling missing data, normalizing indicators according to measurement units, and choosing indicator weights, as exemplified in S. Haloui et al. [17], which proposes a sustainability assessment model suitable for evaluating the sustainability status of a tourist destination at desired intervals through successive comparison using defective indicators that will be adjusted thereafter.
In this article, an original model for assessing tourism sustainability is presented. This model stands out, firstly, from existing models in the literature because it is based on open indicators and composite indices combined through a step function. Additionally, a time-varying tolerance parameter is added to relax the standards' requirements for the desired indicators. This model distinguishes itself through its simplicity, flexibility, and adaptability in various contexts.
And secondly, through the use of simple plugins based on Geographic Information Systems (GIS), these plugins emerge as an indispensable solution, especially considering the geographical aspect inherent in tourism. Numerous studies have explored the link between GIS and sustainable development [18], [19], with a particular emphasis on sustainable tourism. Moreover, Roche S. et al. [20] highlights that the evolution of GIS technology has paved the way for the development of solutions meeting the needs of various organizations. Alshuwaikhat et al. [21] presents the development of a GIS-based model for assessing the sustainability of university campus operations and demonstrates how it can assist decision-makers in designing strategies to improve its environmental sustainability. B. Boers et al. [22] integrated GIS into sustainable tourism infrastructure planning.
However, according to Y. Farsari et al. [23], there appears to be a lack of GIS-based applications to support the planning and management of tourist destinations. The use of GIS should be reassessed in this context to integrate spatial analysis if necessary with non-spatial features. In this context, the significance of our study lies in the integration of geomatics into the exploration of tourism sustainability, thereby enabling:
In the first place, to provide clear information to decision-makers to facilitate decision-making aimed at protecting local resources that can be used to promote the development of sustainable tourism at the local level.
Secondly, the proposed plugins create relational synergies, fostering collaboration and agreement among stakeholders in a participatory governance approach, thus ensuring relevant solutions to sustainability issues in tourist destinations.
In our context, GIS is considered a technical toolbox that offers the possibility to diagnose, track, and recommend adjustments through a simple and visible interactive interface. Tables do not always facilitate interpretations, especially in the presence of large amounts of data, which can lead to information loss. In our case, there is an opportunity to directly link the geographical area with corresponding information, including the overall sustainability status of the studied area and all economic, environmental, and social data, thus enabling local decision-makers to make informed decisions. The proposed application also provides the general public with access to relevant data related to the assessment of sustainable tourism in the city of Tangier and elsewhere. Our contribution in this regard is to provide plugins that calculate interactions between indicators and display results in interactive maps depicting the sustainability status of the studied area.
2. Materials and Methods
2.1. Technical Implementation
To facilitate the calculation of indices for users and decision-makers without strong knowledge of GIS and to support the open-source model, the plugins are integrated into QGIS (an open-source geographic information system software that allows the creation, visualization, editing, and analysis of geospatial data). The use of QGIS is highly recommended as it is available for free, and its capabilities can be extended with a wide range of external plugins developed by its large community. Recently, many plugins have been developed under QGIS to serve sustainability purposes, [24] Imagine Sustainability (2023) Sustainability Assessment Tool based on geographic algorithm MCDA, Spatial Sustainability Assessment Model (SSAM) (2019) by ARPA Umbria - University of Perugia (Developer: Gianluca Massei) for sustainability assessment in a geographic environment, and [25] USM toolset (Urban Sprawl Metric toolset), which is a set of tools facilitating the calculation of weighted urban proliferation (WUP), and Q-LIP environment (2023) [26]. The basic functionality of the plugins is written in Python (3.2), while the graphical user interface (GUI) is developed using the Qt designer concept. Version 3.5.1 is compatible with QGIS version 3.22, and all its features can be run on a standard desktop QGIS.
We are now able to demonstrate how the proposed model was designed based on indicator theory. The design process involves identifying a tourist destination and determining its characteristics. For example, an ecological site (natural resources, landscape, endemic species, beach, forests, etc.) and/or a cultural site (historical site, museum, etc.). More importantly, collecting decisions and proposals from involved stakeholders, which can be represented by various entities, such as the state and its institutions, tourism professionals, the local community related to tourism activity, associations and unions related to the tourism sector, tourists and visitors to the site, and academic researchers.
As mentioned, the necessary information from the decisions of the selected stakeholders can be used to characterize the sustainability of the tourist destination based on commonly accepted key parameters and indicators. Consequently, assessing the performance of the tourist destination can be entirely accomplished by defining sustainability indices for a given period.
Before introducing our model, we define the following step function F:
F(x) = 0 if x<0
F(x) = 1 if x≥ 0
The role of this function F is to detect when an indicator is below its corresponding norm by a given tolerance factor τ. This design of the function F leads to a zero contribution to the overall sustainability index if the standard norms are not met; otherwise, this function retains all positive contributions to this index. Now, based on this step function, we introduce the following conceptual indices depending on time periods t, t = 1, 2, ....
First, we introduce a useful tolerance parameter 𝜏𝑡 that depends on and decreases with time, for example:
Where τ represents the pre-defined initial tolerance factor at time t=1. Its significance is that tolerance becomes smaller and then more stringent over time.
In the following, we define the entire sustainability model by its composite indicator:
Where represents the chosen economic (ec), environmental (en), and social (so) indicators, and are their standard norms. The positive scalars αi, βi, γi > 0 are their corresponding weights successively.
With these defined and characterized composite indicators, we are now able to introduce the Global Sustainability Index (GSI), which can provide a accurate and clear assessment of the sustainability status of the entire tourist destination. This overall assessment index is defined as:
δ1<0, δ2<0, and 0<δ3 (6) are the weights of the sustainability index.
The proposed model possesses properties that enable it to provide a clear measure of sustainability status. Specifically, it should be noted that all values lie between [0, 1] (a scale of order 1), including the overall index. Furthermore, it is easily observable that an indicator with a value of 0 implies non-compliance, whereas a value of 1 indicates compliance within the predefined tolerance. Additionally, the model clearly shows that the best sustainability cases are as follows:
If = 1, all economic indicators are met. On the other hand, in case of sustainability failure:
If = 0, it means that none of the economic indicators are met.
Similar considerations apply to the overall sustainability index as follows:
As can be observed, if the overall sustainability index is strictly between [0, 1]: 0 < GSI𝑡 < 1, then this means that we do not have perfect sustainability, and at least one component is not perfect. It should also be noted that if the output value of GSI (𝑡) is close to 1, then sustainability must be slightly improved. However, if the GSI (𝑡) value is far from 1 or close to 0, then sustainability is significantly deteriorated, requiring radical changes and improvements in the economic, environmental, and social components of the studied tourist destination.
3.1. Sustainability Adjustment
The sustainability adjustment (Adj) primarily occurs after the sustainability assessment. However, this does not mean that no immediate modifications should be made in the face of unpredictable variations in sustainability performance.
The process of adjusting tourism sustainability involves assessing the situation resulting from previous decisions to correct or enhance problematic situations. In practice, this assessment aims to adapt and improve current actions at time tk in relation to future actions at time tk+1. This involves evaluating the model's return values concerning the corresponding indicators and their norms, with specific tolerances. The resulting adjustments, in the form of recommendations and notes, are then assigned to stakeholders based on their respective responsibilities.
Les ajustements sont révisés selon trois critères principaux :
Durabilité la plus mauvaise : Cette situation au temps tk se produit si l'on obtient
In this case, the immediate recommendation is to correct the underlying defective indicators by improving their subsequent state according to the relationship:
where the parameter Adj represents a relative magnitude added to the failing indicators to achieve the performances and objectives aimed at by decision-makers and/or responsible stakeholders.
Minimizing Tolerance: The tolerance should be reduced to its cancellation. It should be chosen as a decreasing value that tends toward 0, i.e., .
Stabilizing or Increasing Norm Values: At each time period tk, for the elementary composite indices, this consequently improves the overall state of sustainability.

Table 1.
Calculated Indices by the Plugins.
| Nomination | Index | Formula |
|---|---|---|
| Composite Economic Indicator | ||
| Composite Environmental Indicator | ||
| Composite Social Indicator | ||
| Global Sustainability Index | ||
| Adjustment Process | Adj(t) | + = + + a |
3.2. Description of the process of the Plugins
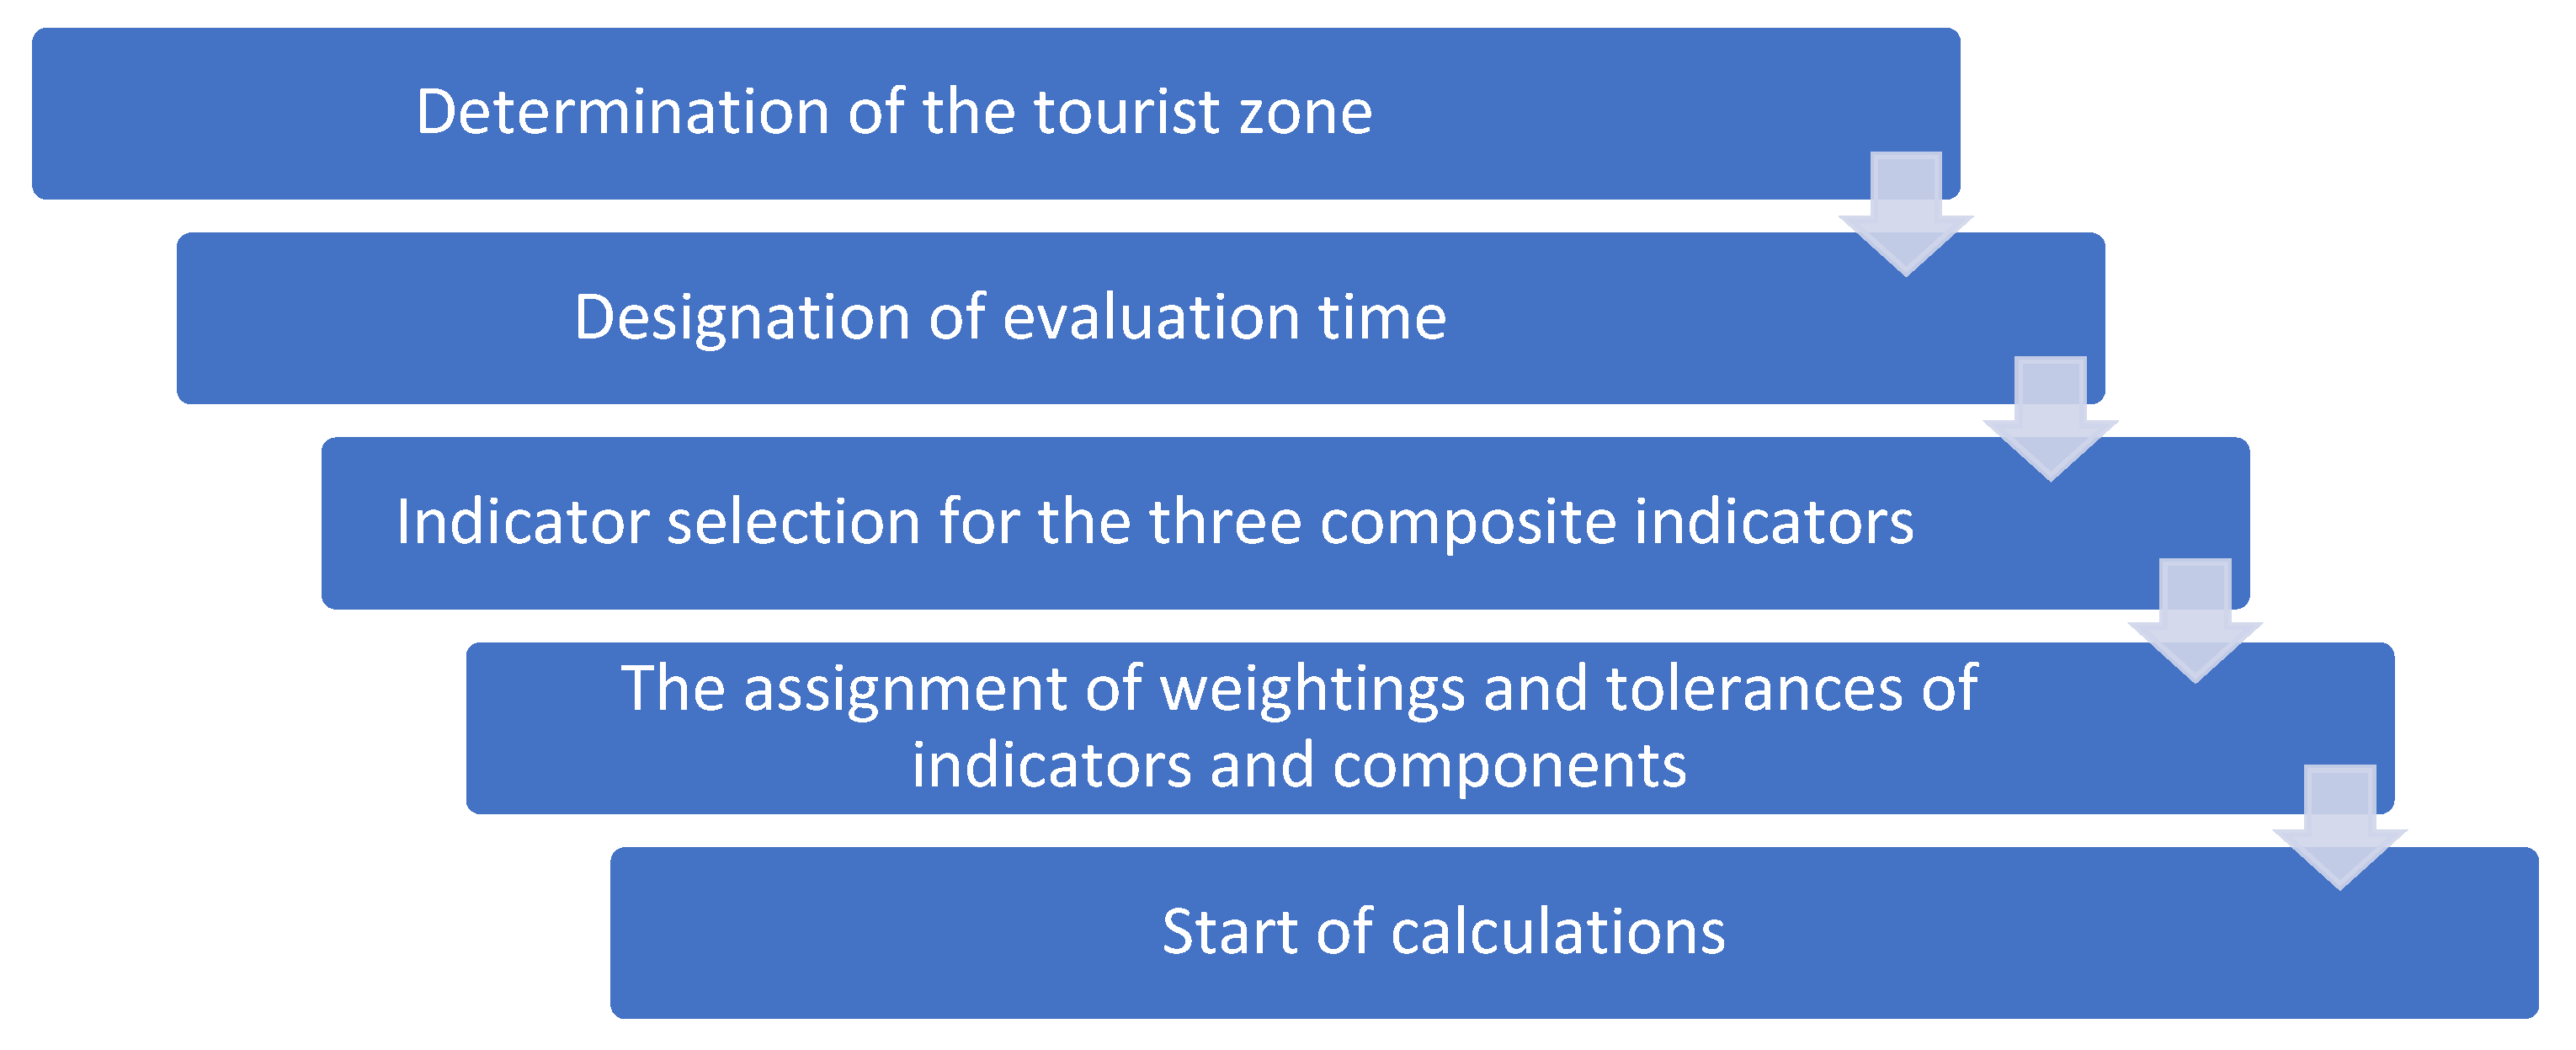
After choosing the calculation time and the study area, the plugins IC(t)^ec, IC(t)^en, IC(t)^so allow users to automatically calculate, in the first instance, the three indices of the sustainability components, in the second instance, the overall sustainability index GSI(t), and finally, generate adjustments and recommendations Adj(t) for deficient indicators. To execute the model program, users' main tasks can be summarized in three steps as illustrated in the following Figure 1:
3.3. Tabs for calculating composite indices of the three components
Figure 2.
Tab for Composite Economic Index .
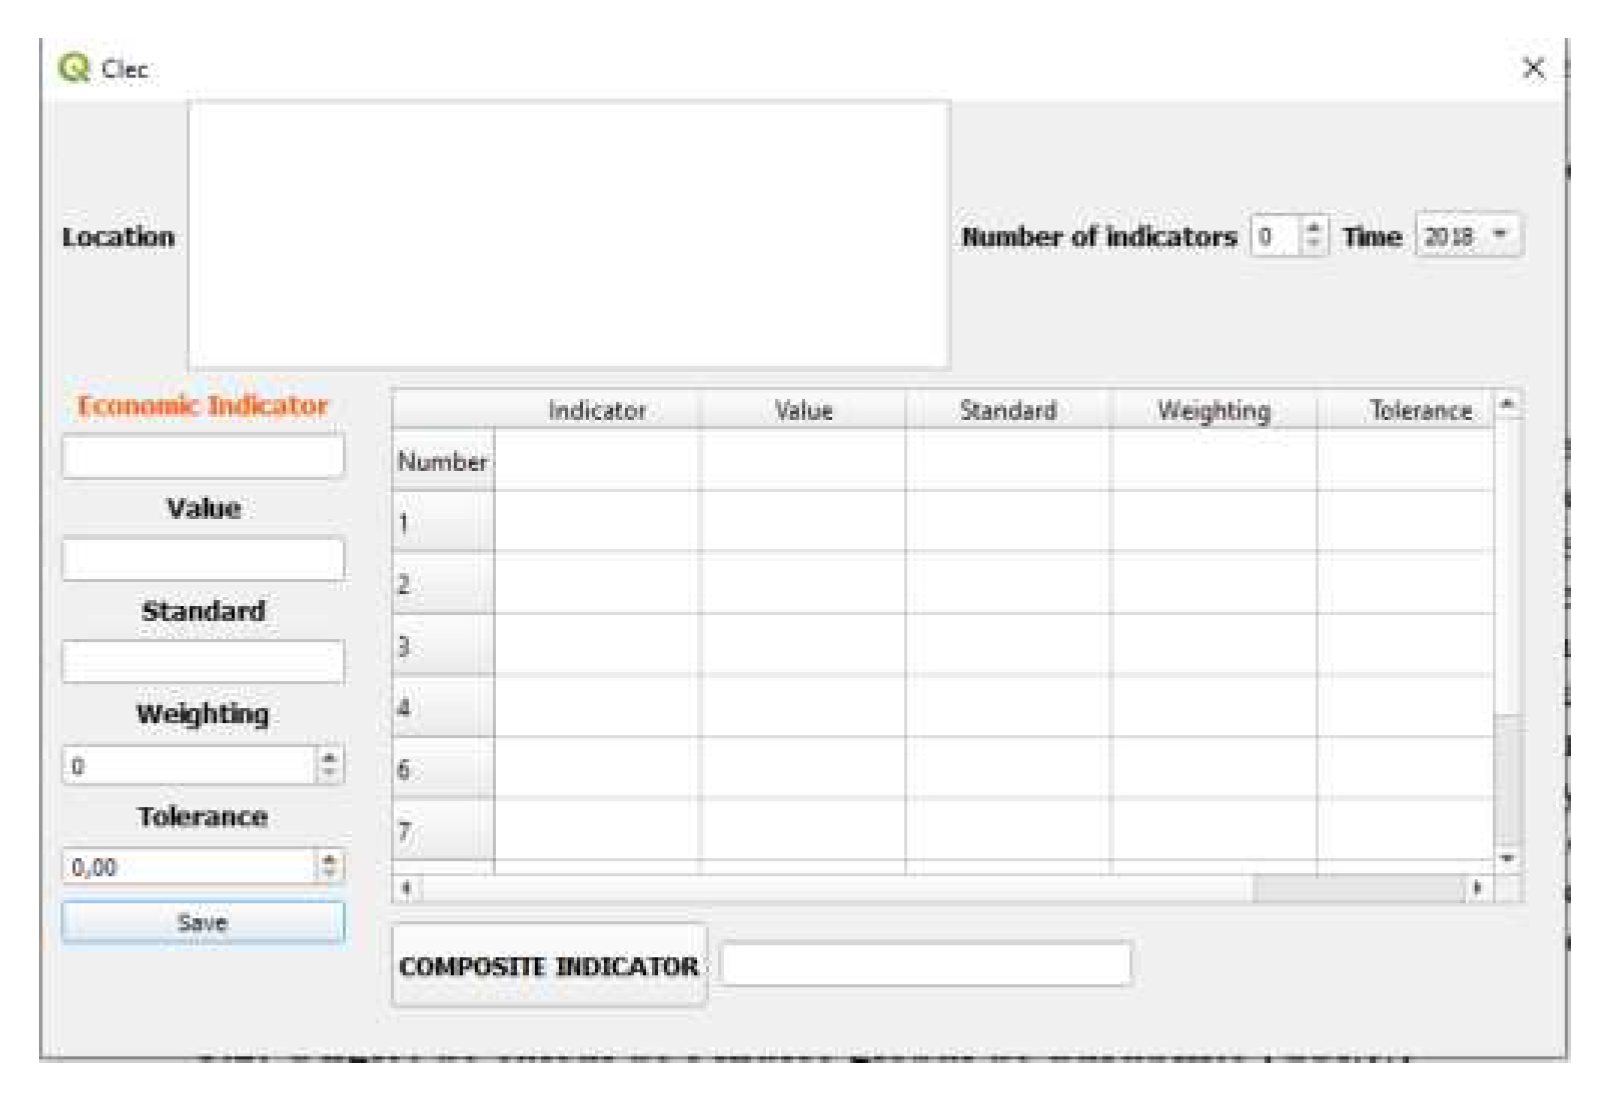
Figure 3.
Tab for Composite Environmental Index
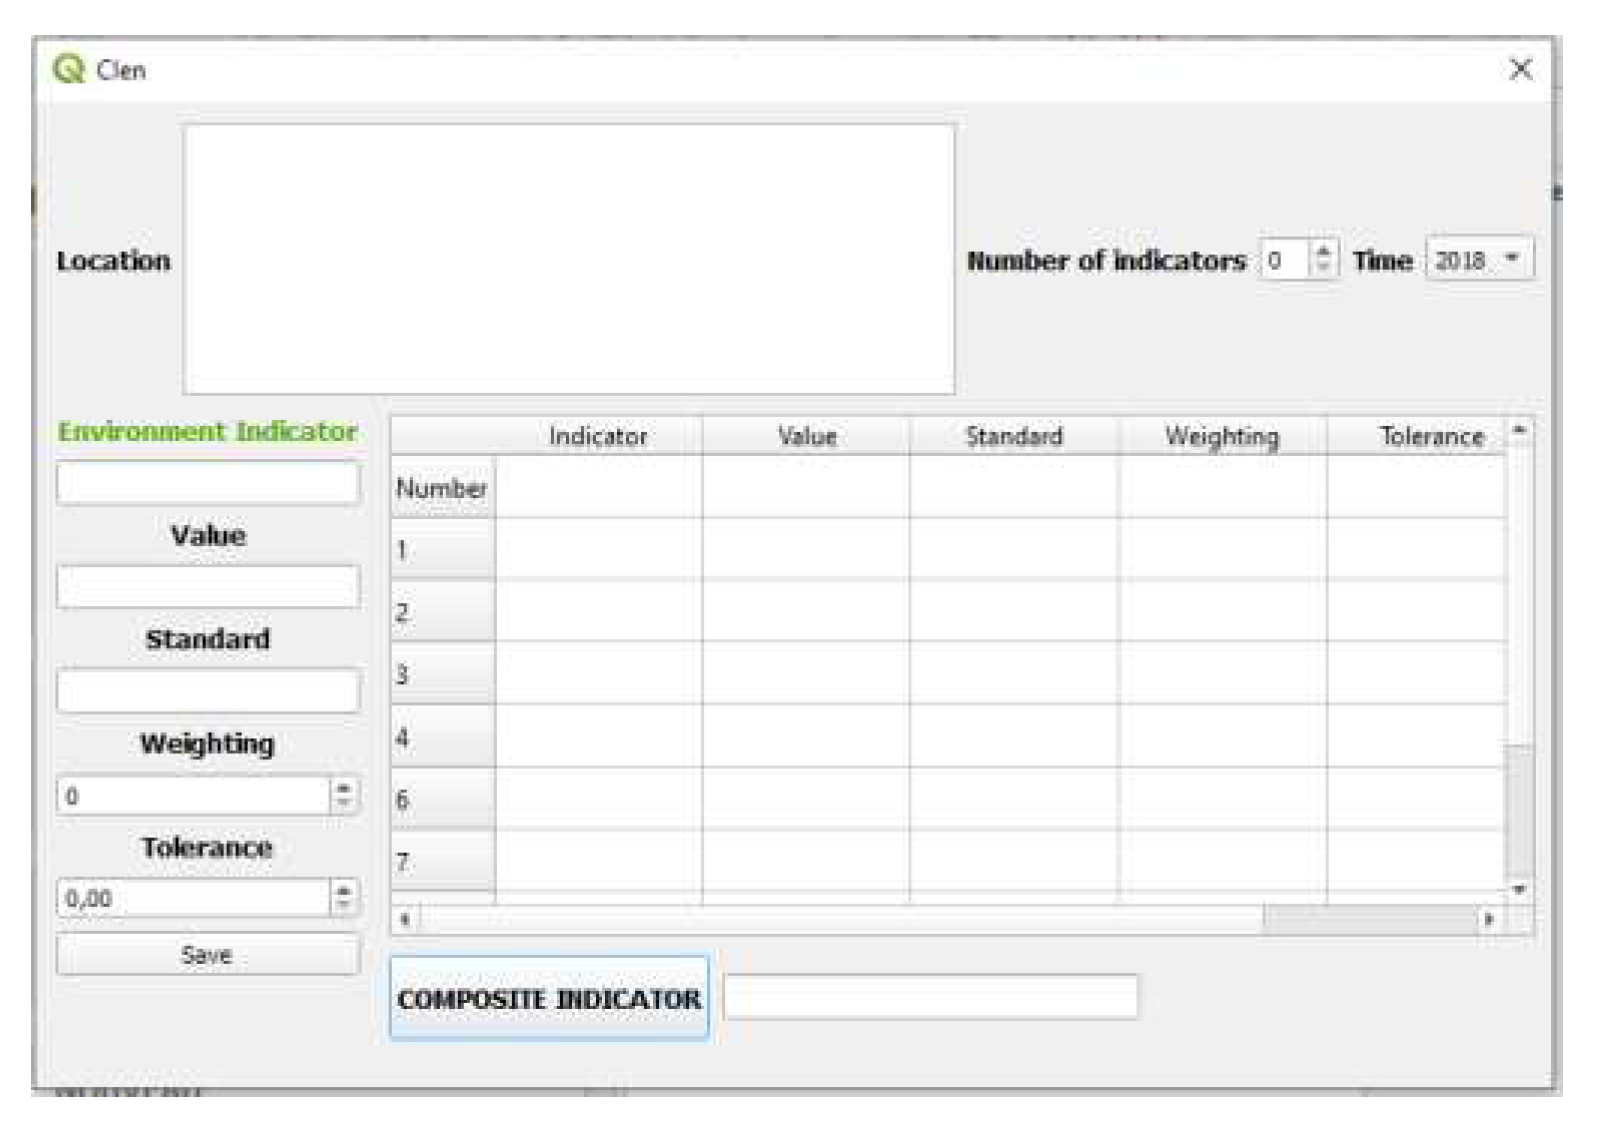
Figure 4.
Tab for Composite Economic Index .
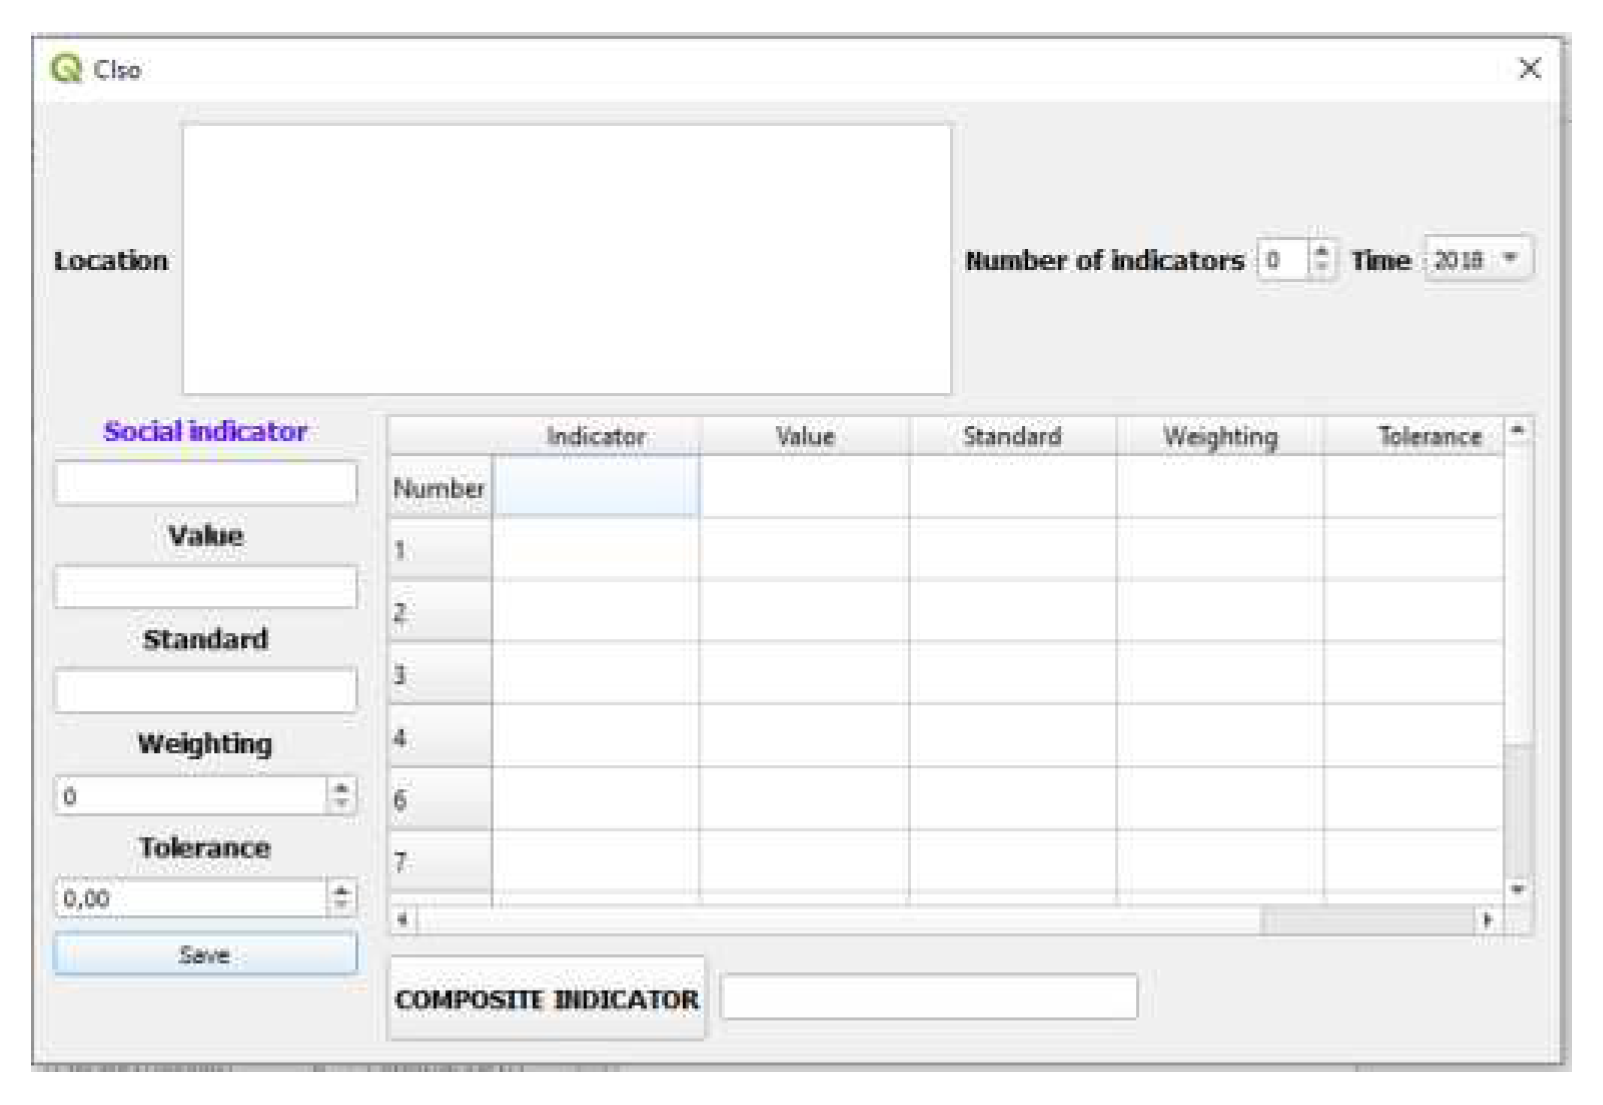
The tabs for calculating composite indices CI (ec), CI (en), CI (so) allow the assessment of the economic, environmental, and social sustainability of the previously georeferenced tourist areas. This window requires the input of data, including the calculation time, component indicators, associated weights, associated standards, and tolerance. This data should result from consensus among stakeholders acting in the studied area. The user can choose from a pre-prepared list (connected to a csv file) validated by [29] the World Tourism Organization (UNWTO) and their standards if they are recognized, such as air pollution [30] (Sulfur Dioxide (SO2) µg/m3 Health protection limit value 125th percentile of daily averages 99.2%). The obtained result appears on the map based on the parameters selected by the user, and a preview of it appears once a zone is selected.
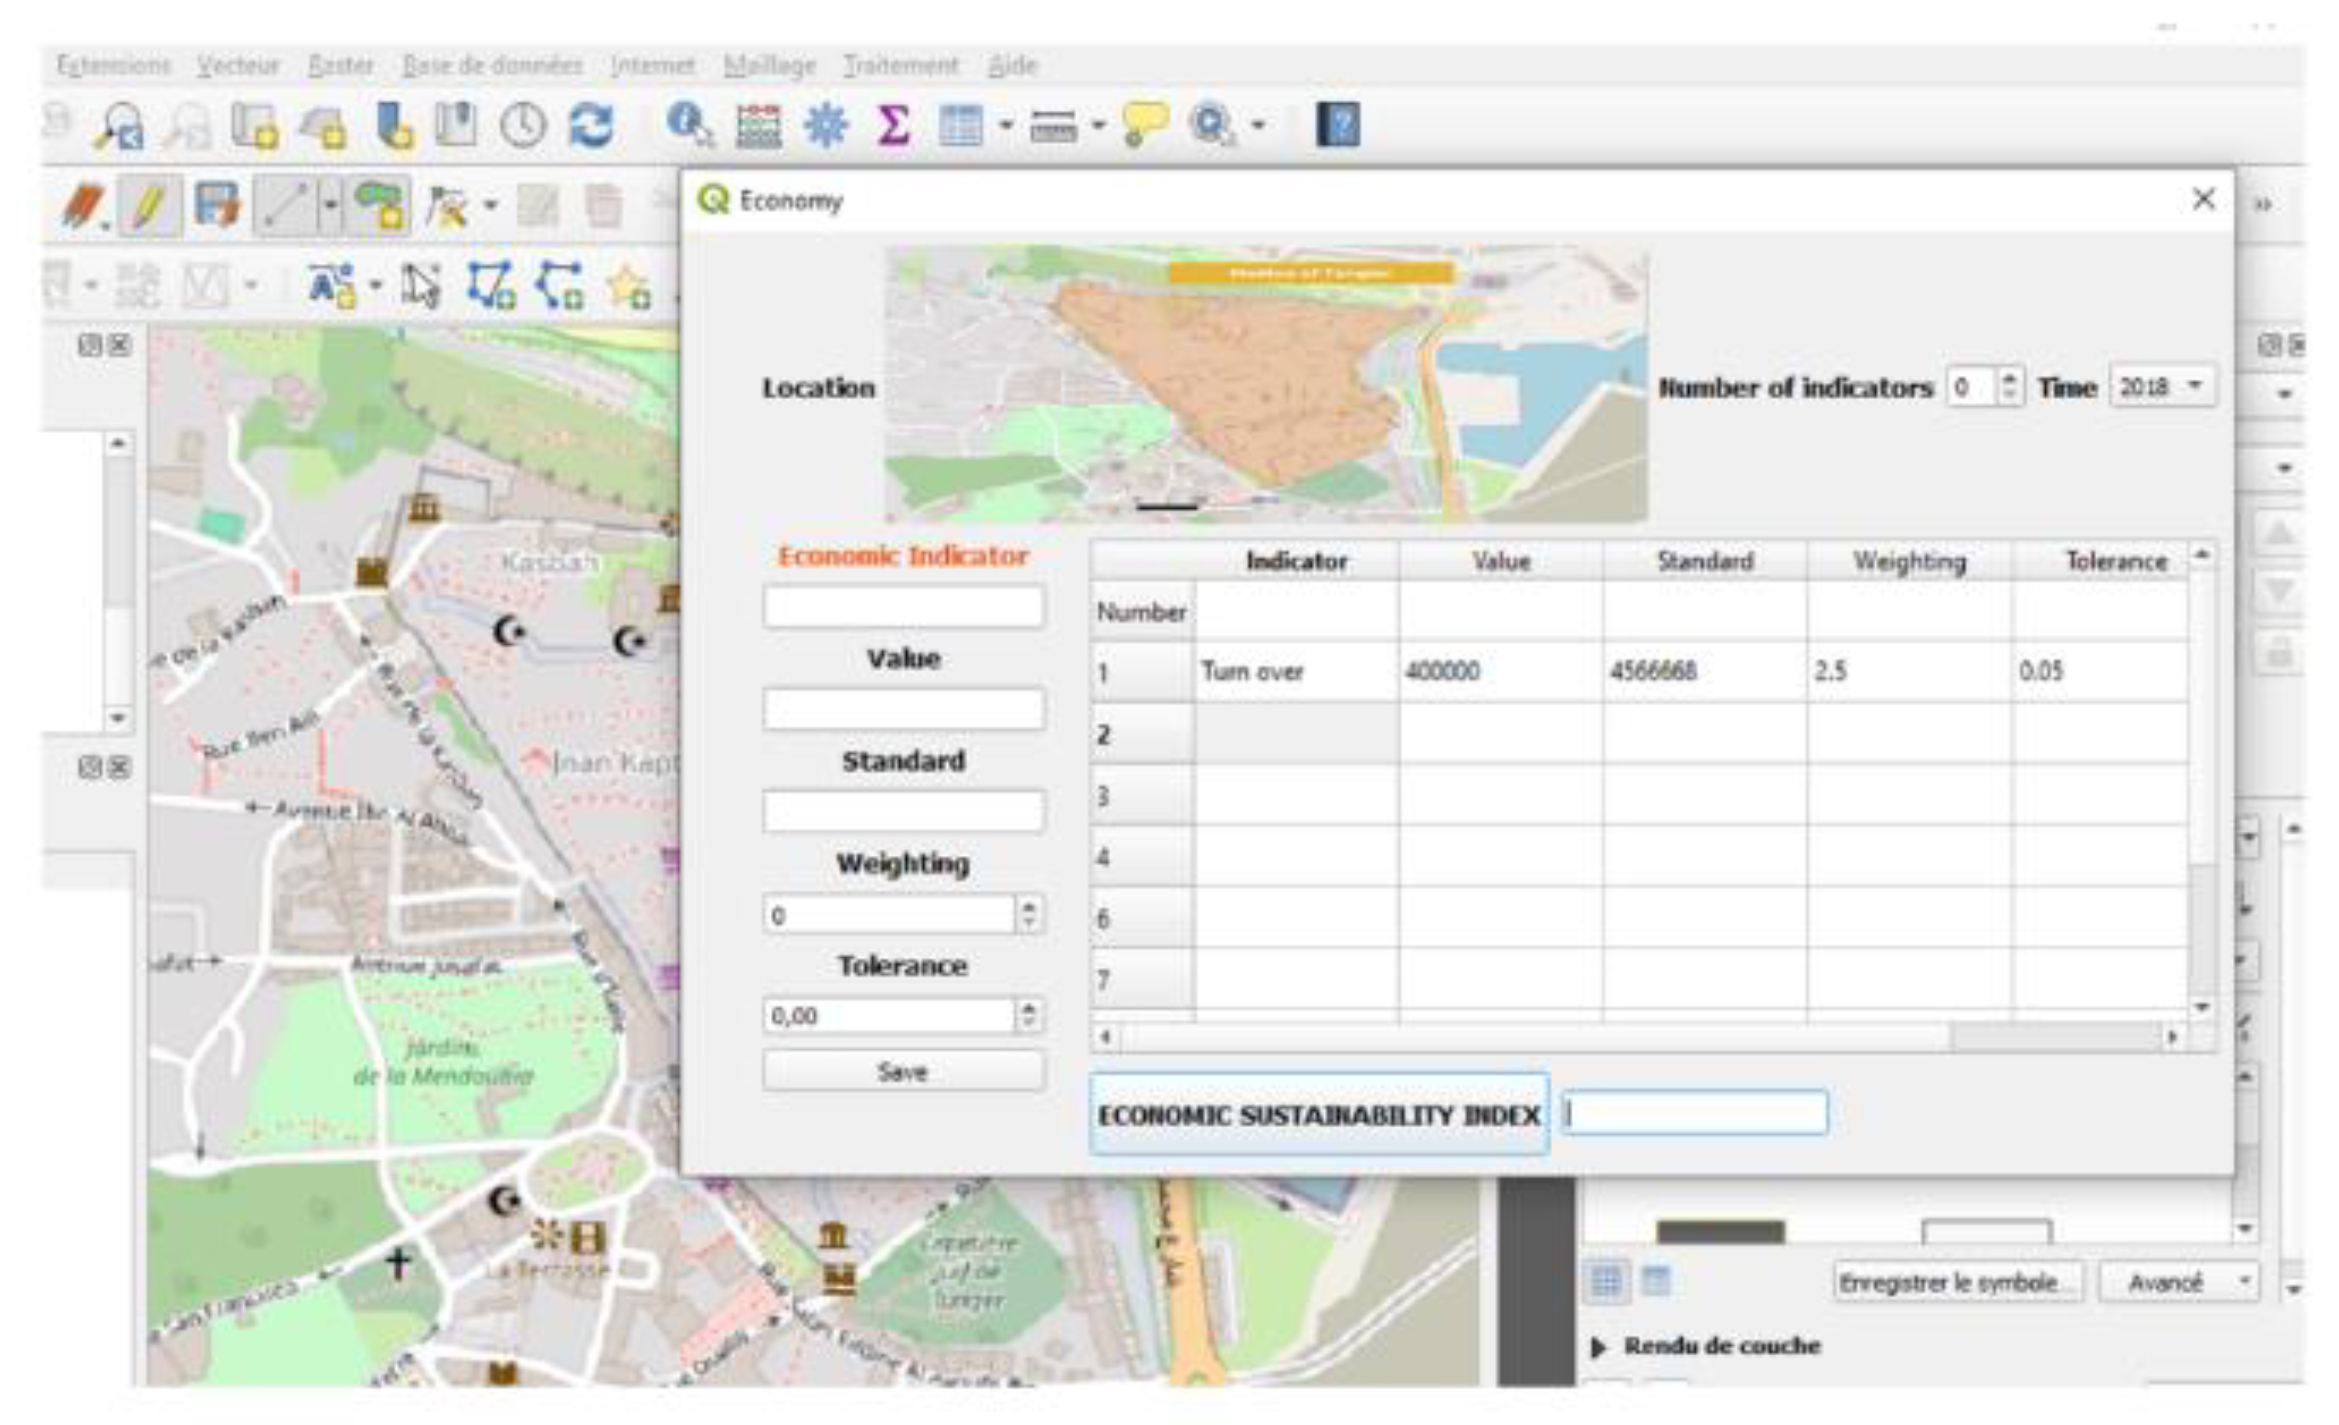
Figure 5.
Selection of the tourist area.
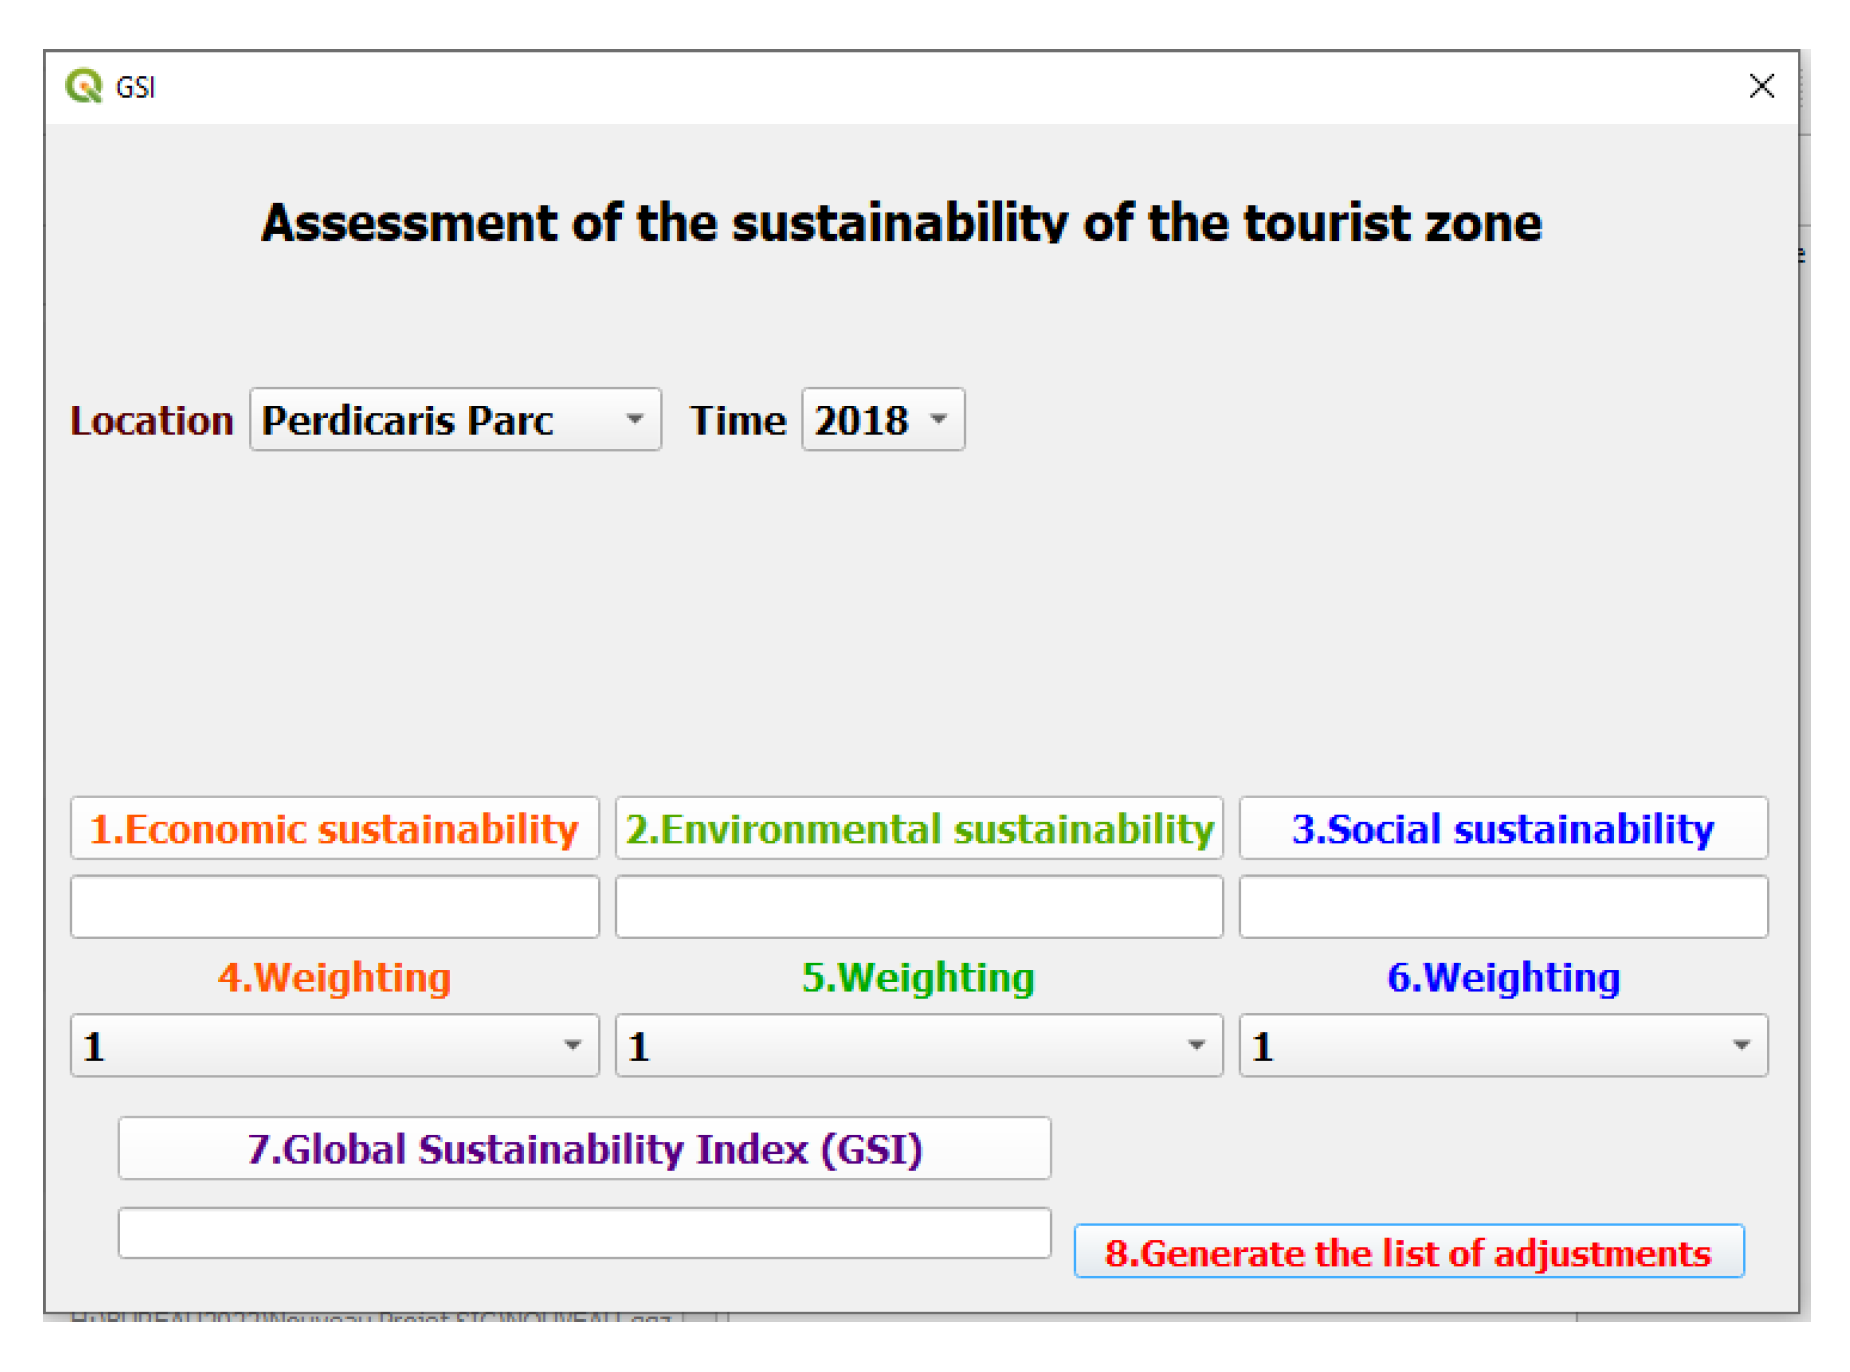
3.4. Tab for Calculating the Overall Sustainability Index (
The GSI(t) tab (Figure 5) allows the assessment of overall sustainability by combining the three previously calculated composite indicators according to equation (8). Once the GSI calculation is done, the information will be loaded into the layer in the study area (attribute table). The insertion of data into the attribute table is done automatically. This data can be used by the user to provide more interpretations and illustrations, giving an idea of the severity of non-sustainability and allowing users to generate the necessary adjustments.
Figure 6.
Assessment of the sustainability of the tourist zone.
3.4. Tab for Adjustment (Adj)
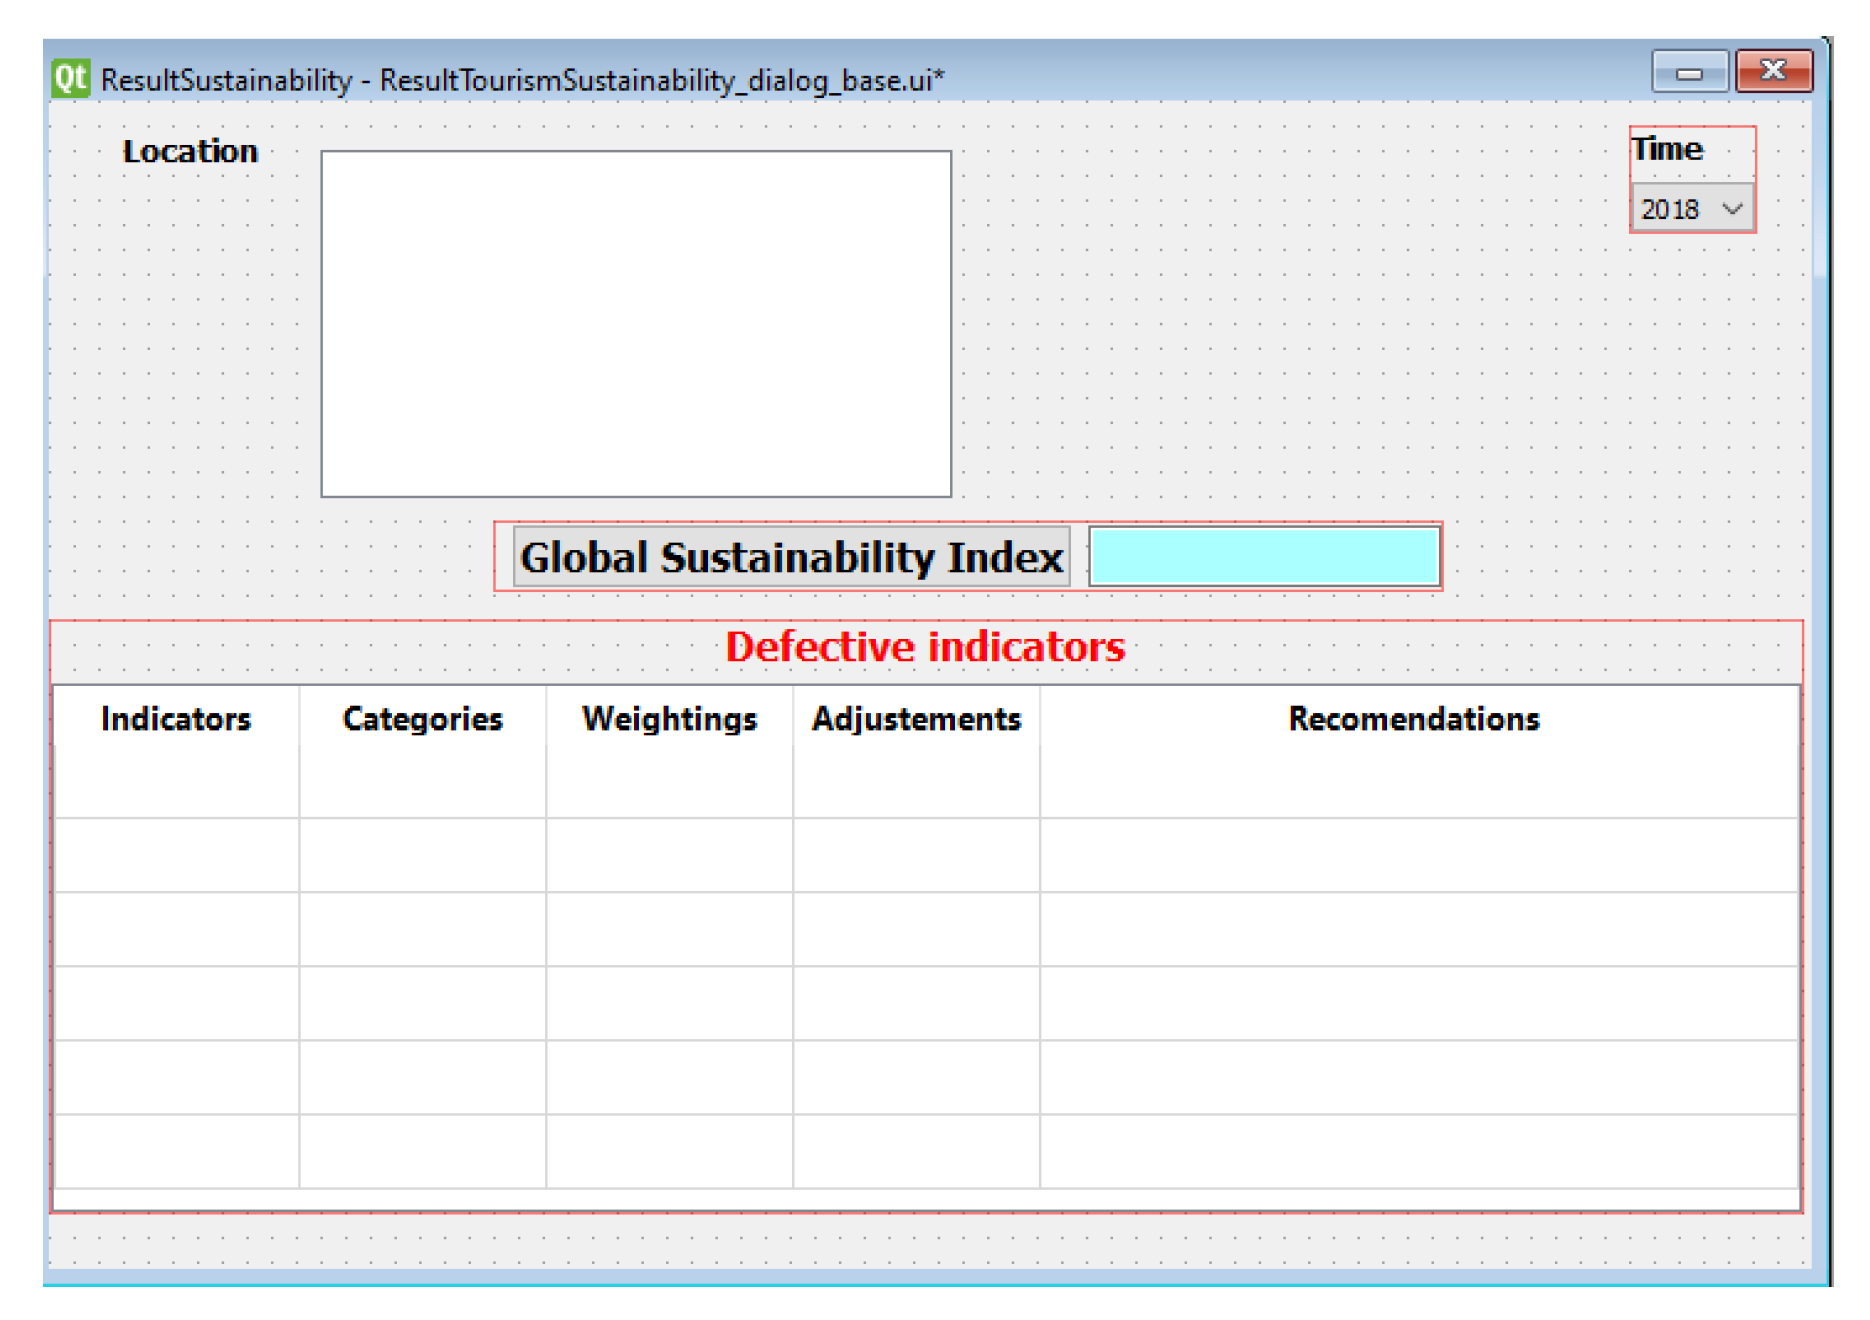
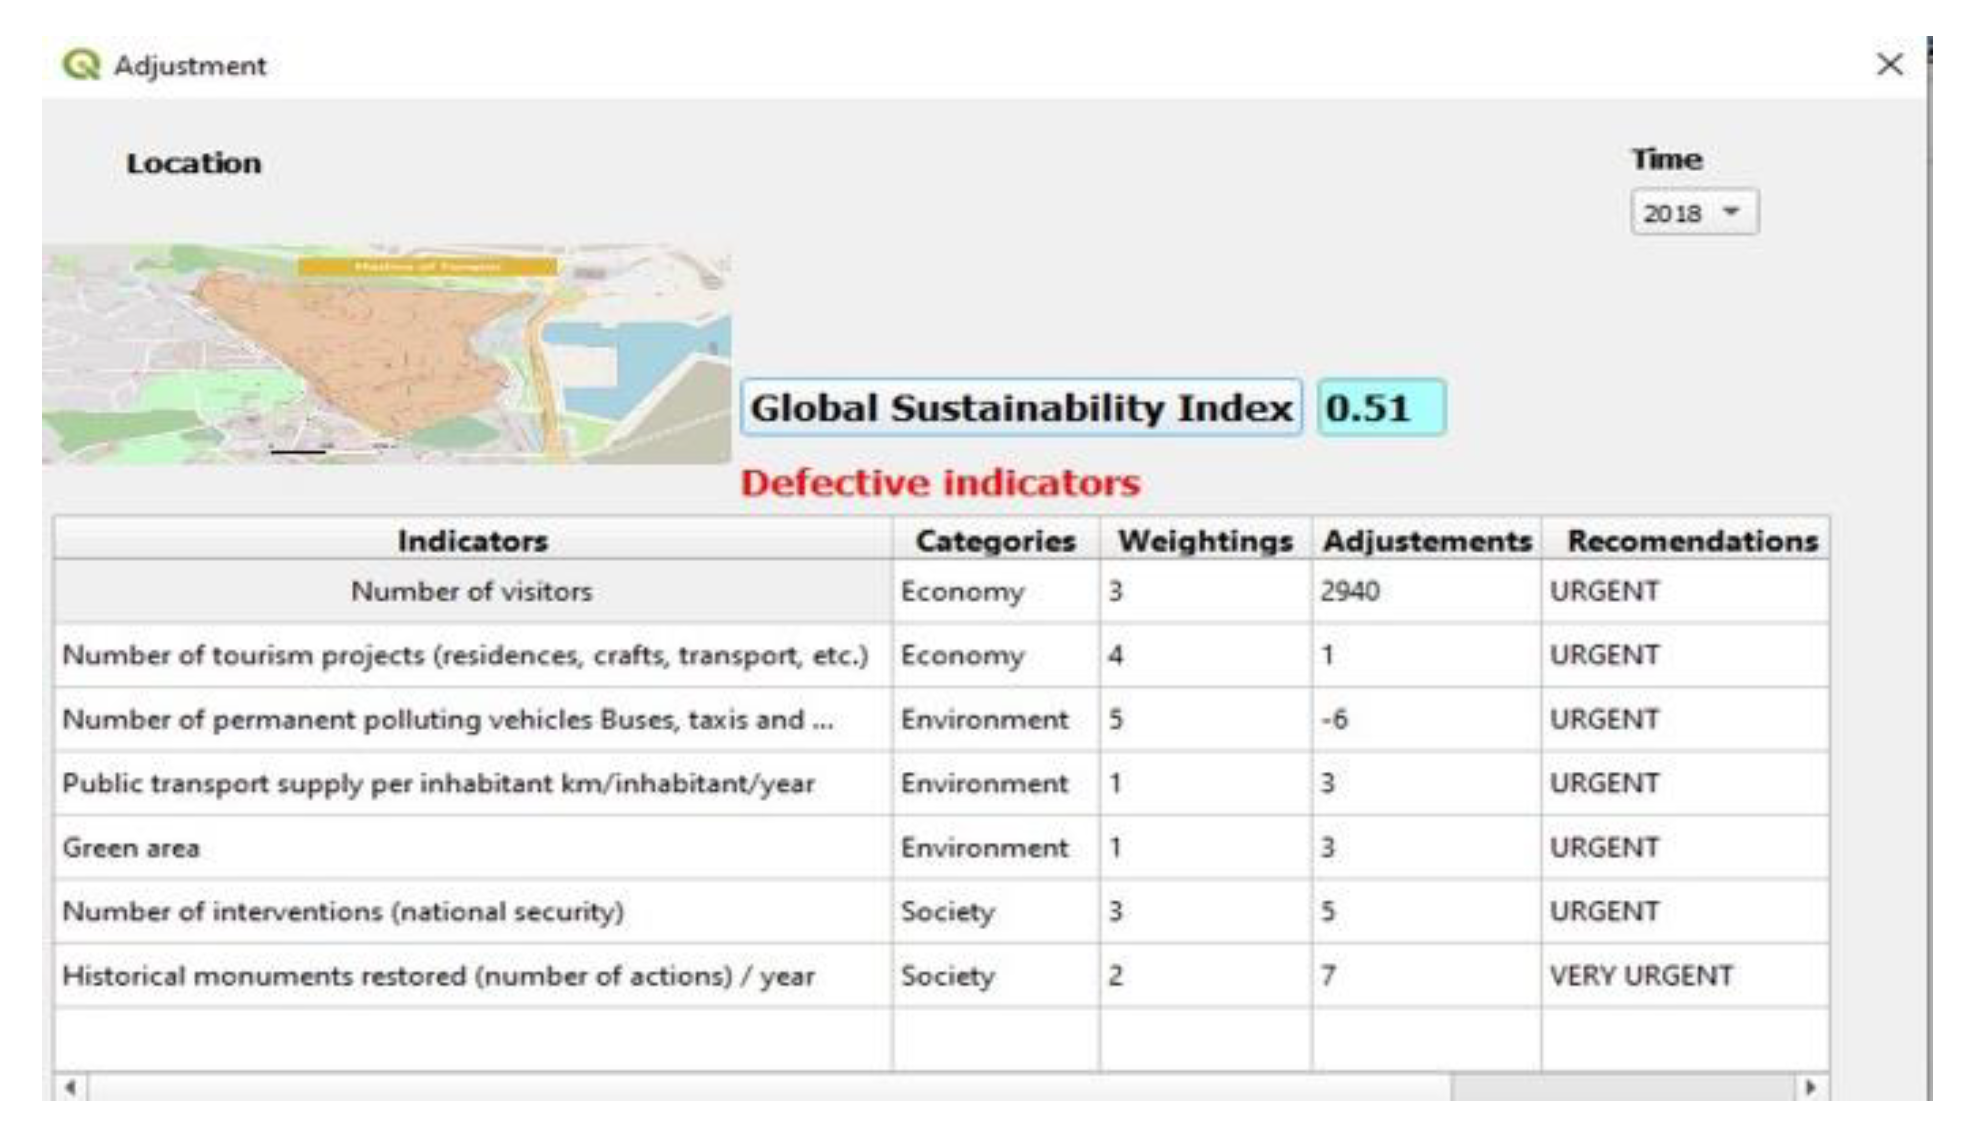
The Adjustment tab (Figure 4) brings together the defective indicators, their category (component to which they belong), their weights, and the adjustments to be made. It also contains a table describing the proposed recommendations, with their values progressing according to their severity, translated by their deviation from the indicator and its standard. It starts with urgent, goes through very urgent, and finally reaches the catastrophic state of the indicator. The calculation here is executed according to equation (11), which represents the deviation of the indicator from its standard.
Figure 7.
Tab for adjustments of indicators and recommendations.
3.5. CASE STUDY: The Medina of Tangier
Tangier is a coastal city in Morocco located at the northern end of the country, facing the Strait of Gibraltar, which separates the Atlantic Ocean from the Mediterranean Sea. The considered tourist destination represents a well-known historical and cultural destination named the Medina of Tangier. In the following, we will apply the proposed model to this destination using the plugins, and we will analyze the output results on its sustainability.
3.5.1. Medina of Tangier as a historical and cultural destination
The Medina of Tangier, one of the tourist gems of the city, enchants with its charm. This ancient city is home to several historical mosques, picturesque alleys, and other Moroccan buildings from different eras. At the heart of the old town is the famous Petit Soko Square, a true pulsating center of the neighborhood. To the east of this square, you discover a set of mosques, among which the Grand Mosque stands out. It attracts many visitors fascinated by its authentic Moroccan-style architecture.
In the heart of the Medina, you find the Kasbah, built by the Portuguese in the 15th century. It is an ancient fortress and includes, among other things, the magnificent Dar el-Makhzen palace. The Kasbah is the best-restored in the whole of Morocco. The Kasbah Museum is housed in the former sultan's palace, and the Museum of Morocco has a rich collection of archaeological artifacts from the region. Also located in a villa from the early 20th century is the first modern art museum in Morocco, featuring an interesting collection of abstract paintings.
3.6. Application of the model
The sustainability performance study proposed was conducted for the initial time period (t1) starting from the year 2018 due to the absence of recent data. The characteristics of the Medina of Tangier are primarily based on historical and cultural potentials. Services provided and the relationship with the local community are also crucial aspects. Considering these factors, the collected data were chosen based on the selected indicators to be implemented in the evaluation model given by equations (3)-(4)-(5)-(6).
Primary data for this study were obtained through meetings with the stakeholders involved in the Observatory for the Protection of the Environment and Historical Monuments of Tangier. Additional information was gathered from the Tourism Delegation of Tangier. The collected information was then analyzed and categorized with respect to the chosen indicators along with their associated standards and tolerance.
Table 2.
List of Indicators in 2018.
| Indicator | Component | Values | Standard | Weighting | Tolerance |
|---|---|---|---|---|---|
| Hotel capacity | Economy | 290 | 250 | 2 | 0.05 |
| Number of visitors | Economy | 12060 | 15000 | 3 | 0.05 |
| Number of potential consumers | Economy | 10000 | 9800 | 1 | 0.05 |
| Number of tourist projects (residences, crafts, transportation...) | Economy | 69 | 70 | 4 | 0.05 |
| Number of permanently polluting vehicles: buses, taxis, and personal cars* | Environment | 956 | 950 | 5 | 0.05 |
| Quantity of household waste collected per inhabitant | Environment | 83055 | 80000 | 3 | 0.05 |
| Public transport supply per inhabitant km/person/year | Environment | 22 | 25 | 1 | 0.05 |
| Green area | Environment | 4 | 7 | 1 | 0.05 |
| Number of interventions (national security) | Society | 45 | 50 | 3 | 0.05 |
| Historical monuments restored (number of actions) per year | Society | 3 | 10 | 2 | 0.05 |
| Number of local cultural and artistic activities | Society | 22 | 20 | 2 | 0.05 |
| Number of active women per 100 active men | Society | 52 | 50 | 2 | 0.05 |
*Inverted indicator (Ien)-1.
Figure 7.
The indicator composite economic figure of the Medina of Tangier.
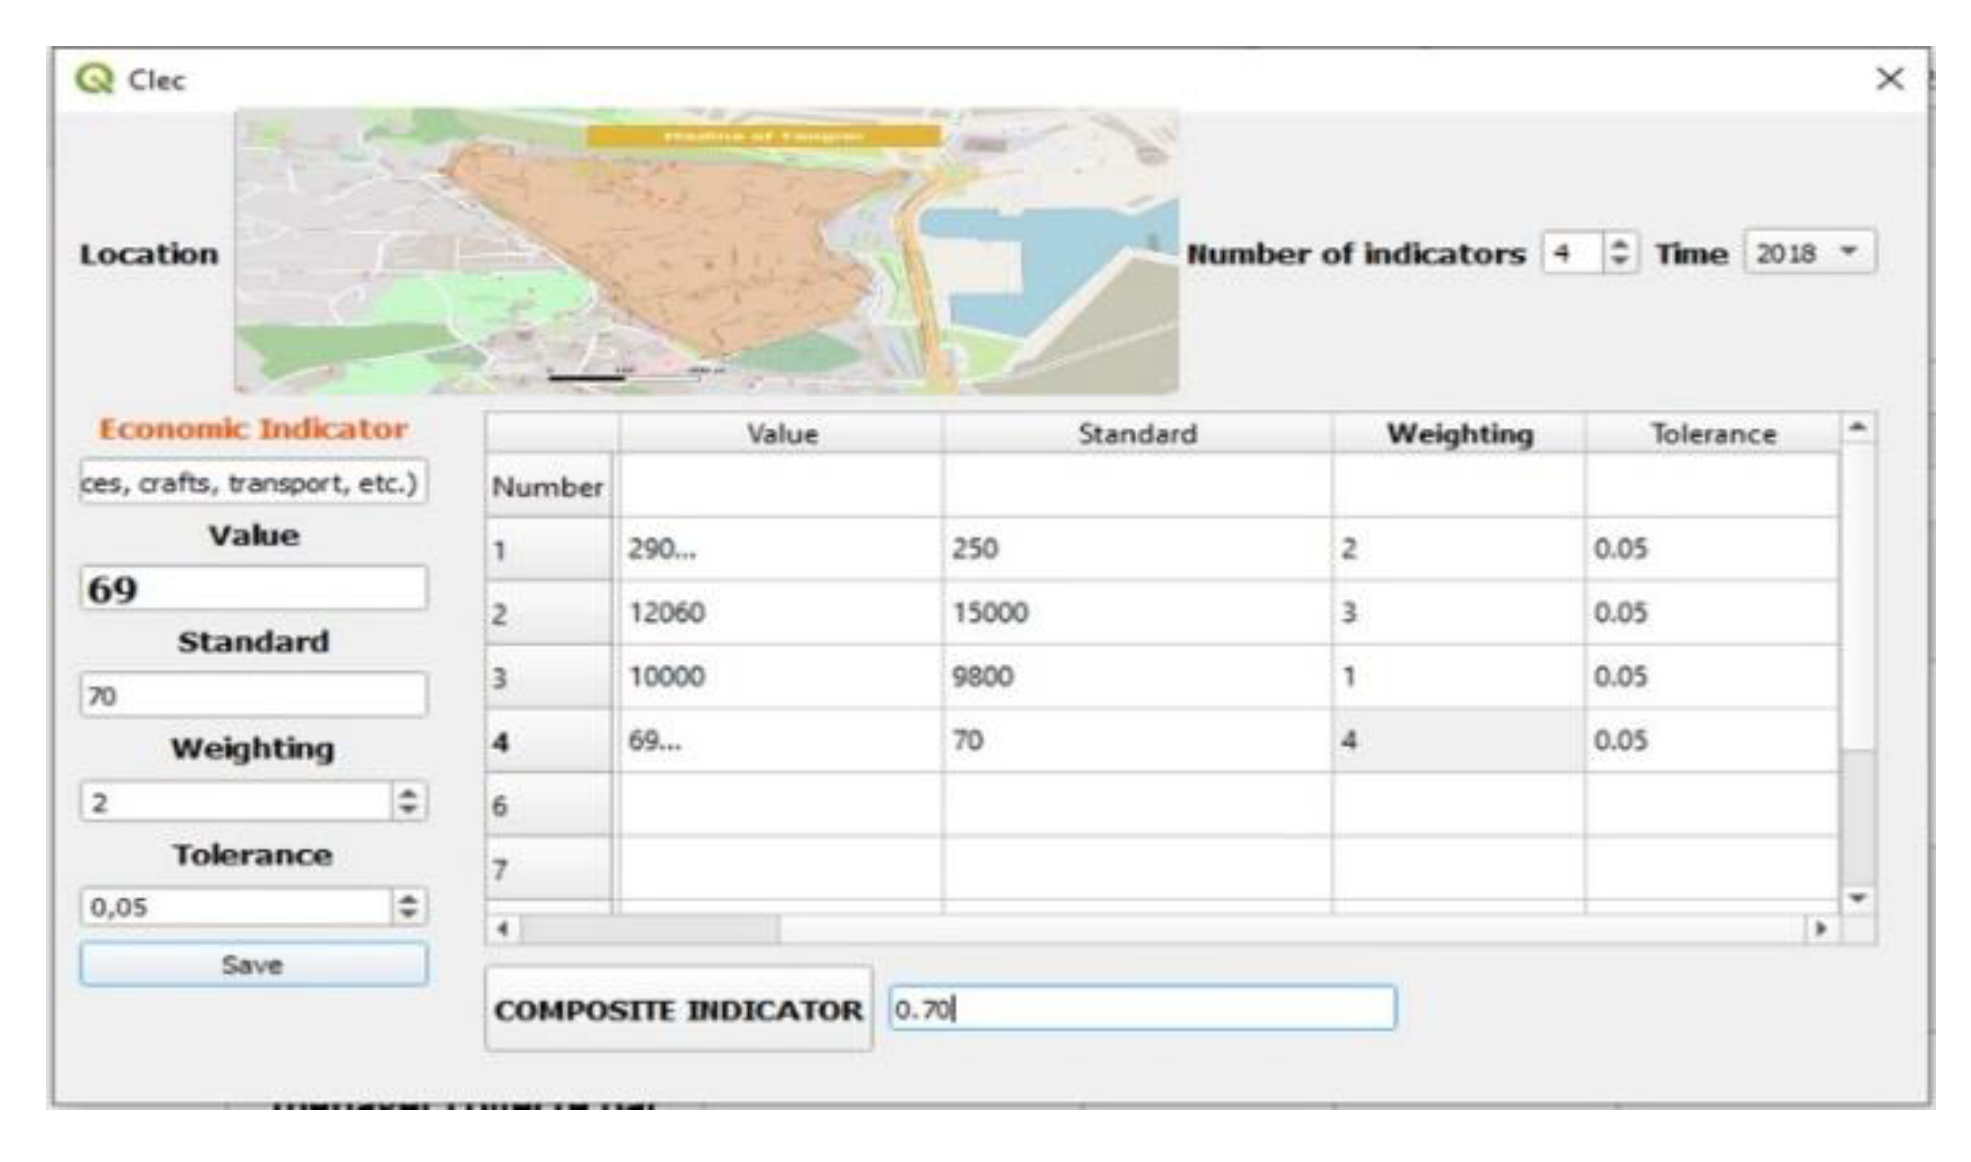
Figure 8.
Composite environmental indicator of the Medina of Tangier.
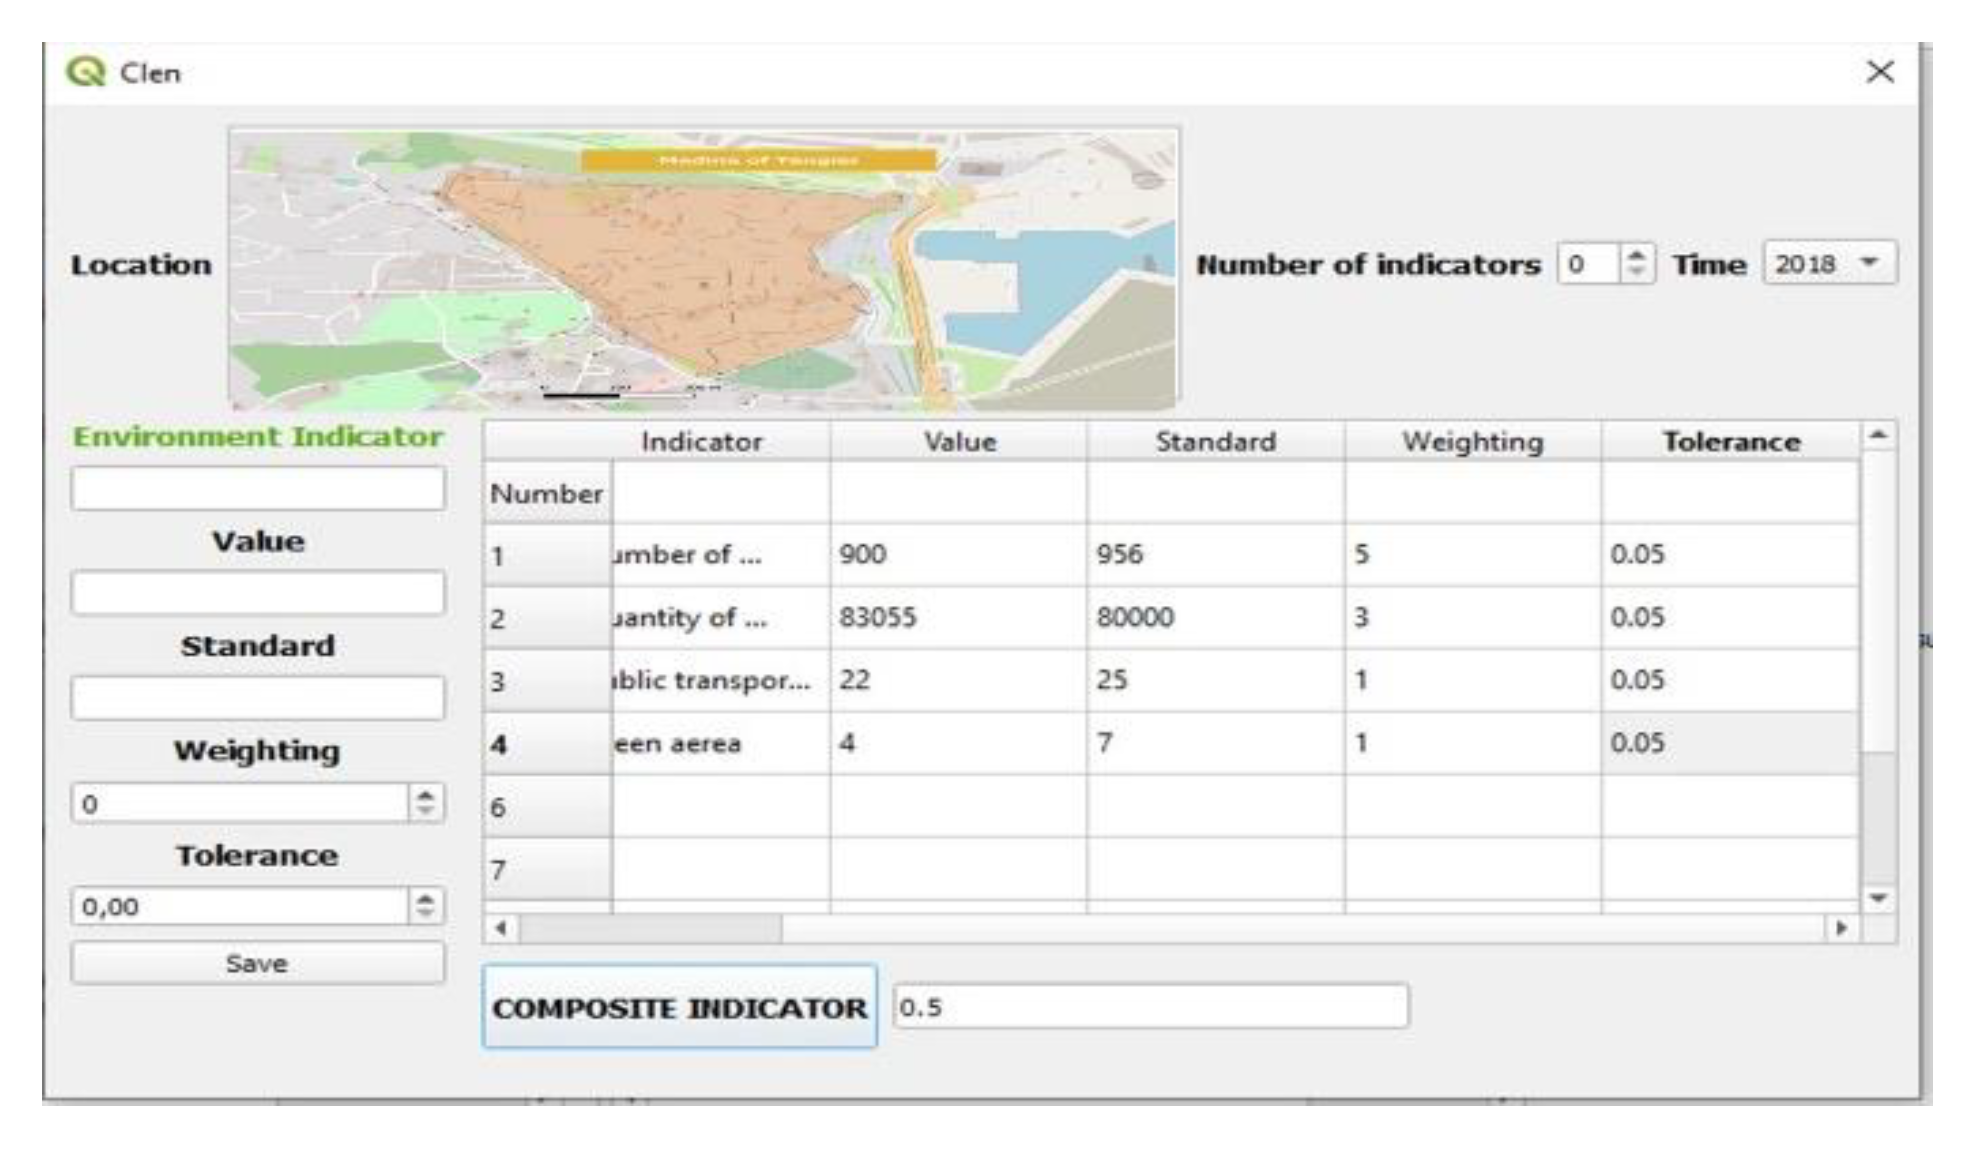
Figure 9.
Composite social indicator of the Medina of Tangier.
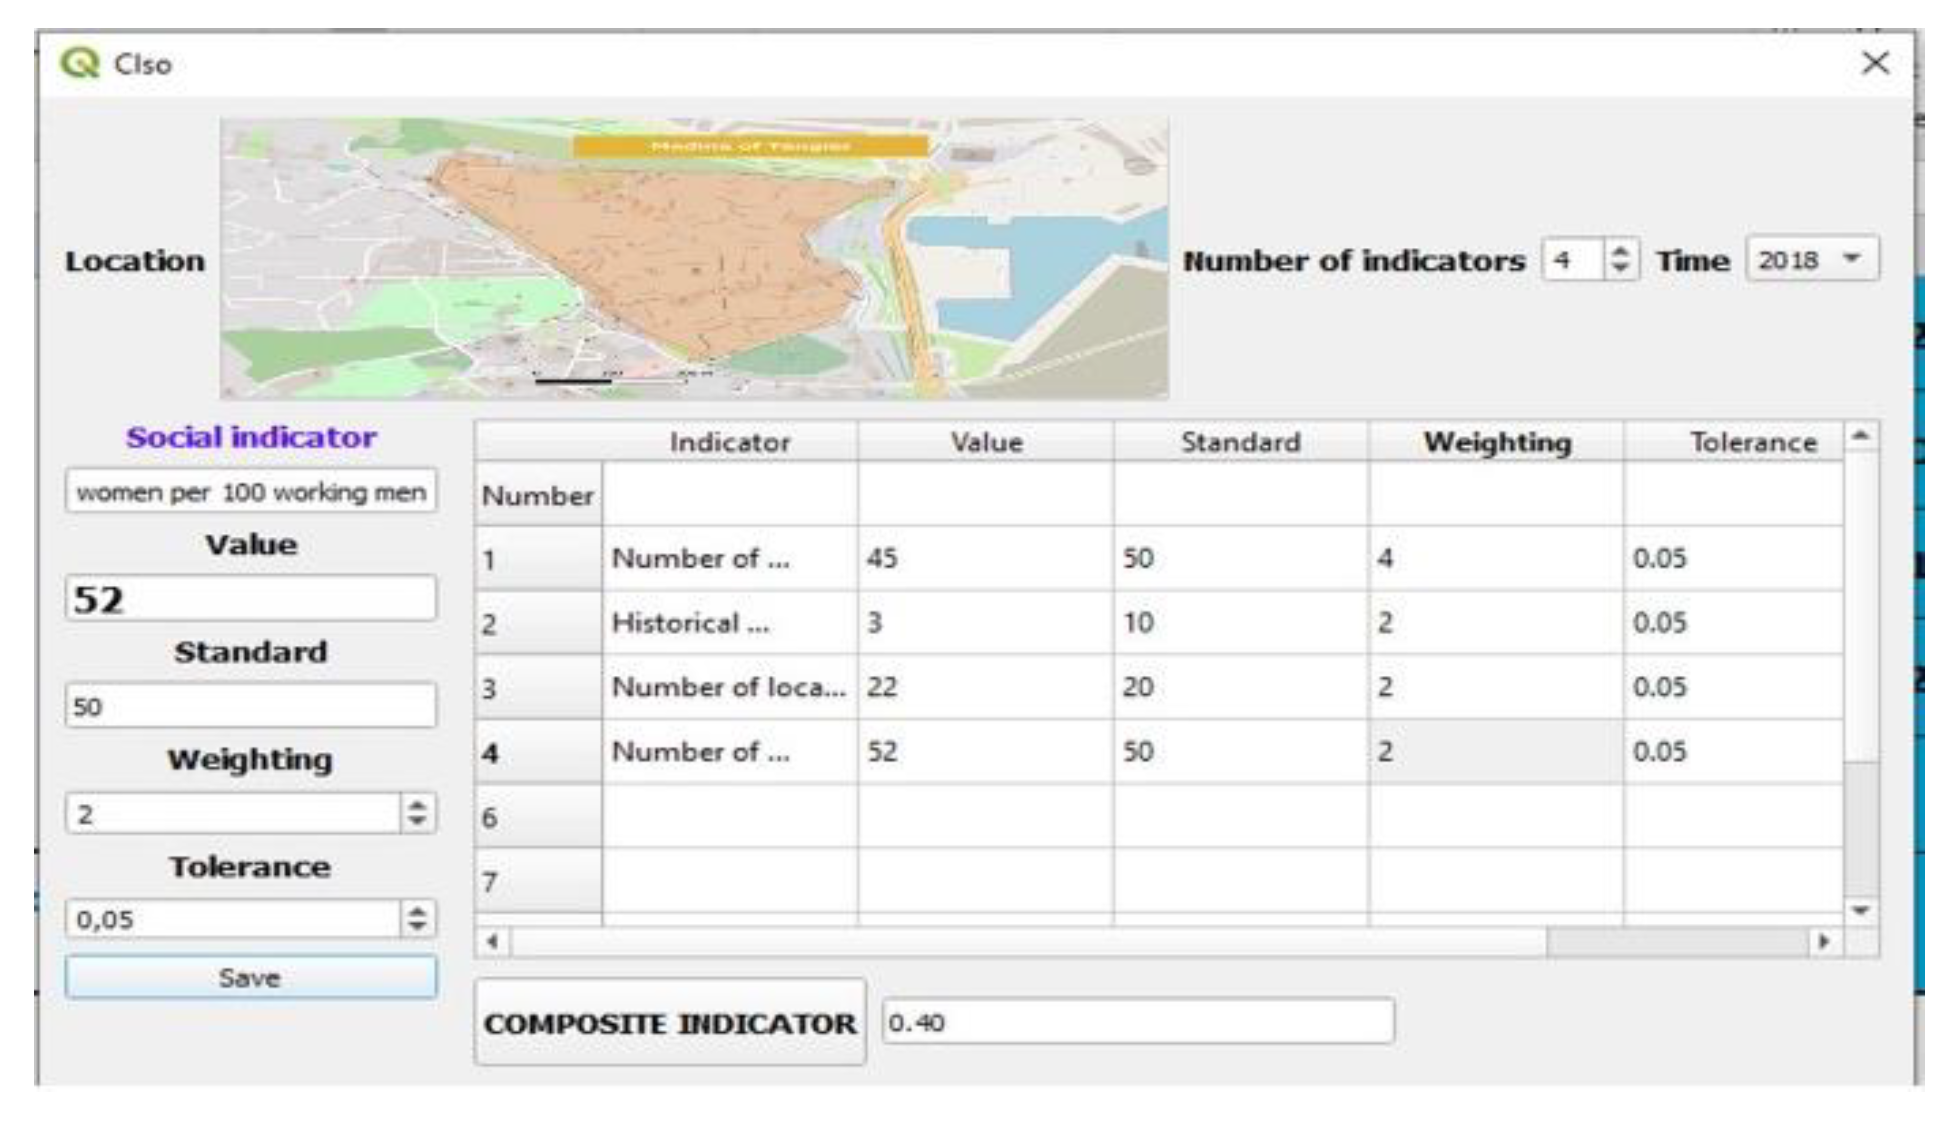
Figure 10.
Global Sustainability Index of the Medina of Tangier.
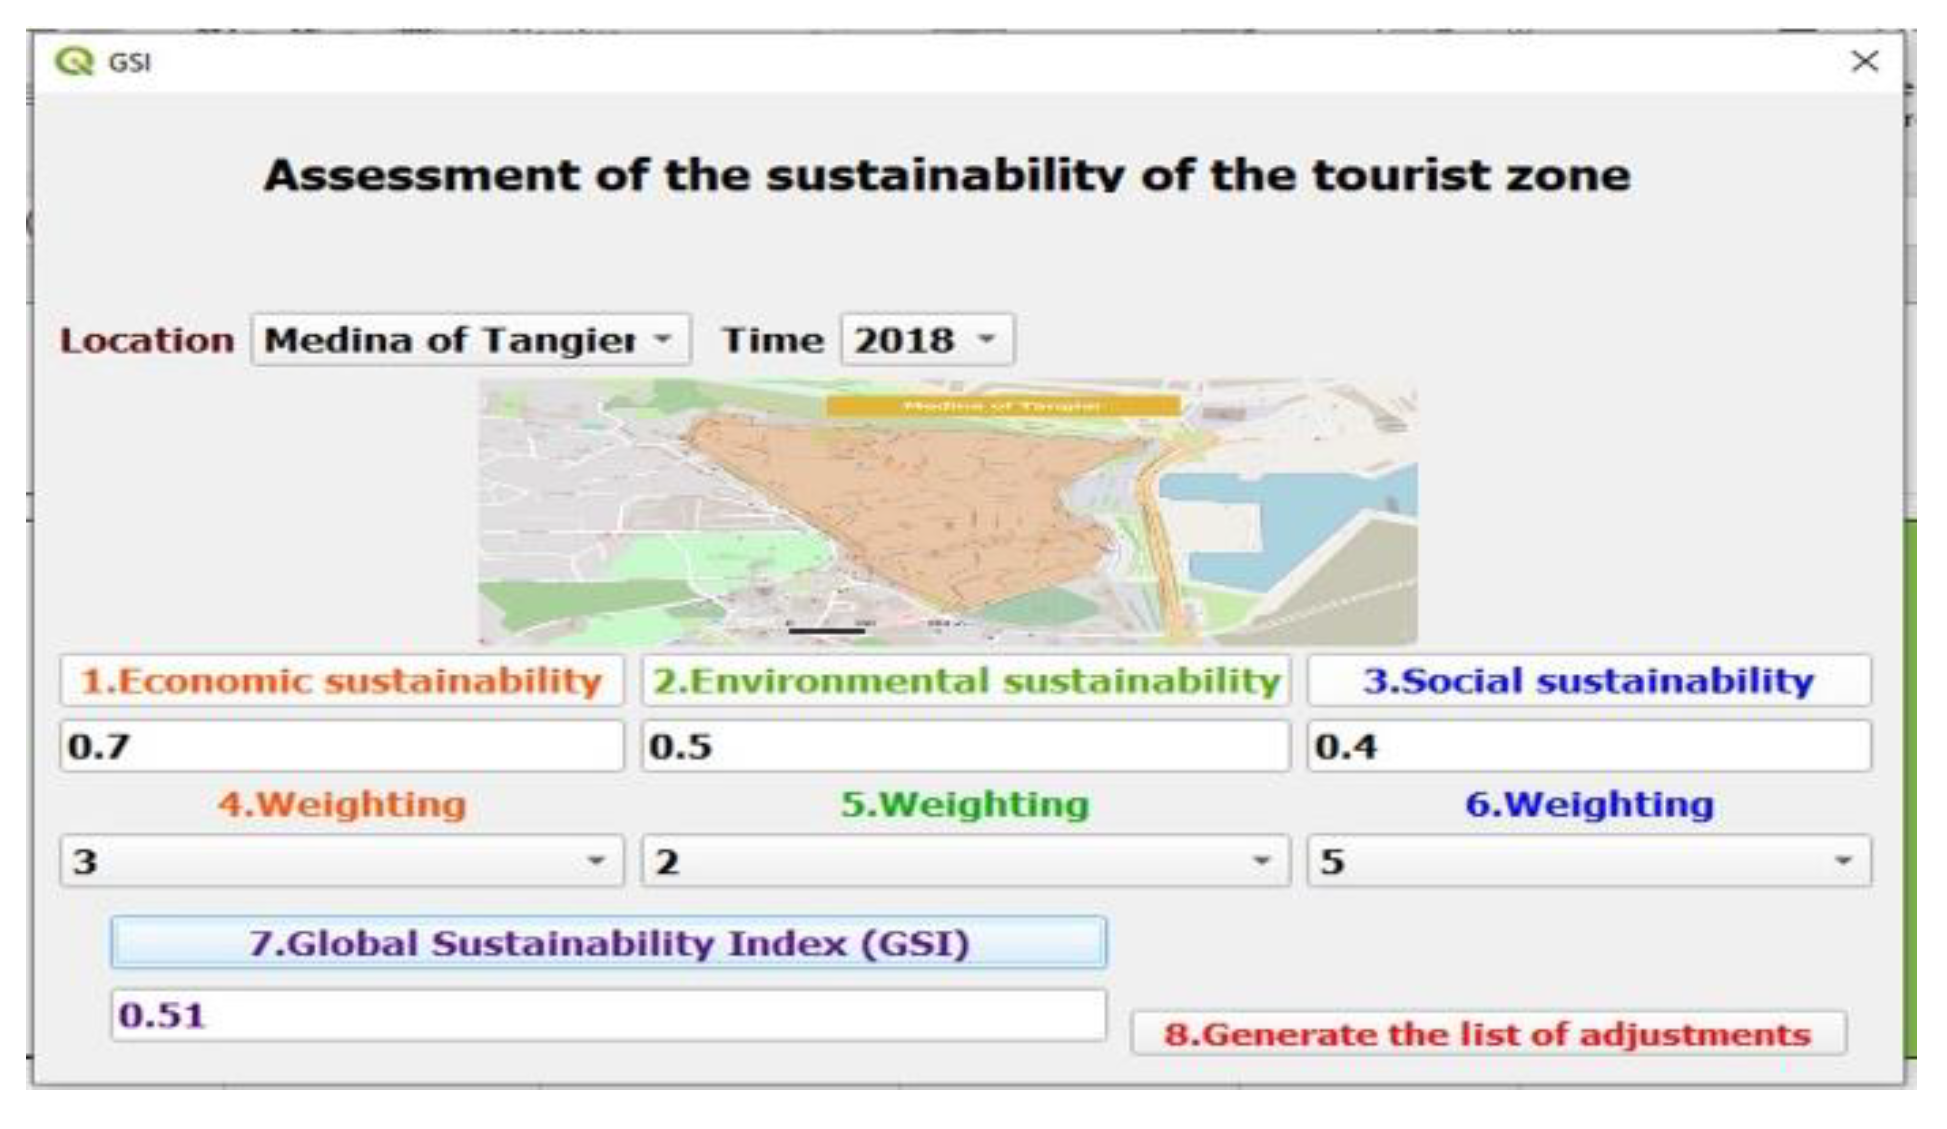
Figure 11.
Adjustments of Deficient Indicators in the Medina of Tangier.
4. Results analysis
The results concerning the destination Medina de Tangier were calculated from the model based on the adopted tolerances and weights, as shown in Figure 2. Note that greater weight was assigned to the social component (δ3 = 5) due to its significance. On the other hand, the economic and environmental components, , , have weaker improvement factors (δ1=1, δ3 =2). Then, based on these values, the sustainability status of Medina de Tangier in the year t1=2018 was determined to reflect the resulting interactions among the different sustainability components through indicators. Note that the indicators responsible for "non-sustainability" based on their evaluated values can be easily identified from Figure 12 adjustments.
As shown in Figure 12, we observed that several indicators are not meeting their standards. Consequently, our evaluation model automatically qualifies the site of Medina de Tangier as relatively unsustainable. This is also evident in the value of the overall sustainability index GSI (2018) = 0.51, which is far from the perfect value of 1. Indeed, in terms of persistent sustainability, the production result represents only 51% of perfect sustainability. This negative aspect should be avoided in the following year t2 (2019), as there might still be a risk of a decline in non-sustainability if key responsible indicators are not adequately adjusted, addressing the real causes of non-sustainability.
4.1. Adjustment
The challenge in effectively monitoring the Medina de Tangier lies in maintaining the best indicators while improving the poor ones. This is essential to defend and protect this fragile site against potential internal deterioration and external disruptions and to achieve a higher composite indicator.
It's worth noting that adjustments and recommendations have been partially implemented after the year 2018, considering the proposals from the Observatory for the Protection of the Environment and Historical Monuments of Tangier. However, this project has not yet been fully implemented, which would have provided more flexibility and ease of operation.
5. Conclusion
This article introduces simple and user-friendly QGIS plugins built under Python, enabling automated processing and calculation of tourist sustainability indices. It assesses the sustainability of tourist areas and can be a valuable tool for decision-makers without strong GIS knowledge. The plugins are designed for monitoring, tracking, and managing attractive destinations threatened by overexploitation of natural and cultural resources.
Author Contributions
Conceptualization, S.H.; methodology, F.E.M. and J.C.; validation, F.E.M., J.C.; investigation, S.H., F.E.M; resources, F.E.M; writing—original draft preparation, S.H.; writing—review and editing, S.H., F.E.M.; supervision, J.C.; project administration, F.E.M.; All authors have read and agreed to the published version of the manuscript.
Funding
This research received no external funding.
Institutional Review Board Statement
Not applicable.
Informed Consent Statement
Not applicable.
Data Availability Statement
Not applicable.
Acknowledgments
The authors express their gratitude to the Observatory for the Environment and Historical Monuments (OPEMH) for their collaboration as the organizer of the annual "Tangier Sustainable City" forum and primary data provider.
Conflicts of Interest
The authors declare no conflict of interest.
References
- Ministry of Tourism, Crafts, and Social and Solidarity Economy. [En ligne]. Disponible sur: https://mtaess.gov.ma/fr/tourisme/chiffres-cles/.
- Impact économique des voyages et du tourisme | World Travel & Tourism Council (WTTC).
- Organisation Mondiale du tourisme OMT, 2023, World Travel & Tourism Council (WTTC). [En ligne]. Disponible sur: https://www.unwto.org/fr/statistiques-du-tourisme/mesurer-la-durabilite-du-tourisme.
- Ko, T.G. Development of a tourism sustainability assessment procedure: a conceptual approach. Tour. Manag. 2005, 26, 431–445. [Google Scholar] [CrossRef]
- Asmelash, A.G.; Kumar, S. Assessing progress of tourism sustainability: Developing and validating sustainability indicators. Tour. Manag. 2019, 71, 67–83. [Google Scholar] [CrossRef]
- Singh, R.K.; Murty, H.R.; Gupta, S.K.; Dikshit, A.K. An overview of sustainability assessment methodologies. Ecol. Indic. 2009, 9, 189–212. [Google Scholar] [CrossRef]
- Mohamed, H.; Rachid, E.-D. Assessing Sustainable Tourism: Trends and Efforts in Essaouira in Morocco as a Coastal City. Int. J. Sustain. Manag. Inf. Technol. 2019, 5, 23. [Google Scholar] [CrossRef]
- Steenbruggen, J. Tourism Geography: Emerging Trends and Initiatives to Support Tourism in Morocco. 2014, Consulté le: 28 juillet 2022. [En ligne]. Disponible sur: https://research.vu.nl/en/publications/tourism-geography-emerging-trends-and-initiatives-to-support-tour.
- Clift, R. Metrics for supply chain sustainability. Clean Technol. Environ. Policy 2003, 5, 240–247. [Google Scholar] [CrossRef]
- Saltelli, A. Composite Indicators between Analysis and Advocacy. Soc. Indic. Res. 2007, 81, 65–77. [Google Scholar] [CrossRef]
- Fu, Y.; Xiangtianrui, K.; Luo, H.; Yu, L. Constructing Composite Indicators with Collective Choice and Interval-Valued TOPSIS: The Case of Value Measure. Soc. Indic. Res. 2020, 152, 117–135. [Google Scholar] [CrossRef]
- Franceschini, F.; Galetto, M.; Maisano, D. Management by measurement: designing key indicators and performance measurement systems; Springer: Berlin, Germany; New York, NY, USA, 2007. [Google Scholar]
- Warhurst, A. Sustainability Indicators and Sustainability Performance Management.
- Opschoor, H.; Reijnders, L. Towards sustainable development indicators. In Search of Indicators of Sustainable Development; Kuik, O., Verbruggen, H., Eds.; Springer: Dordrecht, Netherlands, 1991; pp. 7–27. [Google Scholar] [CrossRef]
- Blancas, F.J.; Contreras, I.; Lozano-Oyola, M. Evaluating destinations’ efforts to improve sustainability in tourism using the inter-temporal decomposition of a composite indicator. Environ. Impact Assess. Rev. 2023, 98, 106947. [Google Scholar] [CrossRef]
- Saisana, M.; Michela, N. Handbook on Constructing Composite Indicators: Methodology and User Guide, European Union. 2008.
- Haloui, S.; Rami, M.A.; Jamal, C. Diagnosis and Adjustment for Sustainable Tourism. Lecture Notes in Networks and Systems, 2022. [En ligne]. Disponible sur:. [CrossRef]
- Haloui, S.; Rami, M.A.; Chao, J. Evaluation of sustainable tourism via GIS: Tangier case study. Int. J. Glob. Sci. Res. 2021, 8. [Google Scholar] [CrossRef]
- Rapport sur l’état de l’environnement et du développement en Méditerranée (RED) 2020. Erscheinungsort nicht ermittelbar: United Nations, 2021.
- Roche, S.; Propeck-Zimmermann, E.; Mericskay, B. GeoWeb and crisis management: issues and perspectives of volunteered geographic information. GeoJournal 2013, 78, 21–40. [Google Scholar] [CrossRef] [PubMed]
- Alshuwaikhat, H.M.; Abubakar, I.R.; Aina, Y.A.; Adenle, Y.A.; Umair, M. The Development of a GIS-Based Model for Campus Environmental Sustainability Assessment. Sustainability 2017, 9, 439. [Google Scholar] [CrossRef]
- Boers, B.; Cottrell, S. Sustainable Tourism Infrastructure Planning: A GIS-Supported Approach. Tour. Geogr. 2007, 9, 1–21. [Google Scholar] [CrossRef]
- Hall, C.M.; Williams, A.M. Northern Arizona University, USA.
- Gianluca, M. QGIS Python Plugins Repository. 2023. [En ligne]. Disponible sur: https://plugins.qgis.org/plugins/author/University%20of%20Perugia%20(Developer:%20Gianluca%20Massei)/.
- Schwab, J.; Horiguchi, R.; Keller, S.F. QGIS Python Plugins Repository Download latest USM toolset. 2023. [En ligne]. Disponible sur: https://plugins.qgis.org/plugins/usm_calculator-main/#plugin-details.
- Sebbah, B.; Alaoui, O.Y.; Wahbi, M.; Maâtouk, M.; Ben Achhab, N. QGIS-Landsat Indices plugin (Q-LIP): Tool for environmental indices computing using Landsat data. Environ. Model. Softw. 2021, 137, 104972. [Google Scholar] [CrossRef]
Figure 1.
The main tasks performed by the users of the plugins.
Disclaimer/Publisher’s Note: The statements, opinions and data contained in all publications are solely those of the individual author(s) and contributor(s) and not of MDPI and/or the editor(s). MDPI and/or the editor(s) disclaim responsibility for any injury to people or property resulting from any ideas, methods, instructions or products referred to in the content. |
© 2024 by the authors. Licensee MDPI, Basel, Switzerland. This article is an open access article distributed under the terms and conditions of the Creative Commons Attribution (CC BY) license (http://creativecommons.org/licenses/by/4.0/).
Copyright: This open access article is published under a Creative Commons CC BY 4.0 license, which permit the free download, distribution, and reuse, provided that the author and preprint are cited in any reuse.


