
Submitted:
28 December 2023
Posted:
28 December 2023
You are already at the latest version
Abstract
The energy crisis is currently a major topic in scientific and managerial discussions in the building and construction industry. While employing low-cost strategies for reducing energy usage is beneficial for principals and decision-makers, the primary purpose of this study is to recommend the use of phase change materials (PCM) to improve cooling and heating load management in buildings. In order to accomplish this, the study applies design-builder simulations to a developing country case study. The results indicate that integrating PCM in buildings can reduce energy usage by around 6 percent. Although this value may be lower than other techniques, it is nevertheless important for reaching green building goals in both developed and developing nations. The case study, which takes place in a four-season region, demonstrates the significant potential of the PCM system for both cooling and heating energy management. In addition, the reciprocal performance improvement of PCMs is a remarkable characteristic, especially when contrasted to some conventional systems that focus on a single energy management objective in buildings. Lastly, it should be underlined that the suggested platform is consistent with Sustainable Development Goal 7 (Affordable and Clean Energy Targets).
Keywords:
Green Buildings
; Energy Efficiency
; DesignBuilder Simulation
; Phase Change Materials
; Sustainability
; Exergy
1. Introduction
Nowadays, the necessity to optimize energy consumption is more acute due to the lack of energy resources, the growth in the cost of energy carriers, and environmental pollution caused by the widespread use of fossil fuels. Nearly 84 percent of the world's total primary energy consumption comes from fossil fuels. Despite declines in recent years due to increased usage of renewable sources, fossil fuels continue to account for the majority of energy use (Statista, n.d.). Moreover, Iran's energy usage is 2.5 times the world average (Statista, n.d.) and at most, only 1.3% of this is derived from renewable energy sources (IEA, n.d.). According to the International Energy Agency (IEA), Iran's residential sector has historically accounted for a significant portion of its energy usage (Figure 1), accounting for nearly 27% of total final usage of energy in 2020, mainly because of its failure to follow construction principles and to use appropriate and optimal materials.
In light of the residential sector's disproportionate share of Iran's final energy consumption compared to other sectors such as industry, transportation, and agriculture (Figure 2), energy consumption can be optimized through the reduction of energy demand, the prudent use of energy, the recovery of heat and cold, and the utilization of energy from the surrounding air and ground. Utilizing a technique that can keep the interior air temperature pretty close to the anticipated temperature for a longer duration can significantly help to reduce energy demand, as cooling or heating a space to preserve thermal tranquility can account for up to 60–70% of total energy usage in non-industrial buildings (Omer, 2008) (Pasupathy et at., 2008).
Table 1 shows various concepts for both heating and cooling solutions that can be used to attain this goal (Omer, 2008).
There has been continuing research into effective and practical technology that might be used to reduce the amount of energy used by buildings. Heat energy loss by convection, conduction, and radiation occurs when energy moves from the warmer internal air to the colder external air through the building envelope (Najjar et al., 2019). Typically, thermal bridges (TB), air exchange between interior and outdoor areas, walls, roofs, windows, doors, slabs, and air leakage via these structures are the main sources of heat energy loss in buildings (Saied et al., 2022). Numerous studies have examined these fundamental types of energy loss in buildings; however, the rates may differ depending on the design and structure of the building (Rashidi et al., 2018). The majority of energy losses in a conventional structure come from the walls and roofs, as shown in Figure 3. Creating energy storage devices is one way to preserve cold or hot energy that is either freely available or that can only be produced during specific periods of the day in a structure (Pasupathy et al 2008). TES is essential for energy conservation, bridging the supply and demand gap, and improving the efficiency and dependability of energy systems (Sharma et al., 2009). Its usage in both passive and active systems also permits the efficient use of thermal energy, peak load-shifting techniques, and waste energy (de Gracia & Cabeza, 2015). Sensible heat storage (SHS), latent heat storage (LHS), thermochemical storage (TCS), or a mix of then all be used to TES as a change in a material's internal energy (Sharma et al., 2009; Androšević and Androšević, 2022).
In contrast to sensible heat storage (SHS), which involves the thermal energy being stored by raising the temperature of a solid or liquid, latent heat storage (LHS) is based on the heat absorption or release that occurs when a storage material undergoes a phase change from solid-solid, solid-liquid, solid-gas, or liquid-gas to solid-gas and vice versa. The foundation of thermochemical systems is the energy gained and released by the totally reversible chemical process of breaking and renewing molecular bonds (Pasupathy et at., 2008). Latent heat thermal energy storage (TES) is one of these thermal heat storage methods that stands out as particularly appealing due to its capacity to provide high energy storage density as well as its capability to store heat at a constant temperature corresponding to the phase transition temperature of phase change material (PCM) (Sharma et al., 2009). PCMs are capable of holding anywhere from five to fourteen times as much heat per unit volume as traditional storage mediums such as water, rock, or rock masonry. PCMs can be classified in a variety of ways, such as by phase change temperature (Zhou et al., 2015), material properties (thermodynamic, kinetic, chemical, and economic properties) (Sharma et al., 2009), material nature (organic, inorganic, or eutectic, such as paraffin, fatty acids, salt hydrates, etc.) (Pasupathy et al., 2008), etc. Despite the fact that it is obvious that no single material can perfectly satisfy all of the properties mentioned above (Abhat, 1983), the phase change temperature, a thermodynamic property, is one of the most crucial selection factors when choosing PCMs since it has an impact on the entire heat transfer process (Zhou et al., 2015). Indeed, in a suitable PCM, the transition temperature must be within the desired temperature range (Sharma et al., 2009).
There has been study on the use of PCM for a number of purposes, such as residential hot water tanks, building space heating and cooling, peak load shifting, solar energy applications, and seasonal storage (Zhou et al., 2015). In terms of buildings, researchers have particularly conducted extensive research on the incorporation of phase change materials (PCM) (de Gracia & Cabeza, 2015). PCM can be introduced into construction materials by many processes in passive technologies, including immersion , direct incorporation, encapsulation, shape stabilization, and microencapsulation (de Gracia & Cabeza, 2015).
Storage systems used in the construction sector can be classified as either active or passive solutions (Parameshwaran et al., 2012). Passive TES systems aim to efficiently increase naturally available heat energy sources to maintain thermal stability in buildings and reduce the required mechanical heating or cooling devices (Soares et al., 2013). On the other hand, using active TES systems enhances the way thermal energy is stored and offers a high level of control over the indoor environment. Active TES systems are typically integrated into buildings, as opposed to passive TES systems, which are embedded into building materials. These systems, which can be applied to both new construction and retrofit buildings, are designed to increase the performance of existing installations, incorporate peak load shifting strategies, and implement renewable energy for space heating and/or cooling (de Gracia & Cabeza, 2015) (Alsokhiry et.al., 2022). Table 2 shows the summary of the integration of the TES in the building in passive and active systems in recent studies.
To summarize, PCM is a promising, developing technology that, when applied to buildings, improves thermal comfort, increases energy efficiency, and lowers overall energy costs. As it is shown in Table 2, phase change material has the potential to be used in buildings for a variety of purposes, among which are heating/cooling load management and power generation (Du et al., 2018). Table 2 indicates that recent PCM building applications in passive and active modes have been focused on PCM impregnation in building materials, PCM implementation as a new layer within the building envelope (side walls, roof, and floor), positioning PCM-TES systems in the building, PCM addition into windows and sun protection, and PCMs in building equipment (Air cooling, Air heating, and Ventilation systems). Another approach to incorporating PCM in building walls that has been less studied is its application as thermal insulation material in wall materials (de Gracia & Cabeza, 2015). Yang et al. (2015) evaluated this idea and demonstrated how the combined benefits of PCM's storage capacity and polyurethane foams' insulation performance have a significant potential to increase building energy efficiency (Yang et al., 2015). The majority of PCM investigations to date have concentrated only on TES capacity (Faraj et al., 2022), ignoring some of the characteristics that make PCMs ideal thermal insulating materials, such as their strong heat transfer resistance and low thermal conductivity (de Gracia & Cabeza, 2015). Further investigation is required in order to adapt this novel thermal insulating material. Furthermore, the impact of PCM-integrated buildings constructed using common and conventional building materials on heating/cooling load reduction has yet to be studied.
By using innovative building insulations, such as phase change materials and nanofluid in the building envelope, the current study intends to evaluate the technical and financial performance of building energy.
As the main problem of the present research, the energy crisis has emerged as a critical concern within the building and construction industry, prompting a reevaluation of existing energy consumption practices. This crisis poses a multifaceted challenge, demanding innovative solutions to reduce the industry's environmental impact. As decision-makers and principals seek cost-effective strategies to mitigate energy usage, it becomes evident that a paradigm shift is necessary. The limitations of current low-cost approaches necessitate the exploration of more sophisticated and sustainable alternatives. In light of this, the research delves into the potential of PCM to revolutionize cooling and heating load management in buildings (Sorooshnia et al., 2023; Mousavi et al., 2023).
As an innoviation points of this research, conducting the case study in a four-season region introduces a layer of complexity and relevance to the research, showcasing the adaptability and effectiveness of PCM in diverse climates. The reciprocal performance improvement of PCM is a standout feature, distinguishing it from conventional systems that often focus on a singular energy management objective. This characteristic not only enhances the overall efficiency of the system but also aligns with the multifaceted demands of modern building structures. Moreover, the research underscores the alignment of the suggested PCM integration platform with Sustainable Development Goal 7 (Affordable and Clean Energy Targets). This not only positions PCM as a solution to the immediate energy crisis but also as a strategic contributor to global sustainability objectives. In conclusion, the study not only identifies problems and presents research content but also introduces innovative points that elevate PCM integration as a transformative force in the building and construction industry's journey towards sustainability(Mousavi et al., 2023).
2. Material and methods
This section's goal is to discuss the research process that was utilized to produce this research. The methods employed to assess the research question are outlined in detail, including sampling, data collection, analysis, and utilization techniques. For this purpose, first a building with common and conventional walls is selected as the case study, and then the case study's related features are thoroughly examined utilizing DesignBuilder simulation software. Second, based on the case study and its locational features, the phase change material is selected and assigned to the building's walls. This method is also performed with a layer of nanofluids. Finally, using simulation software, the given case study is simulated, and the use of the assigned phase change material and the nanofluids is examined, validated, and compared.
This study tackles the energy crisis in the building industry by proposing cost-effective strategies, with a focus on PCM for improved cooling and heating (Figure 4). Using design-builder simulations in a developing country case study, the research demonstrates a 6 percent reduction in energy usage through PCM integration. The practical application in a four-season region highlights PCM's performance advantages over traditional systems, aligning with Sustainable Development Goal 7 for a more sustainable and energy-efficient built environment.
2.1. Case study specifications
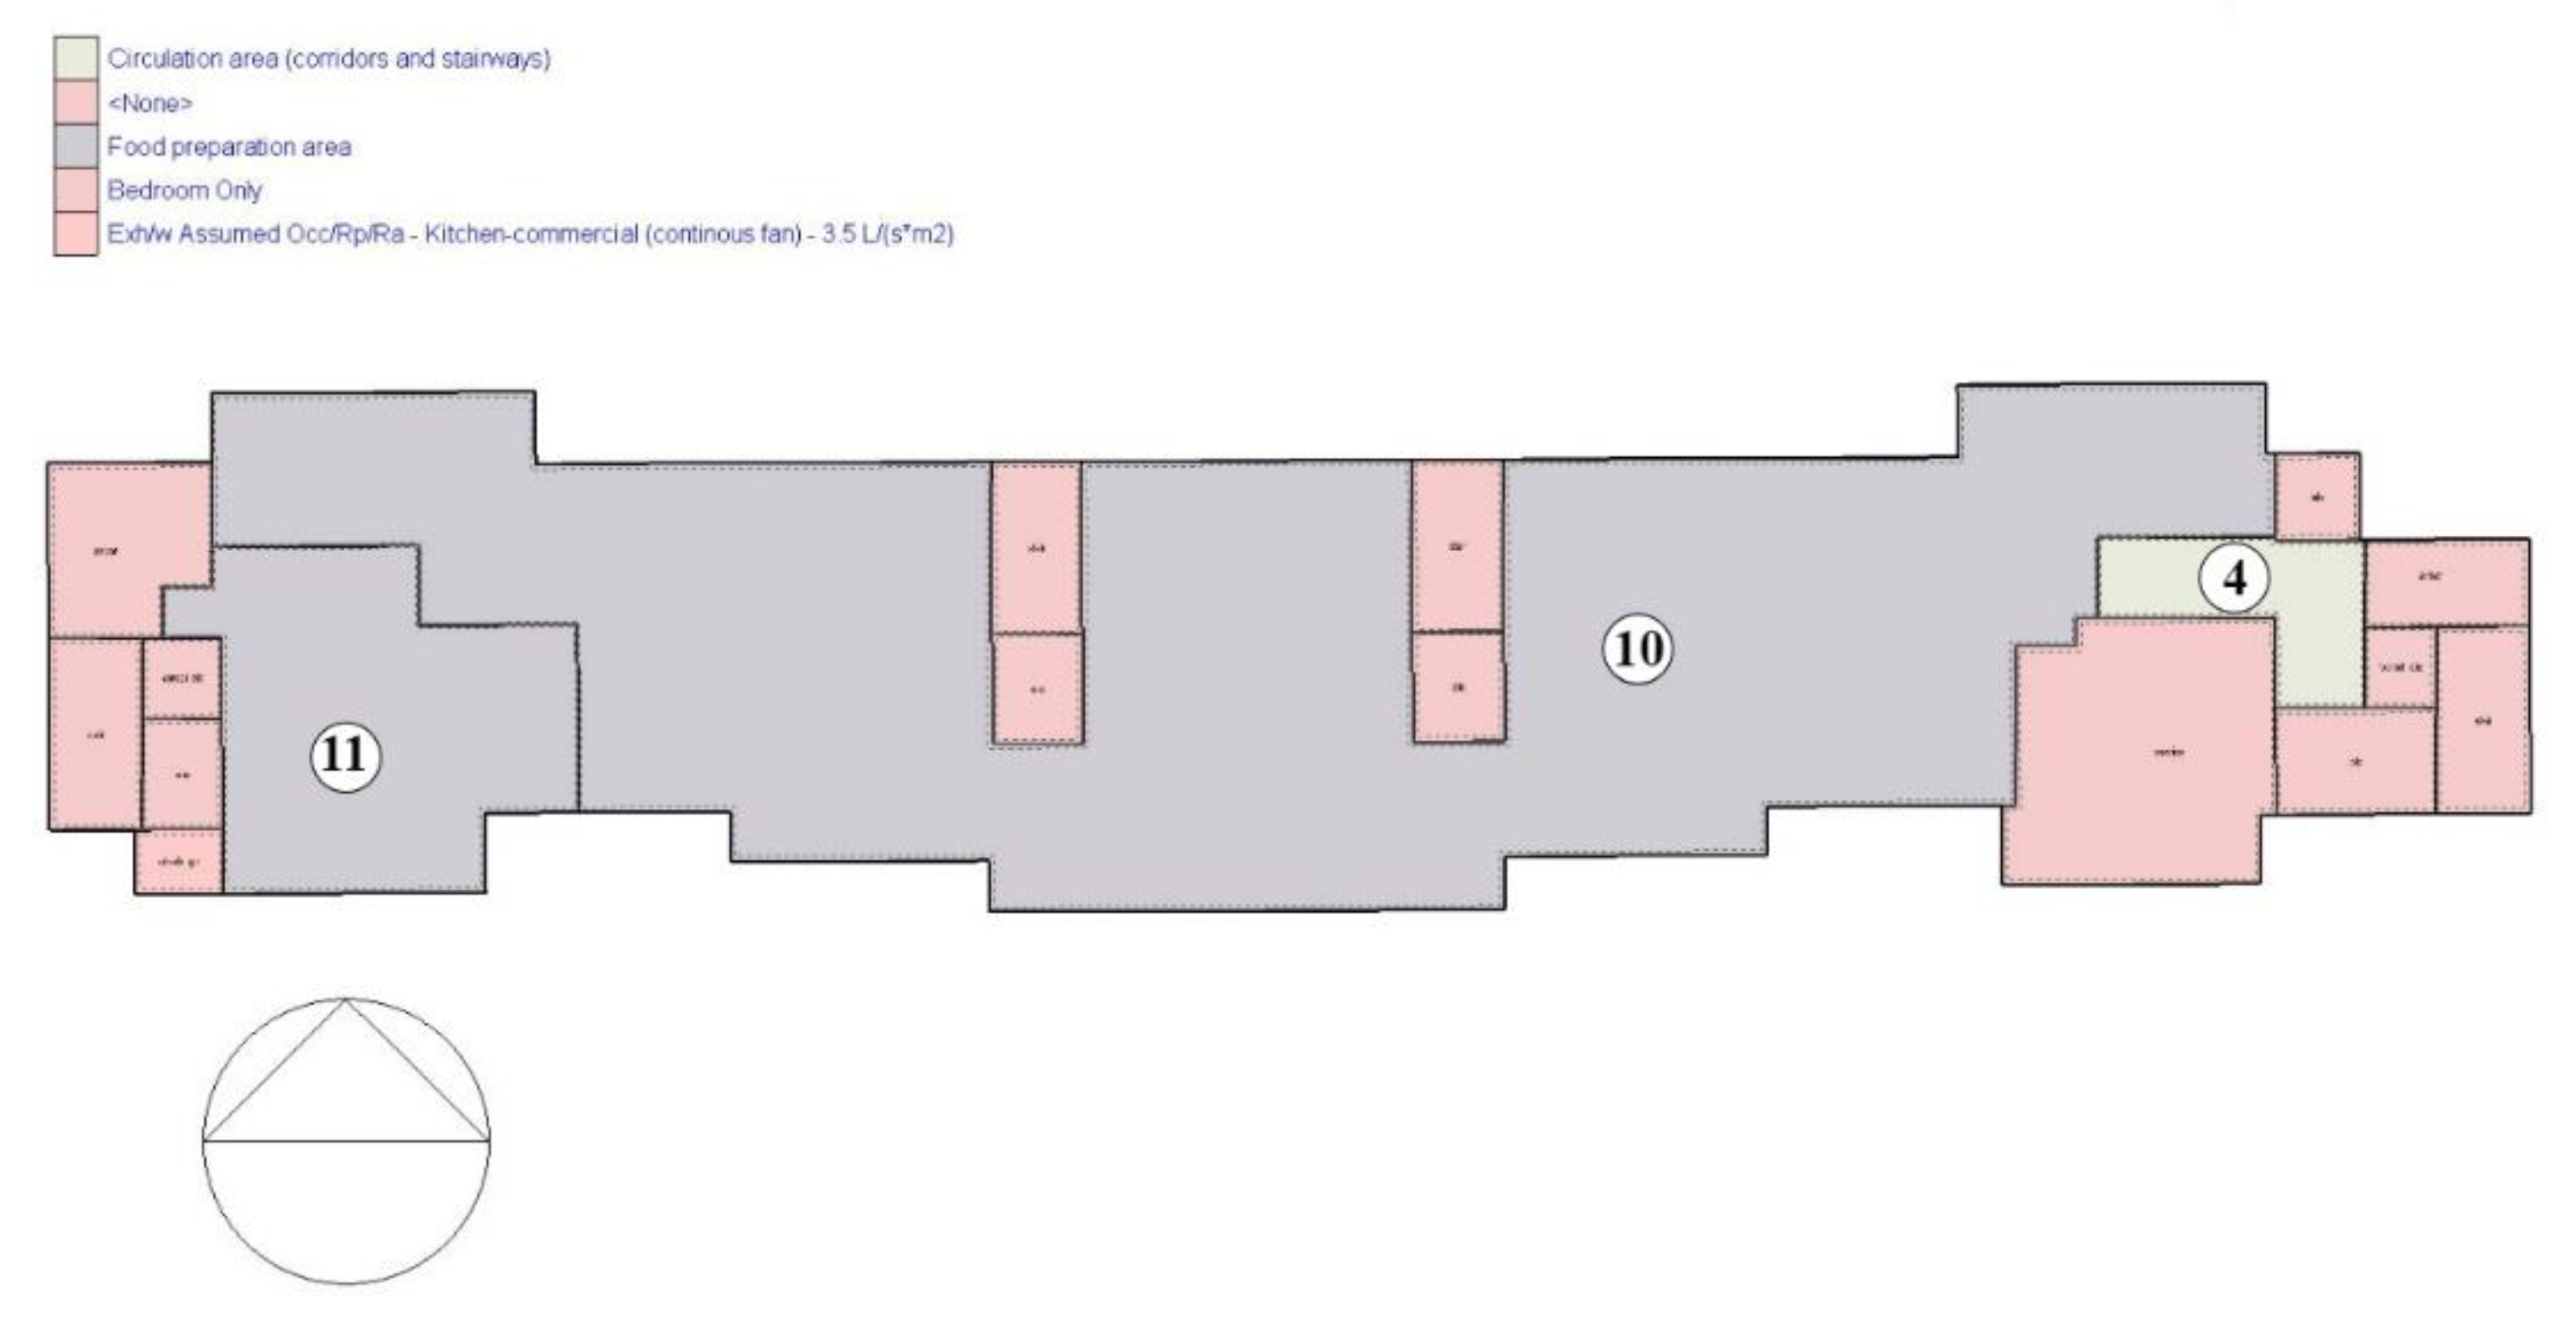
The hotel examined in this study has 16 stories, 5 of which are below ground level (basement) and 10 of which are on ground level (Figure 5). The schematic floor layouts, along with the functions of different parts of the layout, are outlined in Appendix A.1-A.6. The features of the hotel's layout are also shown in Table 3.
The external wall of this hotel, which is made up of common masonry, is simulated in the DesignBuilder software, as shown in Figure 6. The hotel's exterior wall is composed of three materials in layers of different thicknesses. In the outermost layer, 3 centimeters of brick are laid. 15 centimeters of autoclaved aerated cement blocks (AAC blocks) are placed in the middle layer, and 1.3 centimeters of plaster are applied in the innermost layer. The values of heat transfer coefficient and thermal mass, which are related to the heat properties of the external wall without thermal insulation, are also given in Table 4.
2.2. PCM and thermal nanofluids specification
As mentioned in the previous section, the phase change temperature is one of the most important factors when choosing PCM. As a result, the climate of Mashhad, the city where the chosen hotel is located, should be studied first. A PCM with a phase change temperature in an acceptable range that is close to room temperature should be used. This is because if the phase change temperature is, for example, substantially higher or lower than 30 °C, the building's temperature may only reach this point for a few days in summer or winter. As a result, the phase change material will be practically useless except on a few hot summer days or freezing winter days.
The second criterion for selecting the phase change material is the existence and availability of this material in the targeted location, because its absence would ultimately result in a new and different design.
The third consideration is the total cost as well as the price of the phase change material. In order to reduce the total cost, the cheapest phase change material with the minimum thickness and suited to other parameters should be implemented.
The other important factor is the density of the phase-change material. The cost of the structural design and the cost of the phase change material, which is based on its weight, will be lower as density and weight are inversely correlated. Last but not least, further crucial features that must be taken into account are low thermal conductivity, corrosion resistance, fire resistance, and latent heat storage.
Taking into account the aforementioned factors and reviewing the relevant scientific literature, the RT18HC phase change material from paraffins, produced by Rubitherm Company, was chosen for this study. RT18HC is an organic, non-corrosive, flammable, affordable, widely available, and relatively low-density material. Its properties are listed in Table 5 and Figure 7 (Rubitherm, n.d.).
The following are some further characteristics of this phase-change material and other products made by this company whose names begin with the RT prefix.
- -
- High thermal energy storage capacity
- -
- Fairly constant temperatures while storing and discharging heat.
- -
- Neither supercooling nor chemical reactions
- -
- Long lifespan with stable performance in phase change cycling.
- -
- Available in a melting temperature range of -9°C to 100°C
- -
- Reasonable price ( About $2 per weight is the cost of RT18HC, an impure paraffin wax.)
In this study, thermal nanofluids, which are more common in Iran and have a wide range of suppliers, have also been examined in addition to phase change materials. These coatings create a barrier against heat transfer, reducing thermal conductivity and preventing heat loss or gain. They can offer acceptable surface coverage and uniformity owing to their nanoscale nature, which enhances thermal performance. They can be applied to a wide range of materials and substrates, including plaster, cement, and metal surfaces on external walls, facades, and roofs. The thermal characteristics of these thermal coatings can be seen in Table 6 (Shahrul et al., 2014; Bozsaky, 2015).
In this study, Nano Pars Company's Junior Armor thermal nano-paints were used, which have a final thickness of 1 mm on the wall and a surface area of 1 square meter per kilogram of paint. This product is expected to have 10-year durability, and its price is about 7.2 dollars per pound (Nanoparsco, n.d.).
According to Figure 8 and Figure 9, a 2-centimeter layer of RT18HC and a 0.1-centimeter layer of nanopaint have been applied to the building's external walls in this study. Additionally, the heat properties of the external wall, interior wall, and roof with a layer of RT18HC or nanopaint are shown in Table 7 and Table 8.
2.3. Simulation practice
Over the last few decades, PCM application has been the subject of two types of studies: experimental or numerical/ simulation (Faraj et al., 2022). Comparing simulations to experimental studies from an economic standpoint, simulations can be more desirable because they are more cost-effective and have a shorter life cycle (Faraj et al., 2022). On the other hand, methods for estimating a building's energy requirements and energy flows evolved along with computer technologies, ranging from basic to extremely complicated numerical methods (Vukadinović et al., 2020), which has led to the development of over 200 simulation tools in recent years (Akkurt et al., 2020). There is therefore an expanding body of research in the field of PCM application in building thermal performance; examples include those of Peippo et al (1991), Li et al (2009), Sayyar et al (2014), Athienitis et al (1997), and Diaconu et al (2011) (Parameshwaran et al., 2012). In this study, the thermal impact of applying phase change materials and thermal nano-paints on the building envelope is explored and compared by simulating a hotel in the city of Mashhad, Iran, using Designbuilder software which general steps for energy simulation are summarized in Figure 10.
DesignBuilder, a building performance modeling software, offers a wide range of features, including tools for energy simulation, HVAC system design, daylighting analysis, thermal comfort assessment, and renewable energy integration. To effectively use DesignBuilder software in this research, five primary assignments or tasks were completed: project setup, building geometry, building properties, HVAC system design, and energy simulation setup. All of these steps are further discussed in the paragraphs that follow.
2.4. Project Setup
In this step, project settings were defined including project name, location, and units of measurement. To assign climatic characteristics to the weather folder, there are a few options. In this research weather data has been extracted from both DesignBuilder's Built-in Weather Data and Climate Consultant Application. Climate Consultant reads EPW (Energy Plus Weather) format local climate data and shows thousands of different graphic charts of various weather parameters including temperature, radiation range, sky cover range, wind velocity range, and precipitation (Kumar & Sharma., 2018). Figure 11, Figure 12 and Figure 13 depict Mashad's climate data derived from Climate Consultant. As shown in Figure 11, February has the fewest hours of sunlight, while July has the most. Figure 12 shows that Maximum temperatures occur between June to August and the minimum temperature is in January. Additionally, in the winter, the temperature variation between maximum and minimum is higher than in other seasons. Figure 13 indicates that the monthly average relative humidity in Mashhad's climate varies from 25 to 68 percent. In addition to the climatic data collected from the Climate Consultant, Table 10 illustrates the assignment of climatic traits to the climate folder from the Design Builder's library, which depicts the climatic circumstances of the location where the construction project is situated. In general, according to the Köppen climate classification system, Mashhad falls under a Mediterranean climate (Csa). The characteristics of a Mediterranean climate generally include mild, wet winters and hot, dry summers.
2.5. Building Geometry
This step began by constructing the building model, including its shape, dimensions, layouts, spaces, floors, walls, windows, roofs, and other building components (Figure 5). Also, the dimensions, orientations, and connections between different building elements were defined. (Appendix A)
2.5.1. Building Properties
2.5.2. HVAC System Design
HVAC System Design includes designing and configuring the HVAC system using the software's HVAC System Wizard or manual setup options, and then connecting the selected system to the different zones within the building model that have similar heating and cooling requirements. In this study, a 4-pipe fan coil with an air-cooled chiller that consumes natural gas was taken into account, and the coefficient of performance (COP), a measure used to evaluate the efficiency of the thermodynamic system, is calculated from Equation 1.
where:
Coefficient of performance (COP) = Q/314W
Q is the useful heat supplied or removed by the considered system (machine, BTU).
W>0 is the network put into the considered system in one cycle(W, BTU)
2.5.3. Energy Simulation Setup
In this step, the energy simulation parameters, including occupancy schedules, lighting schedules, HVAC operation schedules, equipment schedules, and other input data required for the analysis, were set up. These schedules define when and how these components operate or change their states over time.
Activity or occupancy schedules refer to the process of assigning specific activities or operations to spaces within the building model. It involves associating the intended use or function of a space with the corresponding activity or occupancy profile. Assigning activities helps in simulating the energy performance, thermal comfort conditions, assessing and optimizing the building design, HVAC system, and other aspects of the building based on the expected activities taking place in different areas. For this purpose, a custom activity or a predefined activity profile from DesignBuilder's library of typical activities and occupancy patterns can be selected. The assigned activity schedule for this research is shown in Table 11. Unconditioned locations, including warehouses, elevators, stairwells, parking lots, etc., are not indicated in Table 11.
The information in Table 11 has been meticulously gathered through a comprehensive process, starting with a thorough survey during the case study phase. To ensure accuracy and reliability, the data underwent rigorous validation and double-checking, involving consultations with principals to cross-verify key details. Subsequently, the data was carefully categorized to align with the specific requirements of the simulation process. This categorization ensures that the information is not only comprehensive but also tailored to seamlessly integrate into the modeling framework of DesignBuilder software. The adjustments made during this process were essential for harmonizing the data with the intricate specifications of the simulation. By adhering to the precise demands of the modeling in DesignBuilder, the data in Table 11 is not just raw information—it's a refined and optimized set of inputs ready to contribute effectively to the simulation's accuracy and reliability. The applied data are related to real case study that is used in the present research item. Therefore, the values are actual data and are calibrated in the simulation process.
In the current investigation, simulations were conducted to assess the application of PCM, with a primary emphasis placed on their integration into the walls of a multi-floor structure, rather than an extensive examination of their impact on roofs. This deliberate focus on the building's vertical elements, particularly the walls, stems from the distinctive nature of the multi-floor structure under consideration. The architectural configuration, characterized by sequential floors, played a pivotal role in the research design, as it introduced a dynamic where the uppermost floor is most directly exposed to the external environment, influencing the overall heating and cooling dynamics.
Given the hierarchical distribution of the floors, the research strategy aimed to prioritize the floors sequentially from the top, acknowledging the paramount role of the highest floor in direct contact with the outside environment. This strategic decision was grounded in the understanding that, in a multi-floor structure, the thermal dynamics of the uppermost floor significantly impact the building's overall heating and cooling control. Consequently, the walls of the structure took precedence over the roof in the analysis, as their thermal properties and interaction with external conditions were deemed of greater importance for effective energy management. While the potential influence of roofs on overall energy efficiency is acknowledged, the research scope was deliberately narrowed to address the specific challenges posed by the multi-floor structure's design. The intent was to provide a targeted exploration of PCM application in a contextually relevant manner, taking into account the nuanced thermal dynamics introduced by the sequential arrangement of floors. This approach aimed to contribute valuable insights into optimizing energy efficiency in multi-floor structures, with a particular focus on the pivotal role played by the walls in such architectural configurations.
In the simulation, the finite difference algorithm discretizes the governing heat transfer equations over the PCM-enhanced building envelope. This algorithm is a numerical method employed for solving partial differential equations, including those governing heat transfer phenomena.
It divides the domain into discrete nodes, allowing us to approximate the spatial and temporal derivatives of temperature. The algorithm then iteratively solves these equations to simulate the transient heat transfer and phase change processes within the building components. In the context of our study, it is utilized within the EnergyPlus software for simulating the dynamic behavior of phase change materials (PCM) in building envelopes.
The timestep, Δt, is a crucial parameter in transient simulations, representing the size of each time increment. For PCM simulations in EnergyPlus, the minimum timestep required is a critical consideration to capture the dynamic response accurately. In our study, we carefully selected an appropriate timestep to ensure the fidelity of the simulation results. This choice is guided by the need to capture rapid temperature changes and phase transitions within the PCM.
By setting an optimal timestep, we strike a balance between computational efficiency and accuracy. A timestep that is too large may result in the oversimplification of dynamic processes, while a timestep that is too small can lead to excessive computational demands.
3. Results and Discussion
3.1. Simulation outcomes
After configuring all of the parameters and settings, the energy simulation process should be initiated and completed with the defined inputs and setups. The software will execute the calculations and generate the results, which will include energy consumption, energy use intensity (EUI), operational costs, as explained in the following sections, and other performance metrics.
The software offers comprehensive reporting and visualization capabilities, allowing users to generate detailed reports, graphs, and visualizations of energy consumption. Since calculating energy consumption over the course of a year is required for this project, the period selected in the energy consumption simulation parameters is a full year to date. However, in order to illustrate the output, the display settings are set to monthly consumption. Furthermore, to simulate the influence of phase change materials, "General Solution" is set to "Finite Difference" mode, with all other options set to default. Figure 14 shows the energy consumption results obtained through this simulation for three different cases with and without thermal insulation.
The use of phase change materials, as shown in Figure 14, results in a decrease in the amount of electricity used to run cooling equipment, with the summer month of July marking the pinnacle of this reduction. Additionally, the use of phase-change materials in the colder months of the year will reduce gas energy consumption related to heating equipment. The peaks of this reduction in consumption will be in January, February, and December (Figure 15 and Figure 16).
Although the use of thermal nanopaint coatings on external walls reduced energy consumption, this amount was lower compared to the use of phase-change materials. Additionally, there was little variation in the amount of electrical energy used (Figure 17 and Figure 18).
In order to compare the energy efficiency of various buildings or to track the energy performance of a single building over time, the Energy Use Intensity (EUI), which expresses a building's energy use as a function of its size, is calculated by dividing the total energy consumed by the building in one year by the total gross floor area or the total conditioned floor area of the building. The conditioned floor area is used to figure out the EUI, which is then used to compare the building's gas energy efficiency in three situations: without thermal insulation, with PCMs, and with nanoparticles (Table 13).
Table 13 reveals that when using phase change materials and nano-paints, the energy use intensity has lowered by 5.6% and 1.8%, respectively, indicating an improvement in building efficiency when employing these materials in the building envelope.
The energy simulation results for megacities like Mashhad underscore the tangible benefits of incorporating advanced technologies to enhance building energy efficiency. Through detailed reporting and visualization features, a comprehensive understanding of energy consumption patterns emerges. The monthly breakdown of energy use provided by the simulation facilitates nuanced analyses crucial for addressing dynamic energy demands in megacities. One noteworthy aspect is the simulation's use of Finite Difference mode to model PCMs, highlighting the software's versatility in capturing the impact of innovative materials on energy consumption. The visual representation in Figure 14 vividly depicts a substantial reduction in electricity consumption during peak cooling periods, coupled with a corresponding decline in gas usage during colder months when PCMs are utilized.The examination of nanopaint coatings in Figure 17 and Figure 18 introduces an alternative approach to energy efficiency. While nanopaints contribute to a reduction in energy consumption, the comparison with PCMs reveals a less pronounced impact. This underscores the importance of selecting materials tailored to specific climate conditions and building requirements, with a consideration of trade-offs between effectiveness and cost.
The quantitative comparison of building efficiency in Table 13, through EUI calculations, reinforces the positive influence of alternative materials. A 5.6% reduction in EUI with PCMs and a 1.8% reduction with nanopaints indicate their promising role in enhancing building performance. This data emphasizes the significance of exploring alternative materials in the construction industry to achieve sustainable and energy-efficient structures, especially in megacities with high energy demands.
Zhan et al., 2023 explore the energy-efficient alternatives of using PCMs in building envelope applications. The hierarchical discussion covers simulation tools, classification, integration technologies, and the benefits and drawbacks of widespread adoption. The review highlights a gap in understanding occupant intervention, especially in ventilation, urging future research to consider hydrothermal and optical performance, sustainable materials, visual comfort, and moveable PCM-based interventions [73]. While Liu et al., 2023 investigate the impact of a novel composite concrete containing PCM on building envelopes in different climates. The results indicate the effectiveness of PCM concrete in regulating indoor temperature, emphasizing the need for selecting appropriate PCMs based on the specific climatic conditions of each location [74]. Erdogmus et al., 2023 introduces an innovative solution for the management and disposal of water treatment sludge (WTS) by integrating it with PCM in foam concrete. The study demonstrates the potential of WTS/PCM foam concrete composites in reducing heating/cooling loads, providing energy savings, and lowering carbon emissions [75]. Finally, Zhussupbekov et al., 2023 delves into machine learning techniques for forecasting energy demand in PCM-integrated residential buildings in the Mediterranean climate region. The study not only proposes a model for predicting energy consumption but also establishes the most influential design parameters, with SVM and ANN methods emerging as more reliable for such predictions [76]. Therefore, these studies collectively showcase the diverse approaches and innovations in leveraging advanced technologies, alternative materials, and predictive models to enhance energy efficiency in buildings. As megacities continue to grow, the integration of these technologies becomes imperative for addressing energy-related challenges and promoting environmentally conscious urban development.
3.2. Economical assessments
Although DesignBuilder concentrates on simulating and analyzing building performance rather than performing in-depth cost calculations, it nonetheless has a cost module to evaluate the economic impact of building designs. With the help of this module, users can incorporate life-cycle analysis into the primary energy analysis model and compute construction costs, utility costs, and other expenditures.
In this research, the cost of the phase-change materials estimated by DesignBuilder is $ 467, 918 when the weight of all the materials used in the building is taken into account, with the cost of RT18HC phase- change material being considered to be $2 per kilogram. For Nano paints, the same procedure is done as illustrated in Table 14. After that, the amount of initial investment necessary for the use of the phase-change materials and nano-paint is calculated, and the economic justification for utilizing these materials in the building should be assessed. For this purpose, after identifying the quantity of gas and electrical energy saved, according to the tariff of energy carriers, the amount of utility cost savings through energy savings per year should be determined (Table 14).
The time it will take for the original cost to be recouped through yearly revenue or savings is determined in the following phase, the payback period. This revenue should be computed first from the investor's perspective using Table 15's domestic energy carrier pricing and then from a national perspective using Table 17's energy carrier export rate. Of course, the aforesaid rates are also increased by the yearly inflation rate (Equation 2).
Where:
n: Time unit (year)
1.05: Annual energy price inflation rate increase of 5%
To determine the yearly revenue from a national perspective, the total amount of energy consumption reduction in each scenario is computed. The annual income is then determined using the rate of $0.06 per kilowatt of export energy carriers (Table 16).
The application of PCM as a thermal insulation material and its impact as a passive system in building envelopes on energy savings have been studied through simulated models. From the obtained findings on energy consumption and the costs of using insulating coatings in this study, it has been indicated that phase change materials are 3.8% more energy efficient than nanopaints; however, they initially cost approximately four times as much as nanopaints and take an additional four years to return the initial investment. Additionally, given that the materials employed in this study cost more than energy carriers, especially the domestic rate in Iran, it takes a considerable amount of time to break even on the initial cost and return on investment, which makes the use of these materials unjustifiable from an economic point of view. In other words, the low cost of energy in Iran serves as a justification for not using phase-change materials and nanopaints in this study.
In the pursuit of enhancing building energy efficiency, the integration of PCMs and nanopaints has been examined through rigorous analyses, with a particular emphasis on economic considerations. DesignBuilder, a tool renowned for simulating building performance, offers a dedicated cost module to assess the economic implications of adopting innovative building materials. The research at hand provides a meticulous examination of the economic facets associated with PCM utilization. Specifically, the construction costs for RT18HC PCM and nanopaints are meticulously estimated at $467,918 and $123,384, respectively. This economic exploration extends to the calculation of the initial investment required for incorporating these materials and subsequent assessments of utility cost savings per year, factoring in identified gas and electricity savings. The determination of the payback period, representing the duration for the recovery of the initial investment through annual savings, is a critical phase. From the investor's perspective, the payback period for RT18HC PCM is projected to be 94.1 years, while nanopaints exhibit a shorter payback period of 84 years. These projections consider factors such as energy carrier pricing, inflation rates, and exchange rates. Comparisons with other research studies add depth to the discussion. Agarwal and Prabhakar (2023) focus on the integration of PCMs in clay bricks to optimize thermal comfort and reduce energy consumption. Economic analysis unveils varying cost savings and payback periods contingent on PCM positions and thicknesses, with economic infeasibility identified in Jaipur's climatic conditions [77]. Hou et al. (2023) contribute by exploring the impact of PCM thermal parameters on energy demand and economic benefits. The research emphasizes the comprehensive analysis of all thermal parameters and their interactions, providing valuable insights into the sensitivity of parameters and their effect on economic benefits [78]. Gao et al. (2023) introduce the aspect of thermal energy storage (TES) using PCMs in solar heating systems. The economic evaluation involves the design of a TES unit with different horizontal metal foam filling ratios. Novel findings highlight the contribution of gradient microstructure to the phase transition process, with economic assessments indicating optimal filling ratios and payback periods [79]. Safarzadeh et al. (2023) address the shortcomings of common PCMs, focusing on improving energy and exergy performance through an air–PCM heat exchanger. The economic analysis, conducted under cold climate conditions, underscores the significance of nano-PCM concentrations in reducing charging and discharging periods, ultimately influencing the return on investment [80]. Collectively, these studies offer a nuanced exploration of the economic viability of PCM and nanopaint applications in building designs, considering factors such as construction costs, energy savings, payback periods, and regional climatic conditions. The findings contribute valuable insights for decision-makers in the realm of sustainable building technologies.
3.3. Sustainability Assessment
The following MATLAB algorithm simulates and compares the reversed sustainability indices of three building insulation scenarios: Without Thermal Insulation, With PCMs, and With Nanopoints. The primary goal is to assess the impact of temperature sensitivity on the sustainability indices for each scenario. The model defines constants, including the total conditioned floor area and temperature data, and hypothetical energy use intensities (EUI) for each insulation scenario. The temperature sensitivity coefficients are specified for Without Thermal Insulation, PCMs, and Nanopoints. The reversed sustainability indices are calculated using a function that incorporates temperature effects. The results are visualized through heat maps, allowing a comparative analysis of sustainability indices for the three scenarios (Wang et al., 2021).
The developed program aims to investigate how different insulation scenarios affect the reversed sustainability indices of a building, considering temperature sensitivity. The sustainability indices are calculated based on hypothetical energy use intensities, and the temperature data is used to simulate temperature effects on the building's energy performance. The goal is to provide insights into which insulation scenario demonstrates higher sustainability under varying temperature conditions. The reversed sustainability index for each scenario is calculated using the Equation 3 (Wang et al., 2018).
where , based EUI is the hypothetical energy use intensity for the scenario, temperatureAdjustment is the product of the temperature sensitivity coefficient (β) and the difference between the temperature data and a reference temperature (Tbase). The analysis output involves three heat maps representing the reversed sustainability indices Without Thermal Insulation, With PCMs, and With Nano paints scenarios (Figure 19). In this hypothetical scenario, the PCM scenario sustainability index is reported to be higher than the other two scenarios due to its lower energy use intensity under various temperature conditions. The heat maps provide a visual representation of the sustainability indices, aiding in the comparison of insulation scenarios and their sensitivity to temperature variations.
Sustainability index=1/(baseEUI+temperatureAdjustment) ( 3)
3.4. Exergy analysis
The presented algorithm aims to analyze and compare the exergy performance of three distinct building thermal management scenarios: Without Thermal Insulation, With PCMs, and With Nanopoints. Exergy, a measure of the available work in a system, is calculated based on monthly mean temperatures and entropy values, considering the gas energy consumption, total conditioned floor area, and energy use intensity for each scenario. The goal is to evaluate the impact of different thermal management strategies on the exergy efficiency of a building. The goal of the program is to assess the exergy performance of three building thermal management scenarios over a 12-month period. By incorporating monthly mean temperatures and entropy calculations, the algorithm calculates the exergy for each scenario and visually presents the variations over the months. The exergy values serve as a metric to compare the efficiency of the scenarios in utilizing energy for building conditioning purposes (Zmeureanu, 2013).
The exergy (E) for each scenario is calculated using the formula E = Energy Consumption - T0 * Entropy (Equation 3), where Energy Consumption is the gas energy consumption for each scenario, T0 is the reference temperature in Kelvin, and Entropy is a placeholder for the actual entropy values based on the monthly mean temperatures. The calculations are performed over 12 months, considering the variation in temperatures and entropy for each month (Hepbasli, 2012).
The output of the analysis reveals the exergy values for each scenario over the 12-month period (Figure 20). In this specific case, the PCM scenario exhibits lower exergy limitations compared to the scenarios without thermal insulation and with nanopoints. This outcome suggests that the PCM scenario is the most efficient in terms of exergy, attributed to its low energy use intensity under different random temperature indexes. Therefore, from an exergy perspective, the PCM scenario emerges as the superior choice among the three thermal management strategies. The visual representation of exergy variations over the months provides a comprehensive understanding of the scenarios' performance.
3.5. Research discussion
Phase change materials (PCMs) have gained prominence as passive components within building envelopes, contributing to enhanced thermal performance. In a study conducted by Saffari et al. (2017), the investigation focused on identifying the optimal PCM peak melting temperature to improve the energy efficiency of residential structures across cooling, heating, and annual heating and cooling energy consumption. Employing an optimization methodology grounded in simulation and the amalgamation of EnergyPlus and GenOpt, the study centered on Tehran, a city sharing a Köppen climate classification akin to our research, alongside other climatic parameters derived from the Köppen-Geiger classification.
Saffari et al. (2017) reported that utilizing a PCM with a 20 °C melting point for both heating and cooling purposes in Tehran resulted in energy savings of approximately 2%, equating to a reduction in the total yearly energy demand for heating and cooling by about 922 kWh. This investigation reinforces the notion that selecting PCM materials based on their melting temperature can significantly enhance energy efficiency, thereby advancing our comprehension of the potential benefits of PCM integration within buildings located in analogous climatic conditions.
Similarly, Hasan et al. (2018) conducted an empirical exploration demonstrating that when PCMs are employed as thermal insulation materials within building walls and ceilings, they effectively contribute to improved thermal performance, enhanced thermal comfort, and reduced cooling loads during the summer. The study involved the placement of a paraffin wax layer with a melting point of 44 °C within an experimental chamber as a thermal insulation medium. Hasan et al. (2018) observed that adopting a 1 cm thickness of PCM for all walls proved to be the most efficient approach, resulting in a daily electricity cost savings of 1.35 dollars per cubic meter of the building. This research underscores the significance of PCM thickness and orientation when applied as insulation materials, highlighting substantial cost savings, particularly for larger structures.
Building upon previous research, Vukadinovi et al. (2020) investigated PCM type and placement within walls to evaluate annual heating and cooling energy consumption at five locations in Serbia. The study considered three potential PCM placements: beneath the outer wall layer, within the middle of the wall, and beneath the inner wall portion. The most efficient site demonstrated a reduction in energy consumption of 2.37 percent, with results indicating that the mid-wall PCM placement proved most effective across all locations.
In alignment with earlier studies, Sovetova et al. (2019) employed numerical analysis to focus on climatic factors, particularly in hot desert climates, and integrated PCMs into building envelopes (walls and roofs) with localized design characteristics. Evaluating thirteen distinct PCMs, this investigation assessed thermal performance and energy efficiency in residential structures integrated with PCMs, using EnergyPlus, across eight different cities within the hot desert climate zone. Results showed that top-performing PCMs were capable of mitigating temperature fluctuations and reducing temperatures by up to 2.04 °C. The extent of energy consumption reduction ranged from 17.97 to 34.26 percent, depending on the structure's location, surface area, and thickness and type of PCM layer.
In a separate numerical study conducted within the same geographic area as the present research, the heat transfer characteristics of conventional building walls composed of plaster (2 cm), clay brick (15 cm), and cement (3 cm) were compared with thirteen different PCMs, along with two distinct PCM positions within the wall (proximal to the interior and exterior). Outcomes indicated that PCM's phase-change enthalpy and melting temperature were pivotal factors influencing wall performance. PCMs exhibit lower thermal conductivity, greater latent heat of phase-change, and phase-change temperatures closer to room temperature, effectively limiting heat transfer to the interior. Notably, Enerciel 22 yielded the most substantial heat transfer reduction, ranging from 15.6 to 47.6 percent, while CaCl2. 6H2O exhibited the least reduction (2-7.8 percent). It's noteworthy that doubling the PCM thickness did not consistently result in a twofold reduction in heat transmission (Li et al., 2019).
In a related inquiry, the applicability of nine PCMs (PCM19 to PCM27) in a subarctic climate was assessed from both economic and environmental perspectives. Utilizing metrics such as maximum temperature reduction (MTR), discomfort hours, and average temperature fluctuation reduction (ATFR), the study revealed that integrating PCMs into residential buildings offered notable benefits in terms of ATFR, especially during warm seasons. Results indicated potential yearly energy savings of up to 10,000 kWh for the subarctic region, with economic and environmental payback periods ranging from 16 to 32 years and an estimated annual CO2 savings of 4817 kg. This study underscores the potential for PCM utilization to enhance the thermal and energy performance of buildings even in subarctic climates (Kenzhekhanov et al., 2020).
Conforming to the evolving trends, Kharbouch et al. (2018) investigated the utilization of PCMs to enhance the thermal behavior of building envelopes for cooling purposes in Morocco, a city characterized by warm to hot summers. This comprehensive study combined numerical and experimental approaches to analyze the various properties of PCMs concerning their peak phase change temperatures. Additionally, the study explored the placement of PCM layers within wall and roof structures, employing two distinct configurations. Outcomes indicated that optimizing the phase change temperature was critical for maximizing the thermal performance of PCM-enhanced wall/roof systems, with wall orientation playing a pivotal role. Notably, the east facade exhibited the most favorable conditions, while the roof demonstrated the least optimal performance.
The findings of the abovementioned studies align with our study in showcasing the potential of PCM application as an insulation material in enhancing thermal performance and reducing energy consumption in building envelopes, with minor changes in some cases. Our findings regarding the financial benefits of phase change materials (PCMs) differ from previous research in this field. While the findings of previous studies highlight the multifaceted advantages of PCMs, including both energy savings and cost reductions, making them a promising solution for improving building efficiency and sustainability, our research yielded contrasting results. In this research, the cost-benefit analysis indicated only marginal cost savings, in contrast to the substantial economic advantages reported in previous research. The disparities in our findings could be attributed to Iran's low-cost energy in comparison to other countries. This is despite the fact that the payback period may be reduced and the usage of phase-changing materials in Iran may become more reasonable due to an increase in the price of the dollar in Iran, the availability of phase-changing materials, and a subsequent decrease in their pricing.
The strengths of this study lie in its comprehensive approach to addressing the energy crisis in the building and construction industry. By focusing on the implementation of PCM for cooling and heating load management, the research provides a nuanced and context-specific solution. The use of design-builder simulations in a developing country case study adds practical relevance to the findings, offering insights that can be applied in real-world scenarios. The 6 percent reduction in energy usage, while seemingly modest, aligns with green building goals and highlights the importance of multifaceted strategies in achieving sustainability objectives. The study's emphasis on the reciprocal performance improvement of PCMs distinguishes it from conventional systems, showcasing the versatility and potential impact of this technology in four-season regions. However, the study also exhibits some weaknesses. The 6 percent reduction, though valuable, may be perceived as relatively low compared to other energy-saving techniques. The research could benefit from a more in-depth exploration of the limitations and challenges associated with the implementation of PCM in diverse building contexts. Additionally, a broader range of case studies or a comparative analysis with alternative strategies could strengthen the study's generalizability and provide a more robust basis for its recommendations. Despite these limitations, the study's alignment with Sustainable Development Goal 7 reinforces its significance in the broader context of promoting affordable and clean energy targets.
Incorporating phase change materials (PCMs) into building structures is a promising avenue for enhancing energy efficiency and thermal comfort (Al-Yasiri and Szabó, 2021). The utilization of PCMs in the construction industry aims to address the challenges posed by energy consumption and increase thermal comfort within buildings (Aridi and Yehya, 2022). The thermal performance of PCMs has been extensively studied, focusing on aspects such as cooling/heating load reduction, energy savings, and overall thermal comfort improvements (Al-Yasiri and Szabó, 2021). A review on the sustainability of phase-change materials emphasizes their crucial role in saving energy and reducing greenhouse gas emissions from buildings, underscoring their importance in environmentally conscious construction practices (da Cunha et al., 2020). The connection between PCMs, energy efficiency, and combating energy poverty is explored, highlighting the potential of PCMs to contribute to cost reduction and achieve energy savings in buildings (Madad et al., 2018).Studies have demonstrated that with appropriate design considerations, PCMs can significantly contribute to cost reduction and energy efficiency in buildings, offering a viable solution for sustainable construction practices (da Cunha et al., 2020). Recent improvements and developments in incorporating PCMs into building materials further emphasize their role in addressing energy consumption concerns, showcasing the ongoing efforts to optimize their integration for maximum impact (Rashid et al., 2023). The evaluation of the experimental analysis of the PCM effects on energy savings will be done in future studies.
4. Conclusion
Energy management in the construction industry is regarded as one of the most strategic tools to build resilience against the emerging crisis of energy resources. Simultaneously, the utilization of phase-change materials can offer a stable pathway toward achieving sustainable development goals. The primary objective of this research was to evaluate the performance of nanoparticles and PCMs in optimizing heating and cooling energy in buildings through simulation approaches. The final investigations have demonstrated that, when considering the investment and operation costs along with comparing the performance efficiency of the examined materials, PCMs prove to be more suitable for achieving the aforementioned purposes. Therefore, the present study suggests that laboratory tests for all types of PCMs with green compounds in the construction industry should be conducted as part of ongoing research. On the other hand, it is concluded that the efficiency of PCMs to reduce energy consumption is highly dependent on the experimental setup of the study, including environmental conditions and climate context of the building, PCM properties, PCM's phase change temperature, placement of the PCM within the envelope, the orientation of the PCM integrated external wall (north, south, west, and east), and PCM's thickness. These are all the parameters that can also be further investigated in future research. Additionally, it would be attractive to examine the indicators of air conditioning and air purification in buildings despite the new coatings.
Author Contributions
Conceptualization, M.M.A. and A.AS.; methodology, R.Y.K.; software, M.G.; validation, R.M., A.AS. and M.G.; formal analysis, R.Y.K.; investigation, K.B.; resources, A.AN.; data curation, M.G.; writing—original draft preparation, M.M.A. and A.AS; writing—review and editing, K.B, R.M, and M.G.; visualization, M.G.; supervision, A.AN.; project administration, M.G and R.M;. All authors have read and agreed to this version of the manuscript.
Funding
The authors would like to thank Technical University of Liberec for their support through the Student Grant Competition SGS-2023–3401 and SGS-2022-3037. The research also was supported by Research Infrastructure NanoEnviCz, via Czech Republic's Ministry of Education, Youth, and Sports under Project No. LM2023066.
Institutional Review Board Statement
Not applicable.
Informed Consent Statement
Informed consent was obtained from all subjects involved in the study.
Data Availability Statement
The data that support the findings of this study are available on request from the corresponding author.
Conflicts of Interest
The authors declare no conflict of interest.
Appendix A
Figure A.1.
Basement(-1) floor plan.
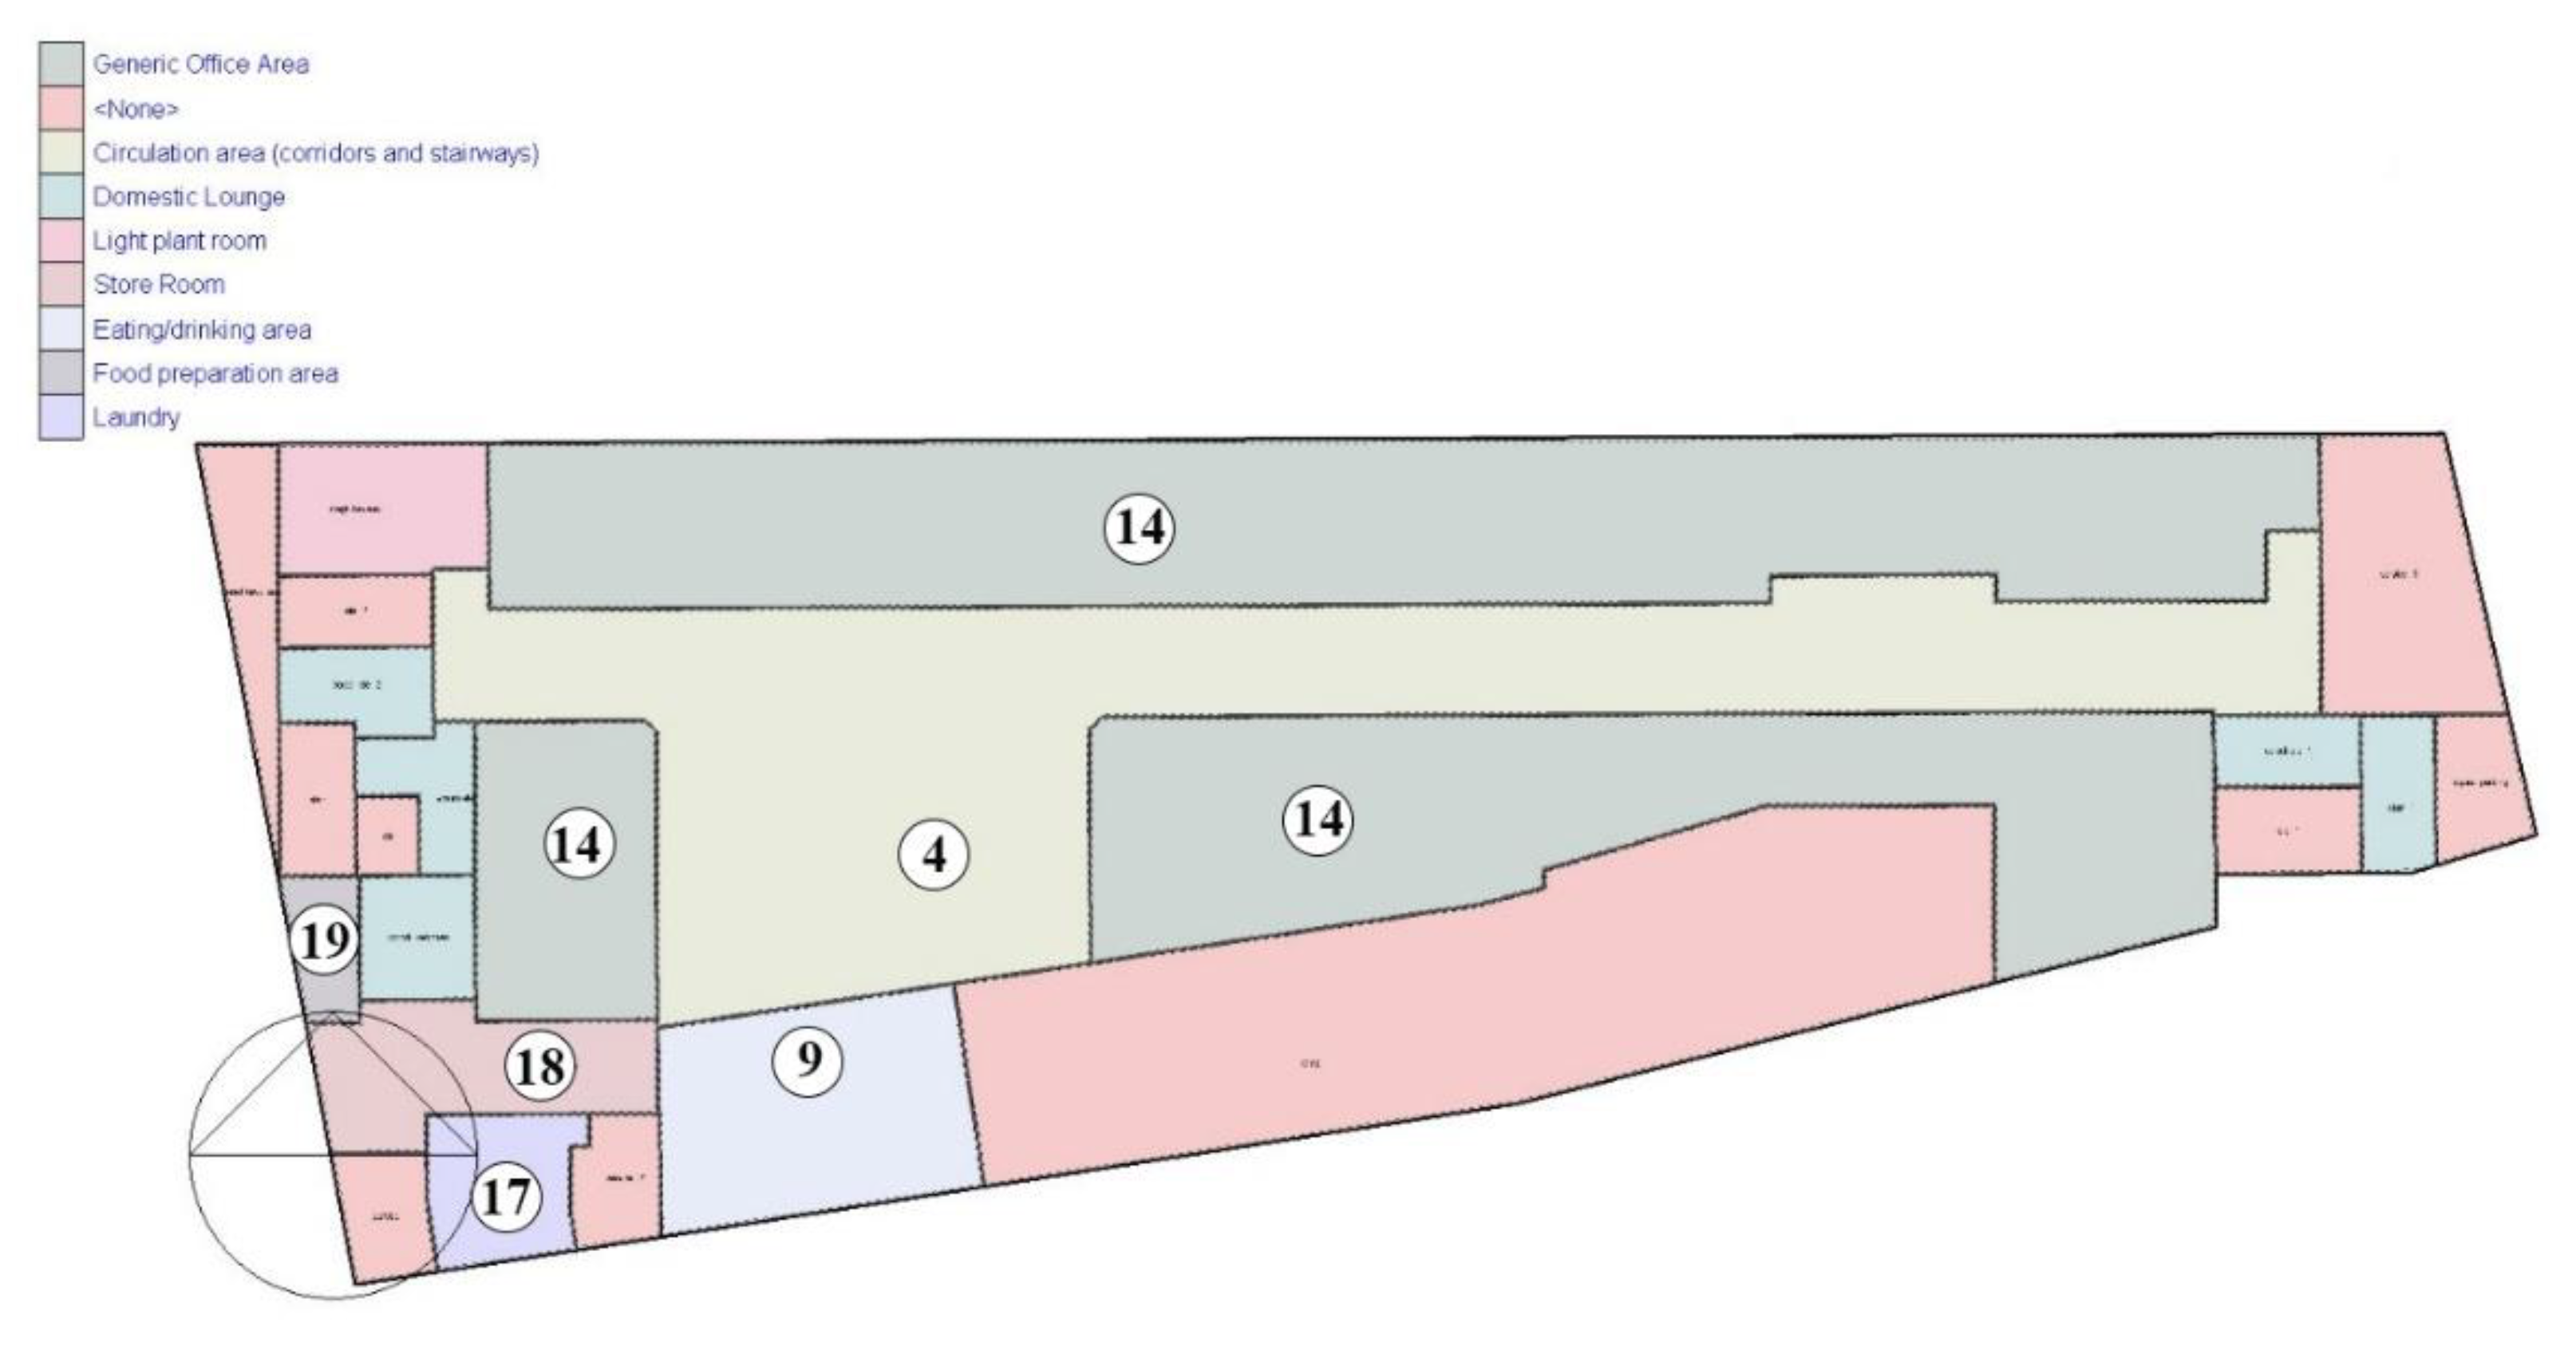
Figure A.2.
Ground floor plan.
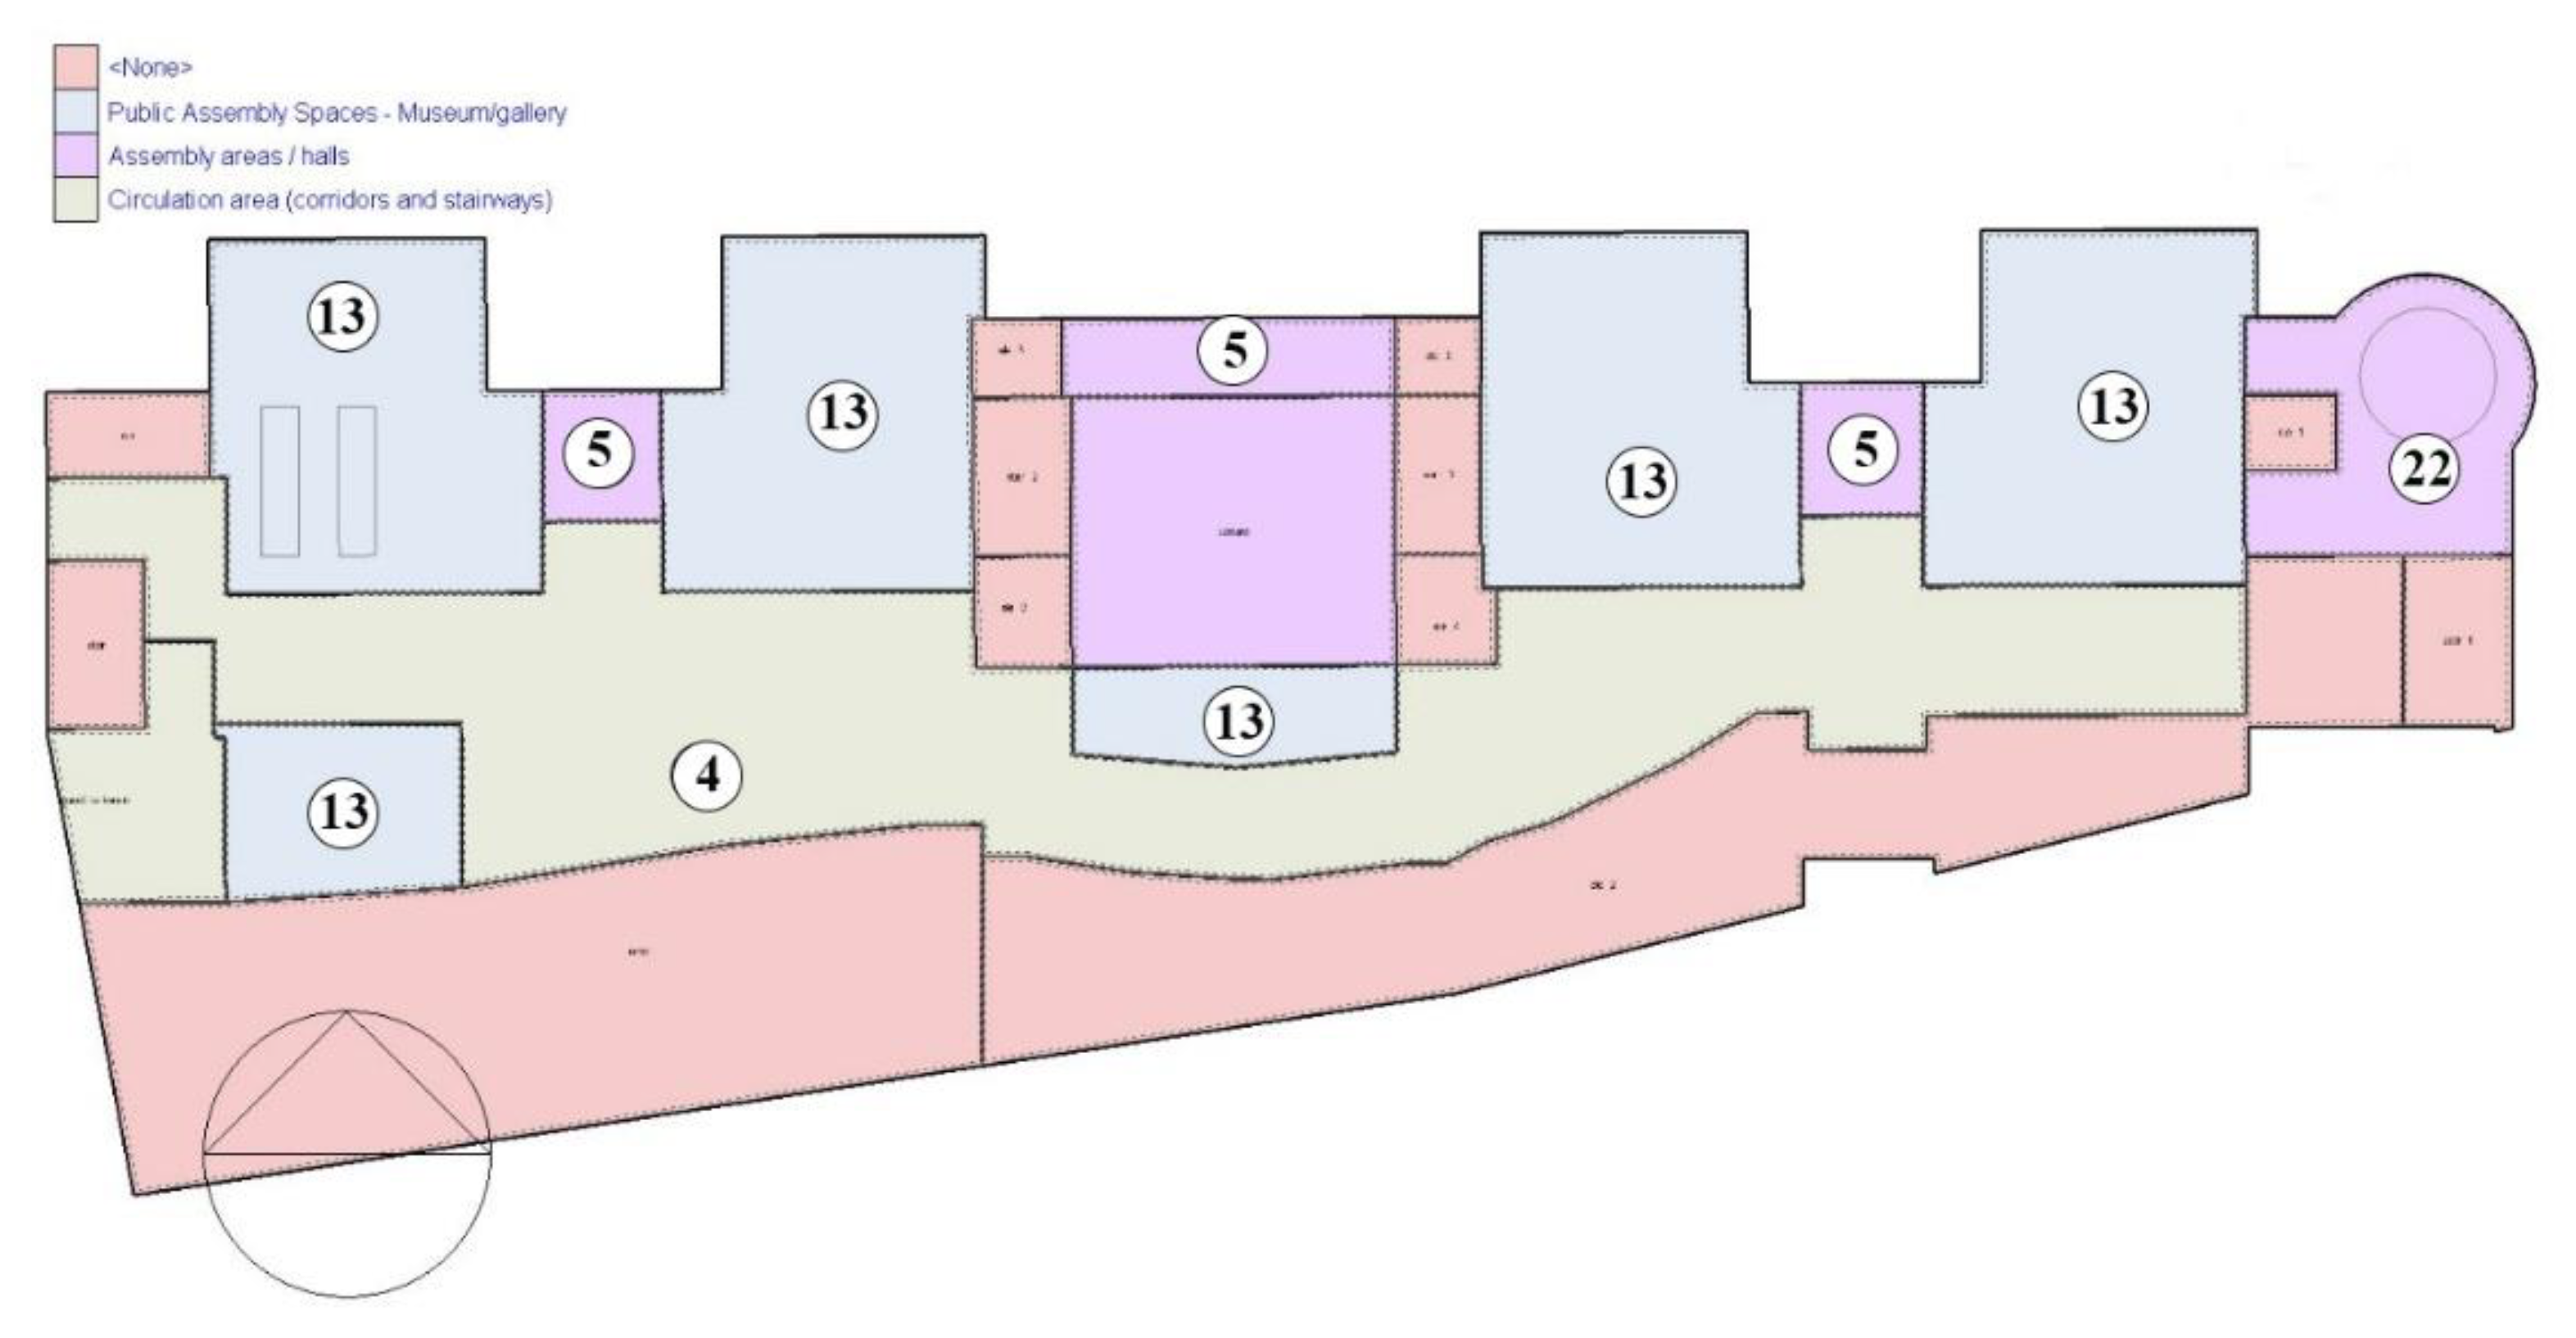
Figure A.3.
1st floor plan.
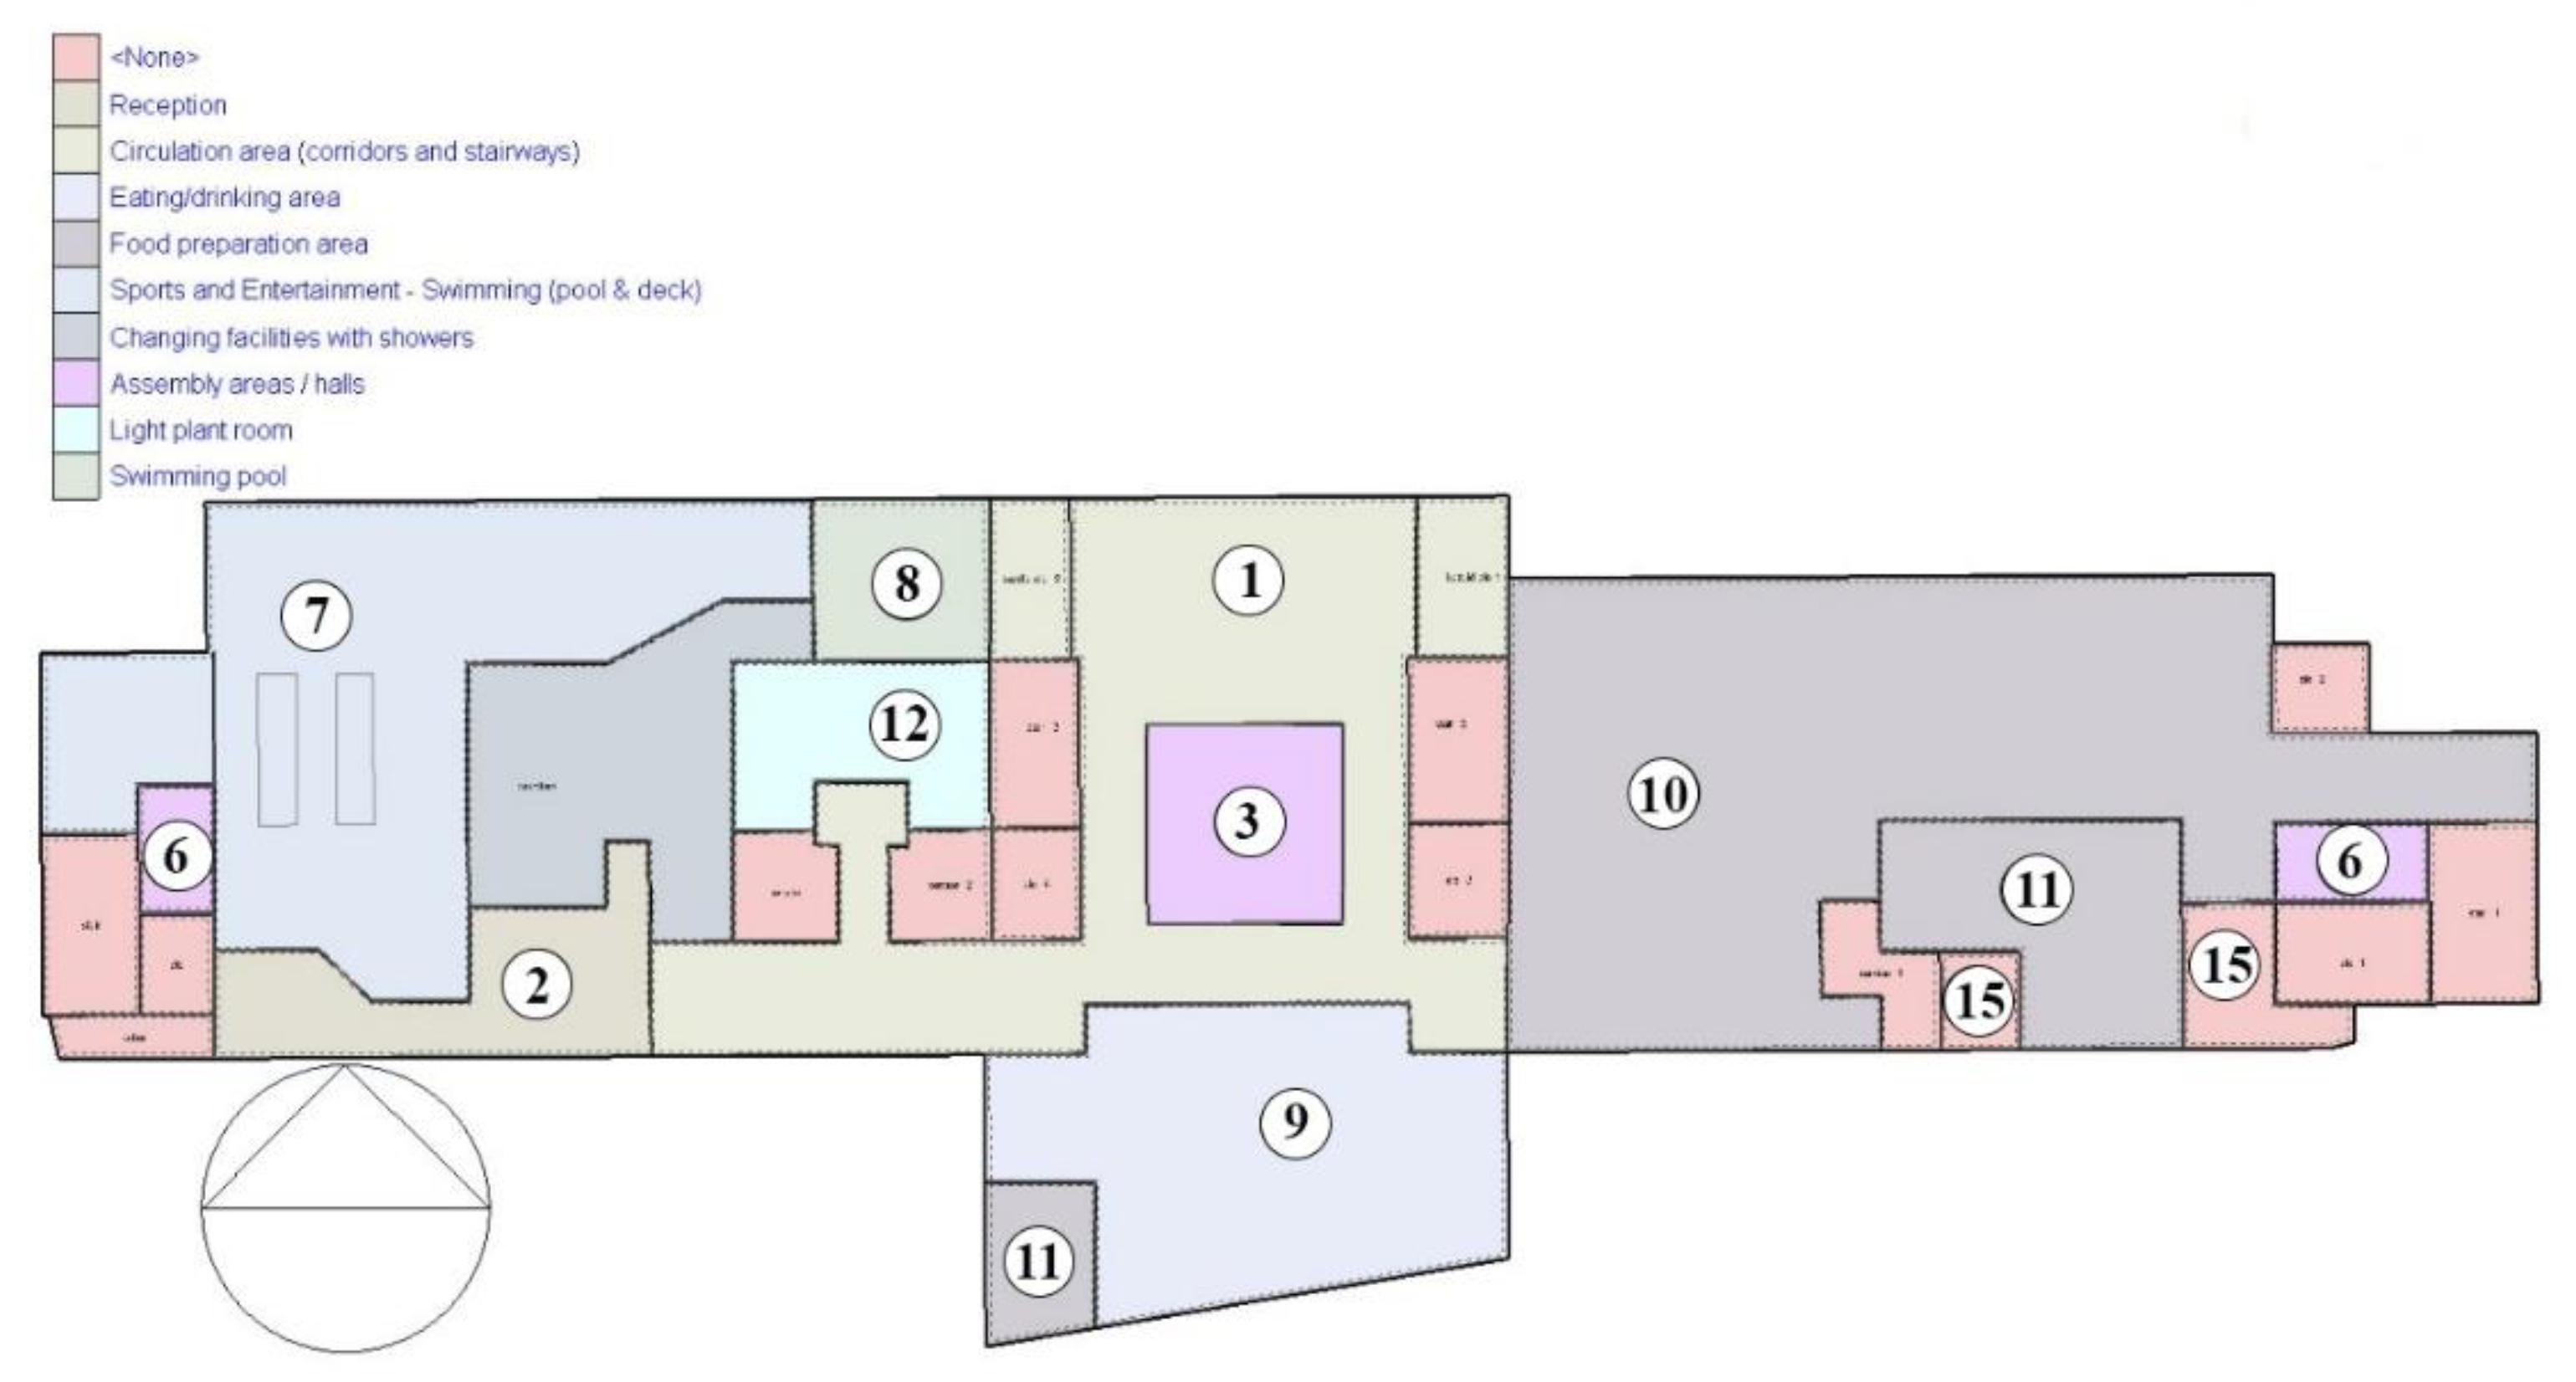
Figure A.4.
2nd - 9th floor plan (east).
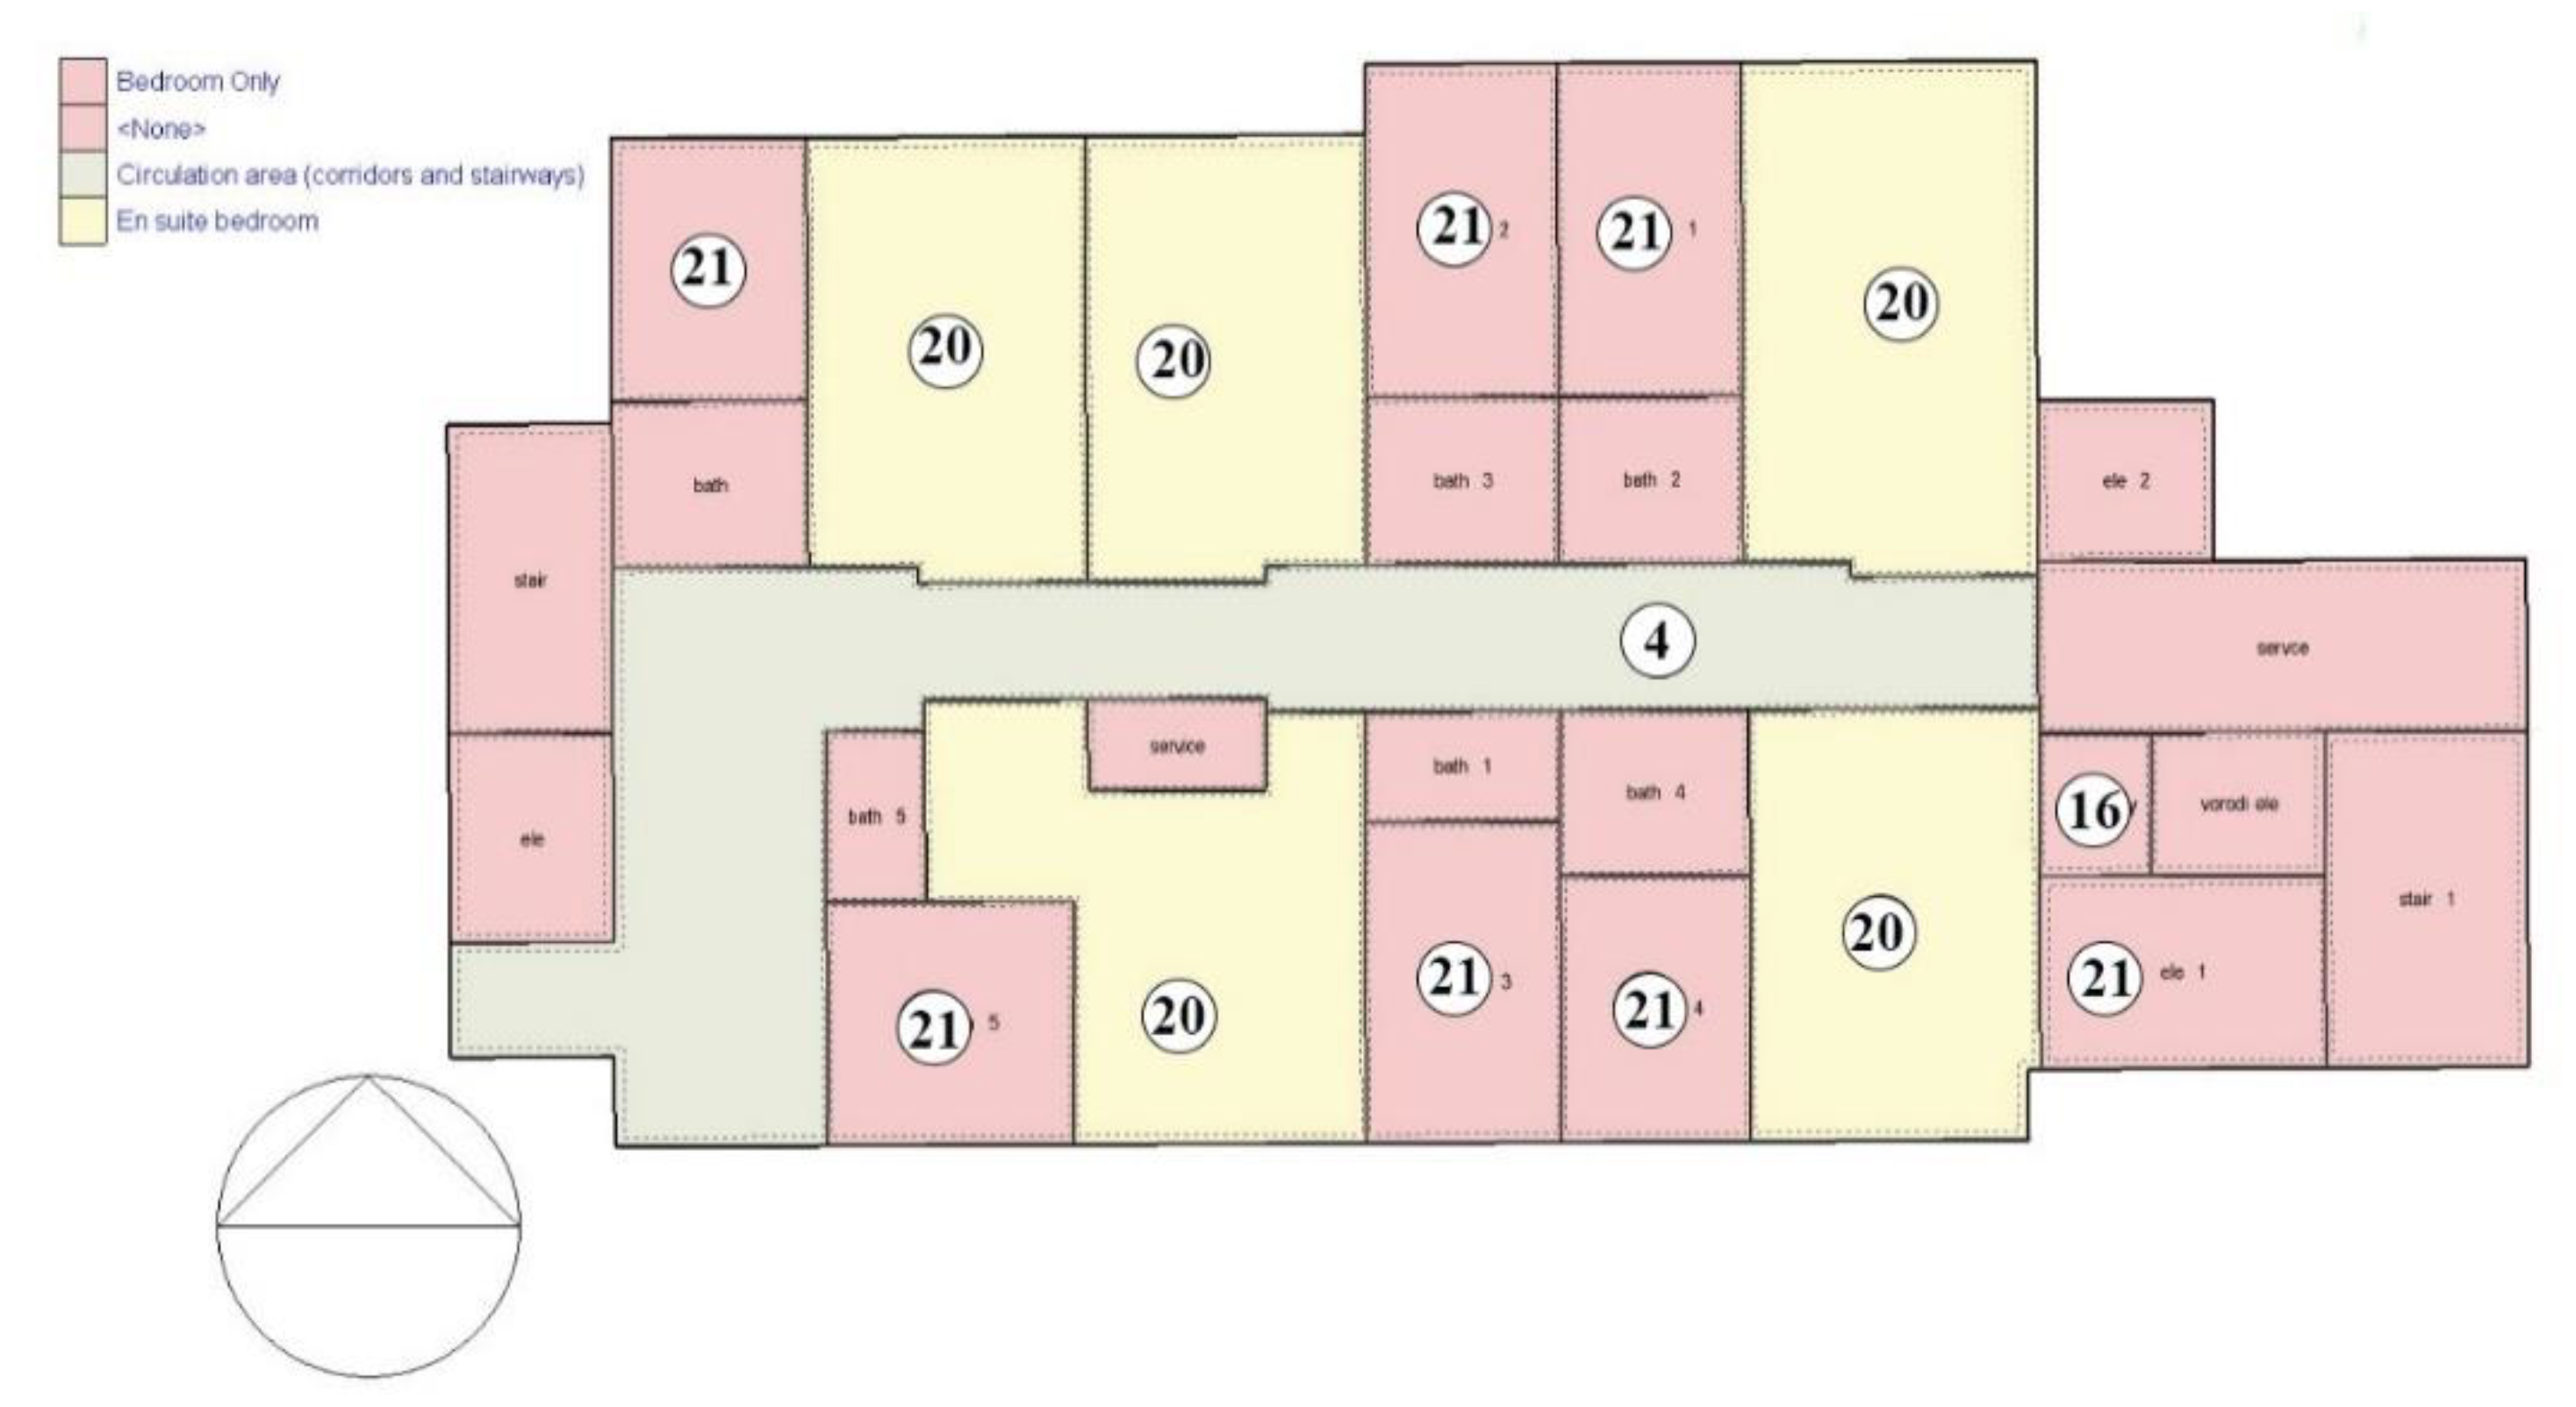
Figure A.5.
2nd - 9th floor plan (west).
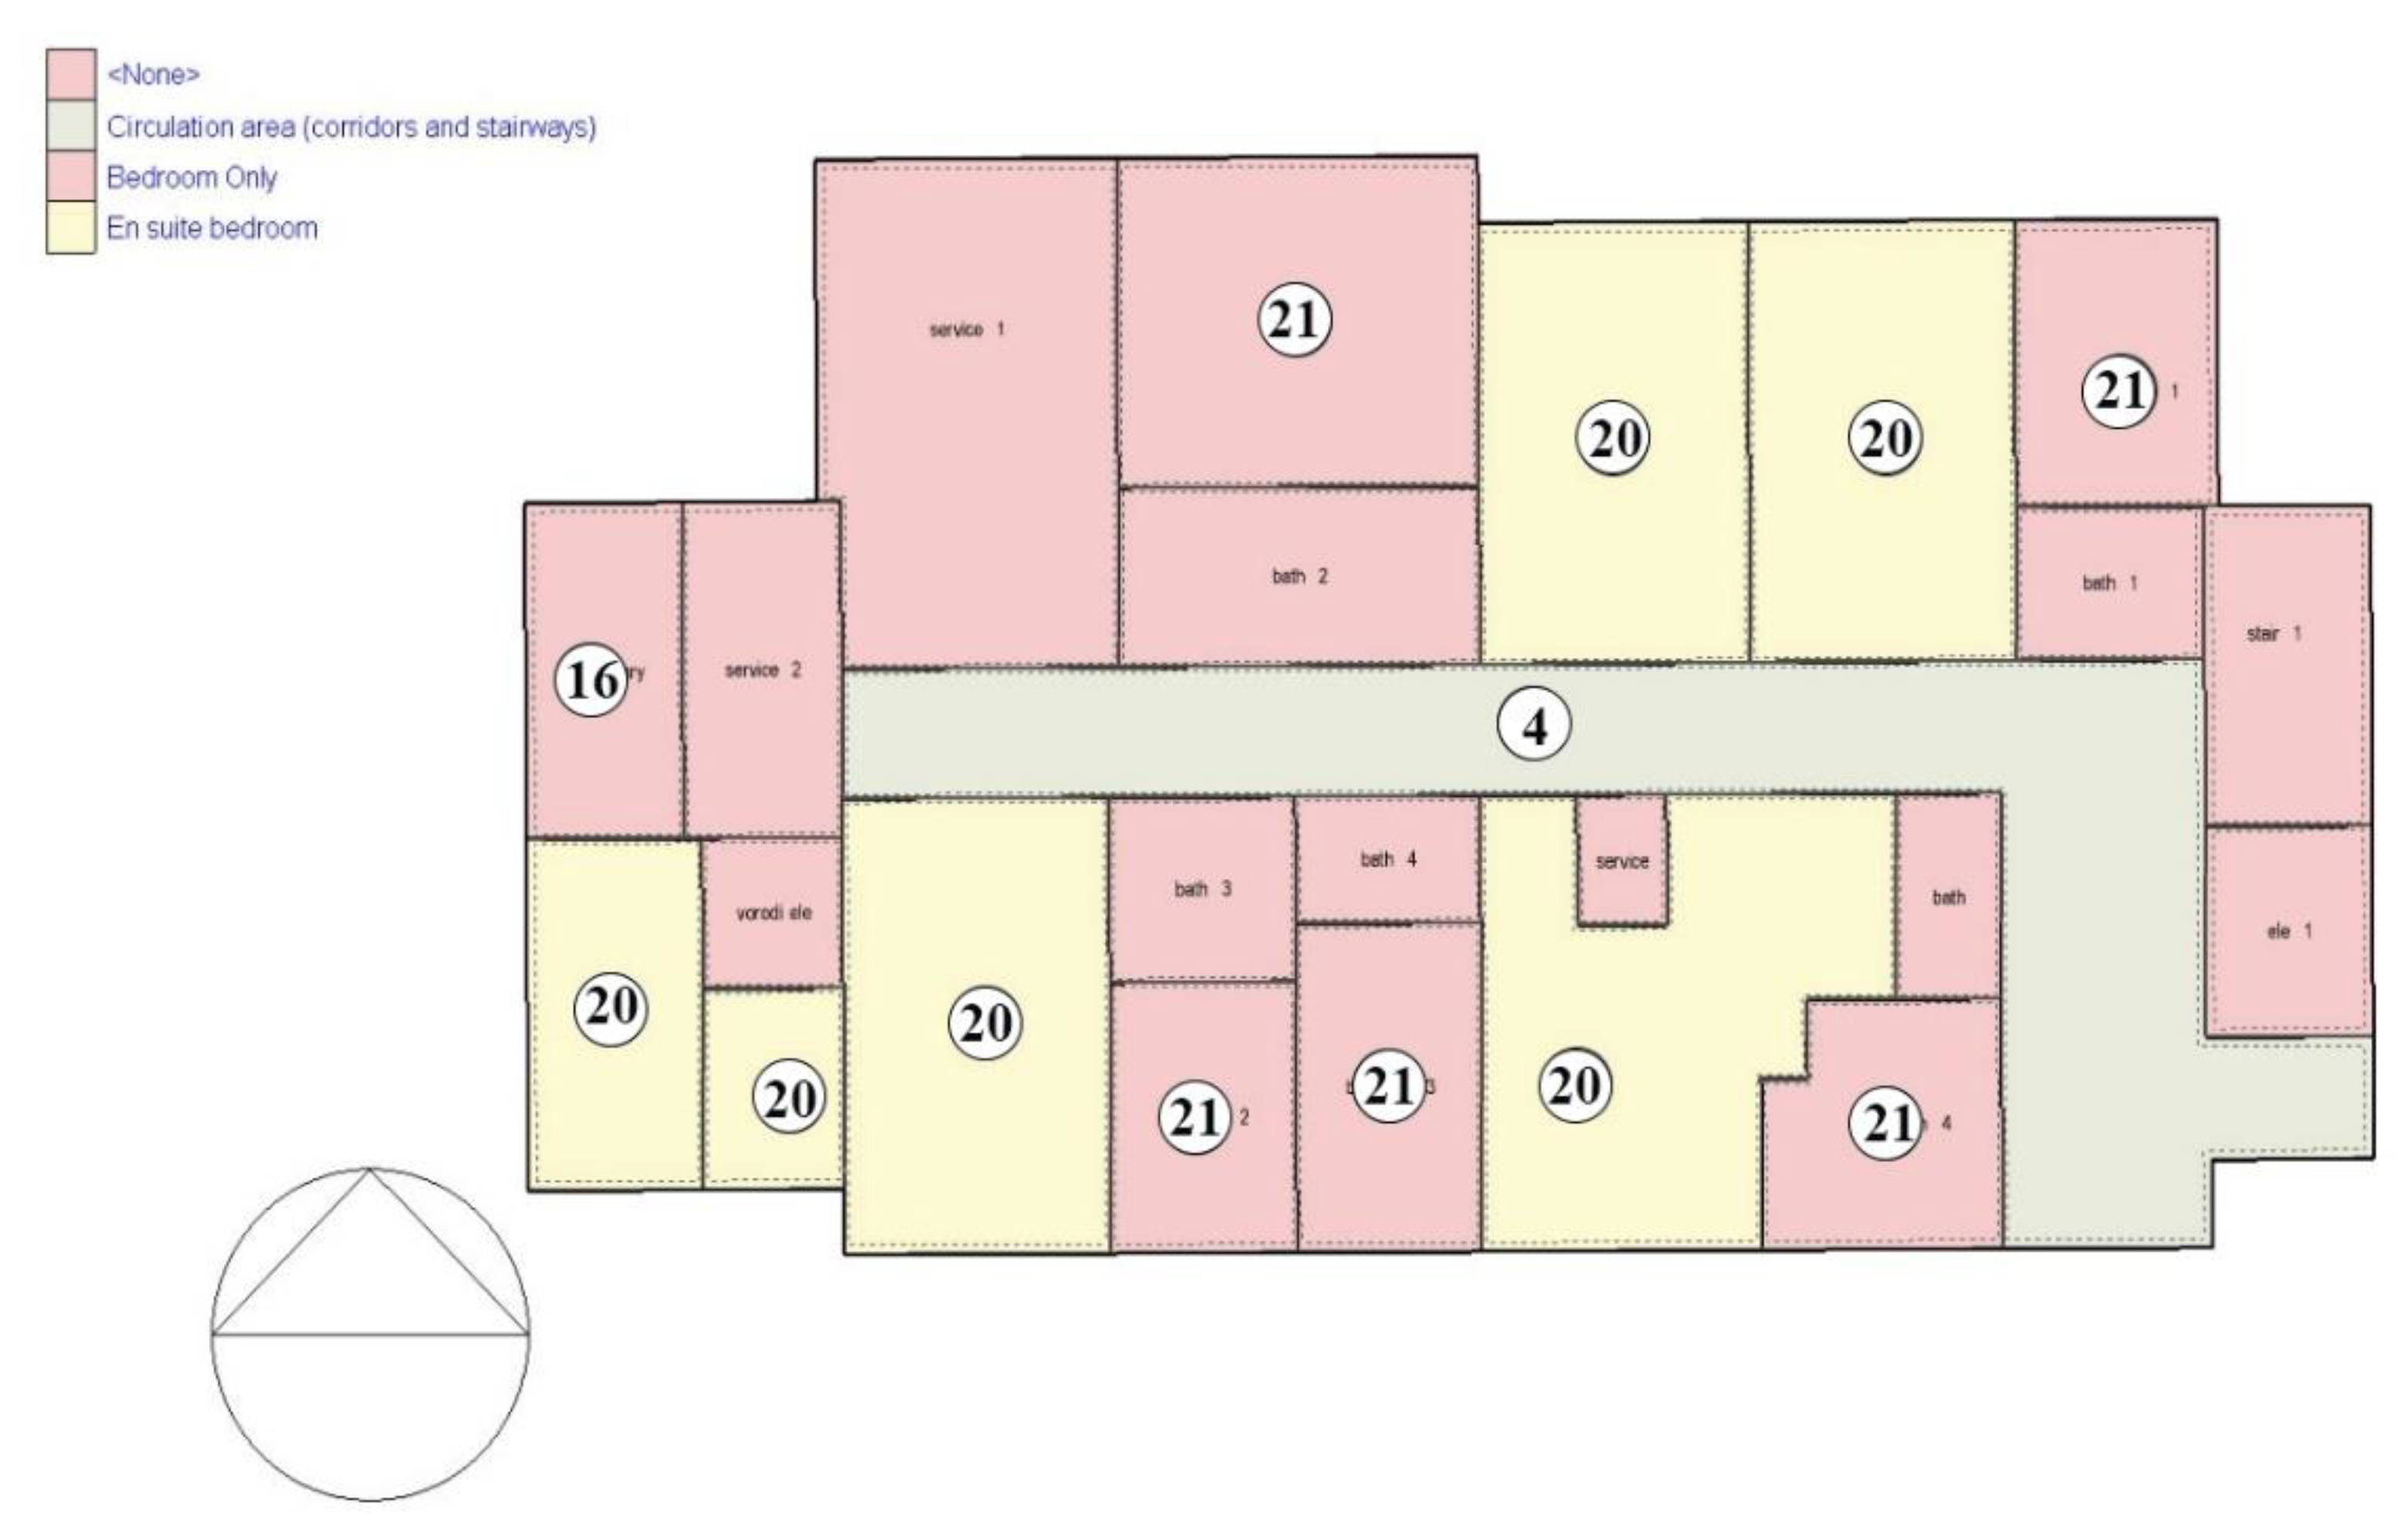
Figure A.6.
10th floor plan.
References
- International Energy Agency. Iran Country Profile. Available online: https://www.iea.org/countries/iran (Accessed 19 May 2023).
- Rubitherm GmbH. Organische PCM (RT). Available online: https://www.rubitherm.com/produktkategorie/organische-pcm-rt (Accessed 1 June 2023).
- NanoPars, Co. [Junior Paint]. Available online: https://nanoparsco.com/product/%D8%B1%D9%86%DA%AF%D8%AC%D9%88%D9%86%DB%8C%D9%88%D8%B1/ (Accessed 12 June 2023).
- Najjar, M.K.; Figueiredo, K.; Hammad, A.W.; Tam, V.W.; Evangelista, A.C.J.; Haddad, A. A framework to estimate heat energy loss in building operation. J. Clean. Prod. 2019, 235, 789–800. [Google Scholar] [CrossRef]
- El Saied, A.; Maalouf, C.; Bejat, T.; Wurtz, E. Slab-on-grade thermal bridges: A thermal behavior and solution review. Energy Build. 2022, 257, 111770. [Google Scholar] [CrossRef]
- Rashidi, S.; Esfahani, J.A.; Karimi, N. Porous materials in building energy technologies—A review of the applications, modelling and experiments. Renew. Sustain. Energy Rev. 2018, 91, 229–247. [Google Scholar] [CrossRef]
- Pasupathy, A.; Velraj, R.; Seeniraj, R. Phase change material-based building architecture for thermal management in residential and commercial establishments. Renew. Sustain. Energy Rev. 2008, 12, 39–64. [Google Scholar] [CrossRef]
- Omer, A.M. Renewable building energy systems and passive human comfort solutions. Renew. Sustain. Energy Rev. 2008, 12, 1562–1587. [Google Scholar] [CrossRef]
- Sharma, A.; Tyagi, V.V.; Chen, C.R.; Buddhi, D. Review on thermal energy storage with phase change materials and applications. Renew. Sustain. Energy Rev. 2009, 13, 318–345. [Google Scholar] [CrossRef]
- de Gracia, A.; Cabeza, L.F. Phase change materials and thermal energy storage for buildings. Energy Build. 2015, 103, 414–419. [Google Scholar] [CrossRef]
- Abhat, A. Low temperature latent heat thermal energy storage: Heat storage materials. Sol. Energy 1983, 30, 313–332. [Google Scholar] [CrossRef]
- Zhou, Z.; Zhang, Z.; Zuo, J.; Huang, K.; Zhang, L. Phase change materials for solar thermal energy storage in residential buildings in cold climate. Renew. Sustain. Energy Rev. 2015, 48, 692–703. [Google Scholar] [CrossRef]
- Parameshwaran, R.; Kalaiselvam, S.; Harikrishnan, S.; Elayaperumal, A. Sustainable thermal energy storage technologies for buildings: A review. Renew. Sustain. Energy Rev. 2012, 16, 2394–2433. [Google Scholar] [CrossRef]
- Saadatian, O.; Sopian, K.; Lim, C.H.; Asim, N.; Sulaiman, M. Y. Trombe walls: A review of opportunities and challenges in research and development. Renew. Sustain. Energy Rev. 2012, 16, 6340–6351. [Google Scholar] [CrossRef]
- Llovera, J.; Potau, X.; Medrano, M.; Cabeza, L.F. Design and performance of energy-efficient solar residential house in Andorra. Appl. Energy 2011, 88, 1343–1353. [Google Scholar] [CrossRef]
- Rempel, A.R.; Rempel, A.W. Rocks, Clays, Water, and Salts: Highly Durable, Infinitely Rechargeable, Eminently Controllable Thermal Batteries for Buildings. Geosciences 2013, 3, 63–101. [Google Scholar] [CrossRef]
- Lee, K.O.; Medina, M.A.; Sun, X. On the use of plug-and-play walls (PPW) for evaluating thermal enhancement technologies for building enclosures: Evaluation of a thin phase change material (PCM) layer. Energy Build. 2015, 86, 86–92. [Google Scholar] [CrossRef]
- Saelens, D.; Parys, W.; Baetens, R. Energy and comfort performance of thermally activated building systems including occupant behavior. J. Affect. Disord. 2011, 46, 835–848. [Google Scholar] [CrossRef]
- Weinläder, H.; Körner, W.; Strieder, B. A ventilated cooling ceiling with integrated latent heat storage—Monitoring results. Energy Build. 2014, 82, 65–72. [Google Scholar] [CrossRef]
- de Gracia, A.; Navarro, L.; Castell, A.; Ruiz-Pardo, Á.; Álvarez, S.; Cabeza, L.F. Thermal analysis of a ventilated facade with PCM for cooling applications. Energy Build. 2013, 65, 508–515. [Google Scholar] [CrossRef]
- Fraisse, G.; Johannes, K.; Trillat-Berdal, V.; Achard, G. The use of a heavy internal wall with a ventilated air gap to store solar energy and improve summer comfort in timber frame houses. Energy Build. 2006, 38, 293–302. [Google Scholar] [CrossRef]
- de Gracia, A.; Navarro, L.; Castell, A.; Ruiz-Pardo, Á.; Alvárez, S.; Cabeza, L.F. Experimental study of a ventilated facade with PCM during winter period. Energy Build. 2013, 58, 324–332. [Google Scholar] [CrossRef]
- Arteconi, A.; Hewitt, N.J.; Polonara, F. Domestic demand-side management (DSM): Role of heat pumps and thermal energy storage (TES) systems. Appl. Therm. Eng. 2013, 51, 155–165. [Google Scholar] [CrossRef]
- Zhang, P.; Ma, Z.; Wang, R. An overview of phase change material slurries: MPCS and CHS. Renew. Sustain. Energy Rev. 2010, 14, 598–614. [Google Scholar] [CrossRef]
- Nomura, T.; Okinaka, N.; Akiyama, T. Impregnation of porous material with phase change material for thermal energy storage. Mater. Chem. Phys. 2009, 115, 846–850. [Google Scholar] [CrossRef]
- Tyagi, V.; Kaushik, S.; Tyagi, S.; Akiyama, T. Development of phase change materials based microencapsulated technology for buildings: A review. Renew. Sustain. Energy Rev. 2011, 15, 1373–1391. [Google Scholar] [CrossRef]
- Zhang, Y.; Lin, K.; Yang, R.; Di, H.; Jiang, Y. Preparation, thermal performance and application of shape-stabilized PCM in energy efficient buildings. Energy Build. 2006, 38, 1262–1269. [Google Scholar] [CrossRef]
- Delgado, M.; Lázaro, A.; Mazo, J.; Zalba, B. Review on phase change material emulsions and microencapsulated phase change material slurries: Materials, heat transfer studies and applications. Renew. Sustain. Energy Rev. 2012, 16, 253–273. [Google Scholar] [CrossRef]
- Soares, N.; Costa, J.J.; Gaspar, A.R.; Santos, P. Review of passive PCM latent heat thermal energy storage systems towards buildings' energy efficiency. Energy Build. 2013, 59, 82–103. [Google Scholar] [CrossRef]
- Alsokhiry, F.; Siano, P.; Annuk, A.; Mohamed, M.A. A Novel Time-of-Use Pricing Based Energy Management System for Smart Home Appliances: Cost-Effective Method. Sustainability 2022, 14, 14556. [Google Scholar] [CrossRef]
- Gholamibozanjani, G.; Farid, M. A comparison between passive and active PCM systems applied to buildings. Renew. Energy 2020, 162, 112–123. [Google Scholar] [CrossRef]
- Du, K.; Calautit, J.; Wang, Z.; Wu, Y.; Liu, H. A review of the applications of phase change materials in cooling, heating and power generation in different temperature ranges. Appl. Energy 2018, 220, 242–273. [Google Scholar] [CrossRef]
- Yang, C.; Fischer, L.; Maranda, S.; Worlitschek, J. Rigid polyurethane foams incorporated with phase change materials: A state-of-the-art review and future research pathways. Energy Build. 2015, 87, 25–36. [Google Scholar] [CrossRef]
- Faraj, K.; Khaled, M.; Faraj, J.; Hachem, F.; Castelain, C. A Summary Review on Experimental Studies for PCM Building Applications: Towards Advanced Modular Prototype. Energies 2022, 15, 1459. [Google Scholar] [CrossRef]
- Shahrul, I.; Mahbubul, I.; Khaleduzzaman, S.; Saidur, R.; Sabri, M. A comparative review on the specific heat of nanofluids for energy perspective. Renew. Sustain. Energy Rev. 2014, 38, 88–98. [Google Scholar] [CrossRef]
- Bozsaky, D. Laboratory Tests with Liquid Nano-ceramic Thermal Insulation Coating. Procedia Eng. 2015, 123, 68–75. [Google Scholar] [CrossRef]
- Vukadinović, A.; Radosavljević, J.; Đorđević, A. Energy performance impact of using phase-change materials in thermal storage walls of detached residential buildings with a sunspace. Sol. Energy 2020, 206, 228–244. [Google Scholar] [CrossRef]
- Akkurt, G.; Aste, N.; Borderon, J.; Buda, A.; Calzolari, M.; Chung, D.; Costanzo, V.; Del Pero, C.; Evola, G.; Huerto-Cardenas, H.; et al. Dynamic thermal and hygrometric simulation of historical buildings: Critical factors and possible solutions. Renew. Sustain. Energy Rev. 2020, 118, 109509. [Google Scholar] [CrossRef]
- Peippo, K.; Kauranen, P.; Lund, P. A multicomponent PCM wall optimized for passive solar heating. Energy Build. 1991, 17, 259–270. [Google Scholar] [CrossRef]
- Li, J.; Xue, P.; He, H.; Ding, W.; Han, J. Preparation and application effects of a novel form-stable phase change material as the thermal storage layer of an electric floor heating system. Energy Build. 2009, 41, 871–880. [Google Scholar] [CrossRef]
- Sayyar, M.; Weerasiri, R.R.; Soroushian, P.; Lu, J. Experimental and numerical study of shape-stable phase-change nanocomposite toward energy-efficient building constructions. Energy Build. 2014, 75, 249–255. [Google Scholar] [CrossRef]
- Athienitis, A.; Liu, C.; Hawes, D.; Banu, D.; Feldman, D. Investigation of the thermal performance of a passive solar test-room with wall latent heat storage. J. Affect. Disord. 1997, 32, 405–410. [Google Scholar] [CrossRef]
- Diaconu, B.M.; Varga, S.; Oliveira, A.C. Numerical simulation of a solar-assisted ejector air conditioning system with cold storage. Energy 2011, 36, 1280–1291. [Google Scholar] [CrossRef]
- Parameshwaran, R.; Kalaiselvam, S.; Harikrishnan, S.; Elayaperumal, A. Sustainable thermal energy storage technologies for buildings: A review. Renew. Sustain. Energy Rev. 2012, 16, 2394–2433. [Google Scholar] [CrossRef]
- Kumar, A.; Sharma, A. Climate Consultant: A Software for Designing Energy Efficient Building. International Journal for Research in Applied Science & Engineering Technology (IJRASET) 2018, 6. [Google Scholar]
- Saffari, M.; de Gracia, A.; Fernández, C.; Cabeza, L.F. Simulation-based optimization of PCM melting temperature to improve the energy performance in buildings. Appl. Energy 2017, 202, 420–434. [Google Scholar] [CrossRef]
- Hasan, M.I.; Basher, H.O.; Shdhan, A.O. Experimental investigation of phase change materials for insulation of residential buildings. Sustain. Cities Soc. 2018, 36, 42–58. [Google Scholar] [CrossRef]
- Vukadinović, A.; Radosavljević, J.; Đorđević, A. Energy performance impact of using phase-change materials in thermal storage walls of detached residential buildings with a sunspace. Sol. Energy 2020, 206, 228–244. [Google Scholar] [CrossRef]
- Sovetova, M.; Memon, S.A.; Kim, J. Thermal performance and energy efficiency of building integrated with PCMs in hot desert climate region. Sol. Energy 2019, 189, 357–371. [Google Scholar] [CrossRef]
- Li, Z.X.; Al-Rashed, A.A.; Rostamzadeh, M.; Kalbasi, R.; Shahsavar, A.; Afrand, M. Heat transfer reduction in buildings by embedding phase change material in multi-layer walls: Effects of repositioning, thermophysical properties and thickness of PCM. Energy Convers. Manag. 2019, 195, 43–56. [Google Scholar] [CrossRef]
- Kenzhekhanov, S.; Memon, S.A.; Adilkhanova, I. Quantitative evaluation of thermal performance and energy saving potential of the building integrated with PCM in a subarctic climate. Energy 2020, 192. [Google Scholar] [CrossRef]
- Kharbouch, Y.; Ouhsaine, L.; Mimet, A.; El Ganaoui, M. Thermal performance investigation of a PCM-enhanced wall/roof in northern Morocco. Build. Simul. 2018, 11, 1083–1093. [Google Scholar] [CrossRef]
- Sorooshnia, E.; Rashidi, M.; Rahnamayiezekavat, P.; Mahmoudkelayeh, S.; Pourvaziri, M.; Kamranfar, S.; Gheibi, M.; Samali, B.; Moezzi, R. A novel approach for optimized design of low-E windows and visual comfort for residential spaces. Energy Built Environ. 2023. [Google Scholar] [CrossRef]
- Mousavi, S.; Gheibi, M.; Wacławek, S.; Behzadian, K. A novel smart framework for optimal design of green roofs in buildings conforming with energy conservation and thermal comfort. Energy Build. 2023, 291, 113111. [Google Scholar] [CrossRef]
- Mousavi, S.; Gheibi, M.; Wacławek, S.; Smith, N.R.; Hajiaghaei-Keshteli, M.; Behzadian, K. Low-energy residential building optimisation for energy and comfort enhancement in semi-arid climate conditions. Energy Convers. Manag. 2023, 291. [Google Scholar] [CrossRef]
- Sharshir, S.W.; Joseph, A.; Elsharkawy, M.; Hamada, M.A.; Kandeal, A.; Elkadeem, M.R.; Thakur, A.K.; Ma, Y.; Moustapha, M.E.; Rashad, M.; et al. Thermal energy storage using phase change materials in building applications: A review of the recent development. Energy Build. 2023, 285. [Google Scholar] [CrossRef]
- Battaglia, V.; Vanoli, L.; Verde, C.; Nithiarasu, P.; Searle, J.R. Dynamic modelling of geothermal heat pump system coupled with positive-energy building. Energy 2023, 284. [Google Scholar] [CrossRef]
- Hai, T.; Dhahad, H.A.; Zhou, J.; Abdelrahman, A.; Almojil, S.F.; Almohana, A.I.; Alali, A.F.; Kh, T.I.; Sharma, K.; Ali, M.A.; et al. Implementation of artificial neural network in a building benefits from radiant floor heating /cooling enhanced by phase change materials. Eng. Anal. Bound. Elements 2023, 146, 66–79. [Google Scholar] [CrossRef]
- Aldakheel, J.; Bahrar, M.; El Mankibi, M. Indoor environmental quality evaluation of smart/artificial intelligence techniques in buildings – a review. E3S Web Conf. 2023, 396, 01101. [Google Scholar] [CrossRef]
- Gao, Y.; Meng, X. A comprehensive review of integrating phase change materials in building bricks: Methods, performance and applications. J. Energy Storage 2023, 62. [Google Scholar] [CrossRef]
- Gupta, S.K.; Chanda, P.R.; Biswas, A. A 2E, energy and environment performance of an optimized vernacular house for passive cooling - Case of North-East India. J. Affect. Disord. 2023, 229. [Google Scholar] [CrossRef]
- Abdullah, S.; Zubir, M.N.B.M.; Bin Muhamad, M.R.; Newaz, K.M.S.; Öztop, H.F.; Alam, S.; Shaikh, K. Technological development of evaporative cooling systems and its integration with air dehumidification processes: A review. Energy Build. 2023, 283. [Google Scholar] [CrossRef]
- Androšević, R.; Androšević, D. Designing the Future Residential Buildings with Low Environmental Impact-Case Study Buildings in Bosnia and Herzegovina. In Advanced Technologies, Systems, and Applications VI: Proceedings of the International Symposium on Innovative and Interdisciplinary Applications of Advanced Technologies (IAT) 2021; Springer International Publishing, 2022; pp. 735–743. [Google Scholar]
- Al-Yasiri, Q.; Szabó, M. Incorporation of phase change materials into building envelope for thermal comfort and energy saving: A comprehensive analysis. J. Build. Eng. 2021, 36, 102122. [Google Scholar] [CrossRef]
- Aridi, R.; Yehya, A. Review on the sustainability of phase-change materials used in buildings. Energy Convers. Manag. X 2022, 15. [Google Scholar] [CrossRef]
- da Cunha, S.R.L.; de Aguiar, J.L.B. Phase change materials and energy efficiency of buildings: A review of knowledge. Journal of Energy Storage 2020, 27, 101083. [Google Scholar] [CrossRef]
- Madad, A.; Mouhib, T.; Mouhsen, A. Phase Change Materials for Building Applications: A Thorough Review and New Perspectives. Buildings 2018, 8, 63. [Google Scholar] [CrossRef]
- Rashid, F.L.; Al-Obaidi, M.A.; Dulaimi, A.; Mahmood, D.M.N.; Sopian, K. A Review of Recent Improvements, Developments, and Effects of Using Phase-Change Materials in Buildings to Store Thermal Energy. Designs 2023, 7, 90. [Google Scholar] [CrossRef]
- Wang, P.; Liu, Z.; Zhang, L. Sustainability of compact cities: A review of Inter-Building Effect on building energy and solar energy use. Sustain. Cities Soc. 2021, 72. [Google Scholar] [CrossRef]
- Wang, N.; Phelan, P.E.; Harris, C.; Langevin, J.; Nelson, B.; Sawyer, K. Past visions, current trends, and future context: A review of building energy, carbon, and sustainability. Renew. Sustain. Energy Rev. 2018, 82, 976–993. [Google Scholar] [CrossRef]
- El Shenawy, A.; Zmeureanu, R. Exergy-based index for assessing the building sustainability. J. Affect. Disord. 2013, 60, 202–210. [Google Scholar] [CrossRef]
- Hepbasli, A. Low exergy (LowEx) heating and cooling systems for sustainable buildings and societies. Renew. Sustain. Energy Rev. 2012, 16, 73–104. [Google Scholar] [CrossRef]
- Zhan, H.; Mahyuddin, N.; Sulaiman, R.; Khayatian, F. Phase change material (PCM) integrations into buildings in hot climates with simulation access for energy performance and thermal comfort: A review. Constr. Build. Mater. 2023, 397. [Google Scholar] [CrossRef]
- Liu, X.; Yang, Y.; Sheng, Z.; Wu, W.; Wang, Y.; Dumoulin, J. Study on thermal storage effectiveness of a novel PCM concrete applied in buildings located at four cities. Renew. Energy 2023, 218. [Google Scholar] [CrossRef]
- Erdogmus, E.; Yaras, A.; Ustaoglu, A.; Hekimoğlu, G.; Sarı, A.; Gencel, O. Thermal performance analysis of novel foam concrete composites with PCM for energy storage and environmental benefits in buildings. Energy Build. 2023, 296. [Google Scholar] [CrossRef]
- Zhussupbekov, M.; Memon, S.A.; Khawaja, S.A.; Nazir, K.; Kim, J. Forecasting energy demand of PCM integrated residential buildings: A machine learning approach. J. Build. Eng. 2023, 70. [Google Scholar] [CrossRef]
- Agarwal, P.; Prabhakar, A. Energy and thermo-economic analysis of PCM integrated brick in composite climatic condition of Jaipur - A numerical study. Sustain. Cities Soc. 2023, 88. [Google Scholar] [CrossRef]
- Hou, J.; Liu, Z.-A.; Zhang, L.; Zhang, T.; Hou, C.; Fukuda, H. Parametric and economic analysis of incorporating phase change material (PCM) into exterior walls to reduce energy demand for traditional dwellings in northeast of Sichuan hills, China. Appl. Therm. Eng. 2023, 223. [Google Scholar] [CrossRef]
- Gao, X.; Niu, Z.; Huang, X.; Yang, X.; Yan, J. Thermo-economic assessments on building heating by a thermal energy storage system with metal foam. Case Stud. Therm. Eng. 2023, 49. [Google Scholar] [CrossRef]
- Safarzadeh, S.; Yousefi, M.; Kazemi, M.; Kianifar, A. Energy, exergy, and economic (3E) analyses of nanoparticle-enriched phase change material in an air–PCM heat exchanger applied for buildings free cooling. J. Therm. Anal. Calorim. 2023, 148, 1–13. [Google Scholar] [CrossRef]
Figure 1.
Share of total final consumption (TFC) by sector, Iran 1990-2020. Source: Energy Transitions Indicators: https://www.iea.org/countries/iran.
Figure 1.
Share of total final consumption (TFC) by sector, Iran 1990-2020. Source: Energy Transitions Indicators: https://www.iea.org/countries/iran.
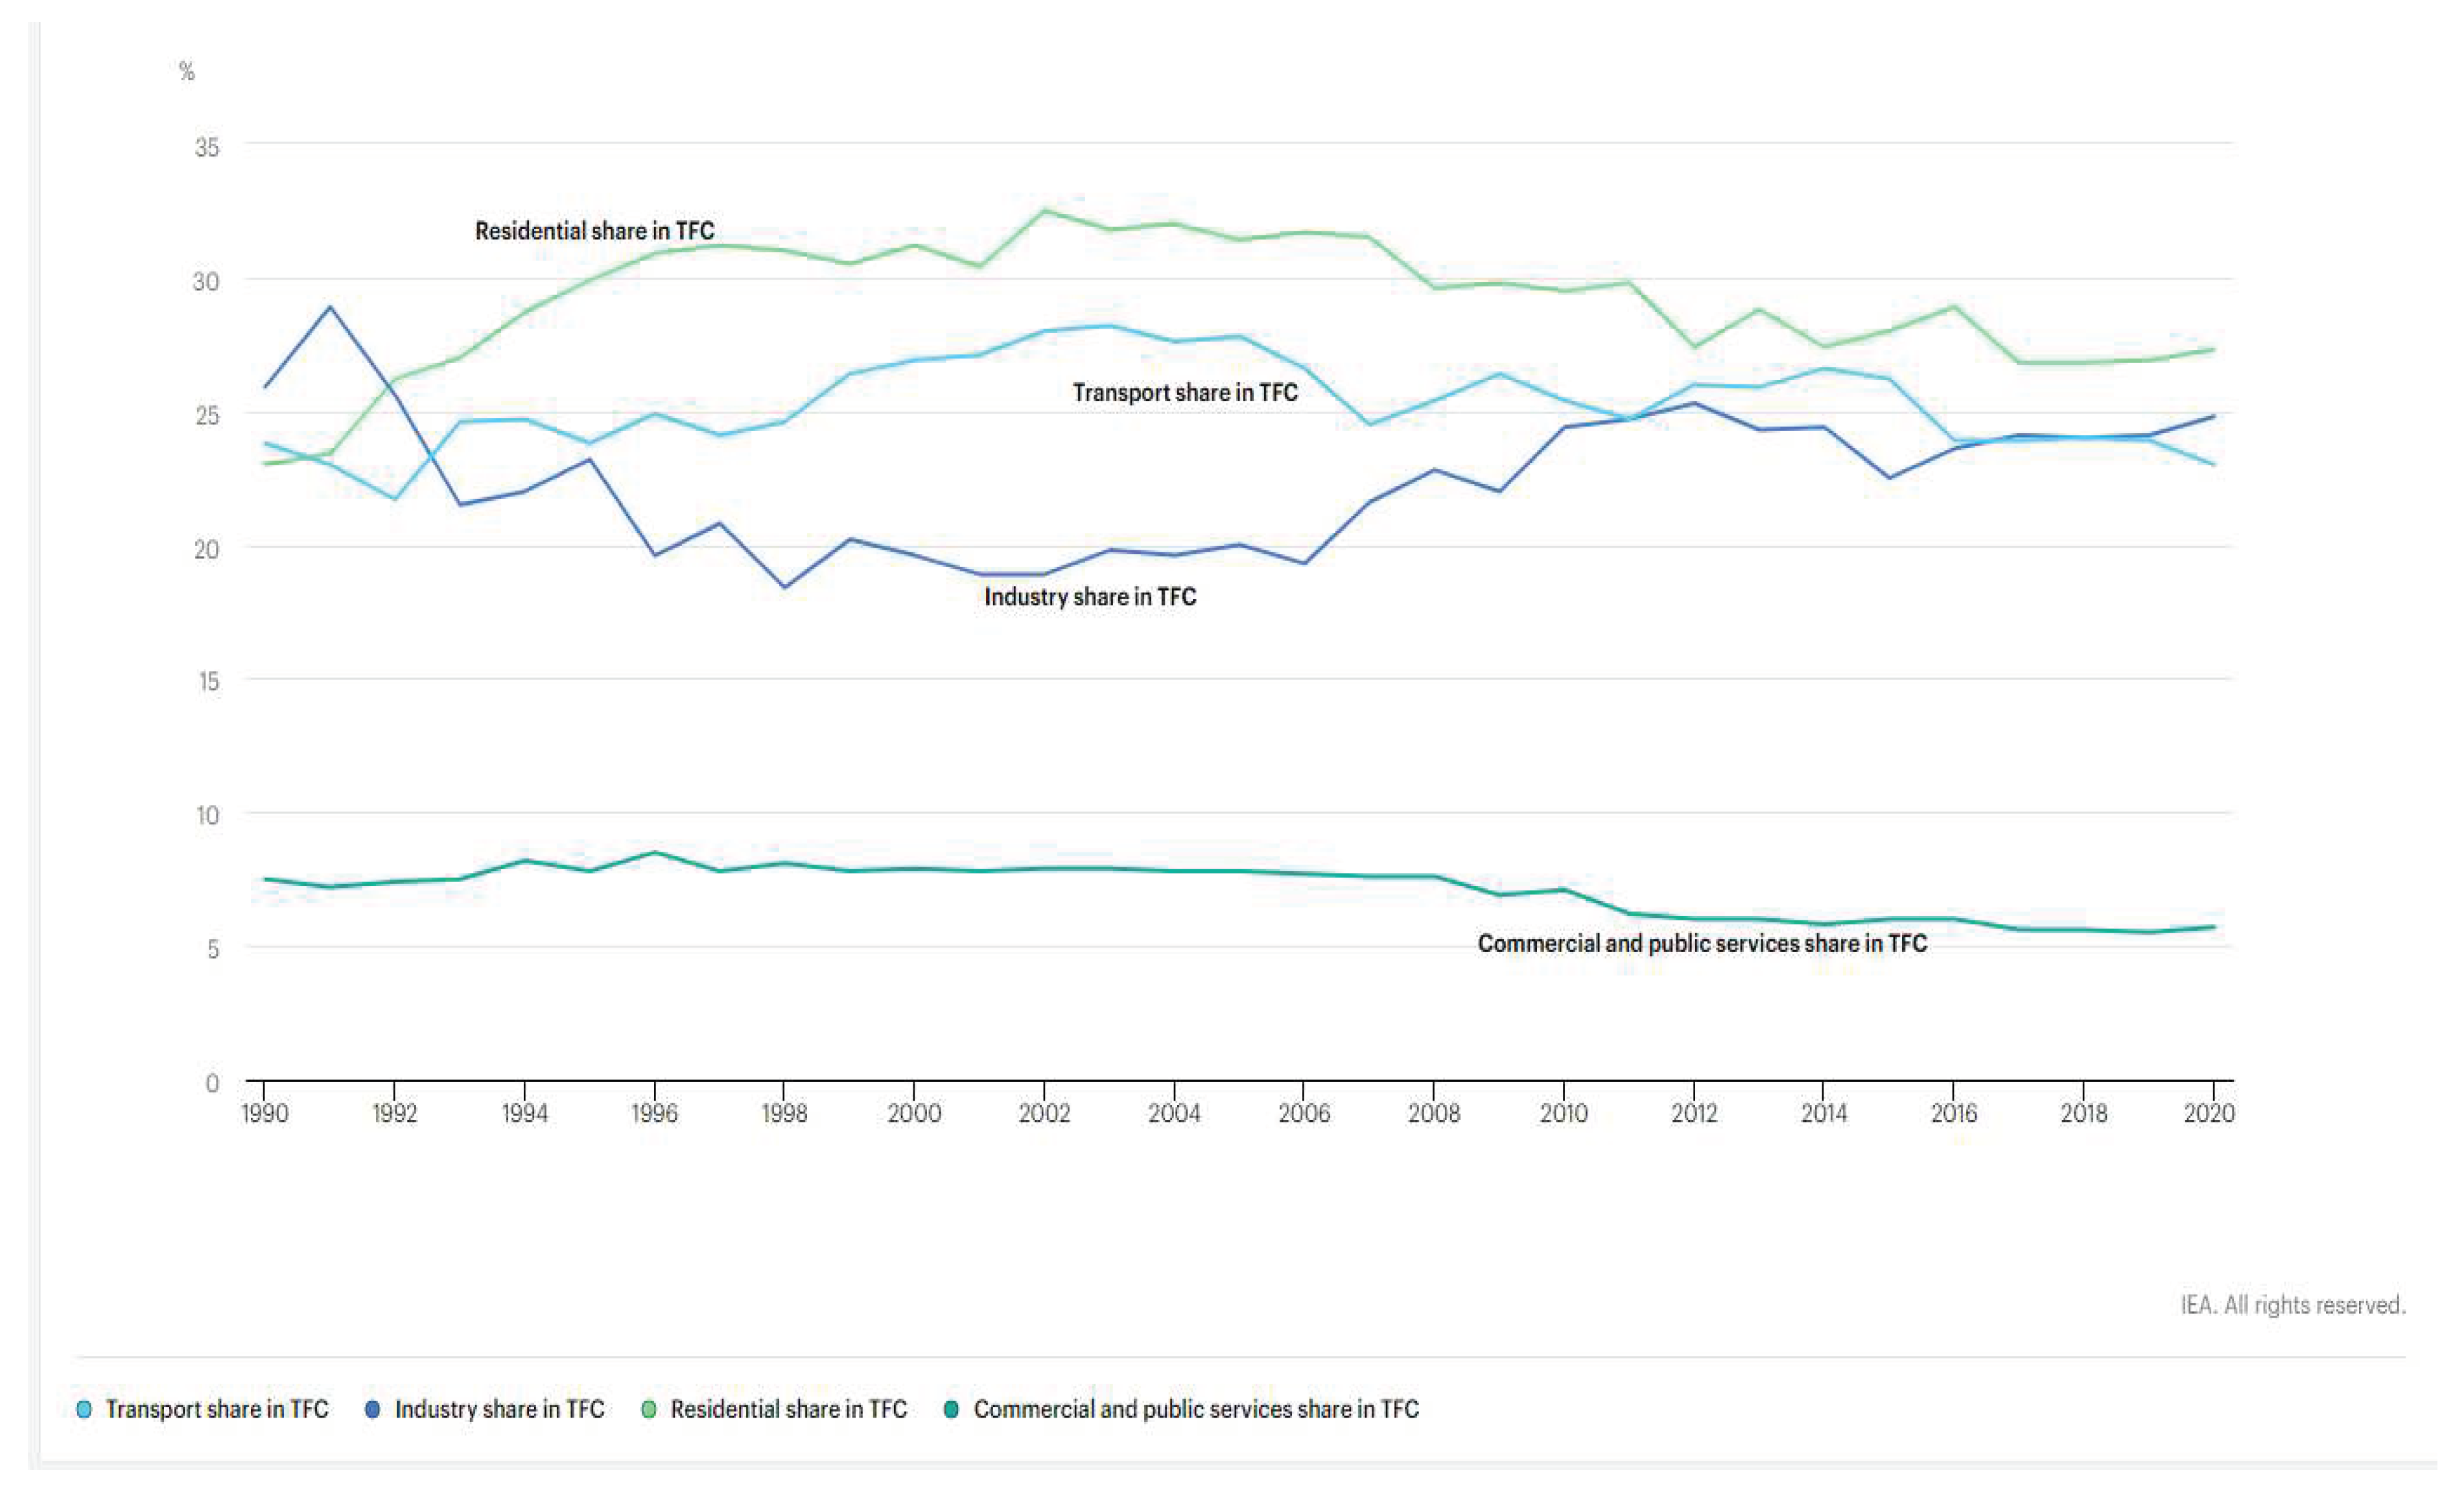
Figure 2.
Total final consumption (TFC) by sector Iran, 2020. Source: World Energy Balances 2022.
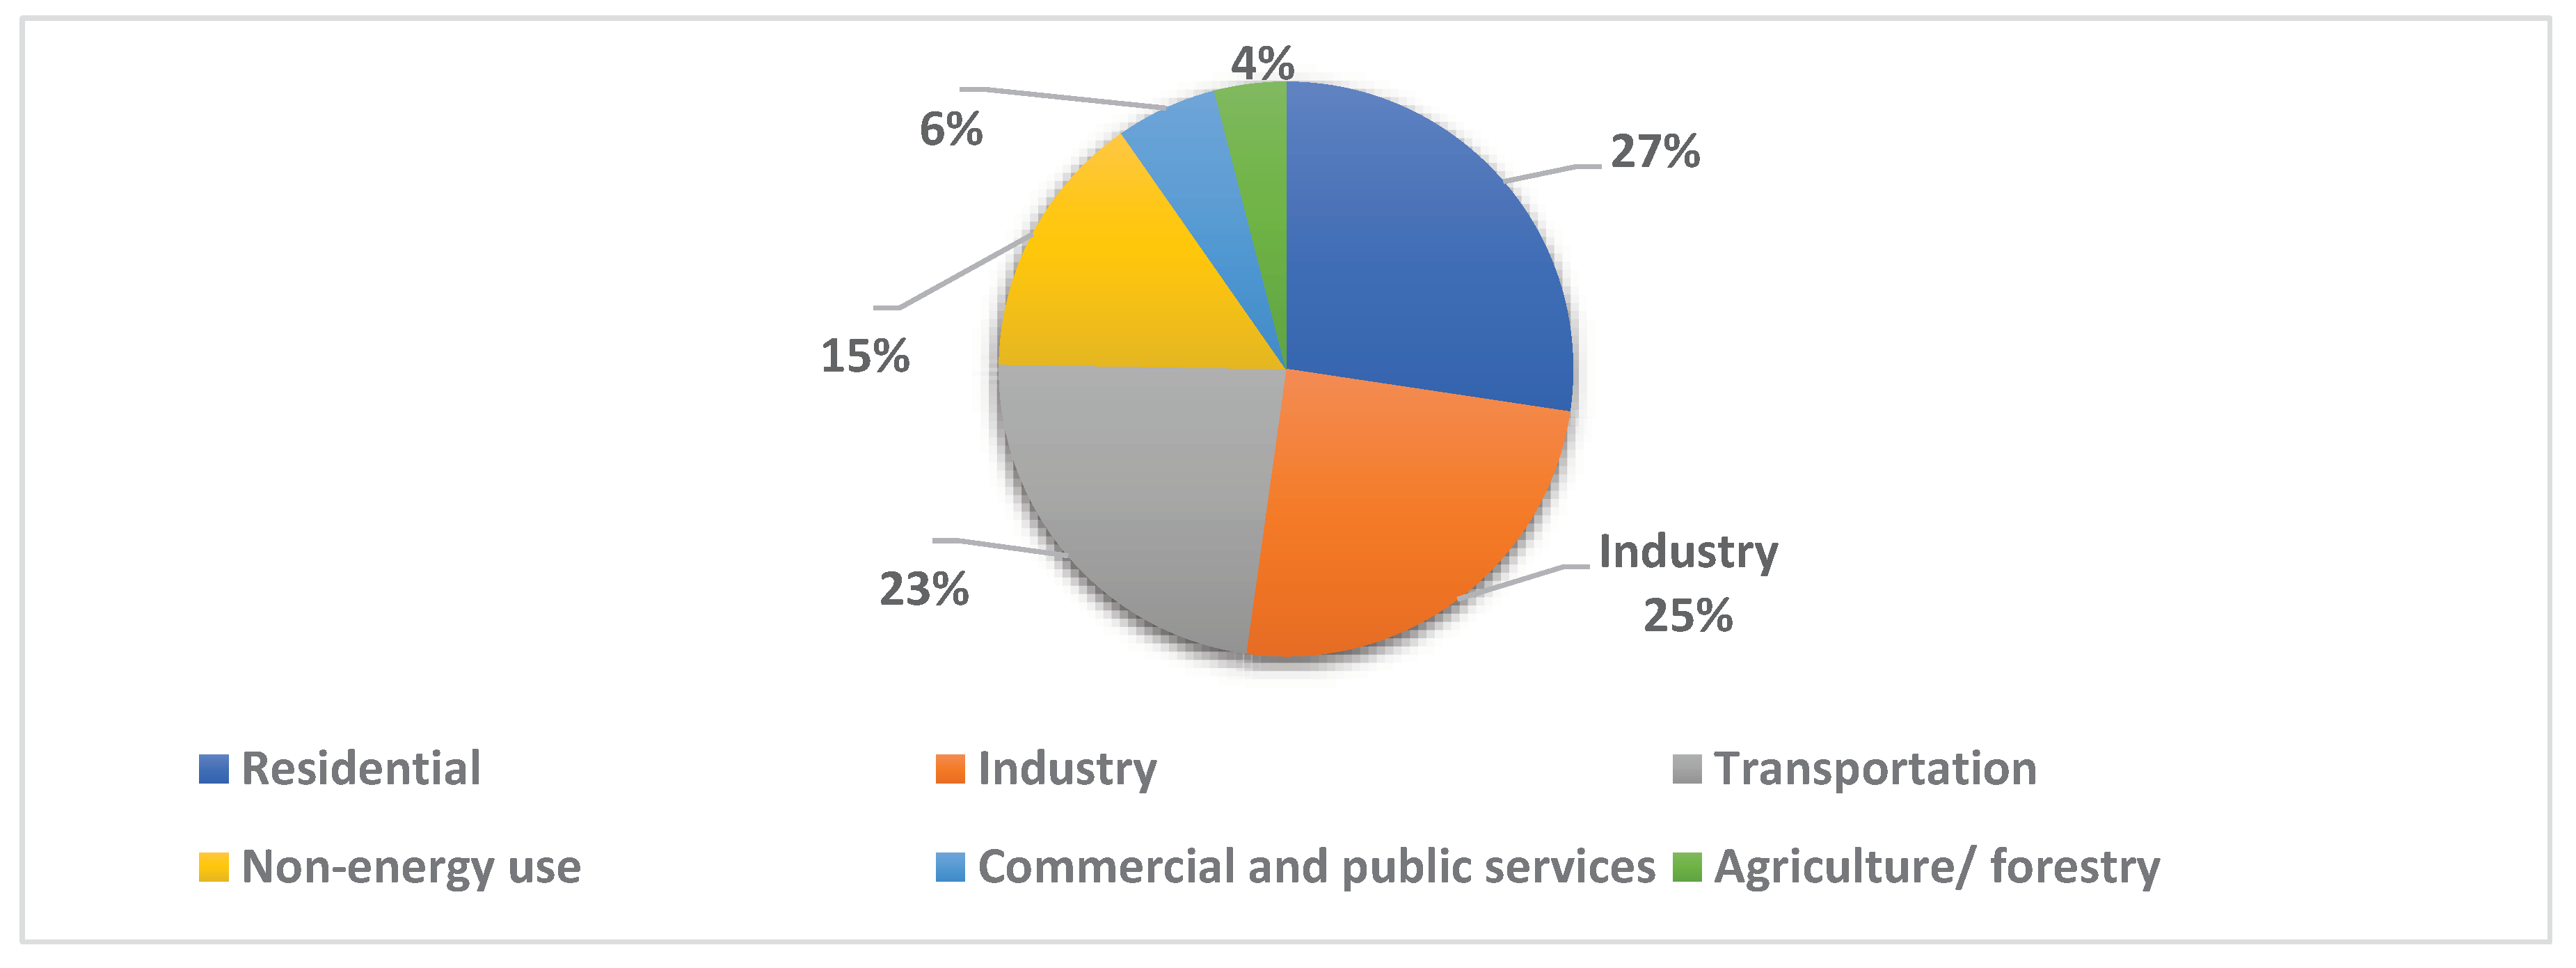
Figure 3.
Area of energy losses in building (Androšević and Androšević, 2022; Sharma et al., 2009).
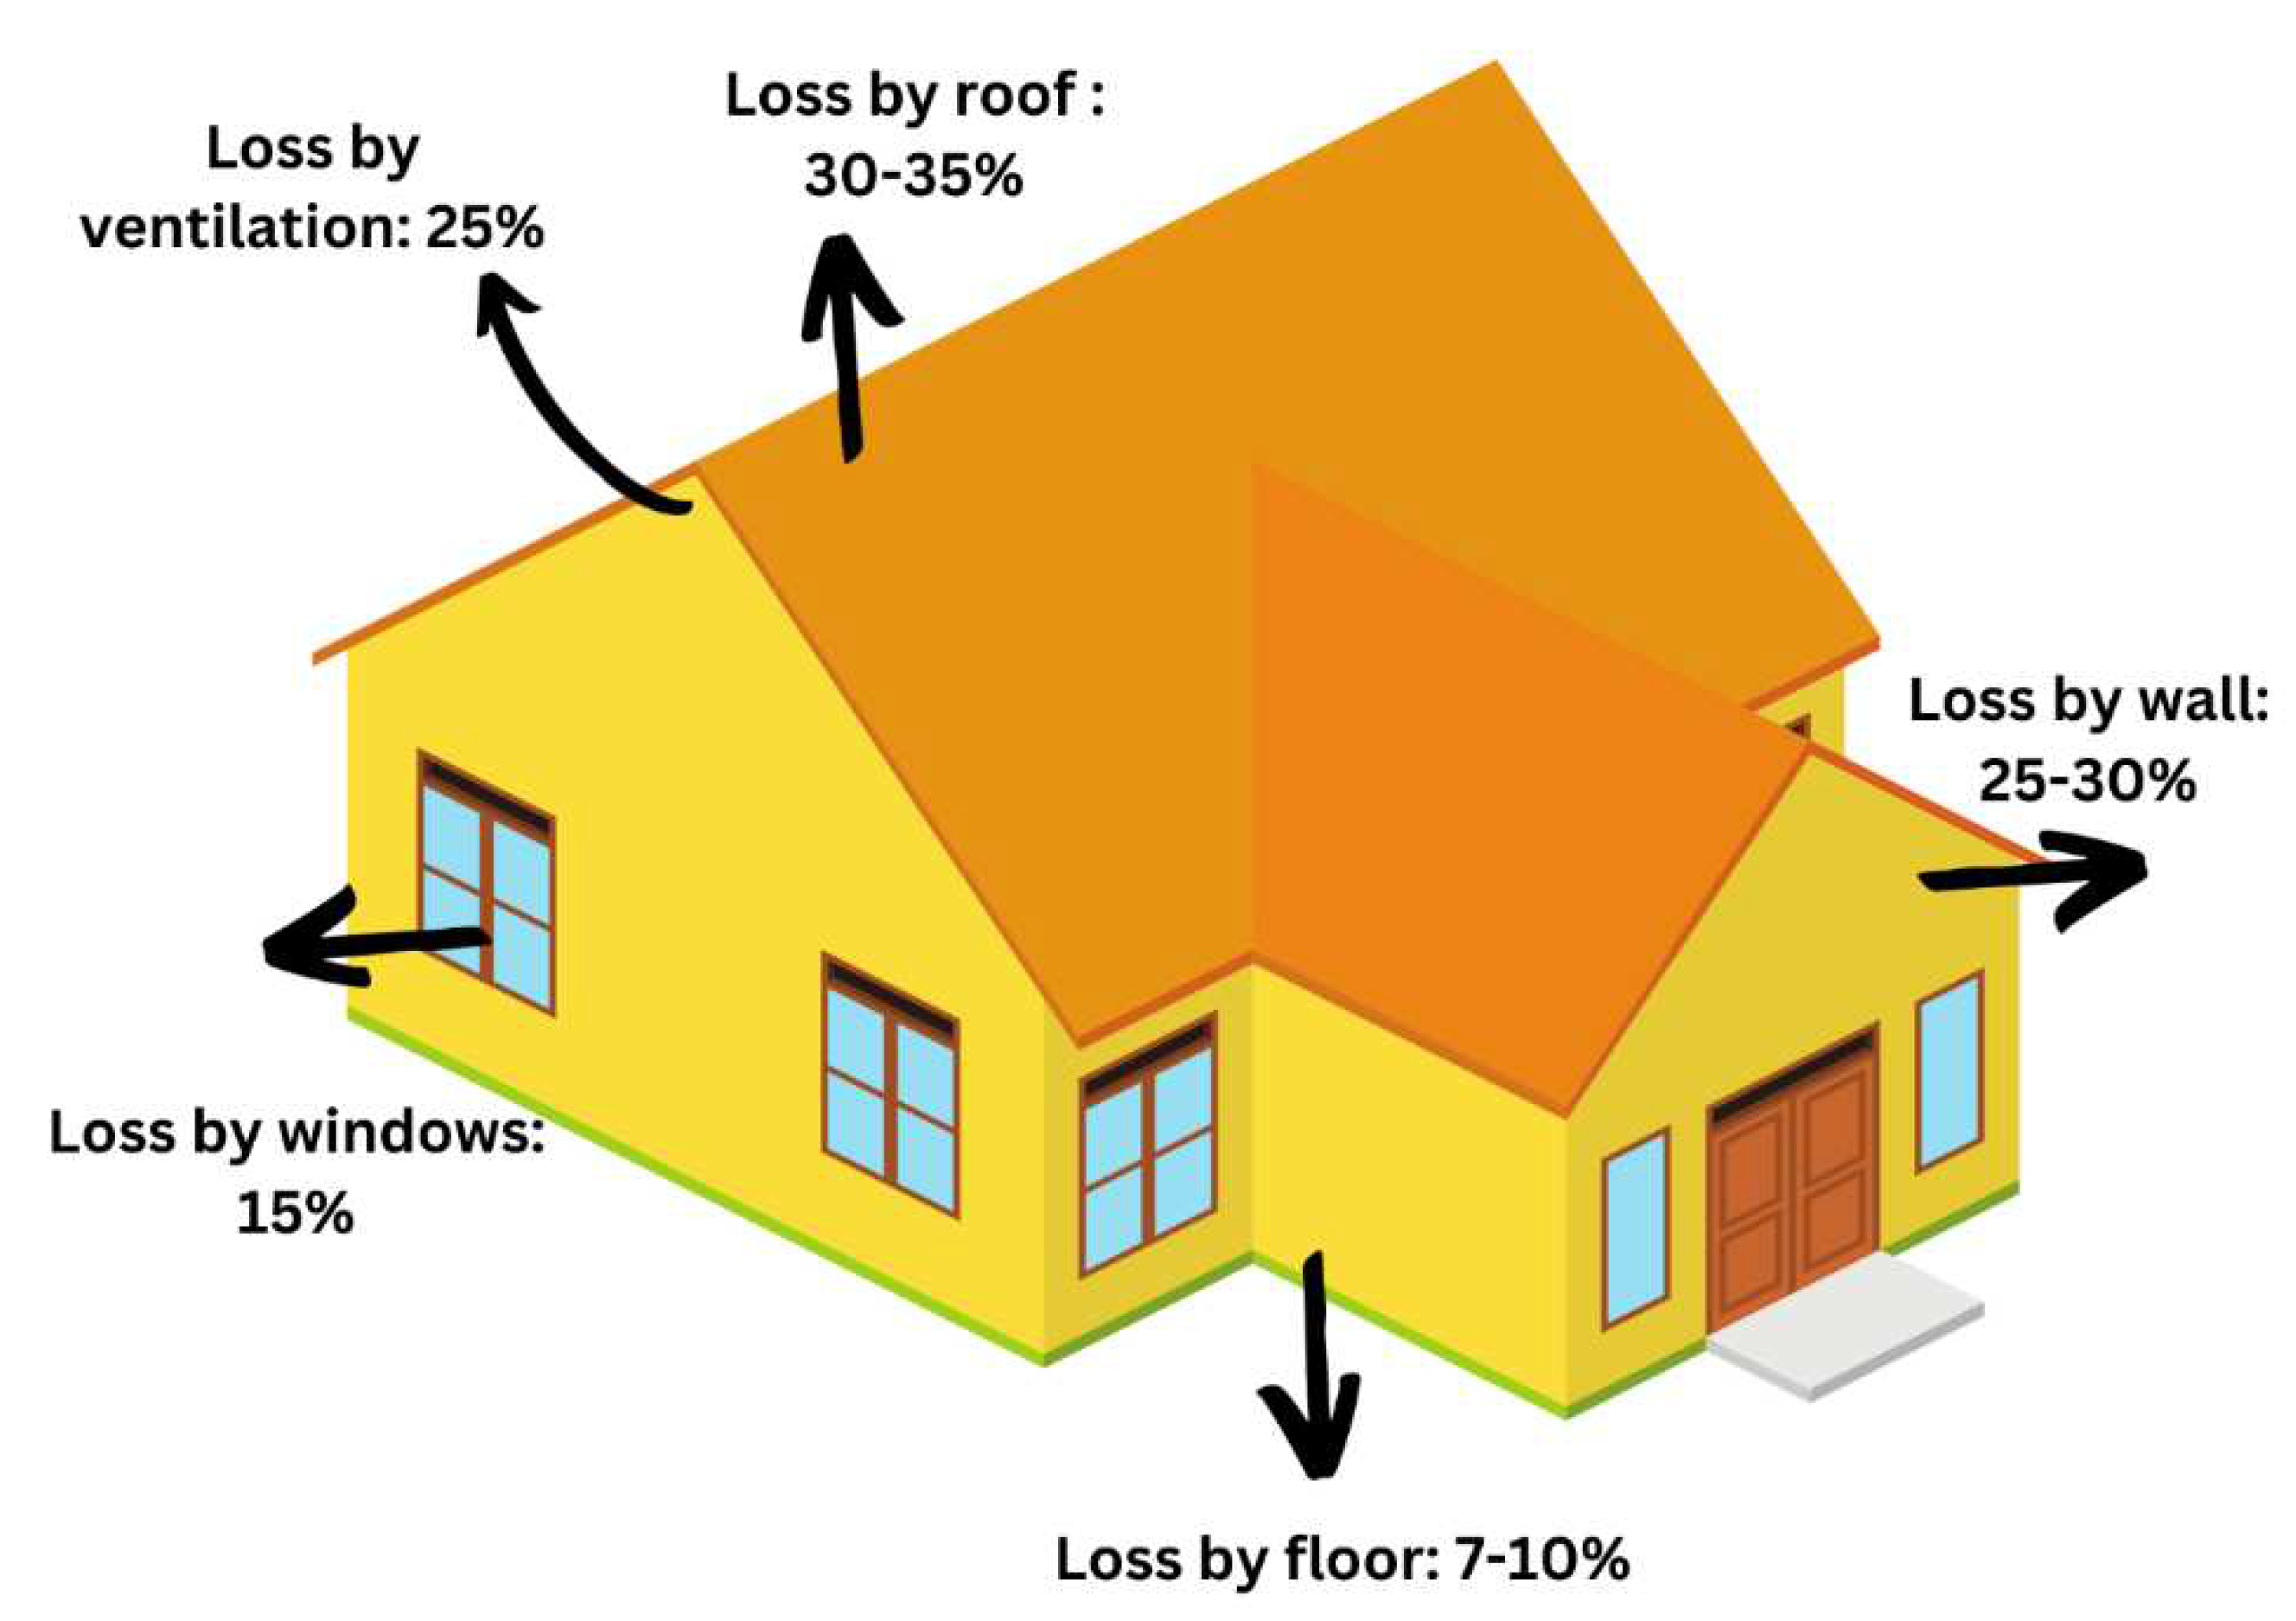
Figure 4.
Research roadmap of the present study.
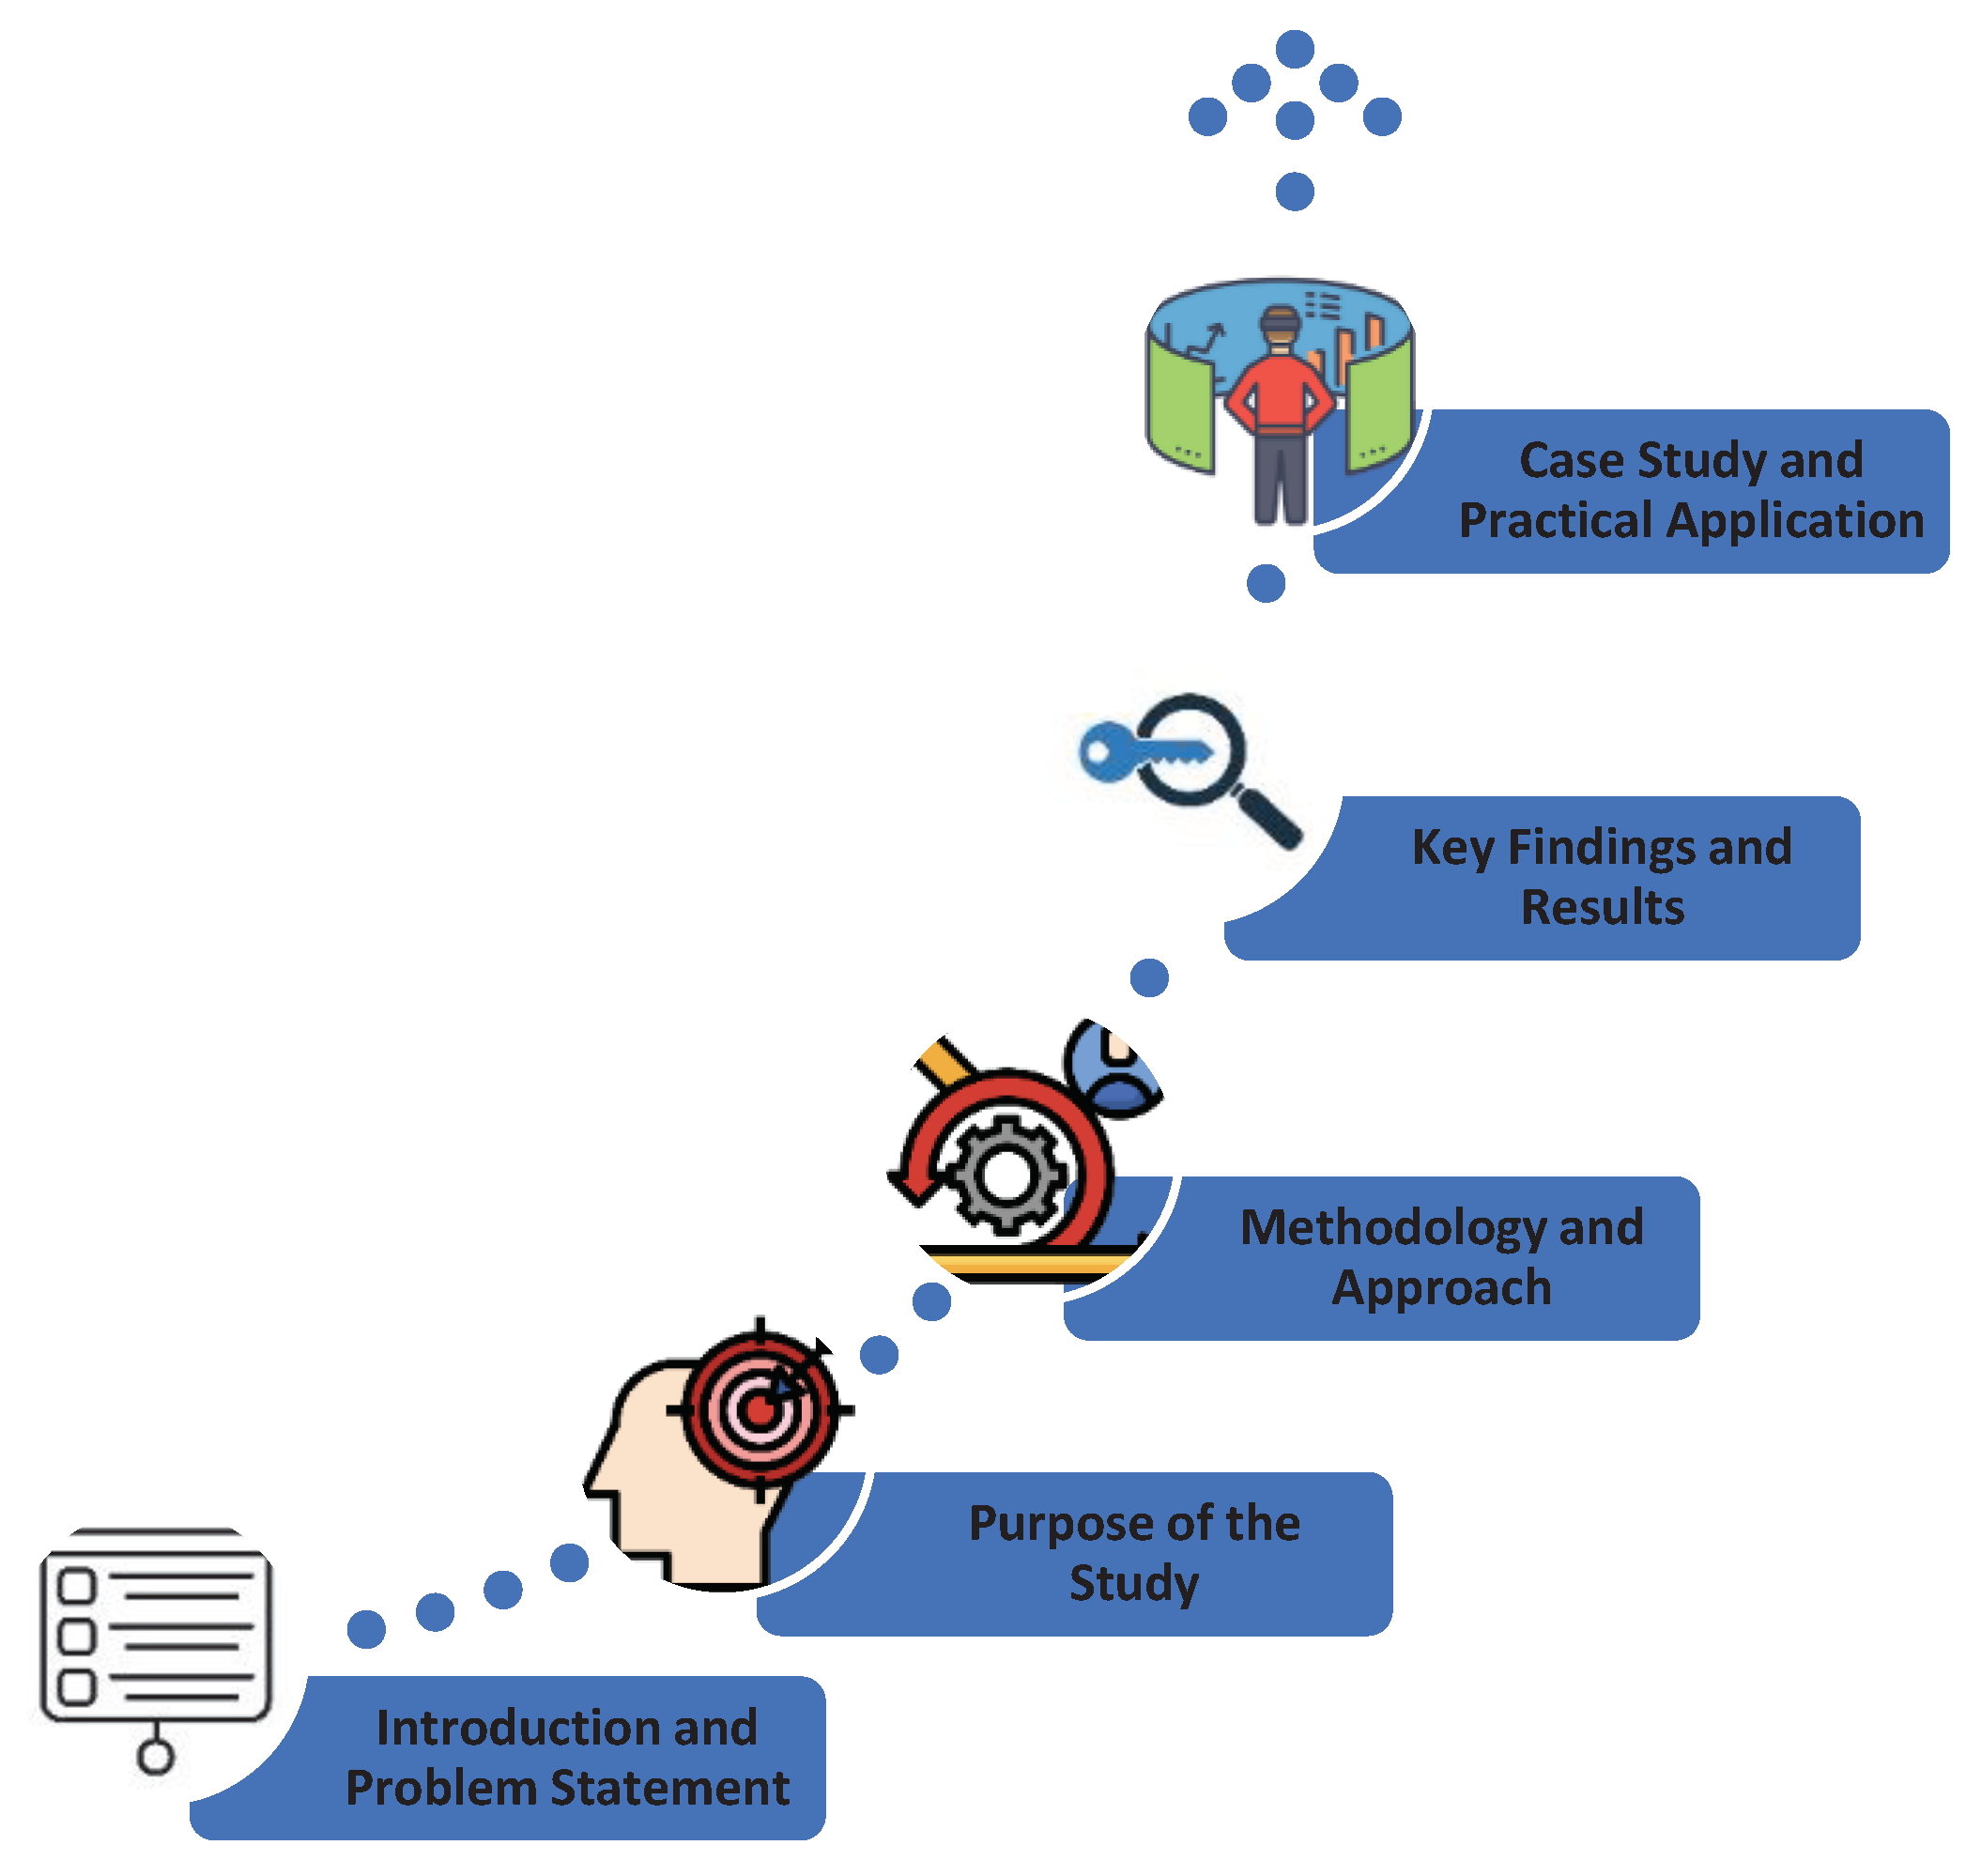
Figure 5.
simulated 3D model of the building.
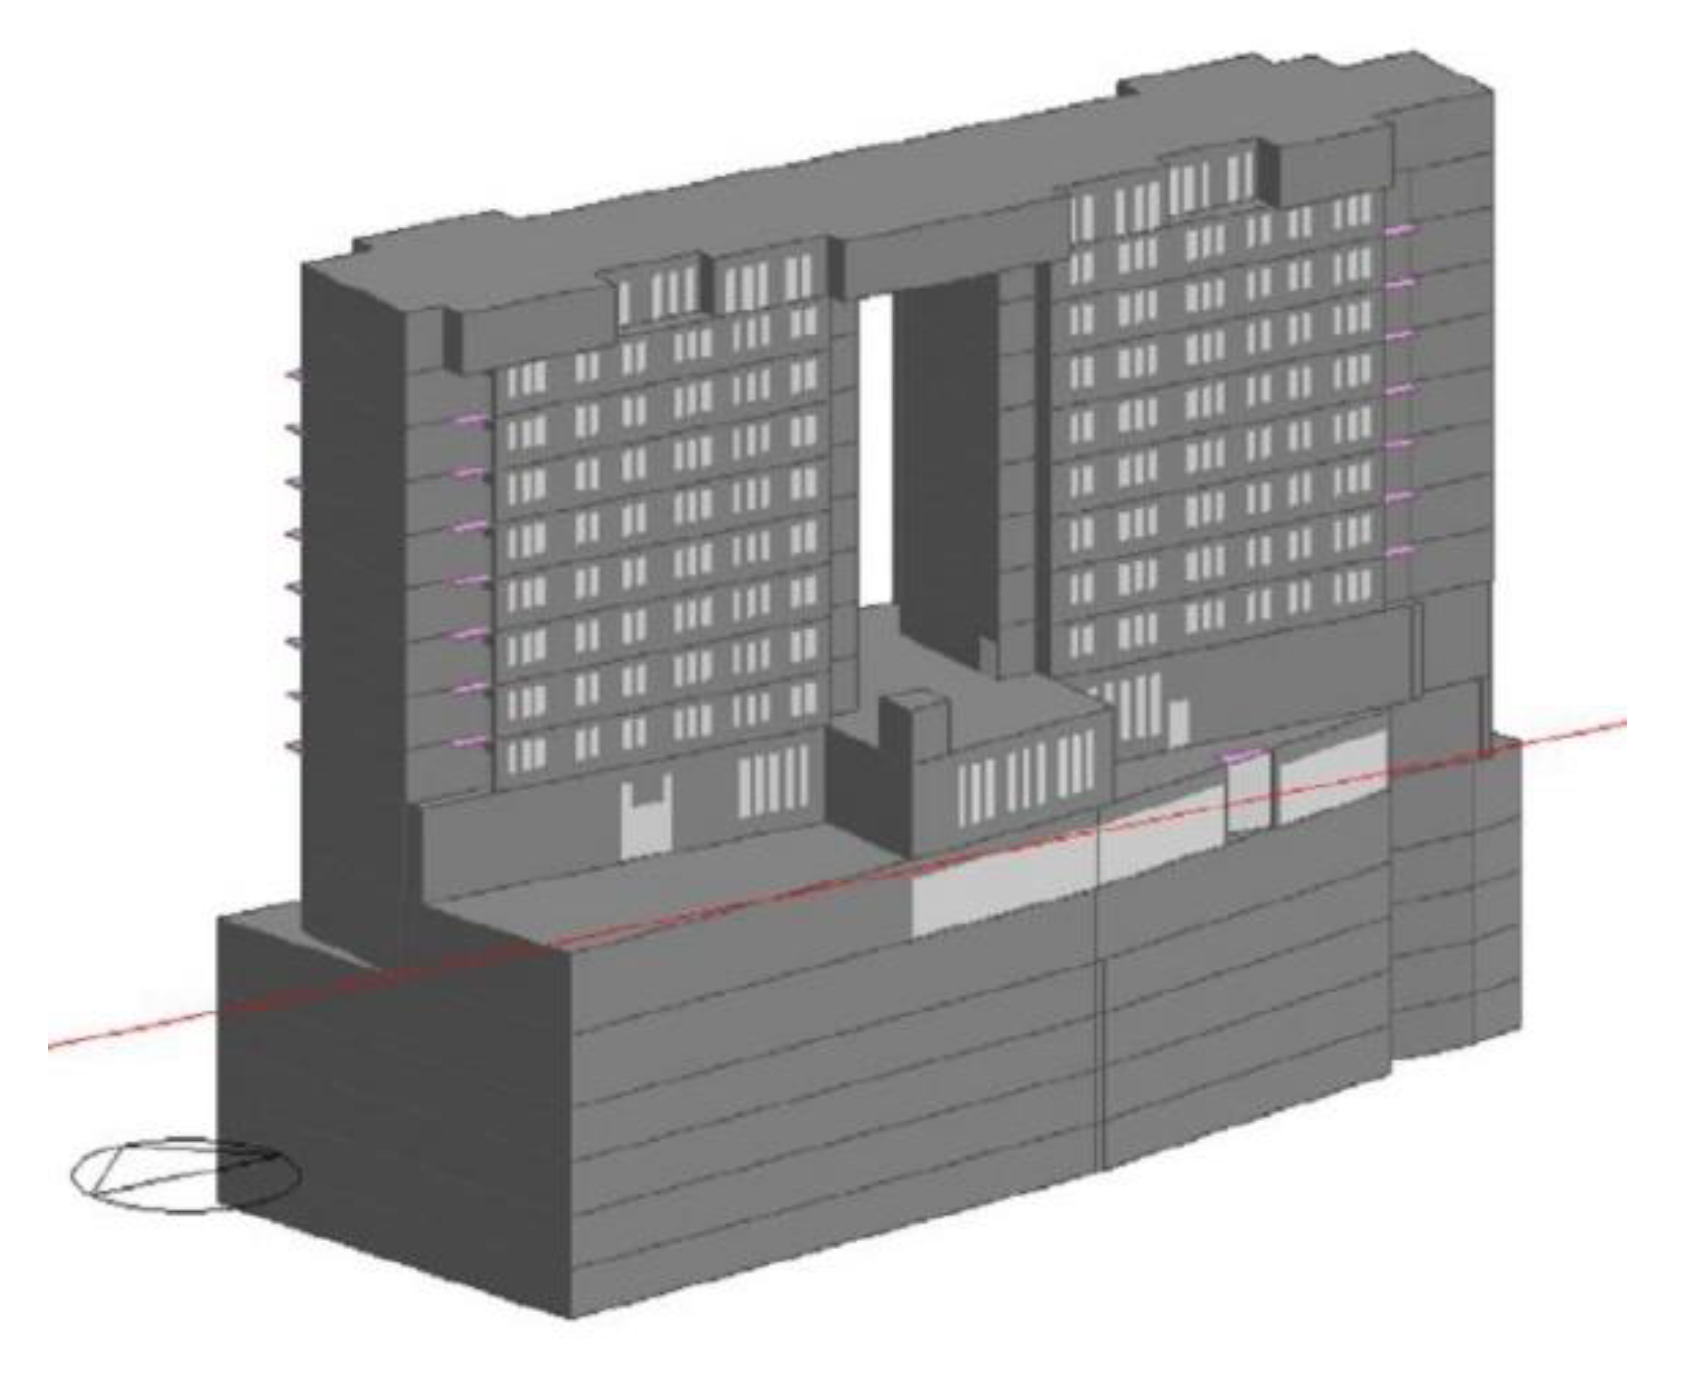
Figure 6.
detail of external wall materials without PCMs or nanofluids.
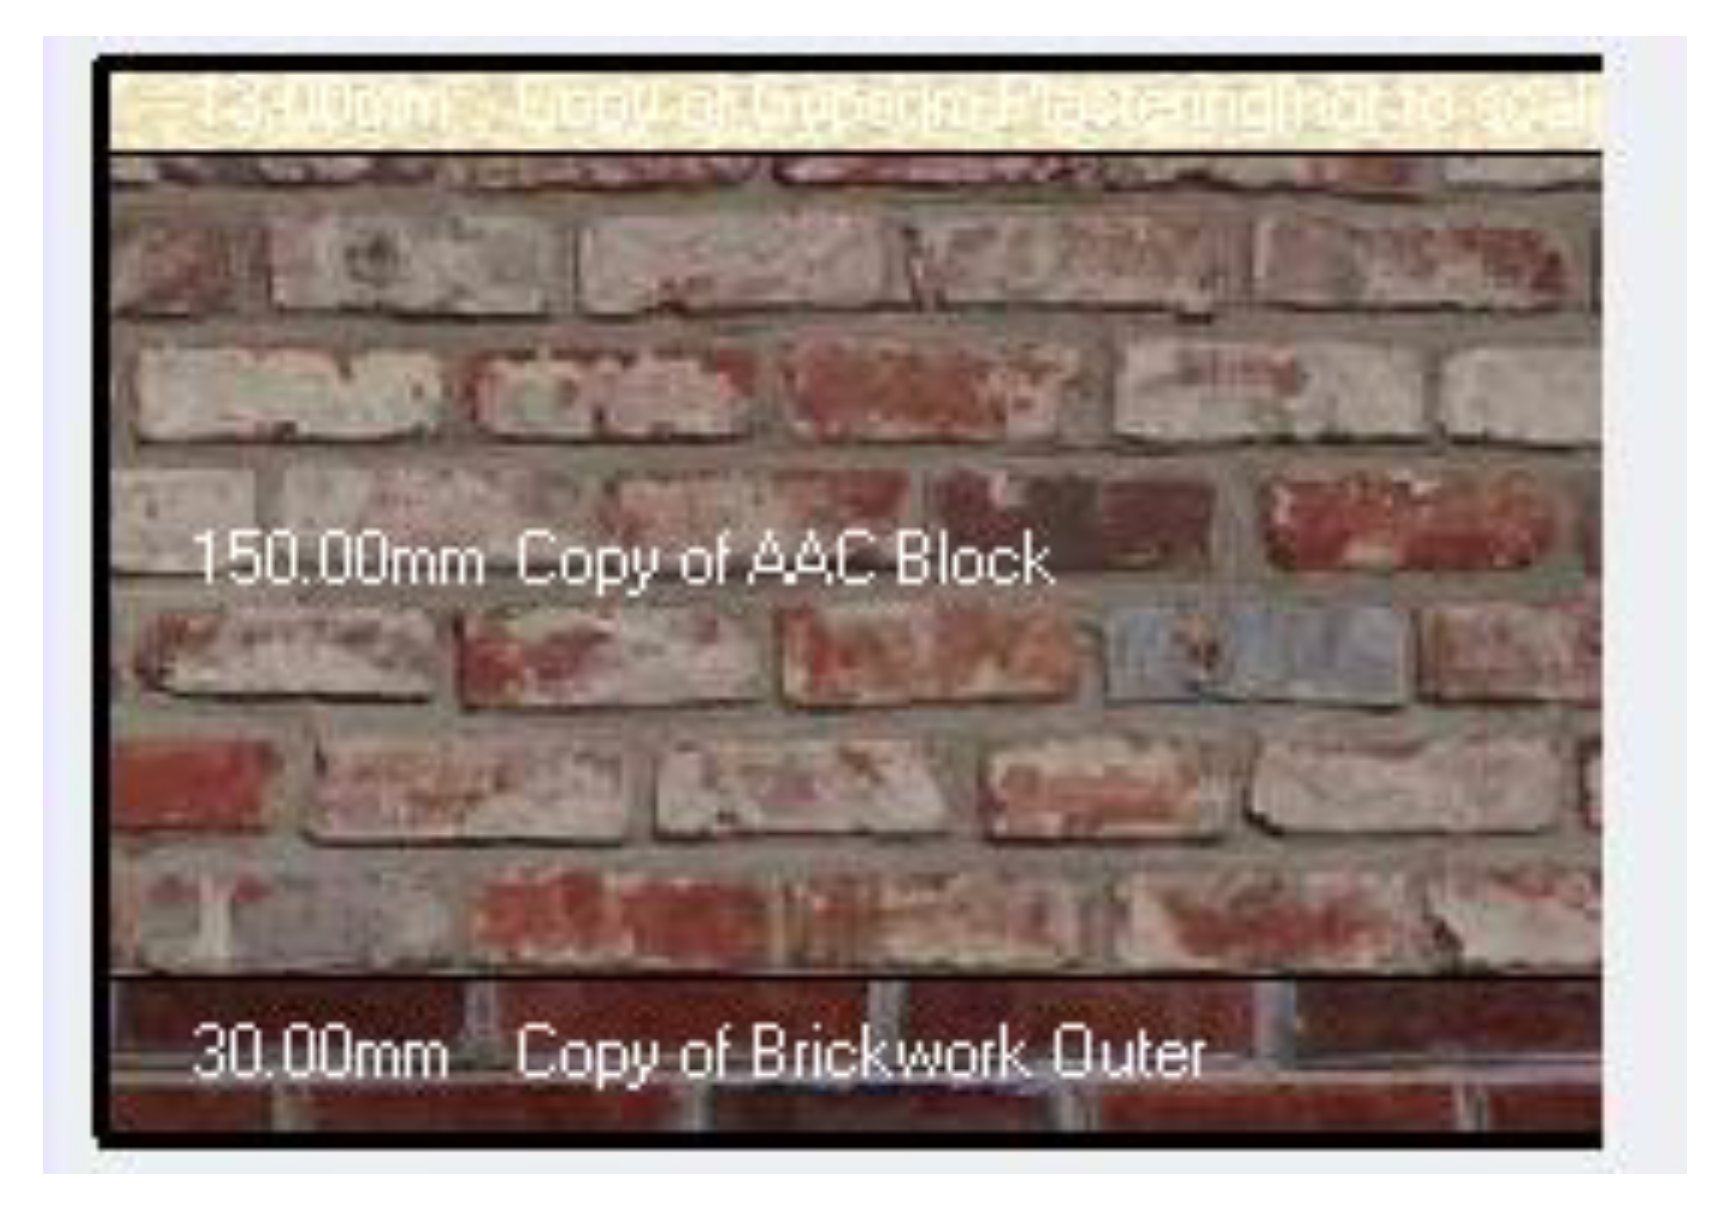
Figure 7.
RT18HC partial enthalpy distribution.
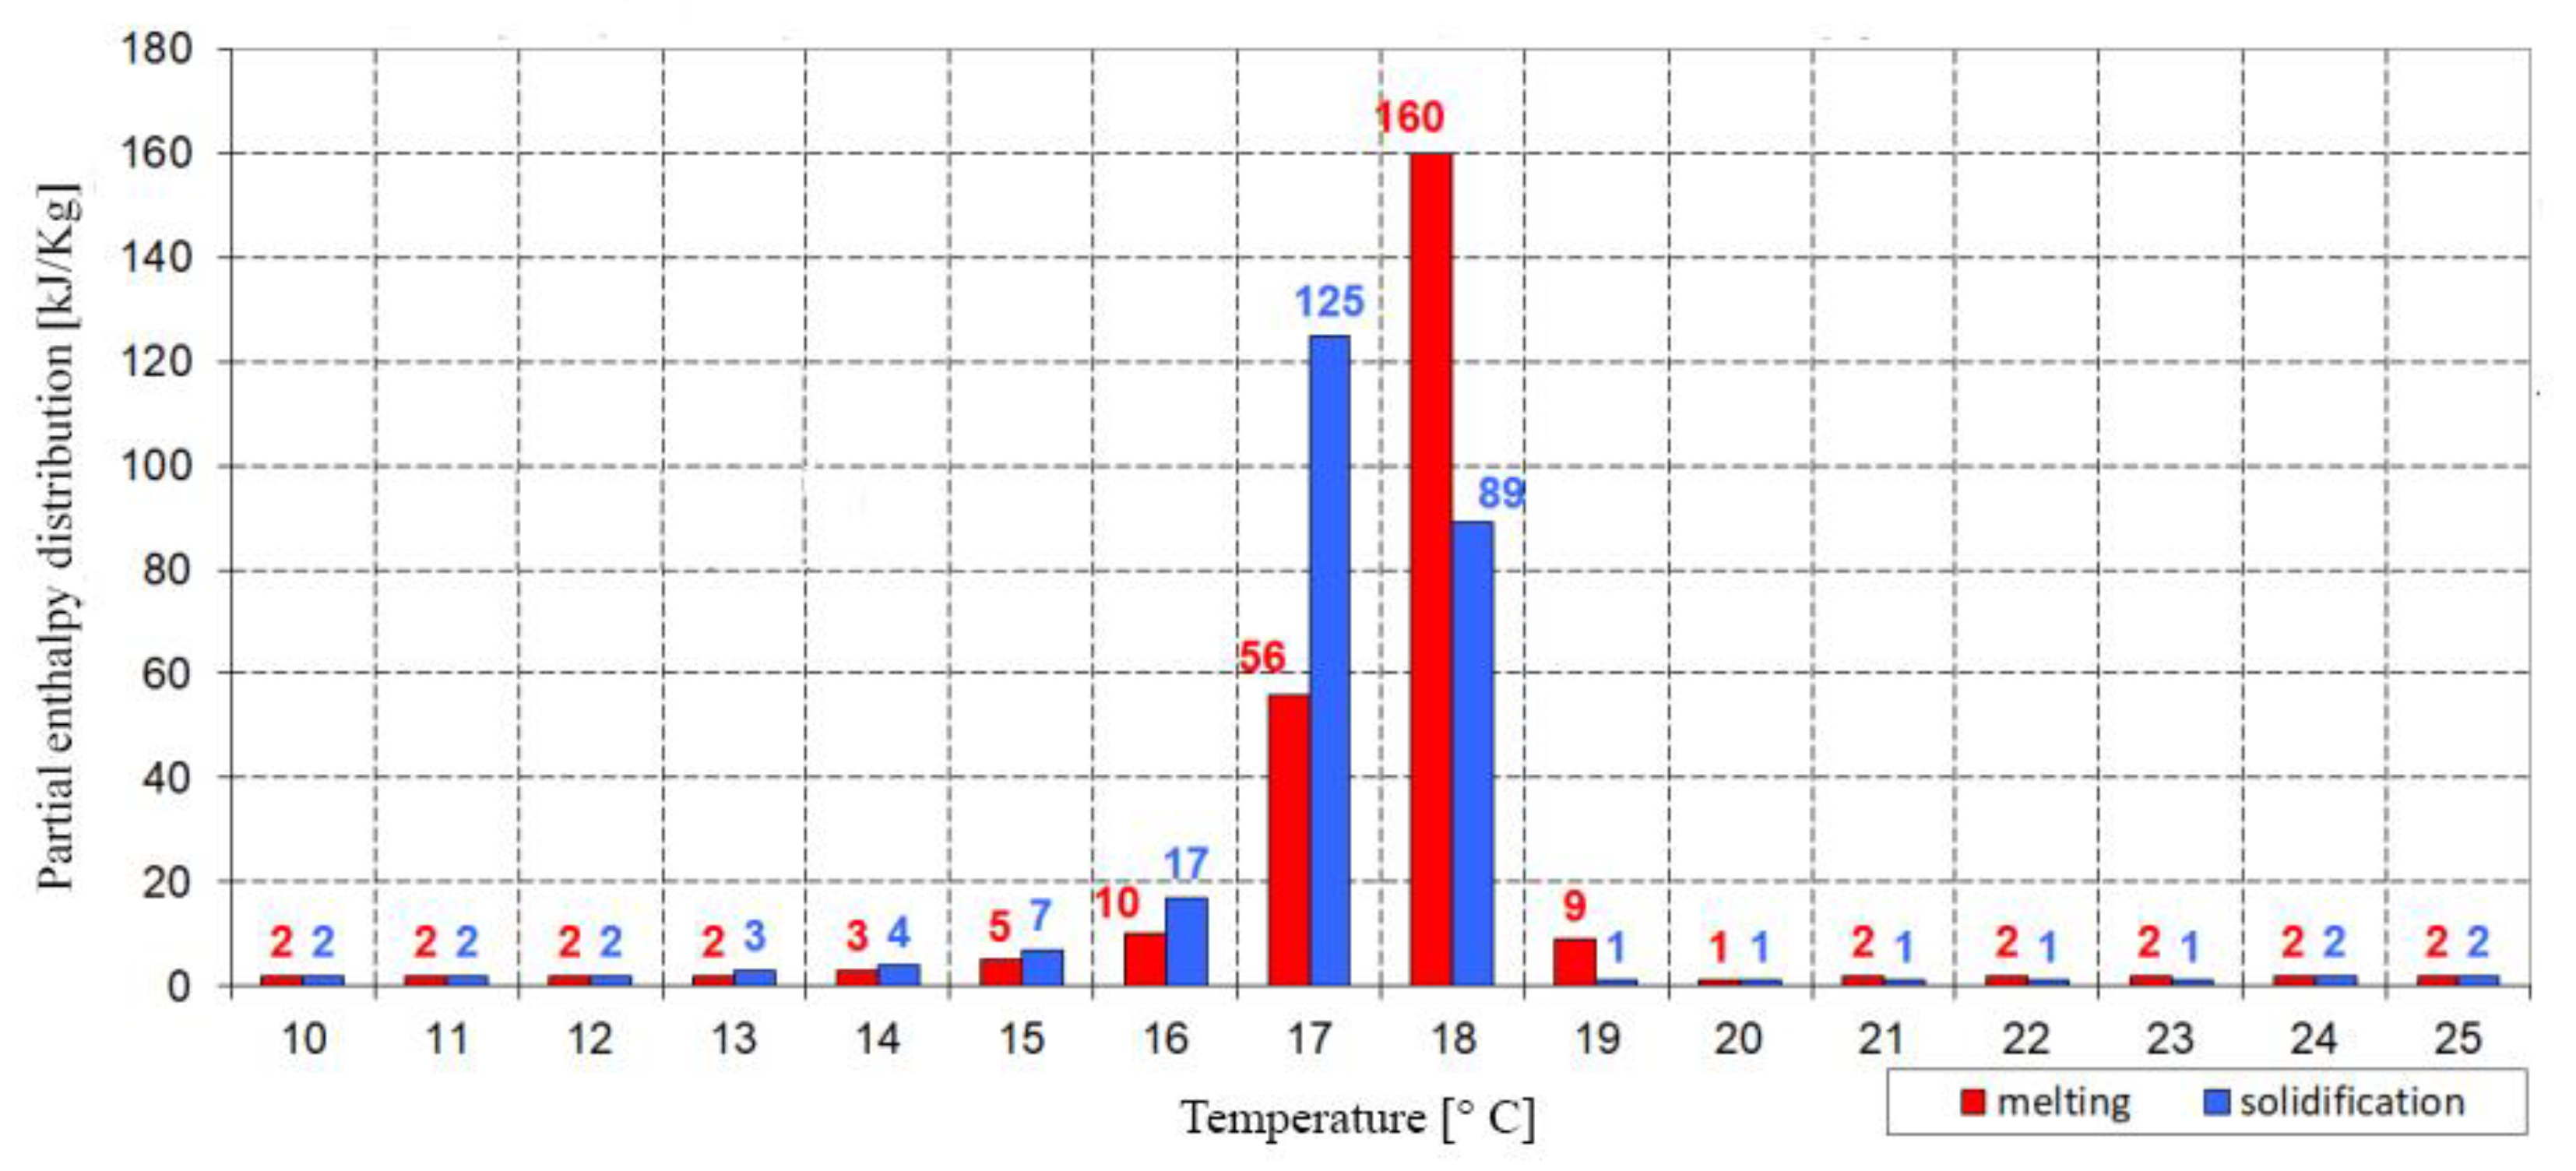
Figure 8.
(a) detail of the roof with PCM and (b) detail of external wall materials with PCM.
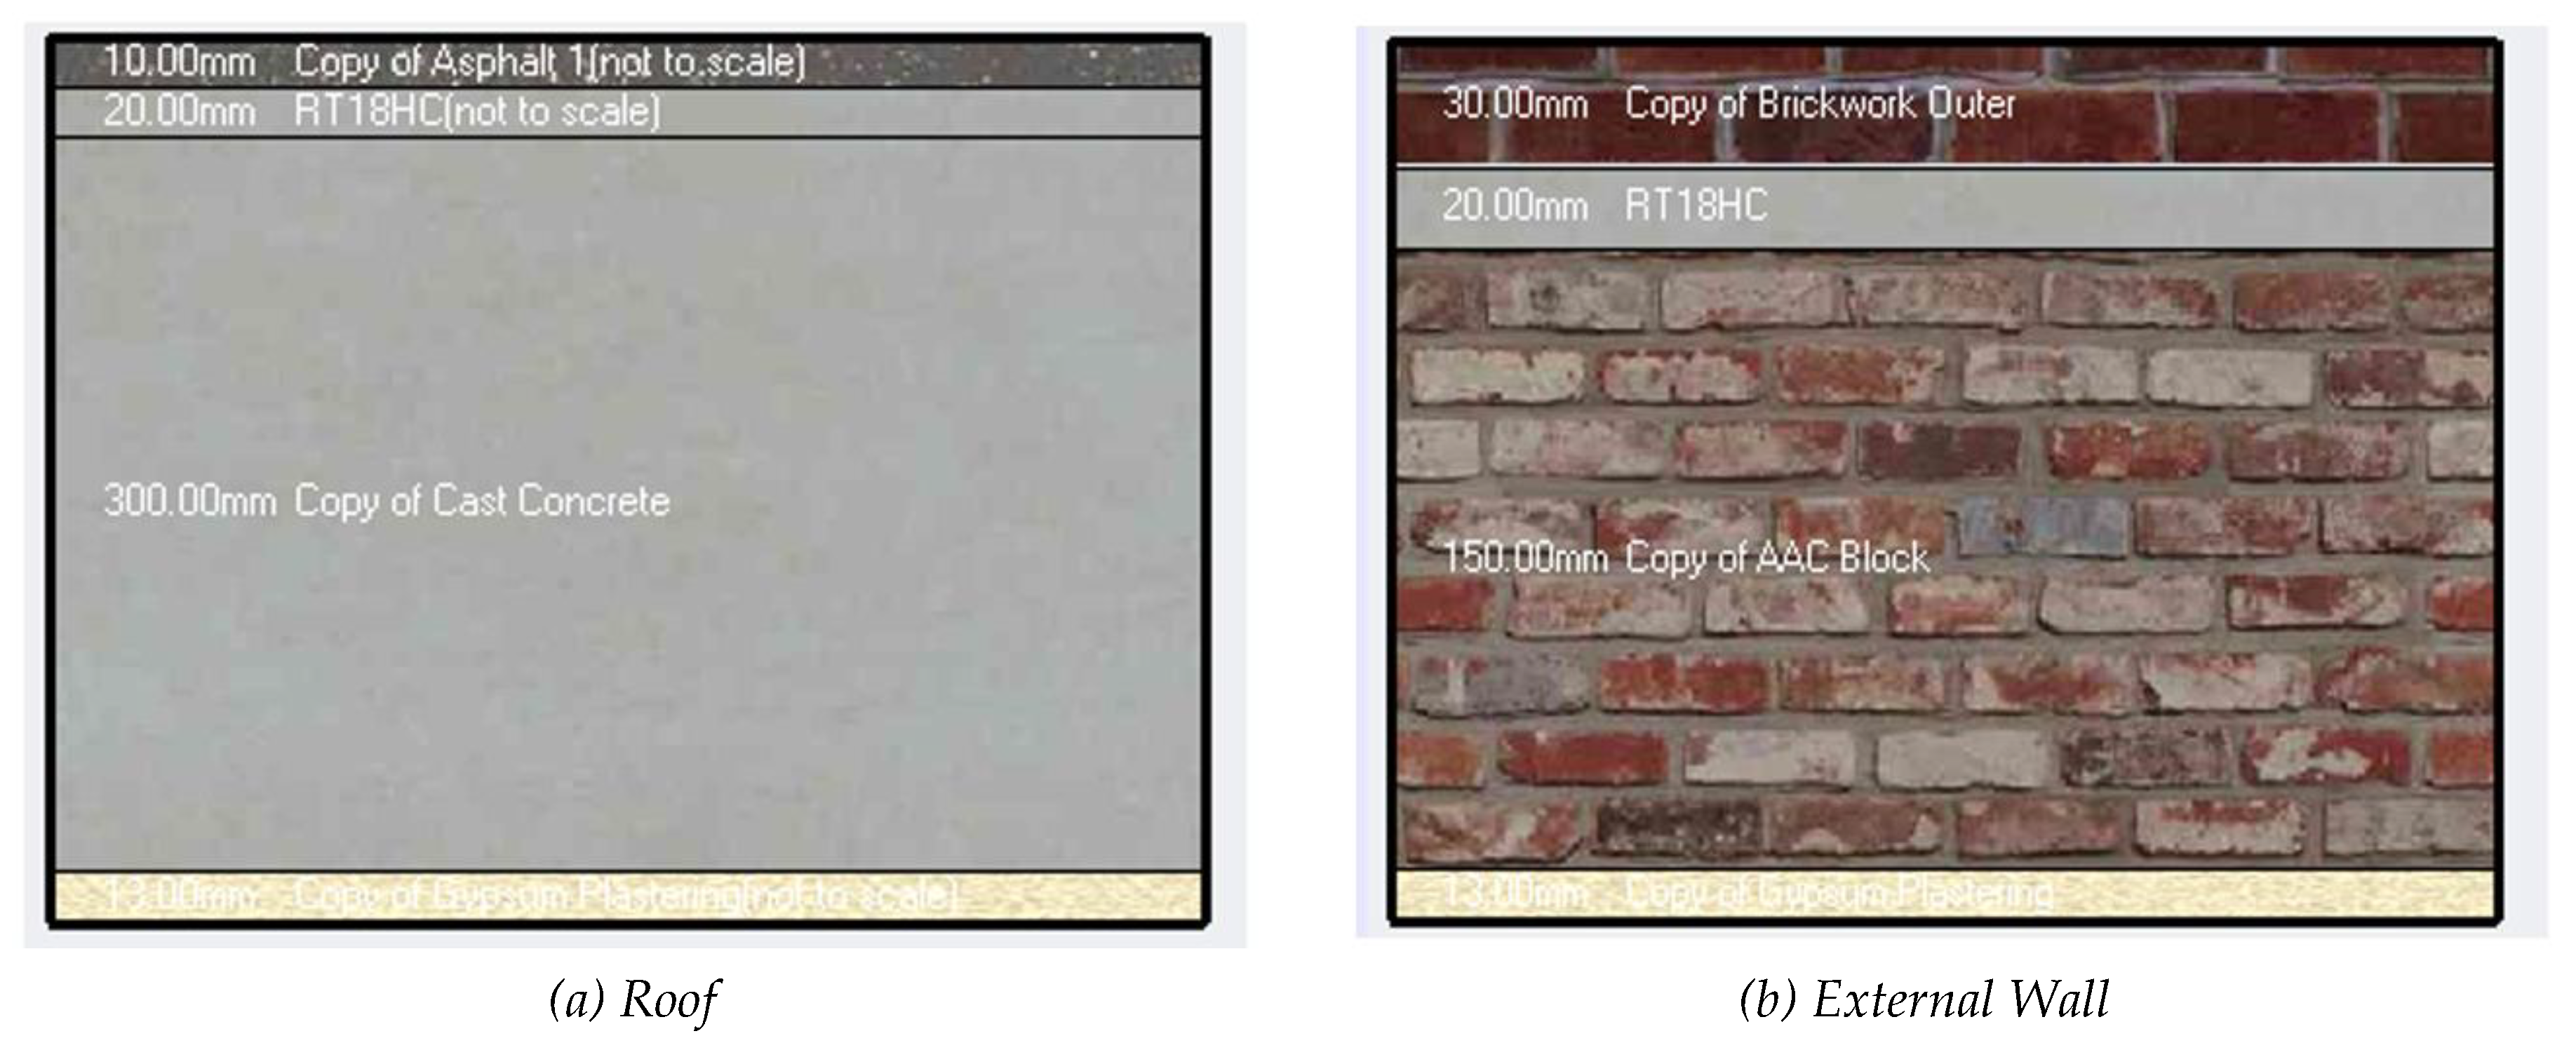
Figure 9.
(a) detail of the roof with a layer of nano paint and (b) detail of external wall materials with a layer of Nano paint.
Figure 9.
(a) detail of the roof with a layer of nano paint and (b) detail of external wall materials with a layer of Nano paint.
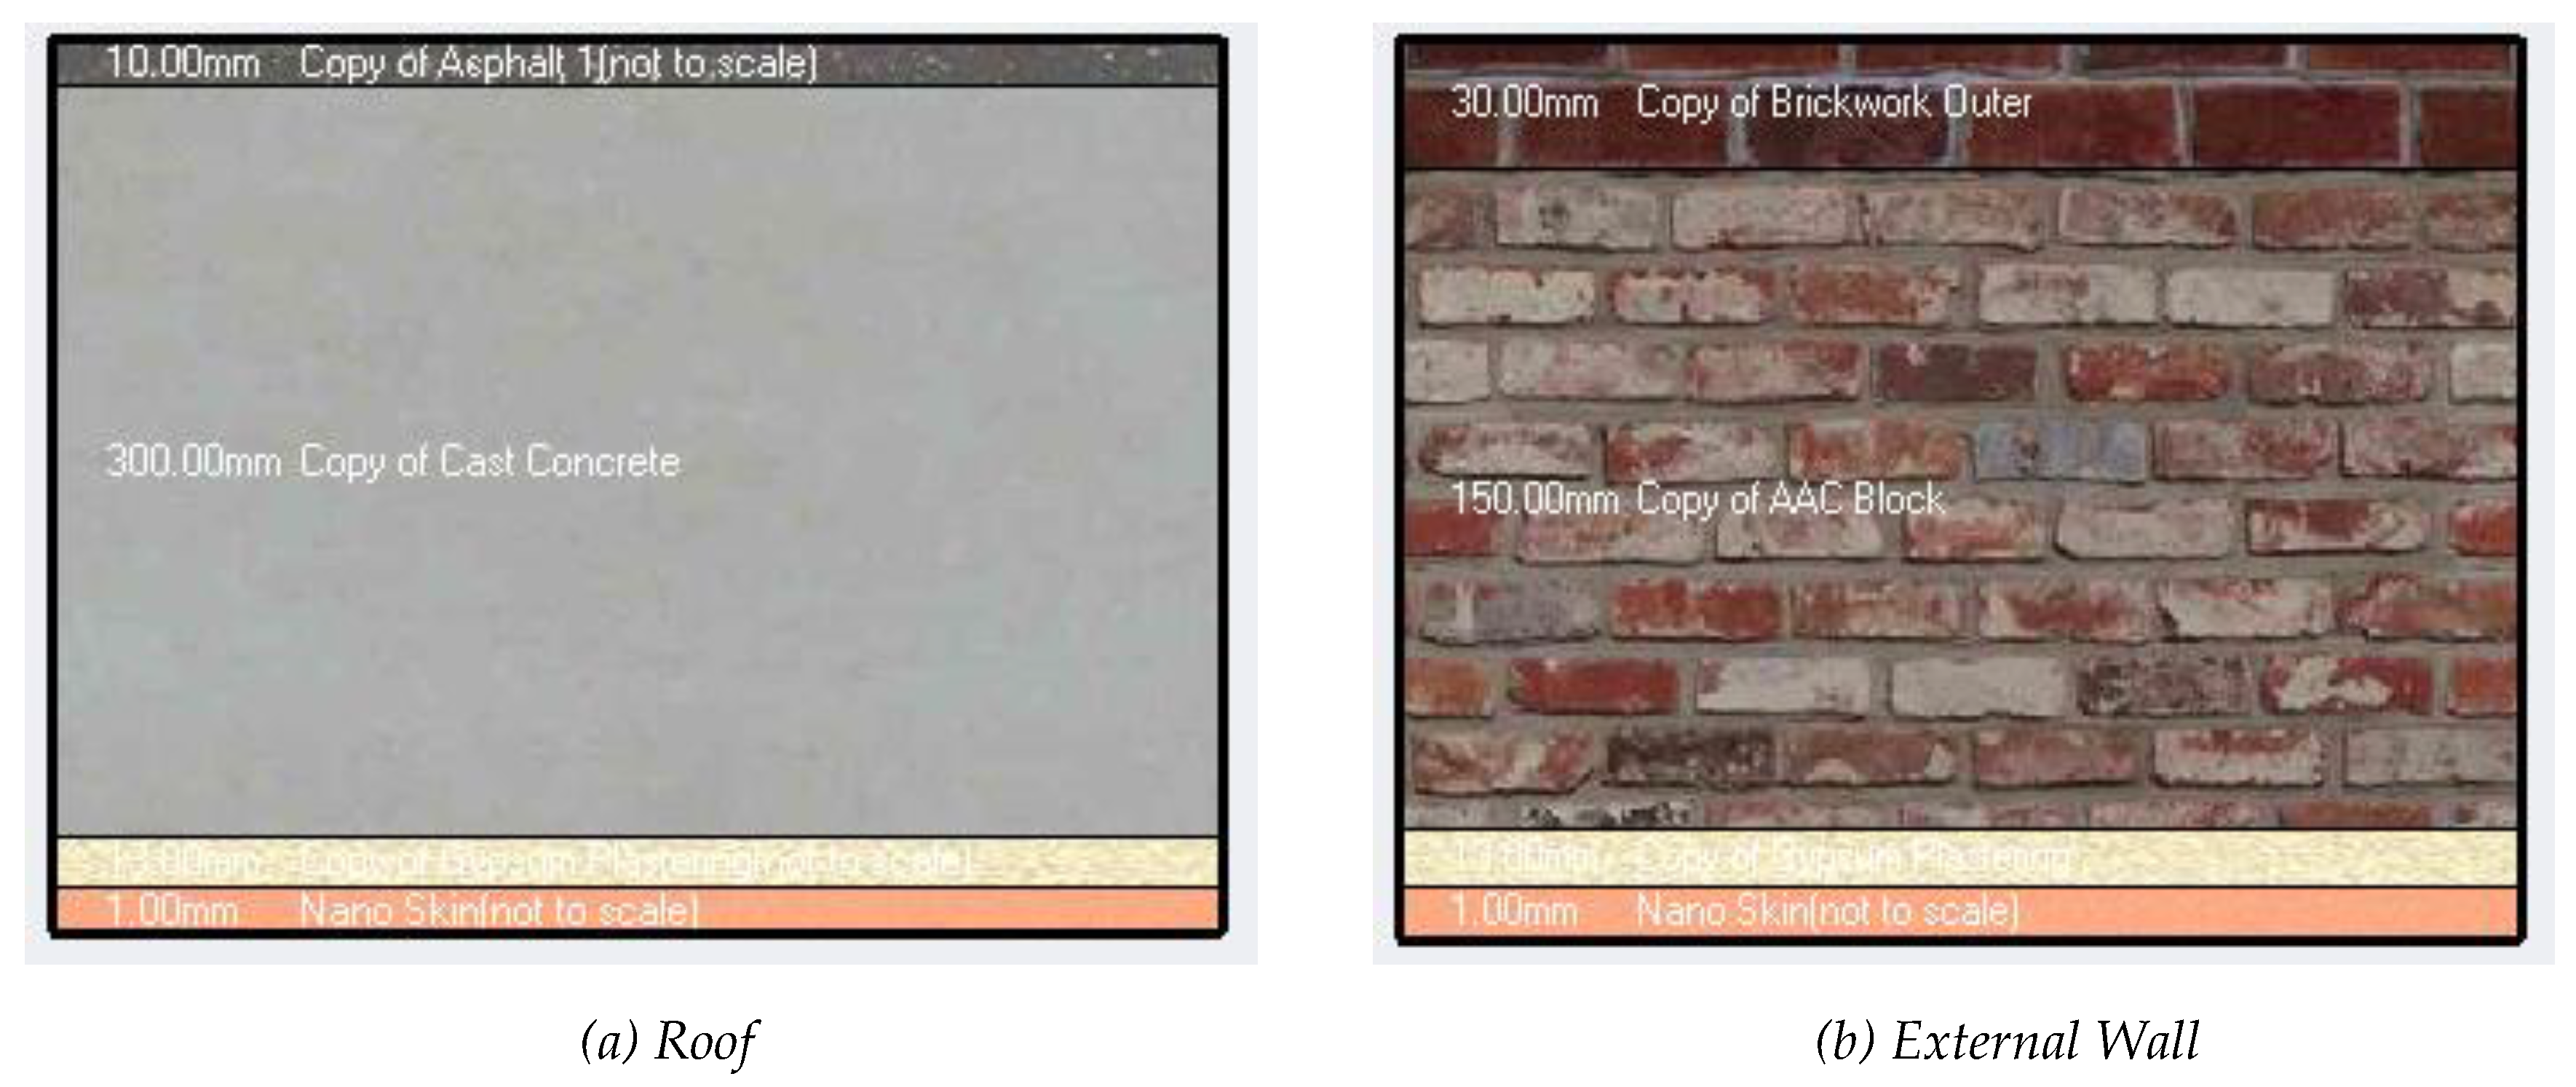
Figure 10.
General steps followed for energy simulation.
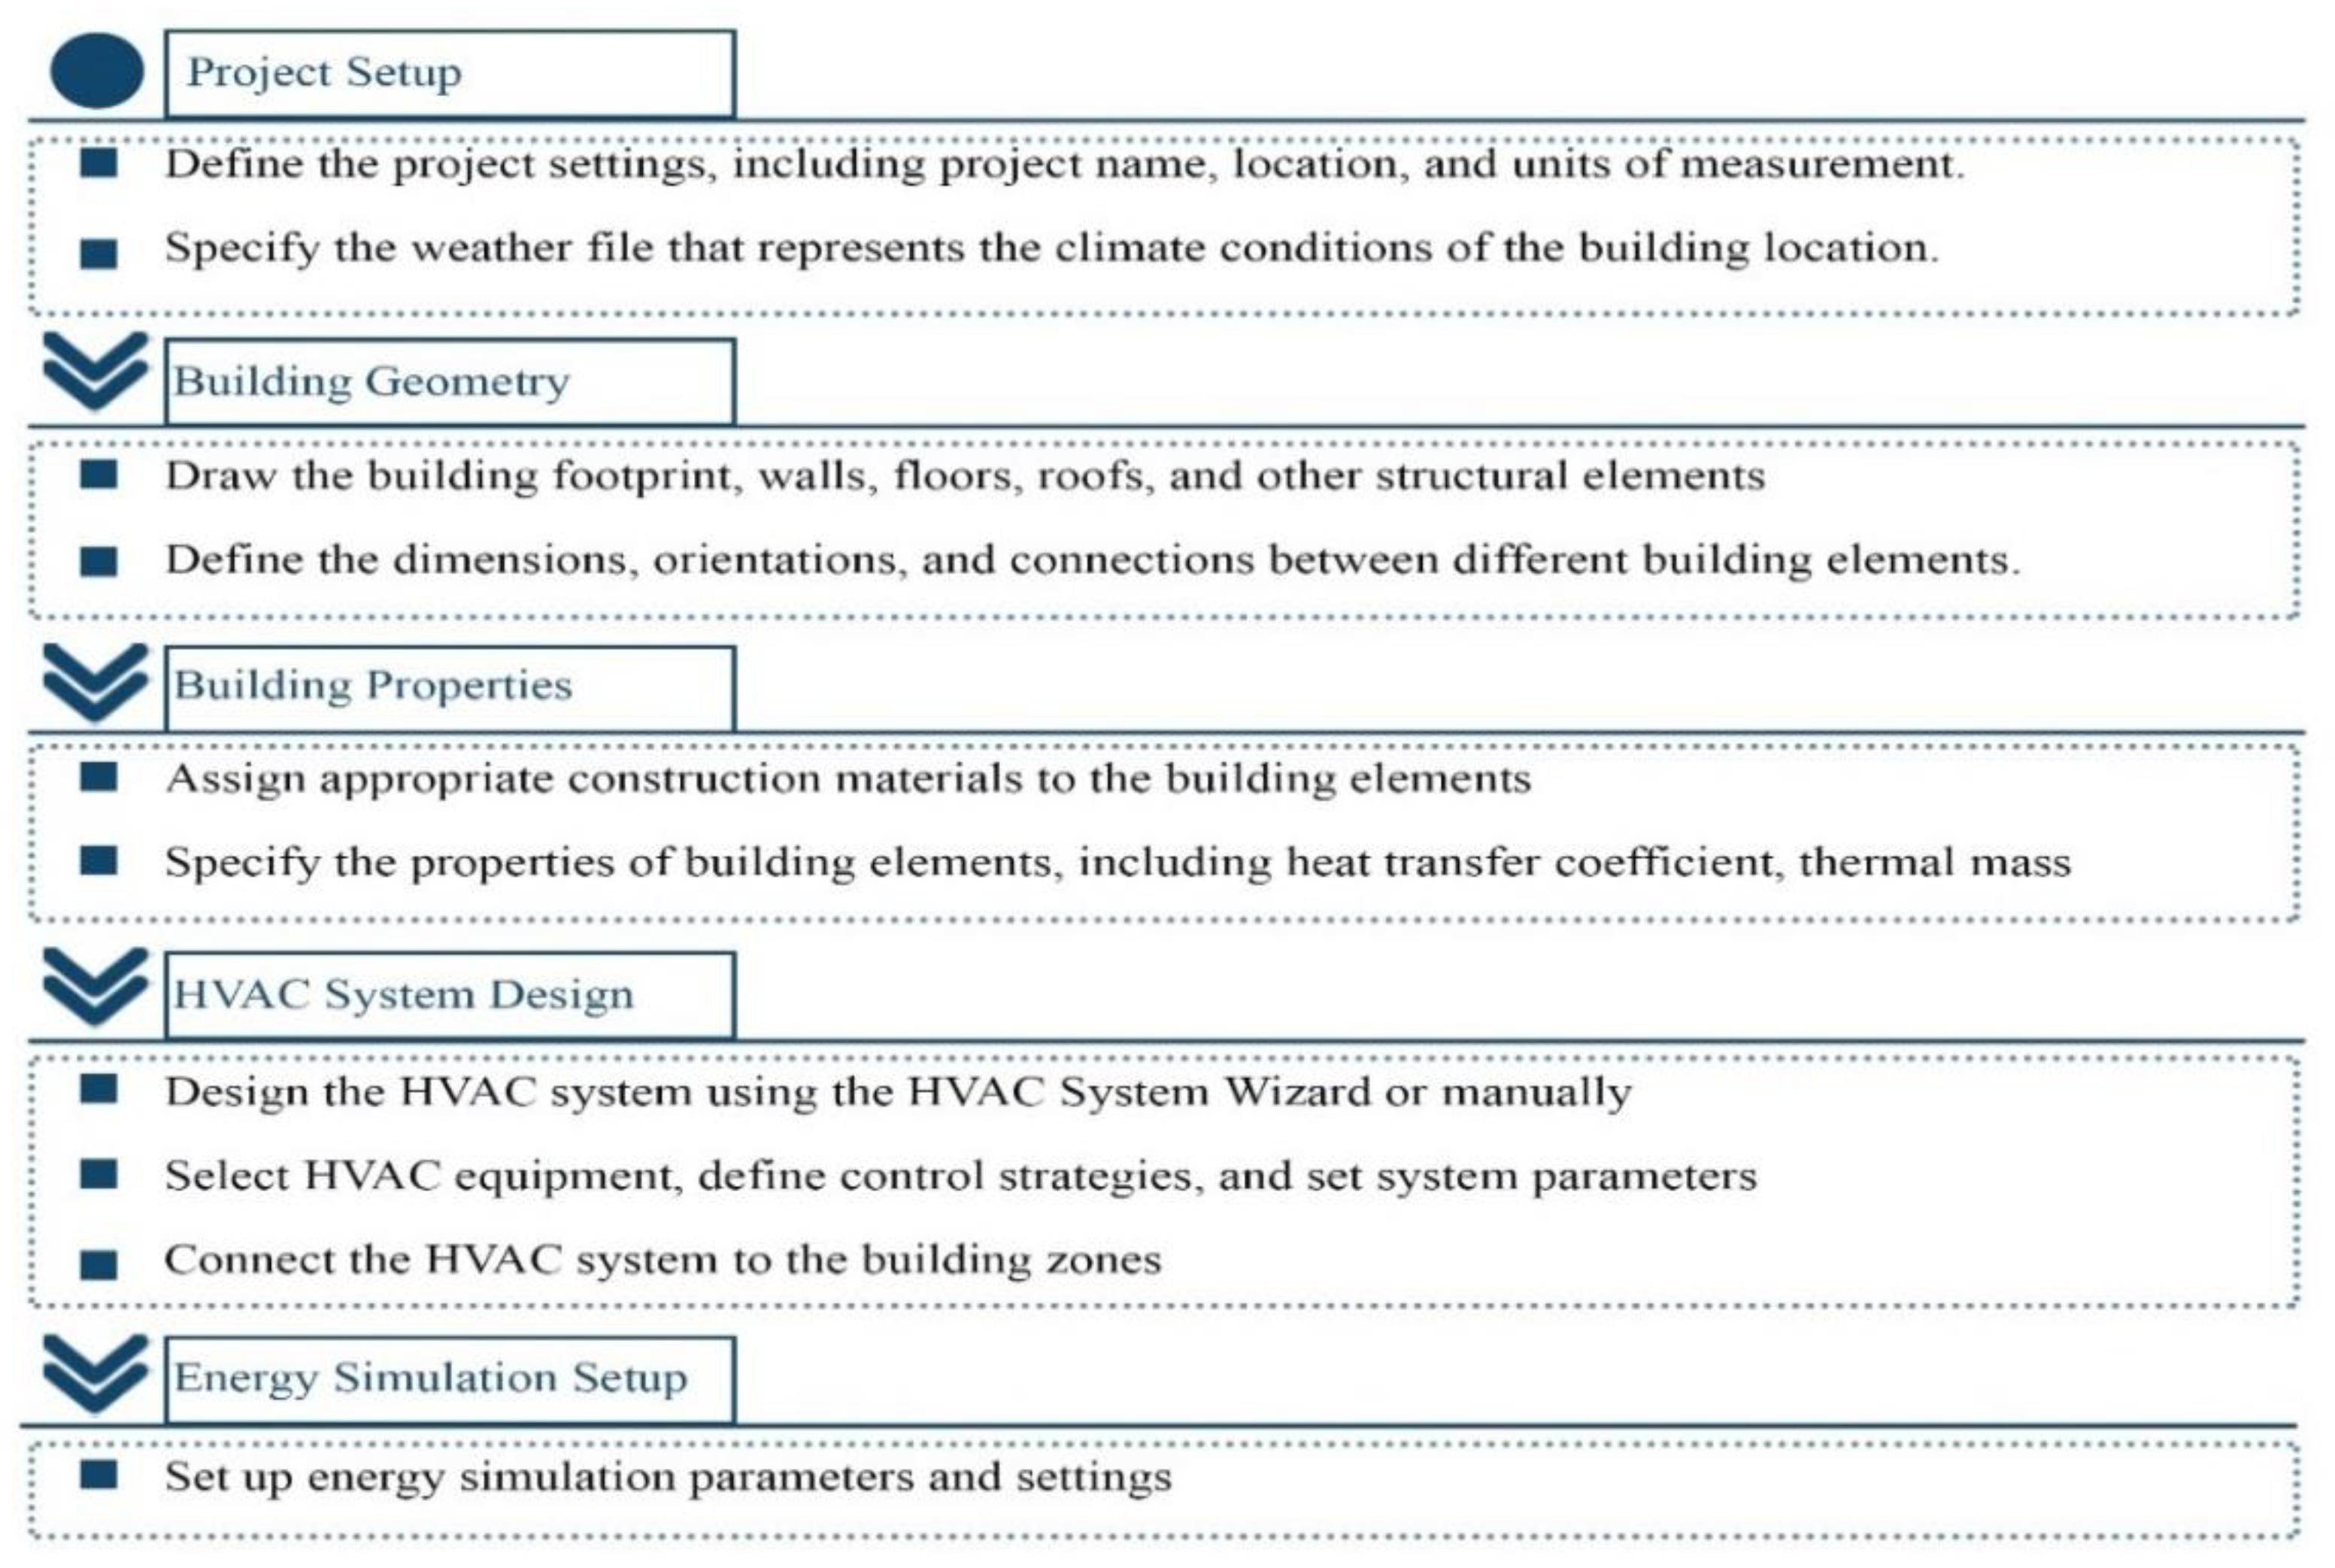
Figure 11.
Diurnal patterns of solar radiation of Mashhad, Iran.
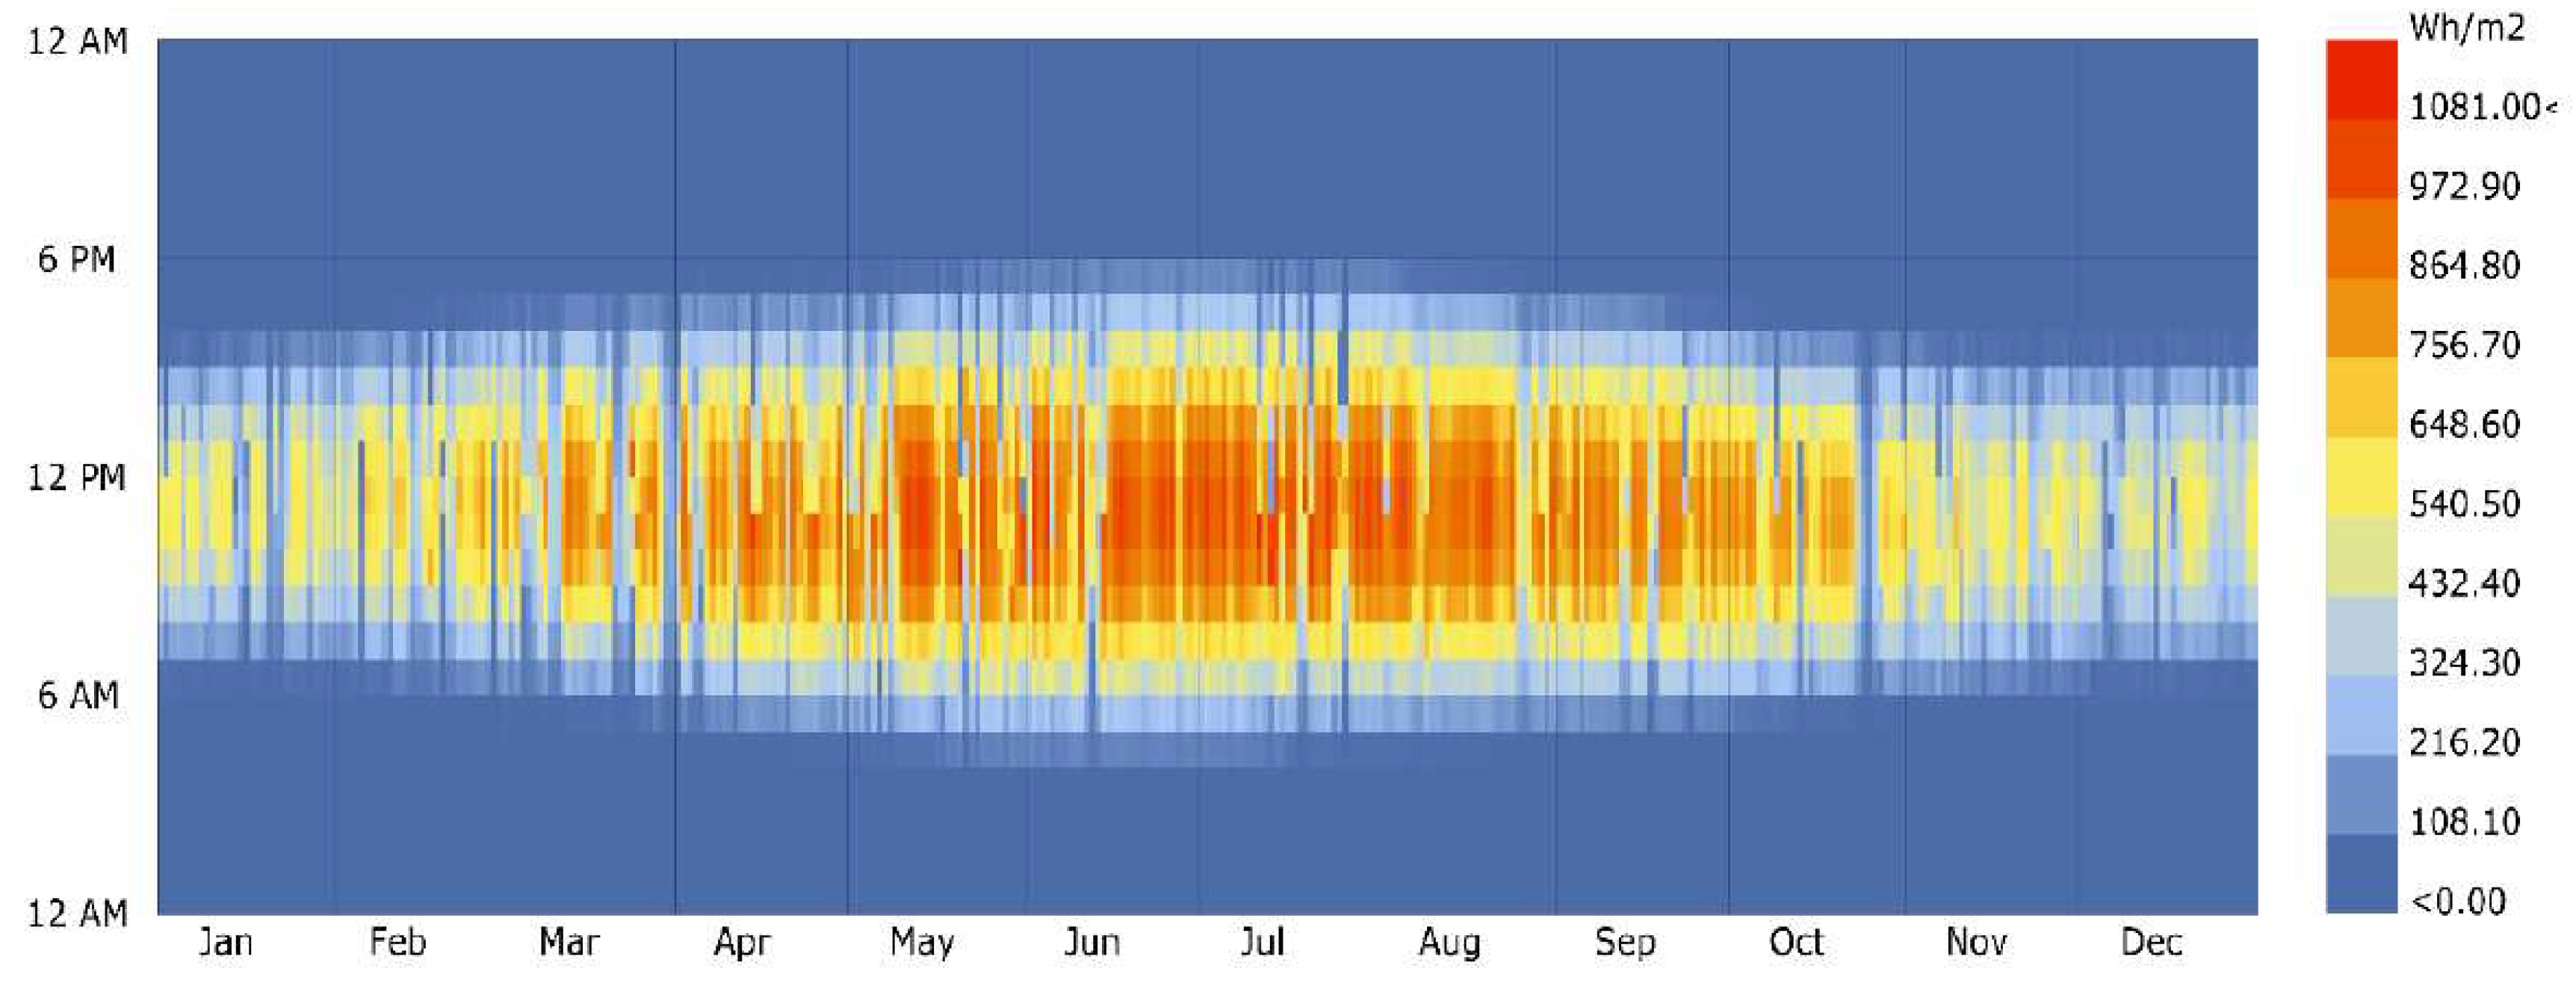
Figure 12.
Monthly average temperatures over a year in Mashhad, Iran.
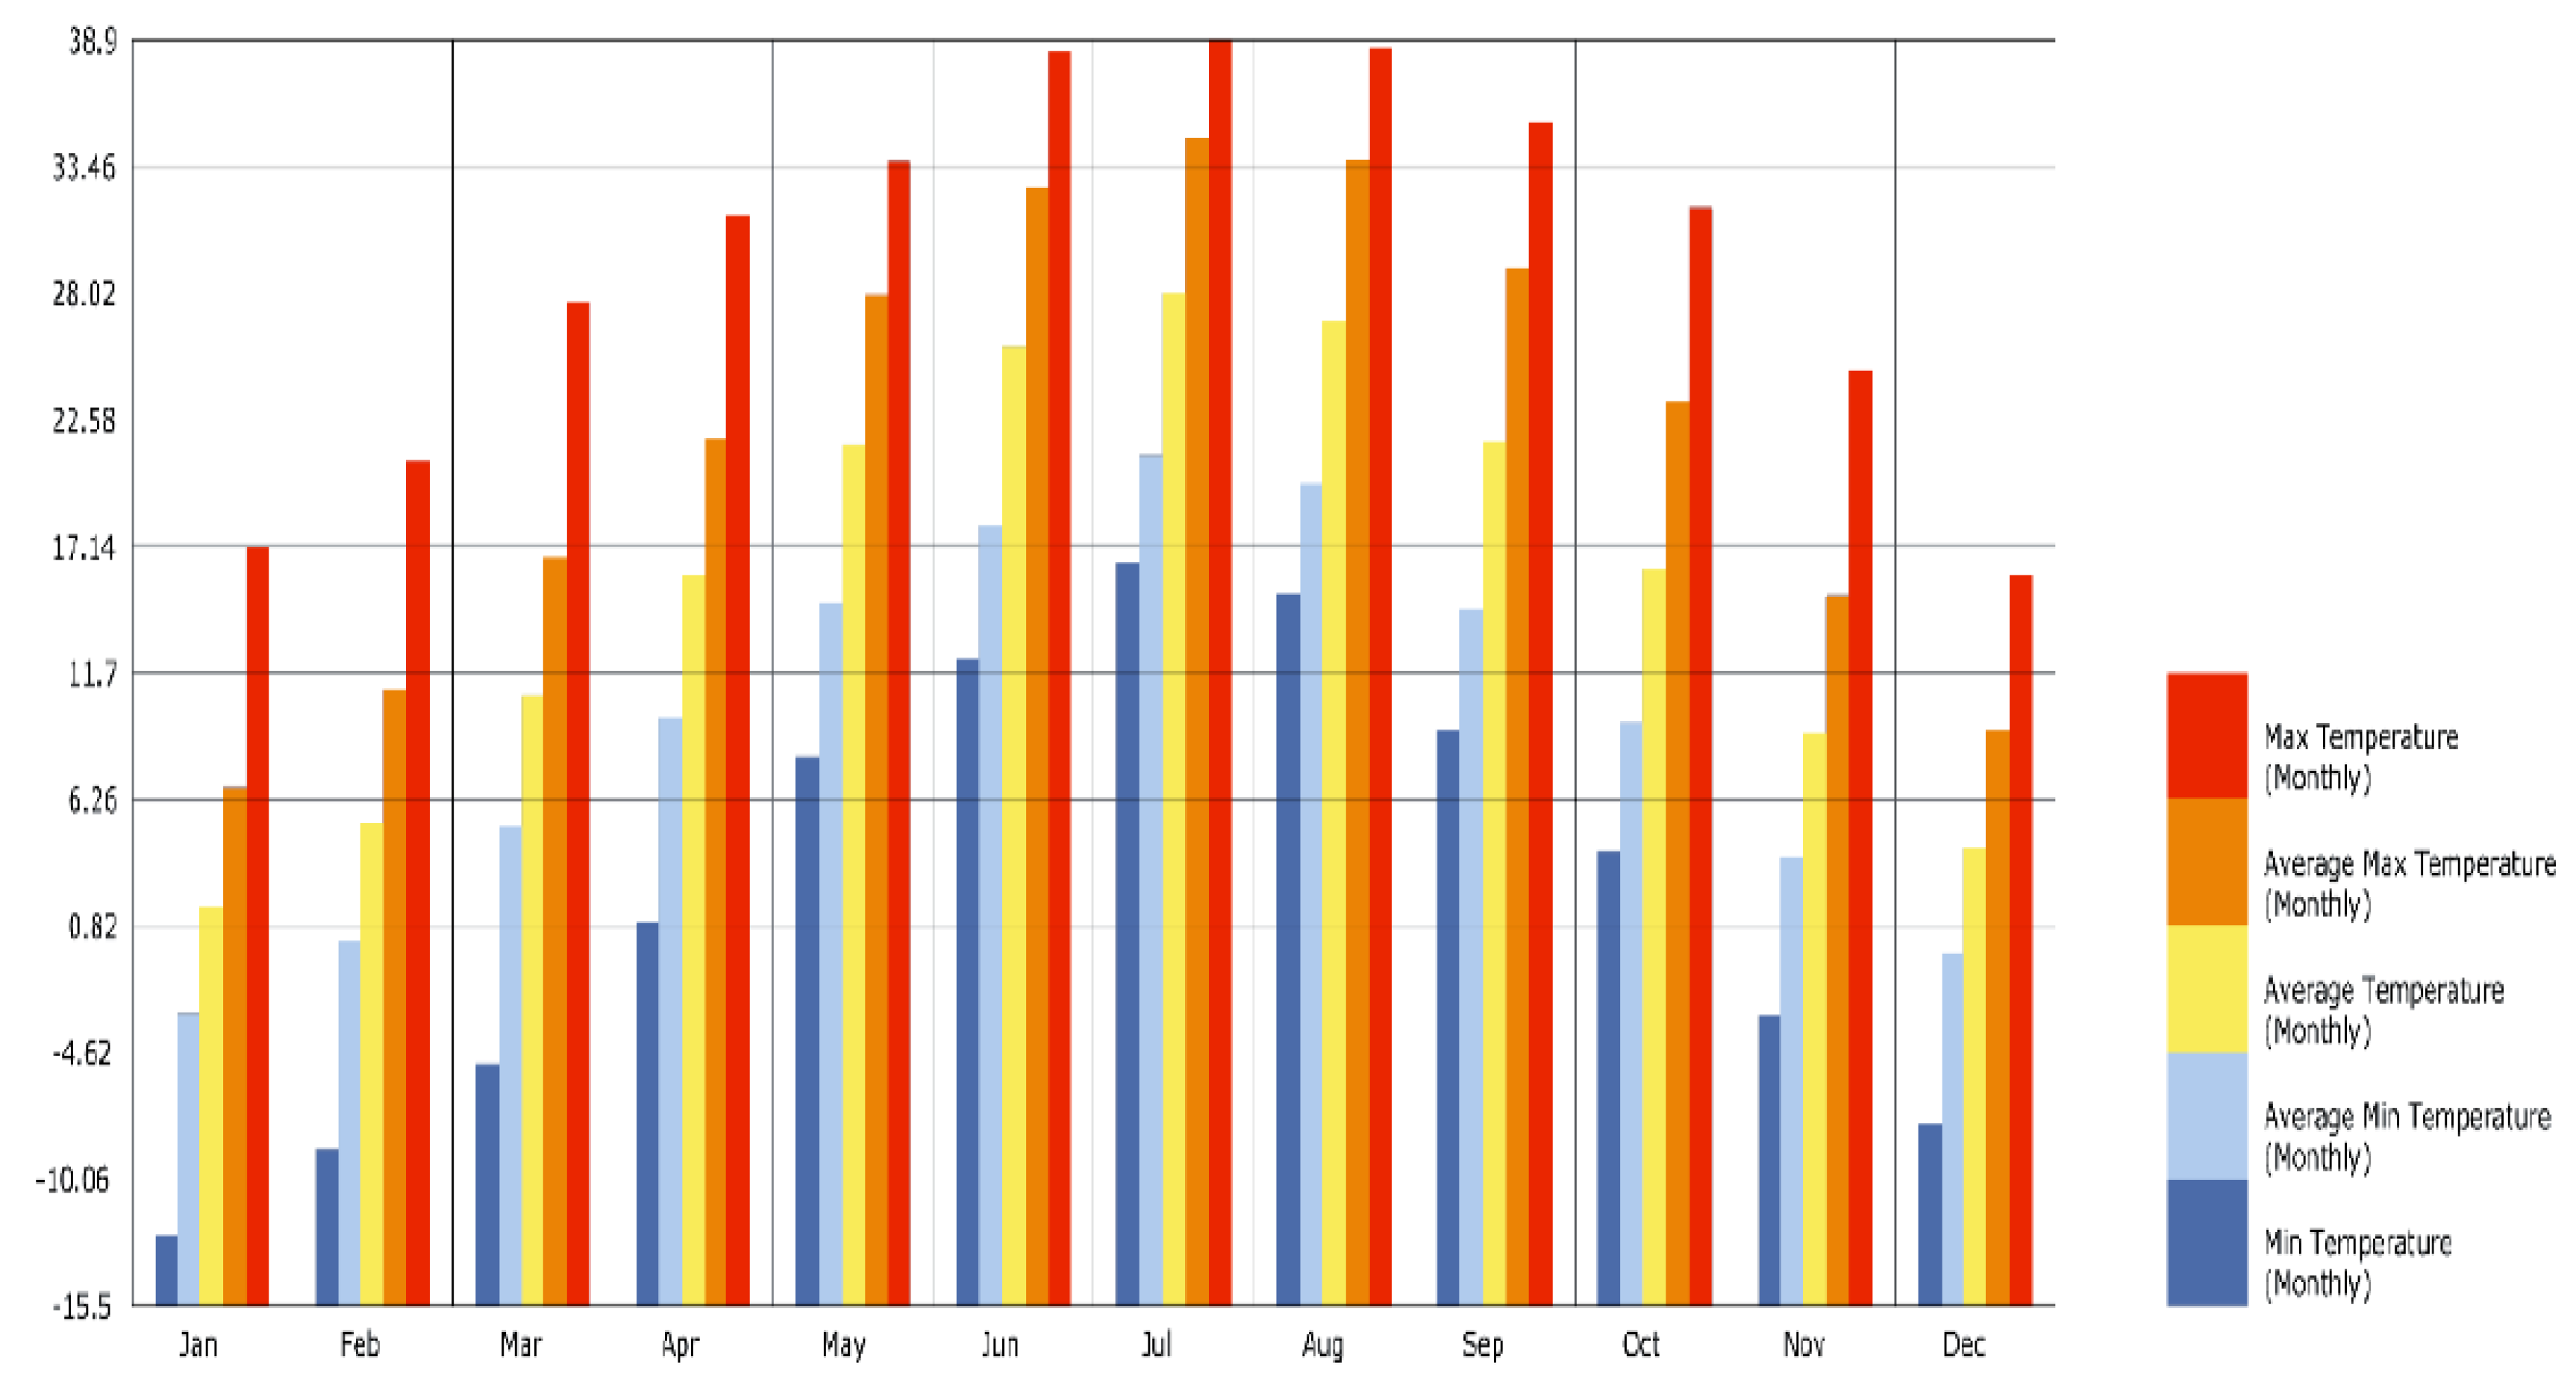
Figure 13.
Monthly average relative humidity of Mashhad, Iran.
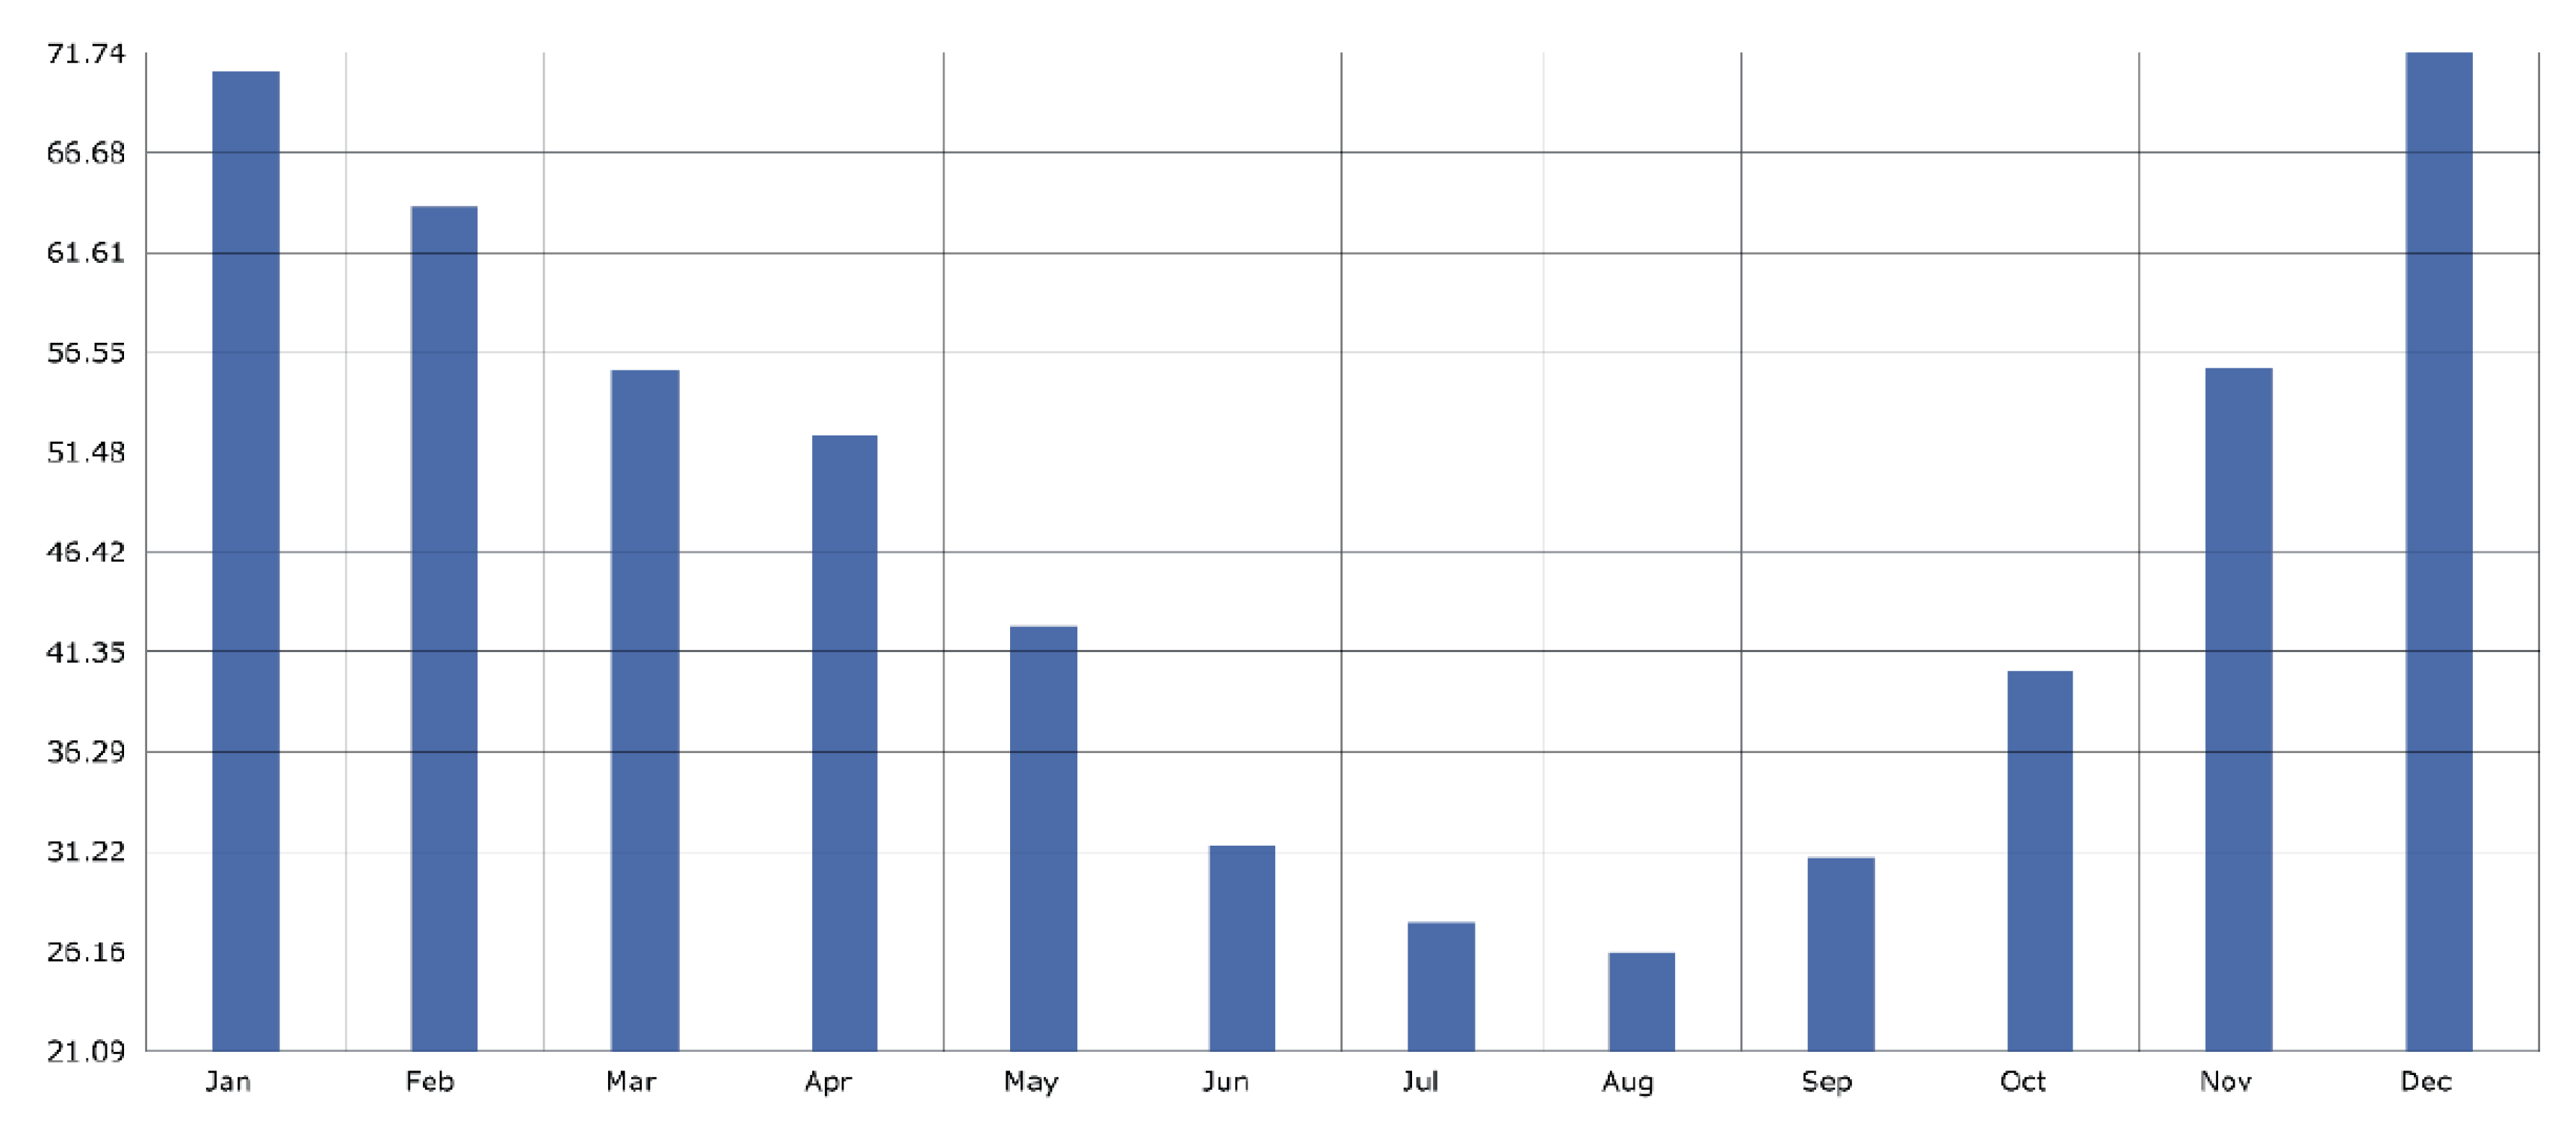
Figure 14.
Energy consumption outputs of the simulation based on electricity and gas resources (MWh) as per (a) external wall without thermal insulation, (b) external wall with a layer of RT18HC, and (c) external wall with a layer of Nano paint.
Figure 14.
Energy consumption outputs of the simulation based on electricity and gas resources (MWh) as per (a) external wall without thermal insulation, (b) external wall with a layer of RT18HC, and (c) external wall with a layer of Nano paint.
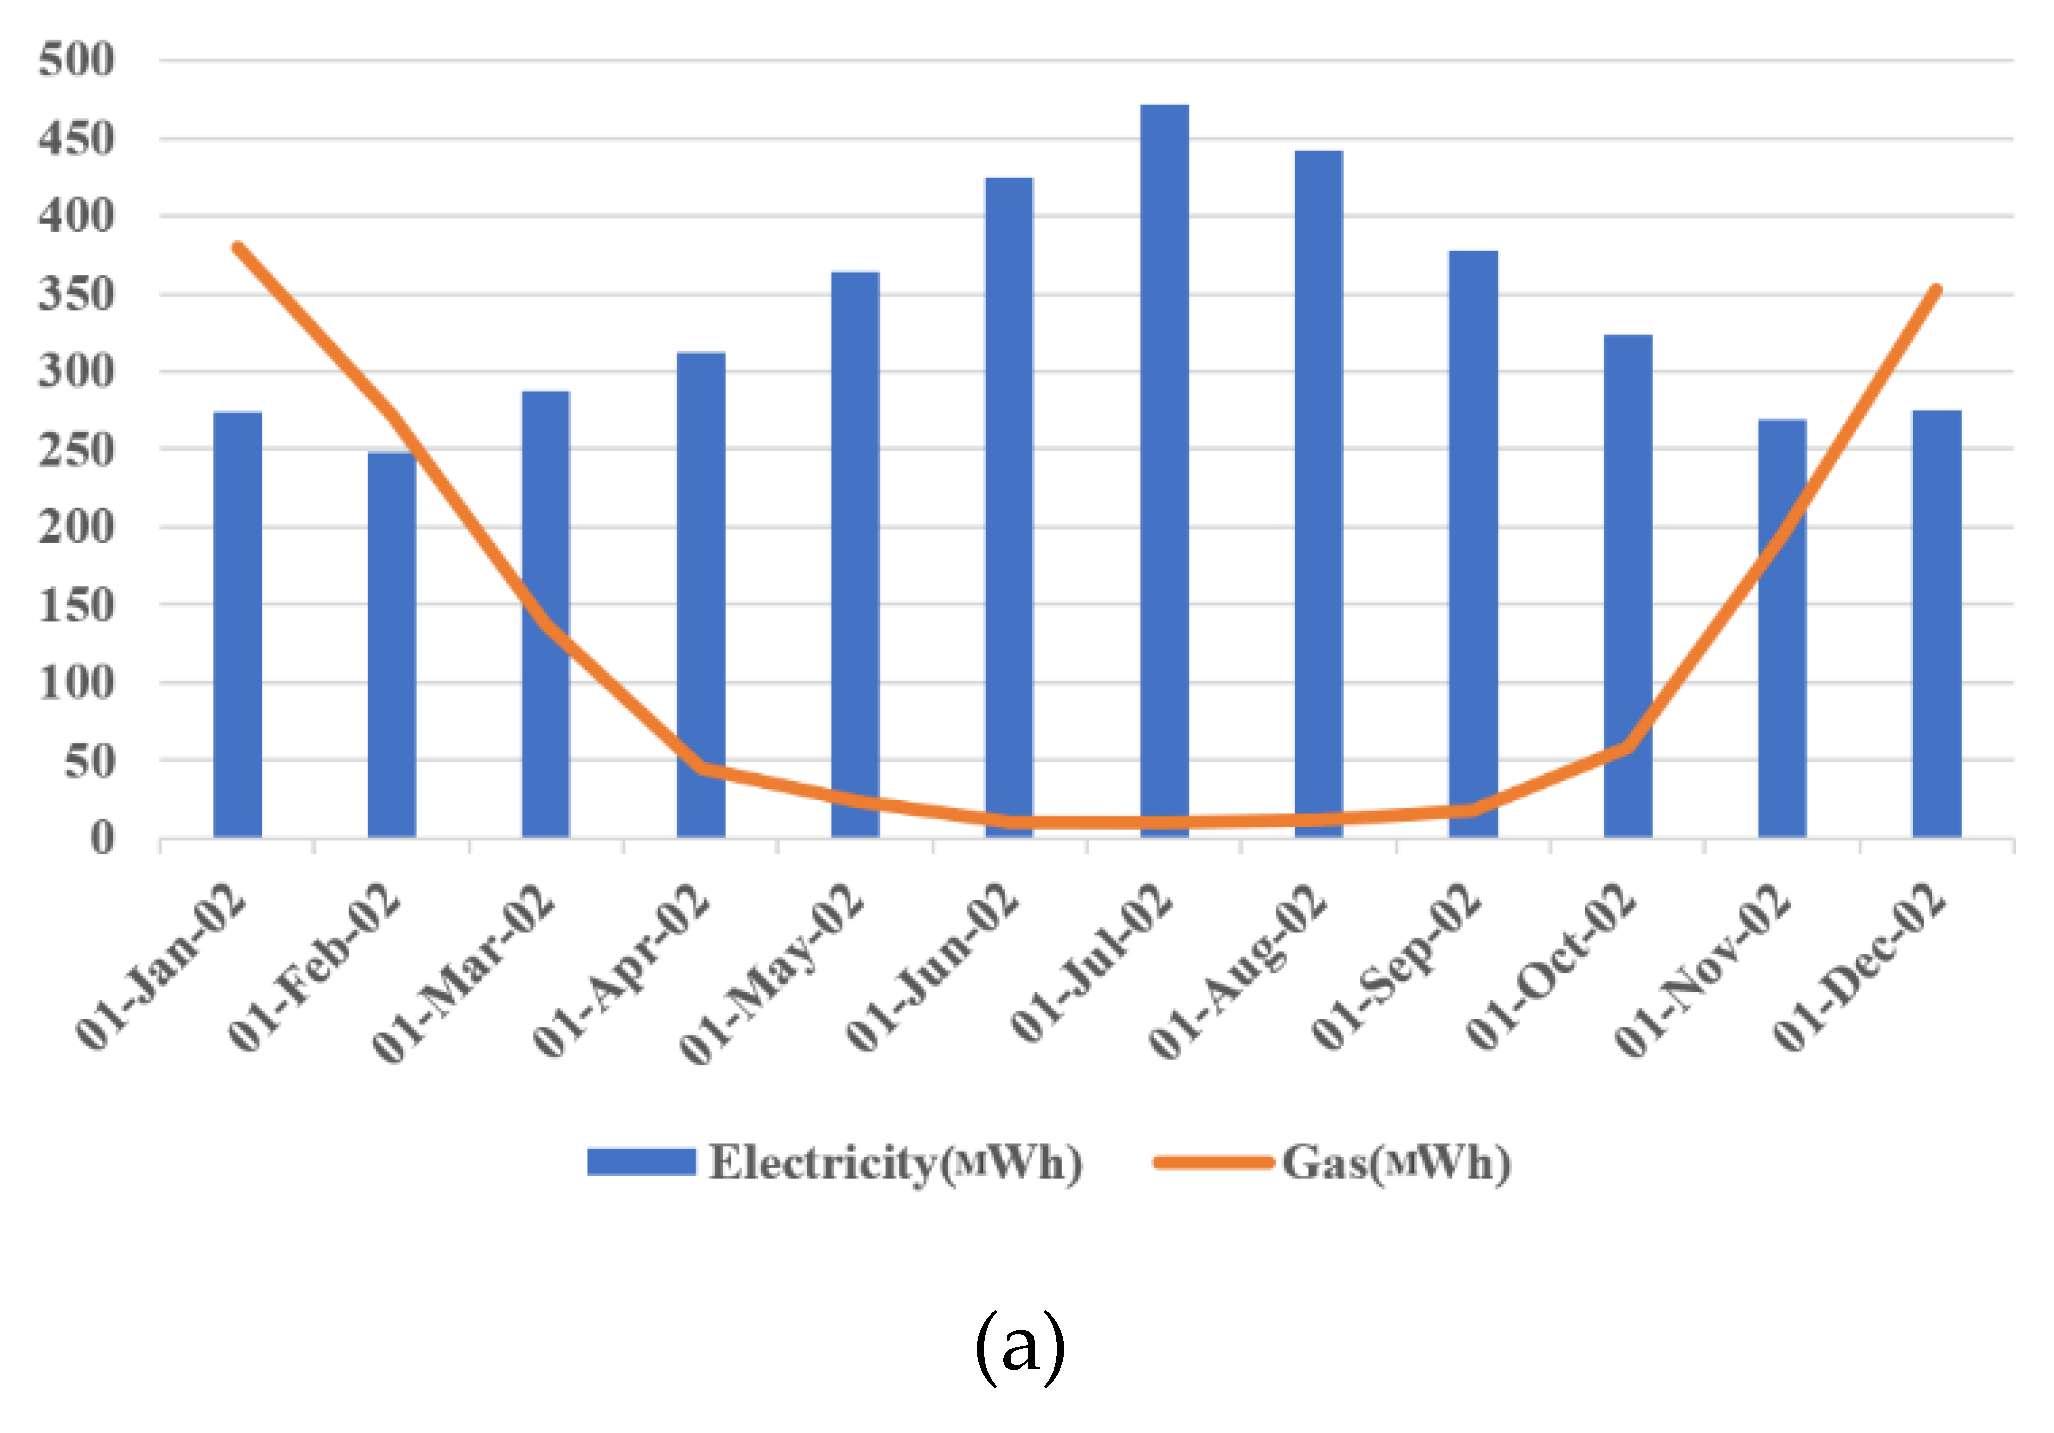
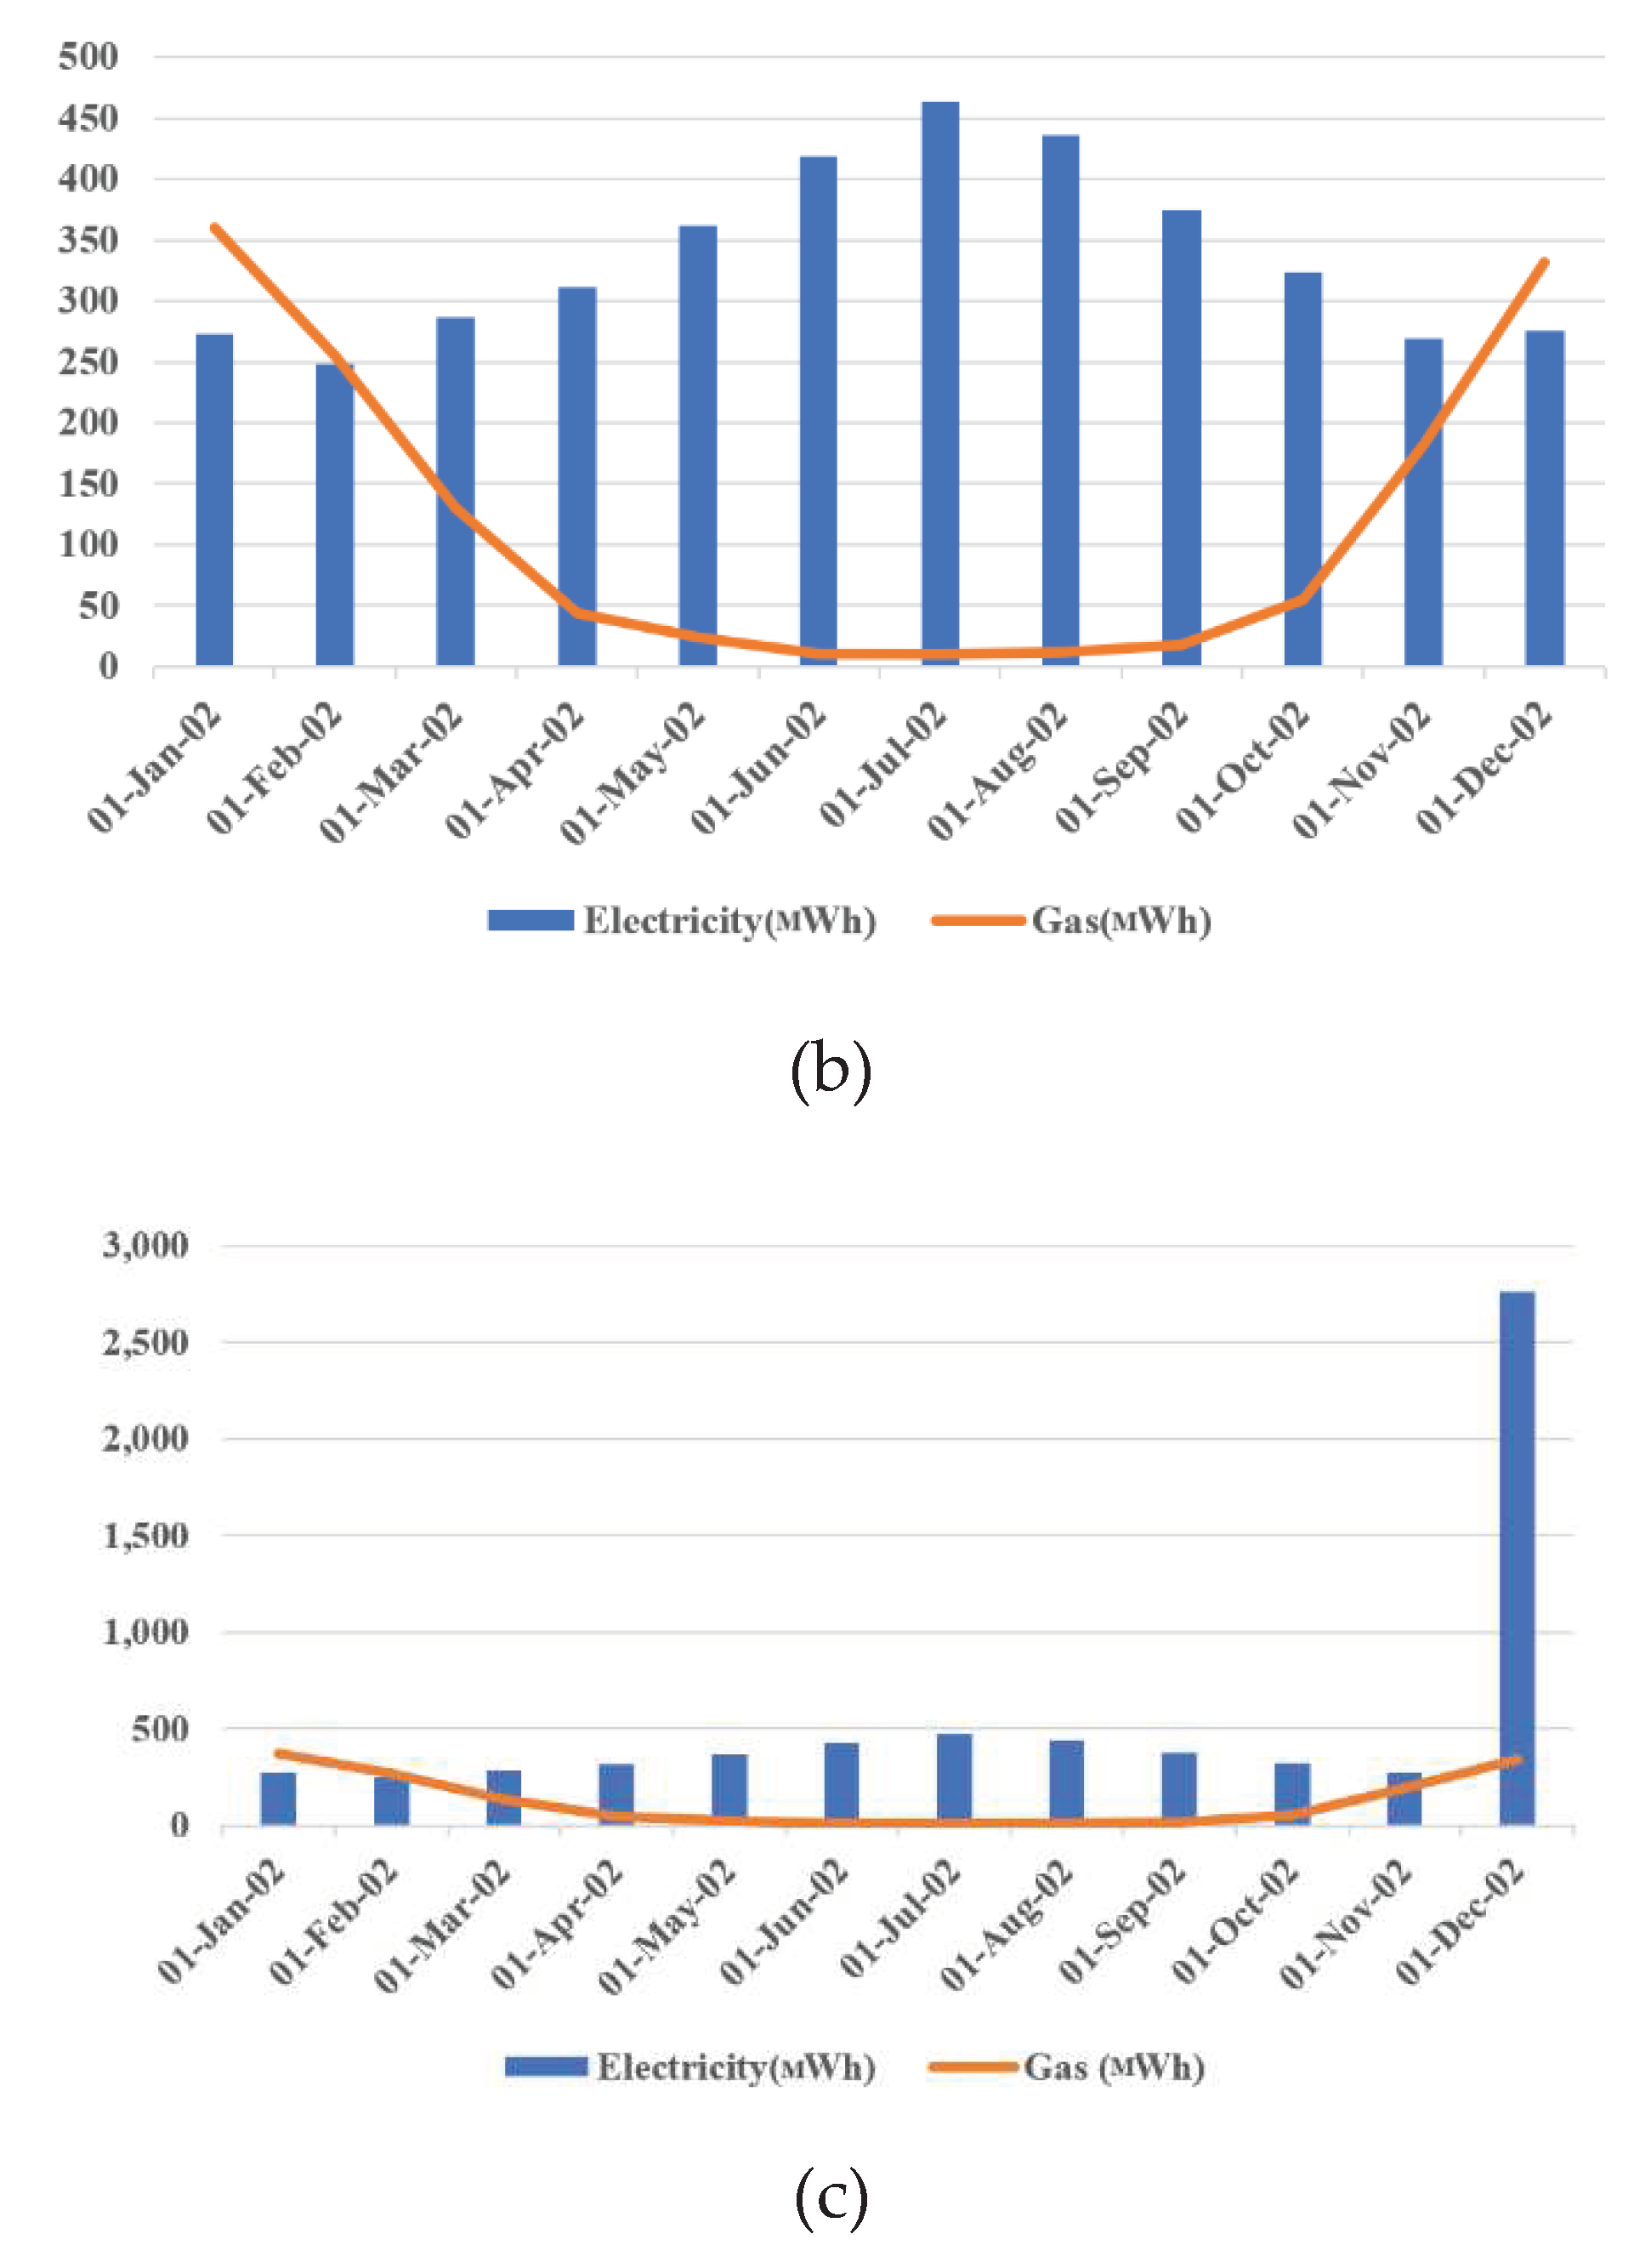
Figure 15.
Yearly electrical energy consumption utilizing phase-change materials.
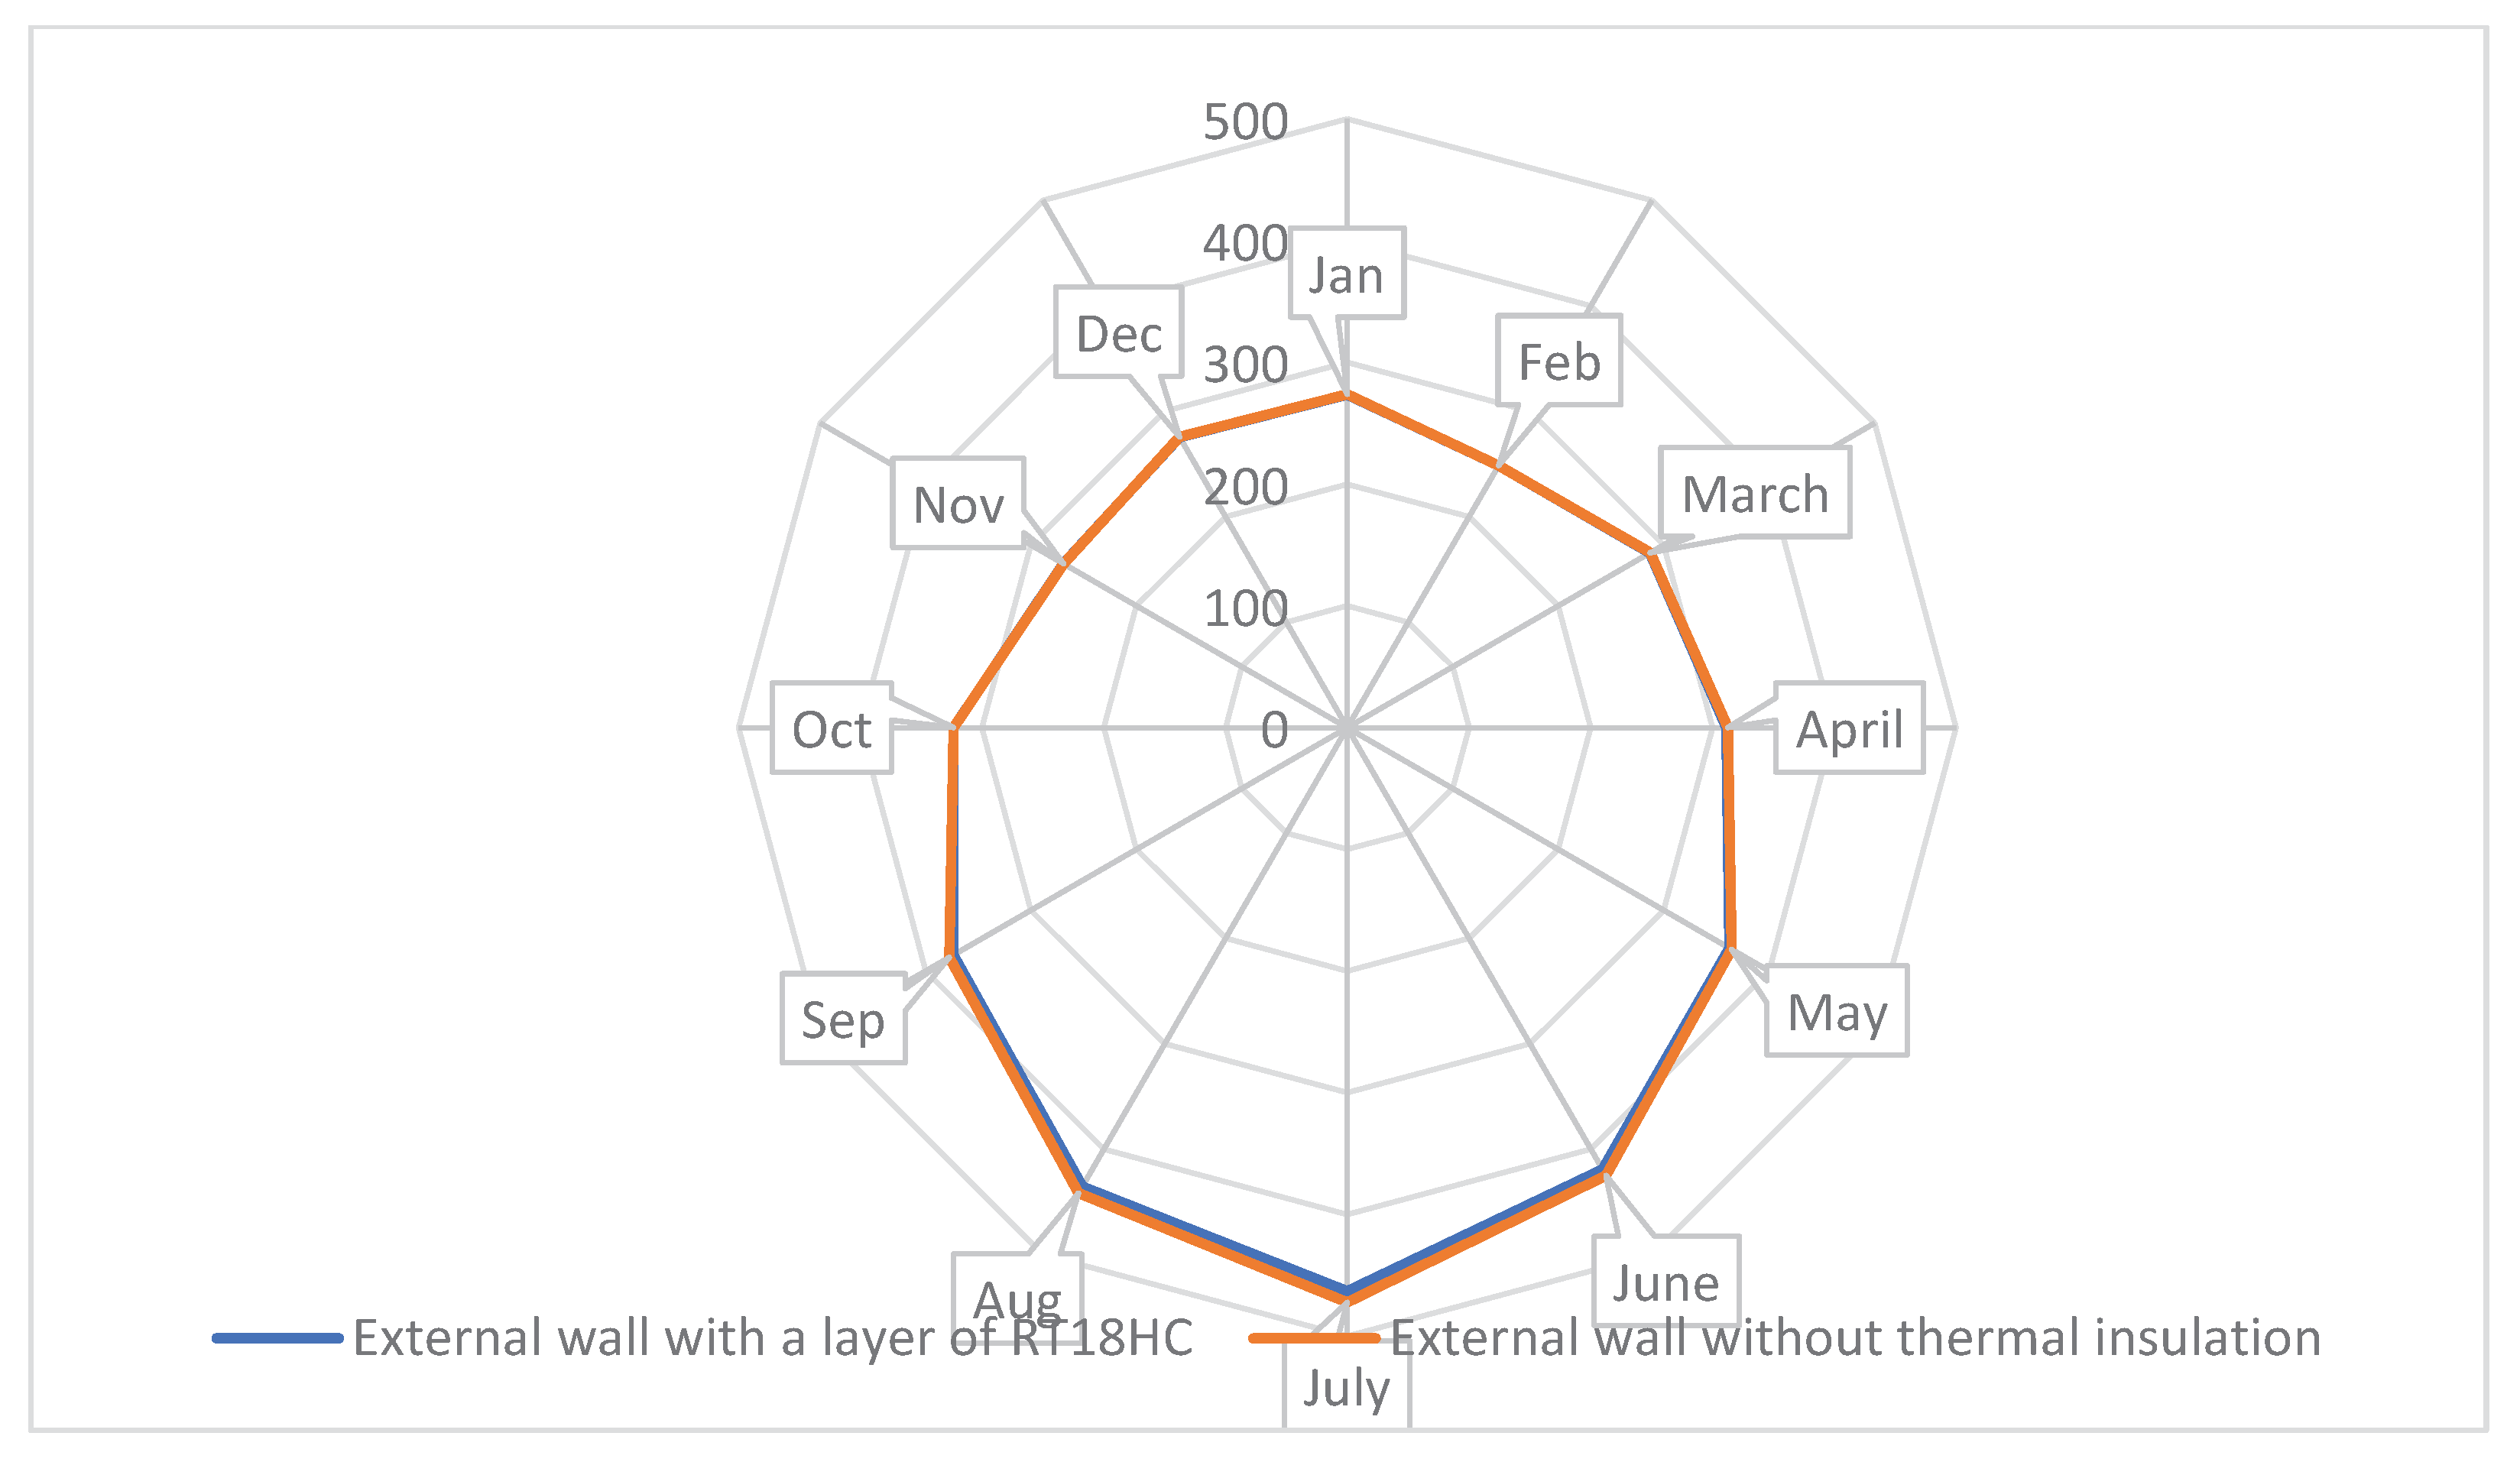
Figure 16.
Yearly gas energy consumption utilizing phase-change materials.
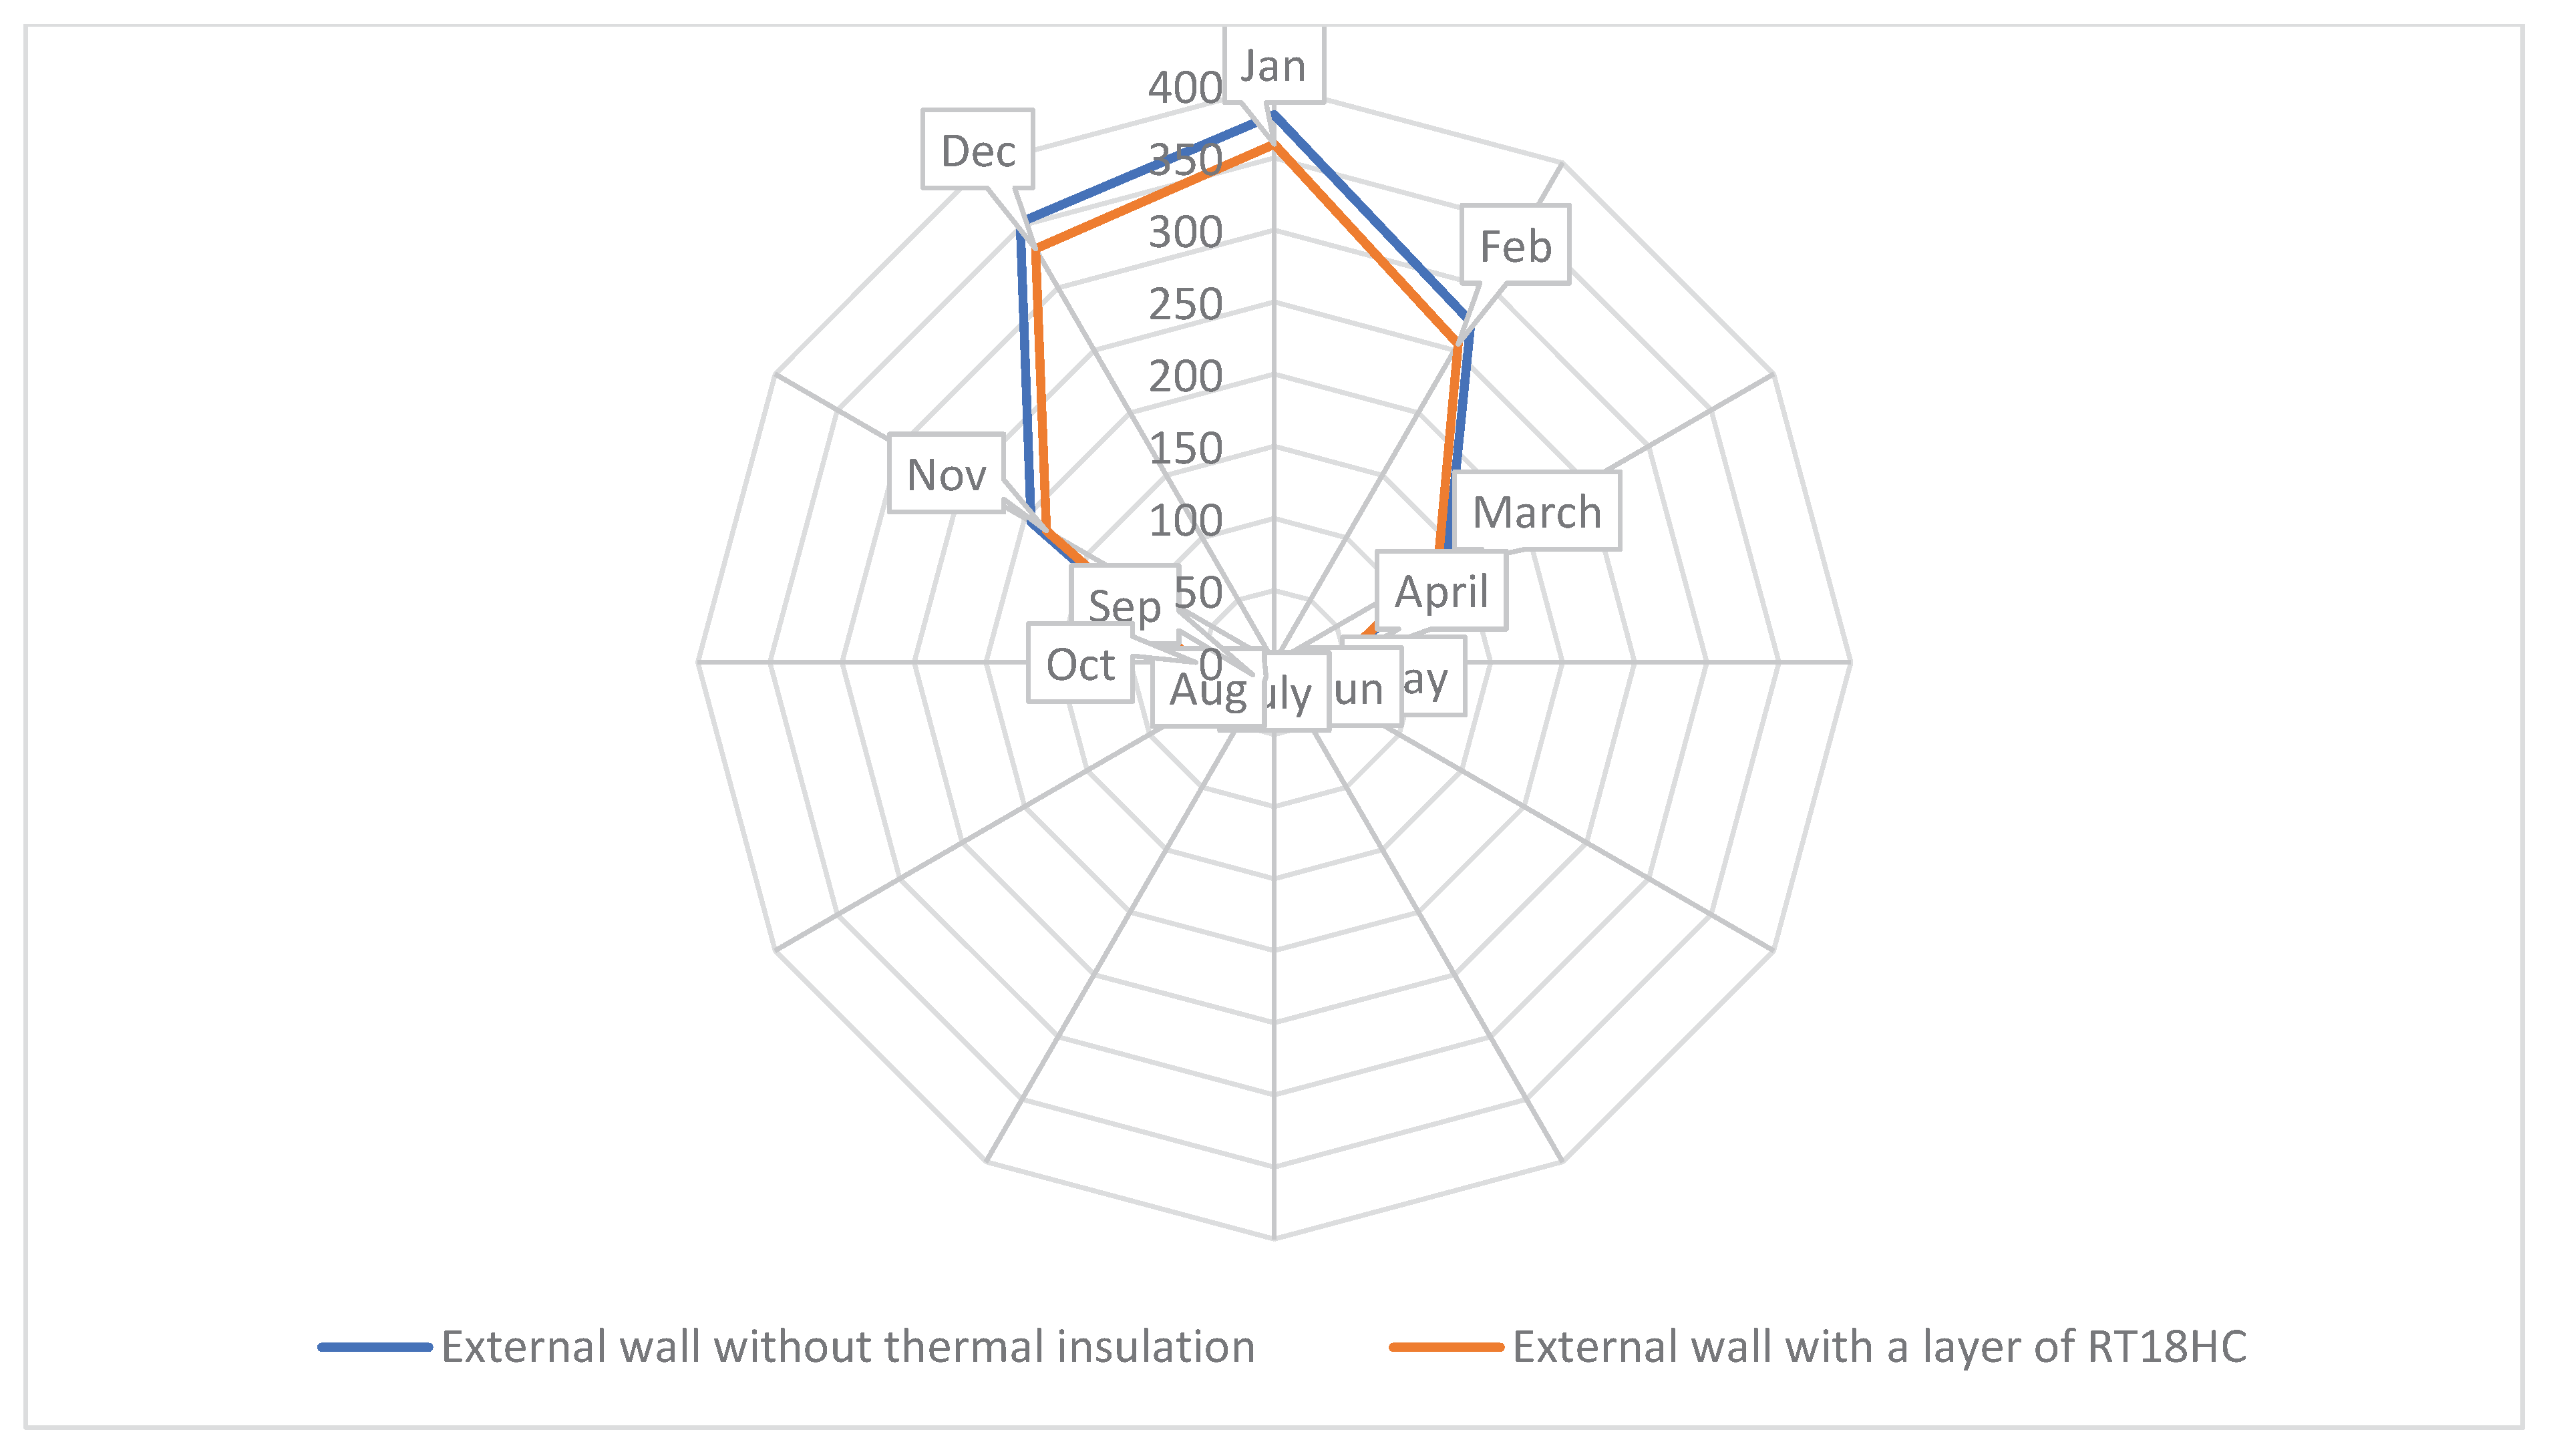
Figure 17.
Electrical energy consumption throughout the year using Nano paints.
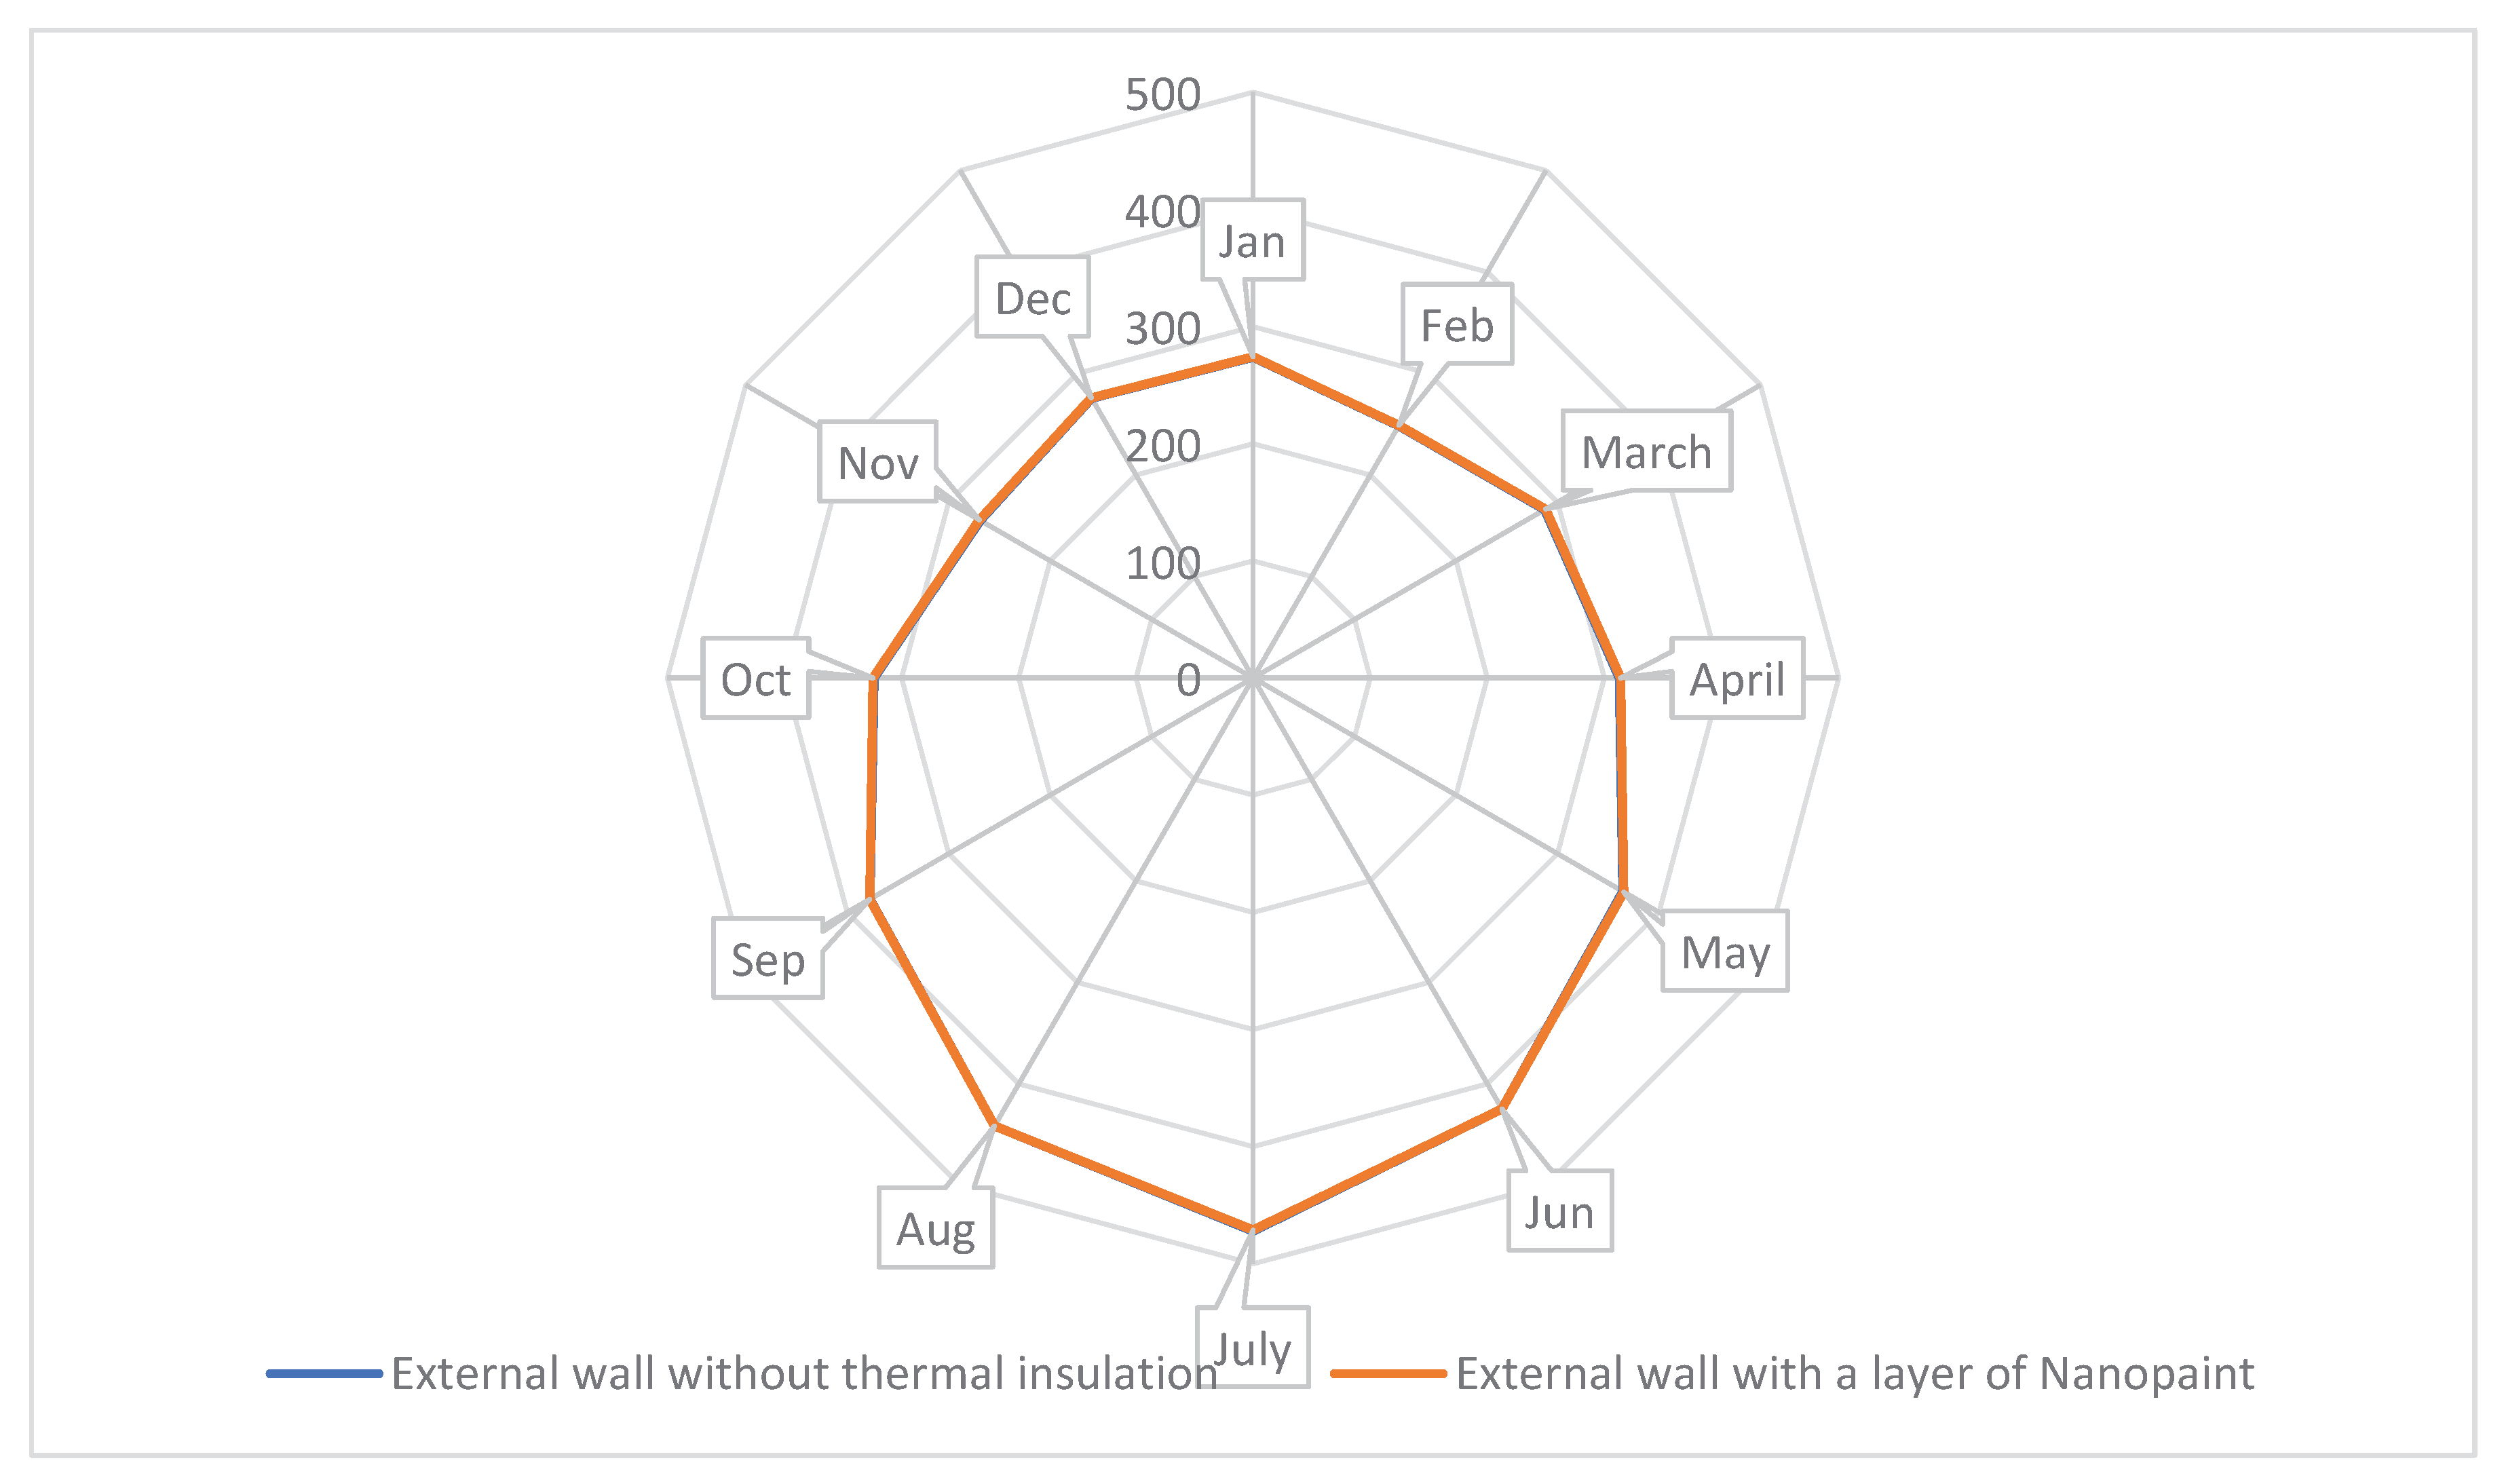
Figure 18.
Gas energy consumption throughout the year using Nano paints.
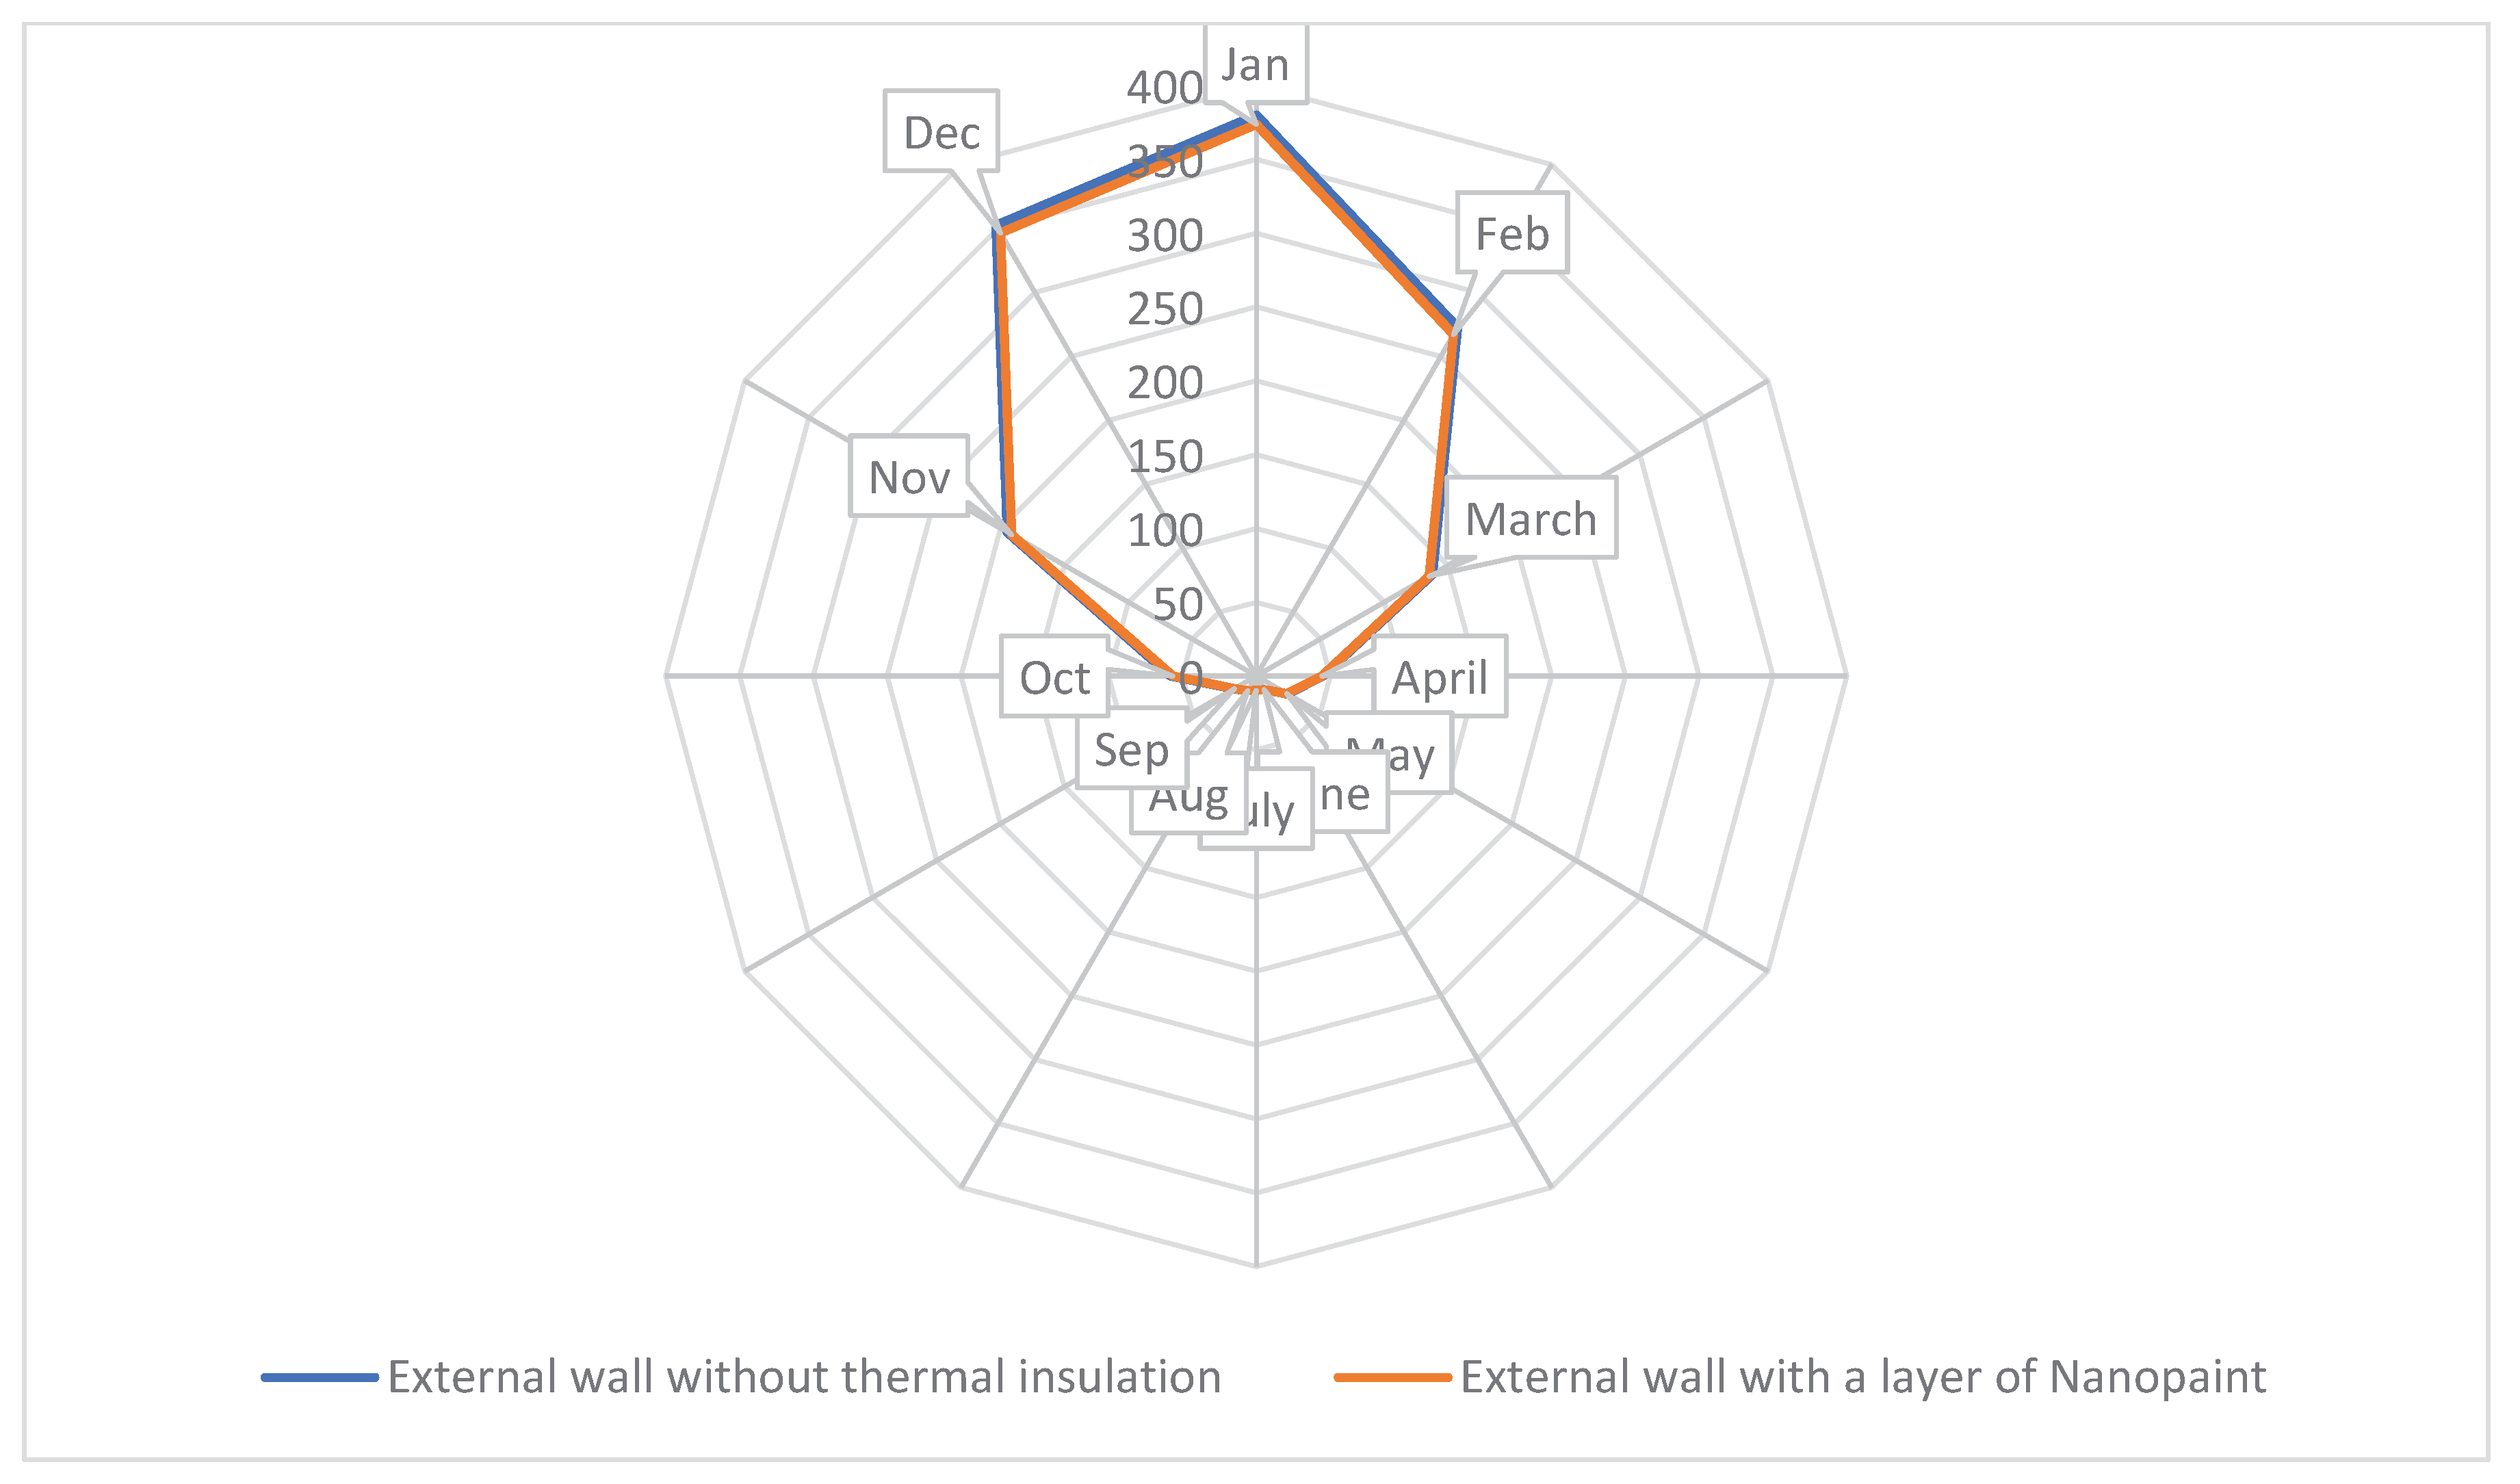
Figure 19.
The sustainability index changes in different temperatures as per (a) Without Thermal Insulation, (b) With PCMs, and (c) With Nano paints.
Figure 19.
The sustainability index changes in different temperatures as per (a) Without Thermal Insulation, (b) With PCMs, and (c) With Nano paints.
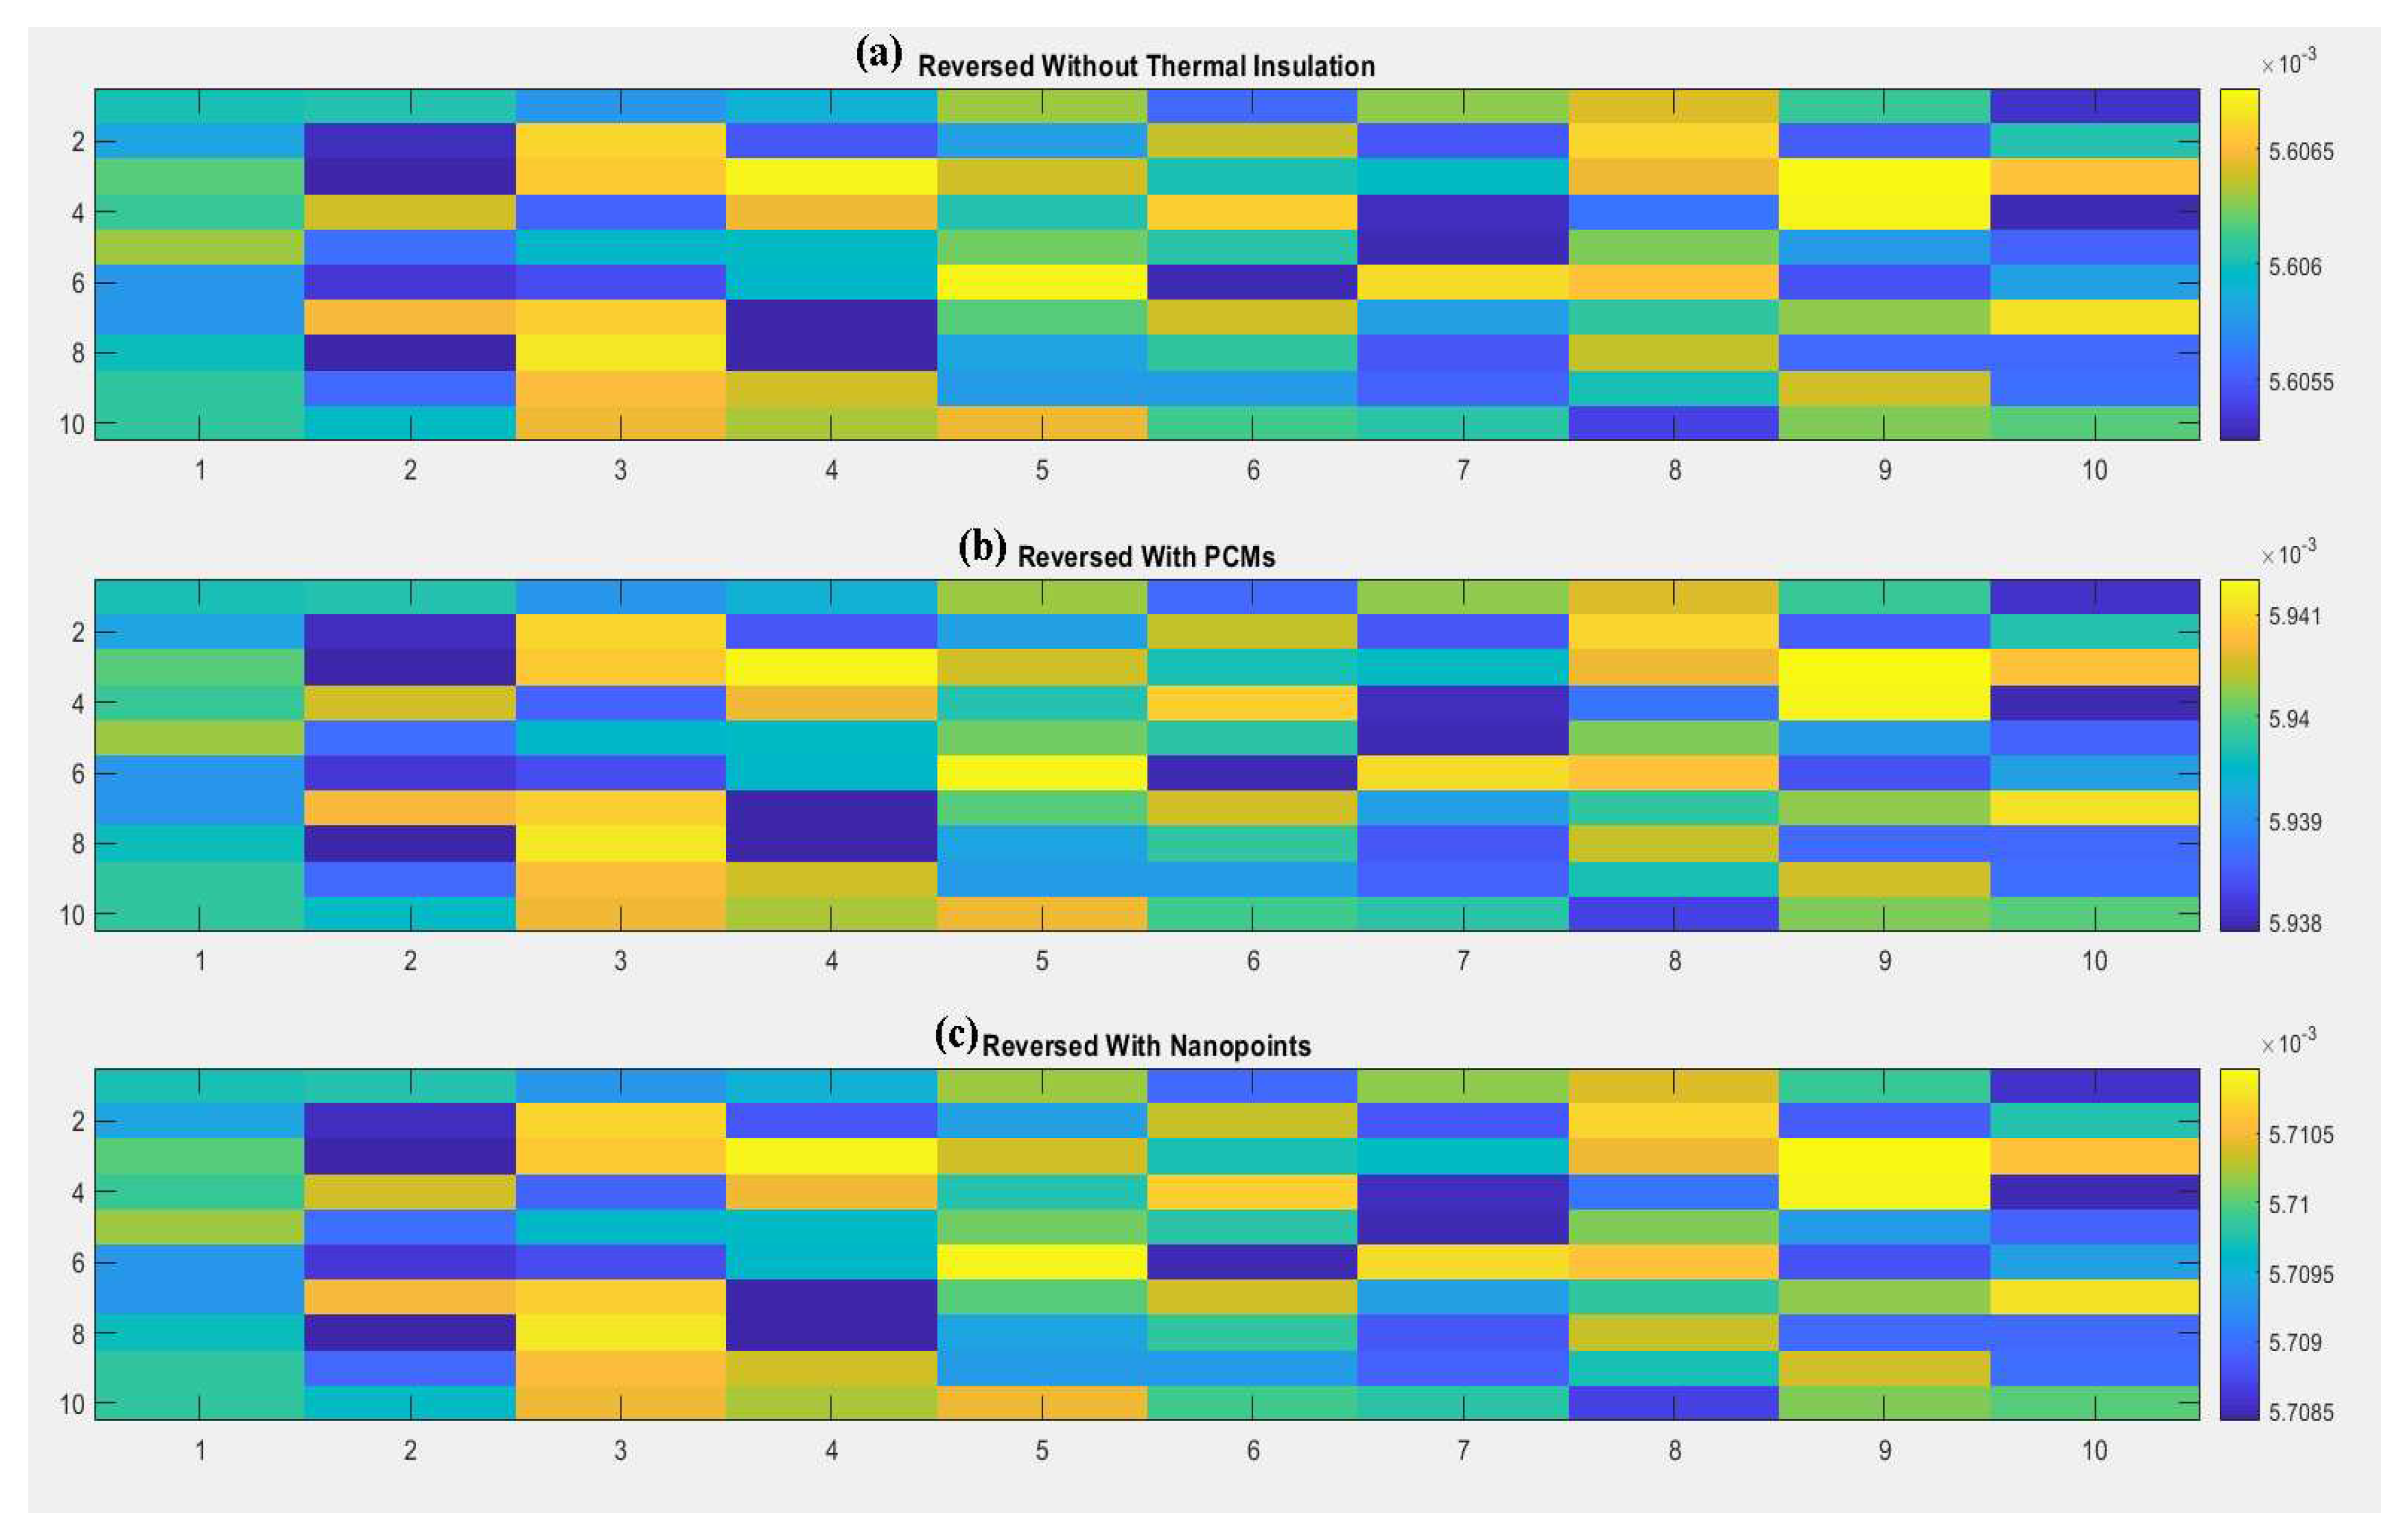
Figure 20.
The exergy fluctuations in different temperatures as per (a) Without Thermal Insulation, (b) With PCMs, and (c) With Nano paints.
Figure 20.
The exergy fluctuations in different temperatures as per (a) Without Thermal Insulation, (b) With PCMs, and (c) With Nano paints.
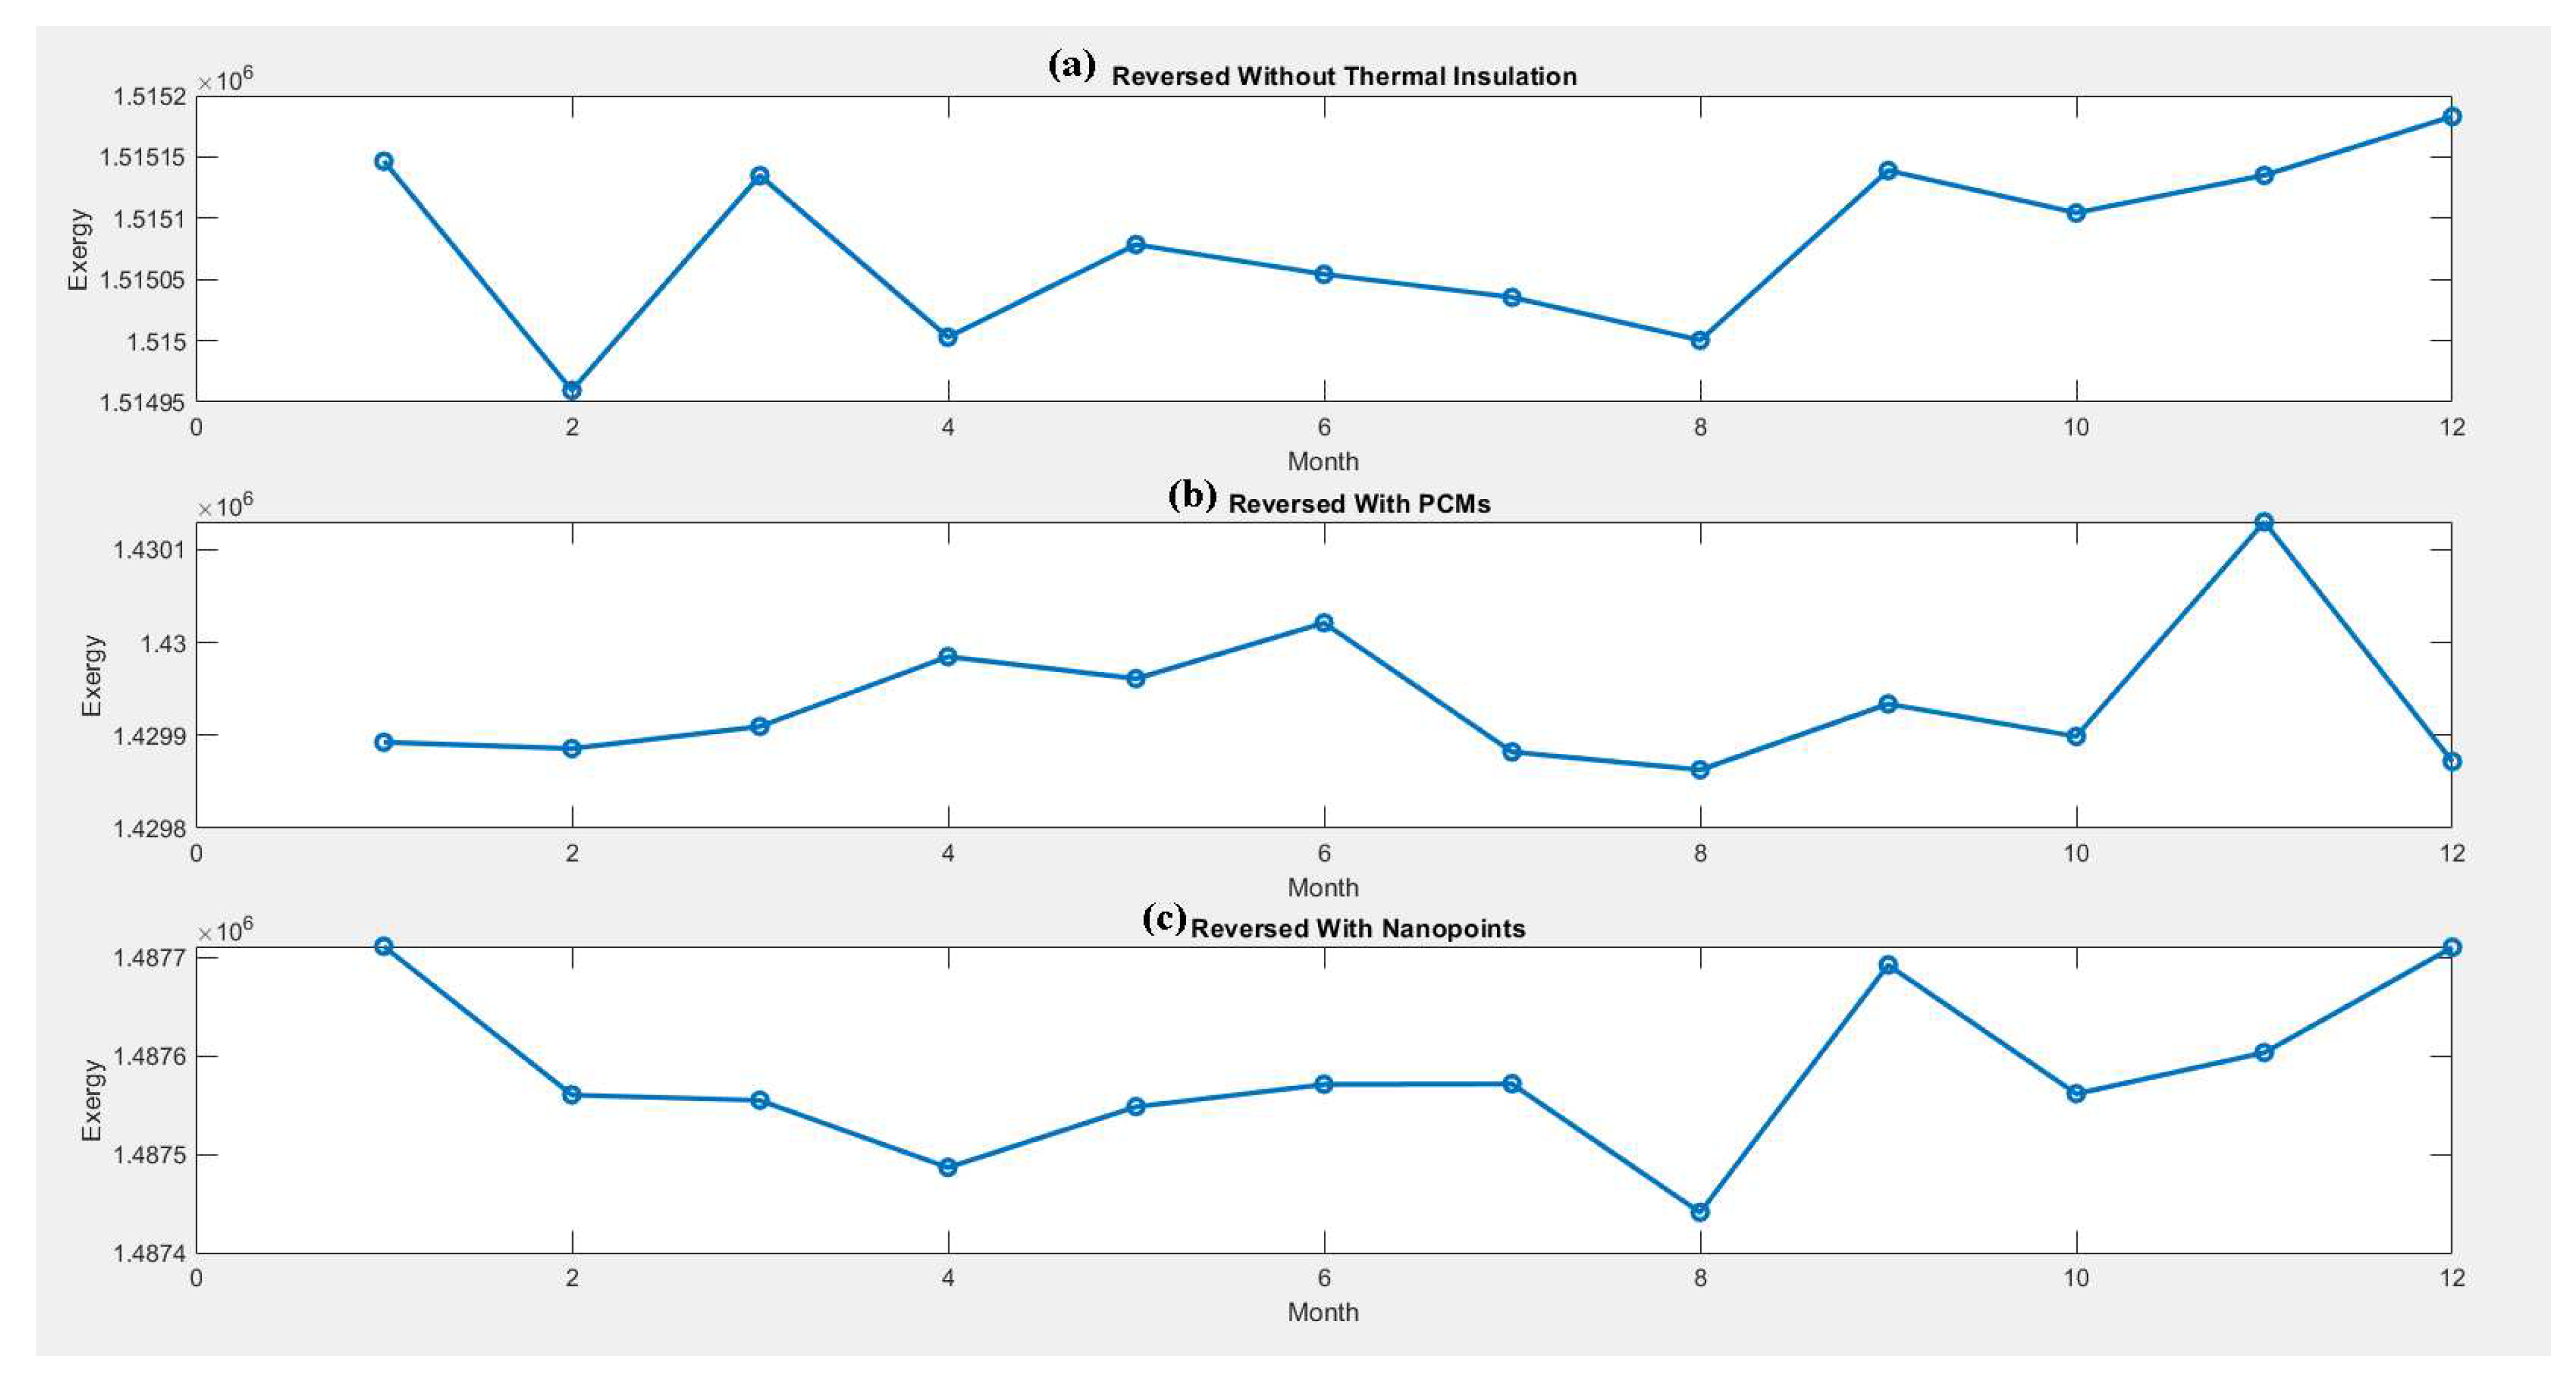

Table 1.
Concepts for heating and cooling solutions.
| Heating Solutions | Cooling Solutions |
|---|---|
| SOLAR COLLECTION: GATHERING HEAT FROM THE SUN VIA THE BUILDING EXTERIOR (OMER, 2008) | solar control: shielding a structure from direct solar rays (Omer, 2008) |
| HEAT STORAGE: THE BULK OF THE WALLS AND FLOORS STORES HEAT (OMER, 2008) | ventilation: replenishing and removing stale air (Omer, 2008) |
| DISTRIBUTION OF HEAT: DISTRIBUTING HEATED AIR TO VARIOUS ROOMS THAT NEED TO BE HEATED (OMER, 2008) | reduction of internal gains: lowering heat generated by people, machinery, and artificial illumination (Omer, 2008) |
| CONSERVING HEAT: KEEPING HEAT WITHIN THE BUILDING (OMER, 2008) | prevention of external gains: defense against unauthorized heat transfer by penetration or conduction through the envelope (hot climates) (Omer, 2008) |
| THERMAL ENERGY STORAGE (TES) SYSTEMS STORE EXCESS THERMAL ENERGY DURING PERIODS OF LOW DEMAND AND RELEASE IT WHEN NEEDED. THIS CAN BE ACHIEVED THROUGH VARIOUS METHODS SUCH AS USING INSULATED TANKS OF HOT WATER OR ADVANCED MATERIALS WITH HIGH HEAT RETENTION PROPERTIES (SHARSHIR ET AL., 2023) | Natural cooling: enhancing natural ventilation by influencing outside air (hot climates) (Omer, 2008) |
| GEOTHERMAL HEAT PUMPS ARE UTILIZING THE EARTH'S STABLE UNDERGROUND TEMPERATURE, GEOTHERMAL HEAT PUMPS TRANSFER HEAT BETWEEN THE GROUND AND THE BUILDING. THEY ARE HIGHLY EFFICIENT AND ENVIRONMENTALLY FRIENDLY, OFFERING A SUSTAINABLE ALTERNATIVE TO TRADITIONAL HEATING SYSTEMS (BATTAGLIA ET AL., 2023) | Evaporative Cooling Systems method utilizes the principle of evaporative cooling, where water is evaporated to absorb heat from the surrounding air. Systems like evaporative coolers or swamp coolers can be integrated into buildings to provide energy-efficient cooling in dry climates without the high energy consumption associated with traditional air conditioning (Abdullah et al., 2023) |
| RADIANT FLOOR HEATING INVOLVES INSTALLING HEATING ELEMENTS BENEATH THE FLOOR SURFACE. THE HEAT RISES FROM THE FLOOR, CREATING A COMFORTABLE AND EVEN WARMTH IN THE LIVING SPACE. IT'S ENERGY-EFFICIENT AND ELIMINATES THE NEED FOR TRADITIONAL RADIATORS OR FORCED-AIR SYSTEMS (HAI ET AL., 2023) | Thermal Energy Storage for Cooling can be used for cooling as well. Buildings can store cool energy during off-peak periods, such as at night, and release it during the day when cooling demands are higher. This method enhances energy efficiency and reduces peak-load stress on power grids (Sharshir et al., 2023) |
| INTEGRATING ARTIFICIAL INTELLIGENCE INTO THERMOSTAT SYSTEMS ALLOWS FOR MORE PRECISE AND PERSONALIZED HEATING CONTROL. THESE SYSTEMS CAN LEARN FROM USER BEHAVIOR, ADAPT TO PREFERENCES, AND OPTIMIZE HEATING SCHEDULES BASED ON FACTORS LIKE WEATHER FORECASTS AND OCCUPANCY PATTERNS (ALDAKHEEL ET AL., 2023) |
Green Roofs and Walls are installing vegetation on rooftops and walls to help cool buildings by providing natural insulation and reducing the urban heat island effect. Plants absorb sunlight and release moisture through a process called transpiration, contributing to a cooler microclimate around the building (Mousavi et al., 2023) |
| PHASE CHANGE MATERIALS (PCMS) ABSORB AND RELEASE THERMAL ENERGY DURING THE PROCESS OF MELTING AND SOLIDIFYING. THEY CAN BE INCORPORATED INTO BUILDING MATERIALS LIKE WALLS OR FLOORS TO STORE AND RELEASE HEAT, HELPING TO REGULATE INDOOR TEMPERATURES EFFICIENTLY (GAO AND MENG, 2023) | Passive Cooling Design involves designing buildings to naturally cool themselves without the need for mechanical systems. Strategies may include proper insulation, shading elements, and ventilation techniques to optimize airflow and reduce the reliance on active cooling (Gupta et al., 2023) |
Table 2.
Summary of heating, cooling, and hybrid PCM applications in buildings.
| Techniques | Researchers | ||
|---|---|---|---|
| Passive | Sensible storage (Rammed earth, alveolar bricks, concrete, stone) |
Standard solar walls (Trombe walls). | Saadatian et al., 2012 Llovera et al., 2011 Rempel & Rempel, 2013 |
| Solar water walls. | |||
| Latent storage (PCMs) | Encapsulation | Lee et at., 2015 Zhang et al., 2010 Nomura et al., 2009 Zhang et al., 2006 Delgado et al., 2012 Soares et al., 2013 Saffari et al., 2017 Hasan et al., 2018 Vukadinović et al., 2020 |
|
| Immersion | |||
| Direct incorporation | |||
| Shape-stabilization | |||
| Micro-encapsulation | |||
| Active | Cooling | Systems for thermally activated buildings (TABS) | Saelens et al., 2011 Weinläde et al., 2014 De Gracia et al., 2013 Tyagi et al., 2011 |
| lowered ceilings | |||
| the outside facades | |||
| system of ventilation | |||
| Solar heating | Water tanks | Fraisse et al., 2006 De Gracia et al., 2013 |
|
| Wall-mounted solar air collectors | |||
| PCM in ventilated facades | |||
| Cooling/ heating | Thermal management PV's | Arteconi et al., 2013 | |
| Building core activation | |||
| Heat pumps with TES systems | |||
Table 3.
The height (meters) and area (square meters) of each floor of the building.
| Floor Level | Height (m) | Floor Area (m2) | Conditioned Floor Area(CFA) (m2) |
|---|---|---|---|
| Basement (-5) | 3.2 | 2010.3368 | 0 |
| Basement (-4, -3, -2) | 3.5 | 2010.3368 | 0 |
| Basement (-1) | 4.8 | 2010.3368 | 934.8 |
| Ground floor | 5.26 | 1800 | 726.5 |
| First floor | 6.24 | 1411 | 1073.6 |
| 2nd, 3rd, 4th, 5th, 6th, 7th and 8th 9th floor (right side ) | 3.5 | 569 | 312.7 |
| 2nd, 3rd, 4th, 5th, 6th, 7th and 8th 9th floor (left side) | 3.5 | 559 | 311.1 |
| 10th floor (roof) | 4 | 1075 | 768.8 |
| Total | 26 | 23361.684 | 8494.1 |
Table 4.
Heat properties of the external wall, interior wall, and roof without thermal insulation.
| Thickness (cm) |
Heat transfer coefficient W/(m²·K) |
Thermal mass (J/K) |
Materials | |
|---|---|---|---|---|
| External wall | 18.1 | 0.624 | 1.602 | Brick- AAC Block- Plaster |
| Interior wall | 15.2 | 0.598 | 1.674 | AAC Block- Plaster |
| Roof | 31.1 | 2.212 | 0.452 | Asphalt- Concrete- Plaster |
Table 5.
Thermodynamic properties.
| Typical values | Amount | Unit (SI) |
|---|---|---|
| Melting range | 17-19 | ° C |
| Freezing area | 19-17 | ° C |
| Heat storage capacity ± 7.5% | 260 | kJ/kg |
| Specific heat capacity | 2 | kJ/kg·K |
| Fixed density (at 15 °C) | 0.88 | kg/l |
| Liquid density (at 25 °C) | 0.77 | kg/l] |
| Conductivity of heat | 0.2 | W/(m·K) |
| Volumetric expansion | 12.5 | % |
| The flash point | 135 | ° C |
| Maximum of working temp. | 50 | ° C |
Table 6.
Characteristics of thermal nanofluids.
| Specific thermal resistance (K⋅m/W) |
Density (Kg/m3) |
Specific heat capacity (J/kg·K) |
|
|---|---|---|---|
| Thermal nanofluids | 0.067 | 370 | 3500 |
Table 7.
heat properties of the external wall, Interior wall, and roof with a layer of RT18HC.
| Thickness (cm) |
Heat transfer coefficient W/(m²·K) |
Thermal mass (J/K) |
Materials | |
|---|---|---|---|---|
| External wall | 20.1 | 0.565 | 1.769 | Brick- AAC Block- PCM-Plaster |
| Interior wall | 15.2 | 0.598 | 1.674 | AAC Block- plaster |
| Roof | 33.1 | 1.616 | 0.619 | Asphalt- PCM- Concrete- Plaster |
Table 8.
Heat properties of the external wall, Interior wall, and roof with a layer of Nano paint.
| Thickness (cm) |
Heat transfer coefficient W/(m²·K) |
Thermal mass (J/K) |
Materials | |
|---|---|---|---|---|
| External wall | 18.2 | 0.619 | 1.617 | Brick- AAC Block- PCM-Plaster |
| Interior wall | 15.3 | 0.598 | 1.674 | AAC Block- plaster |
| Roof | 31.2 | 2.14 | 0.467 | Asphalt- PCM- Concrete- Plaster |
Table 9.
Heat properties of openings.
| Thickness (cm) |
Heat transfer coefficient W/(m²·K) |
Materials | |
|---|---|---|---|
| Door | 2.54 | 3.3 | wood |
| Window | 7 | 1.5 | Double glazed Low-E glass Argon |
Table 10.
Assignment of climatic traits to the climate folder from the Design Builder's library.
| General | |
|---|---|
| Name | MASHHAD |
| Country | IRAN (Islamic Republic of Iran) |
| Source | ASSHRAE/ ITMY |
| WMO | 407450 |
| ASHRAE climate zone | 2B |
| Koppen classification | Bwh |
| Latitude (°) | 36.27 |
| Longitude (°) | 59.63 |
| Elevation (m) | 999.0 |
| Standard pressure (kPa) | 89.9 |
| Time and Daylight Saving | |
| Time zone | (GMT +03:30) Tehran |
| Beginning of winter | Oct |
| Winter’s End | Mar |
| Beginning of summer | Apr |
| Summer’s End | Sep |
| Energy Codes | |
| Legislative region | IRAN (Islamic Republic of Iran) |
| Heating 99.6 % | |
| Outside design temp. (°C) | -9.1 |
| Wind velocity (m/s) | 9.2 |
| Direction of the wind (°) | 0.0 |
| Heating 99 % | |
| Outside design temperature (°C) | -6.1 |
| Wind speed (m/s) | 7.7 |
Table 11.
Activity assignment of different parts of the building.
| Function | Num | Area (m2) |
Activity | Temperature (°C) |
Area per person (m2) |
Timing | others | ||
|---|---|---|---|---|---|---|---|---|---|
| cold | warm | ||||||||
| 1 | Lobby | 1 | 196.4 | Walking | 23 | 20 | 0.2147 | Full-time | - |
| 2 | Reception | 1 | 48.5 | Walking | 23 | 20 | 0.1046 | Full-time | Computer Fax Telephone |
| 3 | Empty space | 1 | 202.3 | Walking | 23 | 20 | 0.18 | Full-time | - |
| 4 | Corridor | 20 | 3138 | Walking | 23 | 20 | 0.12 | Full-time | - |
| 5 | Entrance | 4 | 152 | Walking | 25 | 20 | 0.49 | Full-time | - |
| 6 | Elevator halls | 3 | 33 | Standing | 25 | 20 | 0.18 | Full-time | - |
| 7 | Pool | 1 | 183 | Exercising | 32 | 28 | 0.12 | Part-time | - |
| 8 | Massaging | 1 | 27 | Relaxing | 32 | 28 | 0.14 | Part-time | - |
| 9 | Coffee shop | 2 | 213 | Drinking /Eating |
25 | 23 | 0.18 | Part-time | Appliances |
| 10 | Restaurant | 2 | 1004 | Drinking /Eating |
21 | 17 | 0.33 | Part-time | Appliances |
| 11 | Kitchen | 3 | 176 | Cooking | 21 | 17 | 0.21 | Part-time | Appliances oven |
| 12 | Prayer room | 1 | 38 | Exercising | 25 | 20 | 0.11 | Part-time | - |
| 13 | Commercial | 7 | 997 | shopping | 24 | 20 | 0,43 | Part-time | Computer |
| 14 | office | 3 | 726 | Walking /Seating |
24 | 22 | 0.11 | Part-time | Computer Fax Telephone |
| 15 | Food Warehouse | 2 | 64 | Storing | 23 | 23 | 0.02 | Full-time | Appliances |
| 16 | Housekeeping | 16 | 236 | Preparation | 25 | 20 | 0.05 | Full-time | Appliances |
| 17 | Laundry | 2 | 103 | Washing | 24 | 18 | 0.12 | Full-time | Appliances |
| 18 | Restroom | 2 | 99 | Relaxing | 25 | 20 | 0.11 | Part-time | - |
| 19 | Pantry | 1 | 13 | Food preparation | 21 | 17 | 0.21 | Full-time | Appliances oven |
| 20 | Suit | 88 | 907 | Seating | 25 | 21 | 0.09 | Part-time | Appliances |
| 21 | Room | 88 | 857 | Relaxing | 25 | 20 | 0.05 | Part-time | Appliances |
| 22 | Restaurant's Lobby | 1 | 62.37 | Walking | 23 | 20 | 0.48 | Full-time | - |
Table 12.
Energy Use Intensity in different scenarios.
| Without Thermal Insulation | With PCMs | With Nano paints | |
|---|---|---|---|
| Energy Consumption (Gas) |
1,515,197 | 1,430,131 | 1,487,731 |
| Total Conditioned Floor Area | 8,494.1 | 8,494.1 | 8,494.1 |
| Energy Use Intensity (EUI) | 178.38 | 168.36 | 175.14 |
Table 13.
Economic justification of utilizing RT18HC and Nano paints in the building.
| Construction Cost (USD) |
Gas Energy Saving (kWh) |
Electricity Energy Saving (kWh) |
Gas Cost Saving (USD) |
Electricity Cost Saving (USD) |
Total Cost Saving (USD) |
|
|---|---|---|---|---|---|---|
| RT18HC | 467,918 | 85,066 | 29,377 | 153.3 | 87.2 | 240.5 |
| Nanopaint | 123,384 | 27,466 | 4,925 | 17.4 | 86 | 103.4 |
* The exchange rate used in this study was 250,000 Iranian Rials per US Dollar. ** The annual cost of energy carriers has been calculated according to the natural gas tariff table of 2019 provided by Iran's National Gas Company. This tariff varies according to the cold and hot months of the year. *** The electricity consumption cost is based on the electricity tariff and its general conditions announced by Tawanir Company (IRAN Power Generation Transmission & Distribution Company) and is calculated according to the climate and hot and cold months.
Table 14.
Payback period as seen from the perspective of the investor.
| Initial Cost (USD) |
Total Annual Income (Savings) (USD) |
Payback Period (Year) |
|
|---|---|---|---|
| RT18HC | 467,918 | 240.5 | 94.1 |
| Nanopaint | 123,384 | 103.4 | 84 |
Table 15.
Payback period from a societal perspective.
| Initial Cost (USD) |
Energy Saving (kWh) |
Total Annual Income (Savings) (USD) |
Payback Period (Year) |
|
|---|---|---|---|---|
| RT18HC | 467918 | 114,443 | 6,866 | 31.5 |
| Nanopaint | 123384 | 32,391 | 1,352 | 35.2 |
Disclaimer/Publisher’s Note: The statements, opinions and data contained in all publications are solely those of the individual author(s) and contributor(s) and not of MDPI and/or the editor(s). MDPI and/or the editor(s) disclaim responsibility for any injury to people or property resulting from any ideas, methods, instructions or products referred to in the content. |
© 2023 by the authors. Licensee MDPI, Basel, Switzerland. This article is an open access article distributed under the terms and conditions of the Creative Commons Attribution (CC BY) license (http://creativecommons.org/licenses/by/4.0/).
Copyright: This open access article is published under a Creative Commons CC BY 4.0 license, which permit the free download, distribution, and reuse, provided that the author and preprint are cited in any reuse.


