Submitted:
26 December 2023
Posted:
27 December 2023
You are already at the latest version
Abstract
Cassava Solid waste (Onggok) is a solid waste from the cassava-based tapioca industry, the starch content in Onggok is still 50-80 wt.% of residual starch, which can be used to produce maltodextrin for foods application. Furthermore, using cassava solid waste is beneficial in terms of the cost of raw materials. The starch content in cassava can be modified through enzymatic hydrolysis using α-amylase and β-amylase enzymes at 80oC and pH 5.5. Enzymatic hydrolysis was done using mixed enzymes that varied the concentration of α-amylase at 0,.1% and the β-amylase enzymes at 0.05, 0.1, and 0.5%. the concentration of cassava waste (Onggok) varied from 4%, 7%, 10%, and 13%. The optimum concentration of α-amylase and β-amylase enzymes are 0.1% and 0.1% respectively at time intervals of 1 minute resulting in a dextrose equivalent (DE) value 0f 5.7. The characteristics of maltodextrin were studied using scanning electron microscopy (SEM) to determine the morphology of the starch structure which had changed due to the enzyme hydrolysis. Simultaneous thermal analysis (STA) was studied to determine the Thermal stability of hydrolysis products. Maltodextrin produced from cassava waste (Onggok) has a DE value < 10, which has the potential to be used in the pharmaceutical industry
Keywords:
maltodextrin
; dextrose equivalent
; enzymatic hydrolysis
; α-amylase
; β-amylase
1. Introduction
The use of materials for bioconversion has attracted the attention of scientists over the last few years [1]. Sustainable solid waste management has become a major problem for developing and developed countries in the world, so the environmental problems associated with the disposal of this waste are reduced by bioconversion processes [2]. Cassava Waste is a cassava solid waste from the tapioca industry originating from cassava processing (In Indonesia is known as Onggok), so far, onggok has developed as animal feed, but it causes many environmental problems. Previous research shows that the main component of waste consists of 60,68% starch [3], 19% fibers that contain cellulose fibers [4]. Starch is a group of carbohydrates and is a repeating unit of glucose compound polymer combined with two main components, those are amylose and amylopectin. Amylose is very hydrophilic because it contains many hydroxyl groups [5]. The collection of amylose in water makes it difficult to form a gel, Even though it has a high concentration. Starch molecules do not easily dissolve in water at room temperature or cold water, in contrast to amylopectin which has a branched structure; starch will easily expand and form colloids in water. One example of a starch modification product is dextrin/maltodextrin [6]. Starch from cassava waste can be improved in terms of functionality by involving modification of the chemical and physical properties of starch, and it is widely used as a raw material in animal feed, and has significant potential in the production of maltodextrin [3].An alternative application of starch from cassava waste can be converted into maltodextrin, glucose, and maltose syrups by using amylolytic enzymes [7].
Maltodextrin is a hydrolyzed product of short-chain starch which has wide applications in the food and health sectors. The starch contained in cassava waste provides an interesting perspective for scientists in developing a bioconversion process for cassava waste into useful chemicals [8]. Onggok can be extracted by enzymatic hydrolysis with several groups of amylases [7]. α-amylase reduces starch chains to smaller oligosaccharides used to increase the gelatinization process in enzymatic extraction to reduce the viscosity of the medium and in the saccharification process. α-amylases are responsible for reducing cellulose to smaller chain [9].
Maltodextrin with a dextrose equivalent (DE) value specification of 5 to 20 is a functional material category for pharmaceuticals, as an encapsulation agent and filler in solid and liquid medicines [10]. In previous study, maltodextrin around 10-30% as encapsulating agent could maintain antioxidant activity on phenolic compound [11]. In recent study combination maltodextrin with other materials such as protein isolate and gum Arabic as an encapsulation agent for powder juice obtained encapsulation efficient between 80-95% [12] [13]
In this research, onggok is used as a source of starch which can be enzymatically hydrolyzed to produce maltodextrin. Starch hydrolysis is carried out by varying two enzymes, that are α-amylase and β-amylase with varying times, enzyme concentrations, and substrate concentrations. So that is this research aims to evaluate the activity of enzymatic hydrolysis of starch with α-amylase and β-amylase in the production of maltodextrin. Moreover, SEM, NMR, and STA were conducted to study the morphological and functional group changes in hydrolyzed starches by onggok.
2. Materials and Methods
2.1. Materials
The cassava solid waste or onggok used in this research was obtained from Bogor and is extensively cultivated from cassava tuber plants. A series of treatment processes are carried out before the cassava waste is used for research. Onggok is pressed, dried, and ground to obtain onggok powder. α-amylase and β-amylase enzymes were purchased from Nano bio Laboratory. All reagents including calcium chloride, phenol, sodium hydroxide, potassium sodium tartrate tetrahydrate, hydrochloric acid, concentrated sulfuric acid, and glucose were obtained from Merck. While 3,5-dinitrosalicylic acid (DNS) used in the DNS method was supported by Central Drug House Ltd.
2.2. Enzymatic Hydrolysis
Onggok was first characterized using FTIR and SEM before treatment. The starch slurry was prepared by mixing onggok and 200 ppm calcium chloride solution until the onggok suspension concentration was 10% (w/v). The onggok suspension was then sonicated for 15 minutes using a Hielscher ultrasonic with 15 seconds on and 15 seconds off. The enzymatic hydrolysis reaction of cassava waste was carried out as proposed by Sirohi et al. in 2021 [8] with modifications to enzyme variations, hydrolysis time, and enzyme concentration. The onggok slurry is heated first until it reaches a temperature of 80oC while stirring using a stirrer. The starch hydrolysis reaction from cassava waste suspension was carried out in 3 different enzyme loads at pH 5. Duration of the hydrolysis reaction carried out in time intervals of 1, 5, 10, and 15 minutes. The variations and concentrations of enzymes were varied as attached in Table 1.
Meanwhile, for variations in substrate concentration, the cassava waste suspension was dissolved with 200 ppm calcium chloride solution to a substrate concentration of 4%, 7%, 10%, and 13% (w/v). The addition of enzymes during hydrolysis used various types of α-amylase and β-amylase enzymes as well as the best time intervals which obtained DE values in the range of 2 to 10. Next, enzyme inactivation was carried out by adding 0.1 N HCl to pH 3. The sample was then neutralized with 0.1 N NaOH. The neutral hydrolysate was centrifuged at 6000 rpm for 10 minutes. The supernatant obtained from centrifugation was vacuum pumped using Whatman 1 filter paper and the filtrate was collected. The pure filtrate is then dried using a spray drying process at a temperature of 120oC.
2.3. Dextrose Equivalent (DE)
Reducing sugars produced from starch hydrolysis by onggok were measured using the DNS method. As a first step in testing the DE value of the sample, 2 mL of DNS reagent was added to all tubes and shaken until homogeneous. The tube containing the DNS reagent was then heated in a water bath at boiling temperature for 15 minutes. Next, a UV-Vis spectrophotometer measured the absorbance at a maximum wavelength of 540 nm. The total sugar in the sample was determined using the phenol-sulfate method. 1 mL each of 5% phenol solution and concentrated sulfuric acid were added to the entire tube, then shaken until homogeneous. The tube was then left for 15 minutes and then cooled in an ice bath for 20 minutes. Next, a UV-Vis spectrophotometer measured the absorbance at a maximum wavelength of 490 nm. The dextrose equivalent (DE) value is calculated using Equation 1 [14].
2.4. NMR (Nuclear magnetic resonance)
Analysis using 1H NMR was carried out at the Integrated Laboratory and Research Center, University of Indonesia. NMR testing was carried out using a Bruker Avance Neo Ascend 500 operating at a frequency of 500 MHz A deuterated sample was first made by dissolving 6% of the pile hydrolysis sample in several deuterium oxide (D2O) solvents which were then stirred until homogeneous. Then, the sample solution is placed into the sample holder on the NMR instrument. The 1H NMR spectra, recorded on 400 MHz AVANCE III NMR spectrometer (Brucker) [15].
2.5. SEM (Scanning electron microscopy)
Cassava waste raw materials and cassava waste hydrolyzed samples were subjected to SEM testing using a Jeol JSM-IT200 at the National Research and Innovation Agency. Conductive carbon tape was attached to the aluminum sample holder pin. 1 gram of sample powder was applied in a thin layer onto the carbon label on the sample holder on the SEM instrument with a magnification of 100x, 200x, 500x, 1000x, and 2000x. The same procedure was also carried out for testing the pile samples before hydrolysis [16].
2.6. STA (Simultaneous thermal analysis)
Cassava waste hydrolysis samples were characterized using STA for TG/DTA analysis with a Hitachi STA7300 at the Bandung Institute of Technology. As a first step in STA analysis, 2 milligrams of pile hydrolysis sample were added to the aluminum sample holder on the TG/DTA instrument. This measurement process is carried out using inert gas N2 with temperature measurements from 30oC to 350oC, and a heating rate of 10oC/minute [17].
3. Results.
3.1. Enzymatic hydrolysis of cassava waste using α-amylase enzyme
In the slurry preparation process, cassava waste is dissolved in 200 ppm calcium chloride solution to increase the thermal resistance of the enzyme, thereby avoiding denaturation and increasing the enzyme stability [18]. Before adding enzymes, the slurry is heated until the temperature reaches 80oC, because the starch will swell at this temperature. This stage is known as gelatinization, an irreversible process in which heated starch and water can produce disruption in the starch granular swelling, and crystallite melting, loss of birefringence causing the increasing viscosity and solubility and formation of a paste [19] [20]. The gelatinization stage is very important to increase the amorphous area of amylopectin and make it easier for enzymes to access the starch during hydrolysis [21].
The purpose of adding the α-amylase enzyme to the slurry is to compare the DE value where the hydrolysis process is only catalyzed using α-amylase with hydrolysis using a mixture with β-amylase enzyme. The process of adding the enzyme α amylase to the very thick cassava waste paste is called the liquefaction process. This process will cause the cassava waste paste to become dispersed [22]. The α amylase enzyme used to hydrolyze starch has an active site that is very specific to 1-4 glycosidic bonds in the conversion of starch so that starch can be catalyzed to produce reducing sugars as the product [23]. The α-amylase enzyme cuts long carbohydrate chains that are only specific for α-1,4-glycosidic bonds at random positions, resulting in the production of maltodextrin, maltotriose to maltose from amylose, as well as limiting dextrin from amylopectin [24]. A comparison graph of DE values from hydrolysis of cassava waste using 0.1% α-amylase enzyme at time intervals of 1, 5, 10, and 15 minutes can be seen in Figure 1. Based on the trend in the graph, the longer the hydrolysis time, the DE value will increase. This can be explained by the hydrolysis theory, that the longer of hydrolysis time, the more enzymes will attach to the more substrate to form a substrate enzyme complex so that a product is obtained.
Dextrose equivalent is a measure of the quality of the starch hydrolysis product which states the ratio of the amount of reducing sugar to its dry weight. Dextrose equivalent (DE) is a quantity stating the total value of starch reduction sugar or a starch-modified product in percent units. If the price of DE is high then the price of hygroscopicity, plasticity, sweetness, and solubility is also high, starch will easily undergo the browning process [25].
Dextrose Equivalents were 2.3, 6.02, 9.8, and 10.5 DE, respectively at 1, 5, 10, and 15 minutes of hydrolyzed time results show a knowing increase with respect to time. Dextrose Equivalent (DE) values 2 – 10, with bulk density 1.3-1.4 g/cm3, and crystalline powder can be applied for pharmaceutical purposes [26].
3.2. Effect of Different Concentrations of α-Amylase and β-Amylase Enzymes from Cassava Waste Hydrolysis
The enzymatic hydrolysis process of cassava waste is also carried out using varying concentrations and types of enzymes α-amylase and β-amylase, at different time intervals. The β-amylase itself has an optimum temperature of 75oC, but this increases to 80oC if there is the addition of Ca2+ metal ions to the calcium chloride solvent [27] [28]. The β-amylase has similarities to α-amylase, cutting α-1,4-glycosidic bonds, but the cutting process is very slow and only cuts two glucose groups per cut [29]. β-amylase is an exoenzyme that cuts only the outer part of amylose or amylopectin starting from the non-reducing group.
Figure 2. is a comparison of the DE values of cassava waste hydrolysis using various types of enzymes α-amylase 0.1% and β-amylase 0.05%, 0.1%, and 0.5% at time intervals of 1, 5, 10, and 15 minutes. Based on the trend on the graph, the higher the concentration and the longer the hydrolysis time, the DE value will increase. In this study, the concentration of the α-amylase was kept constant, while the concentration of the β-amylase was varied. DE value data from hydrolysis using the α-amylase enzyme has been attached previously (Figure 1.) to compare the DE value data with the addition of the β-amylase enzyme. Based on the results, the higher the concentration of the β-amylase enzyme, the DE value will increase due to an increase in the reaction rate. This can happen because the greater the enzymes that collide with the substrate, the more enzyme-substrate complexes are formed to obtain products in the form of reducing sugars [30].
Although there are five points at which maltodextrin products can be formed in this research, the target DE value to be achieved is in the range from 2 to 10 for applications in the pharmaceutical field. According to research conducted by Anwar et al. (2004) regarding the use of maltodextrin as an excipient in tablet dosage formulas, maltodextrin with a DE value of 1 to 5 can be used as a tablet binder via wet granulation with a concentration of 2-5%, as well as a tablet binder and tablet filler via direct compression with a concentration of 30-35% [31]. Maltodextrin which can be used as a tablet excipient is obtained from DE 2.5 and 5.7 respectively, with a hydrolysis time of 1 minute using β-amylase 0.05 and 0.1% respectively.
3.3. Morphology of Maltodextrin by Scanning electron microscopy
Changes in the structure of cassava waste hydrolysis products with DE 2.5 (A) and 5.7 (B) can be seen in Figure 3. Onggok hydrolysis products with DE values of 2.5 and 5.7 were obtained from variations in the mixture of α-amylase enzyme 0.1 % and β-amylase 0.1% during a 1-minute time interval. On the left is the surface structure of the DE 2.5 pile hydrolysis product at 2000 times magnification (Figure 3. A). The structure of the DE 2.5 hydrolysis product appears deformed and there are concave parts as marked by the red circles in the image. SEM image obtained from the research is similar to the SEM illustration reported by Ma et al. in 2022 which is a gelatinized starch structure. According to research conducted by Ma et al. (2022), the morphology of starch which has many depressions is caused by the gelatinization process which involves the penetration of water into the starch granules so that the starch experiences swelling. However, water does not penetrate the starch core and only the outer part is hydrated. When spray drying is carried out at high temperatures, the water will evaporate very quickly and create wrinkles and depressions in the starch granule structure [32]. The DE 2.5 starch hydrolysis product is obtained by hydrolysis using a very small enzyme concentration over a short period so that its structure is almost identical to starch that is not treated using enzymes.
Meanwhile, for the structure of the DE 5.7 hydrolysis product Figure 3B), there are small scrapes and holes as marked by the arrow. These abrasions and holes are caused by enzyme attacks. It can be seen that the structure of the DE 5.7 hydrolysis product contains holes marked by arrows. Abrasion or scratches caused by β-amylase are also visible in the structure of the DE 5.7 hydrolysis product which is marked by the arrow.
3.4. Chemical Structure of Maltodextrin by Nuclear Magnetic Resonance (1H-NMR and 13C-NMR)
Figure 4. shows the 1H NMR spectrum of the DE 5.7 of hydrolysis product obtained from the hydrolysis of Onggok using a combination of α-amylase and β-amylase enzymes. When viewed from the spectrum, the main chain in maltodextrin, namely the α-1,4- glycosidic and α-1,6-glycosidic bonds, can be validated by the presence of a signal around 5.0 – 5.25 ppm [33]. The doublet signal at 5.25 ppm belongs to the proton on the α anomeric carbon which is labeled with number 1. This carbon represents the α-1,4- glycosidic bond found in the hydrolysis product of the DE 5.7 pile.
Meanwhile, the doublet signal at 5.06 ppm belongs to the proton on the α anomeric carbon which is labeled with the number 1'. Proton signal number 1' has an anomeric carbon which represents an α 1,6-glycosidic branch bond at the terminal position [34]. Based on this spectrum, the DE 5.7 onggok hydrolysis product obtained from the research has a branched structure due to the high amylopectin content in the onggok so a signal at 5.06 ppm appears. Then a doublet signal appears at around 4.50 ppm in the spectrum which indicates the presence of protons with the anomeric β carbon in the axial position [34]. Anomeric β carbon can be caused by the emergence of reducing sugar in the form of maltose due to the breakdown of starch using the enzyme β-amylase [35].
Maltodextrin contains glucose primarily linked by α-1.4 with a small number of differently branched α- or β-glucose [15]. According to a previous study, the peaks for seven protons of the anhydrous glucose unit (AGU) of maltodextrin were specified [36]. They were obtained between 3.10 and 5.30 ppm, excluding the residual solvent peak (4.79 ppm) (Fig. 4). Then, the signals for enzymes hydrolyzed were recognized according to previous studies [37].
Figure 5. shows the 13C-NMR of maltodextrin hydrolysis product with DE 5.7. From this figure can be seen that 13C-NMR spectra of maltodextrin DE 5.7 showed that ignoring the small peaks that appear in some peaks, the spectrum of all samples is resolved into seven different signals. The samples are into ten signals such as previous research on maltodextrin from HMDB [38].

Table 2.
13C-NMR prediction from HMDB.
| Row No. | Cluster#break#Midpoint | No.#break#Peaks | Coupling#break#Type | No. C’s | Atom#break#No. | Peak#break#Centers (ppm) |
|---|---|---|---|---|---|---|
| 1 | 100,43 | 1 | s | 1 | 8 | 100,43 |
| 2 | 95,30 | 1 | s | 1 | 12 | 95,30 |
| 3 | 79,43 | 1 | s | 1 | 7 | 79,43 |
| 4 | 77,04 | 1 | s | 1 | 3 | 77,04 |
| 5 | 76,28 | 1 | s | 1 | 20 | 76,28 |
| 6 | 74,33 | 1 | s | 1 | 16 | 74,33 |
| 7 | 74,07 | 1 | s | 1 | 8 | 74,07 |
| 8 | 74,00 | 1 | s | 1 | 14 | 74,00 |
| 9 | 73,40 | 1 | s | 1 | 18 | 73,40 |
| 10 | 70,60 | 1 | s | 1 | 22 | 70,60 |
| 11 | 62,45 | 1 | s | 1 | 2 | 62,45 |
| 12 | 61,10 | 1 | s | 1 | 9 | 61,10 |
3.5. Gelatinization and Retrogradation of Maltodextrin by Simultaneous Thermal Analysis
Samples of DE 2.5 (A) and 5.7 (B) hydrolysis products were characterized using STA as seen in Figure 6. and Figure 7. In DE 2.5 and 5.7 hydrolysis products, the TGA thermogram for both samples shows the three stages of weight loss (%), the analysis shows that there is the initial peak of weight loss at 77.4 and 78.9oC attributed to water vapor. At this temperature, the samples lost about 2-8% of their mass of water. In the second stage, the rate of weight loss is almost constant. This temperature can be attributed to the thermal stability of maltodextrin occurs at 77-200 oC, this can be explained in Figure 6. It can be seen that under this condition there is no decrease in the sample weight [39]. Above 206 oC and 214 oC, the weight loss rate decreases exponentially. Maltodextrin DE 5.7 showed a slightly more rapid decomposition than DE 2.5. At this stage, the TG curve (red) also experienced a slight decrease caused by a reduction in sample weight due to the evaporation of absorbed water vapor or volatile components in the sample. After that, the DE 2.5 and 5.7 hydrolysis products began to experience an increase in the DTA curve from around 50 oC to 180 oC and the sample weight was relatively constant when viewed from the TG curve. This indicates that product crystallization has begun [40].
Furthermore, the melting of the DE 2.5 and 5.7 hydrolysis products was seen in the DTA curve at around 220 oC which was almost identical to the melting point of commercial maltodextrin of 240 oC without any changes in the TG curve. However, it appears that the DTG curve (red) at DE 5.7 has two peaks at around 240 oC and 280 oC and is also followed by a peak on the DTA curve which indicates that the product underwent an exothermic reaction. Then an amorphous area was formed [41]. In addition, the DTG curve represents the time derivative of the reduction in sample mass with temperature. Thus, the hydrolysis product DE 2.5 experienced a faster mass decrease than DE 5.7 due to the higher peak of the DTG curve. After melting is complete, the TG curve experiences a sharp decline followed by a peak in the DTG curve which indicates that the sample begins to decompose at temperatures above 350 oC
After melting is complete, the TG curve experiences a sharp decline followed by a peak in the DTG curve which indicates that the sample begins to decompose. This information was important for setting the decomposition temperature range at which the maltodextrin can be heated to avoid chemical changes in the product [42].
The gelatinization property of starches is a very important factor in the food industry. Differential scanning calorimetry (DSC) is a great technique to study the effect of change on the thermal behavior, gelatinization, and retrogradation of starch granules. All through gelatinization, DSC instruments the degree of disruption of hydrogen bonds within the starch granules and quantifies the heat energy that is represented by enthalpy [43] [20]. DSC thermogram of Maltodextrin DE 2.5 and DE 5.7 showed a single large endothermic DSC peak (Figure 8.). in the first run heating from 27 to 350oC, indicating the disintegration of maltodextrin and reduction sugar structure [44]. The gelatinization temperature of maltodextrin under the endothermic DSC peak was about 47 – 71oC implying the temperature required to disrupt the cluster of amylopectin [45]. The onset temperature (To), peak temperature (Tp), and conclusion temperatures (Tc) of all examined ranged from 28,17 ± 0,2 to 67,07 ± 0,2 oC and 28,05 ± 0,2 to 74,8 ± 0,1 oC, respectively. Maltodextrin consists of crystalline and amorphous regions. Gelatinization is a process in which the crystalline section in the starch granules is changed into an amorphous section. To investigate the extent of retrogradation in this study, the reheating DSC endothermic peak was used to estimate the disintegration of the ordered structure during the retrogradation [44]. To determine the glass transition (Tg) of maltodextrin can be measured by DSC as a function of moisture content [46].
Based on the reference, increasing the DE-Value at a dry matter content will decrease a glass transition temperature (Tg). The glass transition of amorphous biopolymers greatly reduces the function of water content and decreases with decreasing molecular weight. Relationships that are often used to correlate water absorption and glass transition data is the Gordon-Taylor equation [47].
3.6. Effect of different substrate concentrations on DE values
Aspects that influence the hydrolysis process include starch and acid concentration, enzyme activity, and hydrolysis time. High DE maltodextrin is generally brown, hygroscopic, sweet, and soluble in water while maltodextrin with low DE is used as viscosity control, binder, or as material for film coating [28]. Maltodextrin with the same DE value has varying impacts on their hygroscopy, fermentability, viscosity, sweetness, stability, solubility, and bioavailability [24]. In a recent study, Chereji et al. reported that α-amylase with a content of 0,1 – 0,15% ensures the best quality for the flour mixture, regarding the maltodextrin properties [48]. Juszczak et al. found that maltodextrin with different DE values showed different influences on the rheological properties [49]. Maltodextrin with a DE value of 18,2 affects the sticky characteristics, flow behaviour, and viscoelasticity of starch [50].
The effect of substrate concentration on hydrolyzed starch was studied by varying the substrate (onggok) content as shown in Figure 9. The onggok levels used are 4%, 7%, 10%, and 13%. The best composition of α-amylase and β-amylase enzyme concentrations used to study the effect of substrate concentration is a concentration of 0.1% α-amylase enzyme and 0.1% β-amylase enzyme concentration at a time interval of 1 minute. However, maltodextrin with an onggok content of 4% has a higher DE value than levels of 7%, 10%, and 13%. During the gelatinization process, the onggok suspension with a content of 13% showed a higher viscosity, making the sample difficult to stir.
Meanwhile, 4% onggok content shows a lower viscosity than levels of 7%, 10%, and 13% so the sample is more easily stirred during the gelatinization process. This difference in viscosity may be responsible for the low DE value at 13% because stirring the sample becomes more difficult. However, after adding enzymes, the viscosity decreases and the mixing process becomes easier. Thus, low substrate concentrations are preferred in the biomass conversion process. This aims to ensure that the biomass is perfectly wet, easily accessible to enzymes, and to avoid inhibitory effects from hydrolysis products [51] [52]. The effect of substrate concentration on the DE value in the hydrolysis of onggok can be seen in Figure 9. Hydrolysis results show that an increasing Onggok concentration in the range of 4-13% reduces the DE-value in the range of 2.5-9.7, it can be concluded that this concentration range produces the DE-range that meets the qualifications for medicine coating application [53].
The melting point of maltodextrin is 190.1oC. the difference in melting point is caused by differences in temperature variance in the Dextrose Equivalent (DE) as a dextrin product was not a pure excipient to serve pharmaceutical [28].
4. Conclusions
In this study, onggok was hydrolyzed using a combination of α-amylase and β-amylase enzymes. The concentration of α-amylase and β-amylase enzymes affects the DE value. The DE value will increase as the concentration of the enzymes α amylase and β-amylase increases. The hydrolysis time also affects the DE value. The longer the hydrolysis time using a mixture of α-amylase and β-amylase enzymes, the DE value will increase. However, higher substrate concentration can reduce the DE value in cassava hydrolysis using a mixture of α-amylase and β-amylase enzymes. DE value in the range 2,5-5,7 is suitable for use as a drug coating.
Author Contributions
“Conceptualization, ASH. and NMN.; methodology, ANS and JN.; software, ANS and JN.; validation, ASH., NMN. and ANS.; formal analysis, ASH and JN.; investigation, ASH.; resources, JN, ANS, and JN.; data curation, ASH.; writing—original draft preparation, ASH and JN.; writing—review and editing, ASH and ANS.; visualization, ASH, JN.; supervision, ASH.; project administration, ANS.; funding acquisition, ASH. All authors have read and agreed to the published version of the manuscript.
Funding
This research was funded by the National Competitive Applied Research Grants 2023, funded by the Directorate of Research, Technology, and Community Service, Directorate General of Higher Education, Research, and Technology (Number: 1173/LL3/AL.04/2023).
Data Availability Statement
Data is contained within the article.
Acknowledgments
The Authors wish to express their appreciation to Ir. Hariadi P Budimartono CEO PT. Utama Sukses Abadi for his materials (Onggok) support of this research. experiments).
Conflicts of Interest
The authors declare no conflicts of interest.
References
- T. E.-A. G. G. Y. U. S.-M. L. Ja Kyong Ko, "Improved bioconversion of lignocellulosic biomass by Saccharomyces cerevisiae engineered for tolerance to acetic acid," GCB-BIOENERGY : Bioproduct For A Sustainable Bioeconomy, p. [CrossRef]
- R. O. D. E. B. E. G. A. Modupe E. Ojewumi. Moses, E.Emetere. Bio-Conversion of Waste Paper Into Fermentable Sugars-A Review. Front. Chemical Engineering 2022, 4. [Google Scholar] [CrossRef]
- M. C. *. M. S. S. J., . F. A. F., . M. C. G. Luciana Reis Fontinelle SOUTO1. Utilization of residue from cassava starch processing for production of fermentable sugar by enzymatic hydrolysis. Food Science and Technology 2017, 37, 19–24. [Google Scholar]
- M. C. Athanasia Amanda Septevani & Mochamad Chalid Aniek Sri, Handayani*. Grafting of cellulose fibers latex by atom transfer radical polymerization. Polymer-Plastics Technology and Materials 2020, 59, 1326–1331. [Google Scholar]
- M. C. E. B. D. P. Aniek S, Handayani. Grafting of amylopectin with various alkyl methacrylate by atom transfer radical polymerization for engineering application. Macromolecular Symposia 2017, 371, 58–60. [Google Scholar]
- R. C. E. A. R. L. T. R. Agus, Triyono. Development of modified starch technology (maltodextrin) from commercial tapioca on semi production scale using oil heater dextrinator. in ICONPROBIOS 2017. [Google Scholar]
- C. O. M. 1. M. J. R. 1., . W. K. 2., . R. d. C. G. 1. Maltose Production Using Starch from Cassava Bagasse Catalyzed by Cross-Linked β-Amylase Aggregates. Catalysts 2018, 1–19. [Google Scholar]
- R. Sirohi, J. P. Pandey, R. Goel. Two- Stage Enzymatic Hydrolysis for Fermentable Sugars Production from Damaged Wheat Grain Starch with Sequential Process Optimization and Reaction Kinetics. Starch 2021, 73. [Google Scholar] [CrossRef]
- X. H. A. B. a. F. K. S. Richard, Bayitse*. Optimisation of enzymatic hydrolysis of cassava peel to produce fermentable sugars. AMB Express 2015, 5, 1–7. [Google Scholar]
- S. Bangar, S. Purewal, M. Trif. Functionality and Applicability of Starch-Based Films: An Eco-Friendly Approach. foods 10, 2021. [CrossRef]
- L. Suriati, I. G. P. Mangku, L. Kade Datrini. The effect of maltodextrin and drying temperature on the characteristics of Aloe-bignay instant drink. Applied Food Research 2023, 2023. [Google Scholar] [CrossRef]
- M. Estupiñan-Amaya, C. Fuenmayor and A. López-Córdoba. Exploring the Potential of Wild Andean Blueberries for Powdered Juice Production through Spray Drying. Foods 2023, 2348. [Google Scholar] [CrossRef] [PubMed]
- W. Deng, X. Li, G. Ren. Stability of Purple Corn Anthocyanin Encapsulated by Maltodextrin, and Its Combinations with Gum Arabic and Whey Protein Isolate. Foods 2023, 2393. [Google Scholar] [CrossRef] [PubMed]
- R. Z. J. Z. G. L. a. X. L. Junliang, Sun. Characterization of Destrins with Different Dextrose Equivalents. Molecules 2010, 15, 5162–5173. [Google Scholar] [CrossRef] [PubMed]
- N. H. P. &. M. P., Lämmerhardt. Comprehensive structural analysis of a set of various branched glucans by standard methylation analysis, 1H NMR spectroscopy, ESI-mass spectrometry, and capillary electrophoresis. Carbohydrate Research 2023, 489, 107933. [Google Scholar]
- C. N. S. P. Quek, SY. The Physicochemical Properties of Spray Dried Melon Powder. Chem. Eng. Process 2007, 46, 386–392. [Google Scholar] [CrossRef]
- G. S. M., . V. A. M., . M. L. B. a. G. e. M. *. Ana Paula da Silva dos Passos1. The Use of Thermal Analysis and Photoacoustic Spectroscopy in the E. Food Technol.Biotechnol 2015, 53, 385–396. [Google Scholar]
- Y. J., A. A differential behavior of α-amylase, in terms of catalytic activity and thermal stability, in response to higher concentration CaCl2. International Journal of Biological Macromolecule 2012, 51. [Google Scholar]
- Y. Liu, C. Chao, J. Yu. New insights into starch gelatinization by high pressure: Comparison with heat-gelatinization. Food Chemistry 2020, 318. [Google Scholar]
- C. P. N. S. S. M. U. C. P. M. H. R. N. M., Mazumder. An Insight into the Gelatinization Properties Influencing the Modified Starches Used in Food Industry: A review. Food and Bioprocess Technology 2022, 15, 1195–1223. [Google Scholar]
- D. F. R. M. M. P. P.-F. A. &. F. D. Palanisamy, "Kinetic modelling of individual starch granules swelling," Food Structure 2020, 26, 100–150.
- R. S. S. S. A. F. P. S. R. M. G. M. N. I. C. J. K. V. J. d. S. V. L. P. D. I. M. B. P. S. R. K. K. S. S. A. M. N. N. M., Sindhu. Enzyme Technology in Food Processing: Recent Developments and Future Prospects. Innovative Food Processing Technologies 2021, 191–215. [Google Scholar]
- B. M., . E. V., . S. D. Effect of pH and temperature on the activities of alpha-amylase in cassava starch liquefaction. African Journal of Food Science and Technology 2018, 9, 2141–5455. [Google Scholar]
- Shukla, P. Singh, R. Singh Mahatma. Amylases: an overview with special reference to alpha amylase Antimicrobial production View project Biodeterioration on Khajuraho monuments View project. Article in Journal of Global Biosciences 2015, 4, 1886–1901. [Google Scholar]
- E. K., . S., . a. R. F. Z Rayhani1. Classification of dextrose equivalent analysis maltodextrin starch seeds through enzymatic hydrolysis reaction. IOP Conf. Series: Materials Science and Engineering 2018, 420, 012072. [Google Scholar]
- P. J. S. a. S. C. O. Raymond C, Rowe. Handbook of Pharmaceutical Excipients; Pharmaceutical Press: Billingham, Great Brittain, 2006. [Google Scholar]
- G.-J. Shen, B. C. Saha, Y.-E. Lee. Purification and characterization of a novel thermostable f-amylase from Clostridium thermosuiphurogenes. Biochemistry 1988, 254. [Google Scholar]
- S. W. K., Sumaiyah. Preparation and Characterization of Dextrin Obtained from Xanthosoma sagittifolium (L.) Schott Starch with Acid Catalyst and Enzymatic Methods. Indonesian Journal of Pharmaceutical and Clinical Research 2018, 01, 47–53. [Google Scholar]
- G., Fox. Starch in Brewing Applications. Starch in Food: Structure, Function, and Applications 2017, 633–659. [Google Scholar]
- R. A. Arfah, A. Ahmad, S. Dali. Utilization of α-amylase enzyme from Bacillus stearothermophilus RSAII1B for maltodextrin production from sago starch. Journal of Physics, 2018; 979. [Google Scholar]
- E. D. J. Y. A. &. B. A. Anwar. Utilization Maltodextrin Wheat Starch as an Excipient in the Formula Preparations of Tablte and Niosomes. Ilmu Kefarmasian 2004, 1, 34–46. [Google Scholar]
- H. Ma, M. Liu, Y. Liang. Research progress on properties of pre-gelatinized starch and its application in wheat flour productsResearch progress on properties of pre-gelatinized starch and its application in wheat flour products. Grain & Oil Science and Technology 2022, 5, 87–97. [Google Scholar]
- M. J. S. M. C. T. D. S. C. &. G. R. G., Tizzotti. New 1H NMR procedure for the characterization of native and modified food-grade starches. Journal of Agricultural and Food Chemistry 2011, 59, 6913–6919. [Google Scholar]
- M. J., Gidley. Quantification of the Structural Features of Starch Polysaccharides by NMR Spectroscopy. Carbohydrate Research 1985, 139, 85–93. [Google Scholar]
- Kainuma, *!!! REPLACE !!!*. Starch Oligosaccharides: Linier, Branched, and Cyclic. Chemistry and Technology 1984, 125–152. [Google Scholar]
- H. N. &. N. T. G., Cheng. Solution NMR spectroscopy of food polysaccharides. Polymer reviews 2012, 52, 81–114. [Google Scholar]
- C. M. L. C. H. C. Y. Y. J. C. T. T. Y. G. T. R. W. M. C. &. L. S. L., Su. Dextran-g-lauric acid as IKK complex inhibitor carrier. RSC Advances 2017, 7, 56247–56255. [Google Scholar]
- HMDP, "13C-NMR Spectrum (1D,800 MHz, D2O predicted," Canada, 2023.
- T. L. V. J. C. F. W. A. B. Joao Paulo Soto, Veiga. Characterization and productivity of cassava waste and its use as an energy source. Renewable Energy 2016, 93, 691–699. [Google Scholar]
- V. D. C. R. A. R. Natalia, Castro. "Influence of DE-value on the physicochemical properties ofmaltodextrinfor melt extrusion processes," 29 Mar 2019. 20 November. Available online: https://oatao.univ-toulouse.fr/23384/.
- M. M. &. B. M. A., Nourmohammadi. Electrophoretic synthesis of titanium oxide nanotubes. International Journal of Engineering 2012, 25, 343–349. [Google Scholar]
- C. L.-P. S. B. A.-D. A. T.-T. a. A. J. B.-E. Zenaida, Saavedra-Leos. Technological Application of Maltodextrins According to the Degree of Polymerization. Molecules 2015, 20, 21067–21081. [Google Scholar] [CrossRef] [PubMed]
- T. T. M. a. B. R. Pooria, Gill. Differential Scanning Calorimetry Techniques: Applications in Biology and Nanoscience. TJ. Biomol Tech 2010, 21, 167–193. [Google Scholar]
- P. C. a. K. N. b. Rungnaphar Pongsawatmanit, a. Thermal and rheological properties of tapioca starch gels with and without xanthan gum under cold storage. Journal of Food Engineering 2013, 117, 333–341. [Google Scholar] [CrossRef]
- P. M. J. 2. S. I. P. G. W., Taggart. Handbook of Hydrocolloids, second ed. Woodhead Publishing Limited, Cambridge, UK, pp. 108–185., ELSEVIER, 2013; pp. 108–185. [Google Scholar]
- R. P. R. B. R. v. d. S. M. I, Siemons. Dextrose equivalence of maltodextrins determines particle morphology development during single sessile droplet drying. Food Research International 2020, 131, 108988. [Google Scholar]
- J. U. Johanna, Claude. Thermal degradation of carbohydrate polymers in amorphous states: A physical study including colorimetry. Food Chemistry 2006, 96, 402–410. [Google Scholar]
- P. M. C. C. R. T. B. V. L. a. B. H. Brandi L., Cantarel. The Carbohydrate-Active EnZymes database (CAZy): an expert resource for Glycogenomics. Nucleic Acids Res 2009, PMC2686590. [Google Scholar]
- B. H. a., Bairoch. New families in the classification of glycosyl hydrolases based on amino acid sequence similarities. Biochemical Journal 1993, 781–788. [Google Scholar]
- N. H. F. C. N. A. Z. M. &. S. N. W., Yunianta. Variations in Dextrose Equivalent and Dynamic Rheology of Dextrin Obtained by Enzymatic Hydrolysis of Edible Canna Starch. International Journal of Food Properties 2015, 18, 2726–2734. [Google Scholar]
- Mezule, I. Berzina and M. Strods. The impact of substrate–enzyme proportion for efficient hydrolysis of Hay. Energies 2019, 12. [Google Scholar] [CrossRef]
- L., . a. A. S. Rissa Megavitry1*. Effect of Sago Starch Concentration on Characteristic of Sago Glucose Syrup. Food Science Tech Journal 2022, 4, 110–117. [Google Scholar]
- P. J. S. M. E. Q. Raymond C, Rowe. Handbook of Pharmaceutical Excipients, vol. Sixth Edition; P. J. S. M. E. Q. Raymond C Rowe, Ed.; RPS Publishing: Washington DC, 2009; pp. 220–222. [Google Scholar]
- P. H. P. M. Nico, Lämmerhardt. Comprehensive structural analysis of a set of various branched glucans by standard methylation analysis, 1H-NMR spectroscopy, ESI-mass spectrometry, and capillary electrophoresis. Carbohydrate Research 2020, 1–38. [Google Scholar]
- C. ·. P. N. ·. S. S. M. ·. U. C. P. ·. M. H. R. ·. N., Mazumder1. An Insight into the Gelatinization Properties Influencing the Modified Starches Used in Food Industry: A review. Food and Bioprocess Technology 2022, 1195–1223. [Google Scholar]
- S. W. K., Sumaiyah*. Preparation and Characterization of Dextrin Obtained from Xanthosoma sagittifolium (L.) Schott Starch with Acid Catalyst and Enzymatic Methods. Indonesian Journal of Pharmaceutical and clinical Research 2018, 1, 47–53. [Google Scholar]
- S. W. K., Sumaiyah. Preparation and Characterization of Dextrin Obtained from Xanthosoma sagittifolium (L.) Schott Starch with Acid Catalyst and Enzymatic Methods. Indonesian Journal of Pharmaceutical and Clinical Research (IDJPCR) 2018, 01, 47–53. [Google Scholar]
- R. S. C. S. K. S. R. S. Sita Prasad, Tiwari. Amylases: An Overview with special reference to alpha amylase. Journal of Global Biosciences 2015, 4, 1886–1901. [Google Scholar]
Figure 1.
Effect of 0.1% α-amylase enzyme hydrolysis time on DE value.
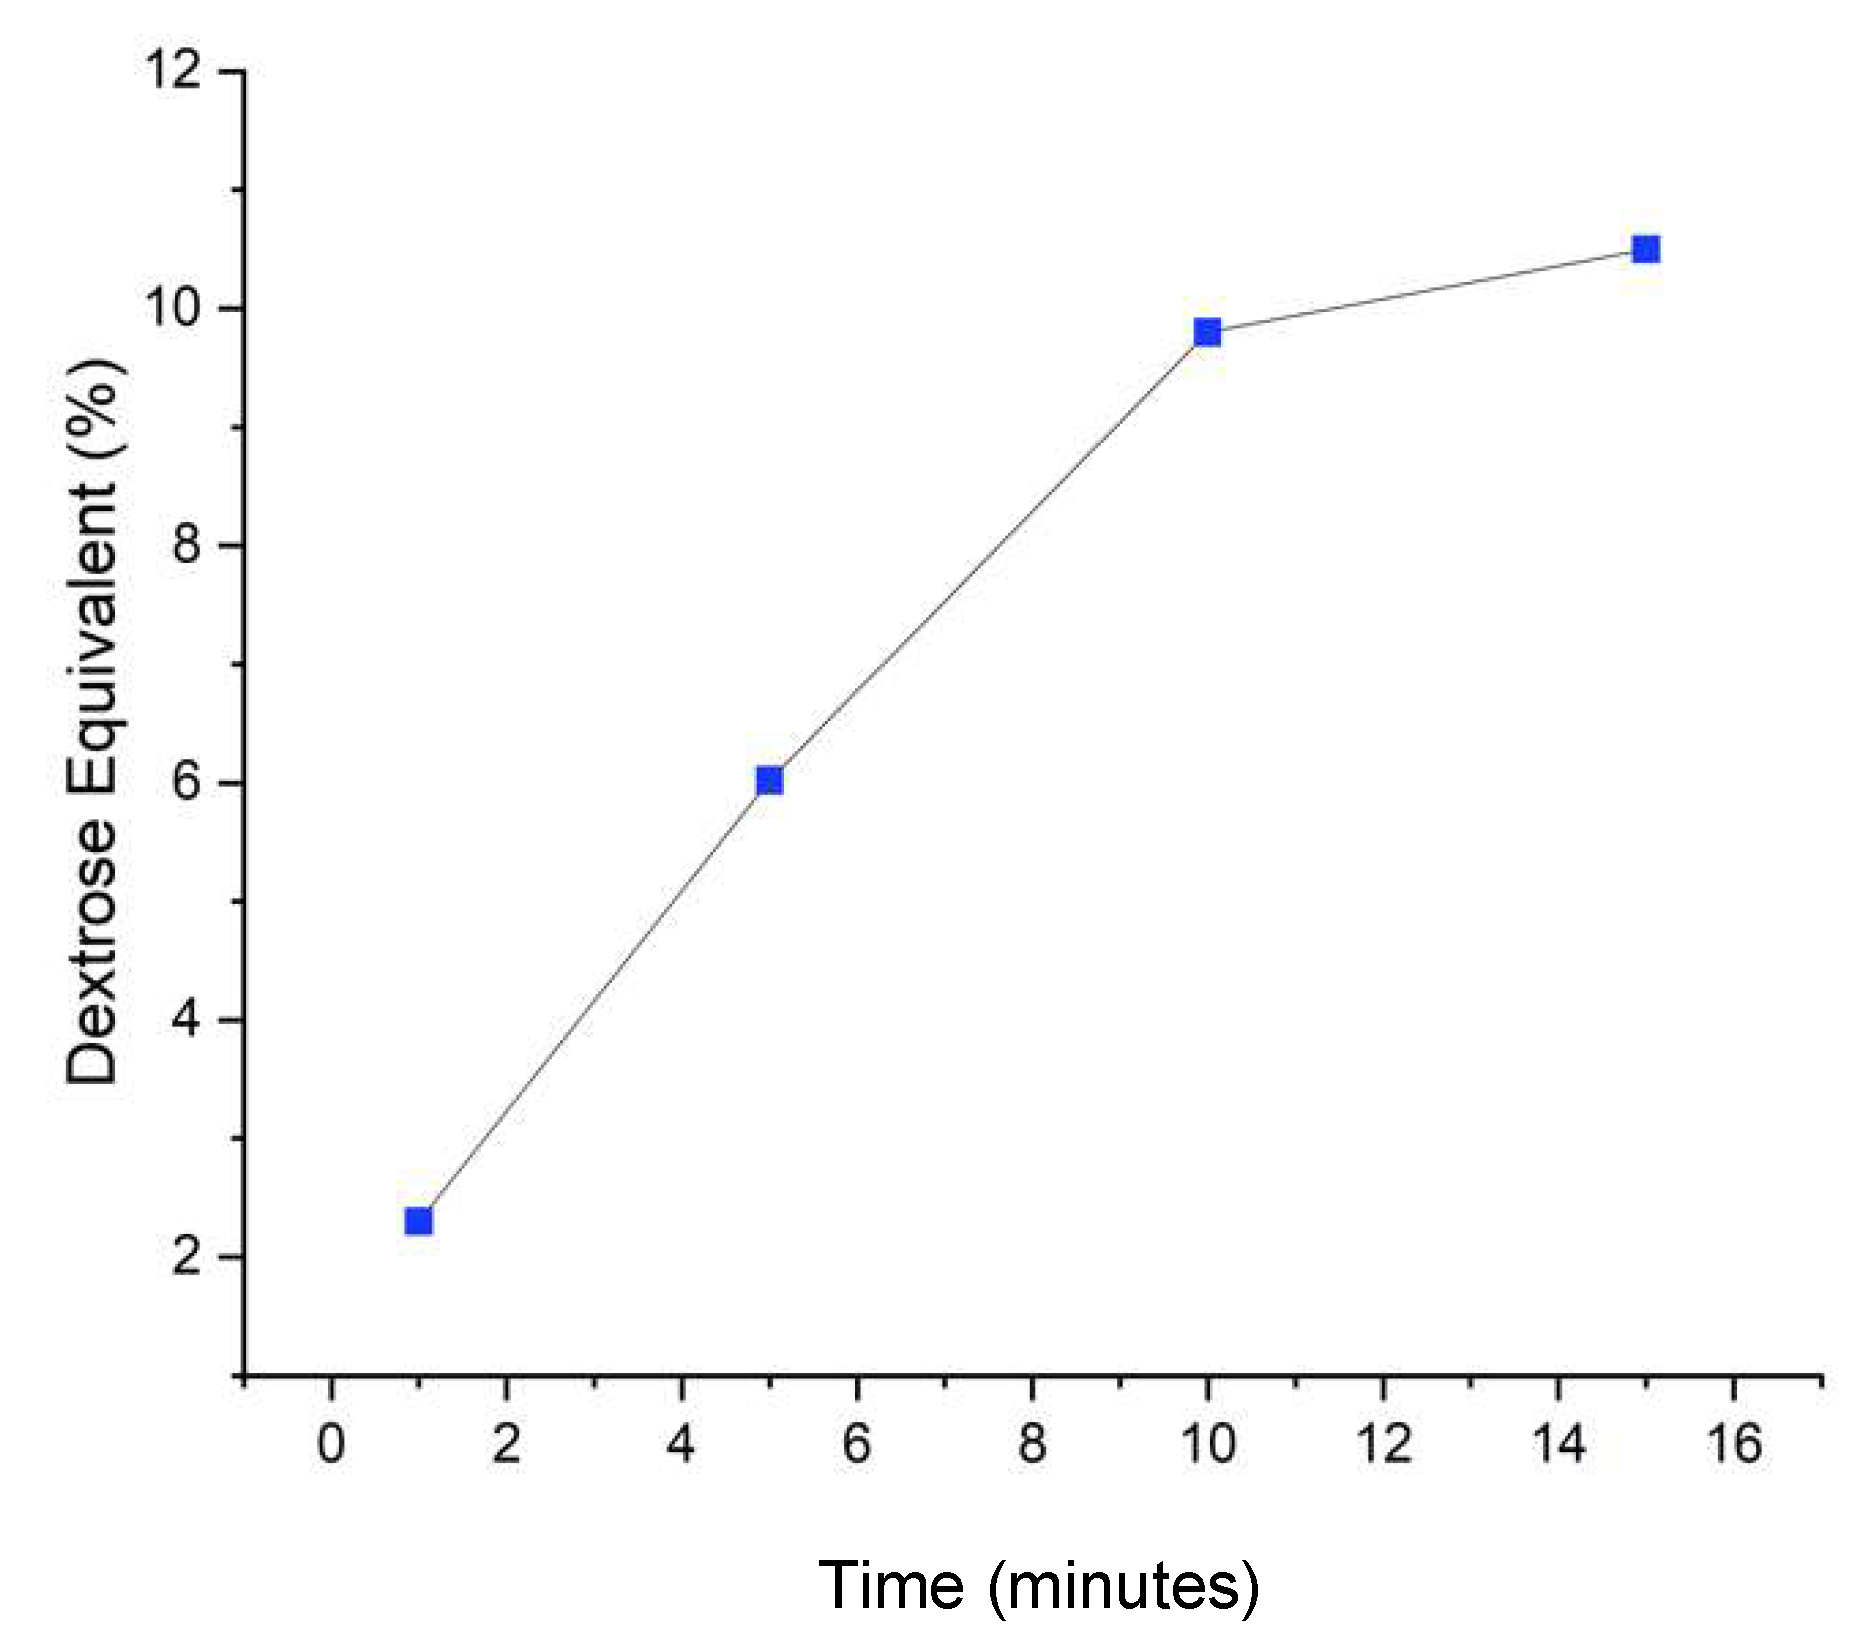
Figure 2.
The effect of hydrolysis time and concentration of the β-amylase enzyme in the mixture of α-amylase and β-amylase enzymes on the DE value.
Figure 2.
The effect of hydrolysis time and concentration of the β-amylase enzyme in the mixture of α-amylase and β-amylase enzymes on the DE value.
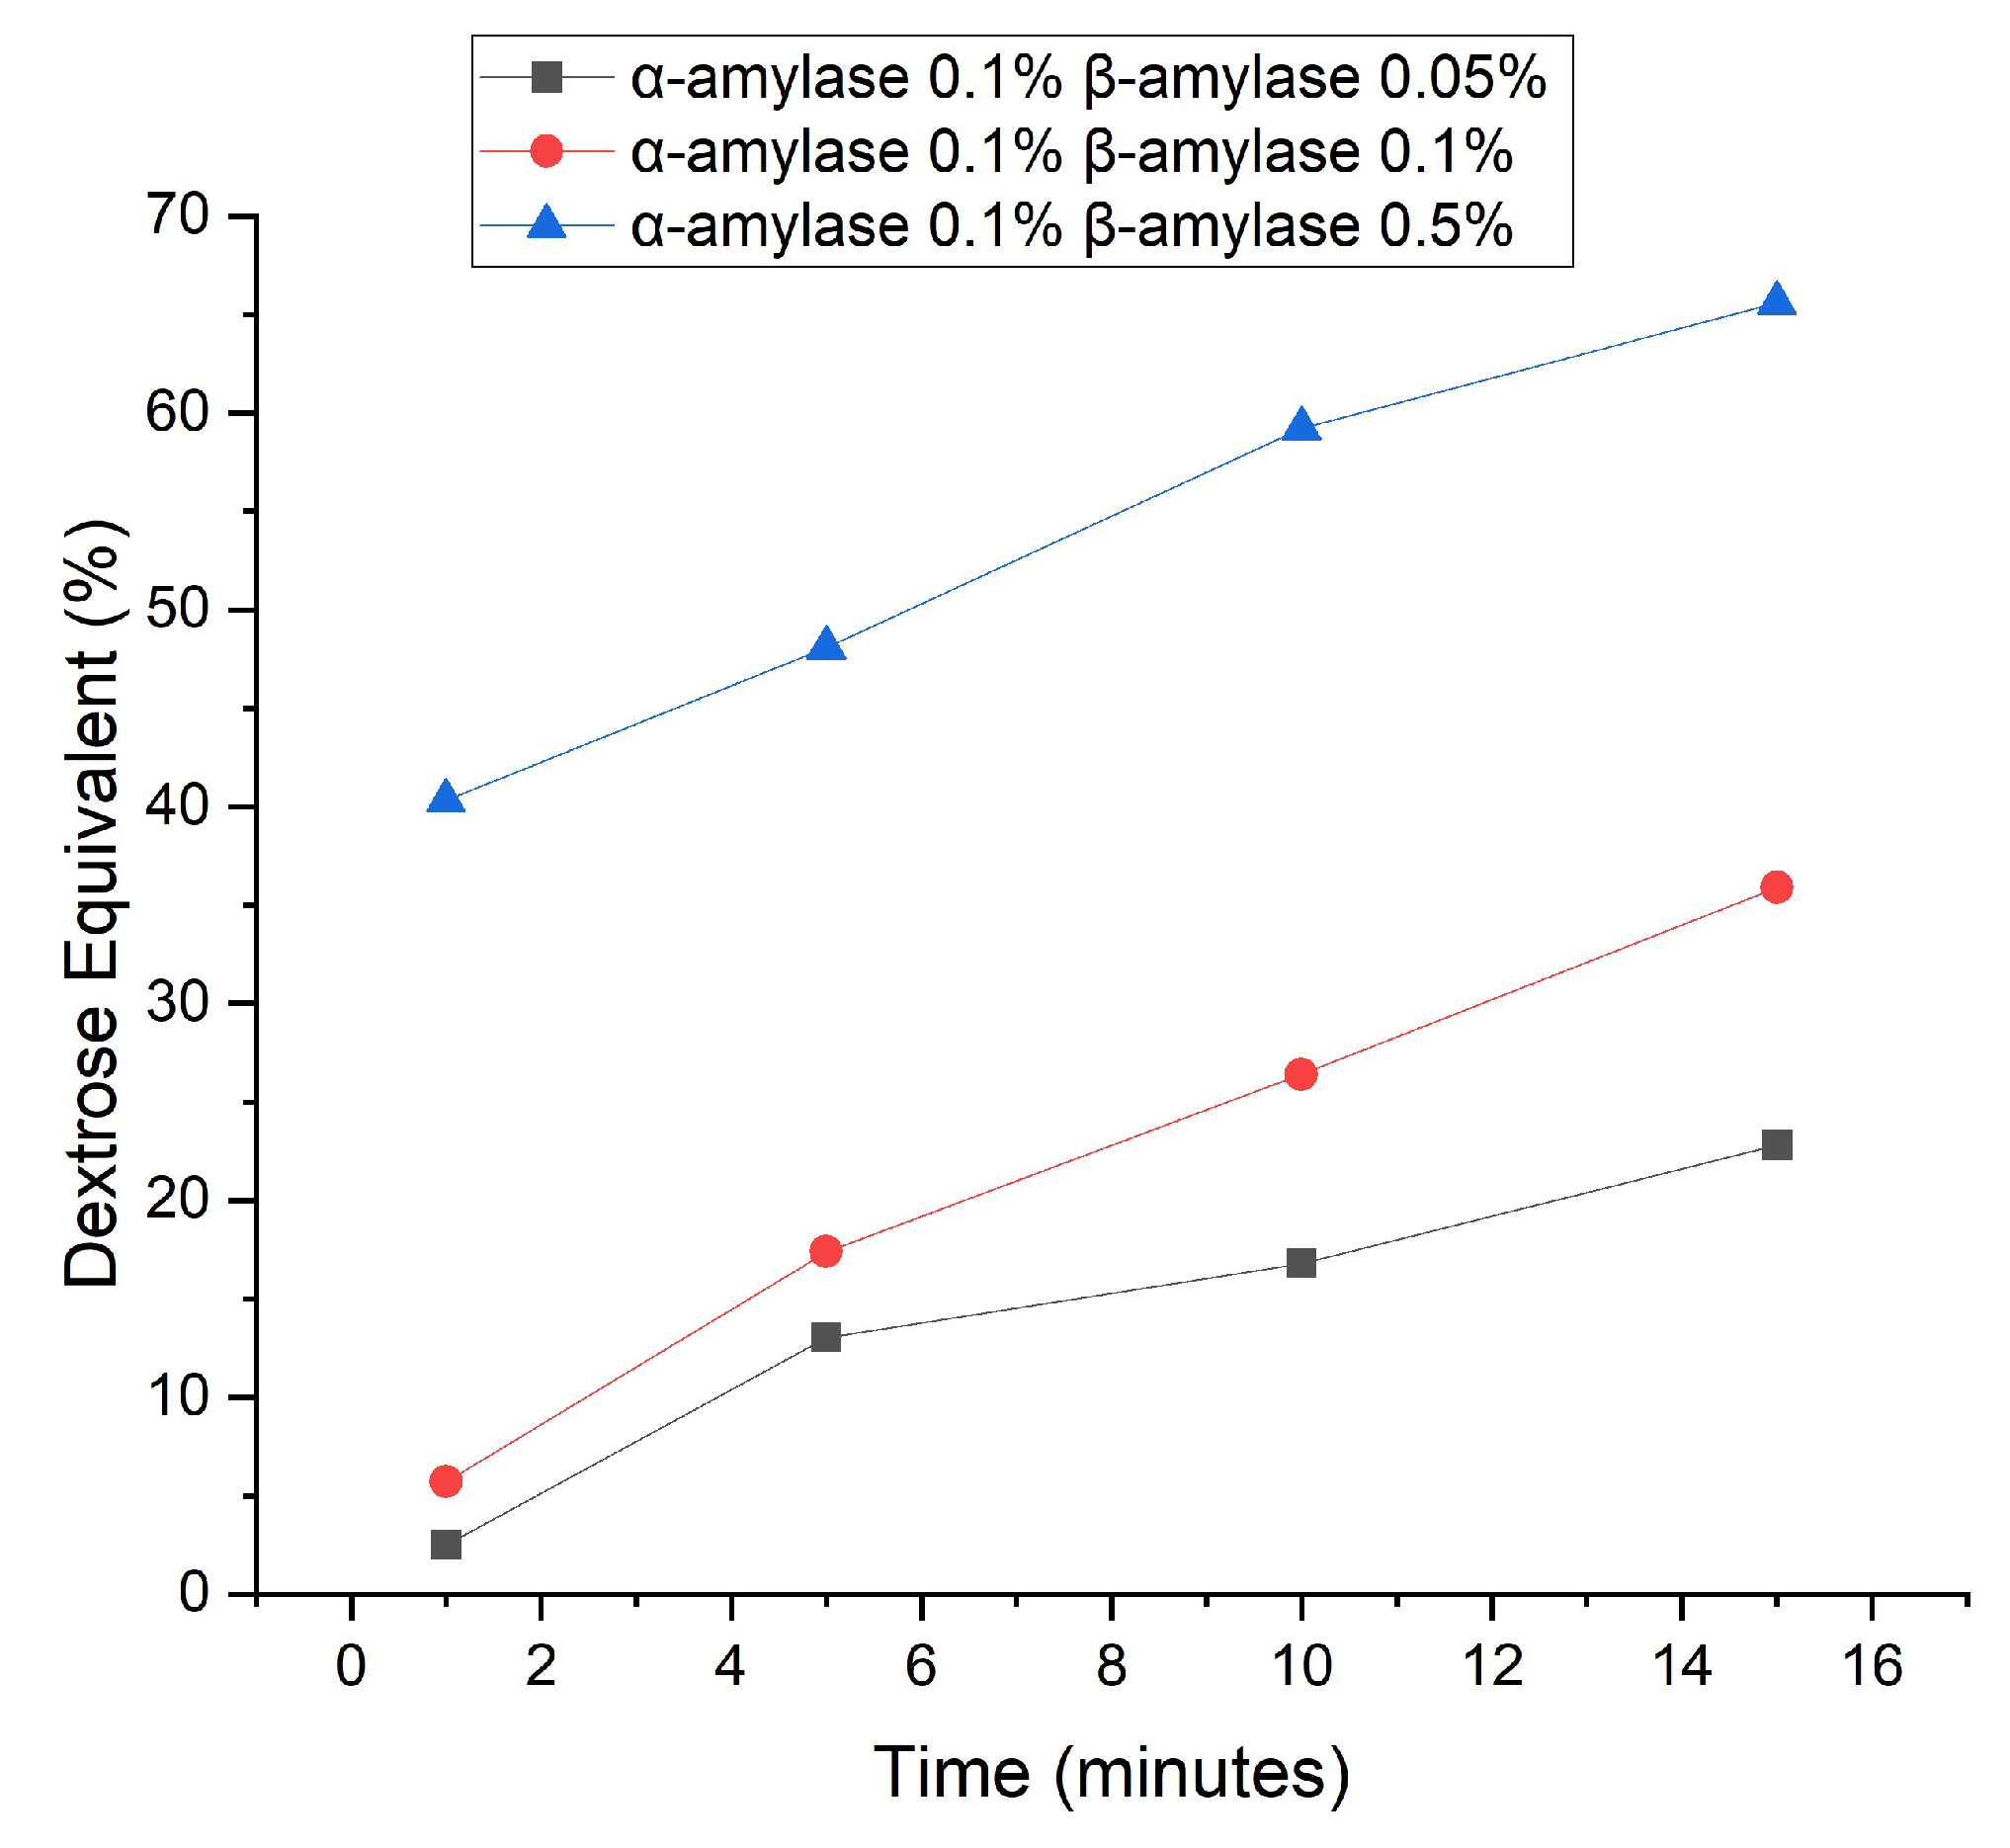
Figure 3.
Surface of hydrolysis products DE 2.5 (A) and DE 5.7 (B) via SEM.
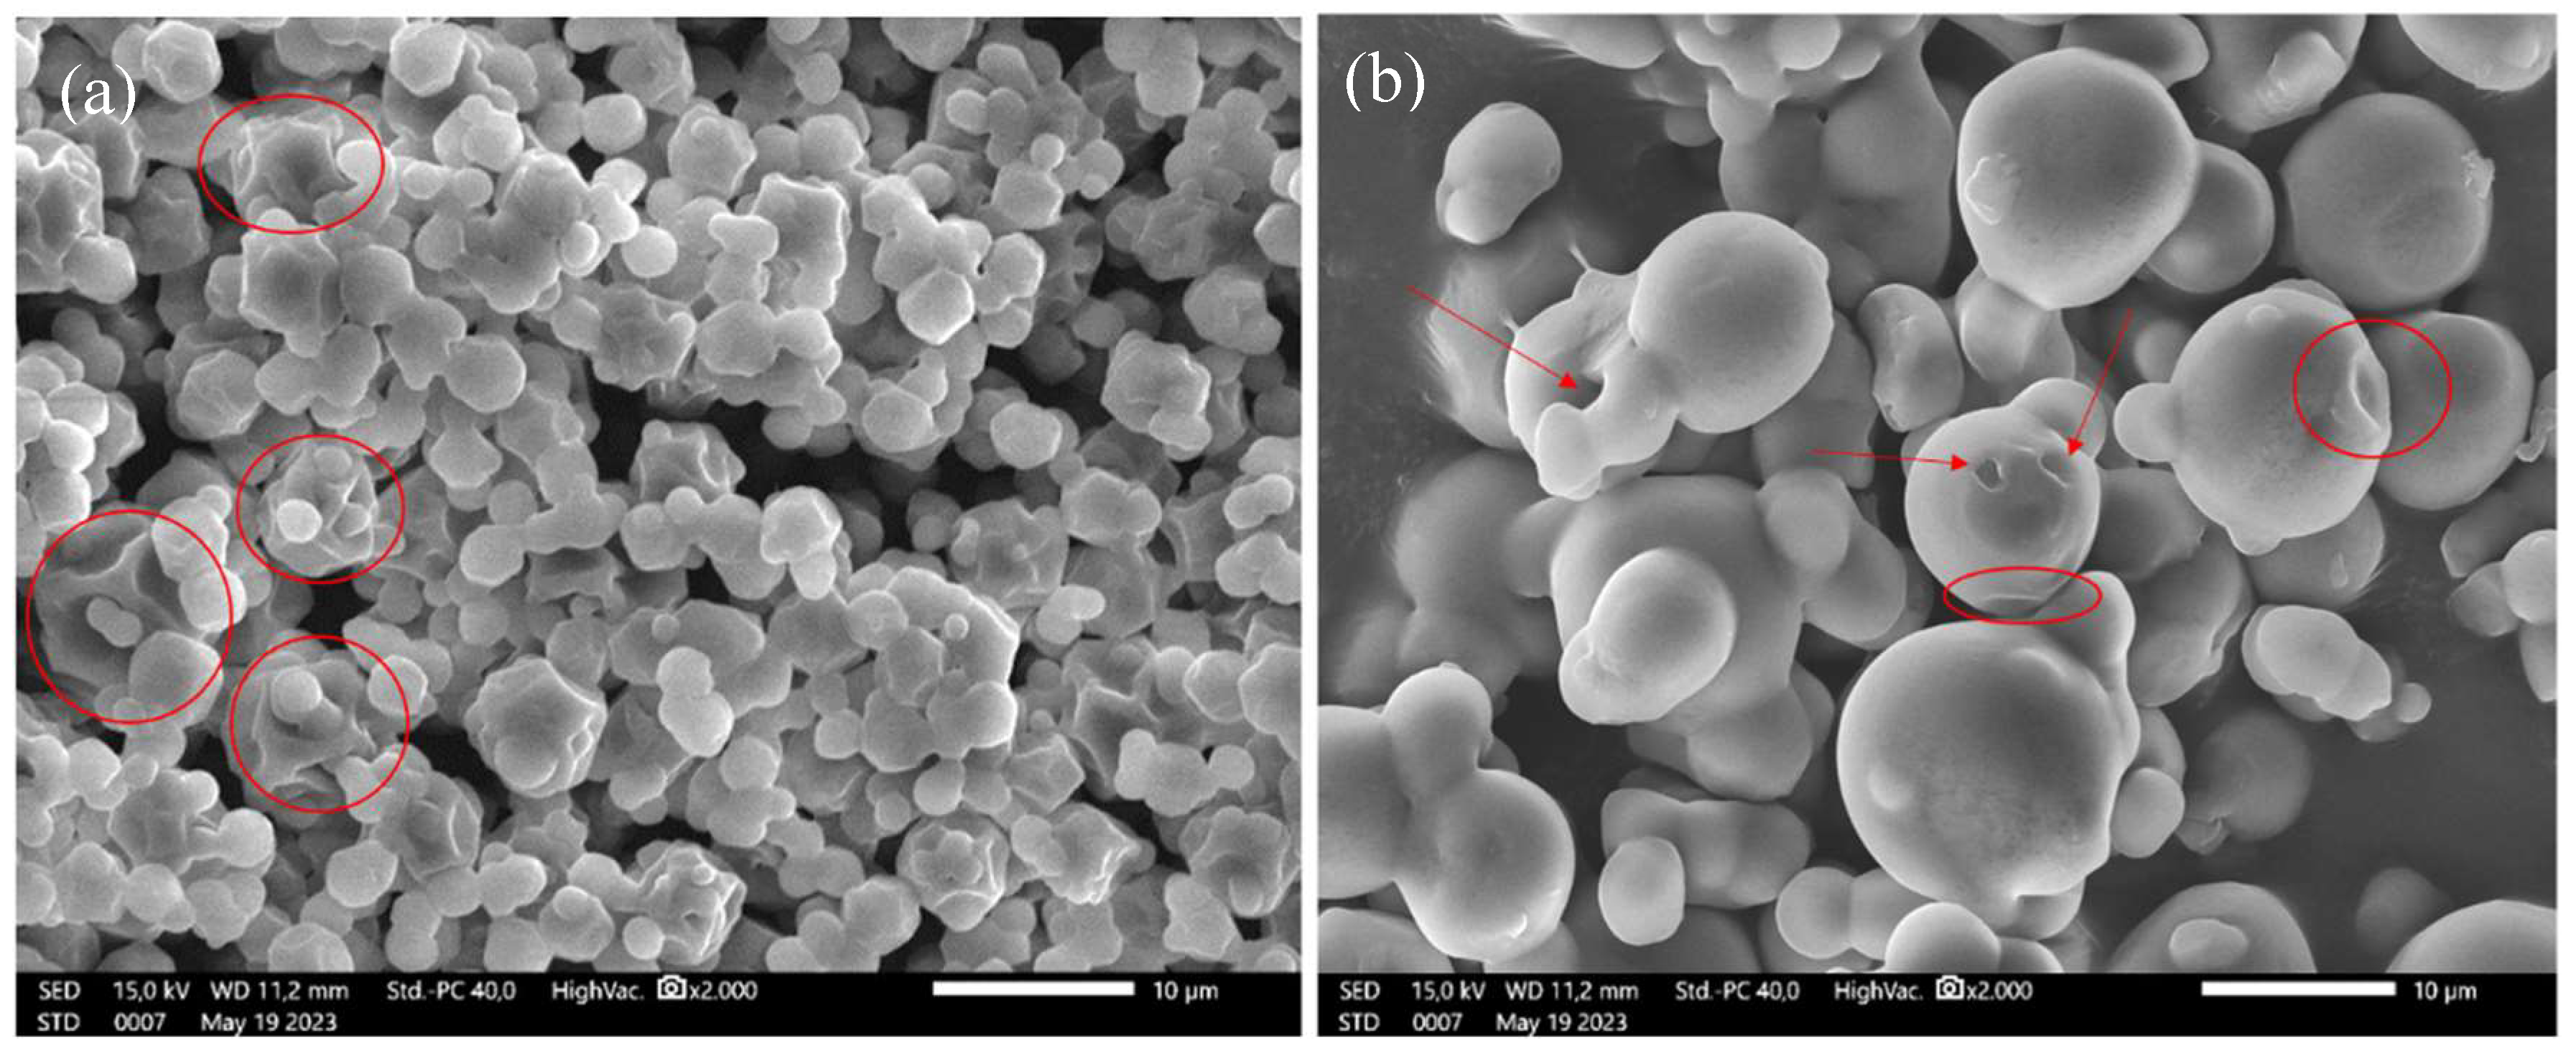
Figure 4.
1H NMR spectroscopy of Maltodextrin with DE 5.7 DE.
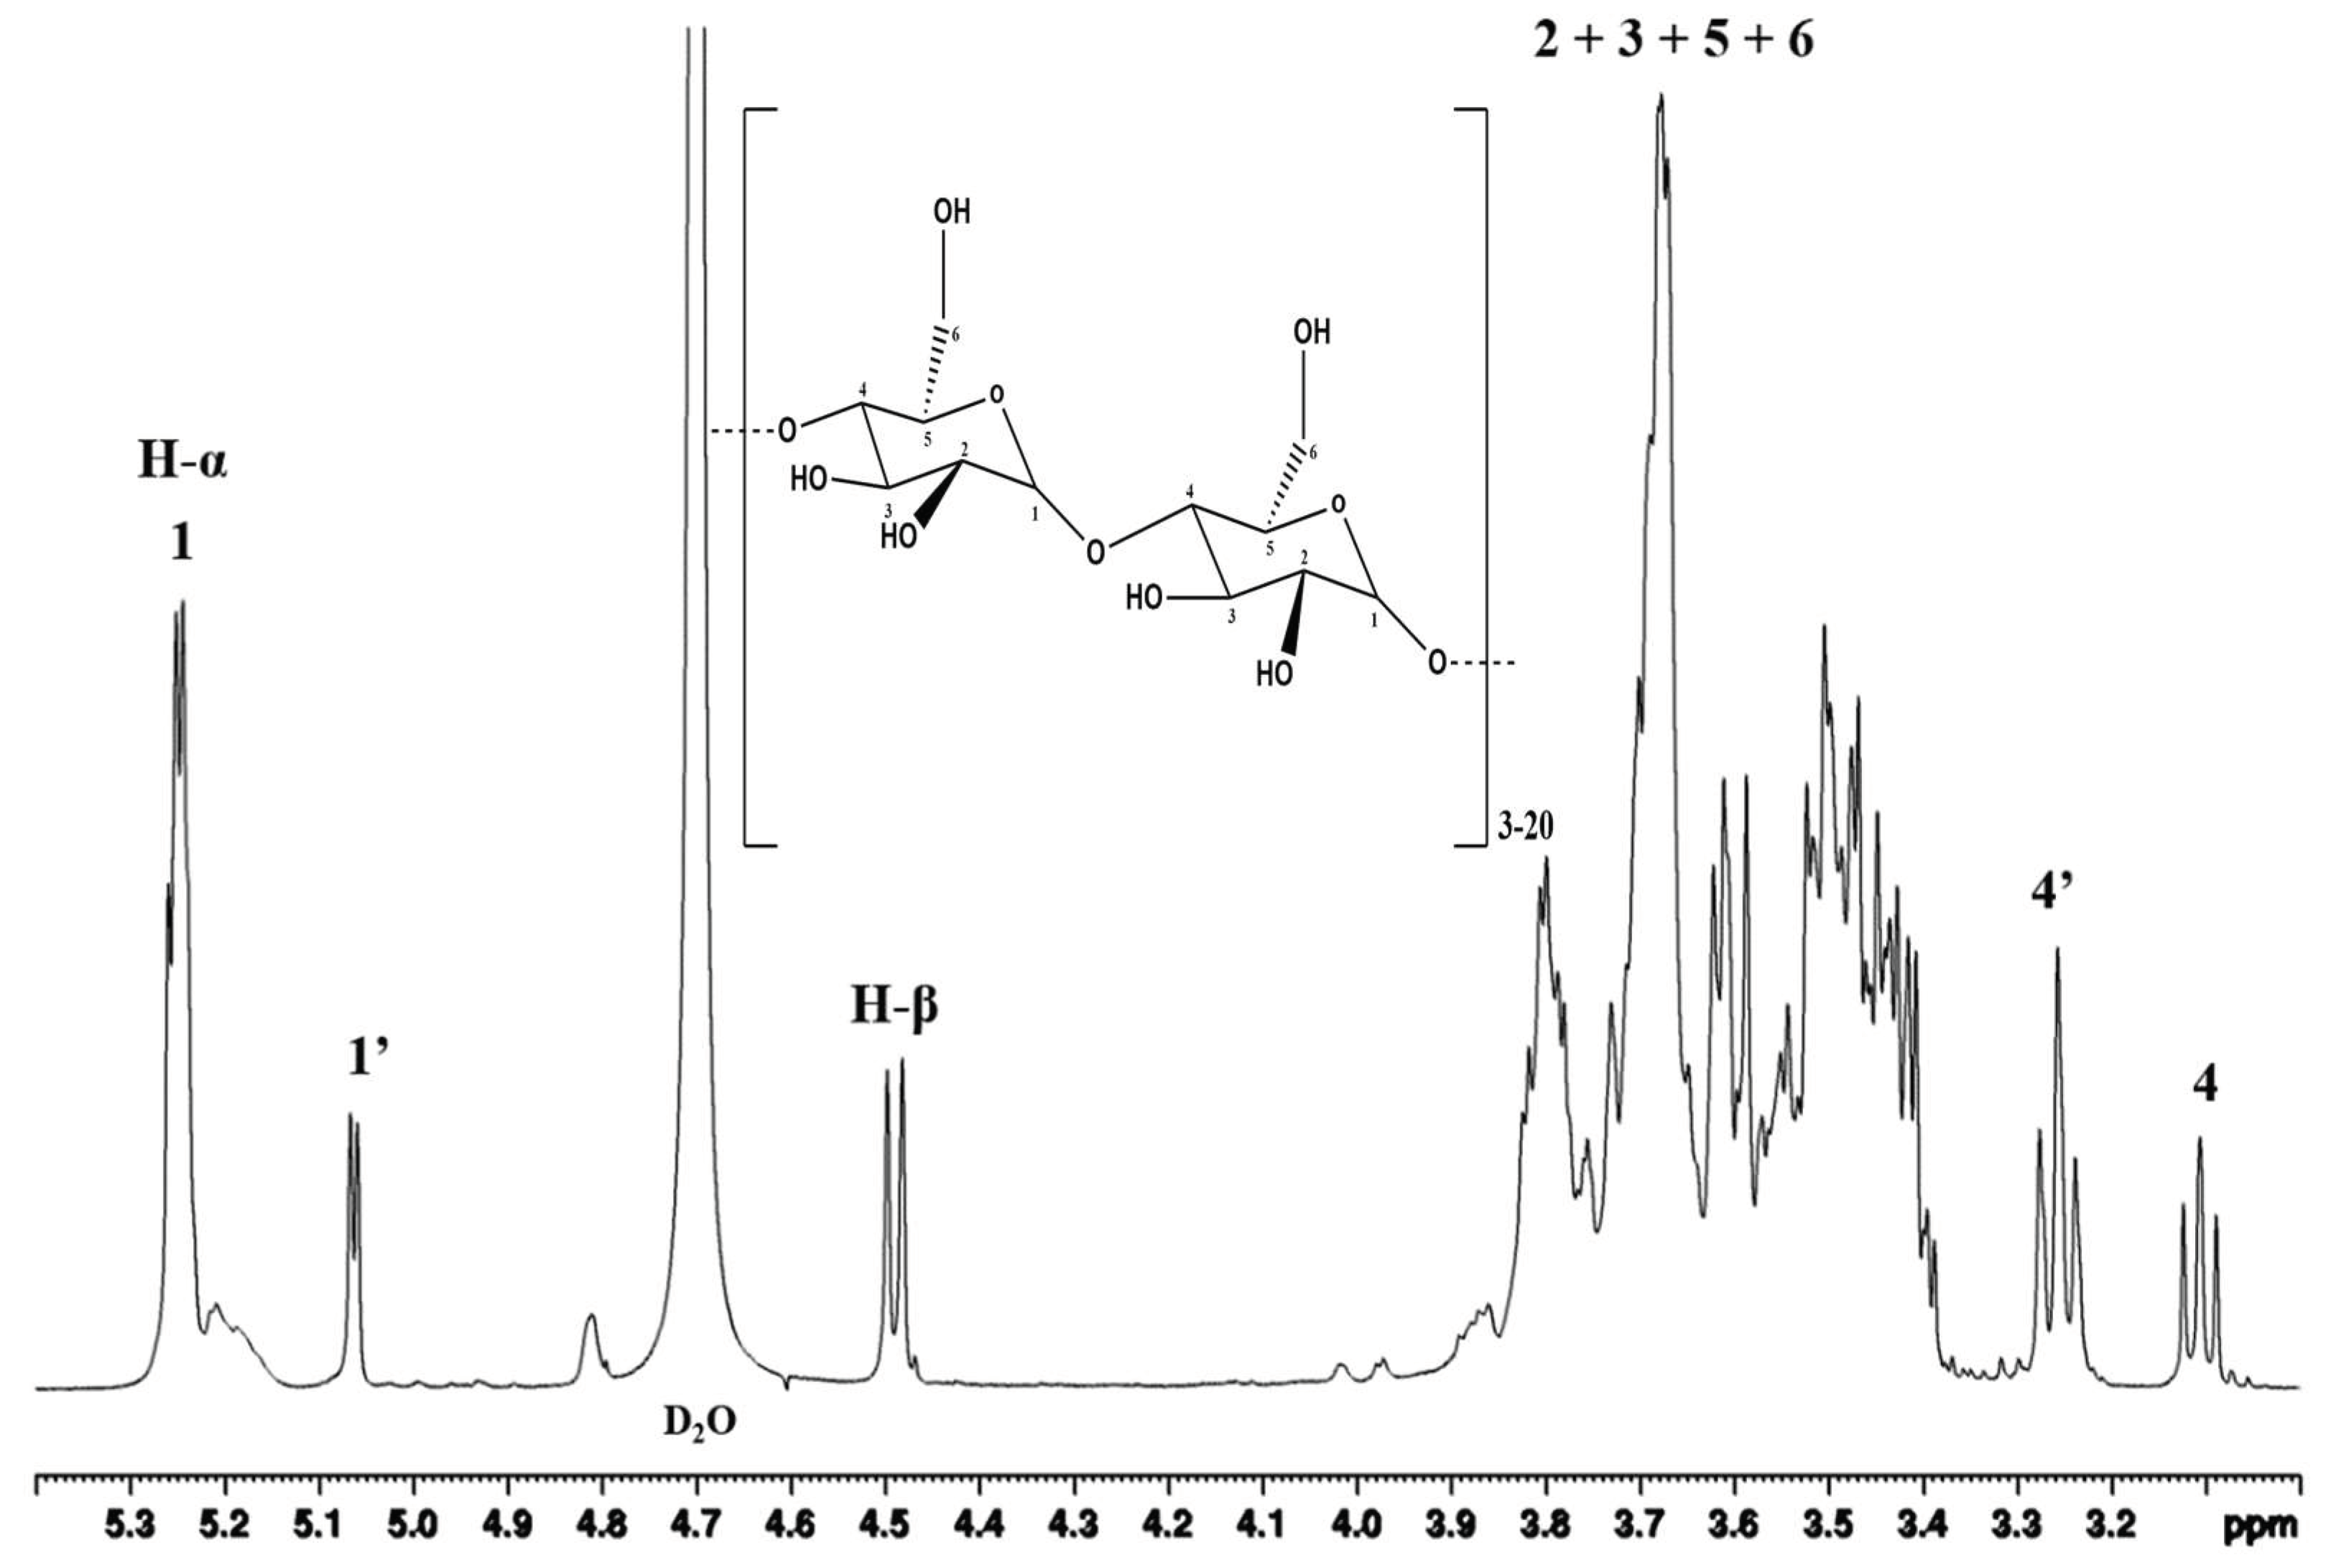
Figure 5.
13C-NMR spectroscopy of Maltodextrin with DE 5.7.
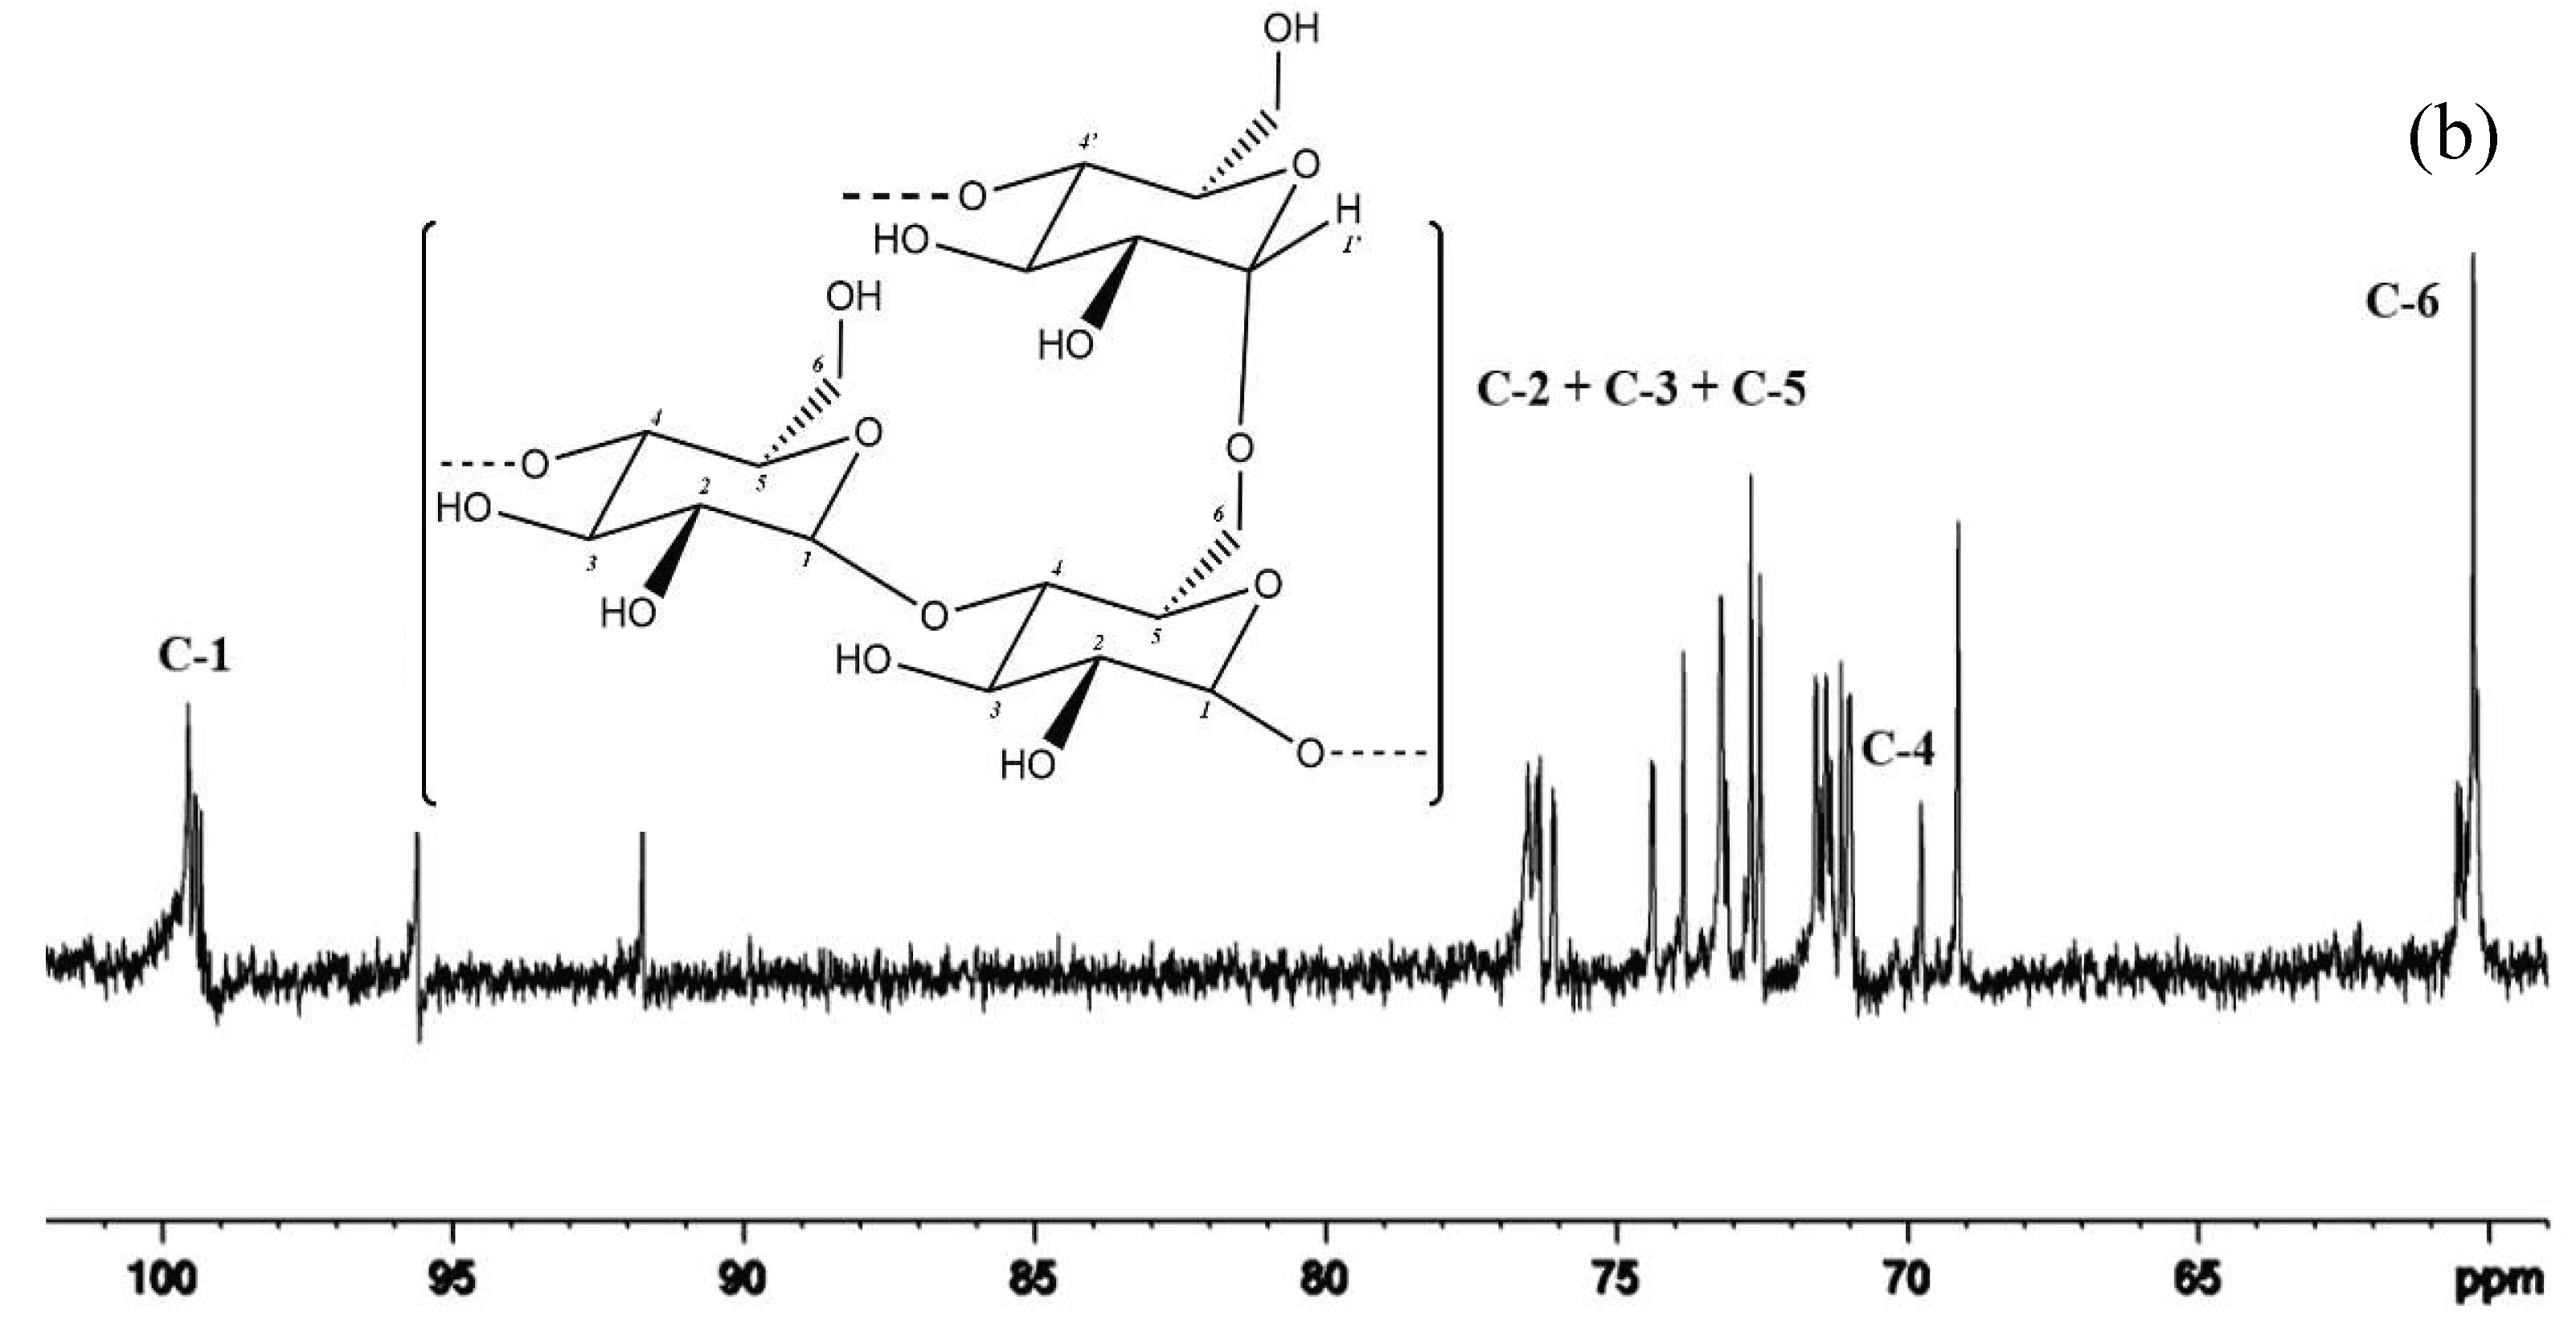
Figure 6.
TGA curve of product Weight loss with DE 2.5 and DE 5.7.
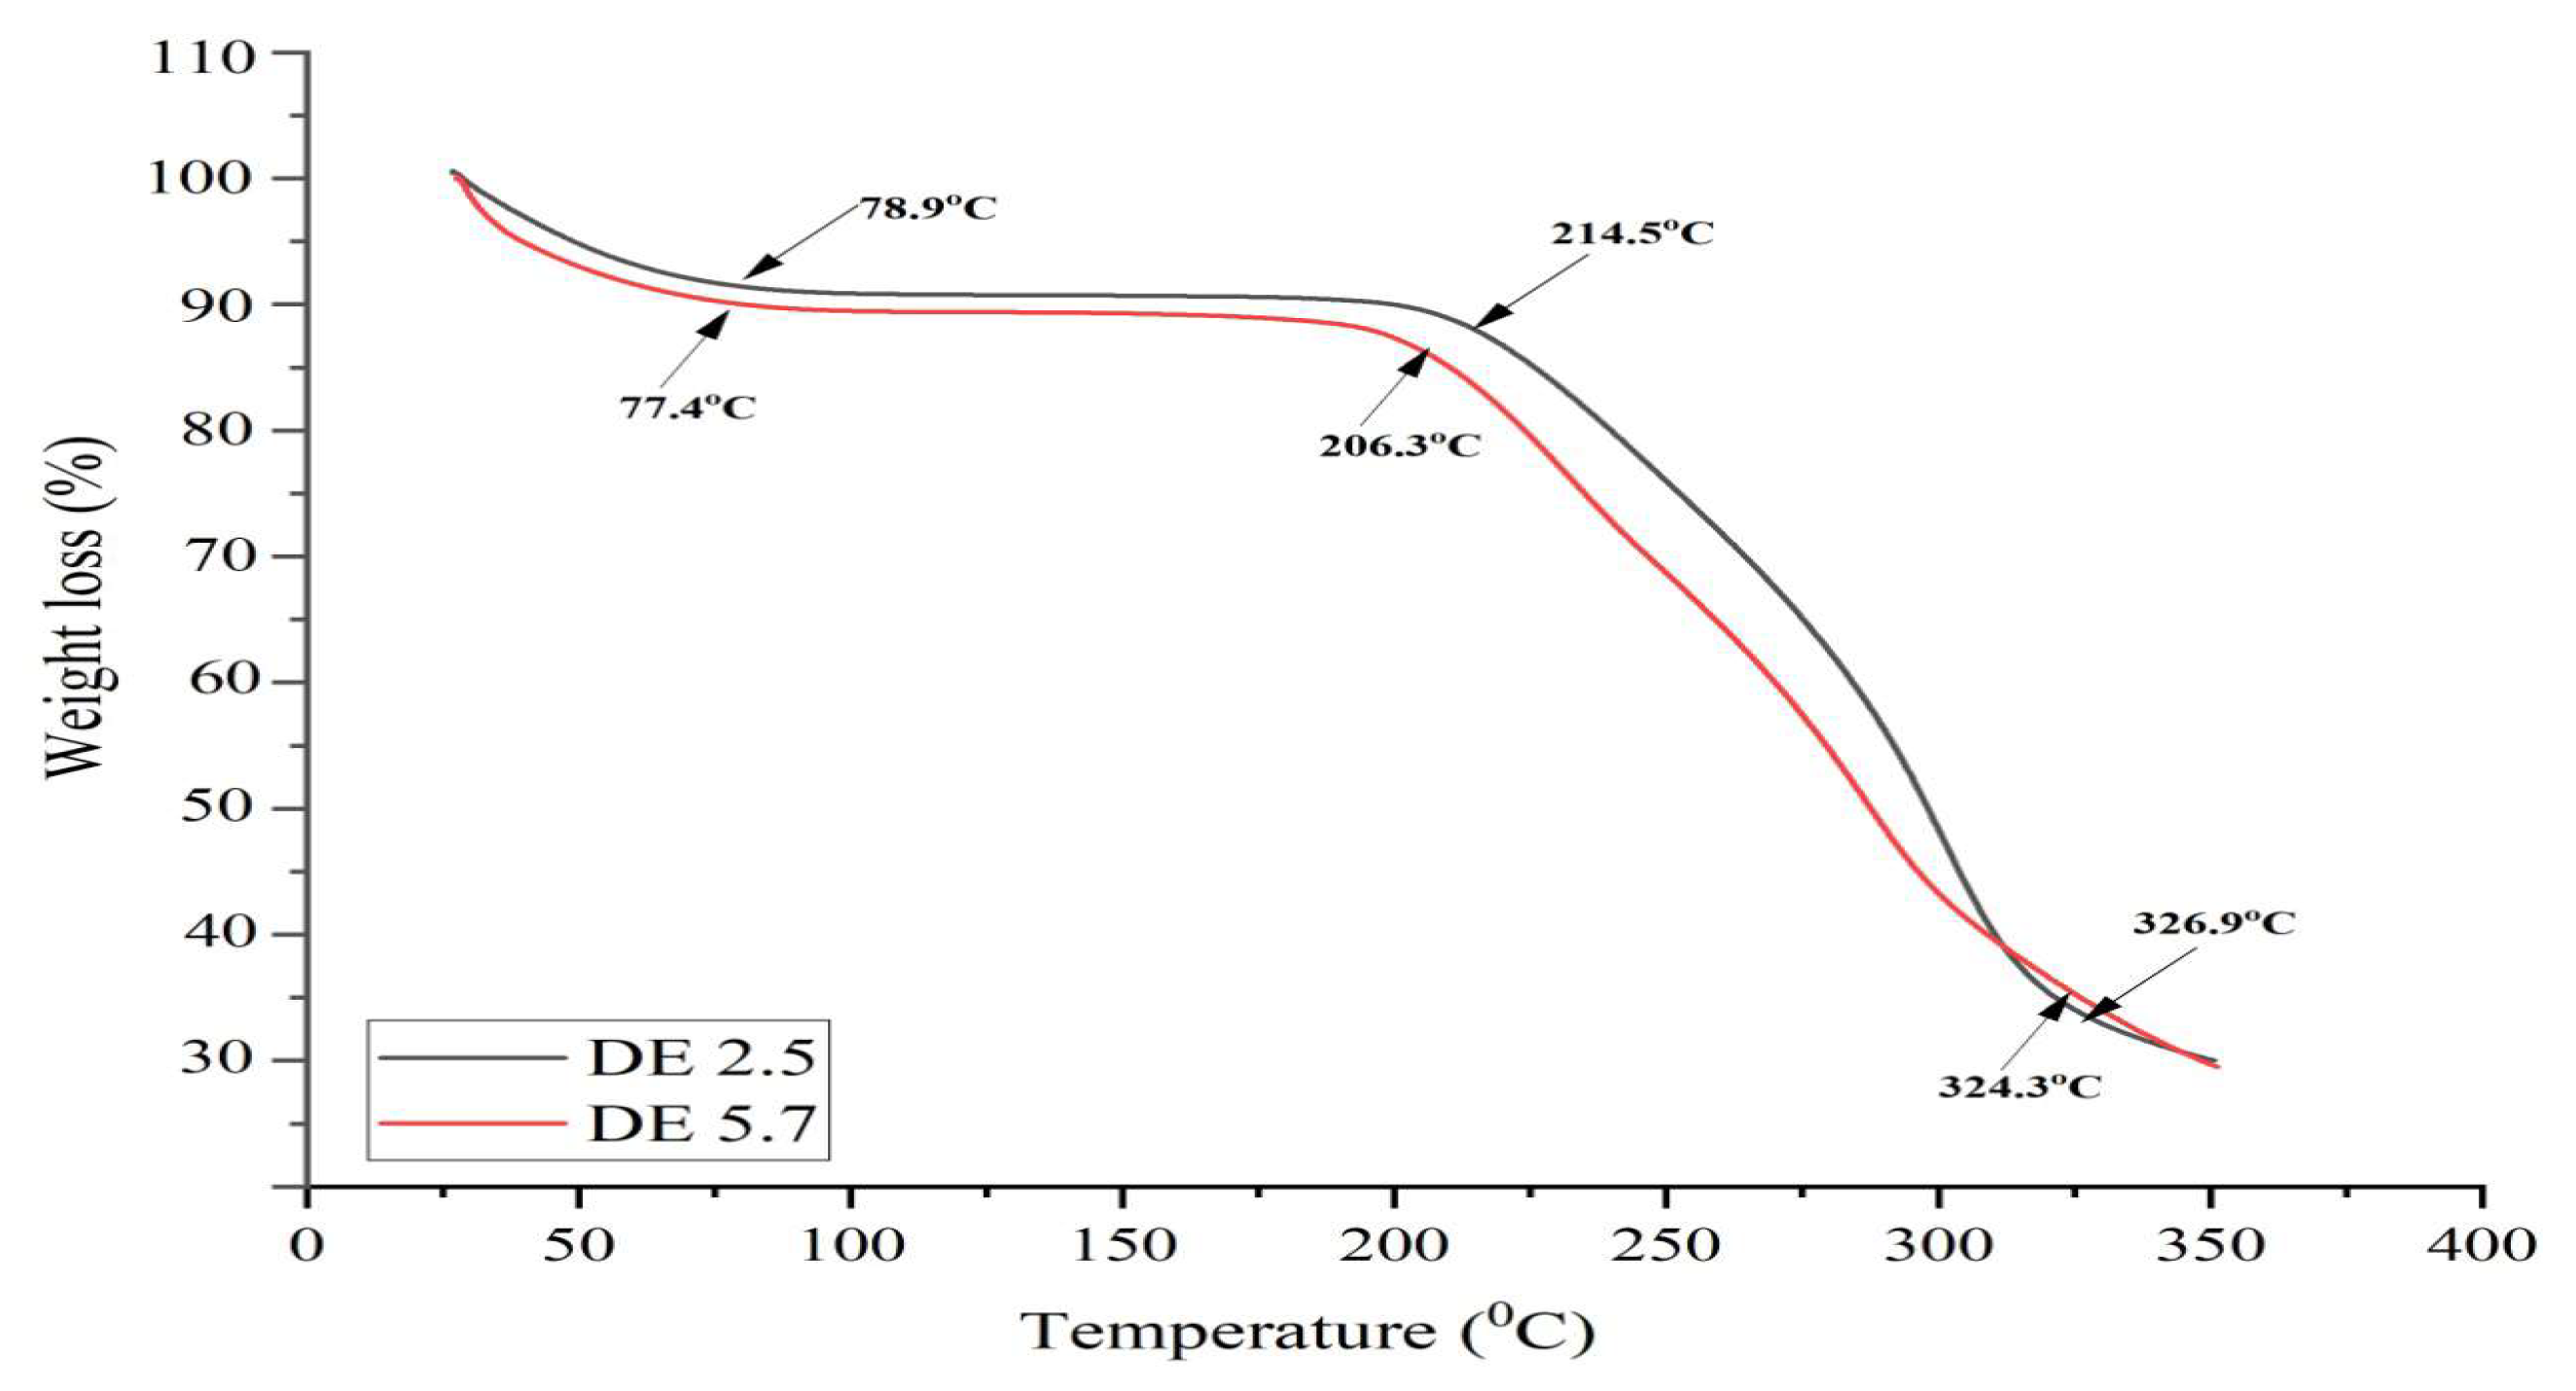
Figure 7.
DTAThermogram of. Maltodextrin DE 2.5 and DE 5.7.
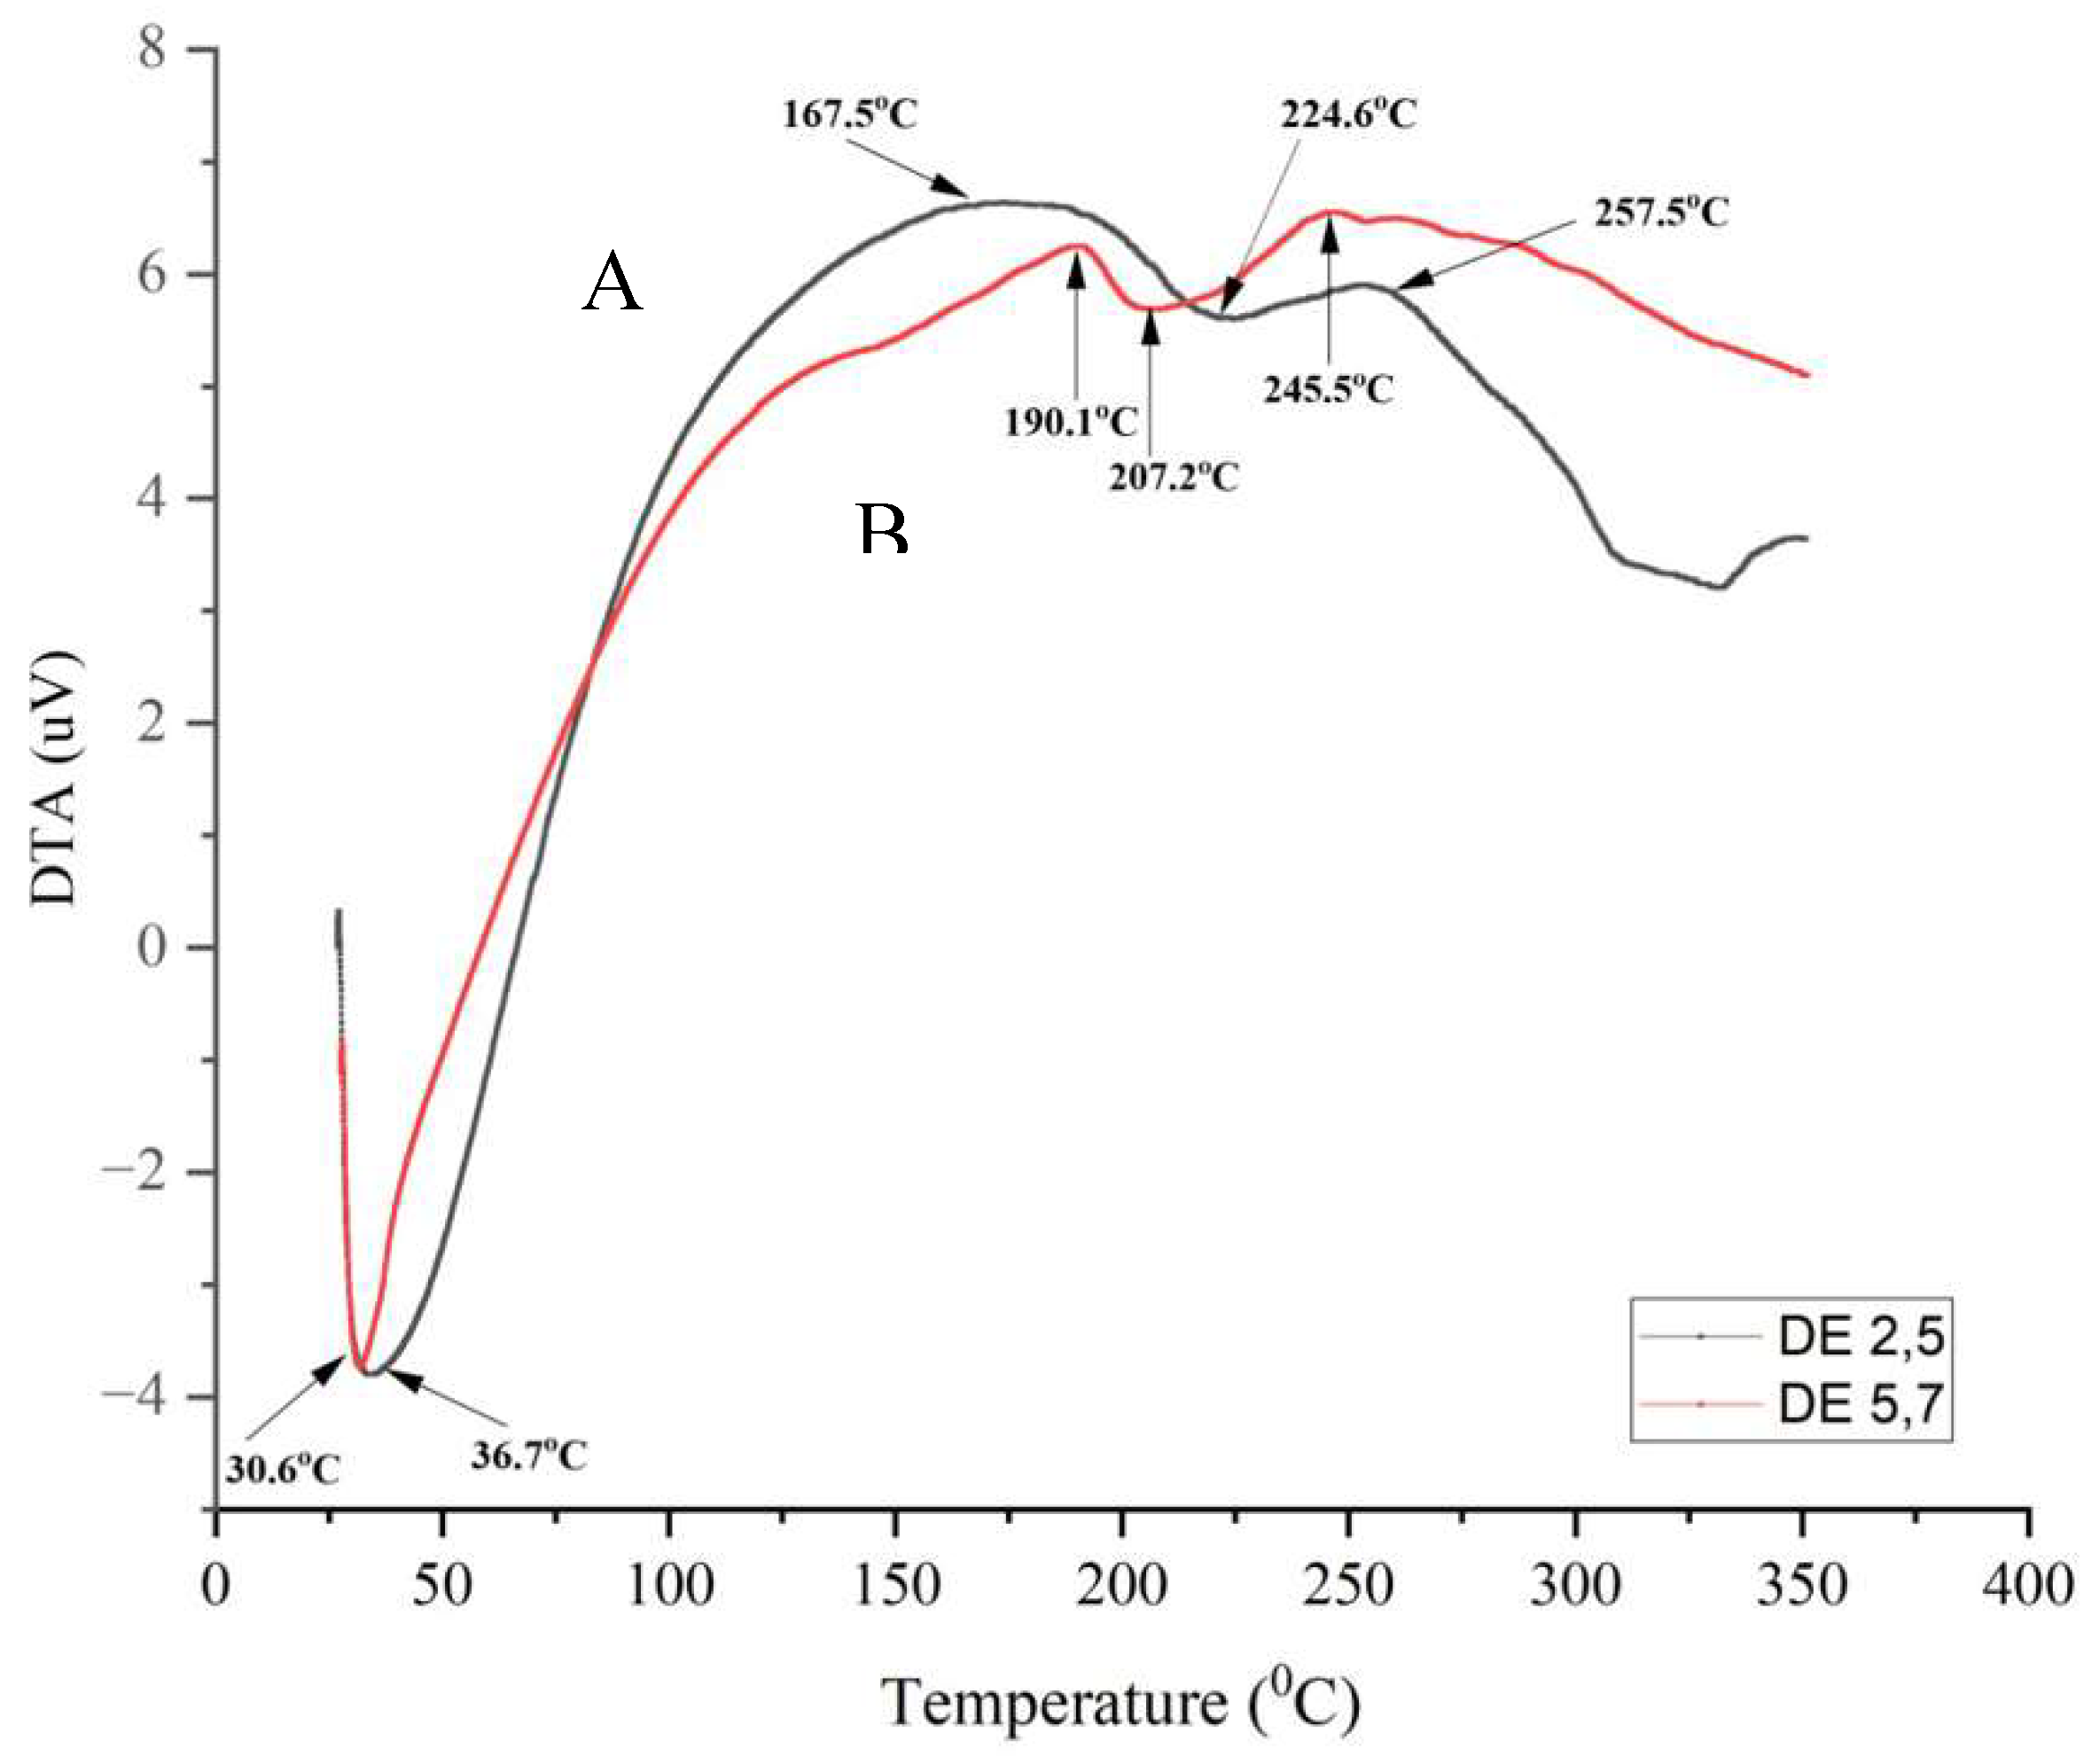
Figure 8.
DSC Thermograms of Maltodextrin DE 2.5 and 5.7.
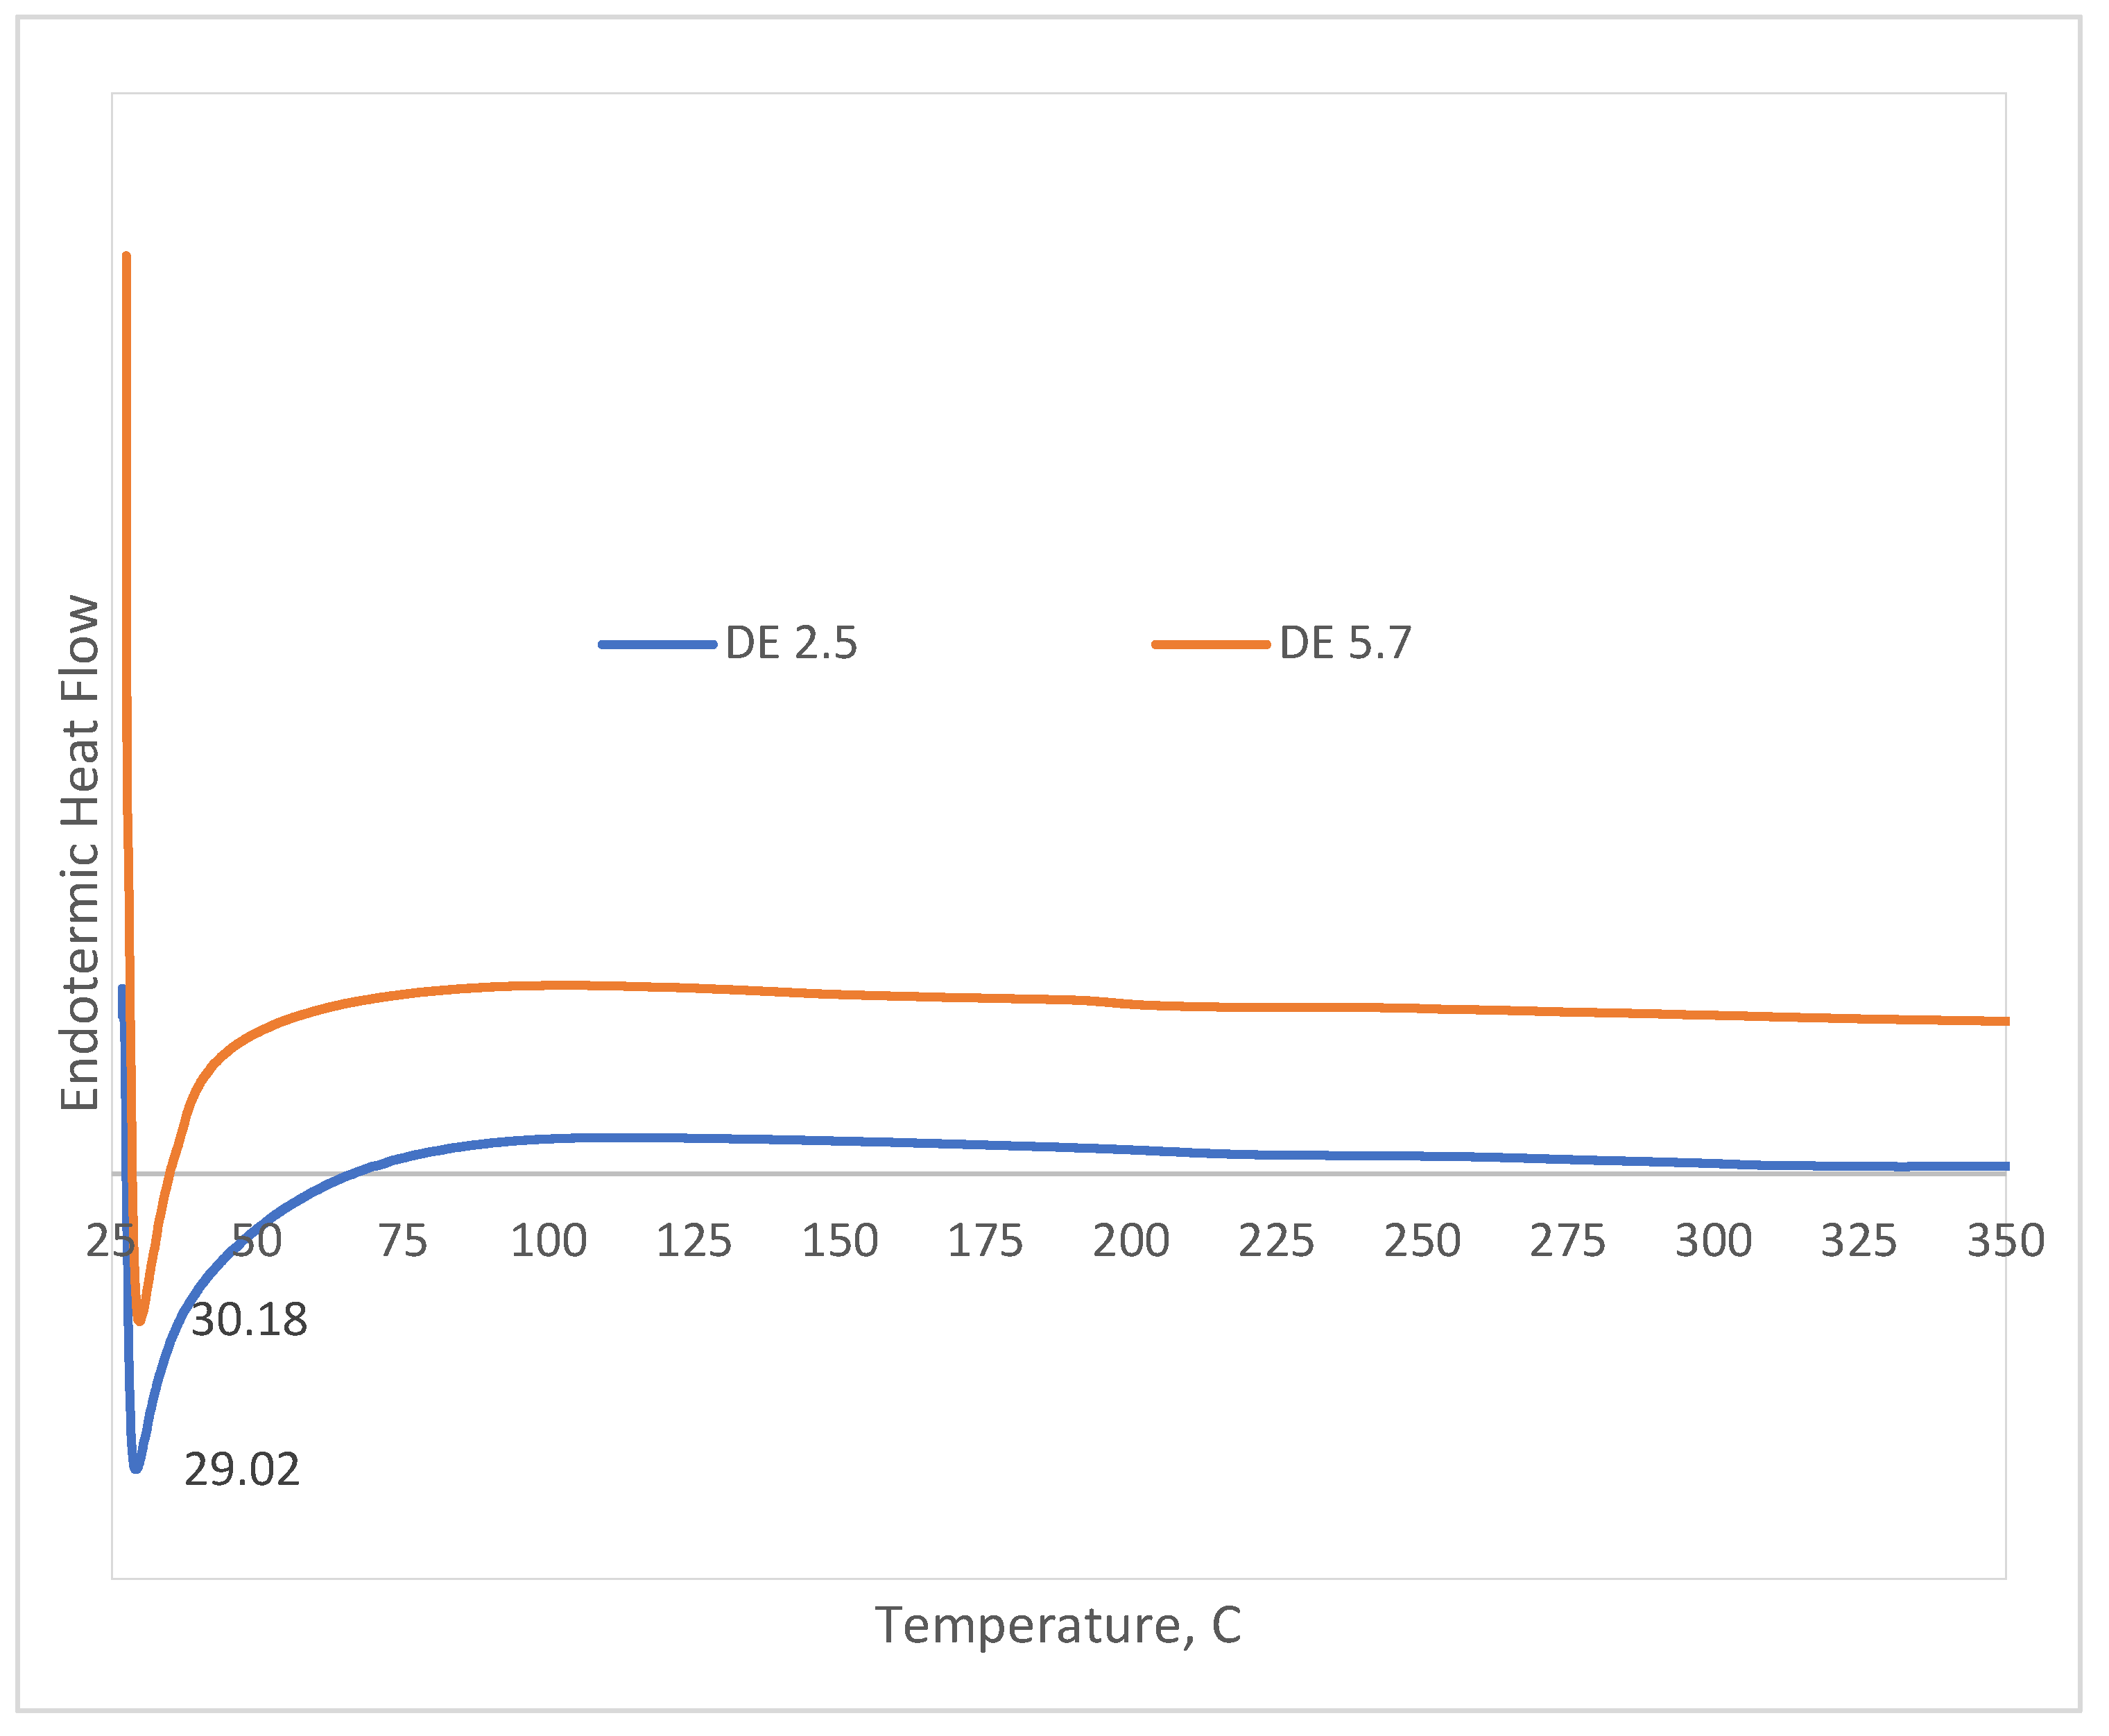
Figure 9.
The effect of substrate concentration on the DE value in hydrolysis of piles using the enzymes α-amylase 0.1% and β-amylase 0.1% for 1 minute.
Figure 9.
The effect of substrate concentration on the DE value in hydrolysis of piles using the enzymes α-amylase 0.1% and β-amylase 0.1% for 1 minute.
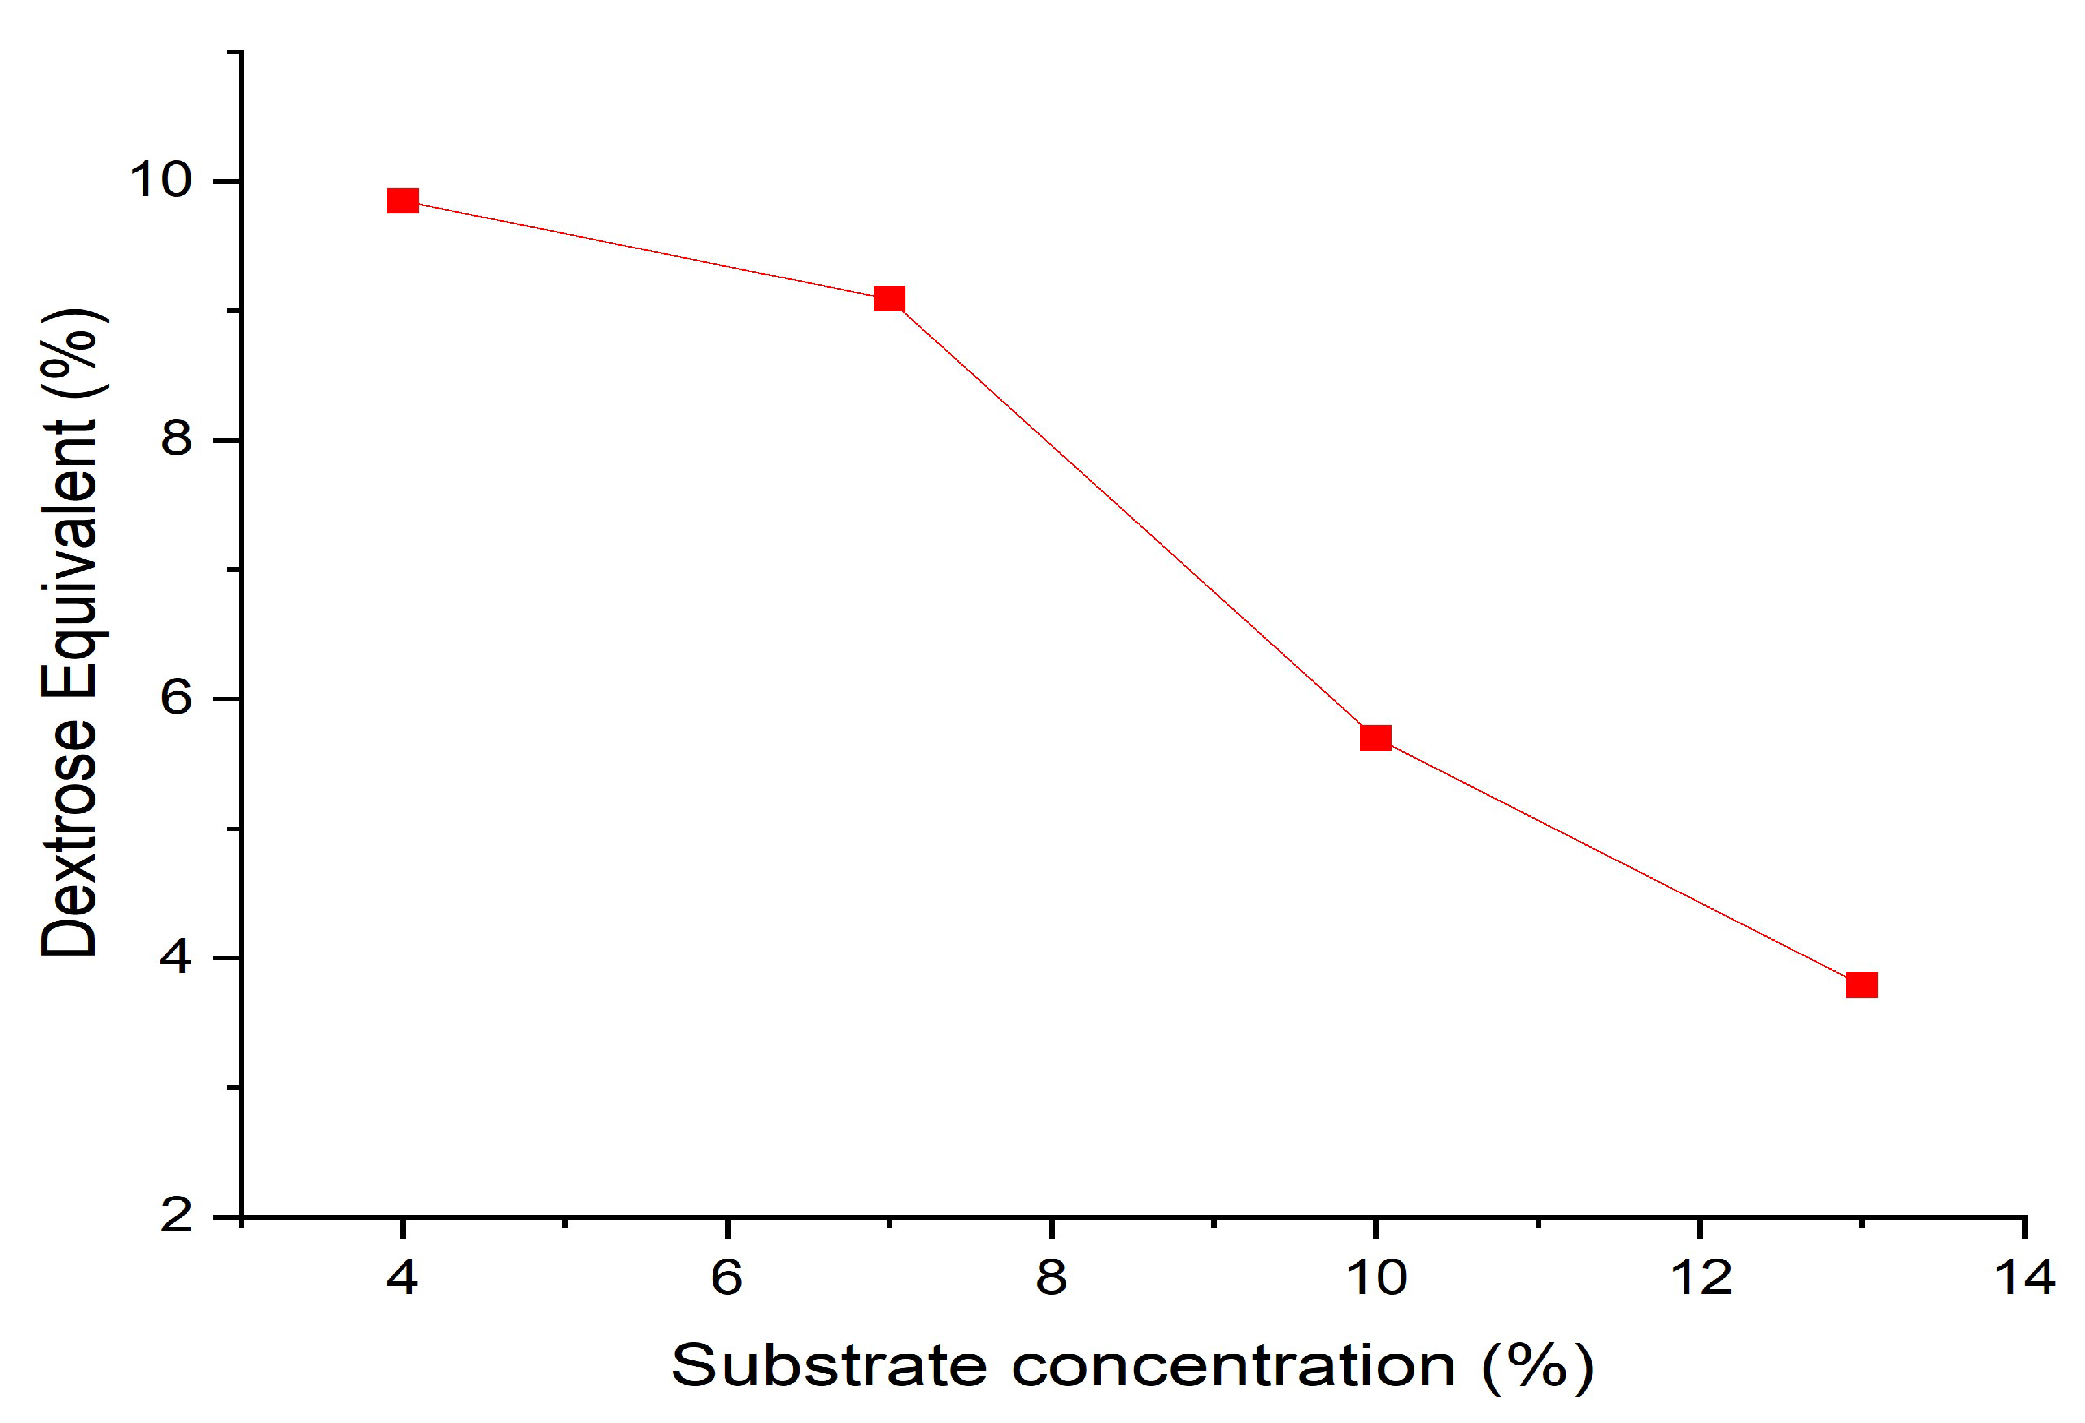
Table 1.
Enzymes and enzyme concentrations are varied.
| Formulation | α-Amylase (%w/v) | β-Amylase (%v/v) |
|---|---|---|
| 1 | 0.1 | 0.05 |
| 2 | 0.1 | 0.1 |
| 3 | 0.1 | 0.5 |
Disclaimer/Publisher’s Note: The statements, opinions and data contained in all publications are solely those of the individual author(s) and contributor(s) and not of MDPI and/or the editor(s). MDPI and/or the editor(s) disclaim responsibility for any injury to people or property resulting from any ideas, methods, instructions or products referred to in the content. |
© 2023 by the authors. Licensee MDPI, Basel, Switzerland. This article is an open access article distributed under the terms and conditions of the Creative Commons Attribution (CC BY) license (http://creativecommons.org/licenses/by/4.0/).
Copyright: This open access article is published under a Creative Commons CC BY 4.0 license, which permit the free download, distribution, and reuse, provided that the author and preprint are cited in any reuse.


