Submitted:
24 December 2023
Posted:
26 December 2023
You are already at the latest version
Abstract
The visual perception of leisure spaces between residences in cold regions is important for public health. To compensate for the existing researches` lack of ignoring the cold snow season`s influence, this study selected two types of outdoor leisure space environments in non-snow and snow seasons as research objects. An eye tracker combined with a Semantic Difference (SD) questionnaire was used to verify the feasibility of the application of virtual reality technology, screen out leisure gaze characteristics, and reveal the environmental factors related to leisure visual perception. In snow season, spatial aspect ratio (SAR), building elevation saturation (BS), and grass proportion in the field of view (GP) showed strong correlation to the leisure visual perception scores (W). In non-snow season, apart from the above three factors, roof height difference (RHD), tall tree height (TTH) and color contrast (HC) also influenced W obviously. The effects of factors on W were revealed in immersive virtual en-vironment (IVE) orthogonal experiments and genetic algorithm (GA) and k-nearest neighbor algorithm (KNN) were combined to optimized the environmental factors. The optimized threshold ranges in the non-snow season environment were SAR: 1.82‒2.15, RHD: 10.81 m‒20.09 m, BS: 48.53‒61.01, TTH: 14.18 m‒18.29 m, GP: 0.12‒0.15, and HC: 18.64‒26.83. In the snow season environment, the optimized threshold ranges were SAR: 2.22‒2.54, BS: 68.47‒82.34, and GP: 0.1‒0.14.
Keywords:
Visual perception optimization
; Residential leisure space
; Immersive virtual environment
; Cold regions
; Machine learning
1. Introduction
The health quality of leisure environment in high-density residential areas has been paid enough attention gradually, strengthening the design of inter-house leisure spaces in urban residential areas is an important measure to promote the high-quality development of urban environments [1]. Existing studies have shown that leisure activities are beneficial to physical and mental health, improve memory, and slow cognitive decline [2,3]. Moreover, as people age, their physical function declines, their sense of loneliness increases, they become more dependent on the familiar house environment, and their activities are mostly maintained in the house leisure space in residential areas [4]. These spaces play a vital role in people’s behavioral activities and psychological recovery [5]. Many studies on public health have proven that the visual perception of people exposed to different environments is significantly different [5,6,7]. Consequently, it is imperative to study the factors that affect visual perception in specific environments.
1.1. Correlation between visual perception and environmental evaluation in leisure activities
Kaplan’s attention restoration theory shows that positive environmental perceptions can provide a buffering effect between daily stressors and mental stress [8]. Several studies have indicated that changes in the building roof contour, façade decoration, and building height have a positive impact on a user’s potential for a restorative experience [9]. Recent studies have revealed that watching natural scenes through virtual reality experiments can alleviate physical fatigue and promote psychological recovery [10]. Environmental stimuli play a crucial role in influencing people’s emotions both directly and indirectly, subsequently influencing their behavioral choices. In recent years, the field of visual perception has attracted significant attention [11]. Wen et al. showed that elements and attributes of a leisure environment can affect people’s psychology and physiology and that extracting and optimizing environmental factors can effectively improve health [12,13,14]. Within the realm of visual perception research, visual comfort includes not only a suitable light environment but also other visual perception factors. However, existing studies have predominantly focused on light environment indicators, such as illuminance and daylight uniformity [15,16], rather than visual evaluation. Owing to limitations in technology and equipment, research on the visual evaluation of other elements in the architectural visual environment, such as geometry, material, and color is limited [17].
Brain responses acquire information through thoughts, experiences, and senses [18]. Some studies have shown that visual perception plays an important role in leisure activities and is an important factor affecting behavioral selection. Environmental assessment is usually carried out by defining people’s different visual perception evaluations. Qualitative analyses in this context have typically employed research methods including questionnaires [19], self-report scales [20], group discussions, and interviews [21]. Rogge et al. used “Likert scale” and “factor analysis” for visual evaluation to obtain users’ emotional feelings and reveal aesthetic preferences [22]. Zhang et al. investigated the correlation between street-view perception and emotions among college students [23]. Parameters used to evaluate the influence of the visual environment on emotions include happiness, arousal, and dominance [24]. The Short form of Mood State Scale, Positive and Negative Experience Scale, Leisure Motivation Scale, and Schedule of Positive and Negative Effects (PANAS) are mostly used in the existing satisfaction evaluation studies of leisure environment [25,26,27,28].
Literature Review and Research Gap 1:
Existing studies have shown that there is a strong correlation between visual perception and leisure environment evaluation, and that the environmental information received by human eyes can affect the evaluation of the environment. Current studies have explored the relationship between leisure environments and physical health. However, there is a lack of refined research on specific leisure scenarios. The factors and mechanisms that influence the perception on leisure environments, specifically during non-snow and snow seasons in cold regions, remain insufficiently explored.
1.2. Research on visual perception using eye tracker and virtual reality technology
From the perspective of the existing literature, traditional research methods, such as questionnaire surveys and the combination of scales and interviews, are widely employed [5,12]. These traditional methods are time consuming, laborious, and easily affected by the investigator’s subjective feelings. Gibson’s theory of visual perception holds that an object’s background constitutes the features of the visual world [29]. In existing studies, in combination with eye-tracker experiments, fixation count, fixation duration, and pupil diameter have been used to reflect people’s attention to spatial scene elements [30,31]. Heat maps (to determine the attraction of elements), gaze maps (to indicate the sequence of gazes), and areas of interest can be obtained in eye-tracker experiments. These methods are also used in the study of emotional gaze characteristics [32]. Compared with photo tests, virtual reality (VR) experiments are closer to the physical environment in terms of mental and physical reactions and can better awaken participants’ emotions [33]. Johnson et al. highlighted the extensive utilization of VR in the design and construction of built environments, emphasizing the need for enhanced research on pedestrian perception through the integration of VR [34]. Luo et al. used VR to simulate the visual perception of people sitting in a park pavilion to assess their preference and mental recovery [35].
Literature Review and Research Gap 2:
In some existing studies, visual preference factors in the environment have been screened through subjective questionnaires, which are easily affected by previous experiences. To obtain better results, some studies have used eye-tracking technology to explore the influence of indoor and outdoor environments on pedestrian gaze. However, this is limited to arbitrarily changing the visual environment according to the influencing factors in real scenes. Despite the gradual integration of VR technology into the study of visual perception, visual perception research combining VR with an eye tracker for parameter modeling has not yet been conducted.
1.3. Machine learning predicts visual perception preference and evaluation model optimization
K-nearest neighbor algorithm (KNN) is a nonparametric classification method widely used in the fields of computer science and behavioral science. It classifies data using the nearest or adjacent training samples in a given region, and calculates the k-nearest neighbor data for a given input value [36]. In the field of architecture, KNN is currently applied to urban lighting design [37], building energy prediction [38], and building thermal comfort performance optimization [39]. Tsalera used a KNN to detect, analyze, and classify urban environmental noise [40].
Genetic algorithms combined with simulations are widely used to optimize building space environments. Zhang proposed a method that combined building environment information with a genetic algorithm to optimize the layout of a virtual environment [41]. Awada and Srour used a genetic algorithm as an optimization tool to simulate building renovation schemes and obtained an optimal renovation scheme based on the relationship between indoor environmental quality and occupant satisfaction [42]. Estacio et al. adopted a simulation model combined with a genetic algorithm to obtain an optimal tree distribution strategy under a pedestrian comfort level, thereby proving the feasibility of this optimization method [43].
Literature Review and Research Gaps 3:
Many studies have used machine-learning and genetic-algorithm tools to evaluate and optimize built environments. However, a notable gap in research on the relationship between various elements and visual perception in the leisure spaces of urban houses remain. Additionally, research on the evaluation and prediction of urban residents’ leisure perceptions is relatively underdeveloped. Although some studies have proven that leisure perception can affect people’s satisfaction evaluations, research on the range of environmental factors influencing indoor leisure spaces using machine learning and genetic algorithms is still insufficient.
1.4. Research Objective
(1) To compensate for the research gap in the evaluation of people’s visual perception of environmental satisfaction in leisure spaces between houses in the non-snow season and the snow season in cold regions, this study explored the influence of leisure space environmental evaluation indicators on people’s leisure perception through VR scene experiments. It also reveals the influencing factors of cold areas in the non-snow and snow seasons and the principle of their influence on the perception of indoor leisure.
(2) To address the limitations of data measurement and the subjectivity of the questionnaire in real scenes, this study verified and extracted human visual perception elements through an eye-tracker pre-experiment, used an eye-tracker experiment combined with a VR environment for an orthogonal experiment, and combined it with an SD semantic difference questionnaire to analyze the correlation and strength of each influencing factor.
(3) To explore and test the calculation method for visual perception elements in specific leisure scenes, a KNN prediction model combined with a genetic algorithm was used to evaluate the scene of residential leisure space between houses and obtain the range of environmental elements under the best visual perception evaluation, which provides a reference for the design of leisure space in the future.
2. Method
As shown in Figure 1, the research method was divided into three parts. First, the influencing factors were extracted. Through the eye movement pre-experiment and SD semantic difference questionnaire, the factors and attributes that affect visual perception in the leisure environment in the non-snow and snow seasons were extracted and verified using the VR eye movement experiment. The second part comprises the construction and analysis of the virtual reality scene model. These factors were used as independent variables to establish immersive virtual reality orthogonal experiments, and a visual perception evaluation under different combinations of factors was obtained. Correlation analysis and data fitting revealed the influence of environmental factors on leisure perception. The third part was the data calculation and model optimization, which used the environmental factors that have a great impact on the leisure perception score to build the dataset and train the K-nearest neighbor algorithm (KNN) prediction model. A genetic algorithm (GA) was used to optimize the KNN, and the value and threshold range of environmental factors under the evaluation of residents’ optimal leisure perception based on visual perception were obtained in both the non-snow season and snow season environments in cold areas.
2.1. Case study
This study focuses on the environment of interhouse leisure spaces in urban residential areas in cold regions. To explore the influencing factors of specific scenes of leisure space in the snow and non-snow seasons in detail, this study set the leisure scenario of walking through residential areas. The investigation specifically focused on the leisure space between houses in four typical cold region settlements in the snow and non-snow seasons. The SD questionnaire and eye-movement experiments were conducted in the four aforementioned outdoor leisure spaces. In addition, a VR scenario was validated using the proposed method. The details of the outdoor leisure spaces in the four urban settlements in cold regions are shown in Table 1.
2.2. SD questionnaire
2.2.1. SD questionnaire focus
In this experiment, an SD questionnaire was used to screen the nature of the spatial elements that affect visual perception in leisure spaces. Visual perception attributes are divided into color, geometry, and material attributes. The HSV (hue, saturation, and brightness) system, number of colors, and color contrast in the field of view were selected as the color attributes. Geometric attributes included the spatial aspect ratio, building roof height difference (the difference between the heights of the lowest and highest residential buildings), sky openness, distance from leisure spaces to residential buildings, building orientation angle, proportion of grass in the view, and height of tall trees. Given the prolonged snow season in cold regions, the attributes of the materials used for building façades and grounds exhibit minimal seasonal variation, and anti-slip and low reflectivity materials are widely used. Consequently, material attributes are not considered in this study.
2.2.2. SD questionnaire Settings
The questionnaire was set up according to the SD method, and 15 groups of adjectives corresponding to the 15 neutral factors of visual perception in leisure spaces between residential buildings were collected (Table 2). According to the setting requirements of the semantic difference table, the survey was divided into five levels, from left to right: very poor, generally poor, neutral, generally good, and very good, corresponding to 1, 2, 3, 4, and 5 points, respectively. Details of the SD questionnaire can be found in the Supplementary Information.
2.2.3. Participants of the SD questionnaire survey
In the non-snow season, SD questionnaires were distributed to 940 urban outdoor leisure people in eight different cold areas, and 663 questionnaires were returned, with a sample effectiveness rate of 70.5%, including 520 males and 420 females. The participants ranged in age from 12 to 76 years, with a mean age of 43.7 years. During the snow season, 965 questionnaires were distributed to urban outdoor leisure participants in eight different cold areas, and 693 questionnaires were returned, with a sample effective rate of 71.8%, including 530 males and 435 females. The ages ranged between 9 and 78, with a mean age of 40.3.
2.3. Eye tracker
2.3.1. Real scene eye tracker
Among the existing studies on the visual perception of the leisure environment, there is some research on the visual gaze characteristics of different hospital staff in outdoor leisure spaces [31], which provides a foundation for the research of this paper. However, the visual attention characteristics of community residents in outdoor leisure environments are still unclear, and whether there are differences in visual attention during the snow and non-snow seasons in cold areas still needs to be discussed. Therefore, it is necessary to screen the physical elements in the space during the snow and non-snow seasons from the perspective of community residents, which can be completed with the help of an eye tracker.
According to the theory of depth perception, the three-dimensional space seen by pedestrian eyes is lost in the retina, and the perception of three-dimensional space is realized through binocular vision, starting with form perception [44]. Gibson believed that pedestrian perception of space is realized by pedestrians seeing a continuous background [29]. In this study, the Tobii professional laboratory platform was used to map eye movement data in the scene video, which was divided into 10 areas of interest(AOI): buildings, ground, sky, tall trees, lawns, seats, sports facilities, artificial landscapes, pedestrians, and cars.
The indicators used in the study included fixation, visit, glance, and saccade four categories were used to measure participants’ focus on the AOI. These data included number of fixation points (NF), number of visits (NV), total fixation duration (TFD), total glance duration (TGD), fixation time (PFD), and glance duration (PGD).
The purpose of the eye-tracking experiment was to find the different visual attention rules of residents walking in the snow and non-snow seasons and to screen the physical elements in the leisure space under the two environments. In this experiment, a Tobii Pro Glass2 was used to record scene information, eye-movement videos, and other data streams (pupil size, number of glances, gyroscope, accelerometer, and TTL input). Data segments can be annotated manually or using user-provided event-classification algorithms [45]. Figure 2 shows eye movement images of the subjects when they were walking between houses in the snow and non-snow seasons.
This study was conducted in snow and non-snow season environments, and the experimental process was as follows: First, before the formal experiment, the tester introduced the experimental task to the subjects and debugged the experimental equipment. Second, the subject wore an eye-tracking device, and the tester helped the subject correct the fixation point. Finally, the tester started timing and the experiment was officially initiated. When the two-minute walk was completed, the recording ended. The details are shown in Figure 2f. All participants were instructed to walk as they would in their daily lives during the experiment.
The experimental sites were four residential leisure spaces located in the cold region of Harbin, China. These selected communities represented a range of residential areas within Harbin. All participants indicated that they voluntarily participated and were informed of the experimental task. The mean age of the subjects was 32.4, with 23 men and 27 women. After removing unusable data with a low sampling rate, 64 groups of effective eye-movement data were obtained, with a sample effective rate of 80%.
2.3.2. VR eye tracker
Because this study needed to conduct orthogonal trials with immersive VR devices during subsequent phases of this study, it was imperative to verify whether the gaze characteristics of residents with head-mounted VR devices were similar to reality when taking recreational walks in the scene. The preliminary verification was deemed essential before proceeding with the VR experiments.
In this study, the Unity3D software platform was used to construct the experimental scene, ensuring the accurate recreation of all elements and attributes to reflect the actual scene. The HTC VIVE PRO EYE device enables users to reproduce realistic walking behaviors in a scene. The HTC VIVE PRO EYE displays images with a resolution of 1600×1440, 90° field of view, and a refresh rate of 42 Hz and can record eye movement behavior data for each subject, as shown in Figure 3a. The eye-movement data recorded in the experiment were processed using the eye-movement analysis function on the ErgoLAB platform [46]. The experiment was validated by taking both the actual walking of the subjects and the use of two handles to control the walking, in order to get the way that best matches the actual eye movement of the subjects. Figure 3c shows the motion state of the subject while wearing the HTC VIVE PRO EYE for the test. Figure 3d and Figure 3e show screens of eye movement features recorded by subjects during non-snow and snow-season house-walking behaviors.
A total of 32 subjects were included in this experiment, each of whom volunteered to participate in two experiments in the snow and non-snow seasons. There were eight scenes in total; eight people in each scene performed the experiment, and 64 groups of experiments were conducted.
2.4. Orthogonal experiment
2.4.1. Orthogonal experimental setup
In this study, urban outdoor leisure spaces are considered to be outdoor places for residents to chat, walk, fitness, and perform other functions. In the non-snow and snow seasons in cold areas, the space generally contains buildings, ground, tall trees, lawns, seats, sports facilities, and artificial landscapes. As shown in Figure 4a and Figure 5a, combined with the case study of outdoor leisure spaces in residential areas in cold areas, the experimental model was constructed based on the prototype of the Fuhua residential area and the Lushang New Town residential area in Harbin, and the parameters were adjusted accordingly.
This study screened environmental factors strongly correlated with leisure perception as variable parameters for VR scene construction. In the variable setting, the spatial aspect ratio referred to the “D/H” index proposed in “External Space Design” by Luranraison. When D/H < 1, the external space provides a sense of urgency; when D/H > 3, the external space has poor enclosure [47]. Therefore, as shown in Table 3 and Table 4, the space aspect ratios were set to 1.2, 1.5, 1.8, 2.1, 2.4, 2.7, and 3. In this study, the roof height difference refers to the height difference between the highest and lowest residential buildings around leisure spaces. Because the main urban area of Harbin is dominated by multistory and high-rise buildings, and the number of grounds is mostly 6‒30 [48], this study set the roof height difference to 0 m, 12 m, 24 m, 36 m, 48 m, 60 m and 72 m. The index of lawn proportion in the field of view refers to the concept of the green viewing rate [49], which can be obtained by calculating the proportion of green pixel value and total pixels of the lawn in the space. Some studies have shown that a green viewing rate is more appropriate at 24‒34% [50]. In addition to the proportion of trees, the proportions of lawns in the field of view were set to 0, 3%, 6%, 9%, 12%, and 16%. Most trees in Harbin are 6-30 m. Therefore, in this study, the heights of the tall trees were set to 6 m, 10 m, 14 m, 18 m, 22 m, 26 m and 30 m. Building saturation refers to the saturation of the main color of a building, which is set to six levels, from low to high. Hue contrast in the visual field refers to the difference between the two main colors in a scene [51]. This study refers to the hue difference between the main building and the ground. The strength of the difference depends on the angle difference on the hue ring, and the study was set to seven levels, from low to high, at 30° intervals.
Orthogonal experimental design was used in the model design, which is a method of selecting some representative points from the comprehensive experiment according to the orthogonality to conduct the experiment. As shown in Figure 4a and Figure 5a, 49 combinations of scenarios and variables were obtained for each snow and non-snow season using the orthogonal experimental design of the experimental model through SPSS.
Figure 4.
Orthogonal experiment parameters and procedure using VR scenes in the non-snow season.
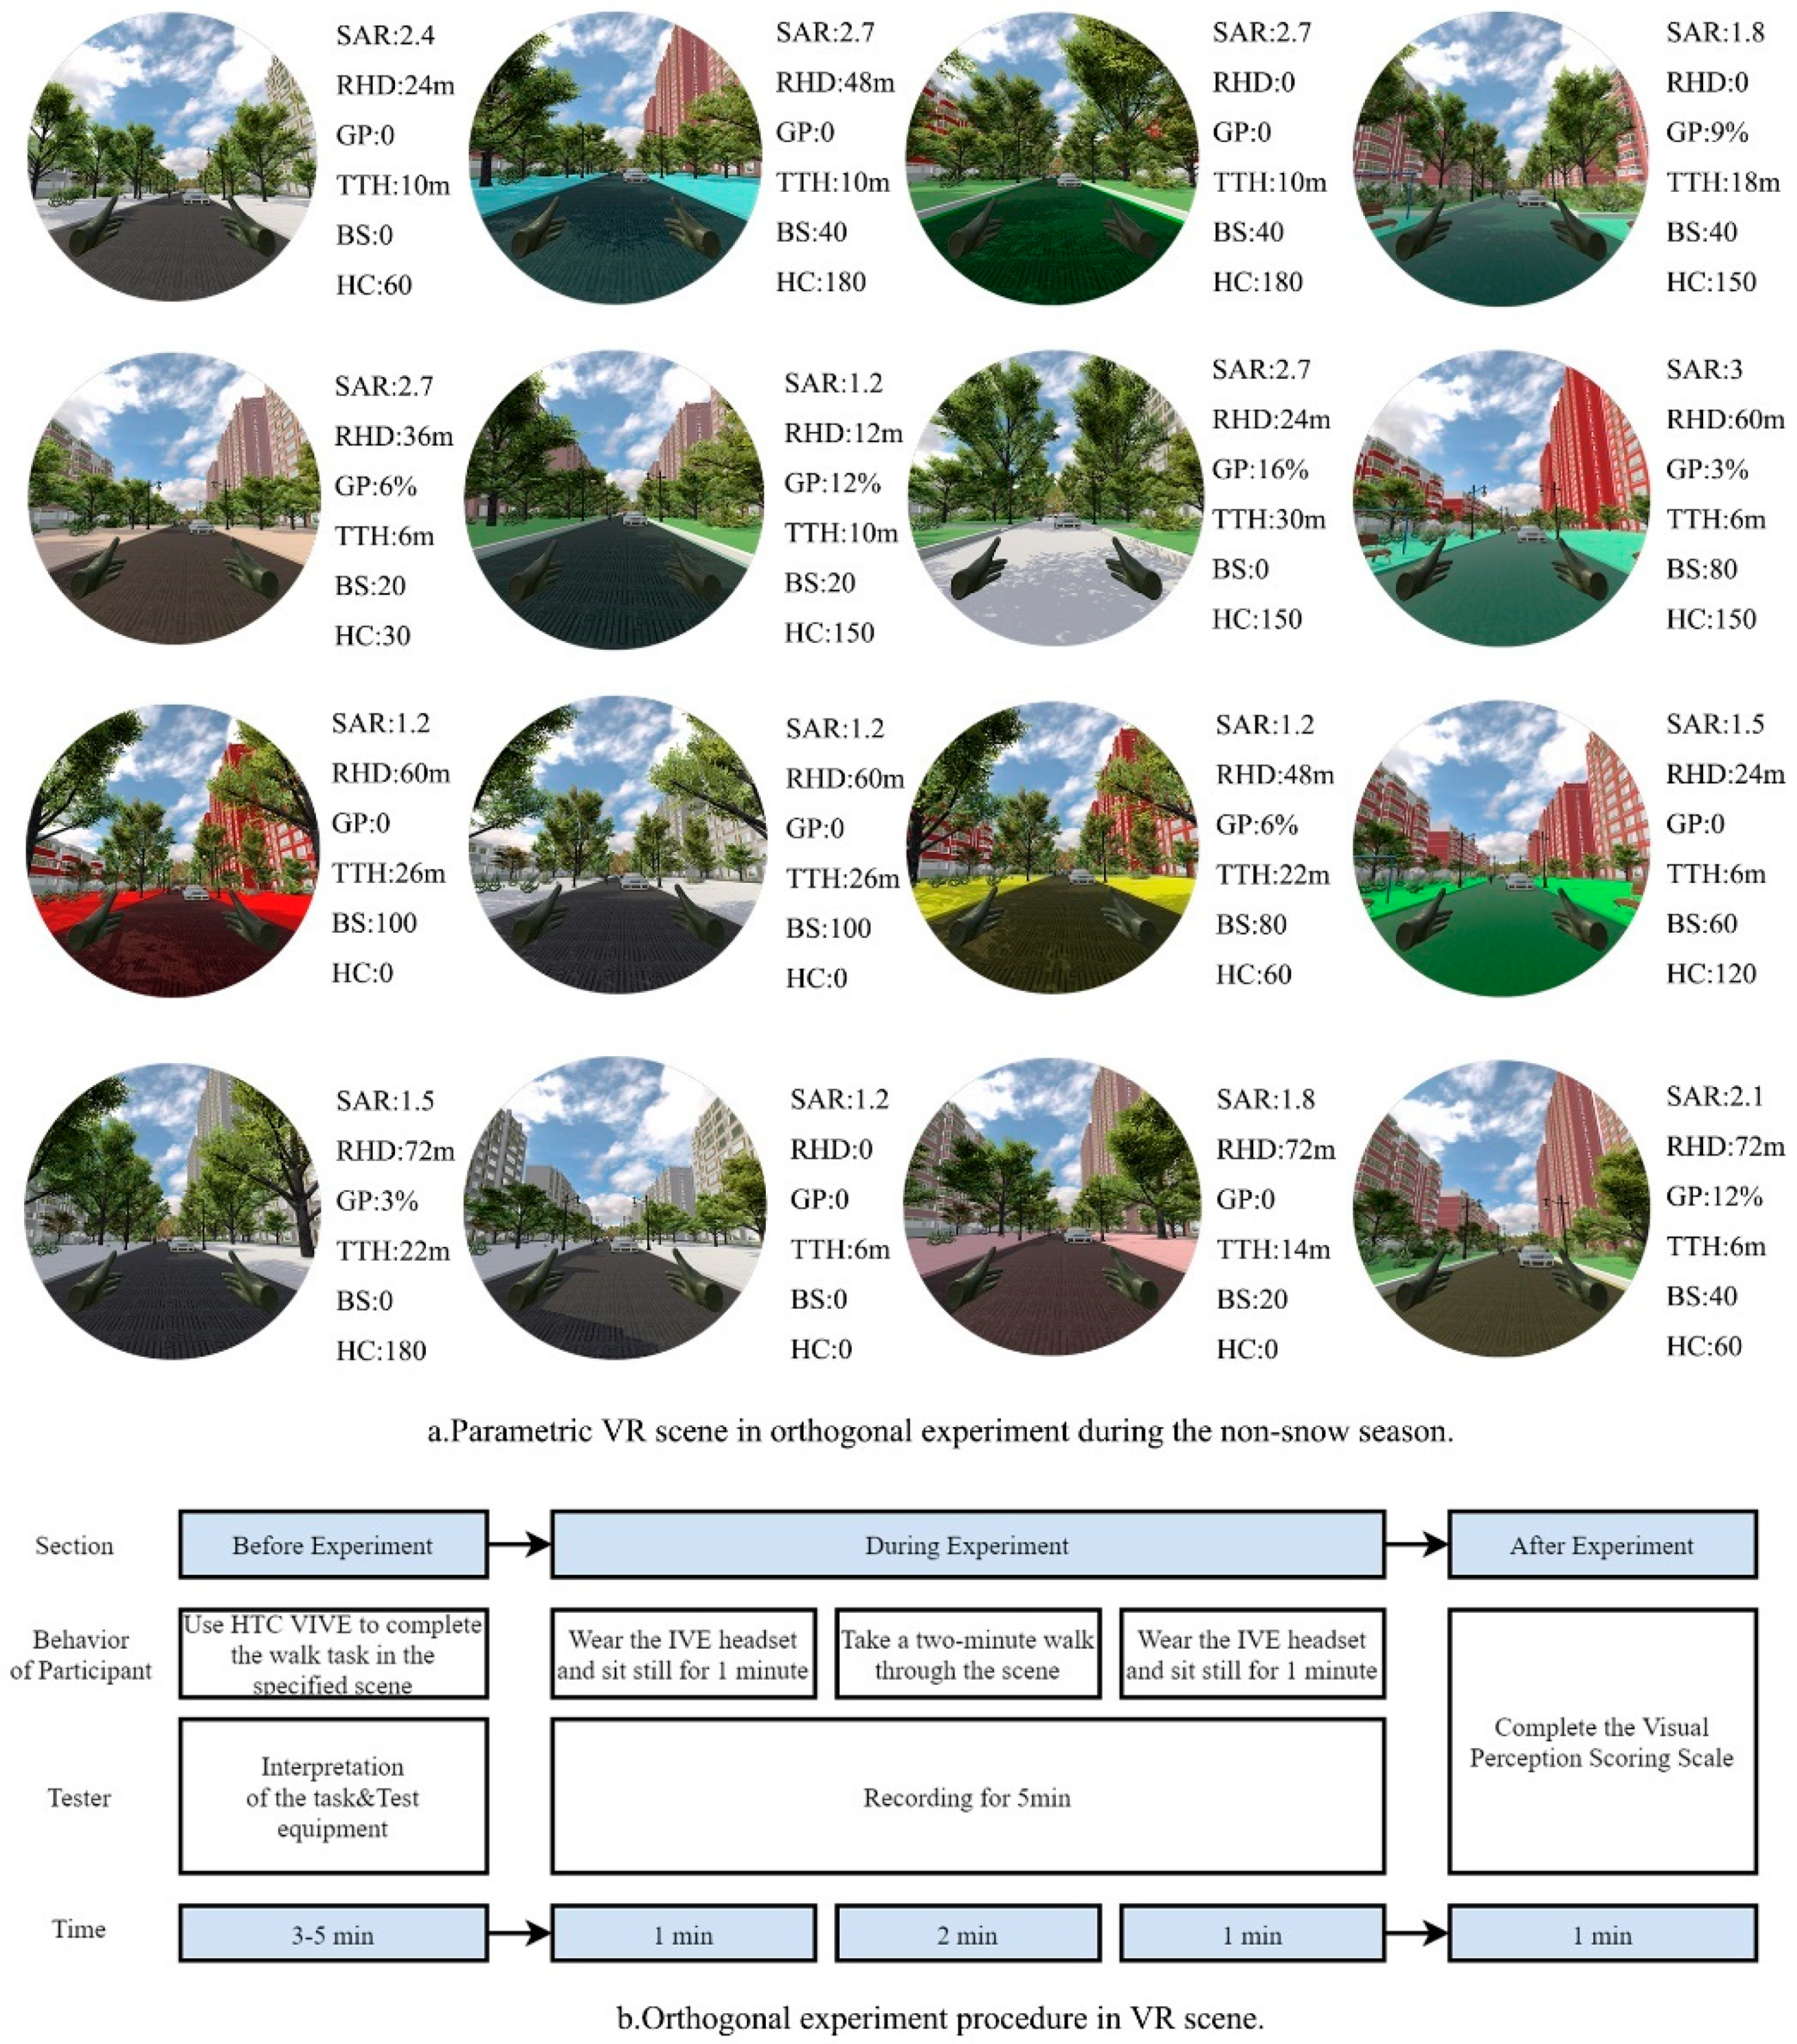
Figure 5.
Orthogonal experiment parameters and procedure using VR scenes in the snow season.
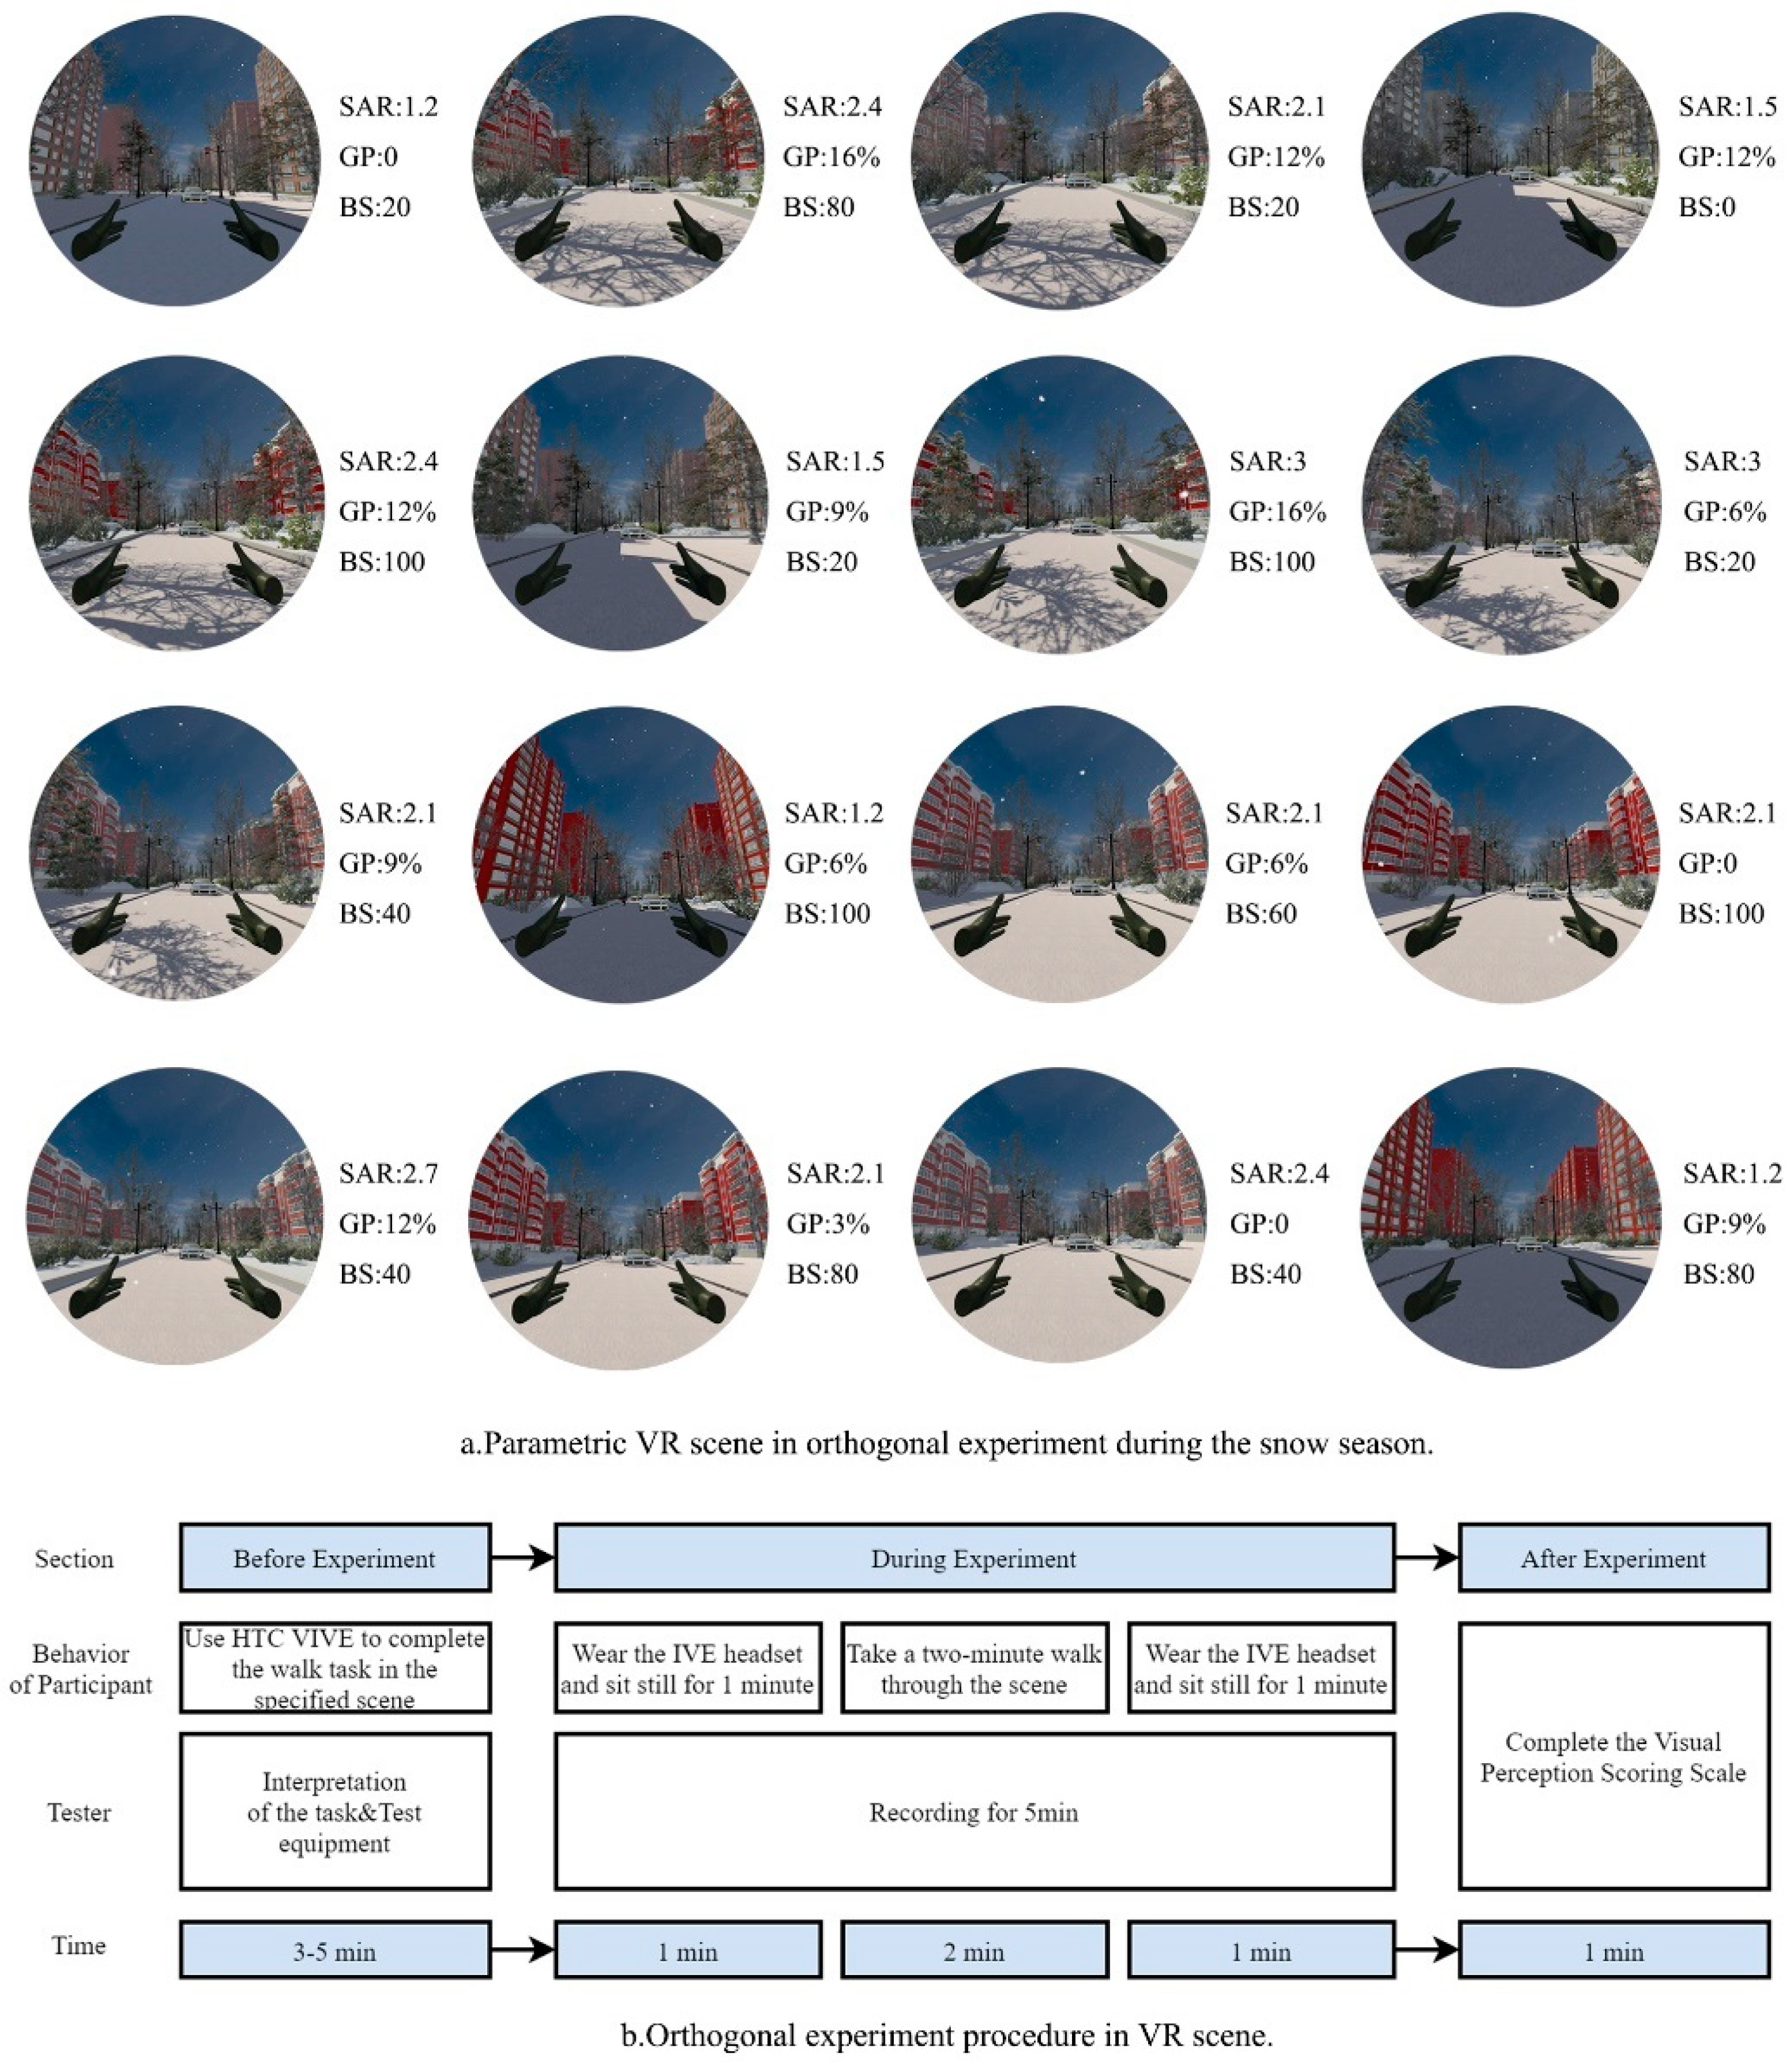
2.4.2. Orthogonal experiment procedure
Before the start of the experiment, all participants were introduced to the task and purpose of the experiment, and signed a formal consent form. There were 40 participants (22 males and 18 females) with an average age of 38.8 years (standard deviation, 3.5). Most participants had no architectural background and were in good health before the experiment. A total of 1960 sets of experiments were completed in the non-snow and snow seasons, and 1685 sets of data were valid (effective rate of 85.97%).
The experiment was conducted in sunny weather during the non-snow and snow seasons, as shown in Figure 4b and Figure 5b. Before the experiment, the subjects wore the virtual reality equipment and walked in the scene for 3-5 minutes to familiarize themselves with the equipment. Subsequently, the experiment officially started, and the subjects first sat for 1 min, then walked normally for 2 min, and finally sat for 1 min. At the end of the experiment, a visual perception rating table was completed.
2.5. Machine learning and genetic algorithms
2.5.1. Machine learning
The goal of visual perception optimization of outdoor leisure environments is to determine the optimal composition of spatial environmental factors and the threshold range of impact factors by adjusting the environmental factors that affect leisure perception to improve user satisfaction. In this study, classification and regression algorithms were first tested for their ability to learn data features, and the structures of the algorithm models were then compared and optimized to yield refined surrogate patterns. 1960 sets of experimental data from each of the non-snow and snow seasons were used for training. The trained surrogate model can predict the visual perception score of the outdoor leisure environment in a cold region using an environmental factor dataset in both environments.
Most existing studies on perceptual evaluation have used classification machine learning for predictions. Because the visual perception satisfaction of the leisure environment was evaluated as a score on a 5-point scale, in the training process of the surrogate model, the visual perception score of leisure was used as the output, and the values of environmental influence factors in the non-snow and snow seasons were used as the input dataset. In this study, the effects of decision tree, support vector machine, KNN, and ANN on the classification calculation methods were compared, and KNN was selected as a suitable surrogate model.
2.5.1.1. Decision Tree
Decision trees are used for classification and regression problems [52]. It selects the best splitting mode by increasing the learning path of each region and reducing the learning uncertainty. where formula. is the ratio of in node , represents the proportion of , indicates the category.
2.5.1.2. Support Vector Machines
The SVM, which defines the classification of data, was first proposed in 1964. It is typically used for classification calculations, and has a good fitting effect [53]. Linear SVMS defines the distance to the closest observation in each class as w and operates by finding w and b with the largest margin (bias). Where is an matrix and is the transposed .
In the equation, indicates when the predicted result is greater than 0, indicates when the predicted result is less than 0, is the margin of separation, the formula for which is as follows:
To prevent margin errors, the following conditions must be met, and the SVM is transformed into an optimization problem that satisfies the following formula conditions:
2.5.1.3. K-nearest neighbor (KNN)
KNN, which is a nonparametric method for computing training and test samples in a dataset, is often used for classification. It classifies the input values in the existing data into the k-nearest samples. The three distances are defined as the Euclidean, Manhattan, and Minkowski distances. Based on the given distance measure, we determine the point closest to in the training set. The region adjacent to covering point is referred to as . Class of is determined in according to the classification decision rule. Where is the eigenvector of the instance, is the class of the instance, .
Where is the indicator function; that is, is 1 when , otherwise is 0.
2.5.1.4. Artificial Neural Network (ANN)
In previous studies, artificial neural networks have been used to predict pedestrian evaluations of the environment [54,55]. The ANN model structure comprised hidden layers and neurons [56]. The MLP network of Input and Target in hidden layer 1 is as follows:
where is the output vector of the hidden layer, is the connection weight matrix from the input layer to the hidden layer, is the connection weight matrix from the hidden layer to the output layer, and are the number of deviations in the hidden and output layers [57]. The transfer algorithm used between the hidden and output layers is as follows:
In this study, the prediction results of four classification algorithms were compared, and the model structure was adjusted according to the fitting effect. The input datasets were 1960 sets of leisure environmental influencing factors in the non-snow and snow seasons, and the output datasets were leisure visual perception scores. According to existing research, 70% of the dataset is used for training, 15% for validation, and the remainder for testing.
2.5.2. Genetic algorithm
The theoretical basis of genetic algorithm derived from the theory of biological evolution and natural selection. When applied to optimization in the field of artificial intelligence, genetic algorithm can solve complex problems with and without constraints [58]. In the optimization process, the output value can be obtained according to the input value, and the “optimal solution” can be obtained by defining the output mode [59]. In this study, the predicted output value (W) was used as a genetic fitness index to determine the optimal range of environmental parameters for visual perception of leisure environments. Based on related studies [60,61], the parameters of the GA were set as follows: The population size was 200, the crossover fraction was 0.8, and the migration fraction was 0.2. During the non-snow season, 200 different groups of SAR, RHD, TTH, BS, GP, and HC were input, and 200 responding W were evaluated to determine the maximum in every generation. During the snow season, 200 different groups of SAR, GP, and BS were input, and the 200 responding W values were evaluated to find the maximum in every generation. It should be noted that because the GA of MATLAB could only calculate the minimum value, in this study, to obtain the maximum value of W, the optimized target was set as the opposite of W.
3. Results
3.1. Interest point filtering
3.1.1. SD questionnaire elements screening
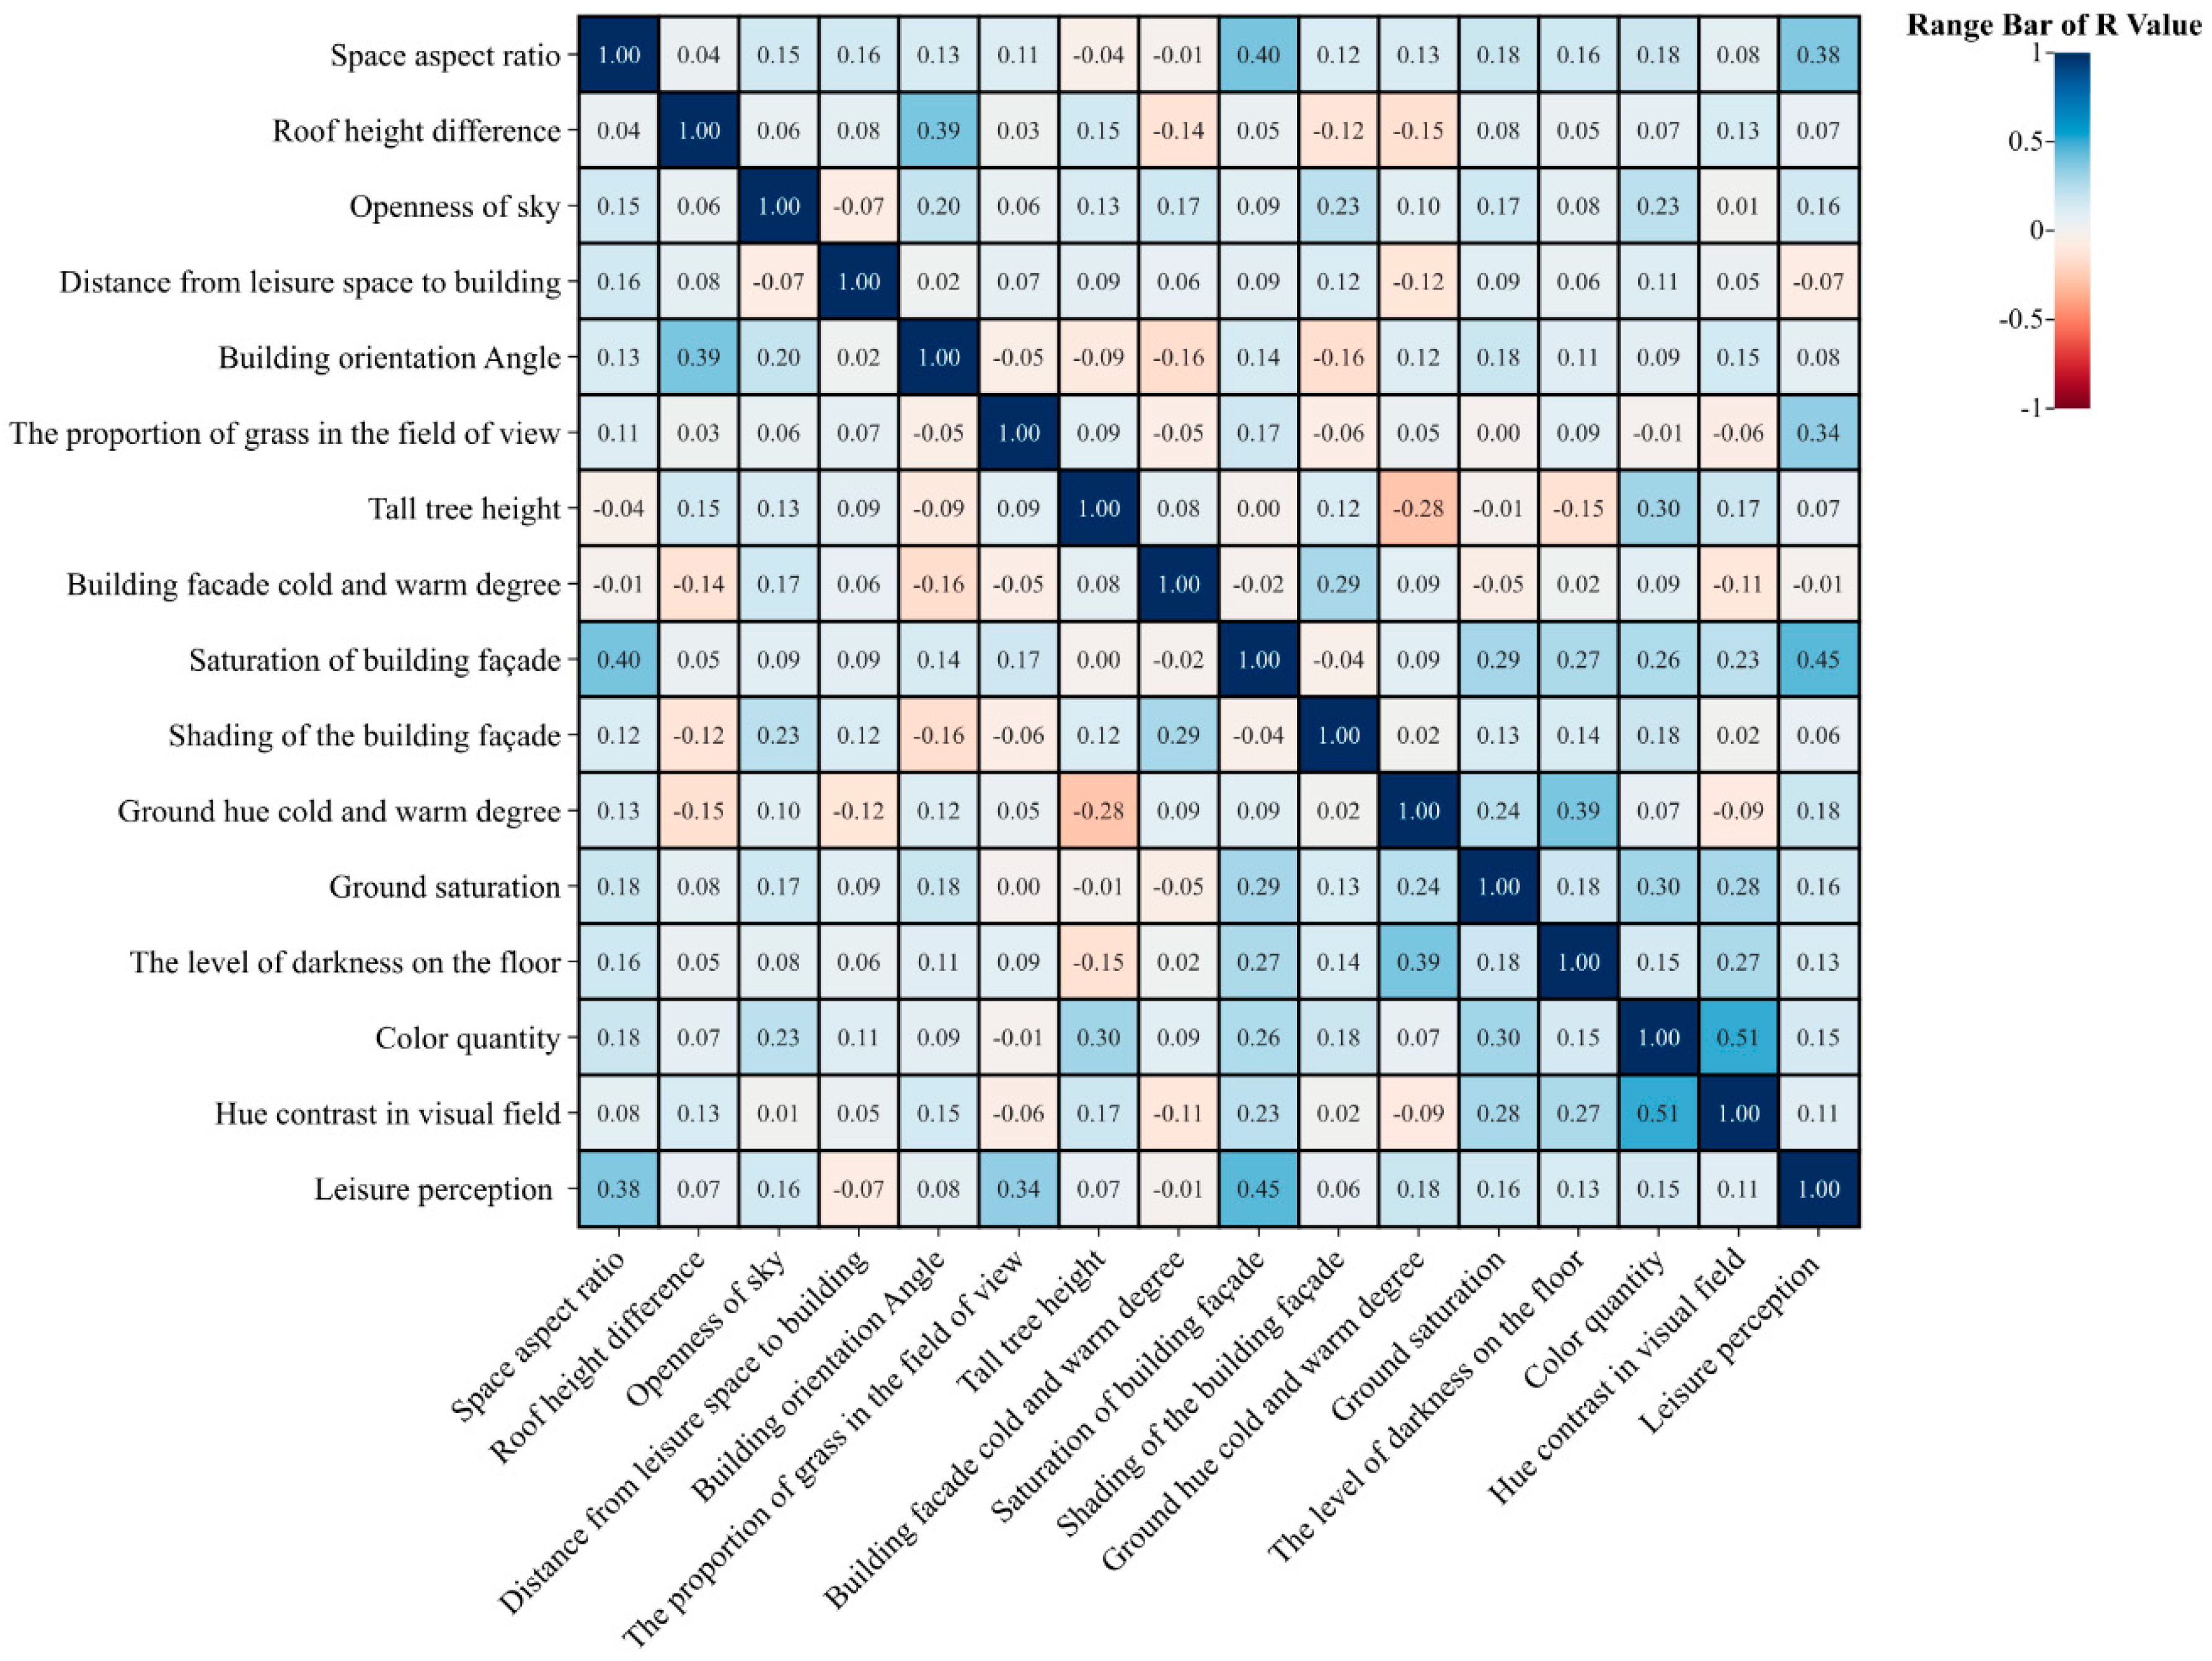
Pearson correlation analysis was conducted between the 15 target variables and the dependent variable (leisure perception score) in the non-snow season and the snow season. The results of the Pearson correlation coefficient (R) were shown in Figure 6 and Figure 7.
The independent variables in the non-snow season were the spatial aspect ratio (R=0.34 > 0.20), roof height difference (R=0.22 > 0.20), proportion of grass in the view (R=0.41 > 0.20), height of tall trees (R=0.33 > 0.20), building façade saturation (R=0.37 > 0.20), and color contrast (R=0.36 > 0. 20) were significantly associated with the dependent variable (leisure perception). Among the independent variables of the snow season, the spatial aspect ratio (R=0.38 > 0.20), the proportion of grass in the view (R=0.34 > 0.20), and the saturation of the building façade (R=0.45 > 0.20) were significantly correlated with the dependent variable (leisure perception). Therefore, six leisure visual influence factors were selected for the non-snow season and three for the snow season.
In the non-snow season, the influence of building saturation in terms of color attributes was higher than that of hue and value, which may be because building saturation can affect residents’ emotional and behavioral choices for leisure walking. The hue contrast in the visual field had a greater influence on leisure visual perception than the number of colors, which means that the hue difference between the two dominant colors in the leisure environment encourages the user to produce more positive emotions. In terms of spatial geometric elements, the selected spatial aspect ratio and roof height difference reflect spatial openness, which will make people capture different amounts of information and then affect the visual experience of users. In this view, the proportion of grass gave people a different feeling of being green. The height of tall trees influenced users to obtain different degrees of cool feelings in the non-snow season. In the snow season, the influence of building saturation on color attributes was higher than that of hue and value, and cold and warm hues had little effect, which may be because most building façades in cold regions were warm colors. Spatial openness under the influence of the spatial aspect ratio on geometric attributes still affected visual perception during the snow season. Greater grass in the field of view was associated with more positive emotions during the snow season.
Figure 6.
Correlation analysis between the environmental impact factors and leisure perception in the non-snow season.
Figure 6.
Correlation analysis between the environmental impact factors and leisure perception in the non-snow season.
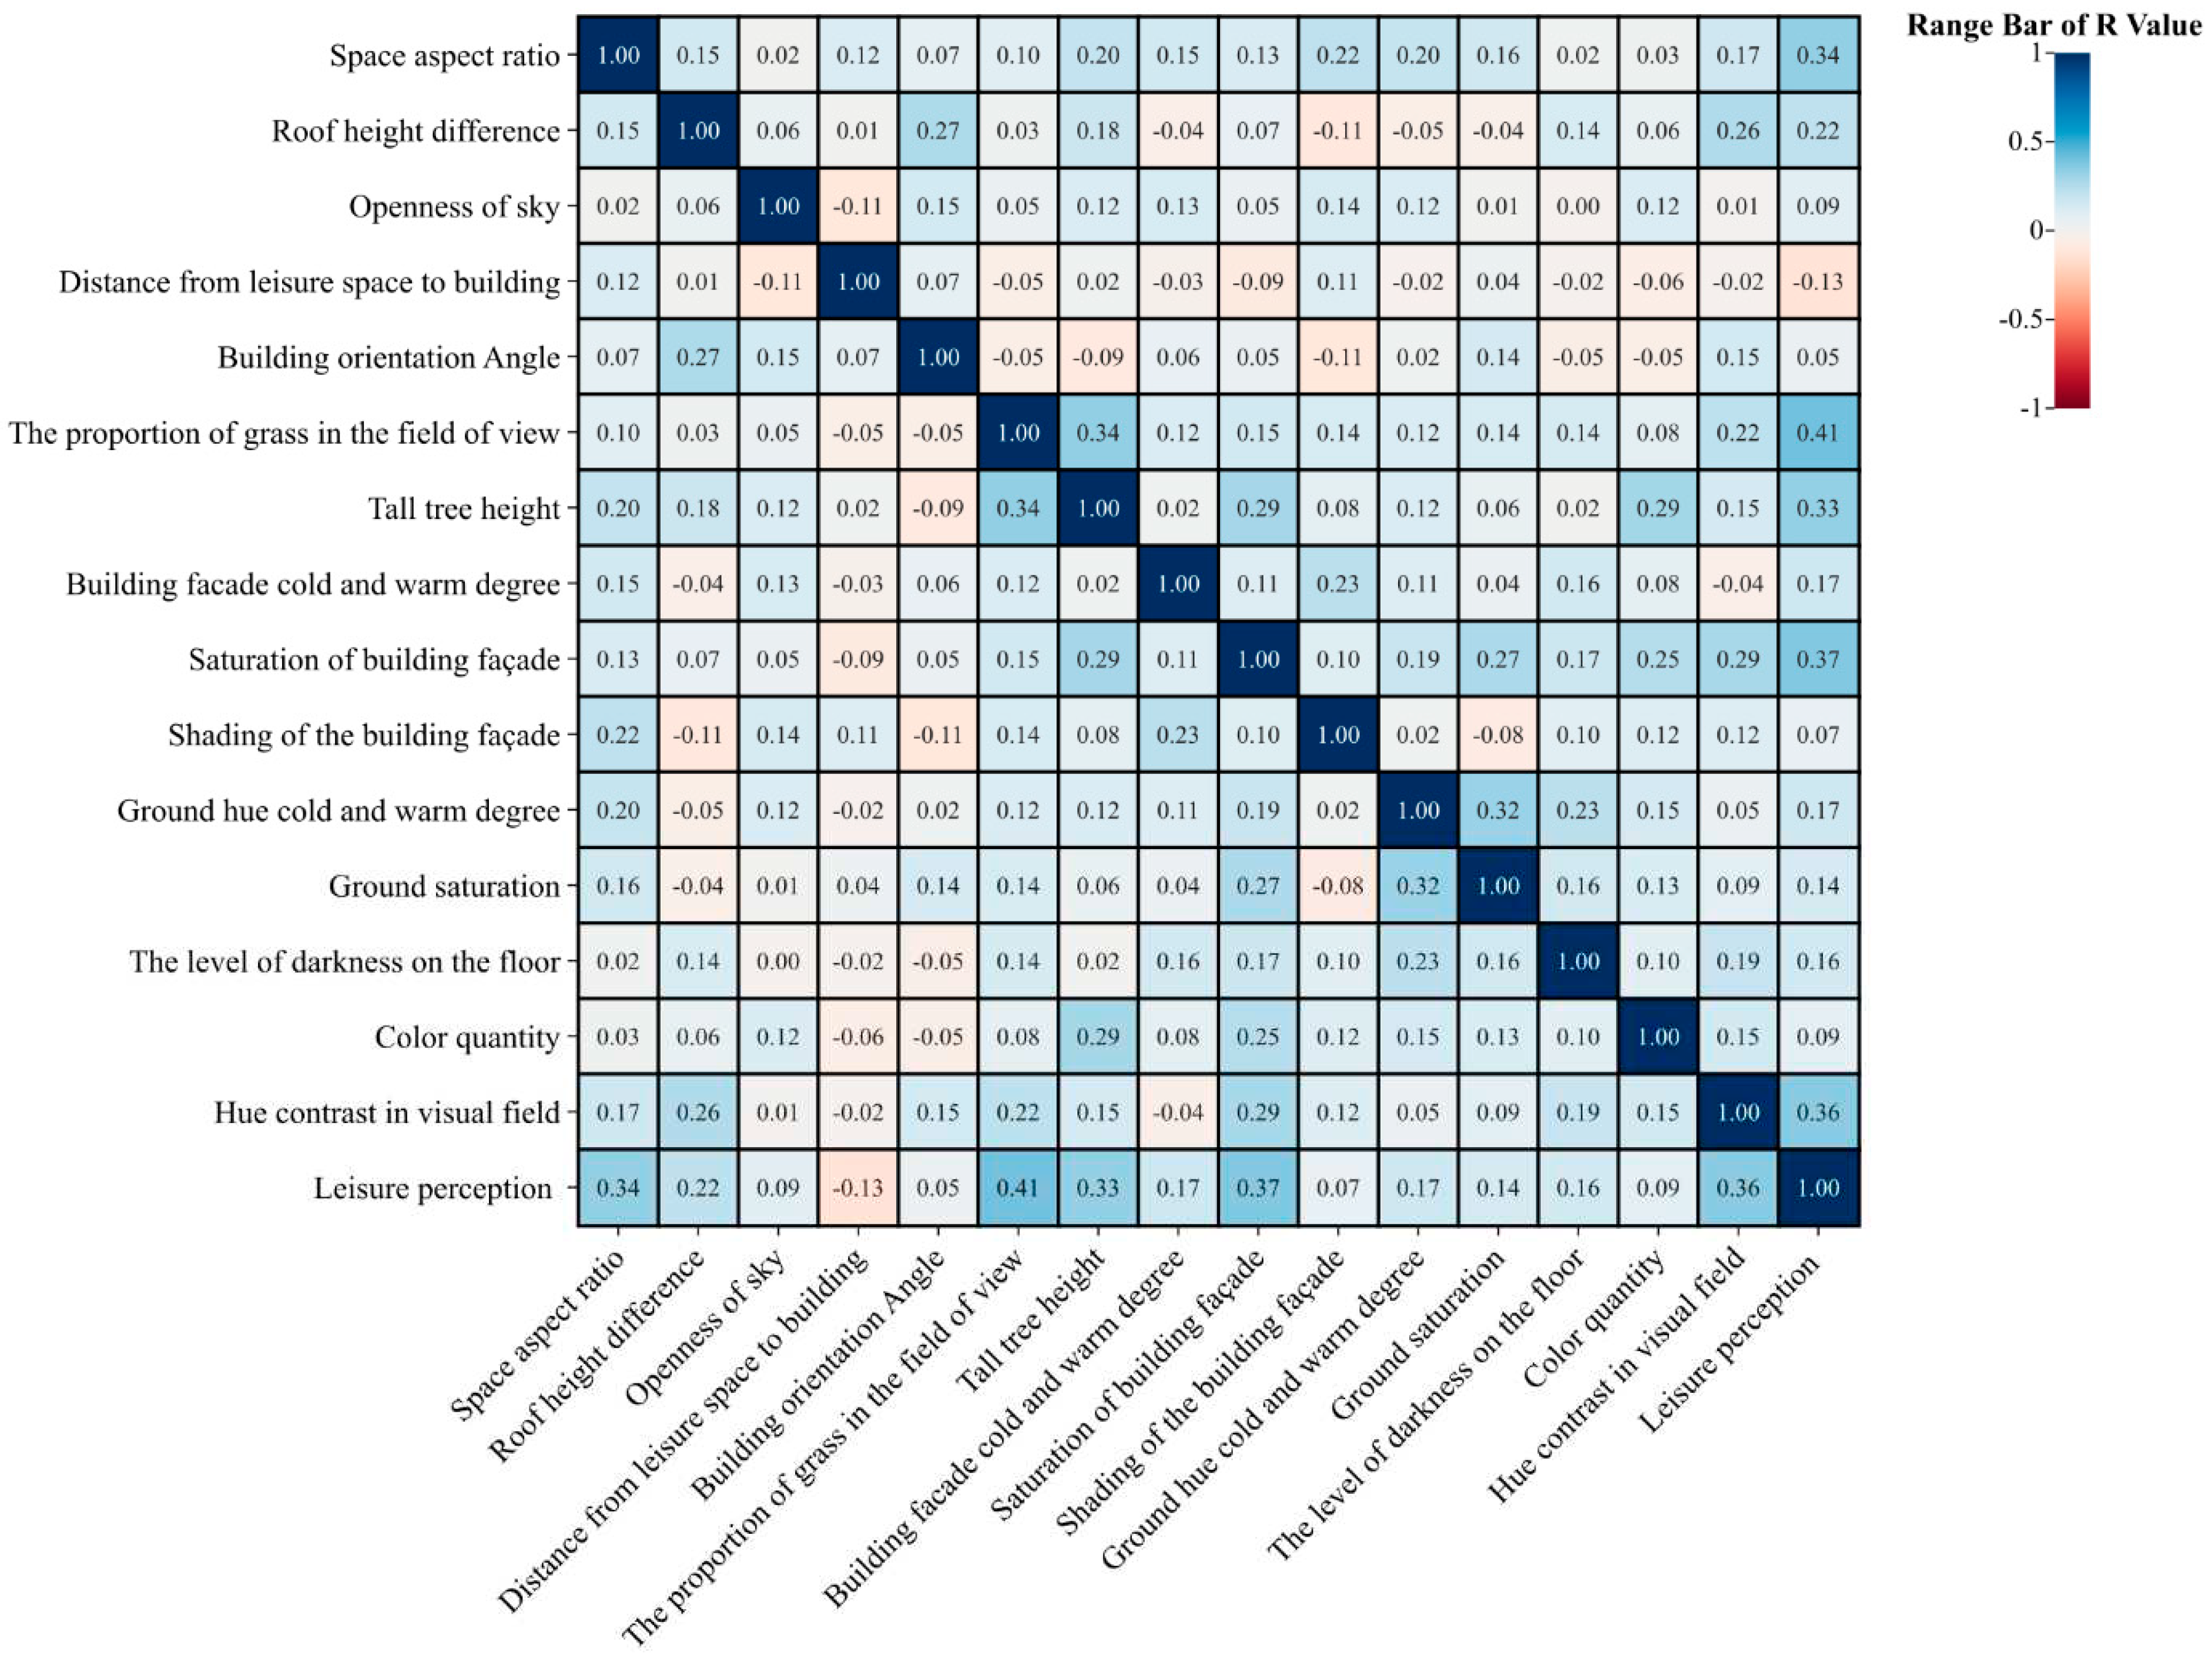
Figure 7.
Correlation analysis between the environmental impact factors and leisure perception in the snow season.
Figure 7.
Correlation analysis between the environmental impact factors and leisure perception in the snow season.
3.1.2. Eye tracker interest point screening
The purpose of the eye tracker experiment was to screen out the entity elements that have a great influence on visual perception in the non-snow and snow seasons and to determine the visual attention rules of residents during leisure walking. The data analysis results of the 40 groups of experiments in the snow and non-snow seasons are as follows.
In the non-snow season, as shown in Figure 8a, the average results for the number of fiction (NF) and visits (NV) were ground > buildings > tall trees > lawn > sky > pedestrians > artificial landscape > seats > sports facilities > cars. In Figure 8b, the average results for total fixation duration (TFD) and total glance duration (TGD) were as follows: ground > buildings > tall trees > lawn > sky > artificial landscape > pedestrians > seats > cars > sports facilities. However, the proportions of fixation time (PFD) and glance time (PGD) are shown in Figure 8c as follows: ground > buildings > tall trees > lawn > sky > artificial landscape > pedestrians > seats > cars > sports facilities.
In the non-snow season environment, the gaze characteristics of people engaged in leisure walking between houses in cold regions were similar. In the outdoor leisure environment, the attention paid to the ground, buildings, tall trees, and lawns was higher than that paid to seats, cars, and sports facilities, which was consistent with actual walking behavior. Although participants paid moderate attention to the sky, considering that the openness of the sky is affected by buildings and tall trees, this study selected the ground, buildings, tall trees, and lawns as the environmental entity elements affecting visual perception in non-snow-season environments.
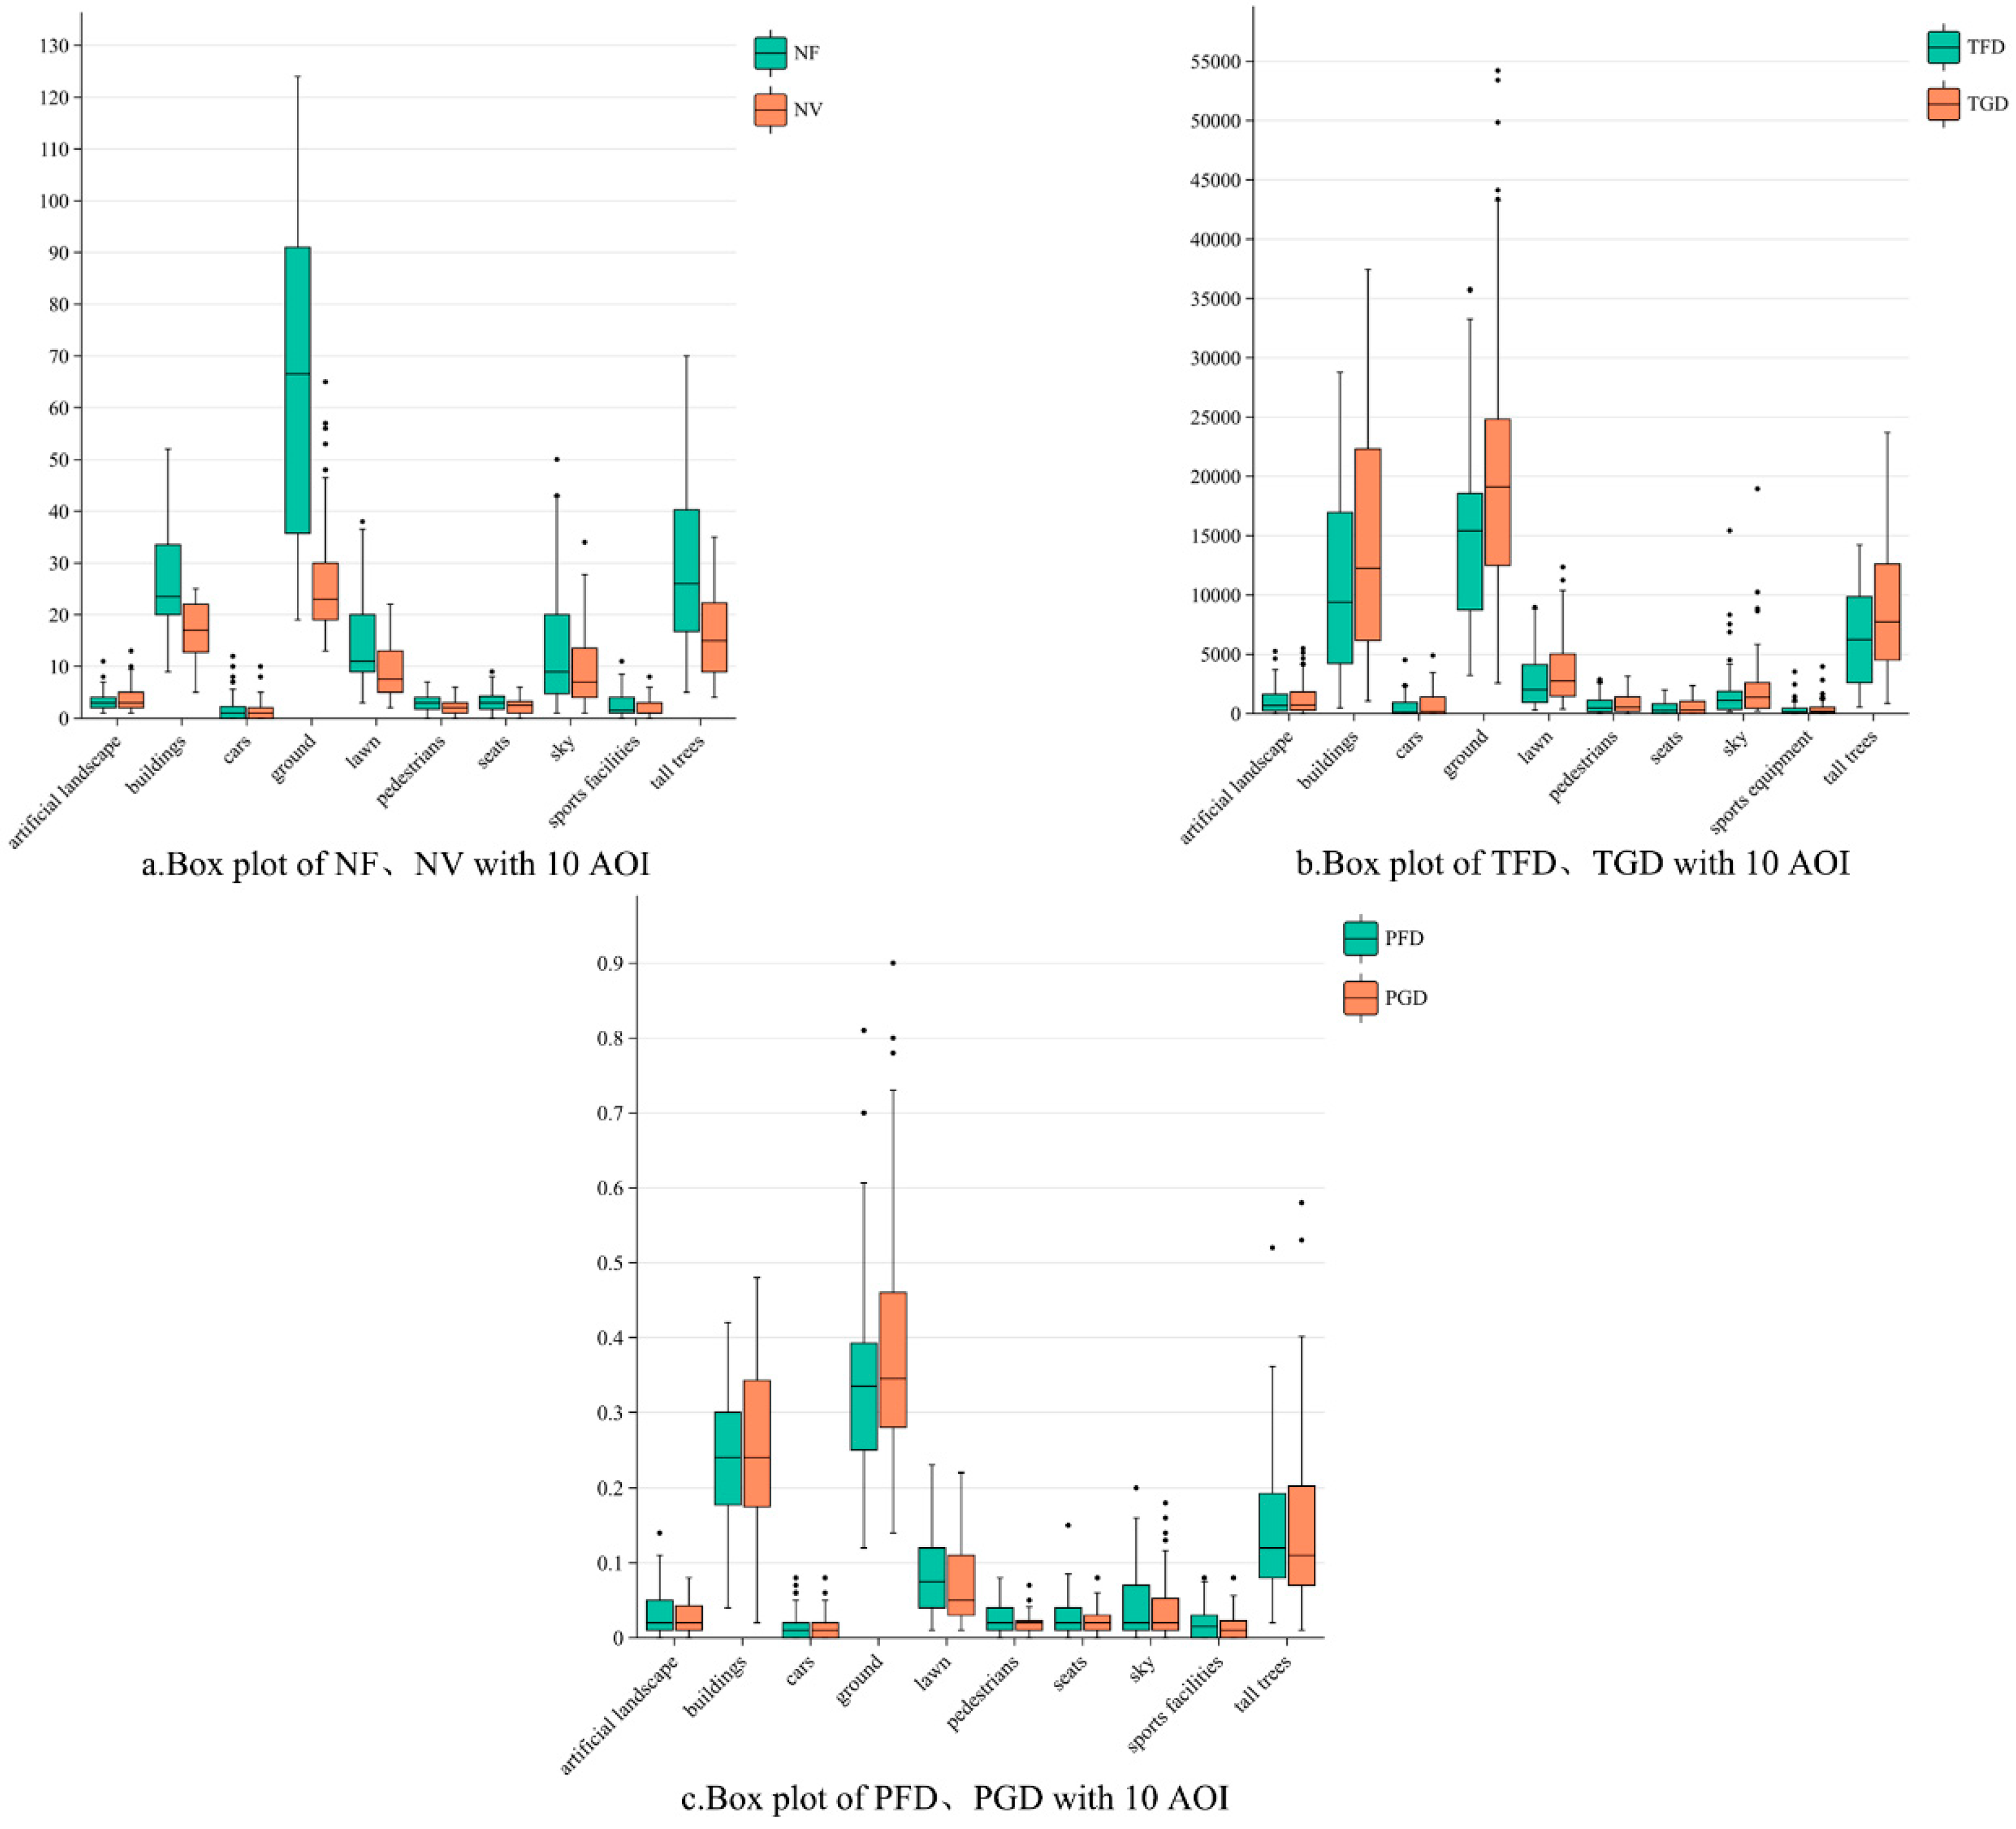
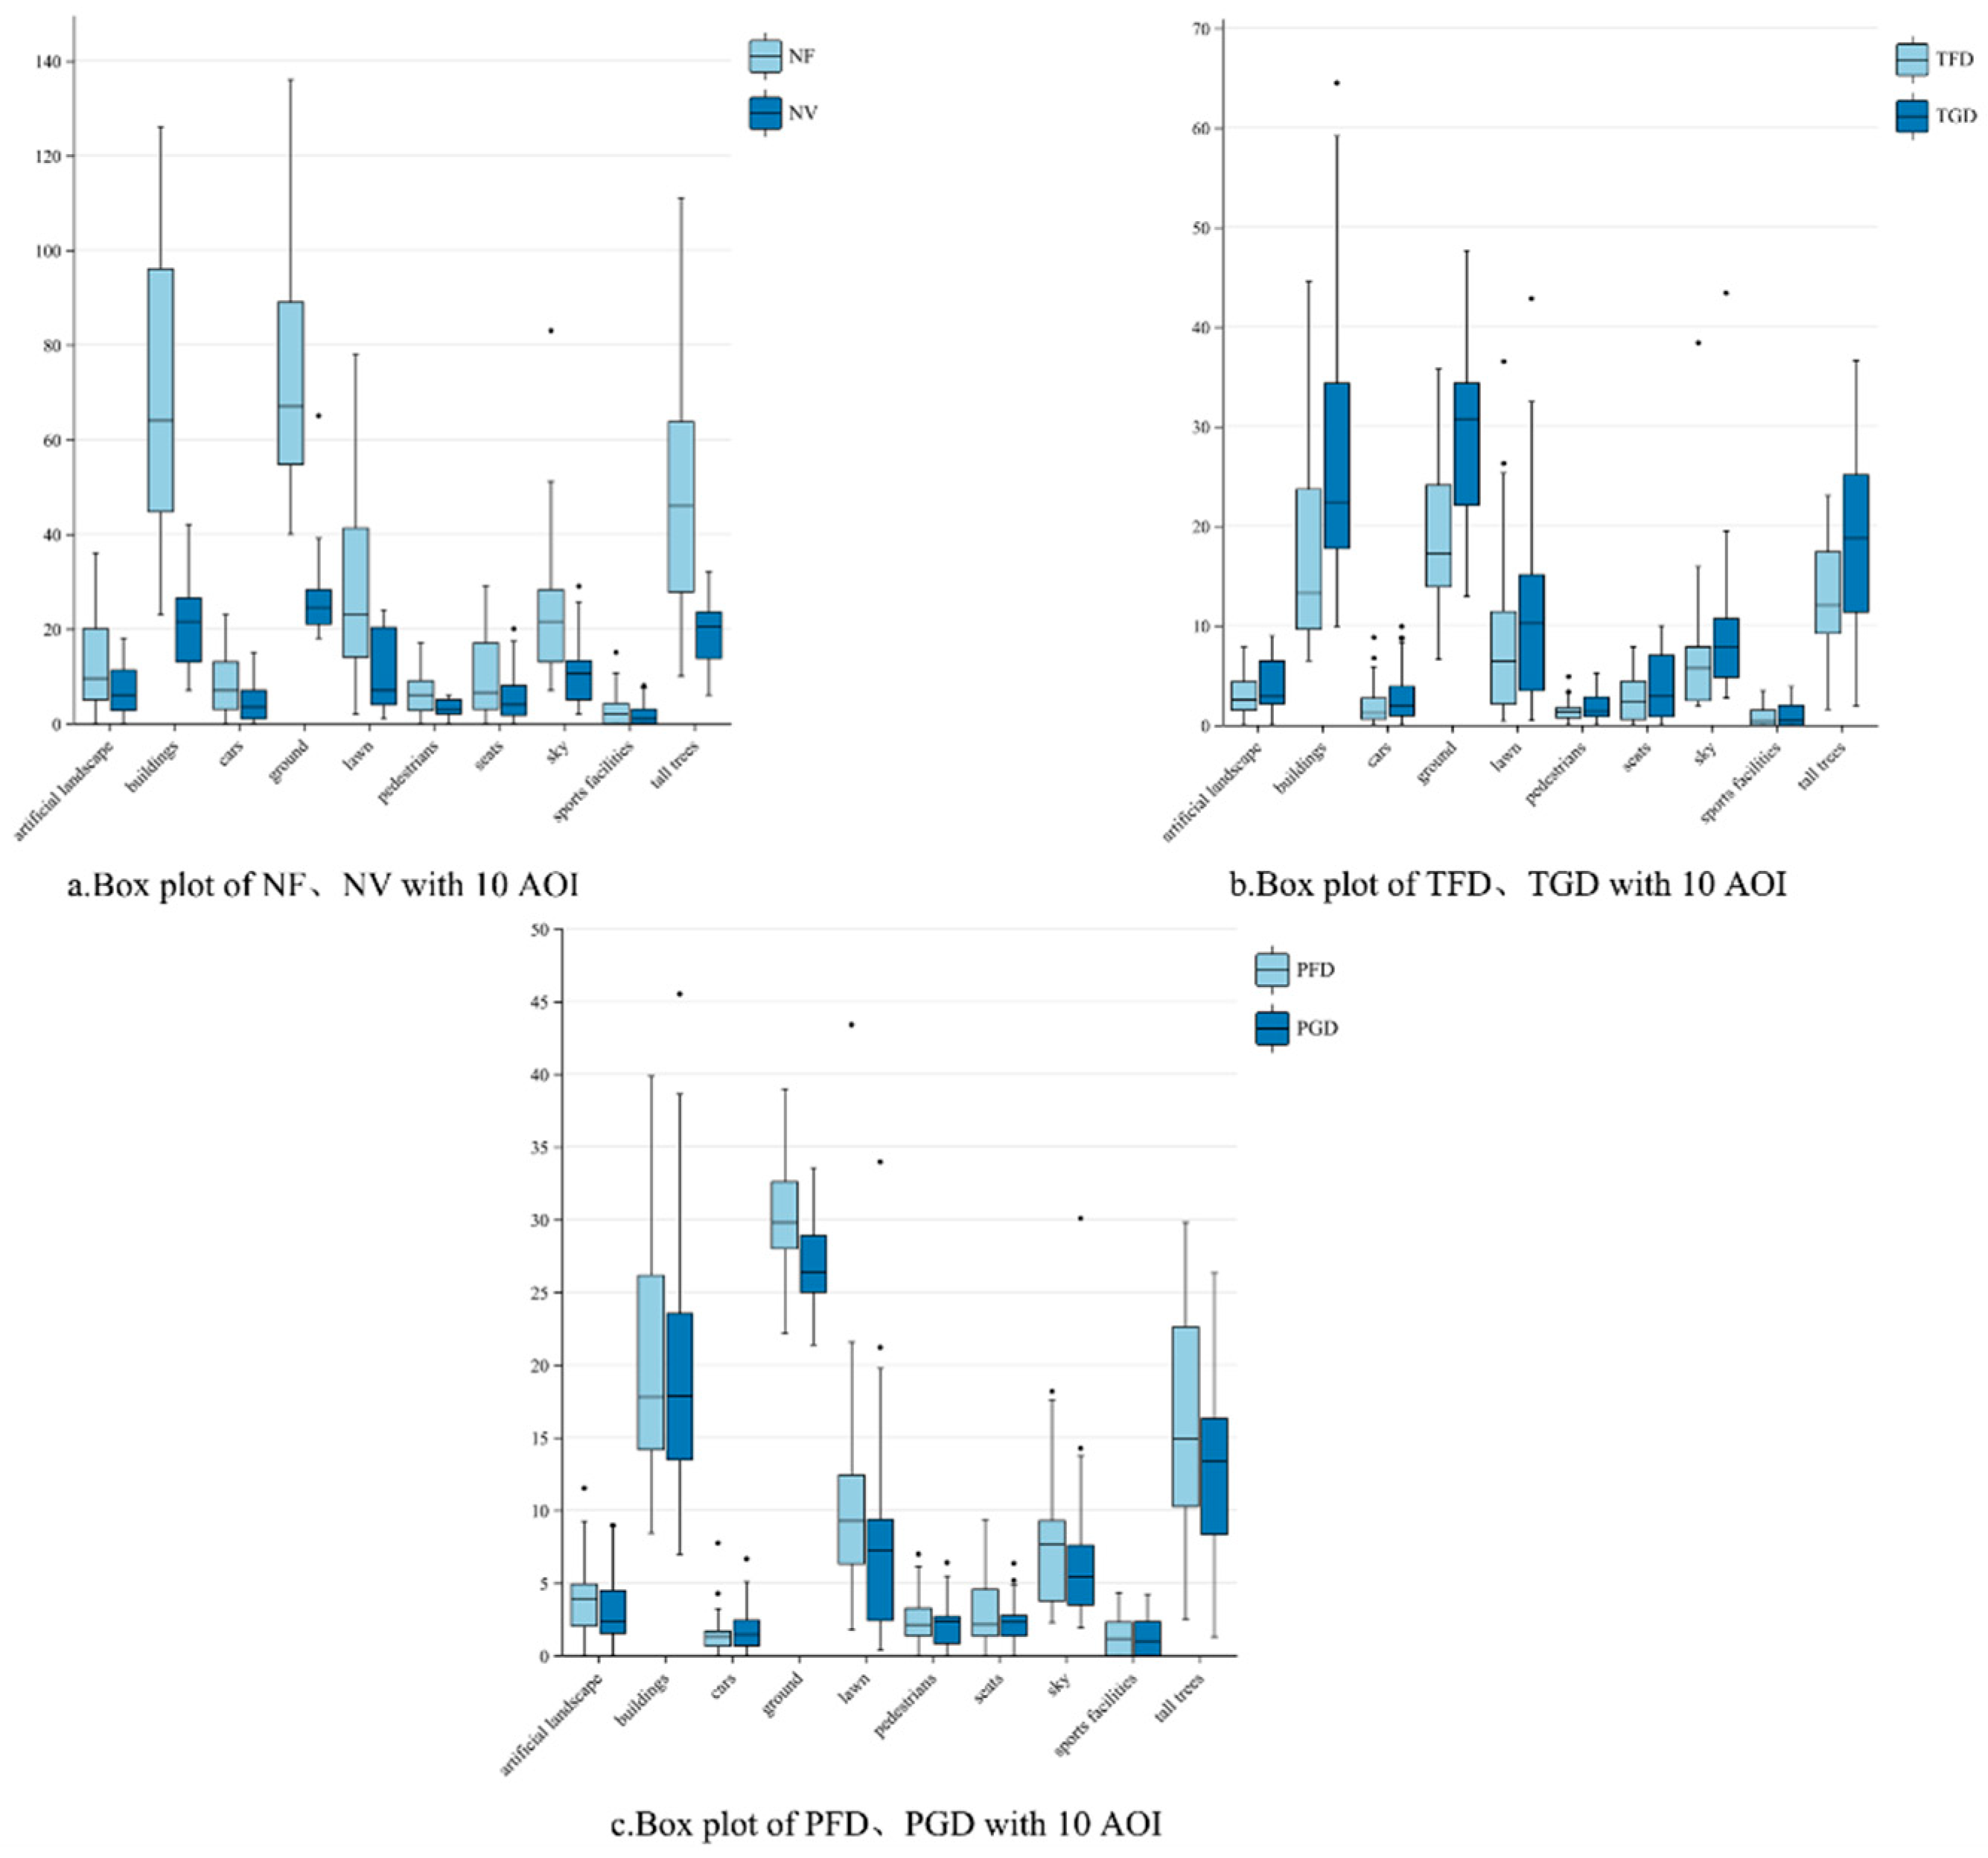
In the snow season, as shown in Figure 9a, the average results for the number of fiction (NF) were as follows: ground > tall trees > buildings > lawn > sky > artificial landscape > seats > pedestrians > cars > sports facilities. The average result of the number of visits (NV) was ground > buildings > tall trees > lawn > sky > artificial landscape > seats > pedestrians > cars > sports facilities. In Figure 9b, the average results for total fixation duration (TFD) and total glance duration (TGD) were as follows: ground > buildings > tall trees > lawn > sky > artificial landscape > pedestrians > seats > cars > sports facilities. However, the proportions of fixation time (PFD) and glance time (PGD) are shown in Figure 9c as follows: ground > buildings > tall trees > lawn > sky > artificial landscape > seats > pedestrians > cars > sports facilities.
In the snow-season environment, the ground, buildings, tall trees, and lawns remained the top four elements of attention when people took leisure walks, while the other six elements were relatively small. Therefore, this study selected the ground, buildings, tall trees, and lawns as environmental entity elements that affect visual perception in the snow-season.
Figure 8.
Analysis of leisure gaze features in real scene in non-snow season.
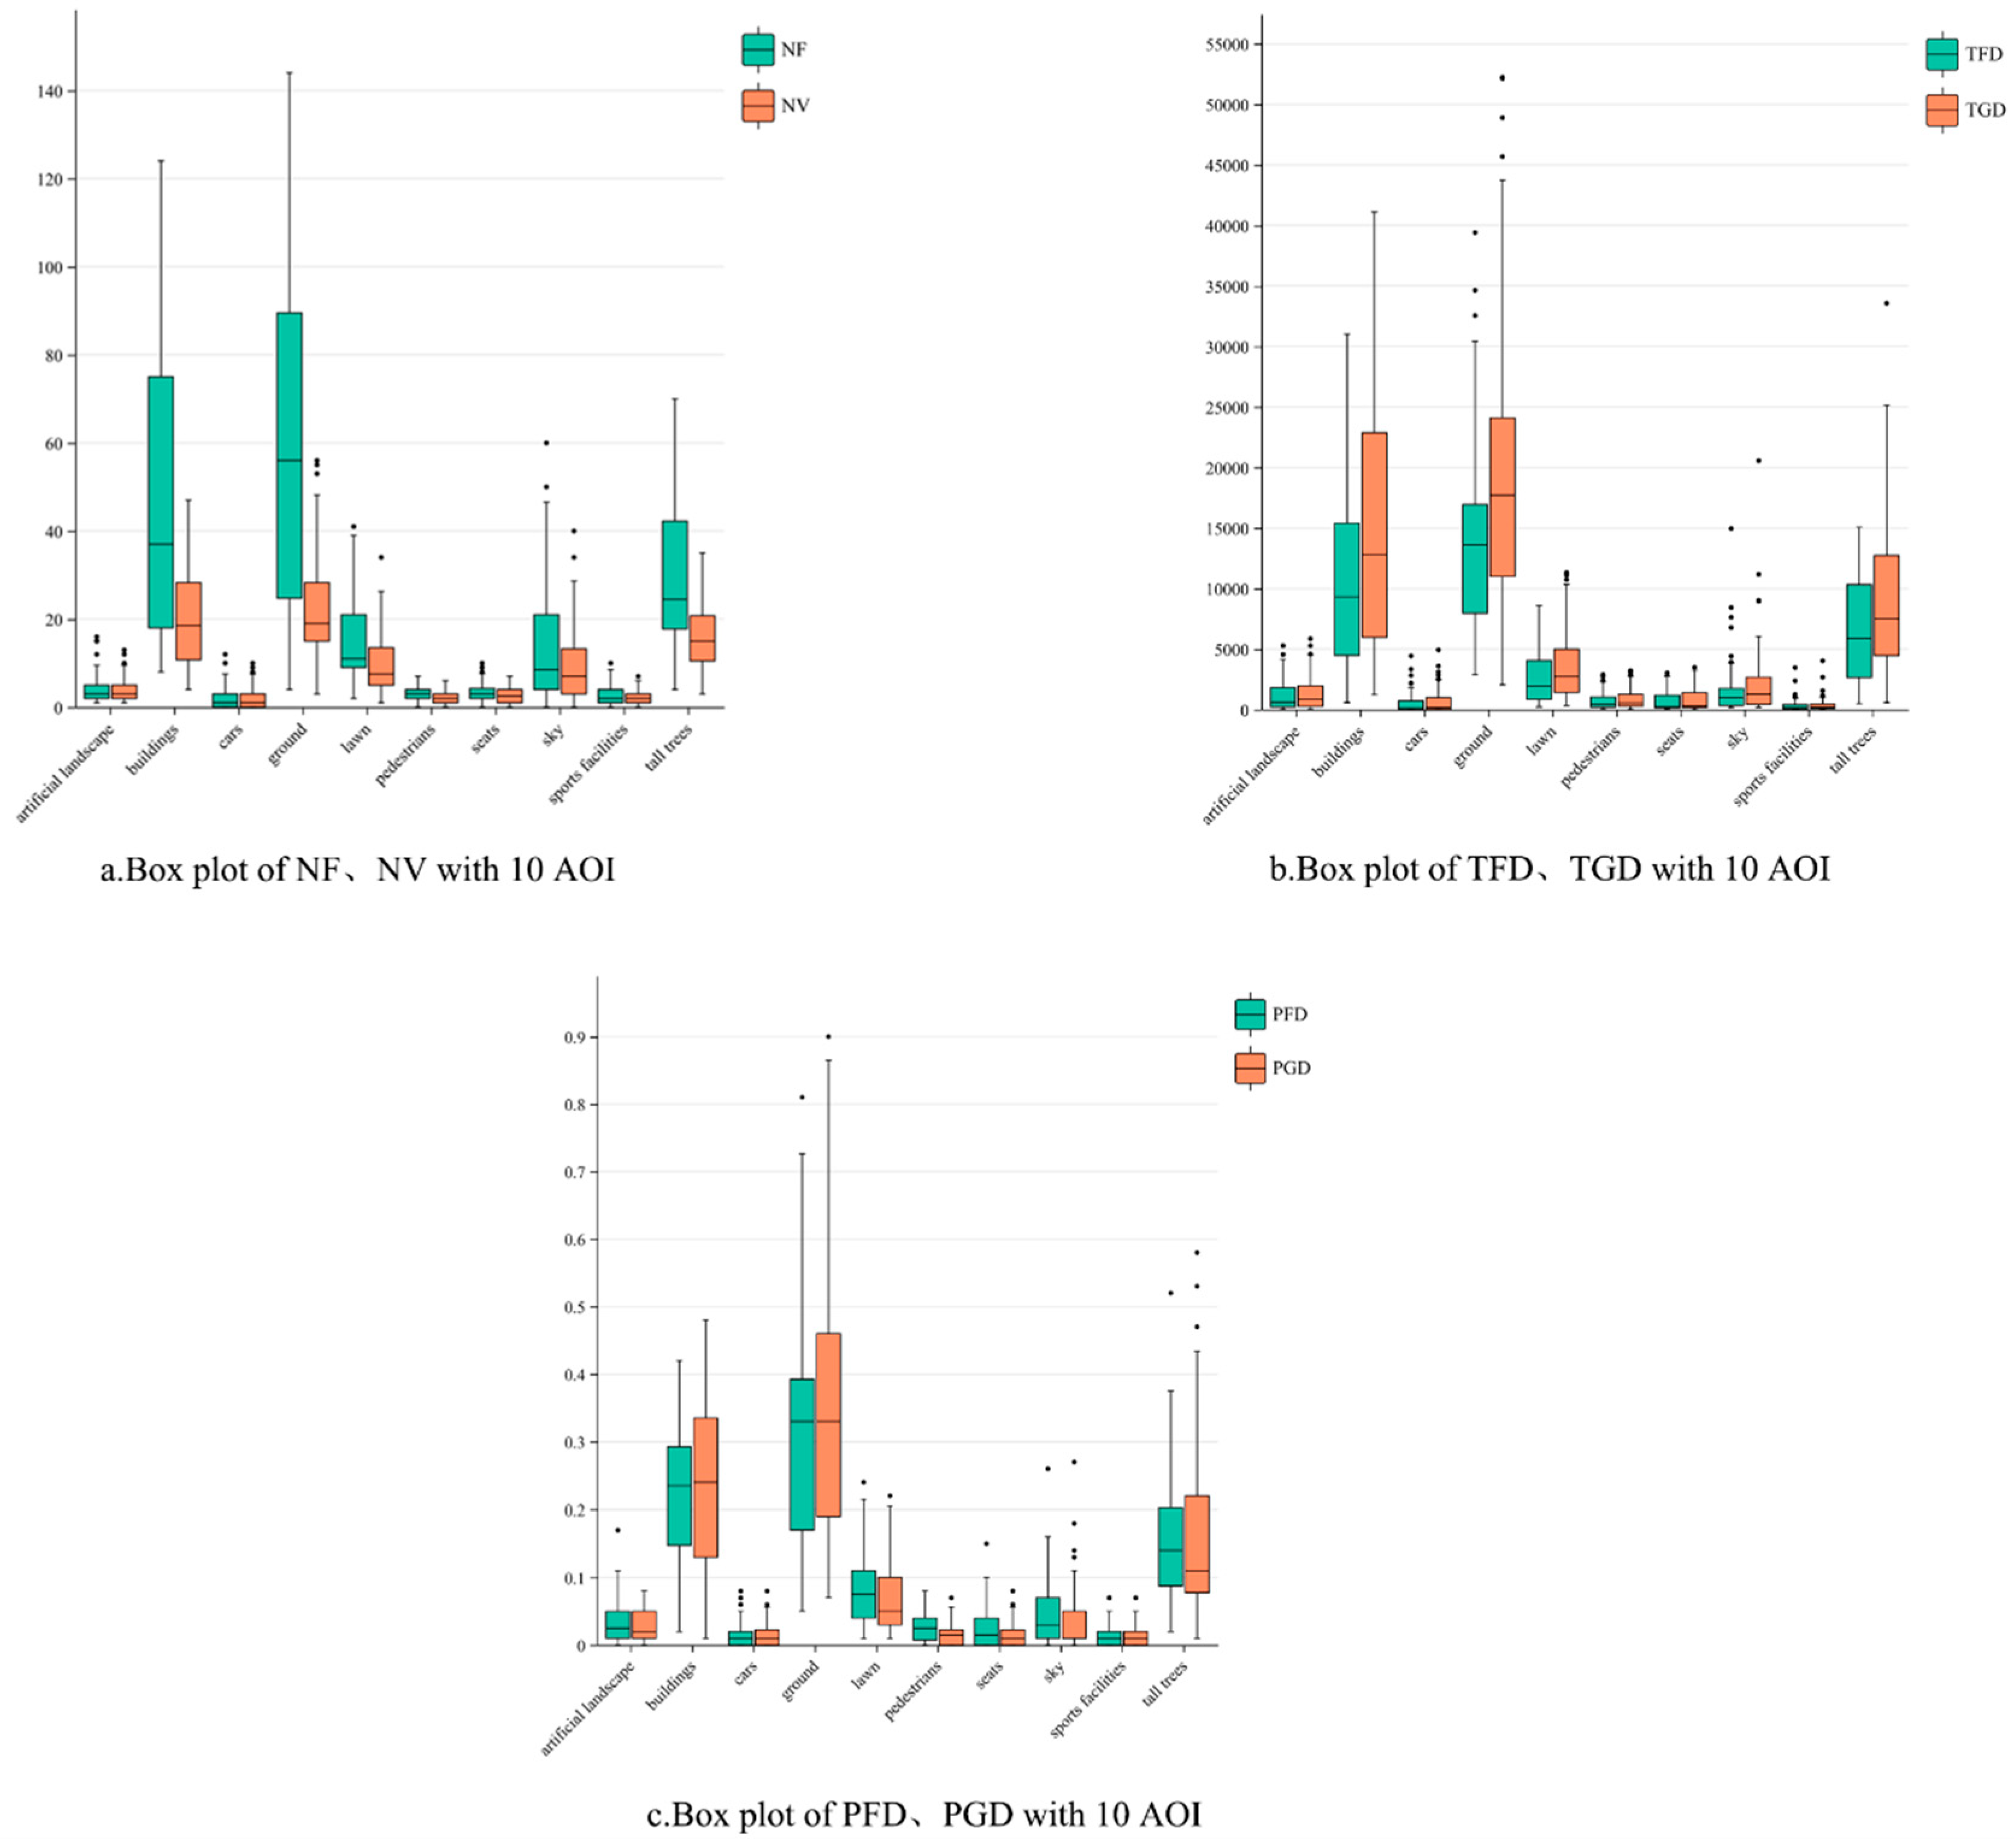
Figure 9.
Analysis of leisure gaze features in real scene in snow season.
3.1.3. VR eye tracking verification
The purpose of the VR eye-tracking experiment was to verify whether the gaze characteristics of the subjects in an immersive virtual reality scene represented the gaze characteristics of the actual scene. Through the analysis of 32 groups of data in the non-snow season environment, When travelling with two handles, as shown in Figure 10a, the average result of the number of visits (NV) is buildings > tall trees > ground > sky > lawn > artificial landscape > seats > pedestrians > cars > sports facilities. In Figure 10, the average results for the number of fixations (NF), total fixation duration (TFD), total glance duration (TGD), proportion of fixation time (PFD) and proportion of glance time (PGD) show that buildings > ground > tall trees > sky > lawn > artificial landscape > seats > pedestrians > cars > sports facilities. Through the analysis of 32 groups of data during the snow season, as shown in Figure 11a, the average number of fixings (NF) was as follows: buildings > ground > tall trees > lawn > sky > artificial landscape > cars > seats > pedestrians > sports facilities. The average result of the number of visits (NV) was buildings > tall trees > ground > sky > lawn > artificial landscape > seats > cars > pedestrians > sports facilities. In Figure 11b and 11c, from the average results of the TFD, TGD, PFD, and PGD, the top four are the ground, buildings, tall trees, and lawns.
When subjects were actually walking, in the non-snow season environment, as shown in Figure 12, the average results for the number of visits (NV), number of gaze (NF), total gaze duration (TFD), total glance duration (TGD), proportion of gaze time (PFD), and proportion of glance time (PGD) were all ground > buildings > tall trees > sky > lawn > artificial landscape > seats > pedestrians > cas > sports facilities. In the snow season environment, as shown in Figure 13, the average results of the number of gaze times (NF) were ground > buildings > tall trees > lawns > sky > artificial landscapes > cas > seats > pedestrians > sports facilities. The average result of the number of visits (NV) is ground > buildings > tall trees > sky > lawn > artificial landscape > seats > cars > pedestrians > sports facilities. In Figure 13b and Figure 13c, the top four rankings from the average results of TFD, TGD, PFD, and PGD are ground, buildings, tall trees, and lawn.
It was found that the gaze characteristics of leisure walking in the virtual reality scene were consistent with those in the real scene, which proved that it is feasible to select the ground, buildings, tall trees, and lawns ranked in the top four as entity elements in the subsequent orthogonal VR experiments. Moreover, actually walking in a VR environment has a more realistic effect than using a joystick remote control. Therefore, combining the entity elements selected by the eye-tracker experiment with the attributes selected by the SD questionnaire, the six environmental impact factors of leisure perception in the non-snow season were selected as the space aspect ratio (SAR), roof height difference (RHD), proportion of grass in the field of view (GP), tall tree height (TTH), saturation of the building façade (BS), and hue contrast in the visual field (HC). The three environmental impact factors of leisure perception in the snow season were space aspect ratio (SAR), proportion of grass in the field of view (GP), and saturation of the building façade (BS).
Figure 10.
Analysis of gaze analysis of VR scenes using the joystick in non-snow season.
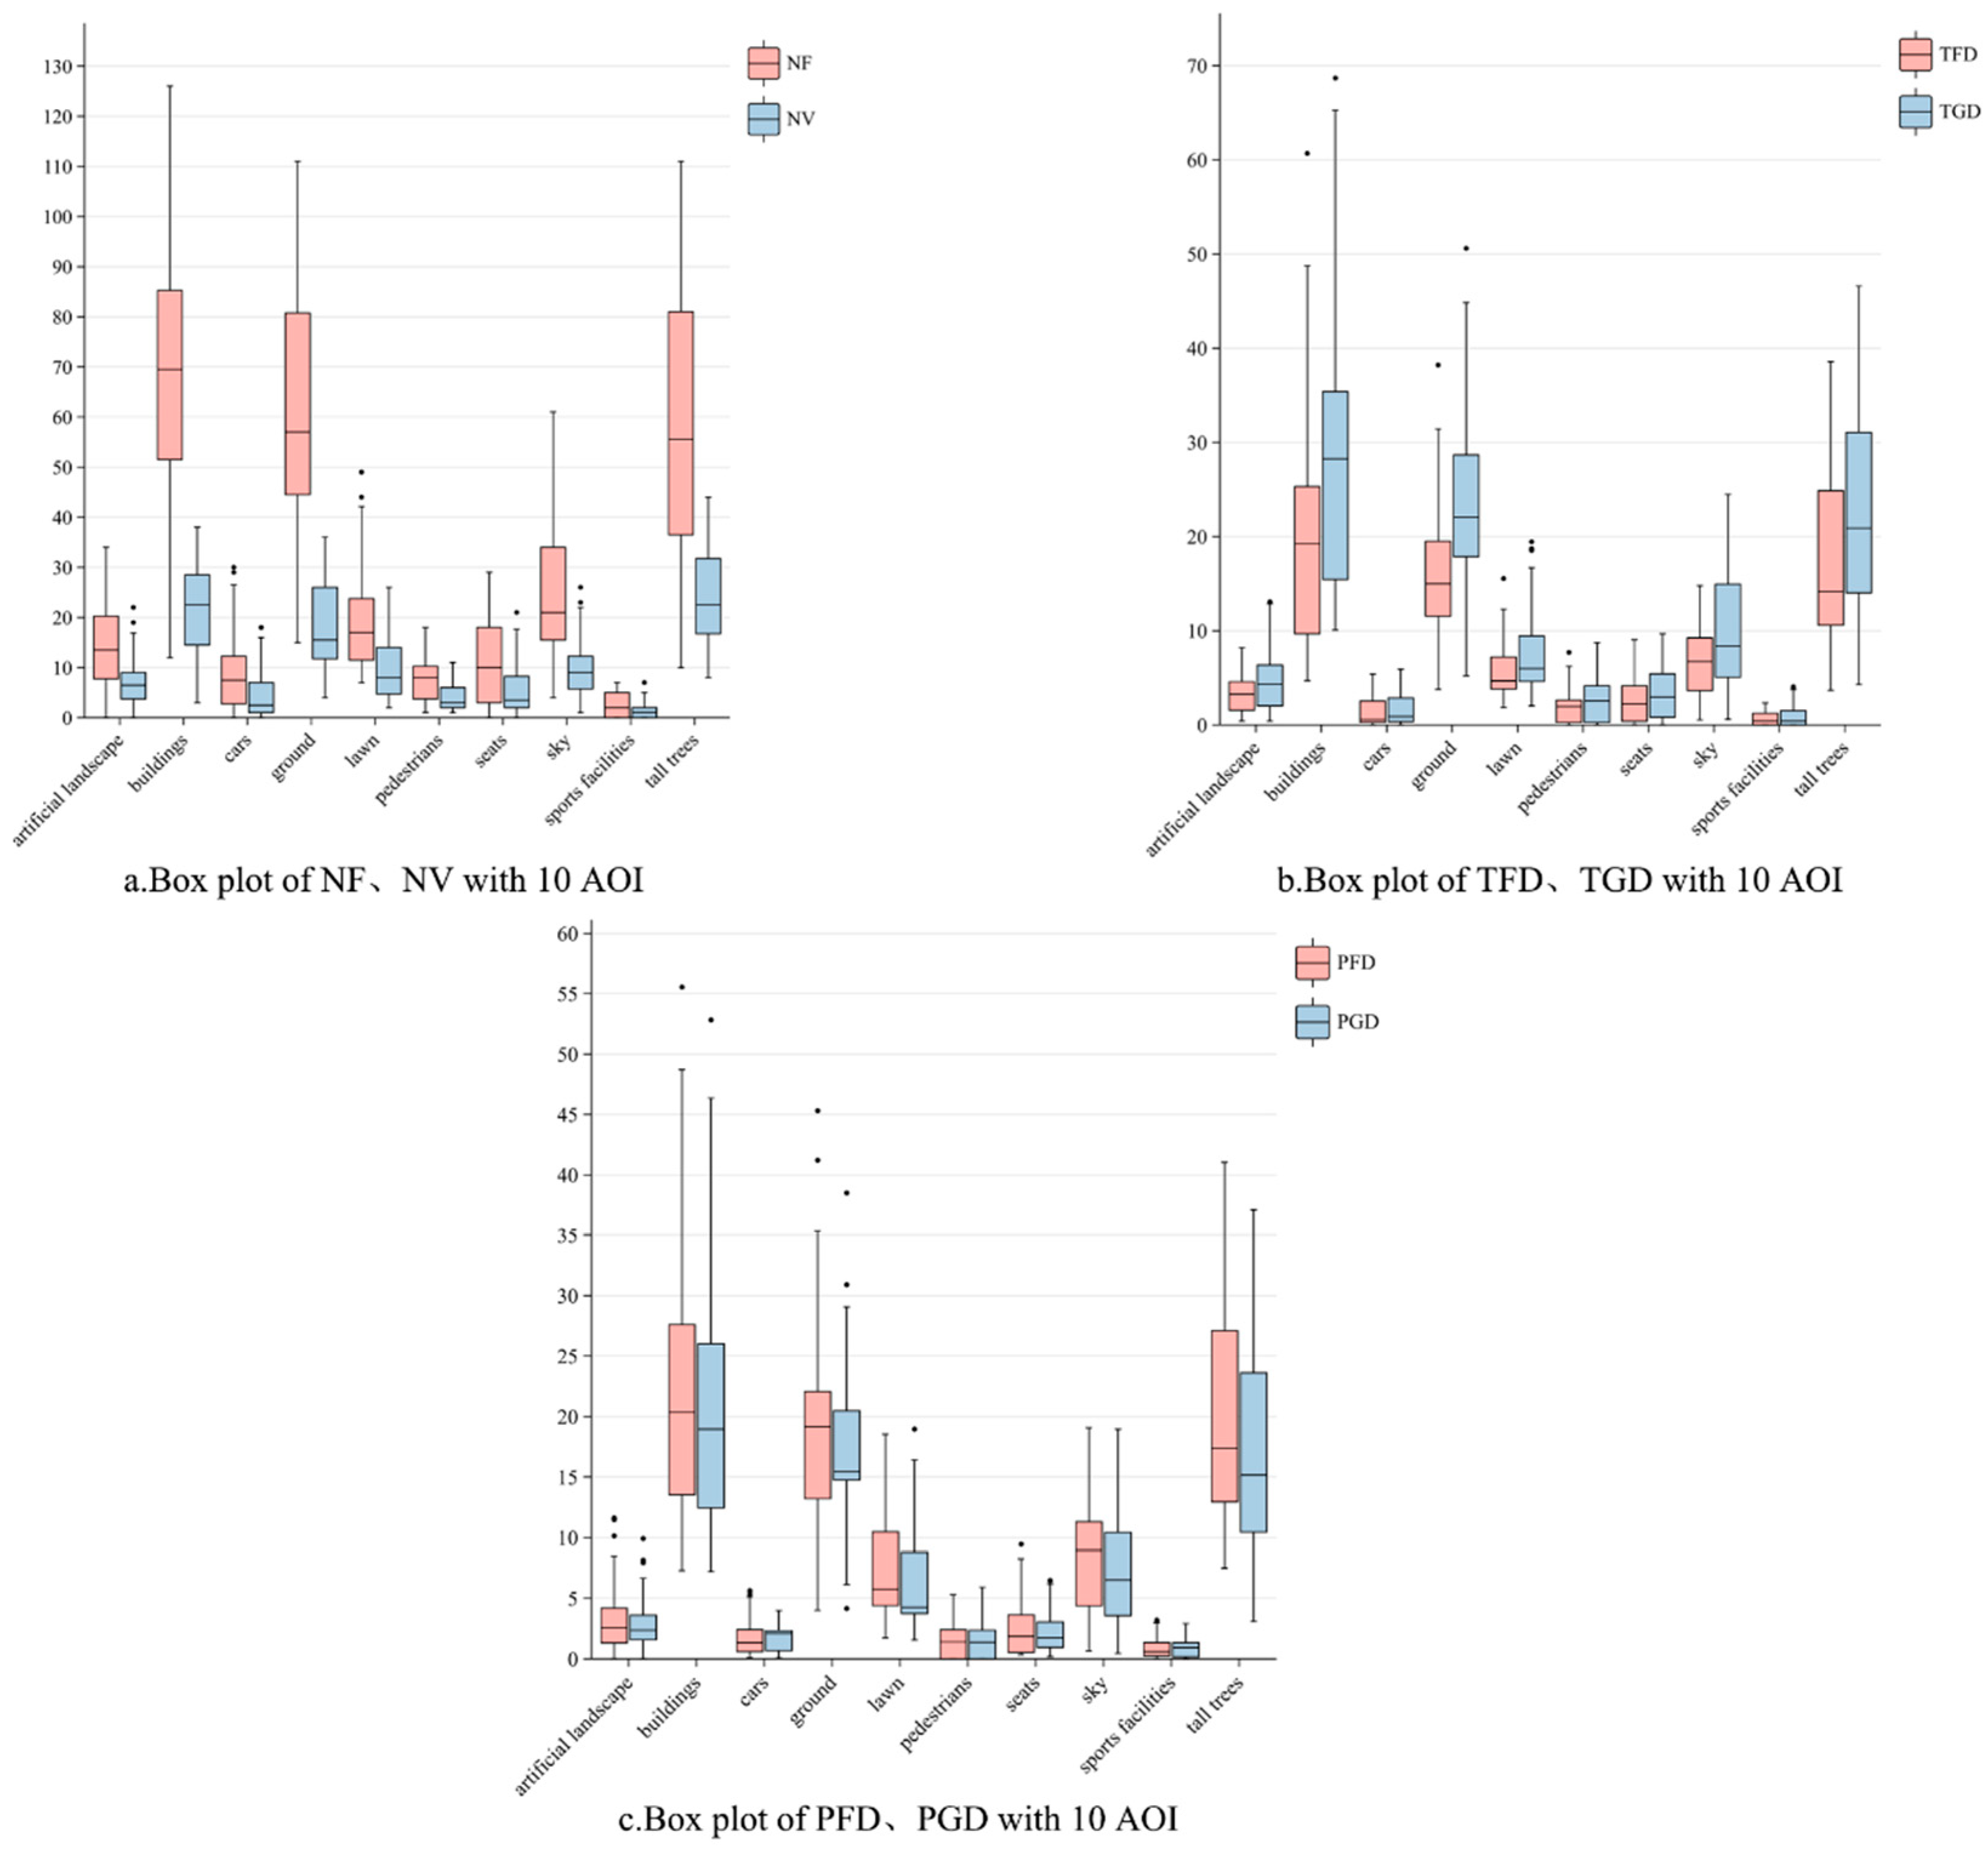
Figure 11.
Analysis of gaze analysis of VR scenes using the joystick in snow season.
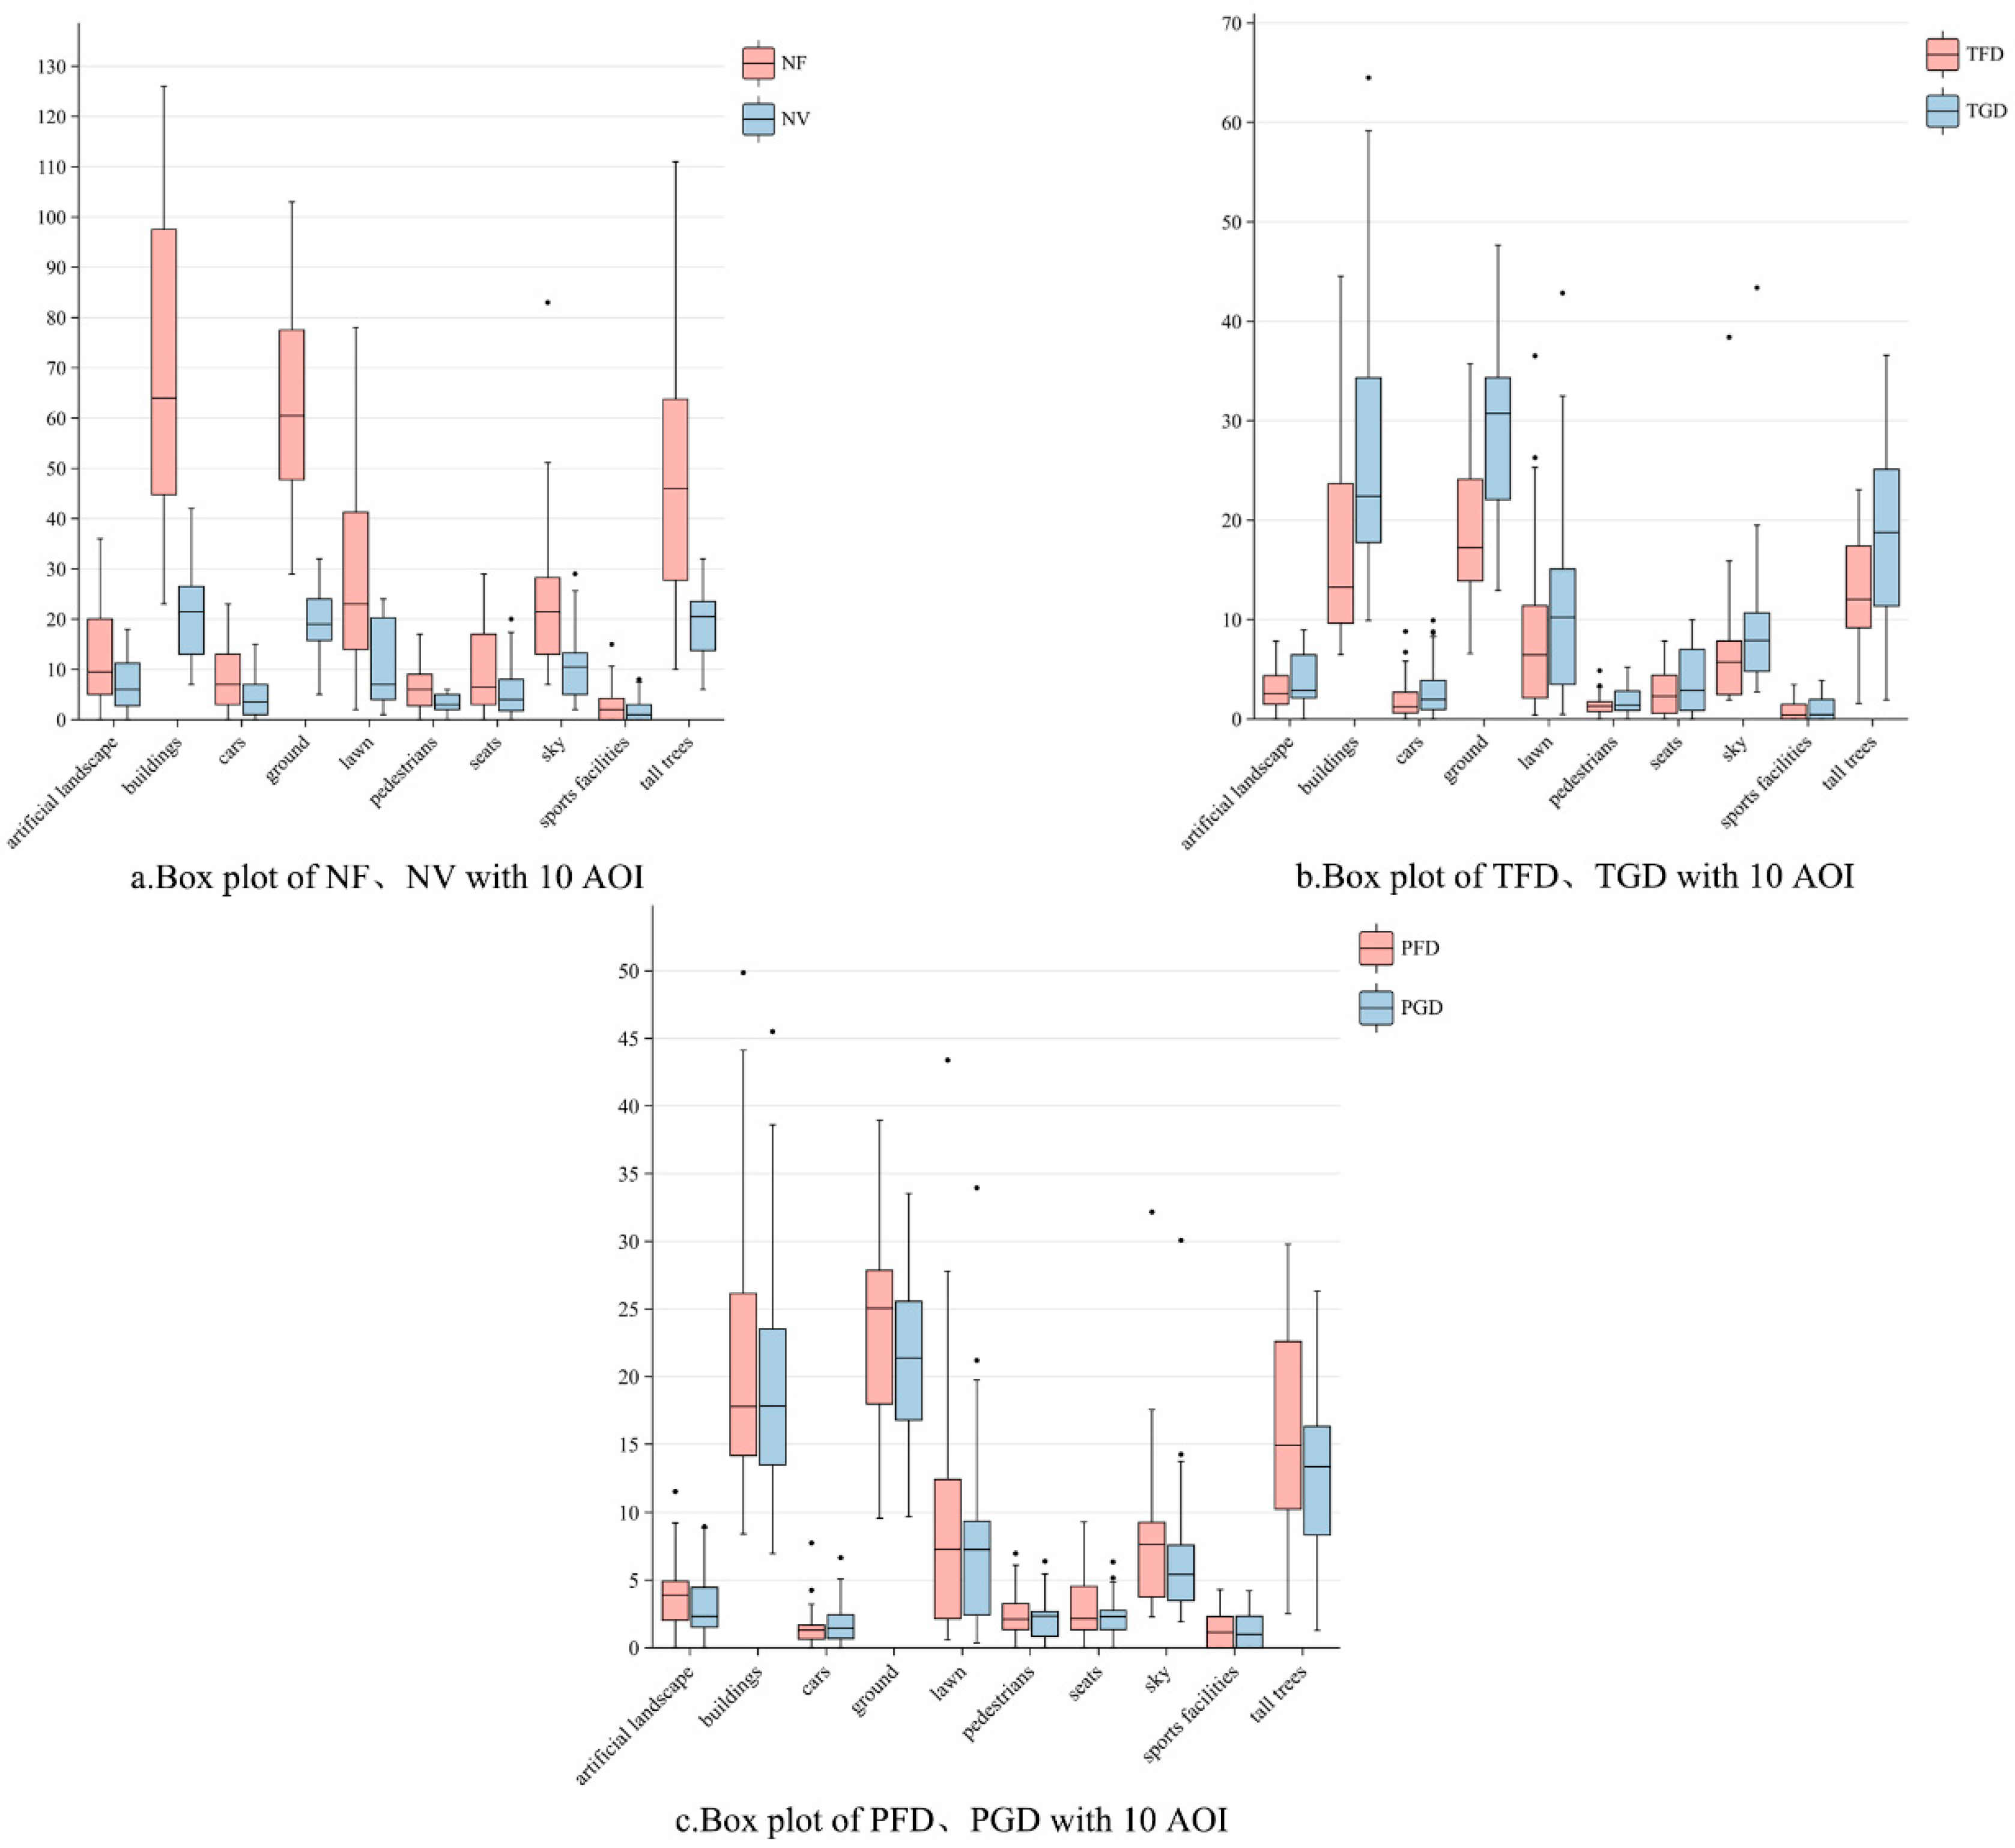
Figure 12.
Gaze Analysis of actual walking VR scenes in non-snow season.
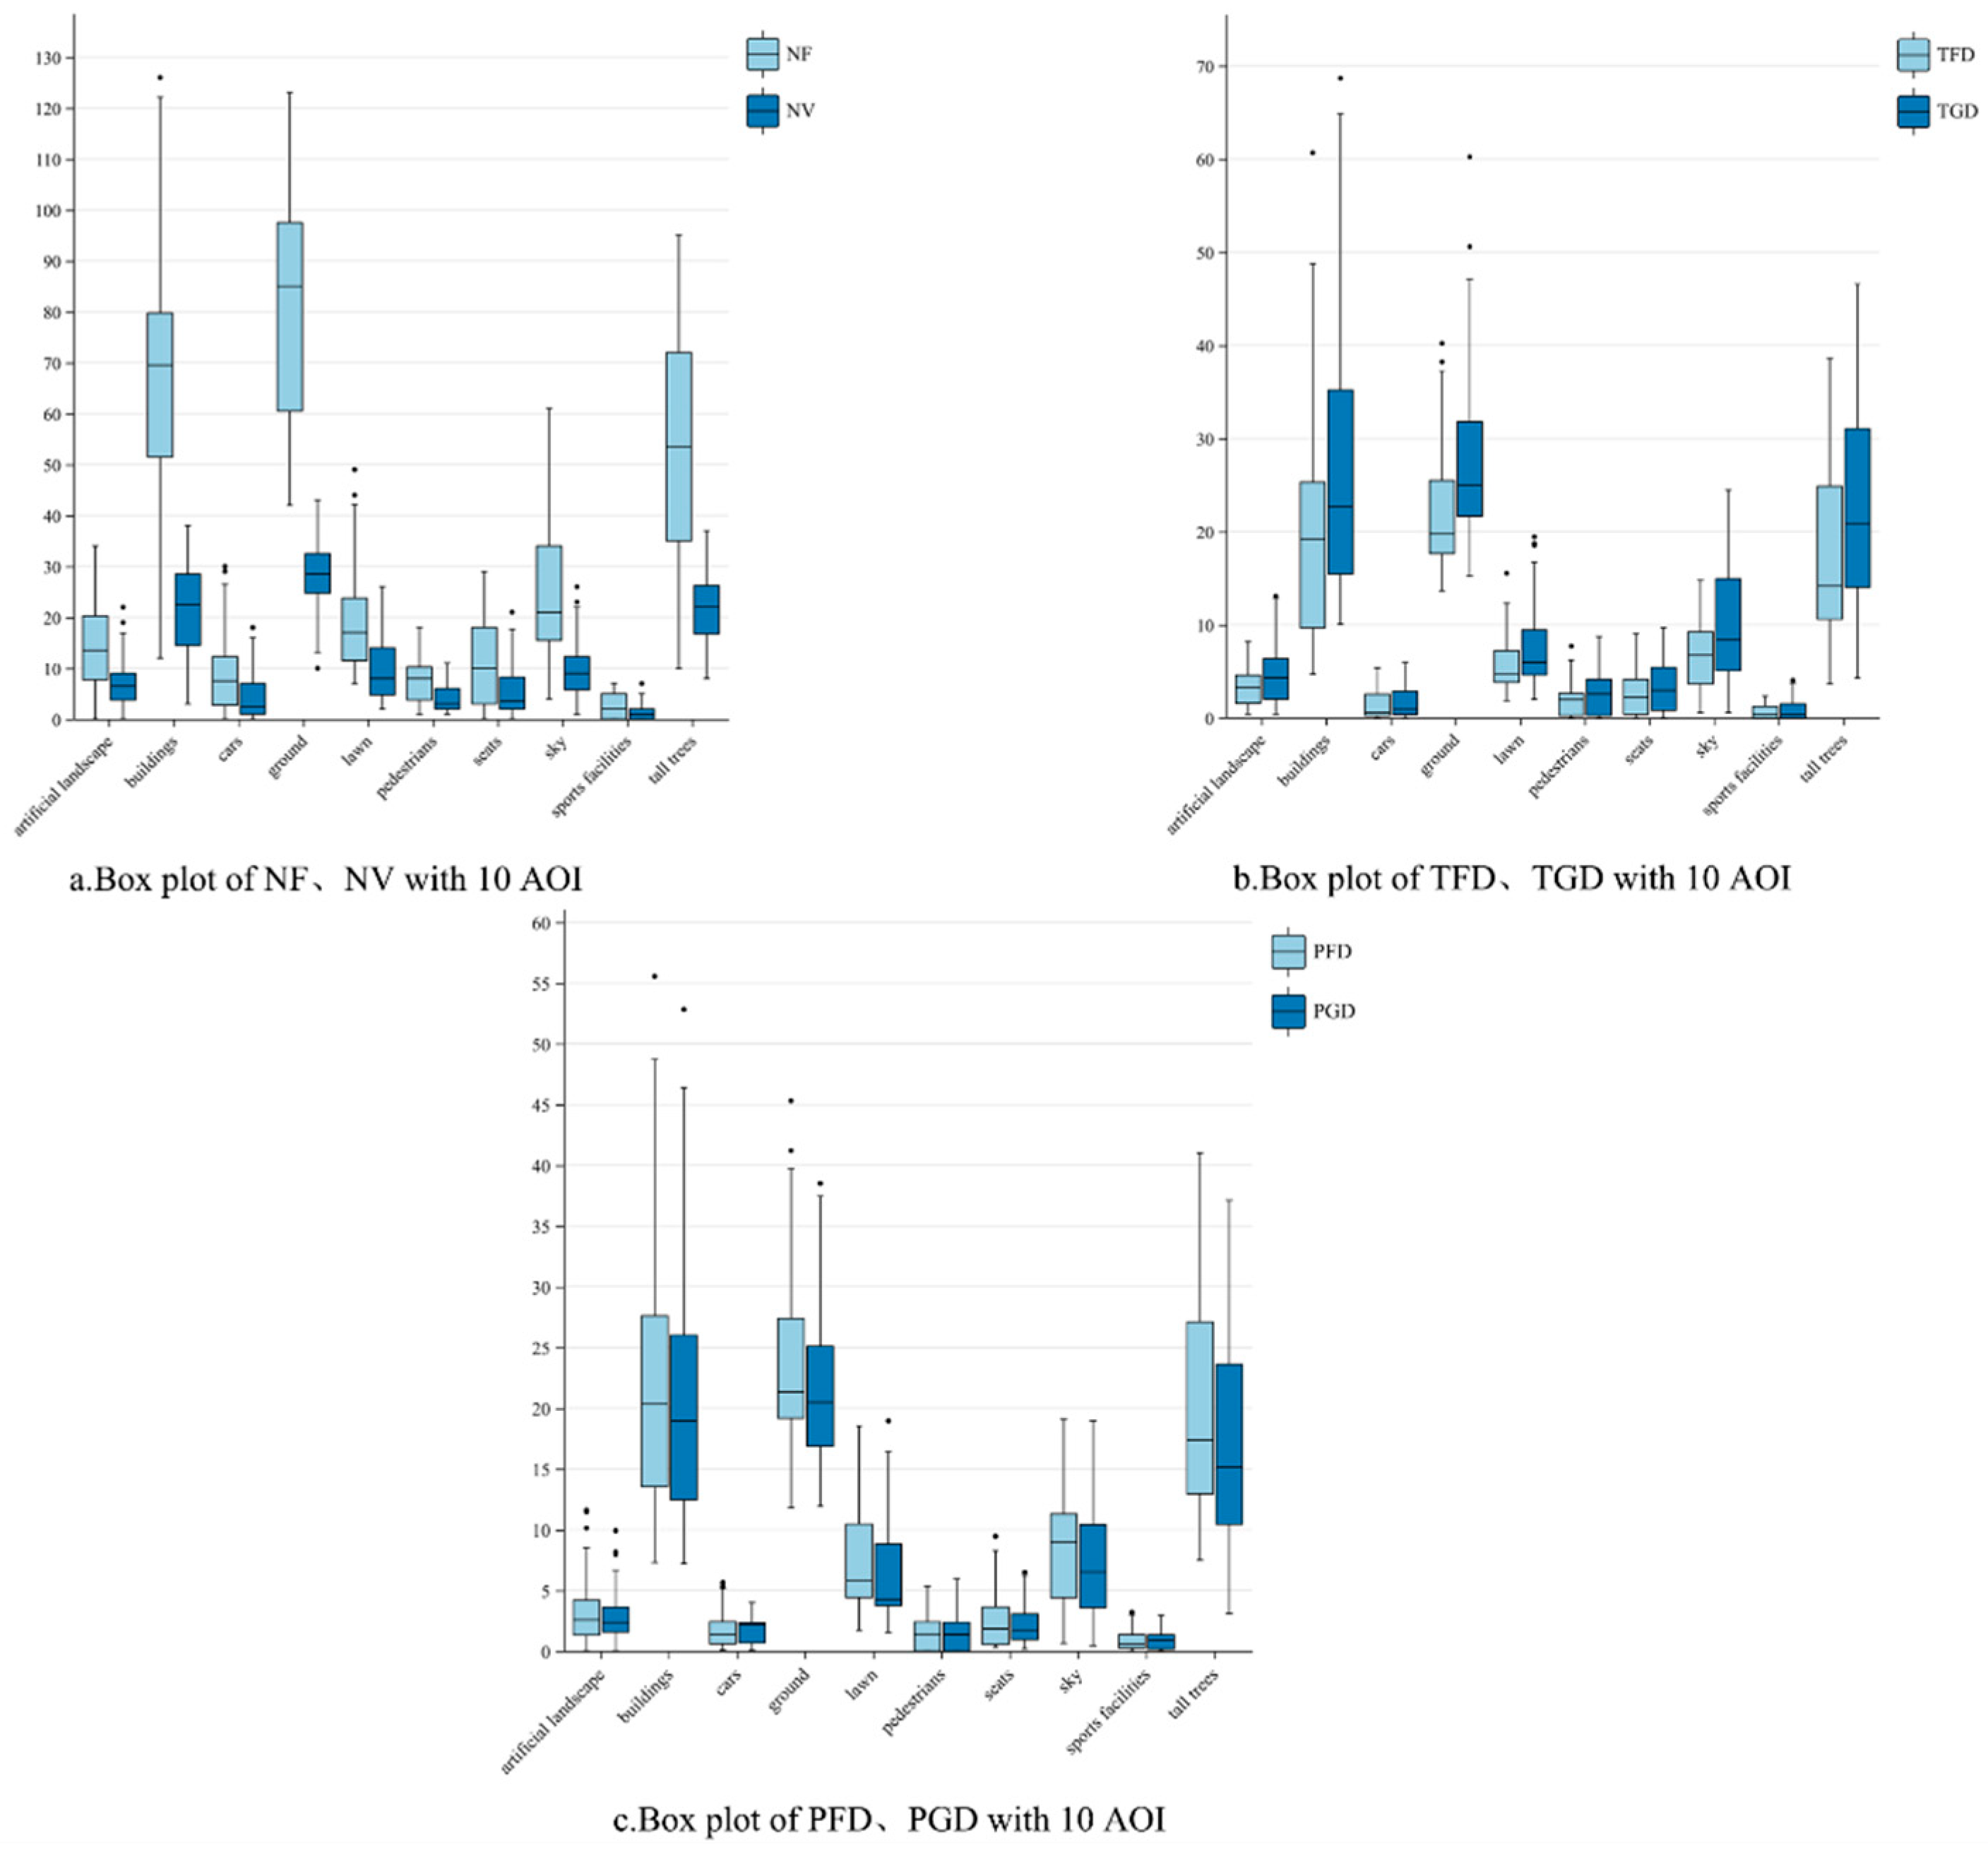
Figure 13.
Gaze Analysis of actual walking VR scenes in snow season.
3.2. Influence Mechanism
3.2.1. Influence mechanism of environmental factors in non-snow season
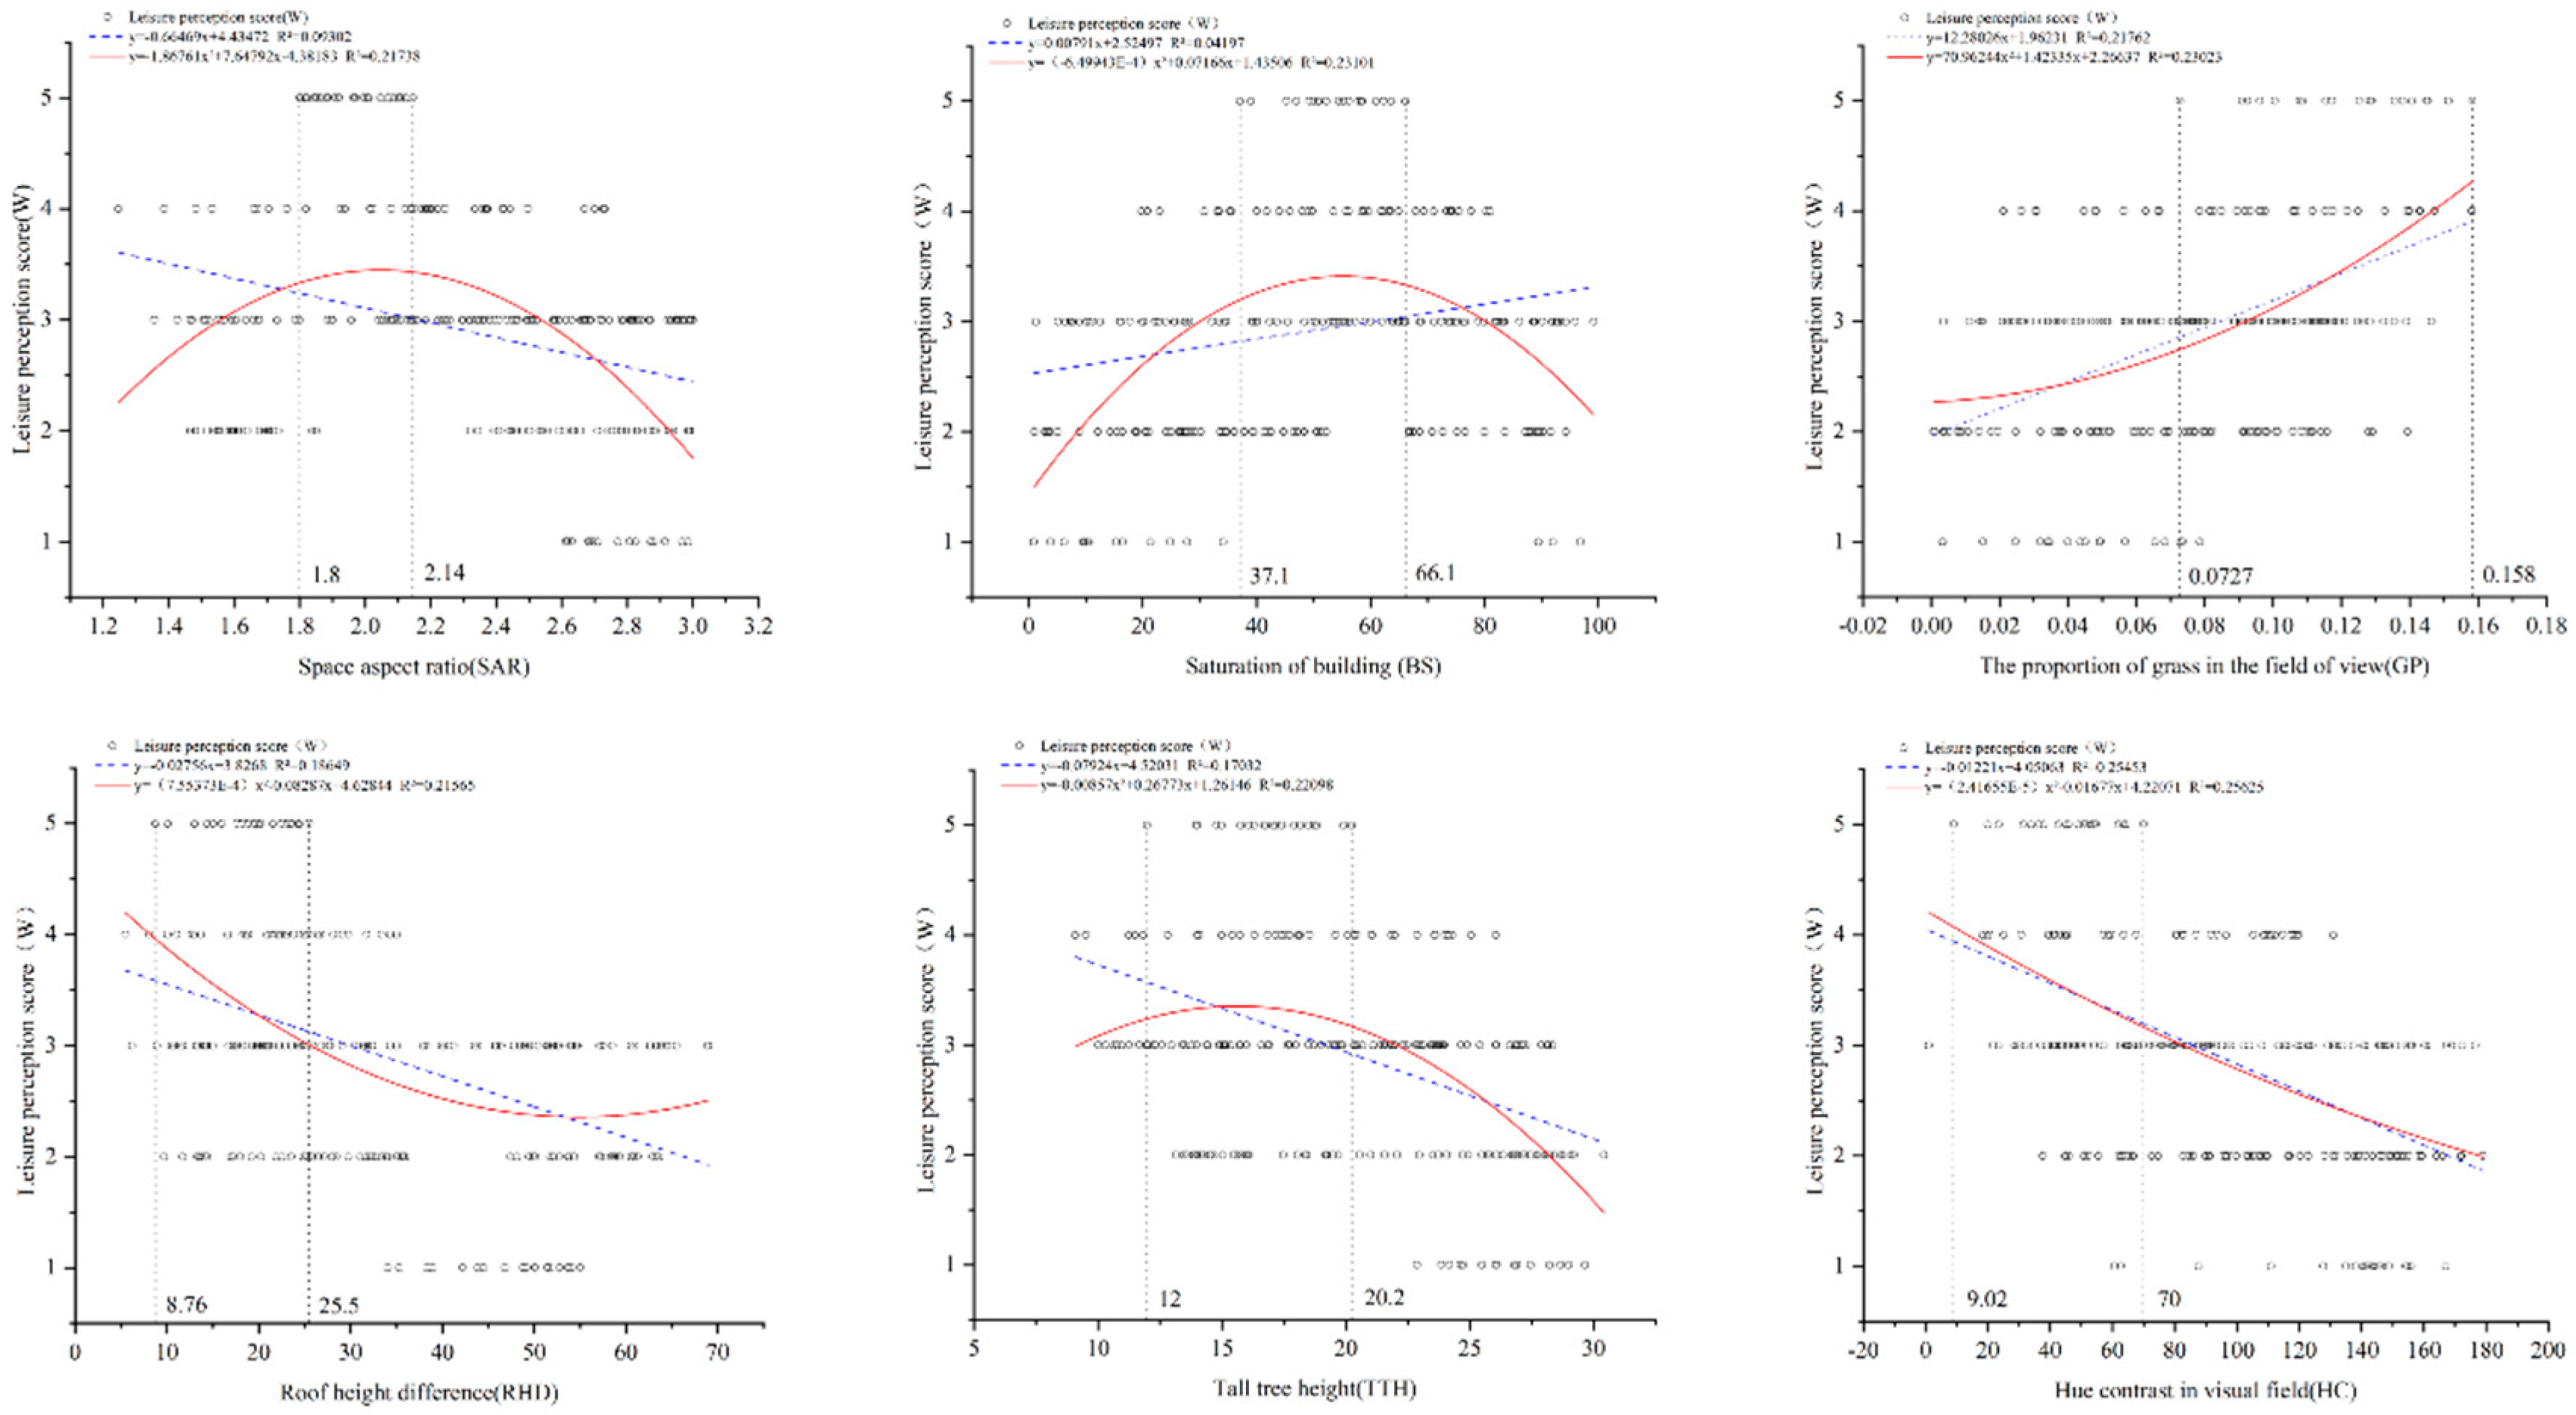
As shown in Figure 14, in the non-snow season environment, according to the correlation analysis, the leisure perception score (W) was correlated with the spatial aspect ratio (SAR), building facade saturation (BS), the proportion of grass in the field of view (GP), the roof height difference (RHD), the height of tall trees (TTH), and the hue contrast (HC).
As shown in Figure 14, the R-square of the quadratic fitting function between SAR and W (R²=0.21738) was higher than that of the primary fitting function (R²=0.09302). In the fitting relationship between SAR and W, W first increased and then decreased with an increase in SAR. The maximum value of W appeared in the middle of the SAR, and when W was the maximum value (W=5), the SAR ranged from 1.8 to 2.14.
As for BS and W, the quadratic fitting function of BS and W has a higher R-squared (R²=0.23101) than the primary fitting function (R²=0.04197). There was a positive correlation between the BS and W, with W showing a trend of first increasing and then decreasing with increasing BS. The maximum value of W appeared in the middle of the BS range. When W reached the maximum value (W=5), the BS ranged from 37.1 to 66.1.
For GP and W, the quadratic fit function for GP and W (R²=0.23023) had a higher R-square than the primary fit function (R²=0.21762). In the fitting relationship between the BS and W, W was positively correlated with GP, and W increased as GP increased. The maximum value of W appeared at the back of the range of GP values, and when W was the maximum value (W=5), the range of GP values was 7.27%-15.8%.
For RHD and W, the quadratic fitting function for RHD and W (R²=0.21565) exhibited a higher R-square than the primary fitting function (R²=0.18649). In the fitting relationship between RHD and W, W was negatively correlated with RHD, and W decreased with increasing RHD. The maximum value of W appeared in front of the value range of RHD. When W was at the maximum value (W=5), the value range of the RHD was between 8.76 m‒25.5 m.
In addition, the quadratic fitting function between TTH and W (R²=0.22098) has a higher R-square than the primary fitting function (R²=0.17032). In the fitting relationship between TTH and W,W first increased and then decreased with increasing TTH. The maximum value of W appears in the middle and front parts of the TTH range. When W is the maximum value (W=5), the TTH value range was 12m-20.2m.
In addition, the quadratic fitting function between the HC and W (R²=0.25625) had a higher R-square than the primary fitting function (R²=0.25453). In the fitting relationship between TTH and W,W was negatively correlated with the HC and showed a decreasing trend with increasing HC. The maximum value of W appeared in the front of the range of HC values, and for the maximum value of W (W=5), the range of HC values was between 9.02 and 70.
Figure 14.
Fitting effects of non-snow season influencing factors and leisure perception scores.
3.2.2. Influence mechanism of environmental factors in snow season
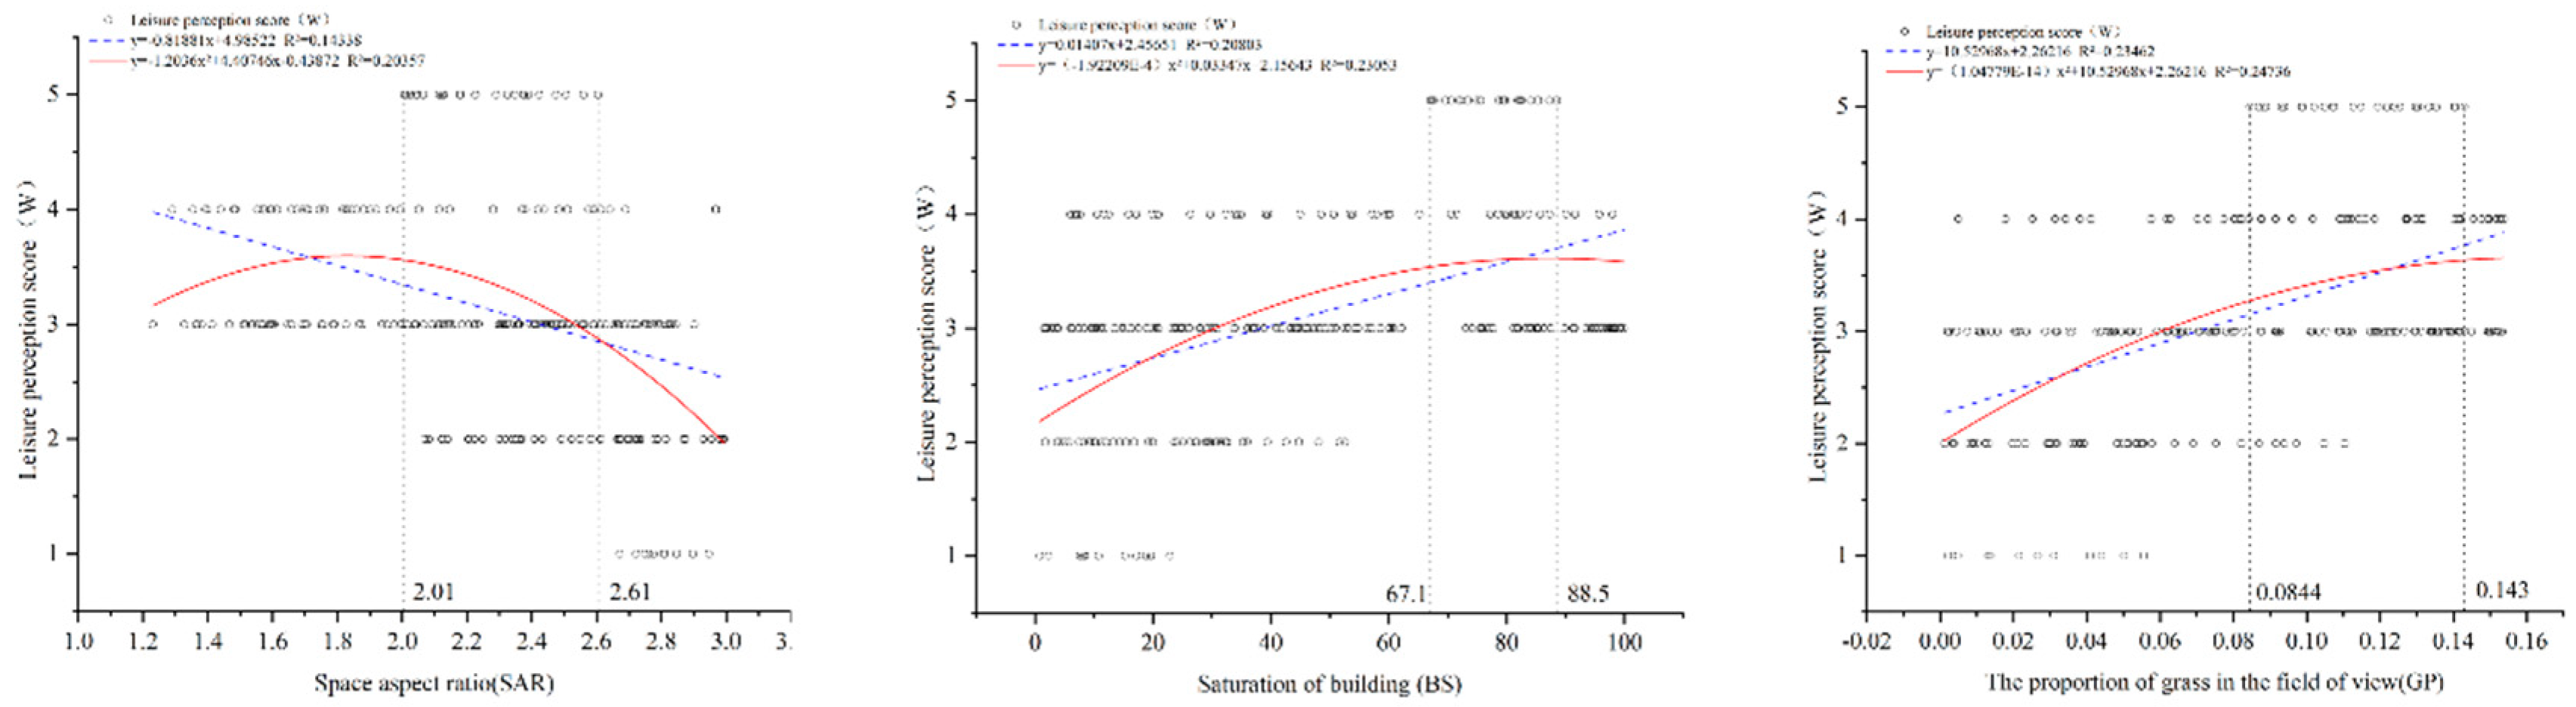
As shown in Figure 15, the leisure perception score (W) correlated with the spatial aspect ratio (SAR), roof height difference (BS), and proportion of grass in the field of view (GP), according to the correlation analysis in the snowy season environment.
For the SAR and W, the R-squared of the quadratic fitting function for spatial aspect ratio (SAR) (R²=0.20357) is higher than that of the primary fitting function (R²=0.14338). In the fitting relationship between SAR and W, W and SAR first showed a positive correlation and then a negative correlation, and W first increased and then decreased with an increase in SAR. At the maximum value of W (W=5), the SAR ranged from 2.01 2.61.
For the BS and W, the R-square of the quadratic fitting function (R²=0.23053) was higher than that of the primary fitting function (R²=0.20803). There was a positive correlation between W and BS, and with the increase of BS, W value showed a trend of first increasing and then decreasing. The maximum value of W occurs when the BS ranged from 67.1 to 88.5. In addition, when fitting the GP and W, the quadratic fitting function (R²=0.24736) had a higher R-square than the primary fitting function (R²=0.23462). W was positively correlated with GP and showed an increasing trend with increasing GP. The maximum value of W was concentrated in the posterior part of the GP range, and the BS ranged from 8.44% to 14.3% when W reached a maximum value of 5.
Figure 15.
Fitting effects of snow season influencing factors and leisure perception scores.
3.3. Threshold Optimization
3.3.1. Machine learning
This section describes the training and validation processes for machine learning. The prediction effects of the four classification algorithms were compared and the model structure was adjusted according to the fitting effect. The input datasets were 1960 sets of visual perception variables of the leisure environment in the non-snow and snow seasons, and the output data were scores of visual perception of leisure.
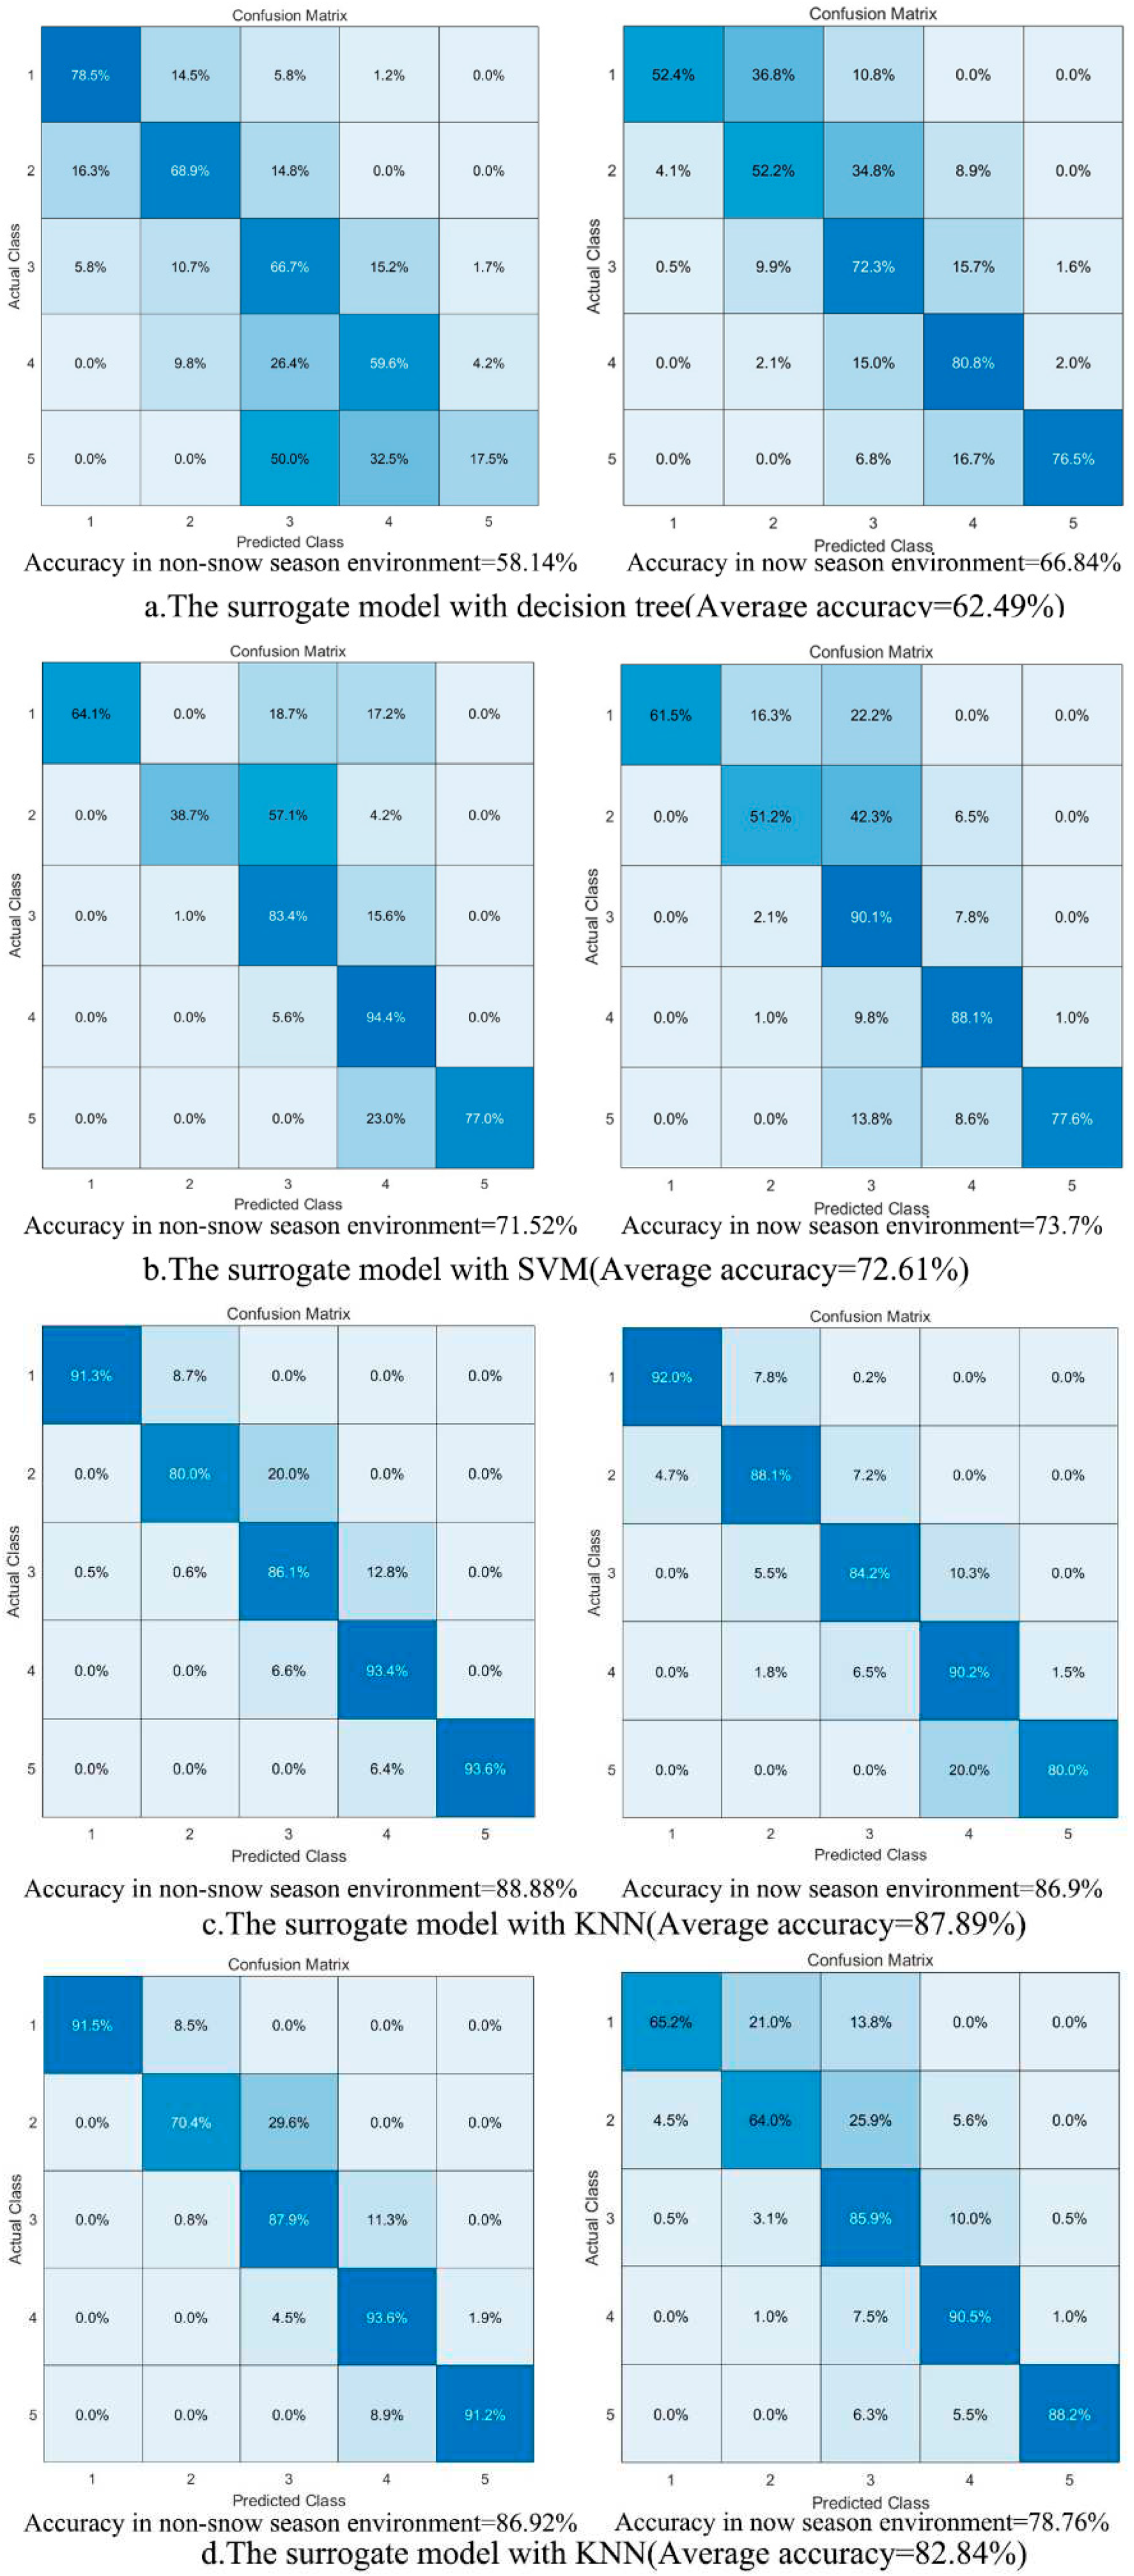
Four algorithms, decision tree, SVM, KNN, and ANN, were selected to train the prediction model in the Matlab-Classification leaner toolbox. Figure 16 shows the accuracy confusion matrix of the four algorithm scores in machine learning for the two environmental factors, from which the average prediction accuracy of the four algorithms was calculated.
In the prediction of the leisure perception score in the non-snow-season environment, the hyperparameters of KNN were as follows: The number of neighbor points was one, the distance measure cosine was used, the distance weight was the inverse distance square, the standardized data was true, and the accuracy was 88.88%, which was better than other classification methods (decision tree: 58.14%, SVM: 71.52%, and ANN: 86.92%). In the prediction of the leisure perception score in the snowy season environment, the hyperparameters of the KNN were as follows: The number of neighbors was 4, the distance metric Mahalanobis was used, the distance weight was inverse distance, the standardized data was true, and the accuracy was 86.9%, which was better than other classification methods (decision tree: 66.84%, SVM: 72.61% and ANN: 78.76%).
In general, as shown in Figure 16, the decision tree (62.49%) and SVM (72.61%) had relatively poor fitting results, and the ANN (82.84%) had a similar but smaller fitting effect than KNN (87.89%).
Figure 16.
Accuracy confusion matrix for 4 machine learning models.
3.3.2. Optimizing the Threshold
In the genetic algorithm optimization design, the environmental factors in the non-snow and snow seasons were set within a reasonable range for optimization, as shown in Figure 17 The environmental factor variable value at the maximum perception score was obtained from the optimization convergence results. The extreme values of the environmental factors obtained after the iterations were integrated, as shown in Table 5. According to the results of GA, in the optimization design of non-snow season environment, this research suggested to set SAR from 1.82 to 2.15, RHD from 10.81 m to 20.09 m, BS from 48.53 to 61.01, TTH from 14.18 m to 18.29 m, GP from 0.12 to 0.15, and HC from 18.64 to 26.83. In the snow-season, the extreme values of the environmental factors obtained after the iterations were integrated, as shown in Table 6. According to the results of GA, in the optimization design of the snow season environment, this study suggested that SAR from 2.22 to 2.54, BS from 68.53 to 82.34, and GP from 0.1 to 0.14.
4. Discussion
This study has attempted to compensate for the research gap of visual perception in the outdoor leisure environment in cold regions and obtained the entity elements of visual perception in the outdoor leisure environment in the non-snow season and the snow season and the appropriate threshold range. However, this study has limitations in the following three aspects.
4.1. Limitation of subject group selection and leisure type
Although this study conducted an element screening experiment for residential users and selected as many age groups as possible to participate, the age, physical condition, motion state, and visual focus of the subjects for element screening may be different. These results are valid for the study of leisure walking behavior, but the validity of this method for other common leisure behaviors has not been demonstrated. Other common visual environment studies of in-house leisure activities, such as sitting still[35]and jogging[62], should be conducted and tested in the future. Physiological indicator devices can be introduced in future studies to compensate for existing limitations[63,64].
4.2. Limitations of screening leisure visual environmental factors
Although this study explored the influence mechanism of visual perception in snow and non-snow seasons, the experiment did not consider the influence of physical factors such as temperature[65], humidity[66], and light environment[67]. In future studies, VR experiments will be conducted in combination with virtual environment warehouse[68,69]. Future research should explore the influence of multiple physical and environmental factors on the visual perception of leisure to compensate for the limitations of this study.
4.3. Limitations of research application and evaluation monitoring
Although this study applied machine learning and a genetic algorithm to calculate the parameter design range in the snow and non-snow seasons, the range was not applied in the actual design, nor was it evaluated and monitored. In future studies, machine learning and genetic algorithms will be used to optimize the light environment[70], establish a parametric VR model, and apply it to an updated design of an actual leisure scene.
5. Conclusions
5.1. Leisure environment factors
In the validation of VR through eye tracker and SD questionnaire, according to the results in Section 3.1.1, in the non-snow season, the attributes of entity elements screened by the SD questionnaire were the spatial aspect ratio, roof height difference, proportion of lawns in the vision, height of tall trees, building façade saturation, and color contrast in the vision. During the snow season, the attributes of the entity elements screened by the SD questionnaire were the spatial aspect ratio, proportion of grass in view, and saturation of the building façade. In Section 3.1.2, the eye-tracker data showed that during the leisure process, users paid the most attention to the ground, buildings, tall trees, and lawns in both the non-snow and snow seasons. In addition, through the Pearson correlation analysis in Section 3.2.1 and Section 3.2.2, it was concluded that the environmental factors affecting the visual perception of the leisure environment in the non-snow season were space aspect ratio (SAR), roof height difference (RHD), saturation of building façade (BS), tall tree height (TTH), proportion of grass in the field of view (GP), and hue contrast in the visual field (HC). The environmental factors affecting the visual perception of the leisure environment during the snow season were space aspect ratio (SAR), saturation of the building façade (BS), and proportion of grass in the field of view (GP).
5.2. VR and the actual scene
In the validation of VR through eye tracker and SD questionnaire, although VR scene perception was slightly different from the real scene, in terms of users’ gaze characteristics, the research results in Section 3.1.2 and Section 3.1.3 showed that the gaze characteristics of leisure walking between houses in the non-snow season and snow season in the VR scene were relatively close to the actual scene. Walking in a VR environment has a more realistic effect than using a joystick remote control. Similar leisure perception scores were obtained by comparing the field scenario questionnaire with the orthogonal experimental questionnaire.
In general, considering the similarities and differences in leisure perception between the VR and actual scenes in the snow and non-snow seasons, it is feasible to apply VR technology to visual research on outdoor leisure environments.
5.3. Environmental factors and leisure perception scores
The influence of factors on leisure perception in non-snow season was carried out from the data regression analysis in Section 3.2.1. In the non-snow season environment, building facade saturation (BS) and the proportion of grass in the field of view (GP) were positively correlated with the leisure perception score, whereas the spatial aspect ratio (SAR), roof height difference (RHD), height of tall trees (TTH), and color contrast in the field of view (HC) were negatively correlated with the leisure perception score. With an increase in building façade saturation (BS), the spatial aspect ratio (SAR), height of tall trees (TTH), and leisure perception score (W) showed a trend of first increasing and then decreasing. With the increase of roof height difference (RHD), the leisure perception score showed a trend of first decreasing and then increasing. When the proportion of grass in the field of view (GP) increased, leisure perception scores increased. When the hue contrast (HC) in the visual field increased, the leisure perception score decreased.
The influence of factors on leisure perception in snow season was illustrated from the data regression analysis in Section 3.2.2. It can be seen that in the snow season, building façade saturation (BS) and the proportion of grass in the field of view (GP) were positively correlated with the leisure perception score, and the spatial aspect ratio (SAR) was negatively correlated with the leisure perception score. The building façade saturation (BS), spatial aspect ratio (SAR), and leisure perception scores showed a trend of first increased and then decreased. When the proportion of grass in the field of view (GP) increased, leisure perception scores increased.
5.4. Machine learning model comparison
In Section 3.3.1, the leisure perception score prediction effects of the decision tree, SVM, KNN, and ANN are compared. The classification prediction accuracy of the KNN (87.89%) was higher than that of the decision tree (62.49%), SVM (72.61%), and ANN (82.84%). This means that the KNN classification algorithm was the best at predicting the perceived score of leisure spaces in cold regions.
5.5. Variable threshold optimization
The environmental variable threshold optimization in non-snow season was calculated in Section 3.3.2. the threshold range of visual environmental factors for leisure perception in a non-snow season environment was obtained. In the environmental design of leisure space between houses in cold regions in non-snow seasons, it was suggested that the space aspect ratio (SAR) was set from 1.82 to 2.15, the range of roof height difference (RHD) was set from 10.81 m to 20.09 m, the range of saturation (BS) of the building facade was set from 48.53 to 61.01, the range of tall tree height (TTH) was set from 14.18 m to 18.29 m, the proportion of grass in the field of view (GP) was set from 0.12 to 0.15, and the color contrast (HC) was set from 18.64 to 26.83.
The environmental variable threshold optimization in snow season was obtained in Section 3.3.2. The threshold range of the visual environmental factors for leisure perception in a snow-season environment was obtained. In the environmental design of leisure space between houses in cold areas in snow season, it was recommended that the space aspect ratio (SAR) range was set from 2.22 to 2.54, the building facade saturation (BS) range was set from 68.47 to 82.34, and the lawn proportion (GP) range was set from 0.1 to 0.14.
Funding
This research received the National Natural Science Foundation of China (Grant NO. 52378012).
Institutional Review Board Statement
Not applicable.
Informed Consent Statement
Not applicable.
Data Availability Statement
Not applicable.
Conflicts of Interest
The authors declare no conflict of interest.
References
- Zhou, B.; Huang, M.; Li, C. L.; Xu, B. Leisure constraint and mental health: The case of park users in Ningbo, China. J. Outdoor Recreat. Tour. 2022, 39, 100562. [Google Scholar] [CrossRef]
- Langlois F., Thien T.M.V., Chasse K., Dupuis G., Kergoat M.-J., Bherer L. Benefits of physical exercise training on cognition and quality of life in frail older adults. J. Gerontol. Ser. B-Psychol. Sci. Soc. Sci. 2013, 68, 400–404. [CrossRef]
- Brach J.S., Simonsick E.M., Kritchevsky S., et al. Association between physical function and lifestyle activity and exercise in health, aging, and body composition studies. J. Am. Geriatr. Soc. 2004, 52, 502–509. [CrossRef]
- Helbich M. Toward Dynamic Urban Environmental Exposure Assessments in Mental Health Research. Environ. Res. 2018, 161, 129–135. [CrossRef] [PubMed]
- Chen C., Luo W., Kang N., Li H., Yang X., Xia Y. Study on the impact of residential outdoor environments on mood in the elderly in Guangzhou, China. SUSTAINABILITY 2020, 12, 3933. [CrossRef]
- Helbich, M.; Yao, Y.; Liu, Y.; Zhang, J.; Liu, P.; Wang, R. Using deep learning to examine street-view green and blue spaces and their associations with geriatric depression in Beijing, China. Environ. Int. 2019, 126, 107–117. [Google Scholar] [CrossRef] [PubMed]
- Wang, R.; Liu, Y.; Lu, Y.; Zhang, J.; Liu, P.; Yao, Y.; Grekousis, G. Perceptions of build environment and health outcomes for older Chinese in Beijing: A big data approach with street view images and deep learning technique. Comput. Environ. URBAN Syst. 2019, 78, 101386. [Google Scholar] [CrossRef]
- Kaplan, S. The Restorative Benefits of Nature: Toward an Integrative Framework. J. Environ. Psychol. 1995, 15, 169–182. [Google Scholar] [CrossRef]
- Lindal, P.J.; Hartig, T. Architectural Variation, Building Height, and the Restorative Quality of Urban Residential Streetscapes. J. Environ. Psychol. 2013, 33, 26–36. [Google Scholar] [CrossRef]
- Calogiuri, G.; Litleskare, S.; Fagerheim, K.A.; Rydgren, T.L.; Brambilla, E.; Thurston, M. Experiencing Nature through Immersive Virtual Environments: Environmental Perceptions, Physical Engagement, and Affective Responses During a Simulated Natural Walk. Front. Psychol. 2018, 8, 2321. [Google Scholar] [CrossRef] [PubMed]
- Hutmacher, F. Why Is There So Much More Research on Vision than on Other Sensory Modalities? Front. Psychol. 2019, 10, 2246. [Google Scholar] [CrossRef] [PubMed]
- Wen, Jun, and Wonje: Effect of the preference for visual elements on the intention to reuse when designing a healing environment for welfare facilities for senior citizens: Focusing on welfare facilities for senior citizens in Seoul. 기초조형학연구 2021, 22, 337–348. [CrossRef]
- Tabrizian, P.; Baran, P.K.; Smith, W.R.; Meentemeyer, R.K. Exploring Perceived Restoration Potential of Urban Green Enclosure through Immersive Virtual Environments. J. Environ. Psychol. 2018, 55, 99–109. [Google Scholar] [CrossRef]
- Polat, A. T.; Akay, A. Relationships between the visual preferences of urban recreation area users and various landscape design elements. URBAN For. URBAN Green. 2015, 14, 573–582. [Google Scholar] [CrossRef]
- Pan, W.; Du, J. Effects of neighborhood morphological characteristics on outdoor daylight and insights for sustainable urban design. J. ASIAN Archit. Build. Eng. 2022, 21, 342–367. [Google Scholar] [CrossRef]
- Yadav, M.; Chaspari, T.; Kim, J.; Ahn, C.R. Capturing and Quantifying Emotional Distress in the Built Environment. In Proceedings of the PROCEEDINGS OF THE WORKSHOP ON HUMAN-HABITAT FOR HEALTH (H3′18): HUMAN-HABITAT MULTIMODAL INTERACTION FOR PROMOTING HEALTH AND WELL-BEING IN THE INTERNET OF THINGS ERA; Assoc Computing Machinery: New York, 2018; p. 11.
- Pei, W.; Guo, X.; Lo, T. Pre-Evaluation Method of the Experiential Architecture Based on Multidimensional Physiological Perception. J. Asian Archit. Build. Eng. 2023, 22, 1170–1194. [Google Scholar] [CrossRef]
- Leisman, G.; Moustafa, A.A.; Shafir, T. Thinking, Walking, Talking: Integratory Motor and Cognitive Brain Function. Front. PUBLIC Health 2016, 4, 94. [Google Scholar] [CrossRef] [PubMed]
- Caicedo, D.G.; Beuzekom, M.V. “HOW DO YOU FEEL?” AN ASSESSMENT OF EXISTING TOOLS FOR THE MEASUREMENT OF EMOTIONS AND THEIR APPLICATION IN CONSUMER PRODUCTS RESEARCH. 2006.
- Mauss, I.B.; Robinson, M.D. Measures of Emotion: A Review. Cogn. Emot. 2009, 23, 209–237. [Google Scholar] [CrossRef] [PubMed]
- Annemans, M.; Audenhove, C.V.; Vermolen, H.; Heylighen, A. How to Introduce Experiential User Data: The Use of Information in Architects’ Design Process. In Proceedings of the Drs; 2014.
- Rogge, E.; Nevens, F.; Gulinck, H. Perception of Rural Landscapes in Flanders: Looking beyond Aesthetics. Landsc. Urban Plan. 2007, 82, 159–174. [Google Scholar] [CrossRef]
- Zhang, Z.; Zhuo, K.; Wei, W.; Li, F.; Yin, J.; Xu, L. Emotional Responses to the Visual Patterns of Urban Streets: Evidence from Physiological and Subjective Indicators. Int. J. Environ. Res. Public. Health 2021, 18, 9677. [Google Scholar] [CrossRef] [PubMed]
- Yusoff, Y.M.; Ruthven, I.; Landoni, M. Measuring Emotion: A New Evaluation Tool for Very Young Children. In Proceedings of the COMPUTING & INFORMATICS, 4TH INTERNATIONAL CONFERENCE, 2013; Jamaludin, Z., ChePa, N., Bakar, M.S.A., Eds.; Univ Utari Malaysia-Uum: Sintok, 2013; pp. 358-+.
- Pretty, J.; Peacock, J.; Sellens, M.; Griffin, M. The Mental and Physical Health Outcomes of Green Exercise. Int. J. Environ. Health Res. 2005, 15, 319–337. [Google Scholar] [CrossRef] [PubMed]
- Ibes, D.C.; Forestell, C.A. The Role of Campus Greenspace and Meditation on College Students’ Mood Disturbance. J. Am. Coll. Health 2022, 70, 99–106. [Google Scholar] [CrossRef]
- Molanorouzi, K.; Khoo, S.; Morris, T. Validating the Physical Activity and Leisure Motivation Scale (PALMS). BMC PUBLIC Health 2014, 14, 909. [Google Scholar] [CrossRef] [PubMed]
- Neill, C.; Gerard, J.; Arbuthnot, K.D. Nature Contact and Mood Benefits: Contact Duration and Mood Type. J. Posit. Psychol. 2019, 14, 756–767. [Google Scholar] [CrossRef]
- Costall, A.P. Are Theories of Perception Necessary? A Review of Gibson’s The Ecological Approach to Visual Perception. J. Exp. Anal. Behav. 1984, 41, 109–115. [Google Scholar] [CrossRef] [PubMed]
- Li, C.; Du, C.; Ge, S.; Tong, T. An Eye-Tracking Study on Visual Perception of Vegetation Permeability in Virtual Reality Forest Exposure. Front. PUBLIC Health 2023, 11, 1089423. [Google Scholar] [CrossRef] [PubMed]
- Cui, W.; Li, Z.; Xuan, X.; Li, Q.; Shi, L.; Sun, X.; Zhu, K.; Shi, Y. Influence of Hospital Outdoor Rest Space on the Eye Movement Measures and Self-Rating Restoration of Staff. Front. PUBLIC Health 2022, 10, 855857. [Google Scholar] [CrossRef] [PubMed]
- Lisinska-Kusnierz, M.; Krupa, M. Suitability of Eye Tracking in Assessing the Visual Perception of Architecture-A Case Study Concerning Selected Projects Located in Cologne. BUILDINGS 2020, 10, 20. [Google Scholar] [CrossRef]
- Birenboim, A.; Dijst, M.; Ettema, D.; de Kruijf, J.; de Leeuw, G.; Dogterom, N. The Utilization of Immersive Virtual Environments for the Investigation of Environmental Preferences. Landsc. URBAN Plan. 2019, 189, 129–138. [Google Scholar] [CrossRef]
- Johnson, A.; Thompson, E.M.; Coventry, K.R. Human Perception, Virtual Reality and the Built Environment. In Proceedings of the 2010 14th International Conference Information Visualisation; July 2010; pp. 604–609.
- Luo, S.; Shi, J.; Lu, T.; Furuya, K. Sit down and Rest: Use of Virtual Reality to Evaluate Preferences and Mental Restoration in Urban Park Pavilions. Landsc. URBAN Plan. 2022, 220, 104336. [Google Scholar] [CrossRef]
- Deng, Z.; Zhu, X.; Cheng, D.; Zong, M.; Zhang, S. Efficient kNN Classification Algorithm for Big Data. Neurocomputing 2016, 195, 143–148. [Google Scholar] [CrossRef]
- Zhang, D.; Li, D.; Zhou, L.; Wu, J. Fine Classification of UAV Urban Nighttime Light Images Based on Object-Oriented Approach. Sensors 2023, 23, 2180. [Google Scholar] [CrossRef] [PubMed]
- Hong, G.; Choi, G.-S.; Eum, J.-Y.; Lee, H.S.; Kim, D.D. The Hourly Energy Consumption Prediction by KNN for Buildings in Community Buildings. Buildings 2022, 12, 1636. [Google Scholar] [CrossRef]
- Xiong, L.; Yao, Y. Study on an Adaptive Thermal Comfort Model with K-Nearest-Neighbors (KNN) Algorithm. Build. Environ. 2021, 202, 108026. [Google Scholar] [CrossRef]
- Tsalera, E.; Papadakis, A.; Samarakou, M. Monitoring, Profiling and Classification of Urban Environmental Noise Using Sound Characteristics and the KNN Algorithm. Energy Rep. 2020, 6, 223–230. [Google Scholar] [CrossRef]
- Zhang, Y.; Yang, G. Optimization of the Virtual Scene Layout Based on the Optimal 3D Viewpoint. IEEE ACCESS 2022, 10, 110426–110443. [Google Scholar] [CrossRef]
- Awada, M.; Srour, I. A Genetic Algorithm Based Framework to Model the Relationship between Building Renovation Decisions and Occupants’ Satisfaction with Indoor Environmental Quality. Build. Environ. 2018, 146, 247–257. [Google Scholar] [CrossRef]
- Estacio, I.; Hadfi, R.; Blanco, A.; Ito, T.; Babaan, J. Optimization of Tree Positioning to Maximize Walking in Urban Outdoor Spaces: A Modeling and Simulation Framework. Sustain. CITIES Soc. 2022, 86, 104105. [Google Scholar] [CrossRef]
- Sundet, J.M. Effects of Colour on Perceived Depth: Review of Experiments and Evalutaion of Theories. Scand. J. Psychol. 1978, 19, 133–143. [Google Scholar] [CrossRef] [PubMed]
- Niehorster, D.C.; Hessels, R.S.; Benjamins, J.S. GlassesViewer: Open-Source Software for Viewing and Analyzing Data from the Tobii Pro Glasses 2 Eye Tracker. Behav. Res. Methods 2020, 52, 1244–1253. [Google Scholar] [CrossRef] [PubMed]
- Zhang, R. Integrating Ergonomics Data and Emotional Scale to Analyze People’s Emotional Attachment to Different Landscape Features in the Wudaokou Urban Park. Front. Archit. Res. 2023, 12, 175–187. [Google Scholar] [CrossRef]
- Ashihara, Y. EXTERIOR Design in Architecture. Van Nostrand Reinhold 1981. [Google Scholar]
- Lu, M.; Song, D.; Shi, D.; Liu, J.; Wang, L. Effect of High-Rise Residential Building Layout on the Spatial Vertical Wind Environment in Harbin, China. Buildings 2022, 12, 705. [Google Scholar] [CrossRef]
- Li, X.; Zhang, C.; Li, W.; Ricard, R.; Meng, Q.; Zhang, W. Assessing Street-Level Urban Greenery Using Google Street View and a Modified Green View Index. Urban For. Urban Green. 2015, 14, 675–685. [Google Scholar] [CrossRef]
- Jiang, B.; Chang, C.-Y.; Sullivan, W.C. A Dose of Nature: Tree Cover, Stress Reduction, and Gender Differences. Landsc. Urban Plan. 2014, 132, 26–36. [Google Scholar] [CrossRef]
- Zhang, X.; Constable, M.; Chan, K.L.; Yu, J.; Junyan, W. Defining Hue Contrast. In Computational Approaches in the Transfer of Aesthetic Values from Paintings to Photographs: Beyond Red, Green and Blue; Zhang, X., Constable, M., Chan, K.L., Yu, J., Junyan, W., Eds.; Springer: Singapore, 2018; pp. 179–189. ISBN 978-981-10-3561-6. [Google Scholar]
- Rokach, L. Decision Forest: Twenty Years of Research. Inf. Fusion 2016, 27, 111–125. [Google Scholar] [CrossRef]
- Ding, S.; Zhu, Z.; Zhang, X. An Overview on Semi-Supervised Support Vector Machine. Neural Comput. Appl. 2017, 28, 969–978. [Google Scholar] [CrossRef]
- Huang, Y.; Ye, B.; Liu, T. Research on an Aging-Friendly Design of Urban Park Landscape Based on Computer Virtual Simulation Technology. Wirel. Commun. Mob. Comput. 2022, 2022, 1–11. [Google Scholar] [CrossRef]
- Li, Y.; Yabuki, N.; Fukuda, T. Measuring Visual Walkability Perception Using Panoramic Street View Images, Virtual Reality, and Deep Learning. Sustain. Cities Soc. 2022, 86, 104140. [Google Scholar] [CrossRef]
- Santos, I.; Castro, L.; Rodriguez-Fernandez, N.; Torrente-Patiño, Á.; Carballal, A. Artificial Neural Networks and Deep Learning in the Visual Arts: A Review. Neural Comput. Appl. 2021, 33, 121–157. [Google Scholar] [CrossRef]
- Ma, G.; Pan, X. Research on a Visual Comfort Model Based on Individual Preference in China through Machine Learning Algorithm. Sustainability 2021, 13, 7602. [Google Scholar] [CrossRef]
- Katoch, S.; Chauhan, S.S.; Kumar, V. A Review on Genetic Algorithm: Past, Present, and Future. Multimed. Tools Appl. 2021, 80, 8091–8126. [Google Scholar] [CrossRef] [PubMed]
- Ting, C.K. On the Mean Convergence Time of Multi-Parent Genetic Algorithms Without Selection. Springer Berl. Heidelb. 2005. [Google Scholar] [CrossRef]
- Lobaccaro, G.; Wiberg, A.H.; Ceci, G.; Manni, M.; Lolli, N.; Berardi, U. Parametric Design to Minimize the Embodied GHG Emissions in a ZEB. Energy Build. 2018, 167, 106–123. [Google Scholar] [CrossRef]
- Ilbeigi, M.; Ghomeishi, M.; Dehghanbanadaki, A. Prediction and Optimization of Energy Consumption in an Office Building Using Artificial Neural Network and a Genetic Algorithm. Sustain. Cities Soc. 2020, 61, 102325. [Google Scholar] [CrossRef]
- Harte, J.L.; Eifert, G.H. The Effects of Running, Environment, and Attentional Focus on Athletes’ Catecholamine and Cortisol Levels and Mood. Psychophysiology 1995, 32, 49–54. [Google Scholar] [CrossRef] [PubMed]
- Shi, L.; Zhang, Y.; Wang, Z.; Cheng, X.; Yan, H. Luminance Parameter Thresholds for User Visual Comfort under Daylight Conditions from Subjective Responses and Physiological Measurements in a Gymnasium. Build. Environ. 2021, 205, 108187. [Google Scholar] [CrossRef]
- Shi, L.; Qiu, J.; Zhang, R.; Li, Y.; Yang, Z.; Qi, X.; Tao, L.; Li, S.; Liu, W. An Intelligent Optimization Method of Exercisers’ Visual Comfort Assessment in Gymnasium. J. Build. Eng. 2023, 76, 107135. [Google Scholar] [CrossRef]
- Du, M.; Hong, B.; Gu, C.; Li, Y.; Wang, Y. Multiple Effects of Visual-Acoustic-Thermal Perceptions on the Overall Comfort of Elderly Adults in Residential Outdoor Environments. Energy Build. 2023, 283, 112813. [Google Scholar] [CrossRef]
- Ge, M.; Huang, Y.; Zhu, Y.; Kim, M.; Cui, X. Examining the Microclimate Pattern and Related Spatial Perception of the Urban Stormwater Management Landscape: The Case of Rain Gardens. Atmosphere 2023, 14, 1138. [Google Scholar] [CrossRef]
- Johansson, M.; Pedersen, E.; Maleetipwan-Mattsson, P.; Kuhn, L.; Laike, T. Perceived Outdoor Lighting Quality (POLQ): A Lighting Assessment Tool. J. Environ. Psychol. 2014, 39, 14–21. [Google Scholar] [CrossRef]
- Lyu, K.; Brambilla, A.; Globa, A.; de Dear, R. An Immersive Multisensory Virtual Reality Approach to the Study of Human-Built Environment Interactions. Autom. Constr. 2023, 150, 104836. [Google Scholar] [CrossRef]
- Eloy, S.; Andrade, M.; Dias, L.; Dias, M.S. The Impact of Sound in People’s Behaviour in Outdoor Settings: A Study Using Virtual Reality and Eye-Tracking. Appl. Ergon. 2023, 108, 103957. [Google Scholar] [CrossRef] [PubMed]
- Ayoub, M. A Review on Machine Learning Algorithms to Predict Daylighting inside Buildings. Sol. Energy 2020, 202, 249–275. [Google Scholar] [CrossRef]
Figure 1.
Workflow of the experiment and optimization procedure.
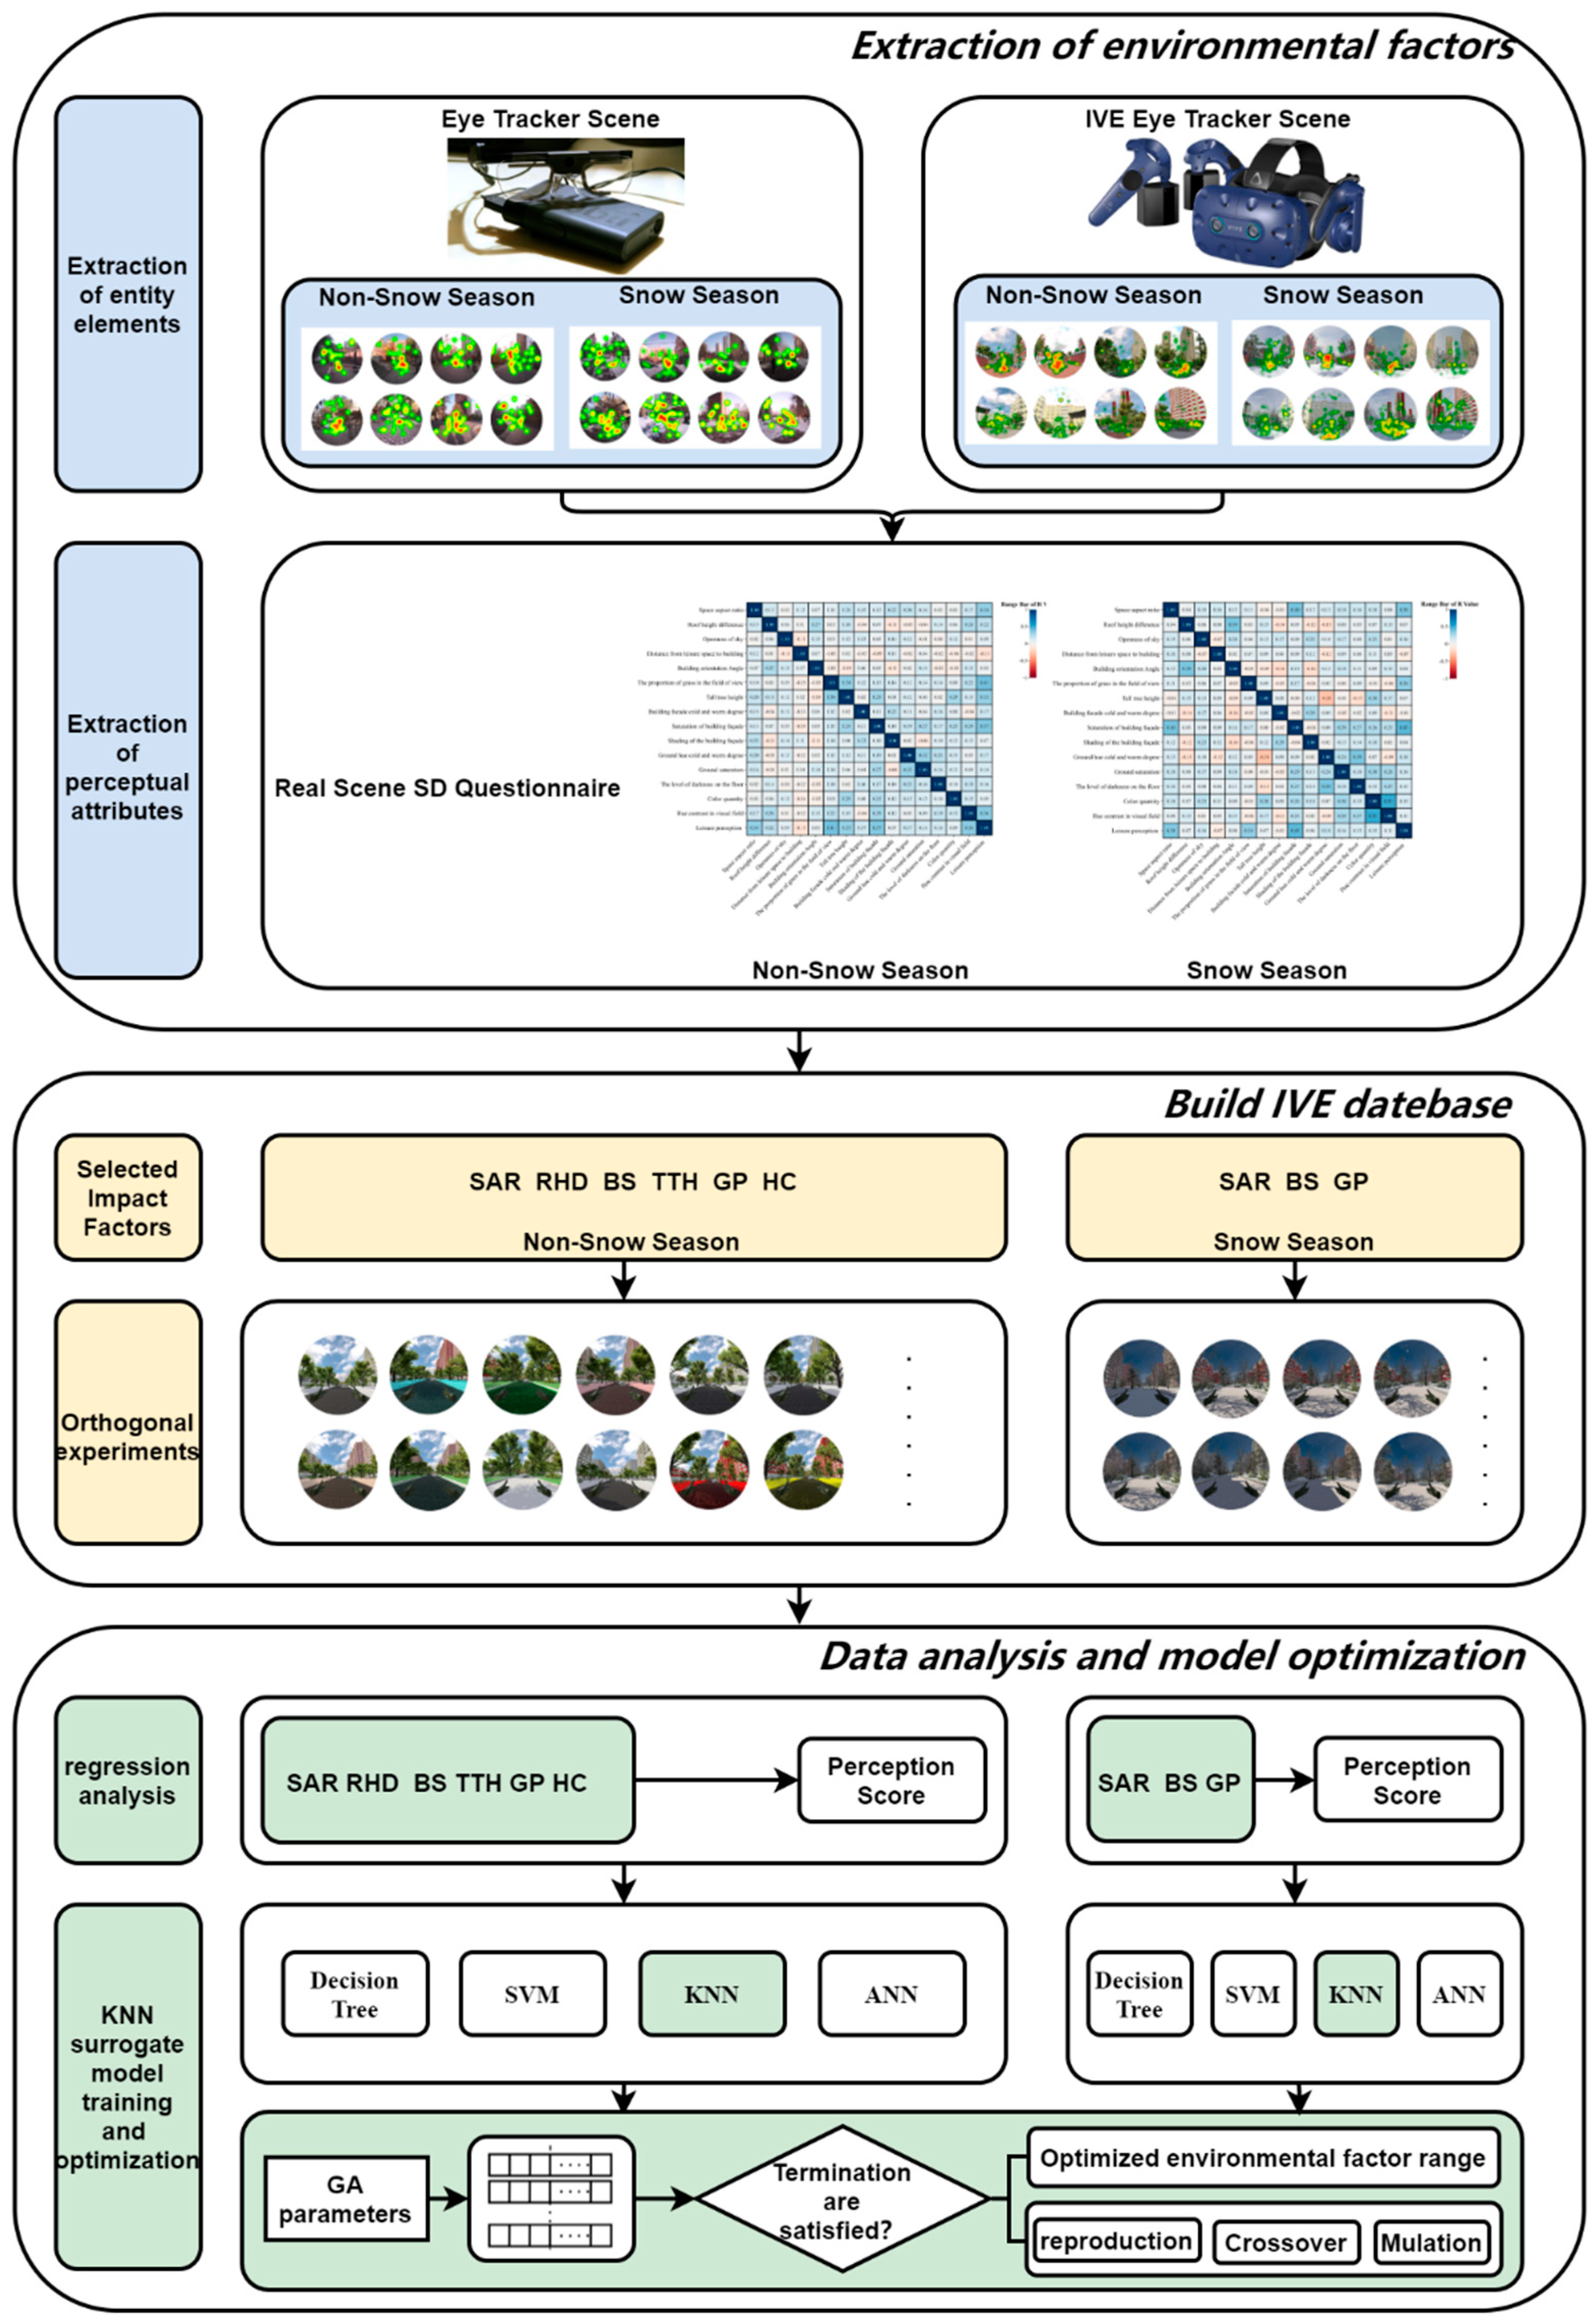
Figure 2.
Eye tracking experience process.
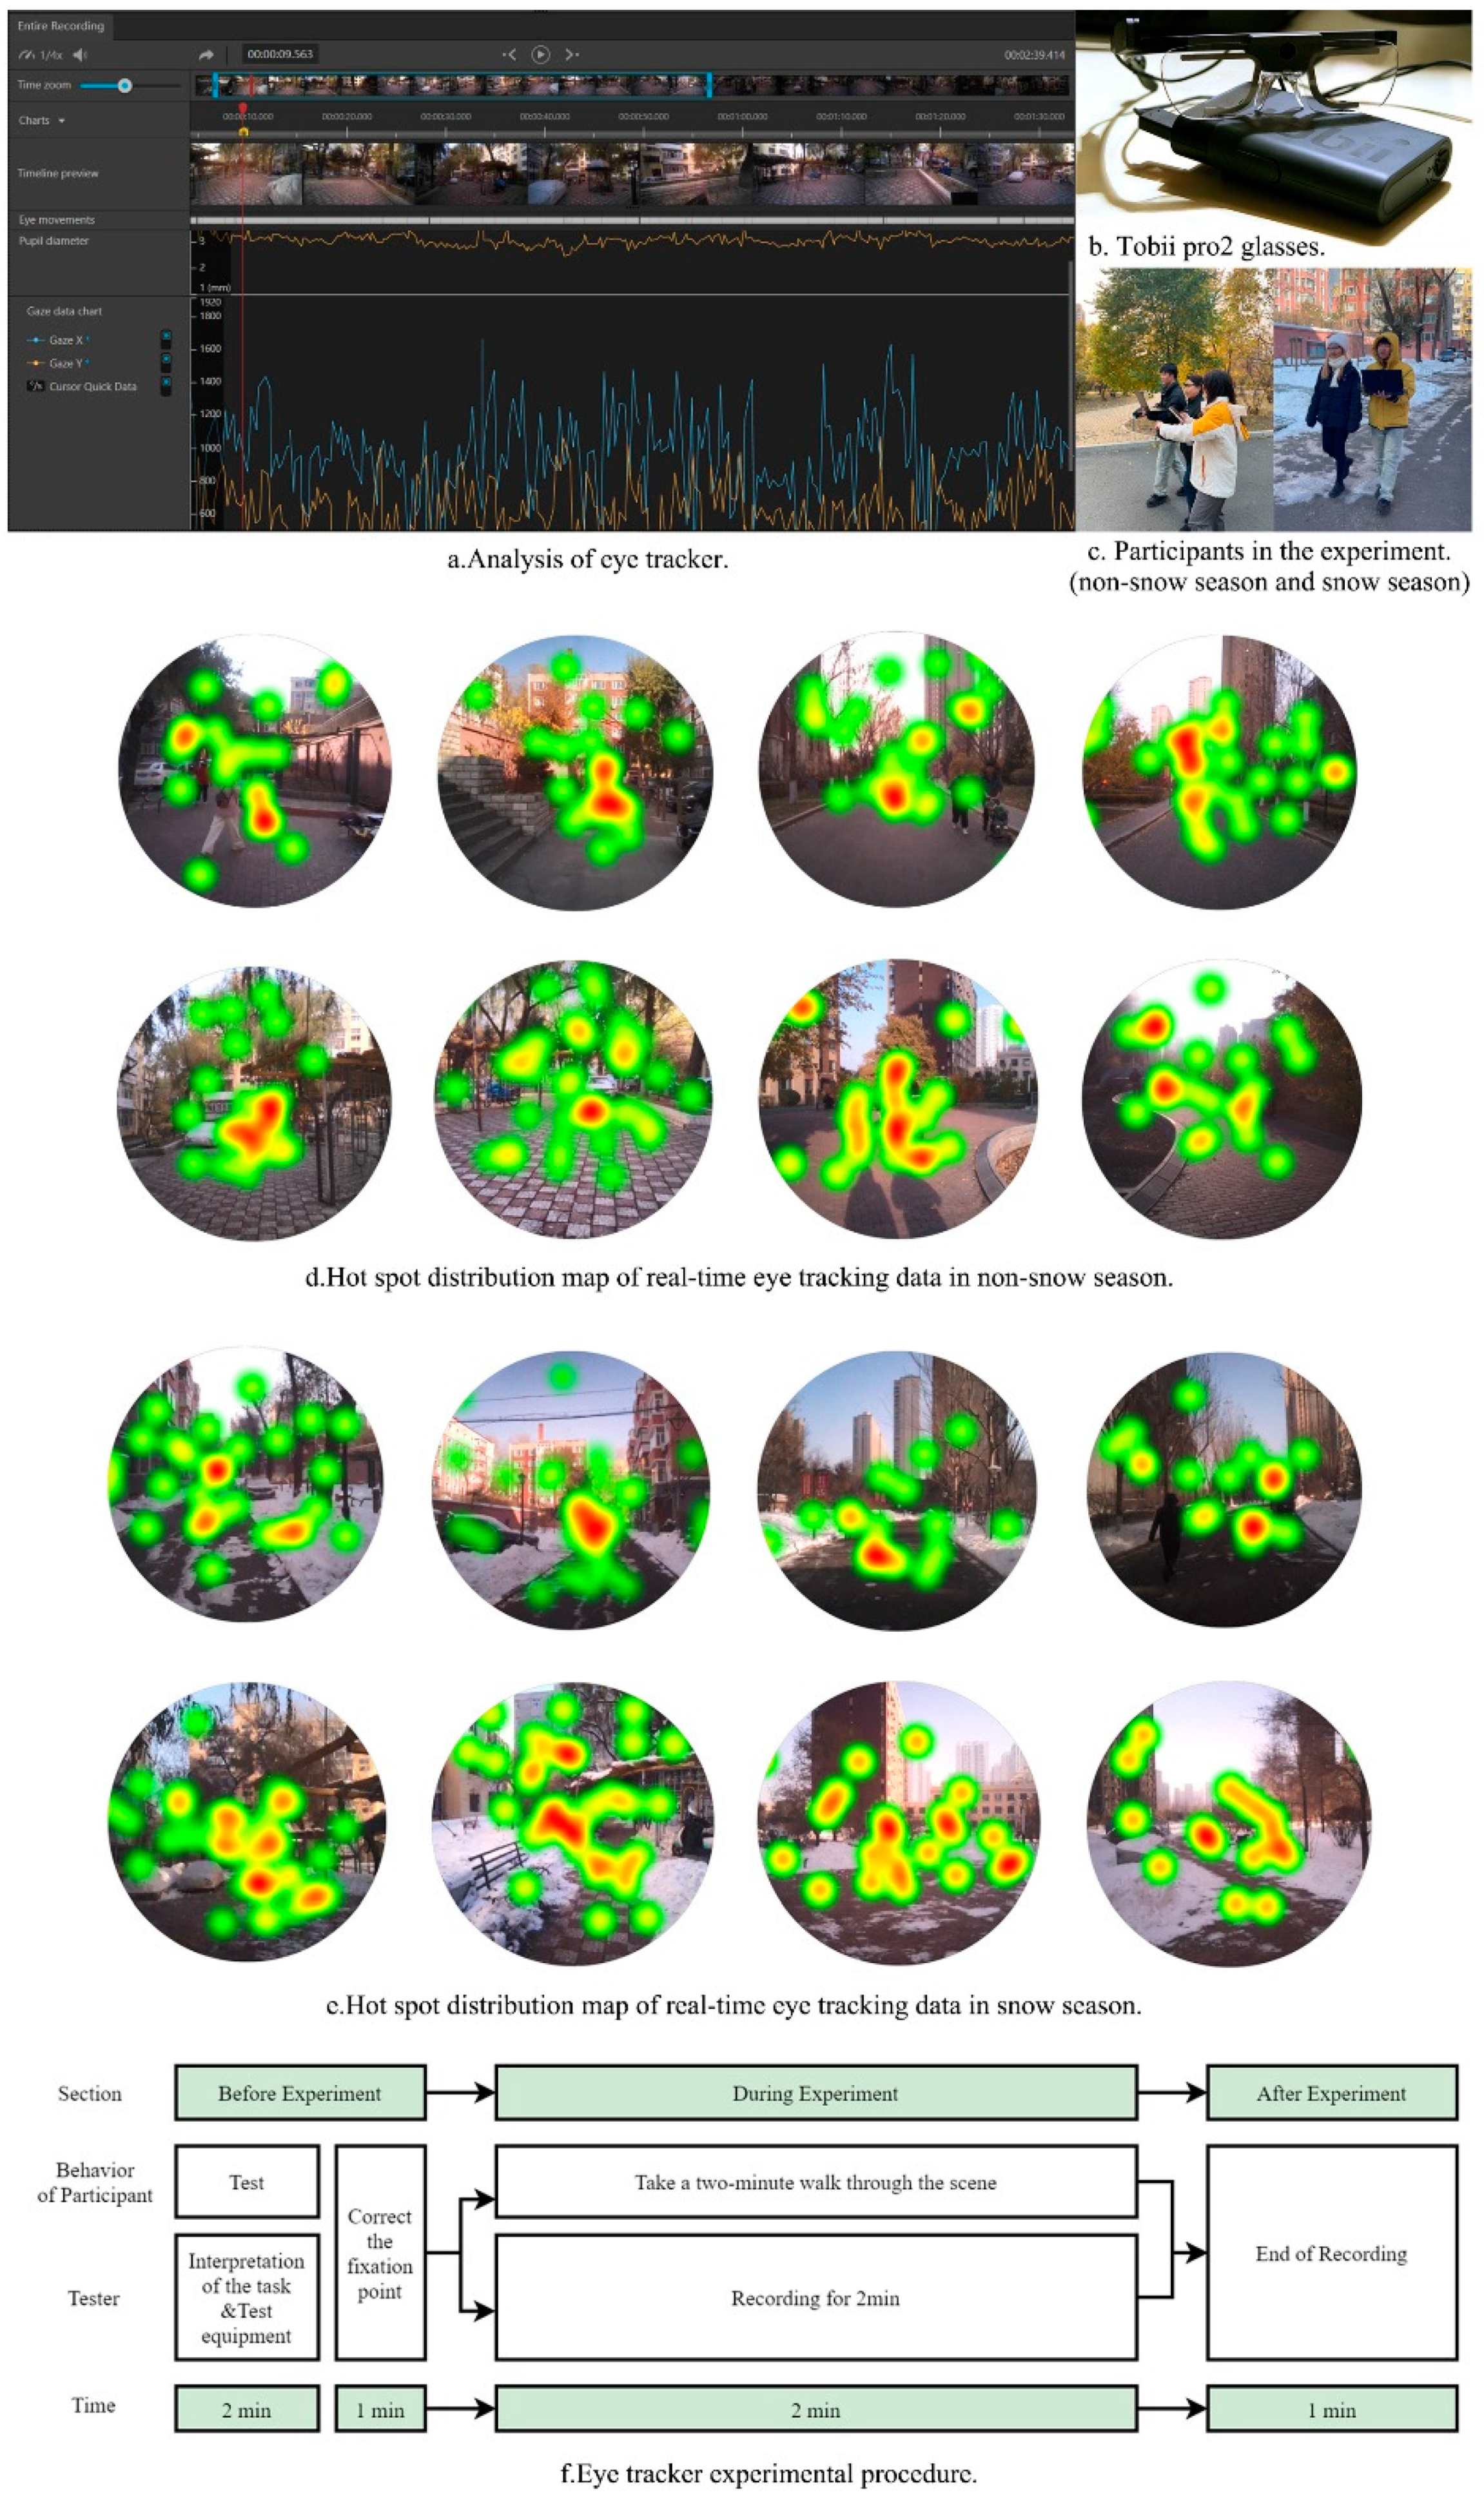
Figure 3.
Process of VR eye tracking experiment.
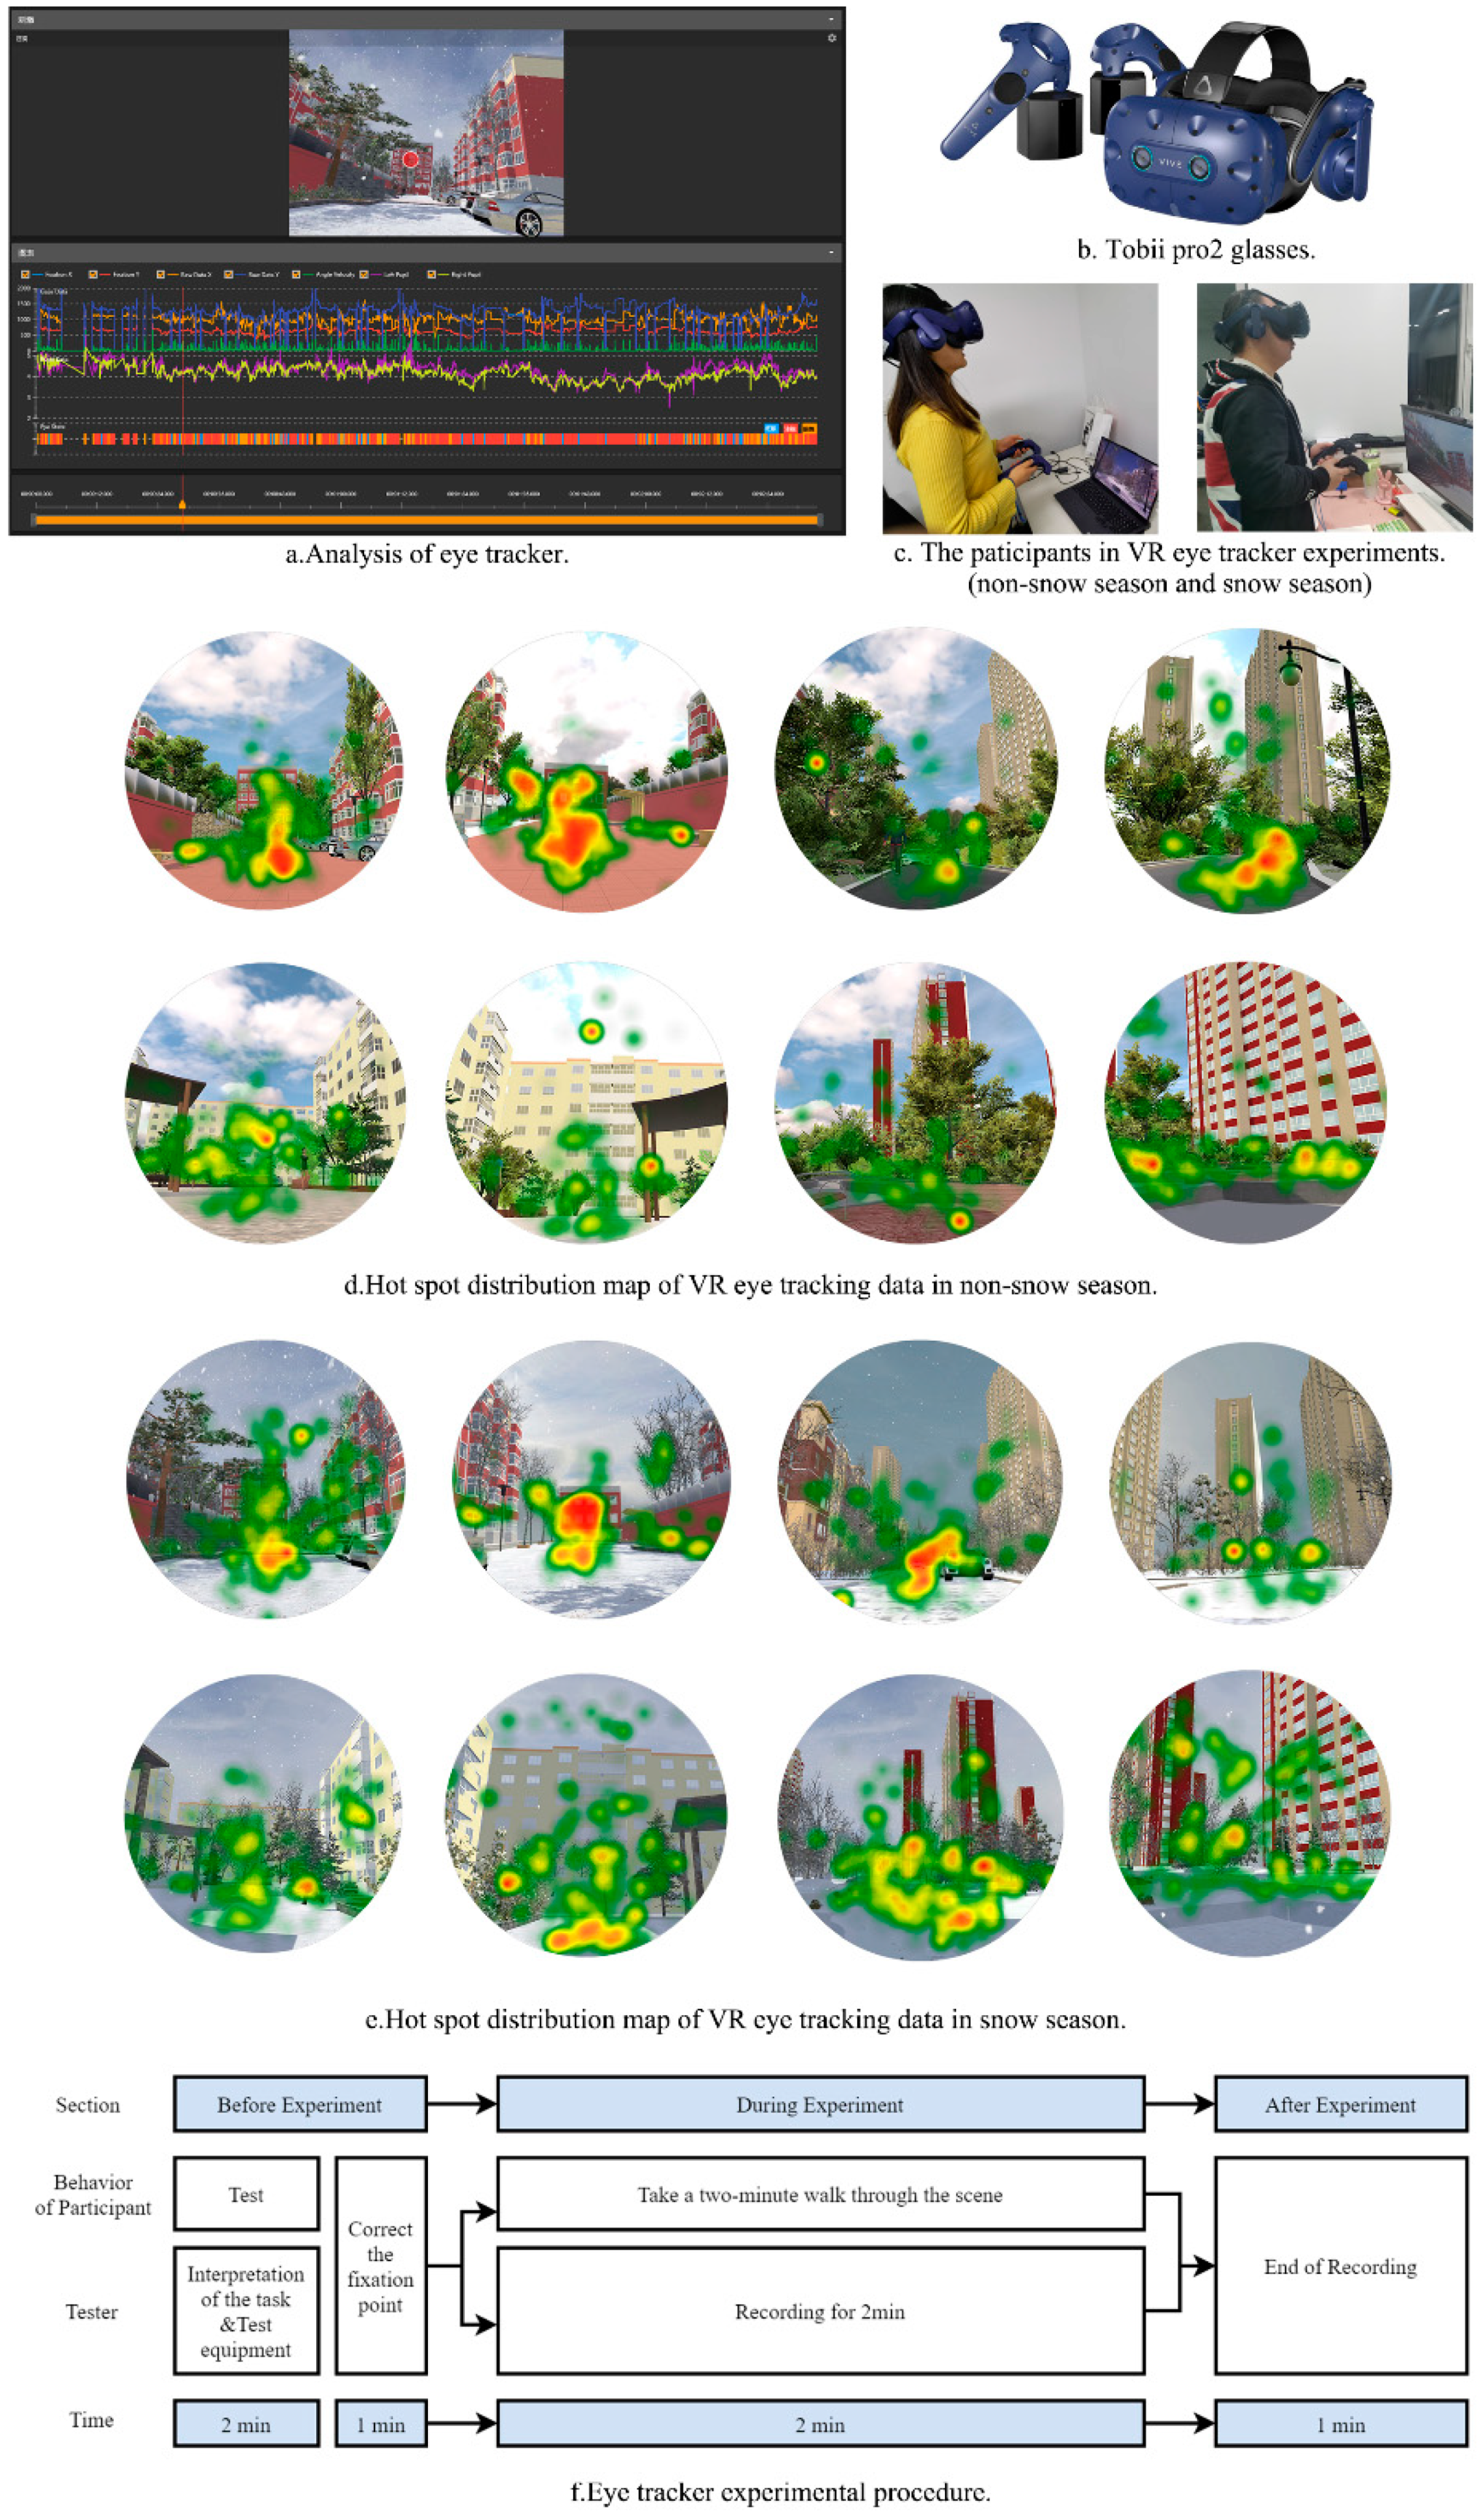
Figure 17.
Optimization effect of genetic algorithm.
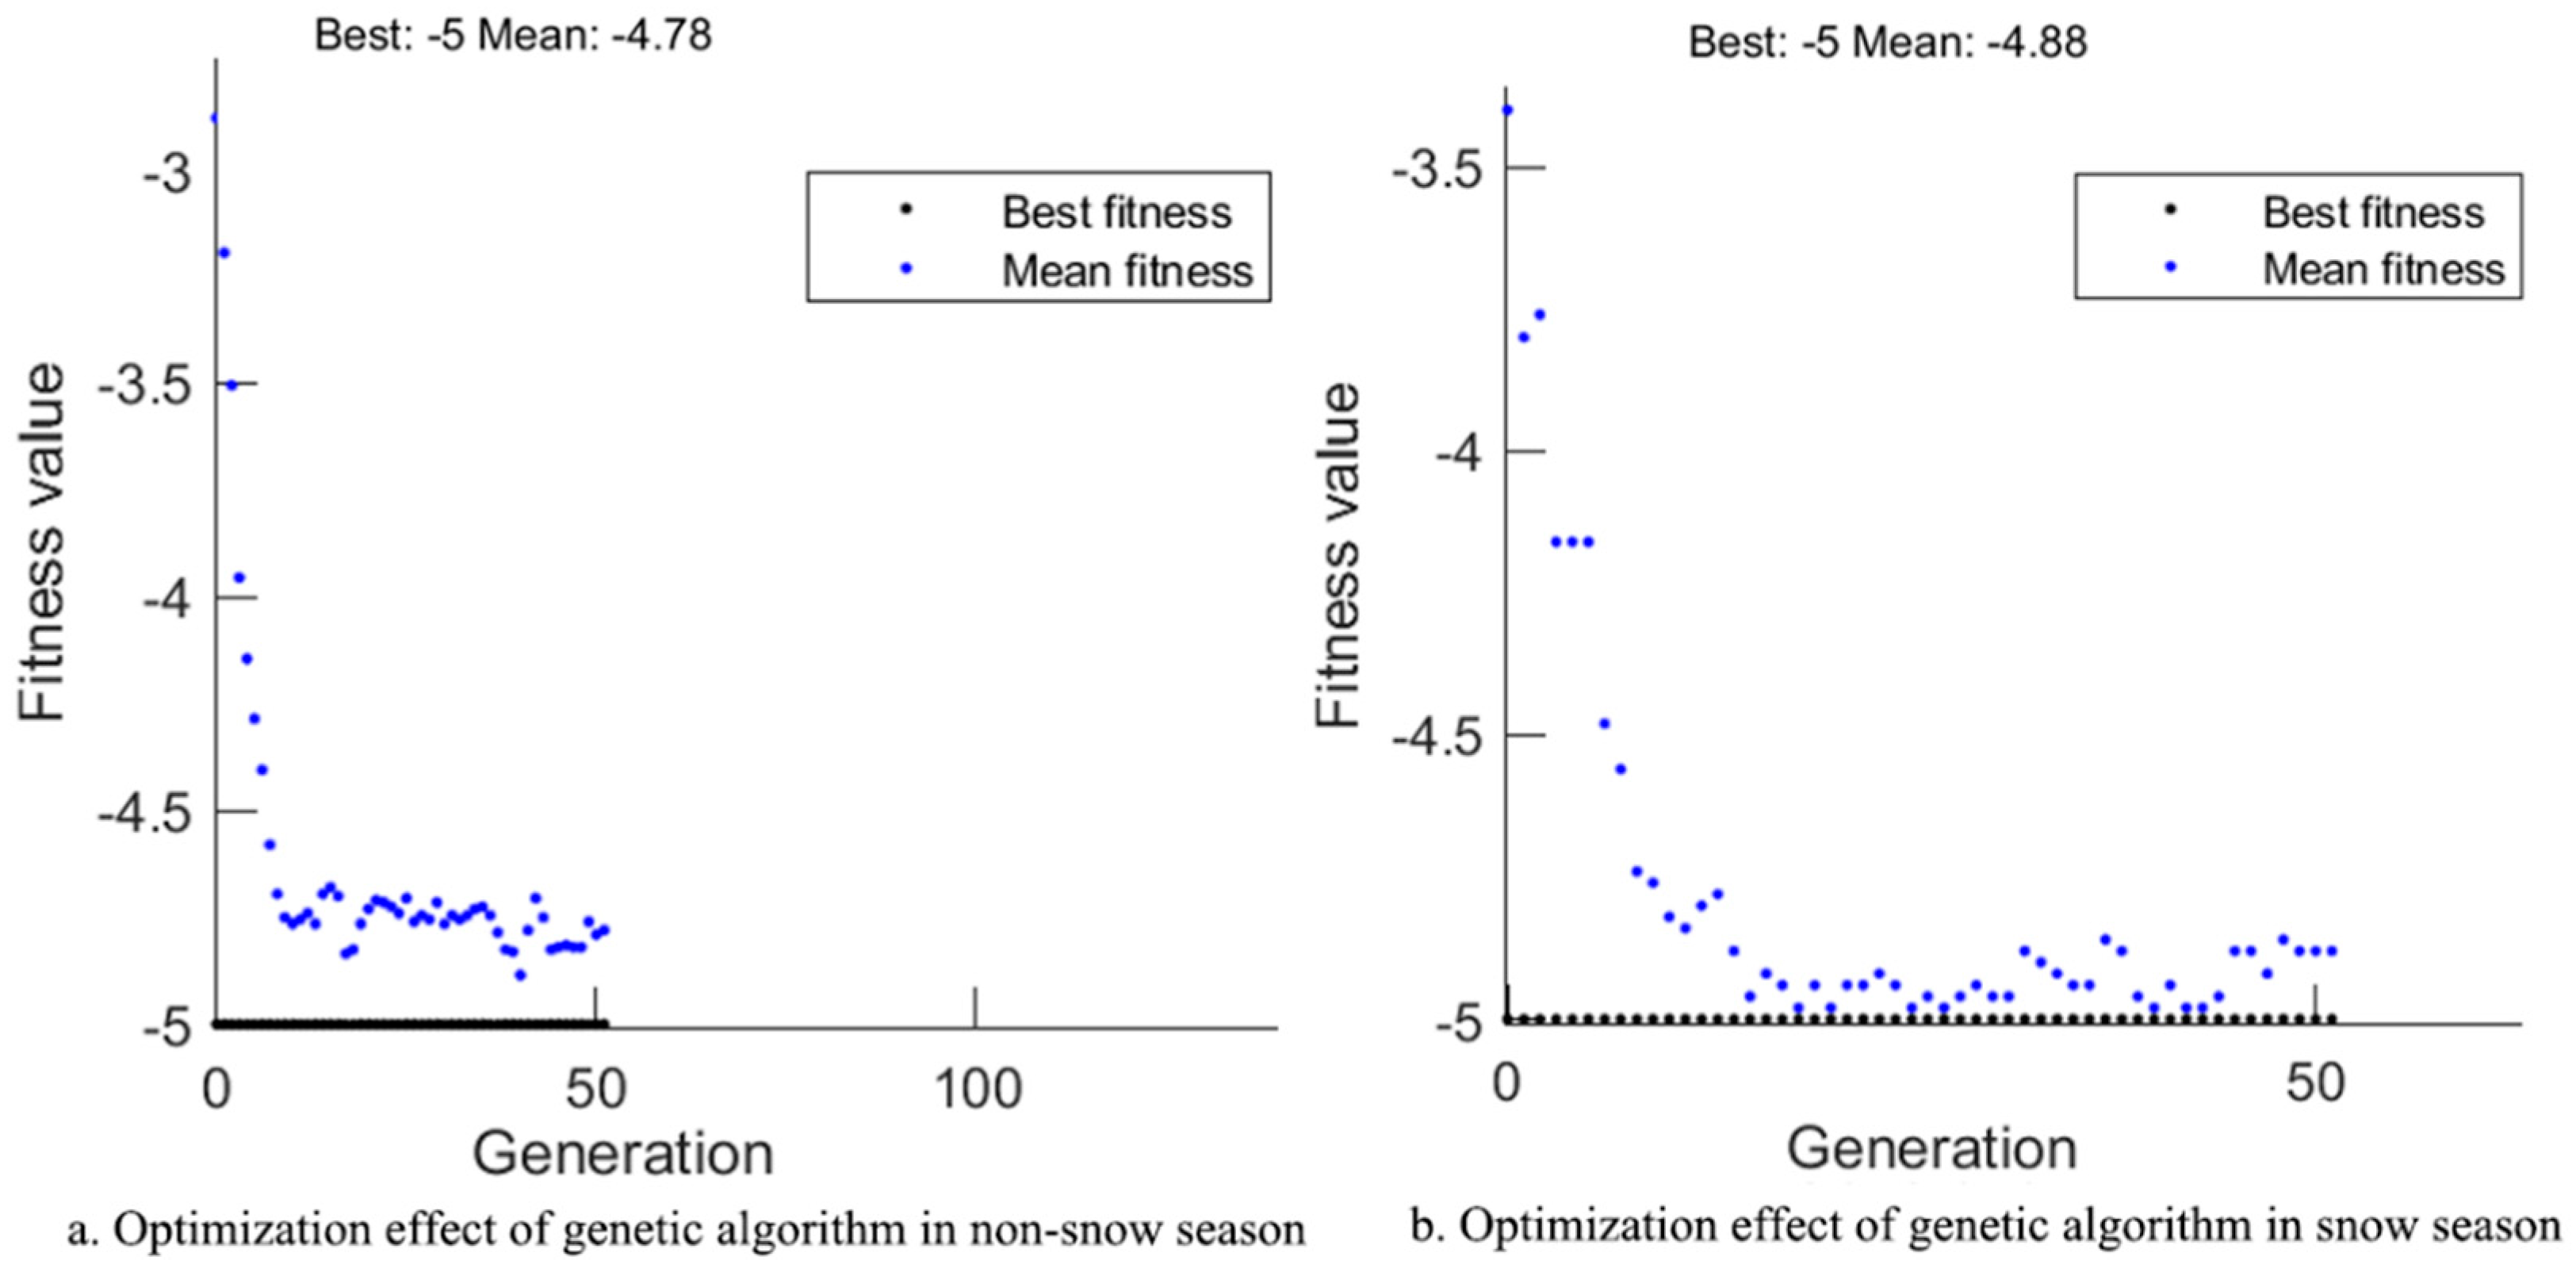

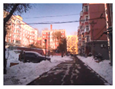
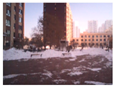
Table 1.
Leisure space in survey.
| Case | A | B | C | D |
| Year of construction | 1990 | 2000 | 2013 | 2016 |
| Floor area ratio | 2.5 | 2.1 | 2.1 | 2.5 |
| Greening rate | 24% | 20% | 30% | 30% |
| Live photos(non-snow season) |  |
 |
 |
 |
| Live photos(snow season) | 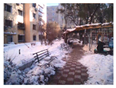 |
 |
 |
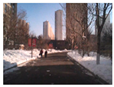 |
Table 2.
Adjective pairs in SD questionnaire.
| Number | Factor of neutrality | Adjective pairs |
|---|---|---|
| 1 | Space aspect ratio | Narrow-Wide |
| 2 | Roof height difference | Low-High |
| 3 | Openness of sky | Small-Big |
| 4 | Distance from leisure space to building | Near-Far |
| 5 | Building orientation Angle | Low-High |
| 6 | The proportion of grass in the field of view | Low-High |
| 7 | The height of tall trees | Low-High |
| 8 | Color of buildings-H | Cold-Warm |
| 9 | Color of buildings-S | High-Low |
| 10 | Color of buildings-V | Brightness-Darkness |
| 11 | Color of ground-H | Cold-Warm |
| 12 | Color of ground-S | High-Low |
| 13 | Color of ground-V | Brightness-Darkness |
| 14 | Color quantity | Less - more |
| 15 | Hue contrast in visual field | Low-High |
 | ||
Table 3.
Orthogonal experimental parameters in the non-snow season.
| Environmental factors | Orthogonal experimental parameters in the snow season |
|---|---|
| Space aspect ratio (SAR) | 1.2, 1.5, 1.8, 2.1, 2.4, 2.7, and 3 |
| Saturation of building (BS) | 0, 20, 40, 60, 80, and 100 |
| The proportion of grass in the field of view (GP) | 0, 3%, 6%, 9%, 12%, and 16% |
Table 4.
Orthogonal experimental parameters in the snow season.
| Environmental factors | Orthogonal experimental parameters in the non-snow season |
|---|---|
| Space aspect ratio (SAR) | 1.2, 1.5, 1.8, 2.1, 2.4, 2.7, and 3 |
| Roof height difference (RHD) | 0 m, 12 m, 24 m, 36 m, 48 m, 60 m, and 72 m |
| Saturation of building (BS) | 0, 20, 40, 60, 80, and 100 |
| Tall tree height (TTH) | 6 m, 10 m, 14 m, 18 m, 22 m, 26 m, and 30 m |
| The proportion of grass in the field of view (GP) | 0, 3%, 6%, 9%, 12%, and 16% |
| Hue contrast in visual field (HC) | 0, 30°, 60°, 90°, 120°, 150°, and 180° |
Table 5.
Optimized thresholds of non-snow environmental factors by GA.
| Solution set 1 | Solution set 2 | Solution set 3 | Solution set 4 | … | Solution set 30 | Range | |
| SAR | 1.8795 | 1.9057 | 1.821 | 1.9776 | … | 2.1485 | 1.82-2.15 |
| RHD(m) | 15.094 | 10.8099 | 15.9183 | 18.1143 | … | 20.093 | 10.81-20.09 |
| BS | 58.2669 | 60.2785 | 48.5304 | 52.8396 | … | 61.0109 | 48.53-61.01 |
| TTH(m) | 17.5717 | 16.7644 | 14.3164 | 17.3361 | … | 18.2912 | 14.18-18.29 |
| GP(%) | 0.125 | 0.1369 | 0.1185 | 0.146 | … | 0.154 | 0.12-0.15 |
| HC | 19.9477 | 18.6411 | 20.6017 | 25.8764 | … | 26.8322 | 18.64-26.83 |
| W(Predict) | 5 (4.90) | 5 (4.70) | 5 (4.85) | 5 (4.96) | … | 5 (4.84) | 5 (4.70 - 5.0) |
Table 6.
Optimized thresholds of snow environmental factors by GA.
| Solution set 1 | Solution set 2 | Solution set 3 | Solution set 4 | … | Solution set 30 | Range | |
| SAR | 2.2234 | 2.4057 | 2.5211 | 2.3716 | … | 2.5425 | 2.22-2.54 |
| BS | 68.5324 | 70.8215 | 78.5304 | 72.8396 | … | 82.3412 | 68.53-82.34 |
| GP(%) | 0.104 | 0.139 | 0.115 | 0.136 | … | 0.144 | 0.1-0.14 |
| W(Predict) | 5 (4.76) | 5 (4.80) | 5 (4.90) | 5 (4.67) | … | 5 (4.84) | 5 (4.67 - 4.90) |
Disclaimer/Publisher’s Note: The statements, opinions and data contained in all publications are solely those of the individual author(s) and contributor(s) and not of MDPI and/or the editor(s). MDPI and/or the editor(s) disclaim responsibility for any injury to people or property resulting from any ideas, methods, instructions or products referred to in the content. |
© 2023 by the authors. Licensee MDPI, Basel, Switzerland. This article is an open access article distributed under the terms and conditions of the Creative Commons Attribution (CC BY) license (http://creativecommons.org/licenses/by/4.0/).
Copyright: This open access article is published under a Creative Commons CC BY 4.0 license, which permit the free download, distribution, and reuse, provided that the author and preprint are cited in any reuse.


