Submitted:
21 December 2023
Posted:
26 December 2023
You are already at the latest version
Abstract
This study concerns in to collect, via a systematic review, works from international academics that employed bicycles to collect primary data on environmental variables for research on microclimatic thermal problems in urban contexts. To that purpose, a systematic review was con-ducted employing several important processes that favor the collecting of relevant material from three well-regarded worldwide academic platforms using well-defined keywords. A selection of papers identified through the platforms was produced, and after reading the titles, abstracts, and entire works, 13 articles were collected that employed bicycles in their mobile transects between 2011 and 2023. The analytical methodologies connected to the thermal environment employed by the research, such as the primary characterizers of urban morphology, were visible from this. The systematic review showed effective in attempting to comprehend current research in the scientific community that employed the approach of mobile measurements using bicycles. The great bulk of work was done in the Northern Hemisphere, specifically on the European continent. Furthermore, it was discovered that the number of publications published using this approach has increased in the previous two years. It is worth emphasizing that, while the platforms offer outstanding results in terms of article discovery, we are nevertheless aware of additional publications that employed similar technique but did not appear in the platforms' results. More study utilizing the bicycle is anticipated for, so that the process may be improved and the precision of future results can be reached.
Keywords:
Systematic Review
; Mobile Measurements
; Bicycle
; Urban Climate
; Microclimate
1. Introduction
The rapid expansion of urban areas has induced substantial alterations in the environmental landscape, marked by a decline in green spaces juxtaposed with an upsurge in built structures. This confluence of urban form and function has intricated interplays with the atmosphere, often stemming from inadvertent human activities. Consequently, the resultant microclimatic ramifications arising from this nexus continue to pose a challenge [1]. Living organisms, responding to atmospheric vagaries, undergo transformations that reciprocally impact the environment itself [2].
The quest for open spaces within urbanized settings has become conspicuously apparent, propelling research endeavors investigating the thermal dynamics within cities’ constructed areas. This surge in studies underpins the burgeoning field of human bioclimatology [1,3], notably due to the heightened impact of climate change experienced within urban centers, marked by extreme meteorological events and abrupt temperature fluctuations [4]. Hence, the development of precise and effective methodologies for meteorological observations in outdoor urban environments becomes imperative [5].
Fixed weather stations stationed at specific urban points may exhibit limitations in comprehensively delineating microclimate conditions, owing to constraints such as accuracy, time, and cost. Consequently, they serve as adjuncts providing supporting references for research [6,7], corroborated by [5] and [8]. In this context, measurements of atmospheric variables via mobile traverses, whether on foot or using vehicles (bicycles, motorcycles, or cars), offer a more nuanced portrayal of the built environment than official stations, especially when conducted via bicycles [9].
It is pertinent to note that recent scholarly research has showcased the efficacy of mobile measurements using bicycles in comprehending urban microclimates, albeit this method remains relatively underutilized. Its simplicity of application and low maintenance costs present promising avenues, although the technology’s widespread implementation remains limited. Nonetheless, it has already exhibited success in discerning climatic variations in diverse urban morphologies [6]. Such studies hold the potential to unravel intricate temperature patterns within microclimates, encompassing aspects of thermal comfort, heat islands, and cool zones.
In investigations delving into the urban thermal environment, a profound grasp of urban morphology assumes paramount importance in understanding how specific environmental qualities elicit varied human responses across different times of the day and seasons [10]. The academic landscape has introduced methodologies such as Local Climate Zones (LCZ), Sky View Factor (SVF), and surface temperature maps, facilitating this understanding [6,11,12,13,14].
In pursuit of innovative methodologies for deciphering the urban thermal landscape, the Systematic Review stands out as a research tool distinct from conventional methods, consolidating and disseminating scientific findings that enrich the repository of knowledge. Serving as a comprehensive platform for consolidating insights, the systematic review aids in refining and advancing specific approaches [15,16].
Given the demonstrated efficiency of mobile measurement methodologies in research and their underutilization in gathering environmental data within urban settings, this work aims to conduct a systematic review aggregating research in the urban thermal environment. Such an endeavor seeks to foster the popularization and refinement of this methodological approach through a comprehensive synthesis of existing knowledge.
2. Materials and Methods
The systematic review occurs in several stages, but it is up to each author to select the criteria that best reflect their study. Such procedures elevate this study to the same level as the research it reviews [15].
There are four critical stages for a systematic review construction [15]: (1) strict eligibility criteria define the population, or "universe," of studies about which the review aims to generalize; (2) a representative sample of this universe is retrieved from the literature via a logical search strategy; (3) essential information from each eligible item is extracted, coded, and combined into statistical outcome measures; and (4) the methods, results, and theoretical implications of the analysis are reported and discussed.
Following the same rationale, [17], list seven critical measures used throughout this systematic study. They are as follows: 1 - Question formulation, 2 - Study location and selection, 3 - Study critical assessment, 4 - Data collection, 5 - Data analysis and presentation, 6 - Data interpretation, and 7 - Review improvement and updating.
The question was formulated in the first step. This stage was critical in carrying out the full study, since it needed to be well formulated and simple to grasp [18]. In this regard, the issue is, "For what analysis methods are bicycles being adopted as a mobile measurement instrument for environmental variables in work related to the urban thermal environment?" This allowed us to consider the keywords that led the research. The selection of keywords is an important search strategy for carrying out the second stage. The following keywords were used: mobile measurements, bicycle, thermal effects, and microclimate.
For the second stage, studies were found and chosen, and the words were translated into English and added to the Connected Papers platform, which provides a general and visual overview of various academic fields as well as building a graph of similar articles with popular works on the topic of interest [19]. Science Direct and Scopus were also used in addition to this platform. The platforms chosen were chosen because they are well-regarded, with the belief that this stage is critical since it is the platform that will add to the available work on the issue covered [17].
The papers were then critically examined (step 3), with the titles first read. Titles that obviously departed from the notion of thermal effects were rejected, as were those that did not employ mobility measurements with a bicycle (cars or on foot were omitted) for other objectives. Some people utilized the bicycle to learn about air quality, which was not the goal of this study, as well as other issues that did not fit, which were also removed. When reading the titles, those that could somehow fit into a research subject connected to the urban thermal environment and that either stated or indicated the usage of bicycles were taken into account.
The titles that were chosen were divided so that the abstracts could be read. The same selection and exclusion rationale was used for abstracts as it was for titles. It was already possible to identify works that used bicycles for mobile measurements in thermal environment research by reading the abstracts; however, some still did not specify in the abstracts which methodology they had used for carrying out mobile measurements (car, motorcycles, bicycles, or walking), so these works were also selected alongside the others so that a complete reading could occur. After thoroughly reviewing the publications, it was possible to decisively pick those studies that employed bicycles to gather environmental data in order to analyze the urban thermal environment, which were used in this research.
Author and year, city/country, continent, local climate according to Köppen [20], season of the year, period of the day for mobile collection, number of collection days, and analysis methods for defining urban morphology based on specific objectives were obtained from the studies (step 4 and 5). As mentioned in the research, issues such as equipment mounted to bicycles during mobile measurements, stationary stations, and exposure to the air environment were also considered. The research’s findings and discussions, were provided in the form of tables, graphs, and explanations for this purpose (step 5, 6 and 7).
Chapter 4.5 was created to provide other works that employed the bicycle to measure environmental factors in the urban thermal environment that were not discovered using the keywords. Such works were discovered through prior information, study conducted using other methods, and, most importantly, by monitoring references listed in research that employed the approach of mobile measurements using a bicycle.
3. Results
3.1. Selected Articles
After entering the keywords into the platforms, 414 papers were found in Connected Papers, 57 in Science Direct, and 7 in Scopus. In all, 478 items were discovered (Table 1).
According to Table 1, after reading all 478 titles (100%) identified, 193 (about 40%) were chosen to read the abstract and 286 (roughly 60%) were rejected because they did not satisfy expectations. After reading the abstracts, 157 (about 81%) were chosen for full reading, while 36 (about 19%) were rejected because they did not suit the theme. It is worth noting that just 13 (roughly 3%) of the 478 (100%) original titles were selected to continue the investigation.
To resume this information, the graph in the Figure 1 reveals that 77% (10) of the 13 papers chosen were located in Connected Papers, 15% (2) in Scopus, and just 8% (1) in Science Direct. Four papers were removed from the Scopus selection because they had already published on the Connected Papers platform.
3.2. Data Collection
Following the selection of the 13 publications, data such as author/year, city/country, continent, climate, major purpose, season, period of the day, collecting days with mobile measurements, and microclimate characterizers were gathered, as shown in Table 2.
4. Discussion
4.1. Publication Dates
The first article found through the platforms was published in 2011 (Figure 2).
The graph illustrates a notable trend indicating an increase in the publication of papers utilizing bicycle-based approaches for mobile measurements over time. Until 2021, the annual output remained consistently low, with just one article published each year. However, after 2021, there was a significant surge in publications, surpassing the previous decade’s numbers. This trend clearly indicates that despite being a relatively new approach, its utilization has been historically limited.
The rising number of articles produced annually following 2021 suggests a potential shift towards increased adoption and exploration of this methodology. If this trajectory continues, it implies a growing interest and potential for further development and application of bicycle-based mobile measurements in research related to the urban thermal environment on an international scale in the forthcoming years.
4.2. Geographic Location and Climate
Figure 3 presents the geographic spatiality of the research found that used mobile transects with bicycles.
The disparity between the Southern and Northern Hemispheres is evident in Figure 3, illustrating a pronounced concentration of works predominantly originating from the Northern Hemisphere. Notably, the preponderance of these works (7) emanated from var-ious European nations, including Greece, the Czech Republic, Italy, the Netherlands, Bel-gium, and two studies from France. In North America, three studies were identified, all of which were conducted in the United States. Asia contributed only one study, situated in South Korea, while South America yielded two studies conducted in Brazil.
Regarding climatic classifications based on the Köppen system [20], the research encompassed a diverse spectrum of climatic conditions. Mobile measurements were sourced from eight distinct climate types: Cfb, DWa, Cfa, Dfb, Csc, Bwh, Dfa, Csa, and Am. Notably, a predominant focus was observed in hot climate zones, notably with five studies centered on Cfb, while the remaining climate types were each represented in one study. Additionally, a separate investigation on thermal environments within densely populated metropolitan areas highlighted a similar emphasis on temperate climatic zones (group C) [21].
4.3. Researches Found
Given the recent rise of urban centers, the demand for open spaces in urbanized regions is clear, stressing the need for even more study including the thermal environment [1,3]. Although some studies had the primary goal of examining human thermal comfort [5,6,22] or islands of coolness [23,24], each research had its own unique characteristics.
The impact of horizontal and vertical nighttime cooling of a small park with irrigated grass and dry surfaces on a university campus in the Phoenix metropolitan region was investigated [24]. Temperature data collected on a bicycle mobile transect were integrated with spatial temperature data modeled in ENVI-Met 3.1. Variations in the thermal characteristics of the surface, urban geometry, building orientation, and soil humidity were all important for determining the distinct urban and non-urban temperatures near to the surface.
The first work discovered through the searches in the Southern Hemisphere was done in Rio de Janeiro, Brazil [25]. The primary goal was to investigate the overall human reaction of the local population to the climatic peculiarities of Rio de Janeiro, as well as to identify certain intervention options in urban morphology that may lead to greater environmental comfort.
Psychological effects of urban green spaces on perceived thermal comfort, as well as the physical conditions of thermal comfort of green spaces in comparison to other urban locations in the city using micrometeorological measurements taken on a bicycle. Questionnaires were used to evaluate residents’ long-term perceptions of thermal comfort on hot summer days in three Dutch cities [26].
The midday cooling impact of Utrecht’s green areas was investigated in order to uncover physical evidence to support the experience of thermal comfort. The bicycle was outfitted with micrometeorological sensors, and the temperature conditions in 13 parks were compared to those in the city center and open pastures outside the city.
There was also a comparison of temperature conditions and park spatial characteristics (size, tree canopy, and plant protection against wind). To establish distinctions, air temperature (Ta), mean radiant temperature (Tmrt), and physiological equivalent temperature (PET) were measured during the day in urban parks, the city center, and open fields outside the city on hot summer days.
A study in Ohio, USA, validated a bicycle for use in mobile measurements, allowing mobility within the city to analyze physical and thermal qualities [8]. Microclimatic data were gathered during the warmest portion of the day to evaluate how physical factors (solar radiation, albedo, sky view factor, vegetation) influenced local changes in soil and air temperatures. The kinds of land surface temperature and land cover explained the variance in air temperatures, while solar radiation and albedo helped to explaining the variation in land surface temperatures throughout the transect.
Another research using bicycles to conduct mobile assessments of thermal comfort in the Athens metropolitan region [22]. The transects were completed in a single day, at midday and at night. The Envi-Met model was used to simulate surface, plant, and air interactions in an urban context. Air temperature, relative humidity, wind speed, global temperature, and global solar radiation were all measured. For the analyses, the PET index was employed.
A bicycle for mobile measurements in the city of Olomouc was employed to look for hot and cold places by analyzing air temperature in distinct Local Climatic Zones (LCZs) throughout the summer, autumn, and winter. The findings revealed that the microclimate and local climate had a considerable impact on temperature [27].
[28], proposes to explore the contribution of predictor factors to the modeling of air temperature and measurement error by addressing data gathering methods and statistical processes. Furthermore, the research intends to enhance urban planning in the context of climate change and to mitigate Urban Heat Islands.
Research in Dijon, Eastern France, using mobile measurements on a bicycle equipped with environmental variables equipment to quantify the effect of urban design on microscale air temperature fluctuation [29]. The trek was completed over the course of 33 spring and summer evenings. Based on analysis of variance, the influence of urban design and land cover on air temperatures was evaluated using land cover and LCZs.
To explore the impacts of canyons and urban environment on air temperature and exterior thermal comfort in a Seoul open plaza, another research using bicycle was used [5]. To assess the accuracy of the mobile approach, data from mobile bicycle measures taken in October at 2pm and 3pm were compared to those from stationary measurements. The effects of the spatial parameters of the urban plaza and local street were investigated using air temperature and Physiological Equivalent Temperature (PET).
During the summer, [6] employed the bicycle to investigate the degree of human thermal (dis)comfort in connection to the various microclimates prevalent around the cycling lanes in Balneário Camboriú, Brazil. The Physiological Equivalent Temperature (PET) and Universal Thermal Climate Index (UTCI) indices were used to measure outdoor thermal comfort, while the Local Climatic Zones (LCZ) and Sky View Factor (SVF) were employed to establish urban form. During the summer, data on environmental variables such as air temperature, relative humidity, and global temperature collected by mobile transects on bicycles are integrated with data from permanent stations in the city.
Measurements in the urban microclimate and details of a hardware and software components application as a methodology for one research was employed to build a mobile transect [4]. The approaches were evaluated in the Italian city of Bolzano, confirming their applicability for recognizing the geographical variability of the microclimate in connection to urban morphology, as well as emphasizing the presence and assessing the severity of the urban heat island.
Mobile bicycle transects were done in Golden Gate Park and neighboring residential districts in San Francisco, CA, from July to October 2012, when temperatures were at their highest [23]. Air temperature, relative humidity, sun radiation, and radiometric surface temperature were all measured.
The goal was to assess the spatial variability in near-surface temperature profiles at these places and on neighboring surfaces. The magnitude of so-called "park cool islands" (PCI) was studied for various types of park land use, at different times of day, during different regional-scale weather conditions, and across the entire range of heights that a human body can experience, as well as humidity differences and the likely drivers of PCI in the urban park.
More comprehensive temperature drop correction approach for mobile readings was researched and tested using bicycle [30]. Temperature evolution may be greatly influenced by the environment, and the link between land cover and temperature was taken into consideration during the period of bicycling readings in two Belgian towns.
4.4. Bicycle Measurements: Studies in the Thermal Environment
The approach of mobile transects using bicycles was discovered to be relatively new, with the first study discovered across all three platforms in 2011 [24]. Several studies cited that their objectives were also to validate measurement with the bicycle [5,6,8], this may occur due to the fact that no work of this kind could have been carried out in their locality, as well as no work that used bicycles for this purpose could have been found.
The grounds for utilizing the bicycle to assess environmental factors were the inexpensive cost of the supplies, as well as the bicycle’s ability to reach locations that other forms of vehicles could no longer access. Another aspect highlighted was the fact that utilizing a bicycle would be more sustainable and would produce less pollution than other sorts of techniques, not to mention that measures using vehicles, for example, suffer from greater traffic, which might impede research efforts.
As indicated in graph of Figure 5, the major goals of the research that employed the bicycle for mobile measurements in urban thermal settings were to explore thermal comfort with 38% (5) and temperature with 38% (5), urban cooler island 15% (2) and urban heat island 8% (1).
Graph in Figure 6 demonstrates that the majority of mobile measurements happened solely during the day, with 62% (8) occurring during the day, 15% (2) occurring at night, and 23% (3) occurring both during the day and at night.
In terms of the time of day when the measurements are taken, it is worth mentioning that the majority of the studies were conducted during the day. Table 2 demonstrated that the selection of the collection period did not follow a consistent trend.
In terms of seasons, it is easy to see that 54% (7), or more than half of the works, decided to conduct out collections in the summer, with autumn following closely after with 15% (2) and just 8% (1) of the works presenting the other sets of stations shown in Figure 7.
The most used urban morphology characterizer in the study was SVF (34%), followed by ENVIMET (25%), LCZ (17%), and 3D SKYVIEW, SKYEF, and Bodembed Ekkingskaart (8%), (Figure 8).
The detailing of information on equipment, software, and atmospheric weather choices for carrying out mobile measurements differed according to the core purpose of each study discovered, with some offering more detail than others. Furthermore, depending on the primary goal of the investigations, the equipment linked to bicycles in study differ substantially (Figure 9). In the urban thermal environment, research is often conducted using specified criteria for each approach, with measuring instruments varied.
Some studies showed photographs of bicycles with equipment mounted, however each research was unique based on the instruments used for measurements. Several tests revealed that the equipment should be higher than 1.25-2.00 meters above ground level to minimize interference from the ground and the pilot [4,6,8,22].
Furthermore, studies documented the use of stationary meteorological stations, in addition to mobile readings, to quantify the average temperature environment, as well as minimizing potential inaccuracies through comparisons of the accuracy of equipment mounted to bicycles with official weather stations [4,6,22].
In terms of the atmospheric environment, some researchers choose to schedule mobile measurements that take sun radiation into consideration because it is a key component of the study [6,8,27] Others reported picking days with no precipitation for observations [27], calibration of dattaloggers, and wind speed readings corrected for cycling speed were also taken into account [6,26].
4.5. Other Studies
During the investigation, a significant finding was discovered. There were works that used the bicycle as a means of measuring environmental variables in the urban thermal environment, but they were not found based on the keywords defined in this work, so the need to present them arose due to the importance and relevance of their results. It is worth emphasizing here that there may be a constraint encountered while carrying out the measures that were taken.
The bicycle was employed in a 1998 study in two cities with differing summer climates: Vancouver, Canada, and Sacramento, CA, USA. Although it was not the sole way of carrying out mobile measurements in this investigation. The temperature regime of urban parks was investigated. To quantify the amount of park-related coolness, surface and air temperatures were remotely measured from permanent stations as well as movable automobile and bicycle crossings. The bicycle was employed in certain study in Vancouver because it allowed access to the interiors of parks and some roadways. A sensor put on the front of the bicycle was used to monitor air temperature [31].
Research to evaluated the frequency of use of mode of transport by cyclists classed as both commuting and leisure riders under particular atmospheric settings in the city of Vienna, Austria was conducted [32]. Statistical approaches and the PET index were used, which revealed that leisure cyclists are more susceptible to weather than commuters/commuters.
Between March 2006 and January 2009, mobile temperature and humidity measurements were taken along a bicycle transect in the Dutch city of Utrecht. To explain the mean intensity profiles and maximum nighttime ICU of the city in relation to the Sky View Factor, two multiple linear regression models were developed [33].
A study in 2014 in which meteorological data were taken on a bicycle in Rotterdam to examine the regional change of temperature throughout a tropical day [34]. The researchers assessed Urban Heat Islands and their geographic variability in urban canyons, linking them to urban form. A multiple linear regression model was built using cross-sectional observation data and verified with 3-year summer ICU statistics taken from four fixed urban and two fixed rural weather sites.
To attempted to assess the thermal comfort of spectators along a Tokyo Olympic marathon course in 2019 [35]. The study demonstrated how numerous environmental elements might influence human thermal comfort. It was feasible to determine air and surface temperature, solar radiation, humidity, and wind speed using mobile measurements taken with a bicycle along the marathon course over 15 days in the summer of 2016, in conjunction with the usage of the Sky View Factor (SVF).
Mobile measurements on a bicycle to assess the interplay of canopy cover and impervious surface cover on daytime urban air temperature throughout the summer were made [36]. In a medium-sized setting in a city in the Upper Midwest of the United States, ten transects were carried out with measurements every 5 meters encompassing a range of impervious cover and canopy.
5. Conclusions
The systematic review showed effective in attempting to comprehend previous research in scientific circles that employed the approach of mobile measurements using bicycles. A total of 13 publications were discovered through a search on three well-known sites in worldwide academia. Because the great majority of works were published in the Northern Hemisphere, in Europe, it was feasible to recognize that there is a very huge gap to be filled with works of this scale throughout the world through this endeavor. It was also feasible to see that the number of publications published in the previous two years that employed this approach has been increasing, suggesting a growth in this research in the next years.
Concerning the most significant constraint discovered in the search, it is worth mentioning that keywords, when combined, may not reveal all accessible articles on the topic; hence, they must be carefully evaluated, as they will guide the whole search. In this regard, it is critical to pay attention to the stage referring to the study’s location, as the higher the search means indicated in the technique, the better the precision. The systematic review is rigorous, but its architecture is established by the researcher himself based on his aim, making it pliable and allowing this constraint to be addressed. It is also worth noting that other research that employed bicycles to investigate environmental factors in urban contexts that were not included in this paper may exist.
In the future, it is envisaged that the systematic review will progressively contribute to future research that will use bicycles to conduct mobile measurements since they are efficient, low-cost, and easily accessible. As a consequence, future results will be more precise and the approach will be improved.
Author Contributions
Conceptualization, L.W., C.A.W and J.P.A.G.; methodology, L.W., C.A.W., I.T.C., A.C.I., A.N.S, O.F.B. and J.P.A.G.; software, L.W. and C.A.W.; validation, L.W., C.A.W., I.T.C., A.C.I., A.N.S, O.F.B. J.P.A.G., S.S. and A.M.; formal analysis, A.M. and S.S.; investigation, L.W. and C.A.W.; resources, L.W. and C.A.W.; data curation, L.W., C.A.W. and I.T.C.; writing—original draft preparation, L.W. and C.A.W.; writing—review and editing, L.W., C.A.W., S.S. and A.M.; visualization, C.A.W., S.S. and A.M.; supervision, C.A.W., J.P.A.G., S.S. and. A.M.; project administration, C.A.W.; funding acquisition, C.A.W. and S.S. All authors have read and agreed to the published version of the manuscript.
Funding
This study was financed in part by the Coordenação de Aperfeiçoamento de Pessoal de Nível Superior-Brasil (CAPES)-Finance Code 001. Conselho Nacional de Desenvolvimento Científico e Tecnológico (CNPq) for proving the Research and Productivity research: grant process number 306505/2020-7.
Acknowledgments
We thank the Conselho Nacional de Desenvolvimento Científico e Tecnológico (CNPq) for proving the Research and Productivity research: grant process number 306505/2020-7.
Conflicts of Interest
The authors declare no conflict of interest.
References
- Oke, T.R. Boundary Layer Climates; Routledge: New York, NY, USA, 1978; 464p. [Google Scholar]
- Auliciems, A. Human Bioclimatology; Springer: Berlin/Heidelberg, Germany, 1998; Volume 5. [Google Scholar]
- Nikolopoulou, M. Outdoor thermal comfort. Front. Biosci. Sch. 2011, 3, 1552–1568. [Google Scholar] [CrossRef] [PubMed]
- Croce, S.; Tondini, S. Fixed and Mobile Low-Cost Sensing Approaches for Microclimate Monitoring in Urban Areas: A Preliminary Study in the City of Bolzano (Italy). Smart Cities 2022, 5, 54–70. [Google Scholar] [CrossRef]
- Kim, H.; Kim, S.W.; Jo, Y.; Kim, E.J. Findings from a field study of urban microclimate in Korea using mobile meteorological measurements. Open House Int. 2022. Epub ahead of printing. [Google Scholar] [CrossRef]
- Writzl, L.; Wollmann, C.A.; Costa, I.T.; Gobo, J.P.A.; Shooshtarian, S.; Matzarakis, A. Outdoor Human Thermal Comfort along Bike Paths in Balneário Camboriú/SC, Brazil. Atmosphere 2022, 13, 2092. [Google Scholar] [CrossRef]
- Parsons, K. Human Thermal Environments: The Effects of Hot, Moderate, and Cold Environments on Human Health, Comfort and Performance, 3rd ed.; CRC Press: Boca Raton, FL, USA, 2014; 635p. [Google Scholar] [CrossRef]
- Rajkovich, N.B.; Larsen, L. A bicycle-based field measurement system for the study of thermal exposure in Cuyahoga County, Ohio, USA. Int. J. Environ. Res. Public Health 2016, 13, 159. [Google Scholar] [CrossRef]
- Pfautsch, S.; Wujeska-Klause, A.; Walters, J.R. Measuring local-scale canopy-layer air temperatures in the built environment: A flexible method for urban heat studies. Comput. Environ. Urban Syst. 2023, 99, 101913. [Google Scholar] [CrossRef]
- Vasilikou, C.; Nikolopoulou, M. Outdoor thermal comfort for pedestrians in movement: thermal walks in complex urban morphology. Int. J. Biometeorol. 2020, 64, 277–291. [Google Scholar] [CrossRef] [PubMed]
- Stewart, I.D.; Oke, T.R. Local climate zones for urban temperature studies. Bull. Am. Meteorol. Soc. 2012, 93, 12. [Google Scholar] [CrossRef]
- Oke, T.R.; Mills, G.; Christen, A.; Voogt, A. Urban Climates; Cambridge University Press: Cambridge, UK, 2017. [Google Scholar] [CrossRef]
- Matzarakis, A. RayMan Pro. A tool for Applied Climatology. Available online: https://www.urbanclimate.net/rayman/RayManManual.pdf (accessed on 11 December 2023).
- Demuzere, M.; Kittner, J.; Bechtel, B. LCZ Generator: A Web Application to Create Local Climate Zone Maps. Front. Environ. Sci. 2021, 9, 637455. [Google Scholar] [CrossRef]
- Stewart, I.D. A systematic review and scientific critique of methodology in modern urban heat island literature. International Journal of Climatology 2011, 31, 200–217. [Google Scholar] [CrossRef]
- Paul, J.; Criado, A.R. The art of writing literature review: What do we know and what do we need to know? Int. Bus. Rev. 2020, 29, 101717. [Google Scholar] [CrossRef]
- Higgins, J.; Green, S. (Eds.) Cochrane Handbook for Systematic Reviews of Interventions. Version 5.1.0 [updated March 2011]: The Cochrane Collaboration, 2011.
- Sampaio, R.F.; Mancini, M.C. Estudos de revisão sistemática: um guia para síntese criteriosa da evidência científica. Revista Brasileira de Fisioterapia 2007, 11, 83–89. [Google Scholar] [CrossRef]
- Connected Papers. Available online: https://www.connectedpapers.com (accessed on 19 March 2023).
- Kottek, M.; Grieser, J.; Beck, C.; Rudolf, B.; Rubel, F. World map of the Koppen-Geiger climate classification updated. Meteorol. Z. 2006, 15, 259–263. [Google Scholar] [CrossRef]
- Wai, C.Y.; Tariq, M.A.U.R.; Muttil, N. A Systematic Review on the Existing Research, Practices, and Prospects Regarding Urban Green Infrastructure for Thermal Proceedings of 8th Windsor Conference: Counting the Cost of Comfort in a changing world Cumberland Lodge, Windsor, UK, 10-13 April 2014. London: Network for Comfort and Energy Use in Buildings, Comfort in a High-Density Urban Context. Water 2022, 14, 2496. [Google Scholar] [CrossRef]
- Nastos, P.T.; Moustris, K.P.; Charalampopoulos, I.; Larissi, I.K.; Paliatsos, A.G. Assessment of the Thermal Comfort Conditions in a University Campus Using a 3D Microscale Climate Model, Utilizing Mobile Measurements. In Perspectives on Atmospheric Sciences; Springer Atmospheric Sciences; Karacostas, T., Bais, A., Nastos, P., Eds.; Springer: Cham, Switzerland, 2017. [Google Scholar] [CrossRef]
- May, S. Oliphant, AJ Characteristics of the Park Cool Island in Golden Gate Park, San Francisco. Theor Appl Climatol. 2023, 151, 1269–1282. [Google Scholar] [CrossRef]
- Chow, W.T.; Pope, R.L.; Martin, C.A.; Brazel, A.J. Observing and modeling the nocturnal park cool island of an arid city: horizontal and vertical impacts. Theoretical and applied climatology 2011, 103, 197–211. [Google Scholar] [CrossRef]
- Drach, P.; Drach, H. Mobile Meteorological Survey Station: Applying Measurement Tools on a bike to create the Meteobike. Proceedings of 8th Windsor Conference: Counting the Cost of Comfort in a changing world. Cumberland Lodge, Windsor, UK, 10-13 April 2014. London: Network for Comfort and Energy Use in Buildings.
- Klemm, W.; Heusinkveld, B.G.; Lenzholzer, S.; Jacobs, M.H.; Hove, B.V. Psychological and physical impact of urban green spaces on outdoor thermal comfort during summertime in The Netherlands. Build. Environ. 2015, 83, 120–128. [Google Scholar] [CrossRef]
- Lehnert, M.; Kubeček, J.; Geletič, J.; Jurek, M.; Frajer, J. Identifying hot and cool spots in the city centre based on bicycle measurements: the case of Olomouc, Czech Republic. Geogr. Pannonica 2018, 22, 230–240. [Google Scholar] [CrossRef]
- Alonso, L.; Renard, F. A New Approach for Understanding Urban Microclimate by Integrating Complementary Predictors at Different Scales in Regression and Machine Learning Models. Remote Sens. 2020, 12, 2434. [Google Scholar] [CrossRef]
- Emery, J.; Pohl, B.; Crétat, J.; Richard, Y.; Pergaud, J.; Rega, M.; Zito, S.; Dudek, J.; Vairet, T.; Joly, D.; et al. How local climate zones influence urban air temperature: Measurements by bicycle in Dijon, France. Urban Clim. 2021, 40, 101017. [Google Scholar] [CrossRef]
- Vieijra, M.; Vergauwen, T.; Top, S.; Hamdi, R.; Caluwaerts, S. Land cover aware temperature correction of bicycle transects: A case study of mapping the air temperature in two Belgian cities. Urban Climate 2023, 101578. [Google Scholar] [CrossRef]
- Spronken-Smith, R.A.; Oke, T.R. The thermal regime of urban parks in two cities with different summer climates. Int. J. Remote Sens. 1998, 19, 2085–2104. [Google Scholar] [CrossRef]
- Brandenburg, C.; Matzarakis, A.; Arnberger, A. The Effects of Weather on Frequencies of Use by Commuting and Recreation Bicyclists. Adv. Tour. Climatol. 2004, 12, 189–197. [Google Scholar]
- Brandsma, T.; Wolters, D. Measurement and Statistical Modeling of the Urban Heat Island of the City of Utrecht (the Netherlands). J. Appl. Meteorol. Climatol. 2012, 51, 1046–1060. [Google Scholar] [CrossRef]
- Heusinkveld, B.G.; Steeneveld, G.V.; Van Hove, L.W.; Jacobs, C.M.; Holtslag, A.A. Spatial variability of the Rotterdam urban heat island as influenced by urban land use. J. Geophys. Res. Atmospheres. 2014, 119, 677–692. [Google Scholar] [CrossRef]
- Vanos, J.K.; Kosaka, E.; Iida, A.; Yokohari, M.; Middel, A.; Scott-Fleming, I.; Brown, R.D. Planning for spectator thermal comfort and health in the face of extreme heat: The Tokyo 2020 Olympic marathons. Sci. Total Environ. 2019, 657, 904–917. [Google Scholar] [CrossRef]
- Ziter, C.D.; Pedersen, E.J.; Kucharik, C.J.; Turner, M.G. Scale-dependent interactions between tree canopy cover and impervious surfaces reduce daytime urban heat during summer. Proc. Natl. Acad. Sci. USA. 2019, 116, 7575. [Google Scholar] [CrossRef] [PubMed]
Figure 1.
Percentual of articles selected on each platform. Source: Authors (2023).
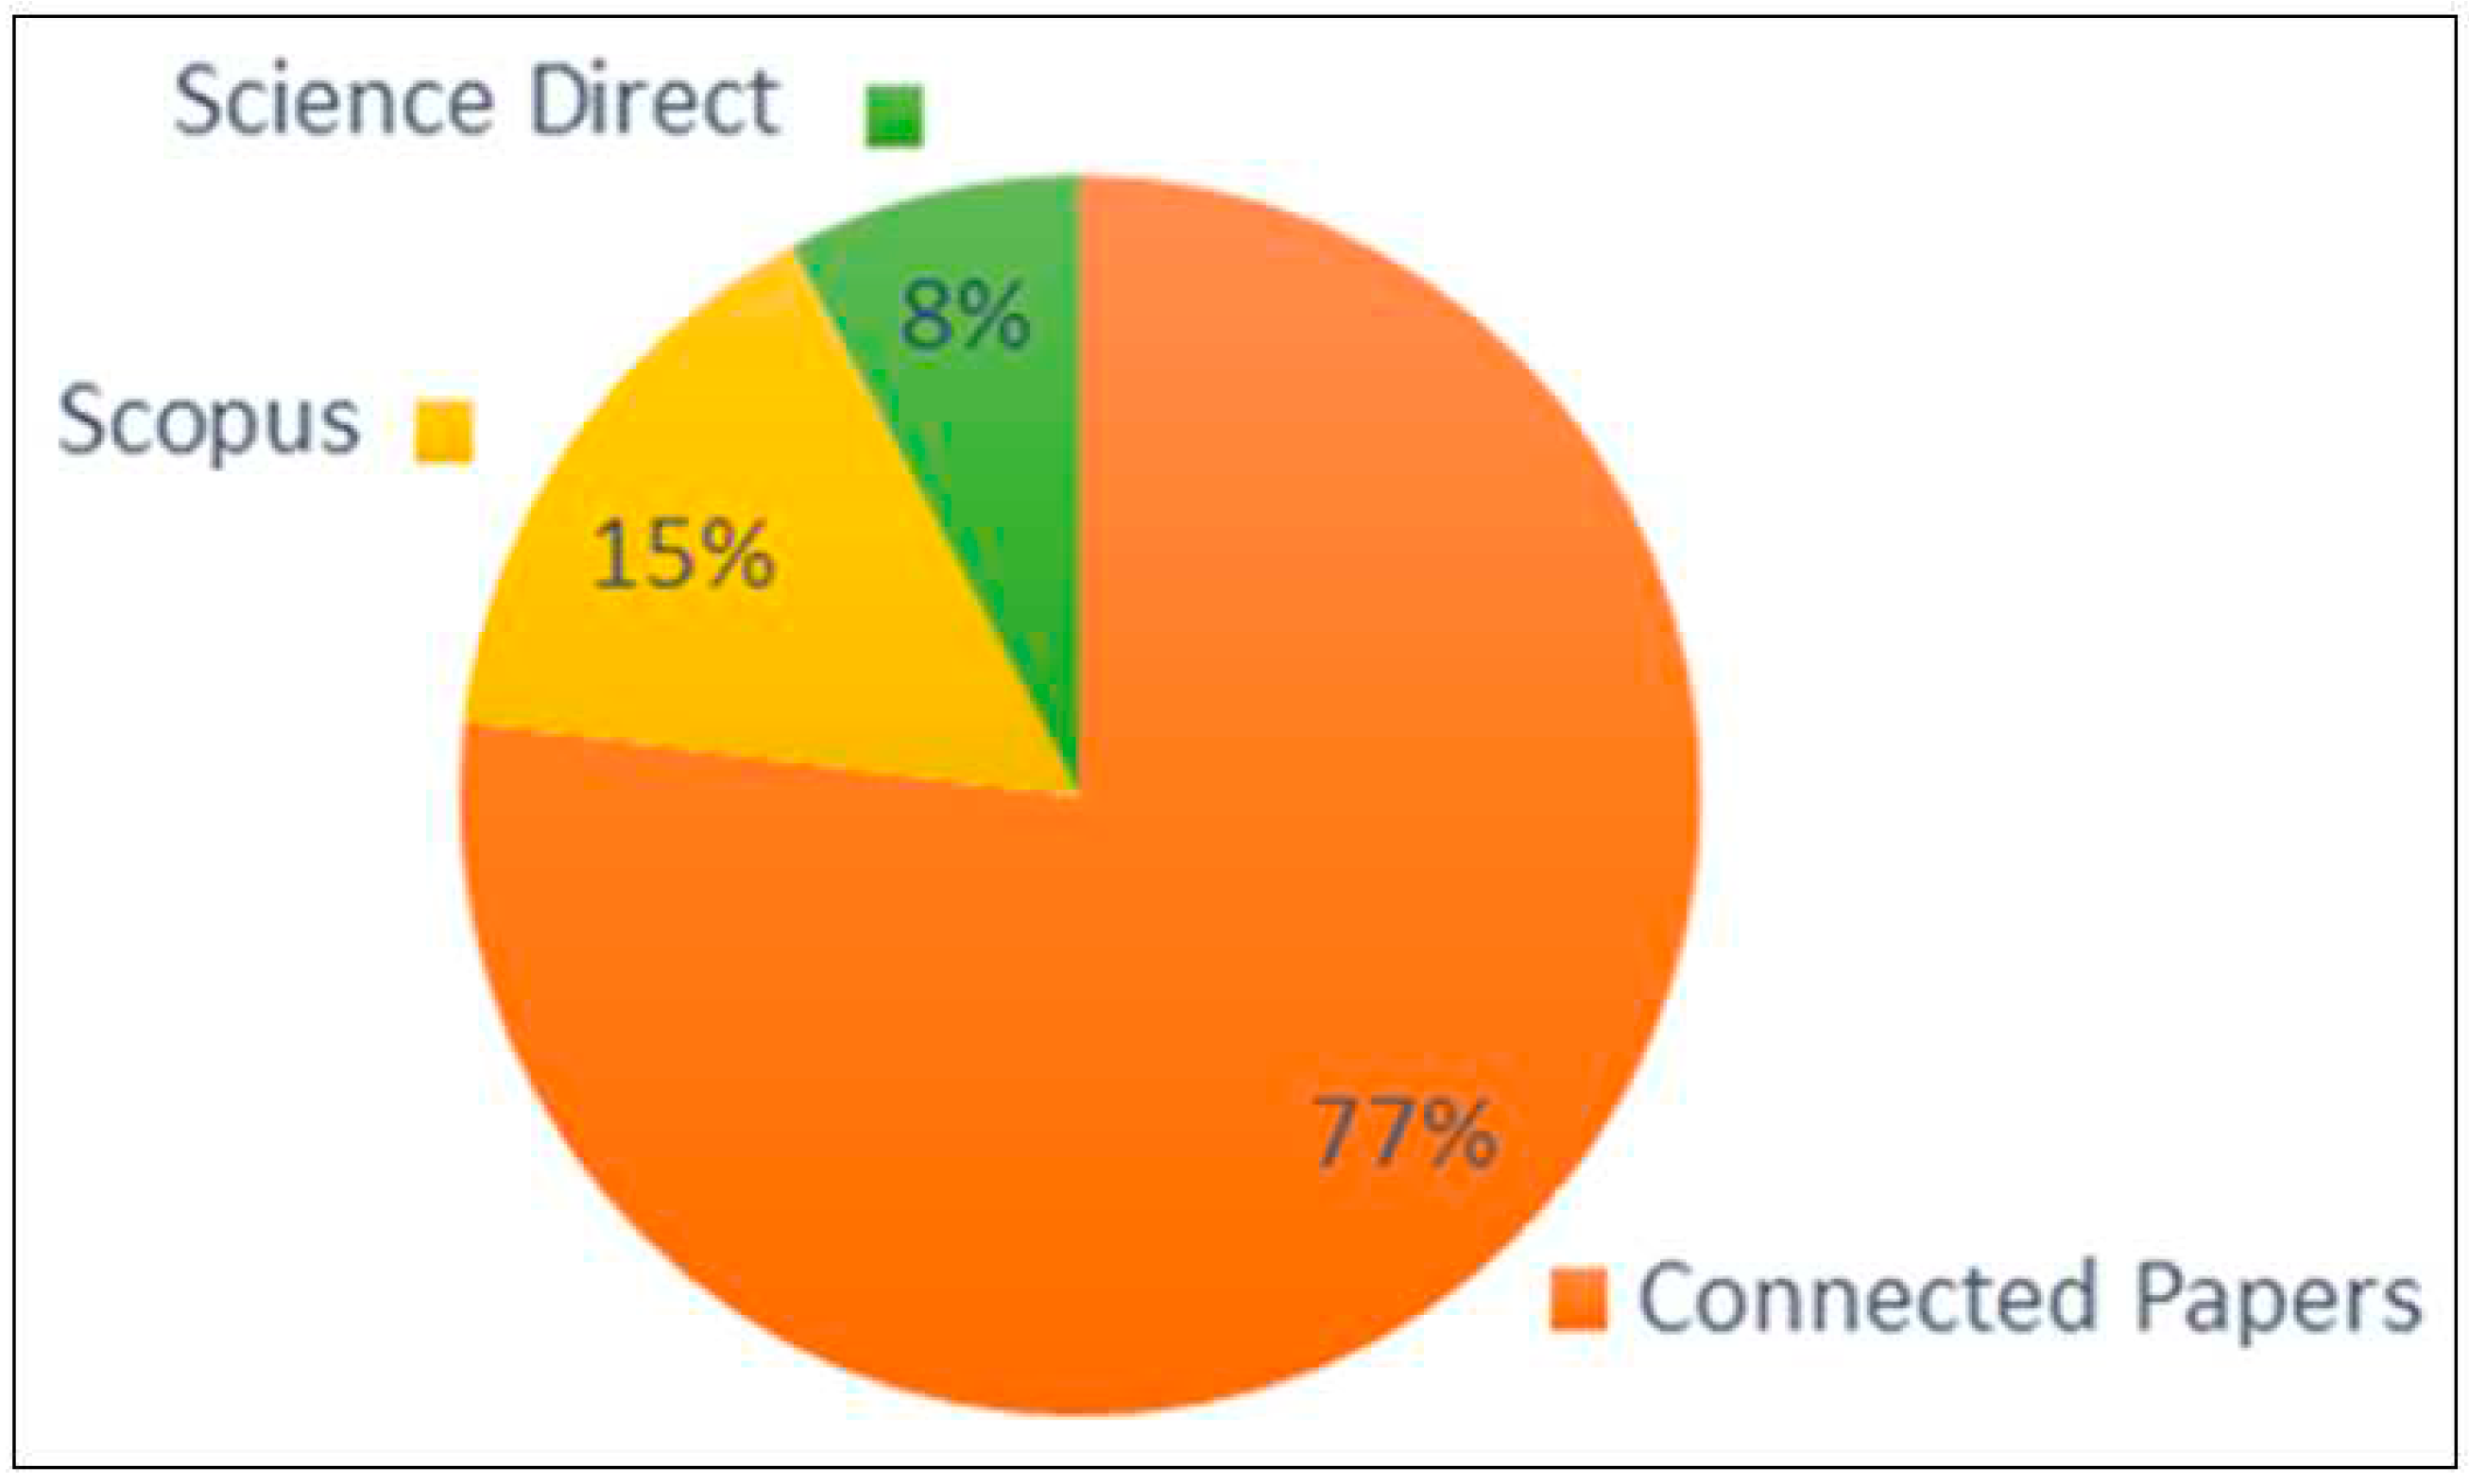
Figure 2.
Number of studies selected by year of publication since 2011, when the first article was found using bicycle in studies. Source: Authors (2022).
Figure 2.
Number of studies selected by year of publication since 2011, when the first article was found using bicycle in studies. Source: Authors (2022).
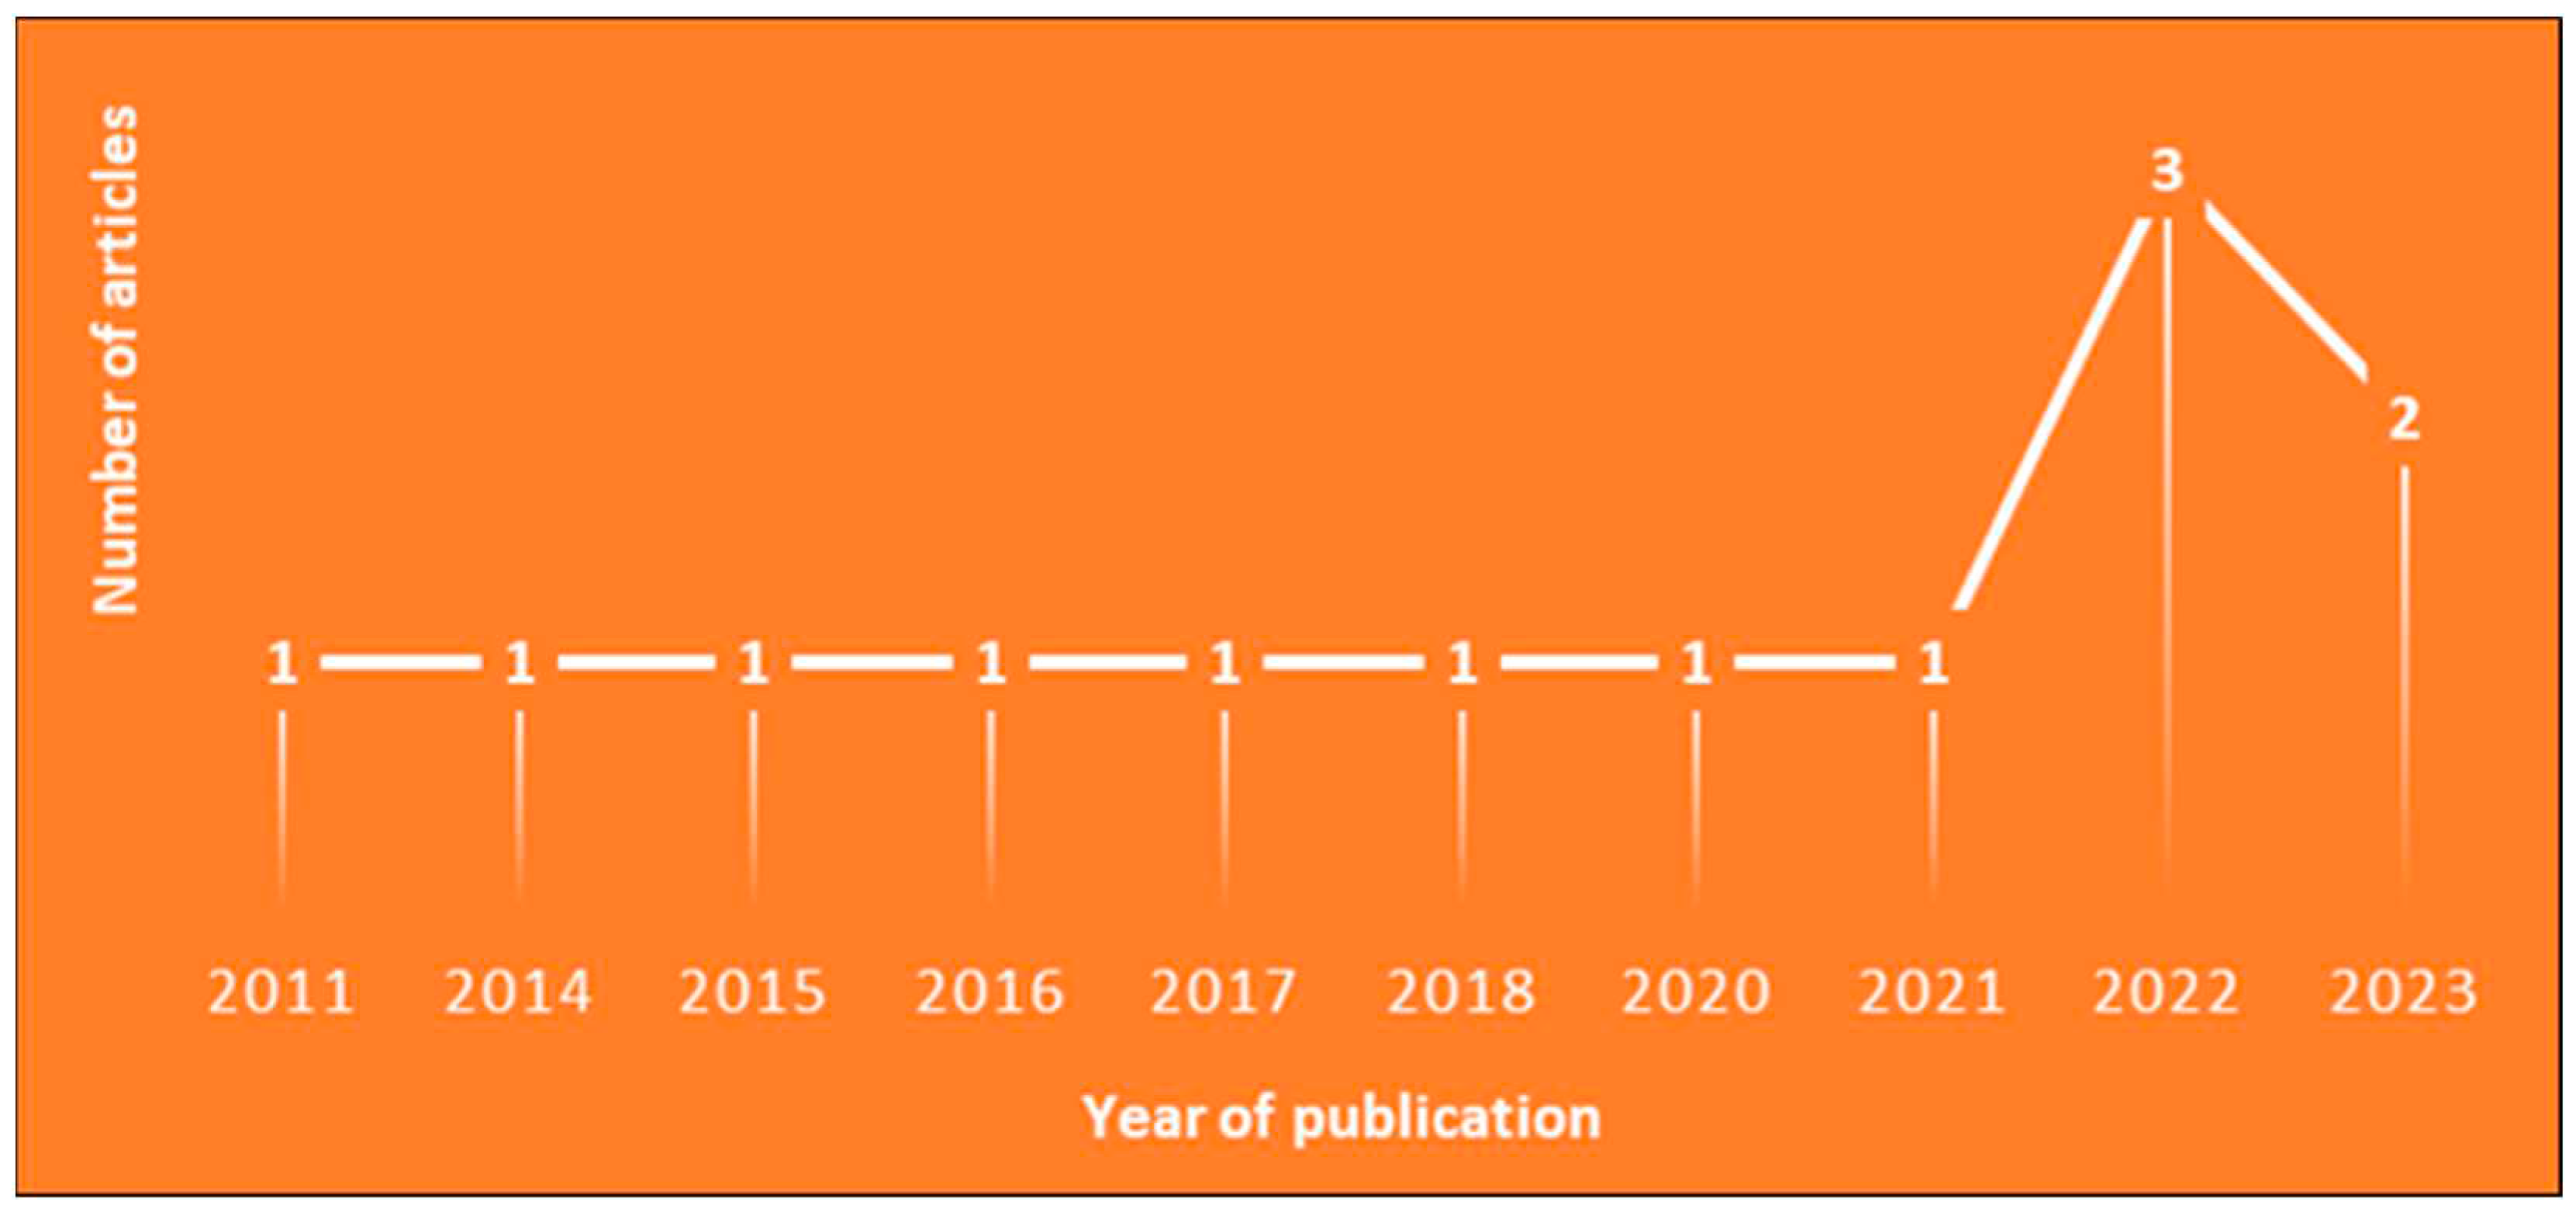
Figure 3.
Worldwide location of papers found according to climate. Source: Authors (2022).
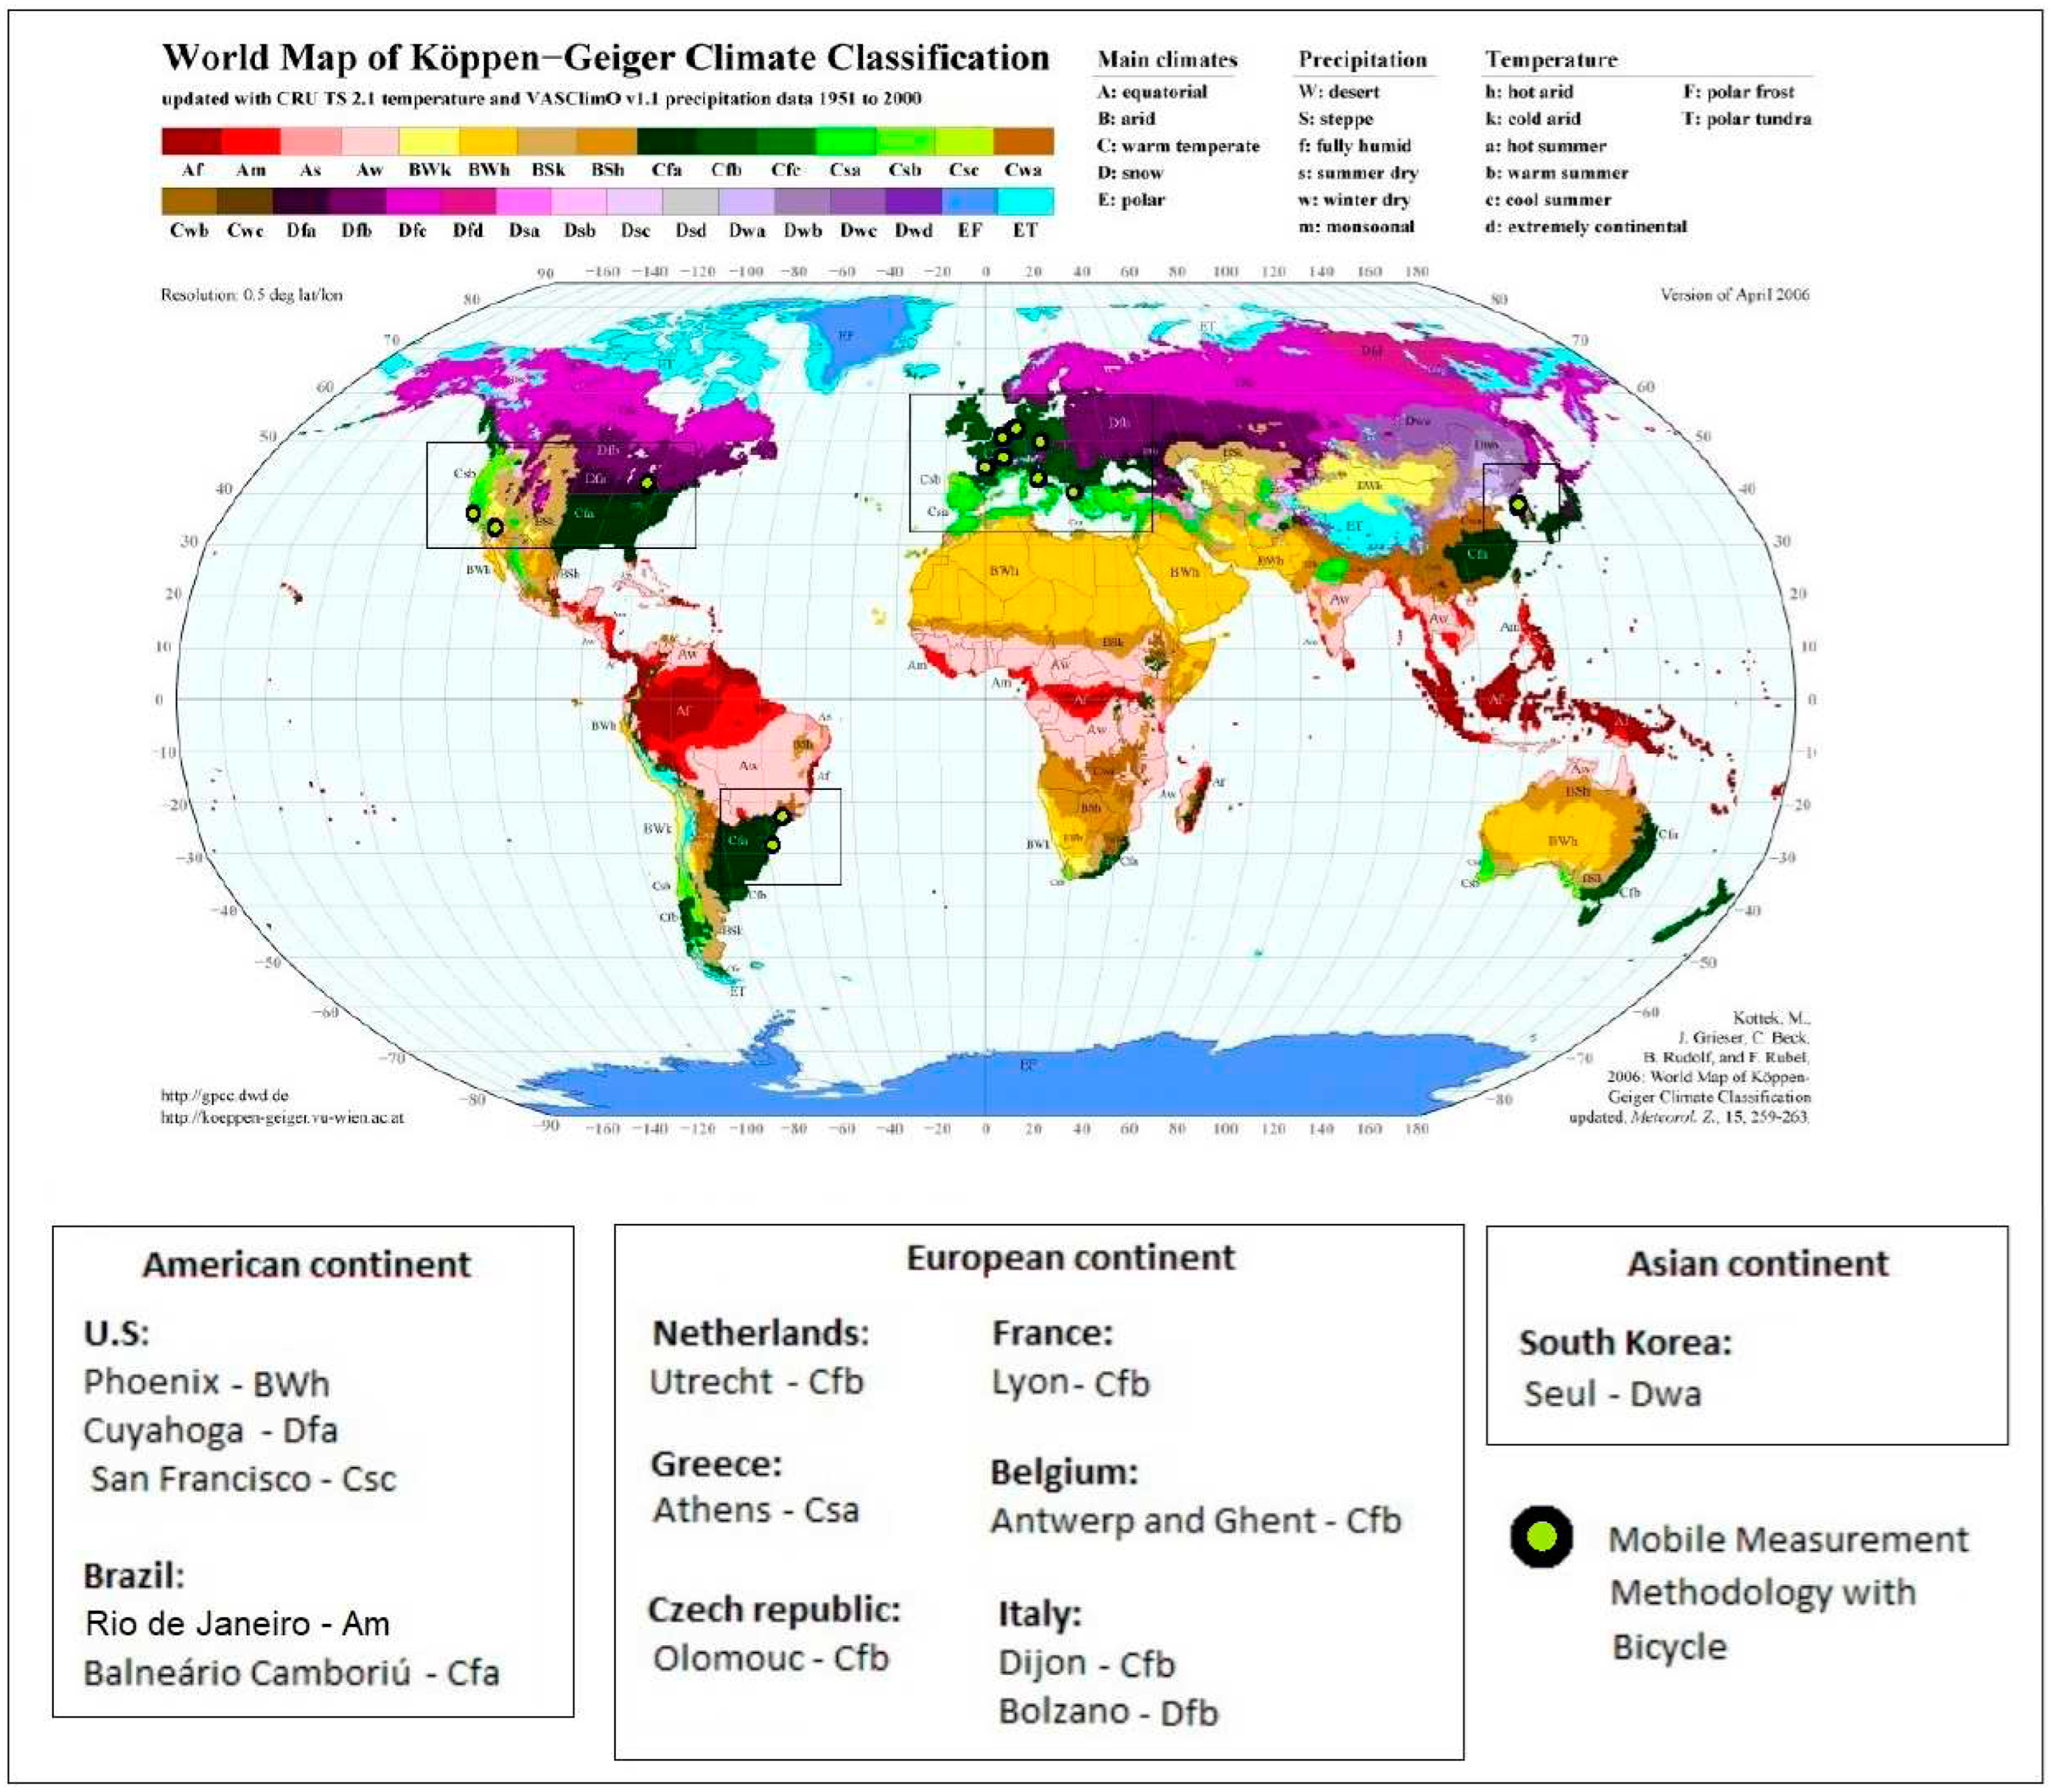
Figure 5.
Main study objectives of the 13 papers selected. Source: Authors (2023).

Figure 6.
Period of the day when collection occurred in the 13 papers selected. Source: Authors (2022).
Figure 6.
Period of the day when collection occurred in the 13 papers selected. Source: Authors (2022).
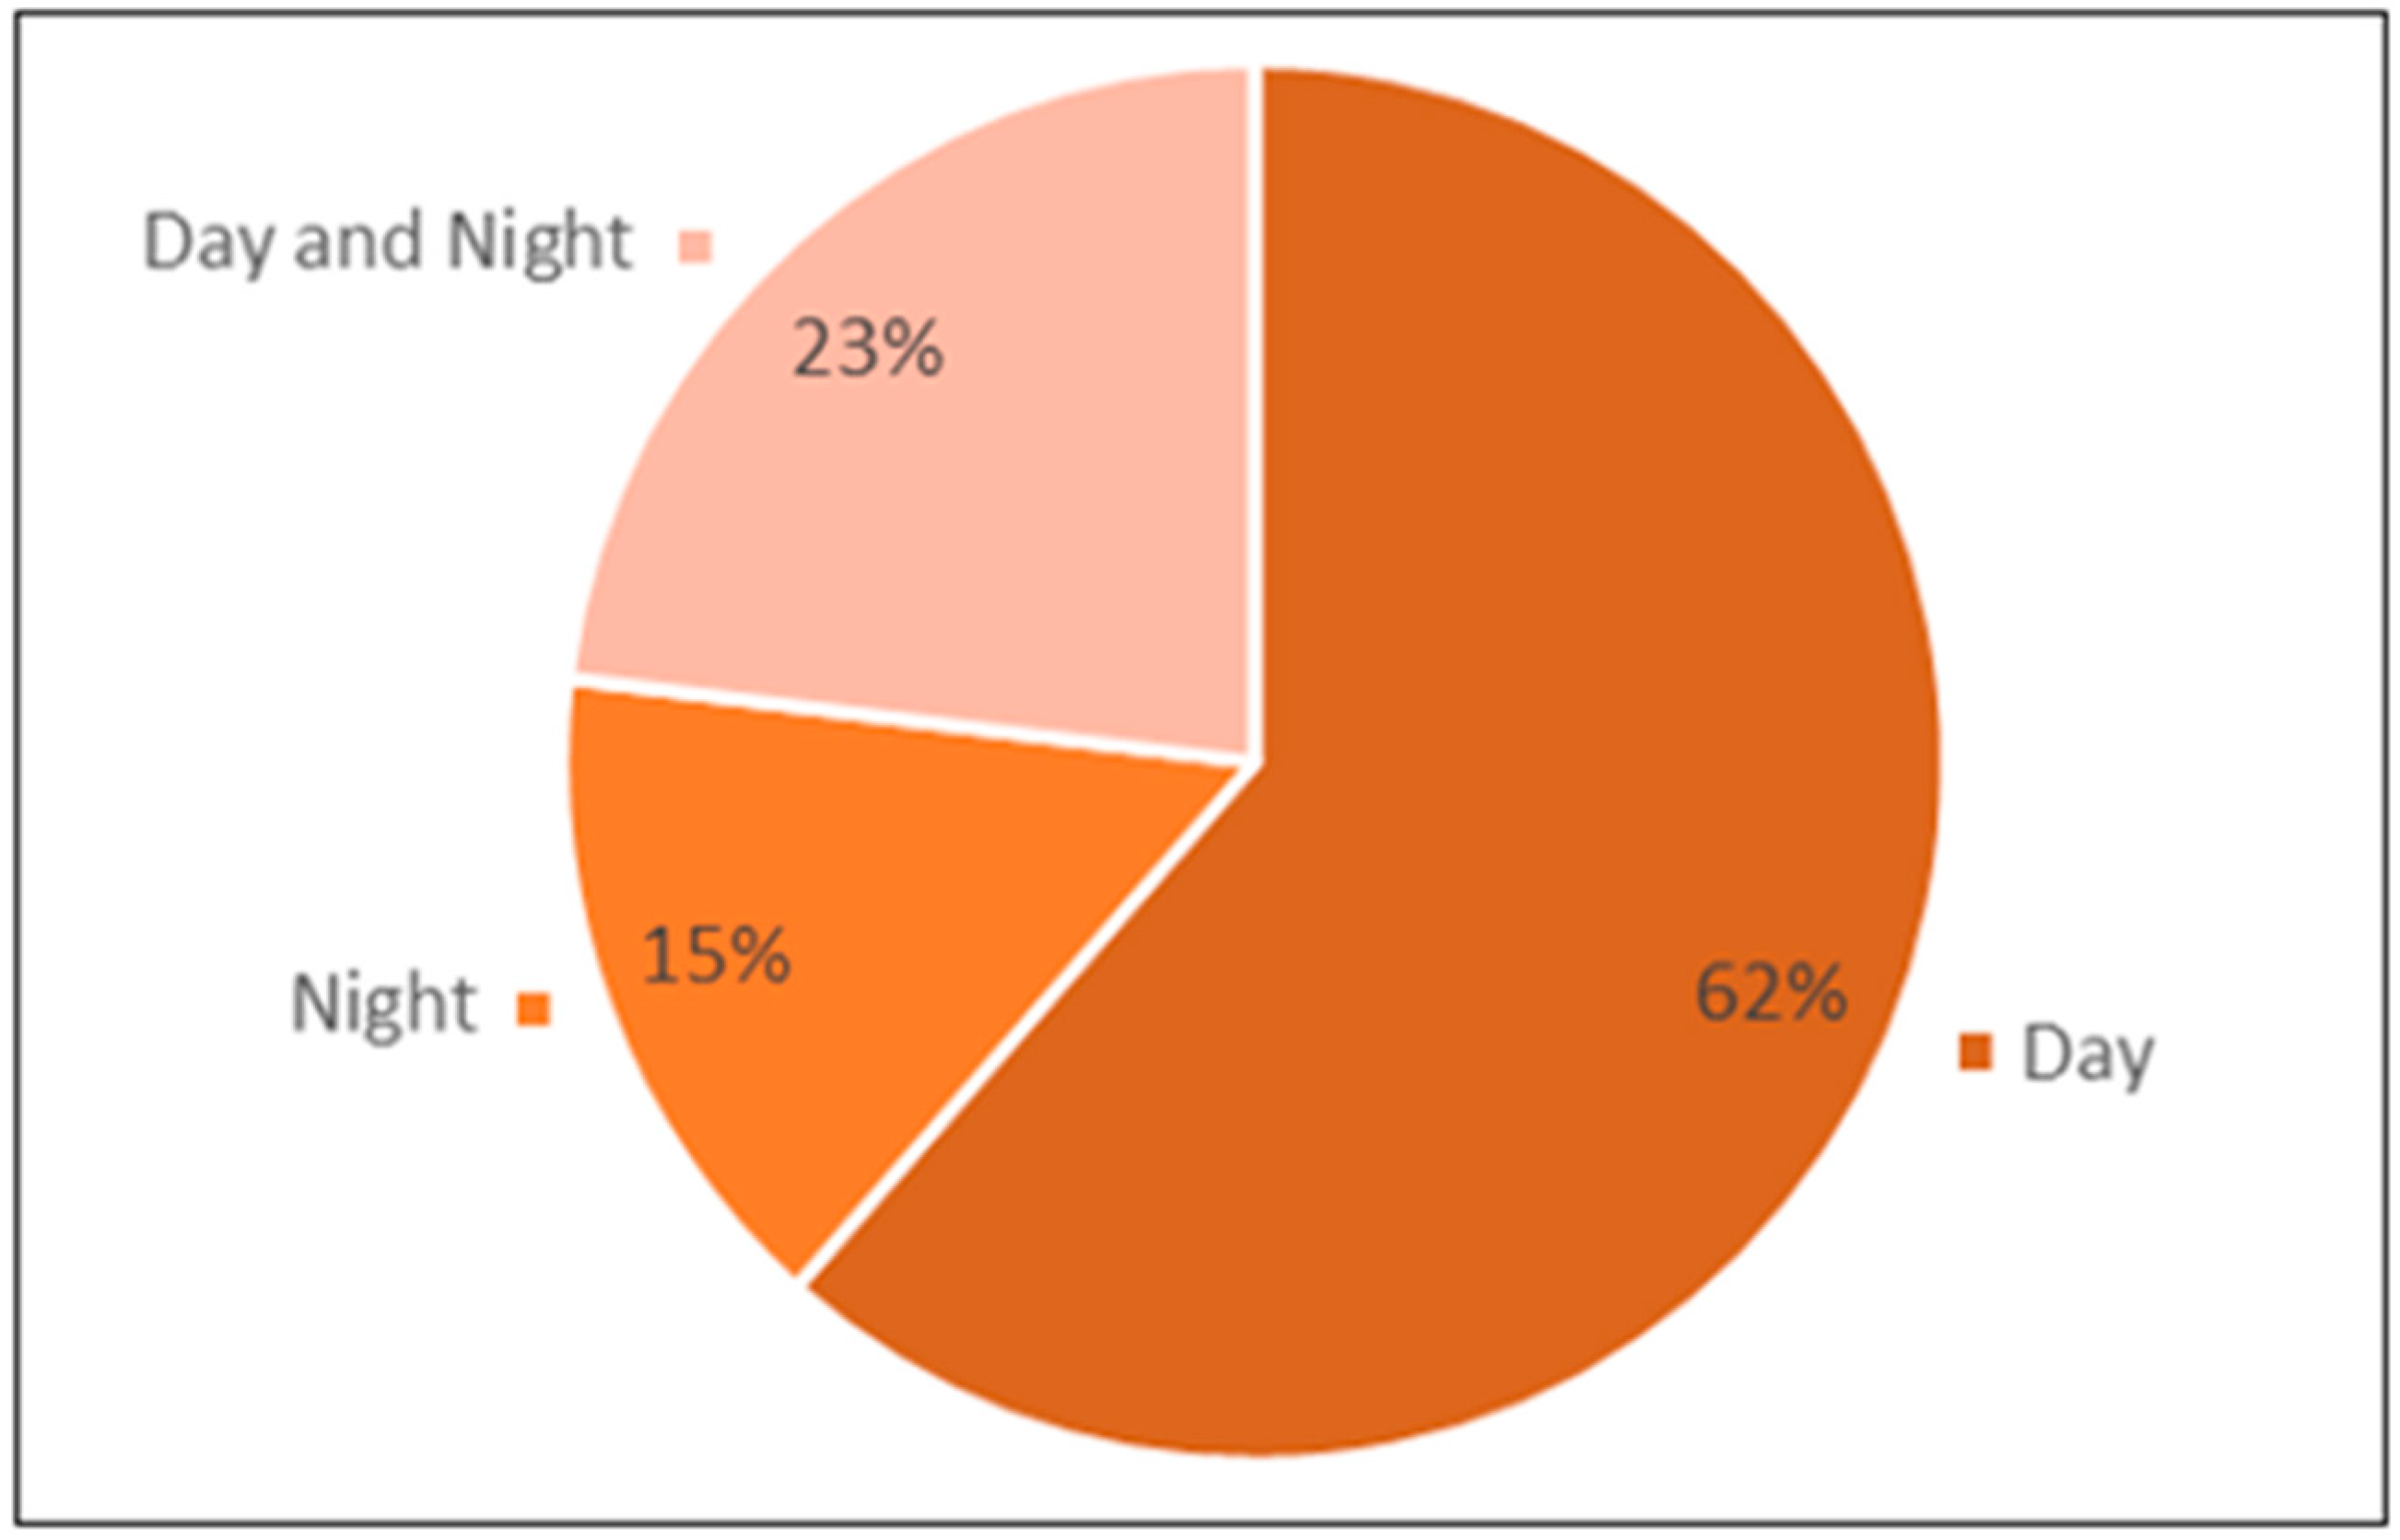
Figure 7.
Seasons of researches occurrence in the 13 papers selected. Source: Authors (2023).
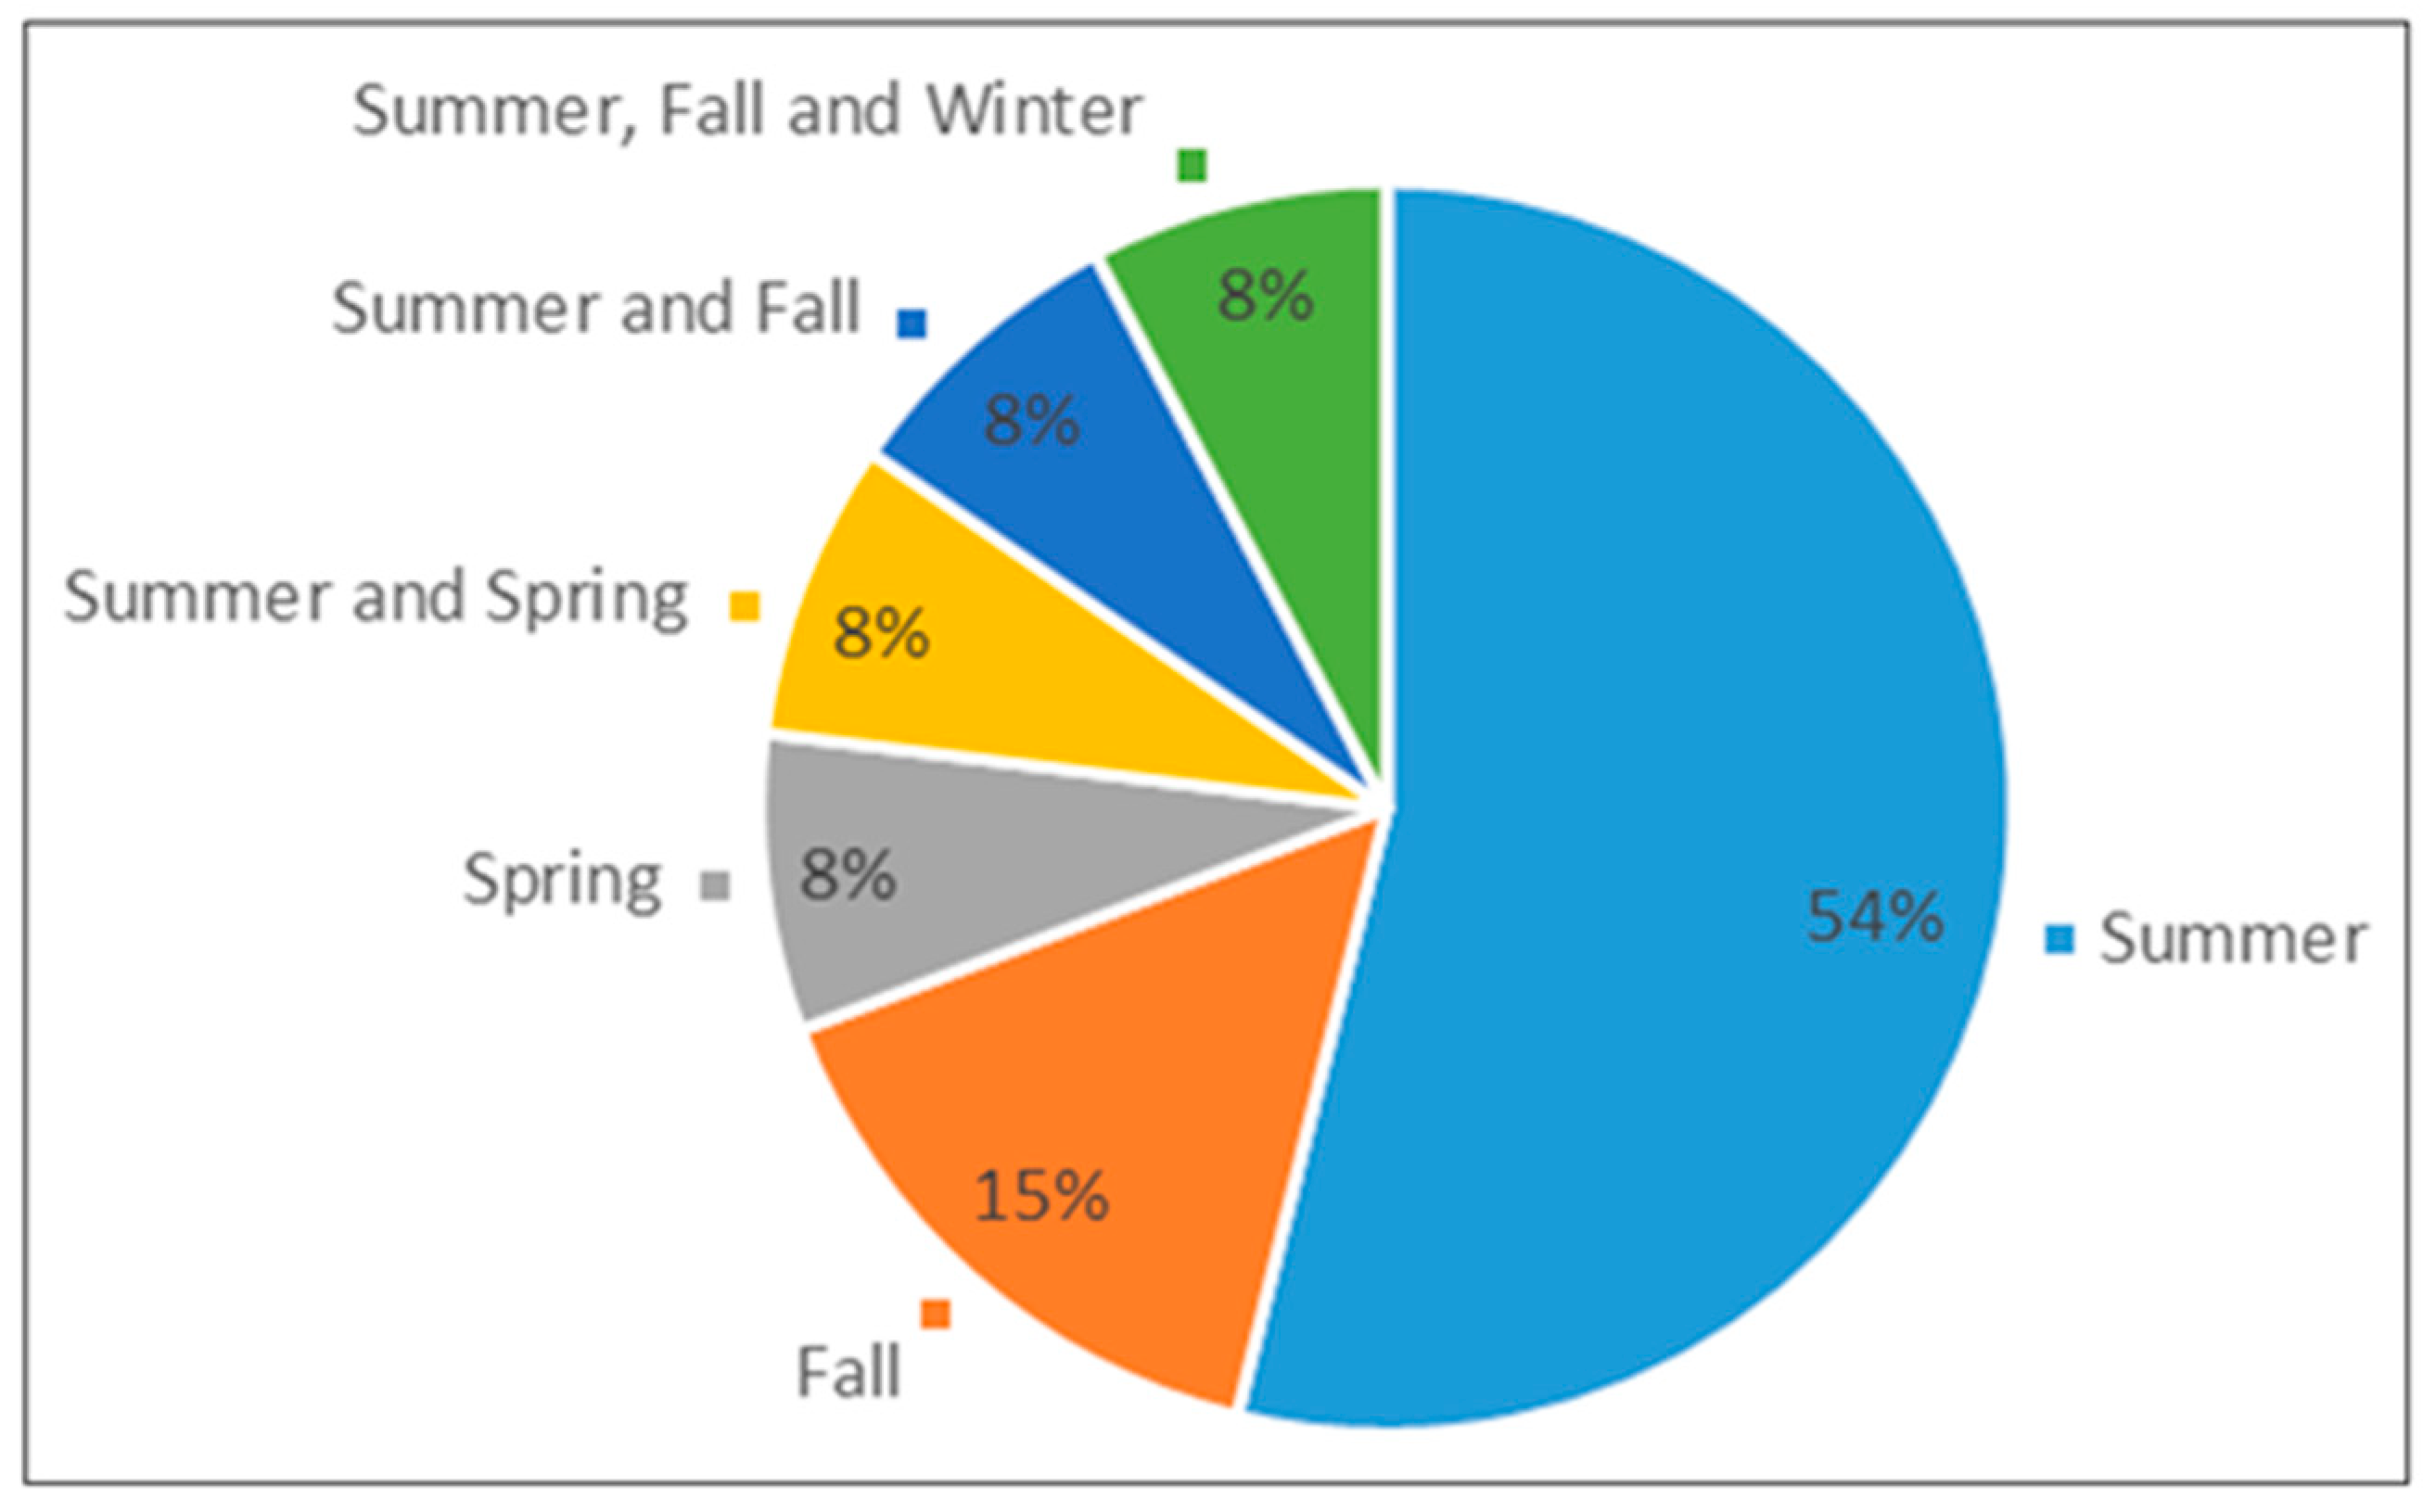
Figure 8.
Main characteristics of urban morphology used in bicycle research in the 13 papers selected. Source: Authors (2023).
Figure 8.
Main characteristics of urban morphology used in bicycle research in the 13 papers selected. Source: Authors (2023).
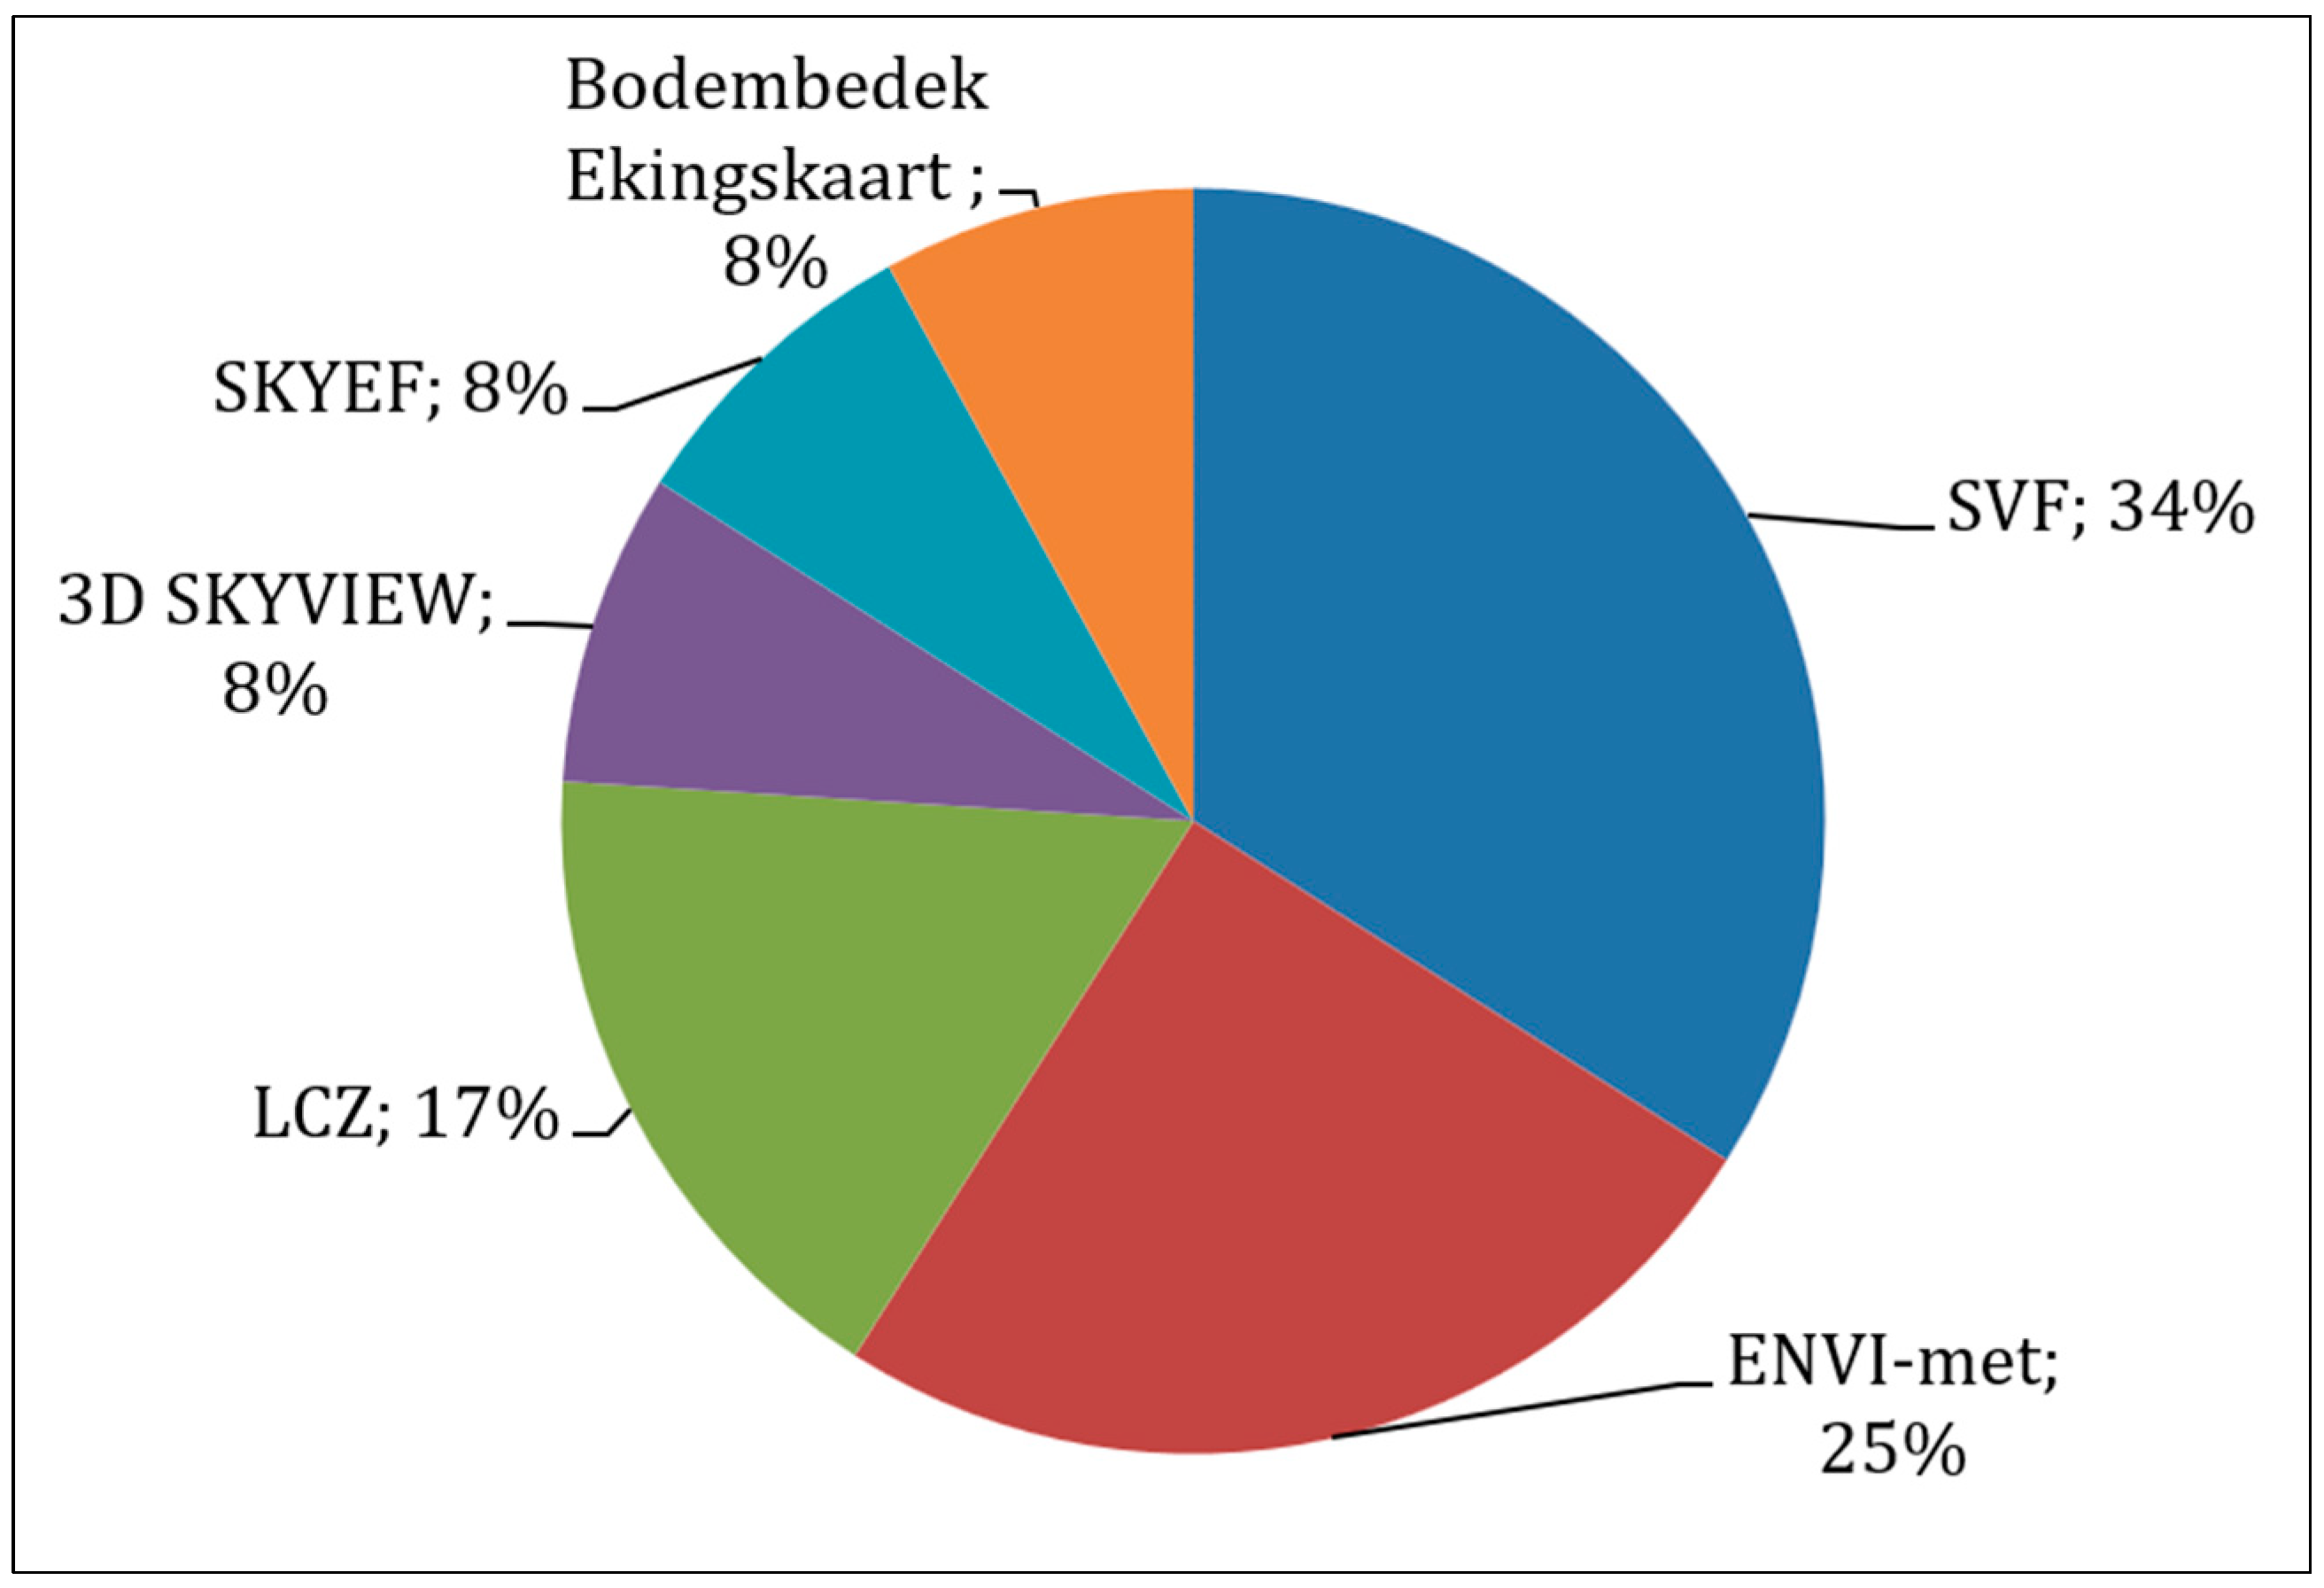
Figure 9.
Equipment attached to bicycles for mobile measurements found in some of the selected articles. A) [8], B) [29], C) [27], D) [6]. Source: Authors (2023).
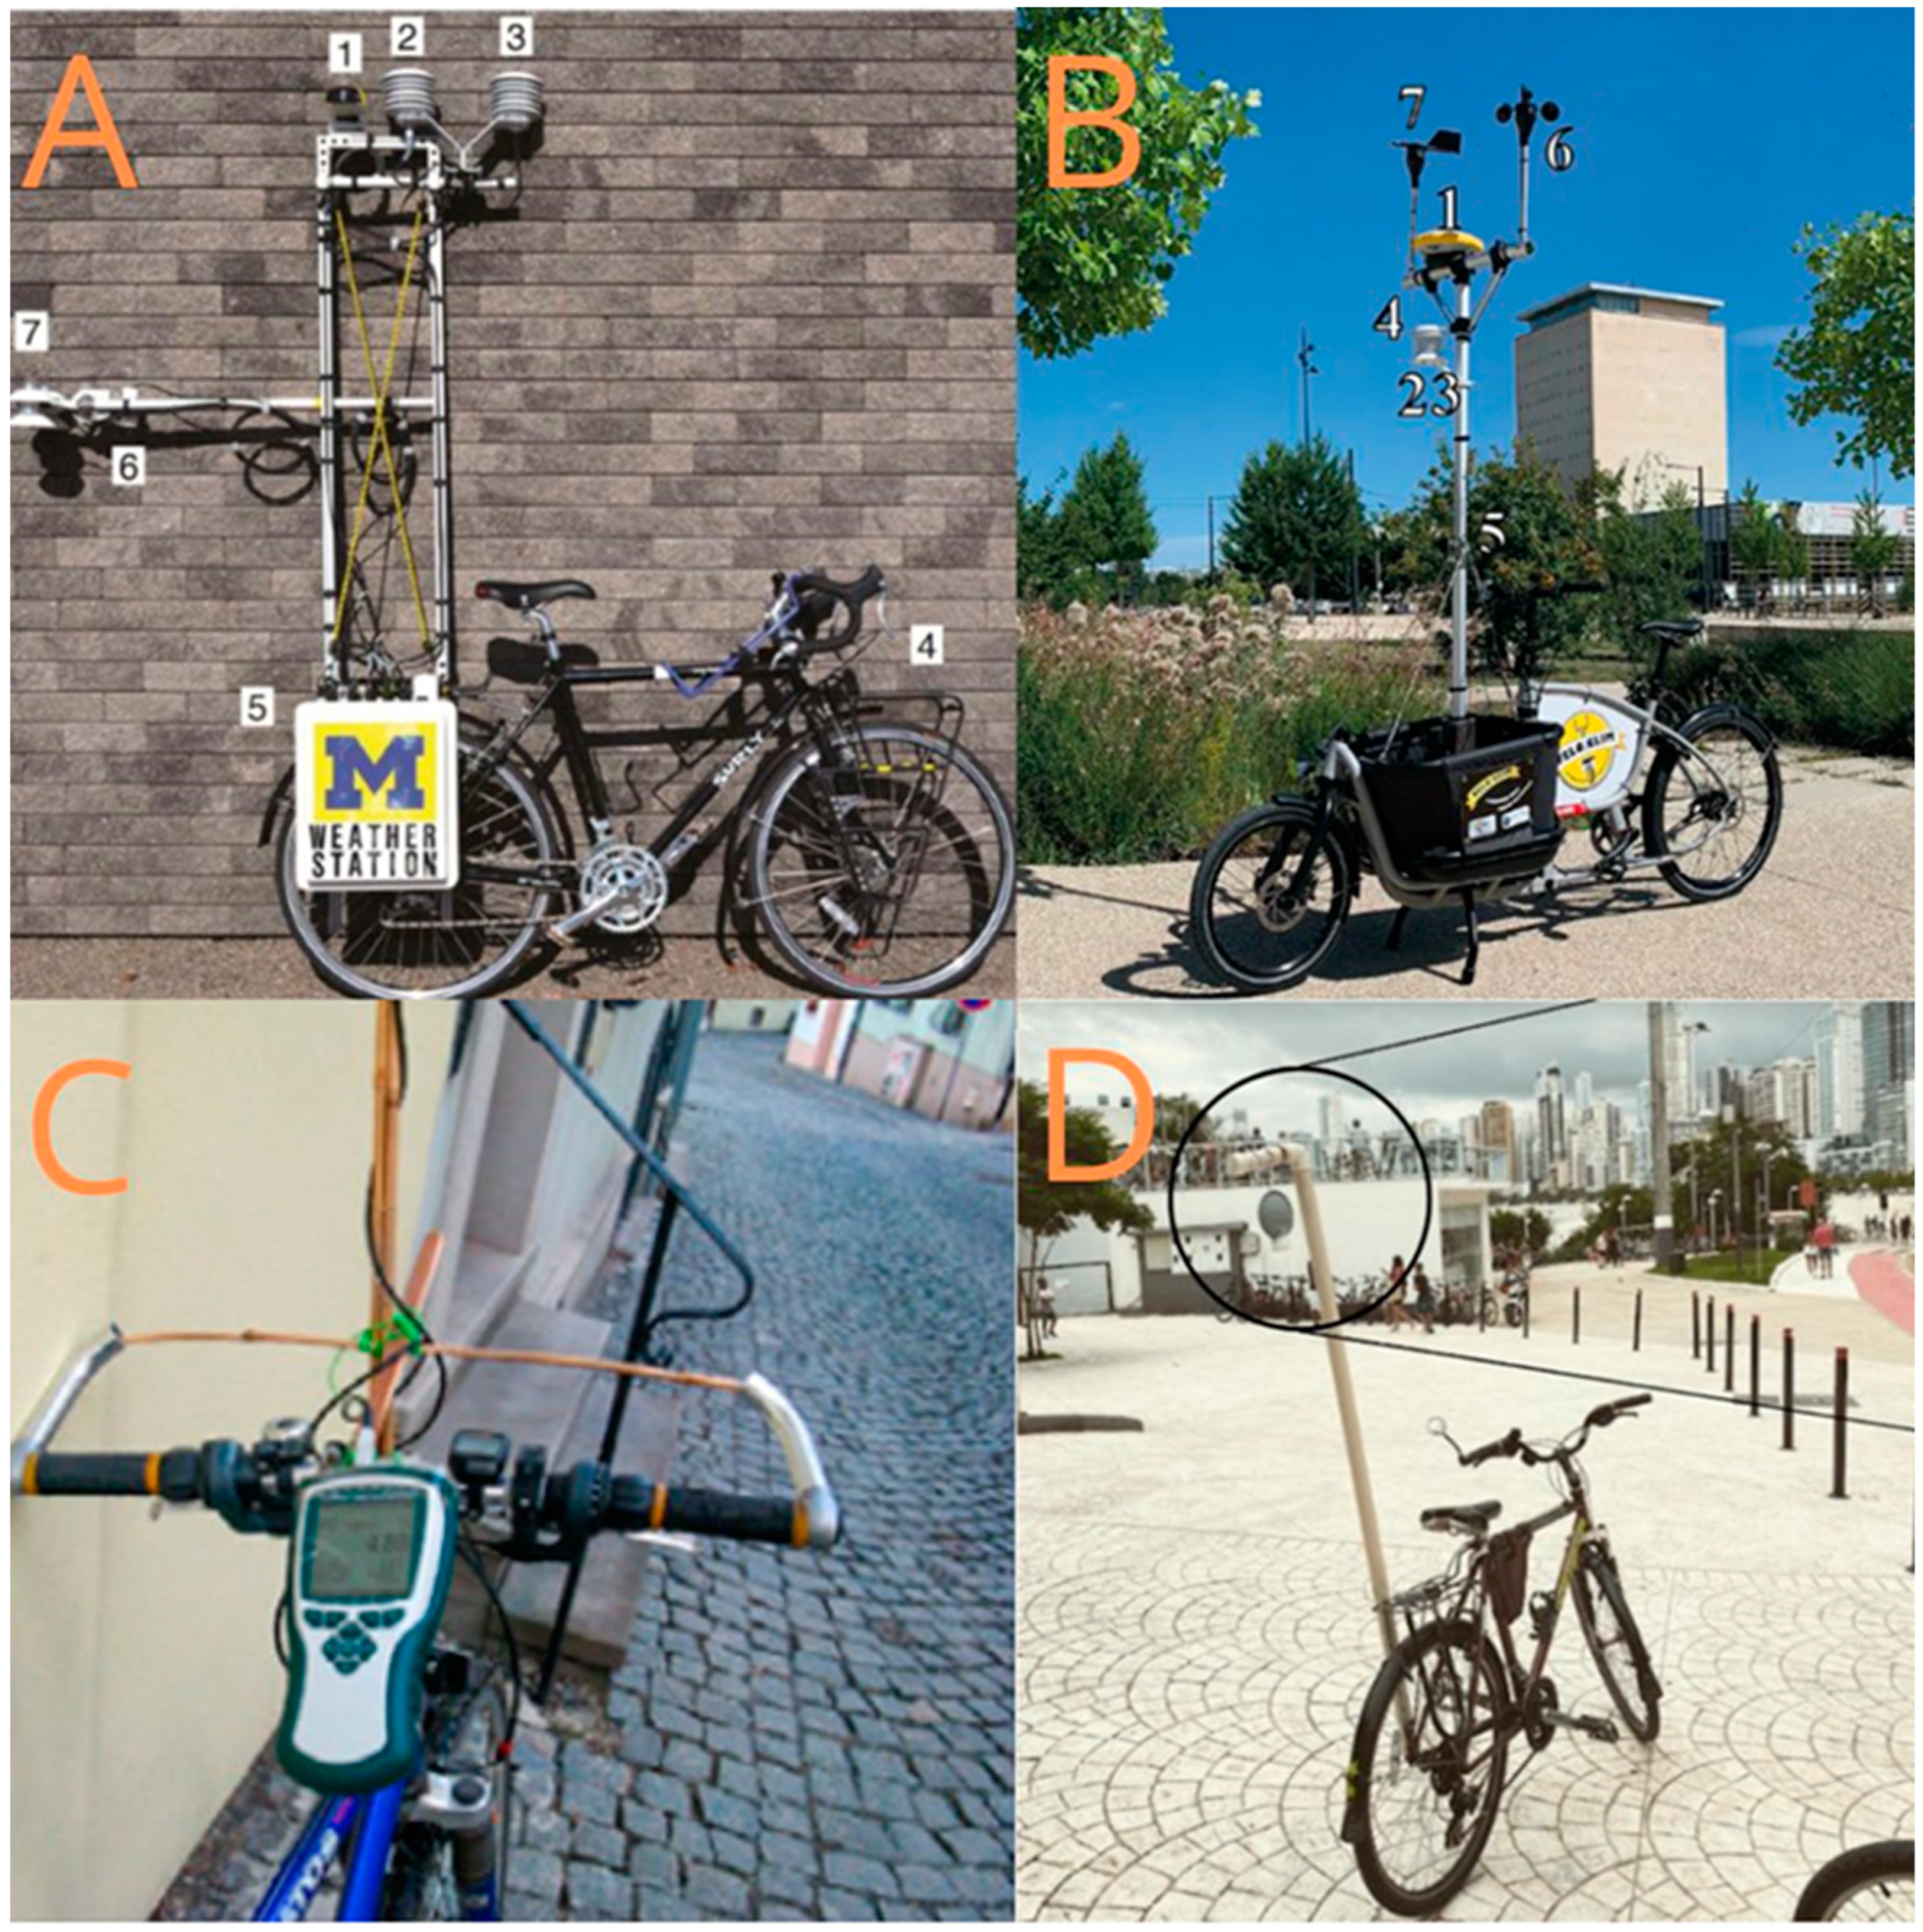

Table 1.
Articles found and selected in every platform.
| Research platform | Total articles in the first search | Selected Titles | Rejected titles |
|---|---|---|---|
| Connected Papers | 414 | 167 | 247 |
| Science Direct | 57 | 19 | 38 |
| Scopus | 7 | 7 | 0 |
| Total | 478 | 193 | 286 |
| Research platform | Total Abstract evaluated | Selected Abstracts | Rejected Abstracts |
| Connected Papers | 167 | 149 | 18 |
| Science Direct | 19 | 2 | 17 |
| Scopus | 7 | 6 | 1 |
| Total | 193 | 157 | 36 |
| Research platform | Articles selected for full reading | % for full reading | |
| Connected Papers | 10 | 24,15% | |
| Science Direct | 1 | 1,75% | |
| Scopus | 2 | 28,57% | |
| Total | 13 |
Table 2.
Collection of main data from the 13 articles.
| Author/Year | Country | Continent | Climate | Objectives | Seasons | Day/Period | Collection/Days | Methods in the Urban |
|---|---|---|---|---|---|---|---|---|
| Chow et al (2011) |
USA | America | BWh | Cooler Island | Fall | Day | 1 day | Envi-Met SVF 3D SkyView |
| Drach et al (2014) |
Brazil | America | Am | Thermal Comfort | Summer | Day | 16 days | SVF Envi-Met |
| Klemm et al (2015) | Netherlands | Europe | Cfb | Thermal Comfort | Summer | Day and Night | 2 day | Many methods |
| Rajkovich et al (2016) |
USA | America | Dfa | Temperature | Summer | Day | 1 day | SVF |
| Nastos et al (2017) | Greece | Europe | Csa | Thermal Comfort | Summer | Day and Night | 1 day | Envi-Met |
| Lenhert et al (2018) | USA | Europe | Cfb | Temperature | Fall, Summer and Winter |
Day and Night | 16 days | LCZ |
| Alonso et al (2020) | France | Europe | Cfb | Temperature | Summer | Day | 4 days | Many methods |
| Emery et al (2021) | France | Europe | Cfb | Temperature | Spring and Summer | Night | 33 days | LCZ |
| Kim et al (2022) |
South Korea | Asia | Dwa | Thermal Comfort | Fall | Day | 2 days | PET SKYEF |
| Writzl et al (2022) | Brazil | America | Cfa | Thermal Comfort | Summer | Day | 1 day | SVF LCZ |
| Croce et al (2022) |
Italy | Europe | Dfb | Heat Island | Spring | Day | 60 days | Gateway LoRaWAN EDP |
| May et al (2023) |
USA | America | Csc | Cooler Island | Summer and Fall | Day | 90 days | Many methods |
| Viejira et al (2023) | Belgian | Europe | Cfb | Temperature | Summer | Night | 2 days | Bodembedek Ekingskaart (BBK) |
Disclaimer/Publisher’s Note: The statements, opinions and data contained in all publications are solely those of the individual author(s) and contributor(s) and not of MDPI and/or the editor(s). MDPI and/or the editor(s) disclaim responsibility for any injury to people or property resulting from any ideas, methods, instructions or products referred to in the content. |
© 2023 by the authors. Licensee MDPI, Basel, Switzerland. This article is an open access article distributed under the terms and conditions of the Creative Commons Attribution (CC BY) license (http://creativecommons.org/licenses/by/4.0/).
Copyright: This open access article is published under a Creative Commons CC BY 4.0 license, which permit the free download, distribution, and reuse, provided that the author and preprint are cited in any reuse.


