Submitted:
23 December 2023
Posted:
26 December 2023
You are already at the latest version
Abstract
Multi-channel and multi-parameter near-infrared spectrometers (NIRS) have gradually become a new research direction and hot spot due to their ability to provide real-time, continuous, comprehensive indicators of multiple parameters. However, multi-channel and multi-parameter detection may lead to crosstalk between signals. There is still a lack of benchmarks on the evaluation of reliability, sensitivity, stability and response consistency of the NIRS instrument. In this study, a set of test methods (the ink drop test, multi-channel crosstalk test and multi-parameter crosstalk test) for analysis crosstalk and verifying the reliability of NIRS were conducted to test experimental verification on a multi-channel (8-channel), multi-parameter (4-parameter) NIRS instrument independently developed by our team. Results show that these tests can be used to analyze the signal crosstalk and verify the reliability, sensitivity, stability and response consistency in the NIRS instrument. This study contributes to the establishment of benchmarks for the NIRS instrument crosstalk and reliability testing. These novel tests have the potential to become the benchmark for the NIRS instrument reliability testing.
Keywords:
near-infrared spectroscopy
; crosstalk analysis
; multi-channel
; multi-parameter
; multi-wavelength
1. Introduction
Near-infrared spectrometers (NIRS) has become a valuable tool as a noninvasive analytical technique in the field of human–computer interfaces, medical diagnosis, and treatment in recent decades [1,2,3,4]. Near-infrared light can be transmitted to the deep layers of human tissues. NIRS detects changes of multiple physiological parameters in human body by detecting the optical density of these tissues [5,6]. It has several advantages, including the use of low cost, silent, transportable/portable instrumentation, and the possibility to move freely during the measurements [7,8,9]. NIRS with multi-channel and multi-wavelength is gradually being widely developed and applied due to its advantage of providing more signals and information [10,11,12,13,14,15,16,17].
Meanwhile, the crosstalk problem of multi-channel and multi-wavelength NIRS instruments has drawn more and more attention, which has led to many hardware design solutions and algorithm solutions to reduce NIRS crosstalk. Crosstalk between channels or wavelengths of NIRS instruments can be effectively reduced by properly designing the layout of the printed circuit board (PCB) [18,19]. The essence of crosstalk is a kind of energy transfer between adjacent traces. The degree of crosstalk is inversely proportional to the line spacing. In order to improve signal quality and reduce crosstalk between signals during wiring, the distance between traces should be widened as much as possible during design [20,21,22,23]. When drawing PCB lines, try to use 45-degree fold lines and avoid sharp angles and 90-degree fold lines. Folding can reduce the radiation of high-frequency signals. Critical transmission lines should be short and thick. The wiring of adjacent layers should be as vertical as possible. Coupling is easy to occur when they are parallel. When dealing with clock circuit wiring, try to make the wiring from the clock output to the clock input of the device as straight and short as possible. Parasitic parameters caused by long wiring will affect the output waveform. Reasonable layout and wiring make the instrument highly reliable. As to the algorithm solutions to reduce NIRS crosstalk, the existing blood oxygen parameters are calculated from the original data through the Lambert-Beer's law formula, and some parameters in this process, such as the differential pathlength factor (DPF) [24,25]. DPF is not a definite value. Since DPF estimation requires photon time-of-flight information [26], DPF is first assumed in continuous wave NIRS. Importantly, errors in DPF spectra can cause hemoglobin crosstalk [27], which is detrimental to fNIRS. There are studies suggesting relying on multi-range high-density measurements to estimate subject-specific DPF spectral dependence [28]. This reduces hemoglobin crosstalk in high-density recordings.
As the physiological signal of human tissue is very weak, the monitoring system needs high sensitivity and minimization of the interference into it. Crosstalk is an important part of the interference signal. In the previous reports [29,30,31] on NIRS instrument that independently developed by the team, the test standards for crosstalk, sensitivity and reliability are different, and the test indicators and schemes are not unified. This makes there is a hindrance to paper review and significantly reduces the paper's credibility, impact, and reproducibility. Therefore, it is necessary to develop a set of tests for evaluating the sensitivity, stability and reliability of NIRS instrument.
In this study, the ink drop test, multi-channel crosstalk and multi-parameter crosstalk test were introduced. And an 8-channel, 4-wavelength NIRS instrument developed by our team was used to demonstrate the details and results of the set of tests. The results shown the degree of reliability, sensitivity, stability and response consistency of the test instrument. This study contributes to the establishment of benchmarks for NIRS instrument crosstalk and reliability testing. It has the potential to become the benchmark for NIRS instrument reliability testing.
2. Materials and Methods
The ink drop test, multi-channel crosstalk test and multi-parameter crosstalk test were designed to evaluate the reliability of the test instrument. Here, a multi-channel (8 channels), multi-wavelength (4 wavelengths) functional near-infrared spectrometer developed by our team was employed for the demonstration of a complete crosstalk test program. MATLAB (R2014a, Mathworks Company) was employed to analyze the data.
2.1. Ink Drop Test
In the ink drop test, the photons emitted by the near-infrared LEDs change in different concentrations of absorbent solutions, causing corresponding changes in the data collected, providing a means to test the reliability, sensitivity, stability and response consistency of a system. In previous study, several materials were used to simulate the light-absorptive properties of human body. A number of substances that mimic the absorption of light by the human body were listed and compared in Table 1. Considering the availability of materials and their stability during the experiment, ink was chosen as the simulated light-absorbing substance in this study.
The photons emitted by the near-infrared LEDs in the ink drop experiments change accordingly in different concentrations of absorbent solutions, causing corresponding changes in the data collected. In order to test the reliability, sensitivity, stability and response consistency of an equipment. Magnetic stirrer (with rotor and polyethylene stirring container) was used to mix the pure black ink and pure water to obtain different concentrations of ink. Two 2.5mL sterile injection syringes were used to drop small, gradual drops of pure black ink into water. Black blackout sponge and black textile tape were used to prevent light interruption from the environment. 1000mL large beaker, 200mL small beaker were used to hold the solutions during the whole experiment. In addition, since this test is sensitive to light, therefore the influence of ambient light on the experiment should be minimized as much as possible. In this paper, optical darkroom was chosen as the experimental place while turning off all the light sources in the optical darkroom.
Figure 1 is the sketch and the scene diagram of the ink drop test. The experimental procedure was as follows: First, the first probe of the test device was wrapped with a black light-blocking sponge around a polyethylene container containing 600 ml of fresh water and ensuring that the highest point of the probe was below the surface of the water. The temperature of the magnetic stirrer was set to a constant 31°C. The container was placed on the magnetic stirrer tray. The vessel was placed on the magnetic stirrer tray and the stirring rotor was placed inside the vessel. Then, the materials used in the experiment were prepared by adding 600 ml of water to a small beaker, and then 1 ml of carbon ink was injected into the beaker using a sterile syringe and stirred well using a glass rod to obtain a 600-fold diluted solution of black ink, because the gradual change of the collected data could not be observed if the concentration of the absorbent dripped into the water was too high. Finally, the device is connected to a computer, the control page of the host computer is opened, and the software parameters such as the serial frequency are set. The device was then turned on and 1 ml of diluted carbon ink was aspirated into a polyethylene container using a syringe at 1-minute intervals. During the whole process of the experiment, the working magnetic stirrer drives the magnetic stirring rotor in the polyethylene container to carry out high-speed rotation and stirring of the liquid, so that the drops of diluted carbon ink are fully dispersed in the water. The whole process should be as gentle as possible to avoid the liquid fluctuations caused by the large fluctuations in the detection data, and then observe the upper computer to display the data curve changes until the end of the experiment. The whole experimental process lasts about ten minutes in total. The variation curves of light intensity at different wavelengths for the first channel of the test instrument and graph of the liner result for the ink drop test were plotted.
2.2. Multi-channel Crosstalk Test
For instruments with multiple channels, crosstalk between the channels is inevitable. This part of the experiment is used to test the crosstalk between the channels.
The principle of the channel crosstalk test experiment is to test the crosstalk suffered by each channel in the normal operation of other channels. The specific experimental operation was to use a black opaque sponge to cover the photosensitive detector 1, and placed a heavy object on it to ensure that the light will not enter the detector 1 outside the instrument, but the rest of the detectors were working fine. The crosstalk of each channel were calculated in turn. In the test, a laser can be chosen as a strong light source to periodically irradiate the detector 1. However, in consideration of the availability of materials and the feasibility of the experiment, here, a smartphone flash was chosen as the strong light source for the experiment. The frequency of periodically turning on and off the flash was set to 1 Hz. And the whole experiment was carried out in an optical dark room to avoid the interference of ambient light.
2.3. Multi-parameter Crosstalk Test
Compared with single-parameter instruments, multi-parameter instruments can obtain richer data and more information. Usually, in order to carry out multiple parameter measurements, it is necessary to integrate several different wavelengths of near-infrared light into the probe, and the crosstalk between parameters is essentially the influence of these different wavelengths of near-infrared light, in order to test the interference between multiple different wavelengths of near-infrared light of the instrument, the multi-parameter crosstalk test was designed in this study.
In the experimental process, this study used the ink added to the water to simulate the light through the stable environment. Firstly, a polyethylene container was prepared, then a certain amount of pure black carbon ink was added into the water and mixed well. After that, one of the probes was wrapped with a black shading cloth on the container and ensured that the whole probe was below the surface of the water. Set the test procedure to light up only the 760 nm wavelength near infrared light, let it always light up for ten minutes (600 seconds), and then turn off the 760 nm near infrared light. Only opened the second wavelength near infrared light that is the 850 nm wavelength near infrared light, also let it always light up for another ten minutes (600 seconds). According to the method in four wavelengths of the near infrared light are individually for the ten minutes of the operation of the light, and then let the test instrument control the four near infrared light in accordance with the normal collection of light up the way. In this way, after the four wavelengths of near-infrared light are individually lit for ten minutes, let the test instrument control the four near-infrared light in accordance with the normal collection of the lighting method for lighting, that is, time-sharing lighting, in the control of different wavelengths of near-infrared light at the same time as the main control circuit of the photoelectric detector to detect the data collection.
3. Results
3.1. Ink Drop Test Result
The variation curves of light intensity at different wavelengths for the first channel of the test instrument in the test is shown in Figure 2. It can be seen from the figure that, as the amount of ink added increases, the concentration of black ink in the polyethylene container initially filled with water increases, and the high-speed rotation of the rotor causes the ink to be dispersed uniformly at the moment of dropping into the container.
As shown in Figure 3, the light intensity detected by the photosensitive detector and the number of drops of ink in the solution under test show a linear relationship, indicating that the test instrument has good linearity.
3.2. Multi-channel Crosstalk Test Result
The raw channel 2 data was shown in Figure 4. During the experiment, since the excitation to the photodetector 2 is a periodic light signal, its response is also a periodic voltage signal. At the same time, all channels except channel 1 were able to detect light from the light source. The raw data of channel 1 was shown in Figure 5. The response of channel 1 is always a very small voltage signal, which is not only interfered by other channels, but also has the dark noise generated by the system itself.
In order to get the noise condition of other channels when other channels are working normally, the other seven channels were also measured according to the above scheme. Table 2 shows the mean measurement (mV) and mean square deviation (mV) results of these eight channels.
3.3. Multi-parameter Crosstalk Test Result
A plot of crosstalk at 760 nm is shown in Figure 6. The first 600 seconds of the graph is the light intensity detected by the detector when the 760 nm near-infrared light is always lit. The second 700 seconds was the light intensity of 760 nm near-infrared light detected by the detector when the microcontroller lights up according to the time-lighting mode of near-infrared light in normal operation of the test instrument.
The crosstalk situation for each wavelength of NIR light is shown in Table 3. Whether in a single wavelength light or in the normal operation of the instrument, the four wavelengths are lit at different times, the mean square error of the detected results is a very small value. The mean square deviation of the detected results is a very small value.
4. Discussion
In this study, the ink drop test, multi-channel crosstalk test and multi-parameter crosstalk test were designed to evaluate the reliability of instrument. And a 8-channel, 4-wavelength custom device was employed to demonstrate the crosstalk test program.
As shown in Figure 2, the light intensity at the four wavelengths of 760nm, 850nm, 910nm and 970nm detected by the photosensitive detector decreases in steps according to the same trend of change, and the time point of each change is the moment when the diluted ink is dripped into the container. This shows that the test instrument can reflect the change of absorbent concentration with good sensitivity. And the signals of these four wavelengths between two drops of ink are kept relatively smooth, which indicates that the test instrument has good stability. Beer-Lambert's law indicates that the amount of attenuation of light intensity is proportional to the concentration of the light-absorbing substance in the solution. Since there is a large change in the light intensity signal at the instant the ink is dropped, before it stables with stirring. In this paper, the light intensity at each wavelength when the data is stabled after each drop of ink is selected and plotted. As shown in Figure 3, the light intensity detected by the test instrument and the number of drops of ink in the solution under test show a linear relationship, indicating that the test instrument has good linearity, which means the test instrument is reliable.
According the raw data for channel 2 and channel 1 in Figure 4 and Figure 5, it can be judged that the performance of the test instrument was excellent. And its dark noise and the interference value between channels were very small, which indicated that the test instrument is reliable and stable. From the Table 2, it can be seen that the mean value of these eight channels is a very small value, which indicates that these channels will be superimposed on a very small noise signal when the other channels are working normally. These signals have a very small mean square deviation and can therefore be treated as a fixed value. During the monitoring of specific physiological parameters, it is possible to subtract the signal measured by each channel from this superimposed noise signal. The results will be more accurate by subtracting the superimposed noise from the value of the signal measured by each channel during the monitoring of specific physiological parameters.
It can be seen from the Figure 6 that both the first 600 seconds and the last 700 seconds of the detector detection results have very small fluctuations, which also verified that the instrument has excellent stability in operation. There is an obvious difference between the detector results in the first 600 seconds and the last 700 seconds, which indicates that the 760 nm NIR light is interfered by other wavelengths of NIR light. This is because the difference in detection between these two phases is a very small value compared to the intensity measured by the detector. This indicates that the crosstalk of 760 nm NIR light by other wavelengths is very small and has little effect on our actual monitoring results. As shown in Table 3, both of the mean square error and mean square deviation of the detected results whether in a single wavelength light or in the normal operation of the instrument is a small value, which indicates that the instrument maintains a very good stability in both modes of operation. In both modes, the difference in the mean value of the detector results as a percentage of the mean value is a very small value. This indicates that the four wavelengths of NIR light are not affected by the other wavelengths of NIR light in the normal operation mode, and the test instrument is reliable.
5. Conclusions
In this study, a set of experiment were designed to evaluate the reliability and crosstalk of the test instrument (the ink drop test, multi-channel crosstalk test and multi-parameter crosstalk test). And an 8-channel, 4-wavelength custom device was employed for the demonstration of a complete NIRS crosstalk test program. Results help guide the reliability, sensitivity, stability and response consistency of test instrument. This study contributes to the development of industry benchmarking for NIRS equipment. Besides, it has the potential to become the standard for the reliability, sensitivity, stability and response consistency test of NIRS instruments.
Author Contributions
Conceptualization, Z.C. and T.L.; methodology, X.L.; software, X.L.; validation, Z.C., X.C., T.L. and X.L.; formal analysis, X.L.; investigation, Z.C., X.C. and T.L.; resources, X.L.; data curation, Z.C. and X.C.; writing—original draft preparation, Z.C.; writing—review and editing, Z.C., T.L., X.C.; visualization, X.C. and Z.C.; supervision, T.L. and B.P.; project administration, T.L., P.W.; funding acquisition, T.L. All authors have read and agreed to the published version of the manuscript.
Funding
This research was funded by the Medical and Health Innovation Project (grant nos. 2021-I2M-1-042, and 2022-I2M-C&T-A-005), the Tianjin Outstanding Youth Fund Project (grant no. 20JCJQIC00230), the CAMS Innovation Fund for Medical Sciences (CIFMS) 2022-I2M-C&T-B-012 and the National High Level Hospital Clinical Research Funding (2022-PUMCH-A-071).
Institutional Review Board Statement
Not applicable.
Informed Consent Statement
Not applicable.
Data Availability Statement
Not applicable.
Conflicts of Interest
The authors declare no conflict of interest.
References
- Beć, K.B.; Grabska, J.; Huck, C.W. Principles and applications of miniaturized near-infrared (NIR) spectrometers. Chemistry (Easton) 2021, 27, 1514–1532. [Google Scholar] [CrossRef] [PubMed]
- Grassi, B.; Quaresima, V. Near-infrared spectroscopy and skeletal muscle oxidative function in vivo in health and disease: a review from an exercise physiology perspective. J Biomed Opt 2016, 21, 091313–091313. [Google Scholar] [CrossRef] [PubMed]
- Paulmurugan, K.; Vijayaragavan, V.; Ghosh, S.; et al. Brain–computer interfacing using functional near-infrared spectroscopy (fNIRS). Biosensors 2021, 11, 389. [Google Scholar] [CrossRef]
- Chen, Z.; Ji, X.; Li, T.; et al. Lateralization difference in functional activity during Stroop tasks: a functional near-infrared spectroscopy and EEG simultaneous study. Front Psychiatry 2023, 14. [Google Scholar] [CrossRef] [PubMed]
- Mancini, D. M.; Bolinger, L.; Li, H. , Kendrick, K., Chance, B.; Wilson, J. R. Validation of near-infrared spectroscopy in humans. J Appl Physiol 1994, 77, 2740–2747. [Google Scholar] [CrossRef] [PubMed]
- Li, T.; Gong, H.; Luo, Q. Visualization of light propagation in visible Chinese human head for functional near-infrared spectroscopy. J. Biomed. Opt. 2011, 16, 045001. [Google Scholar] [CrossRef]
- Quaresima, V.; Ferrari, M. Functional near-infrared spectroscopy (fNIRS) for assessing cerebral cortex function during human behavior in natural/social situations: a concise review. Organ Res Methods 2019, 22, 46–68. [Google Scholar] [CrossRef]
- Piper, S.K.; Krueger, A.; Koch, S.P; et al. A wearable multi-channel fNIRS system for brain imaging in freely moving subjects. Neuroimage 2014, 85, 64–71. [Google Scholar] [CrossRef]
- Pinti, P.; Aichelburg, C.; Lind, F.; et al. Using fiberless, wearable fNIRS to monitor brain activity in real-world cognitive tasks. JOVE-J VIS EXP 2015, e53336. [Google Scholar] [CrossRef]
- Liu, X.; Cheng, F.; Hu, S.; et al. Cortical activation and functional connectivity during the verbal fluency task for adolescent-onset depression: a multi-channel NIRS study. J PSYCHIATR RES 2022, 147, 254–261. [Google Scholar] [CrossRef]
- Wen, Y.; Qi, X.; Cui, S.; et al. A multi-channel NIRS system for prefrontal mental task classification employing deep forest algorithm. IEEE Biomed Circuits Syst Conf 2019, 1–4. [Google Scholar]
- Chou, P.H.; Yao, Y.H.; Zheng, R.X.; et al. Deep neural network to differentiate brain activity between patients with first-episode schizophrenia and healthy individuals: a multi-channel near infrared spectroscopy study. Front Psychiatry 2021, 12, 655292. [Google Scholar] [CrossRef]
- Sudakou, A.; Lange, F.; Isler, H.; et al. Time-domain NIRS system based on supercontinuum light source and multi-wavelength detection: validation for tissue oxygenation studies. BIOMED OPT EXPRESS 2021, 12, 6629–6650. [Google Scholar] [CrossRef]
- Mujumdar, R.; Cheung, M.; Kadam, S.P.; et al. Wearable Sensor for Multi-wavelength Near-Infrared Spectroscopy of Skin Hemodynamics Along with Underlying Muscle Electromyography; Springer: Cham, 2022. [Google Scholar]
- Chen, Z. , Gao, C., Li, T. et al. Open access dataset integrating EEG and fNIRS during Stroop tasks. Sci Data. 2023, 10, 618. [Google Scholar] [CrossRef]
- Holper, L.; Mitra, S.; Bale, G.; et al. Prediction of brain tissue temperature using near-infrared spectroscopy. Neurophotonics 2017, 4, 021106. [Google Scholar] [CrossRef] [PubMed]
- Myllylä, T.; Harju, M.; Korhonen, V.; et al. Assessment of the dynamics of human glymphatic system by near-infrared spectroscopy (NIRS). J Biophotonics 2017, e201700123. [Google Scholar]
- Liu, D.; Zhang, P.; Zhang, Y.; et al. A cost-effective instrument of distributed functional near-infrared spectroscopy for hyperscanning real-world interactions. IEEE Trans Instrum Meas 2023. [CrossRef]
- Afsary, N.; Uddin, M.N.; Islam, S.; et al. Elevating NIR Photonic Integration with Tantalum-Niobium Pentoxide. 2023. [Google Scholar]
- Togt, R.V.D.; Lieshout, E.J.V.; Hensbroek, R. Electromagnetic Interference From Radio Frequency Identification Inducing Potentially Hazardous Incidents in Critical Care Medical Equipment. Survey of anesthesiology 2009, 53. [Google Scholar]
- Chiba, A.; Sakamoto, T.; Kawanishi, T.; et al. Analysis of crosstalk impact on optical packet signals in an optical cross-bar switch by intensity-trimming method. Optical Fiber Communication Conference. Optical Society of America 2009. [Google Scholar]
- Jose, A.N.D.S.; Colin, A.C.P.M.; Mologni, J.F.; et al. Inductive and capacitive couplings in automotive harnesses - A crosstalk investigation. In Proceedings of the 2013 SBMO/IEEE MTT-S International Microwave & Optoelectronics Conference (IMOC), Rio de Janeiro, Brazil, 4–7 August 2013. [Google Scholar]
- Paul, C.R.; Jolly, M.B. Sensitivity of Crosstalk in Twisted-Pair Circuits to Line Twist. IEEE Trans Electromagn Compat 1982, 24, 359–364. [Google Scholar] [CrossRef]
- Zijlstra, W.G.; Buursma, A.; Meeuwsen-Van, R.W.P. Absorption spectra of human fetal and adult oxyhemoglobin, de-oxyhemoglobin, carboxyhemoglobin, and methemoglobin. Clin Chim 2023, 1633–8. [Google Scholar] [CrossRef]
- Essenpreis, M.; Cope, M.; Elwell, C.E.; et al. Wavelength dependence of the differential pathlength factor and the log slope in time-resolved tissue spectroscopy; Springer US: New York, NY, USA, 1993. [Google Scholar]
- Torricelli, A.; et al. Time domain functional NIRS imaging for human brain mapping. NeuroImage 2014, 85 (Part 1), 28–50. [Google Scholar] [CrossRef]
- Kohl, M.; Nolte, C.; Heekeren, H.R.; Horst, S.; Scholz, U.; Obrig, H.; Villringer, A. Determination of the wavelength dependence of the differential pathlength factor from near-infrared pulse signals. Phys Med Biol., 1998, 43, 1771–1782. [Google Scholar] [CrossRef] [PubMed]
- Chiarelli, A.M.; Perpetuini, D.; Filippini, C.; et al. Differential pathlength factor in continuous wave functional near-infrared spectroscopy: Reducing hemoglobin’s cross talk in high-density recordings. Neurophotonics 2019, 6, 035005–035005. [Google Scholar] [CrossRef] [PubMed]
- Lv, X.; Zheng, Y.; Li, T.; Zhang, Z.; Gong, H. A portable functional imaging instrument for psychology research based on near-infrared spectroscopy. Frontiers of Optoelectronics in China 2018, 1, 279–284. [Google Scholar] [CrossRef]
- Li, L.; Du, P.; Li, T.; Luo, Q.; Gong, H. Design and evaluation of a simultaneous fNIRS/ERP instrument. Optical Tomography and Spectroscopy of Tissue VII 2007.
- Li, T.; Li, Z.; Zhao, K.; Pan, B.; Wang, Z.; Yang, X. Reliability analysis of a mini-instrument for simultaneous monitoring water content, deep tissue temperature, and hemodynamic parameters. Microelectron Reliab 2018, 86, 72–76. [Google Scholar] [CrossRef]
Figure 1.
Ink drop test. (a) Sketch of the ink drop test. (b) Scene diagram of the ink drop test.
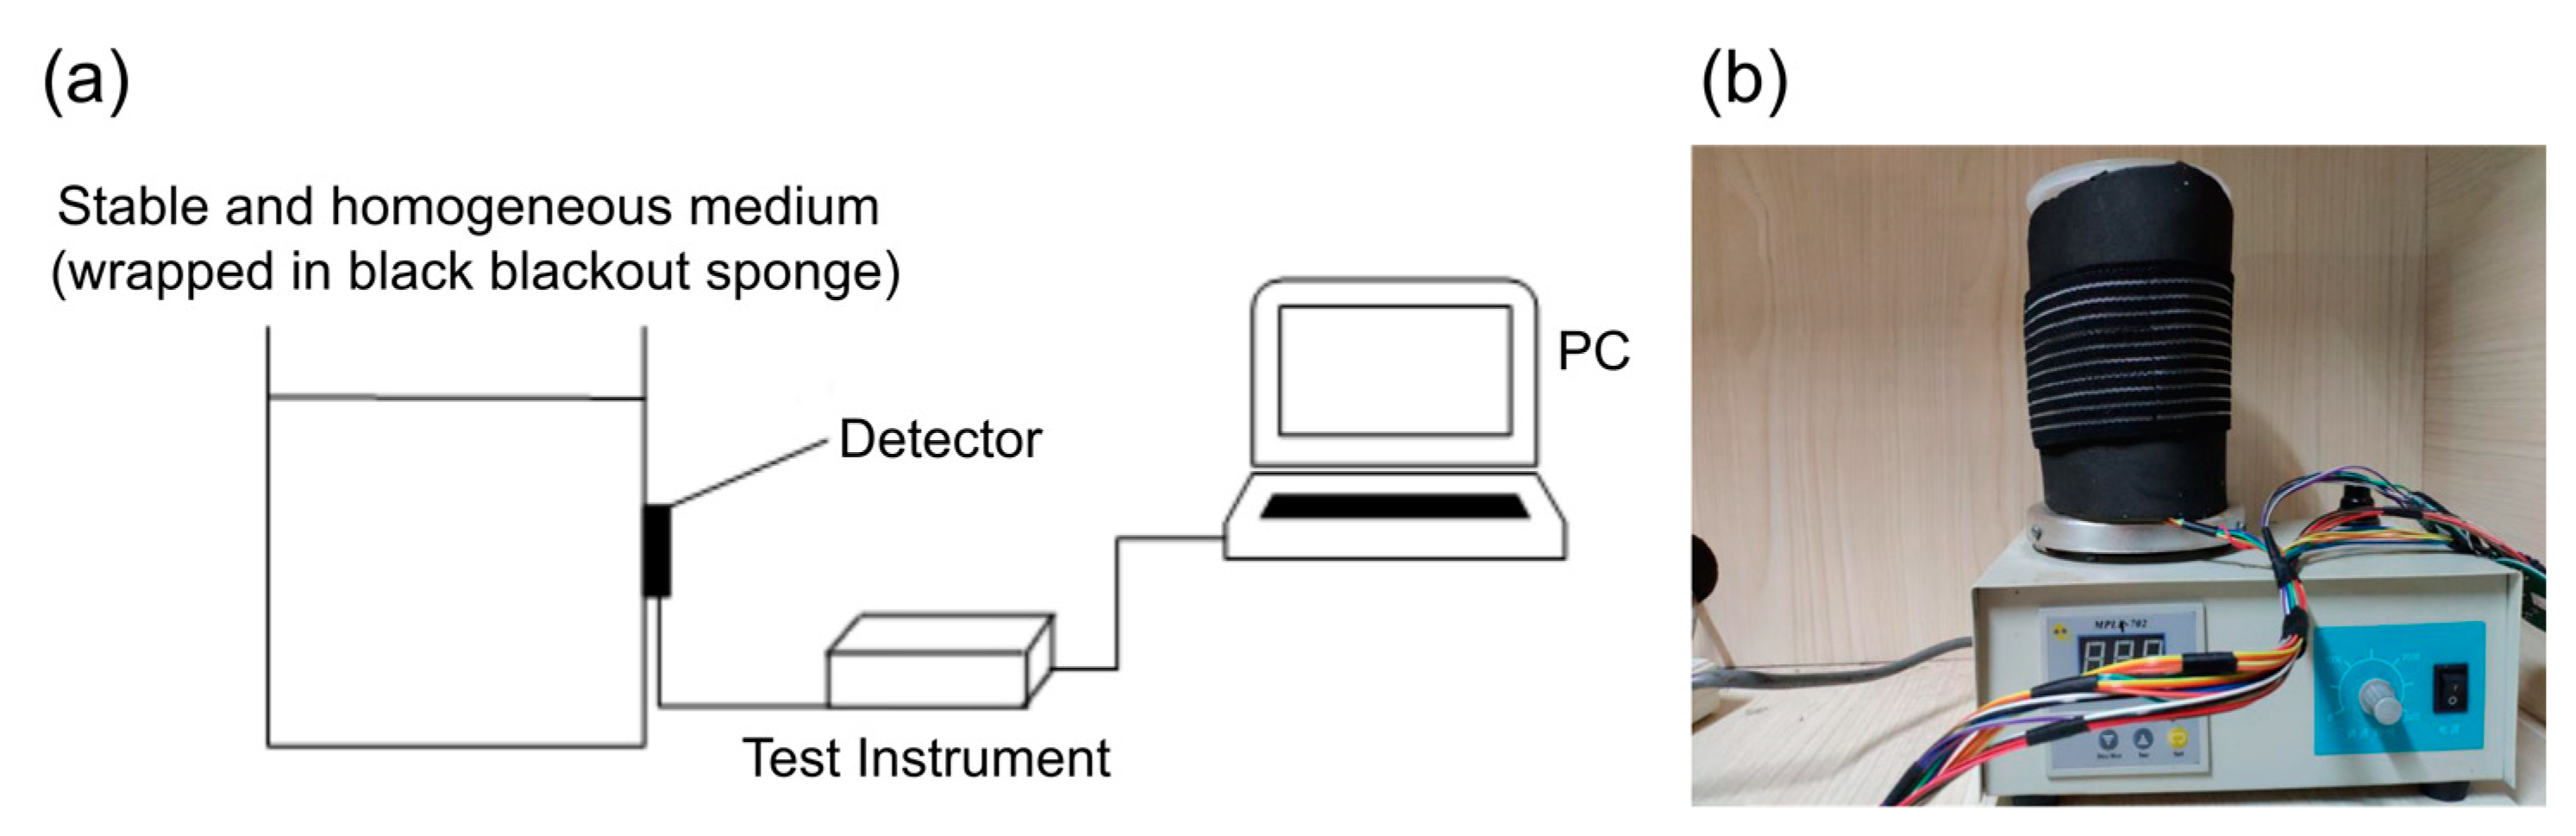
Figure 2.
Graph of the variation of light intensity at different wavelengths.
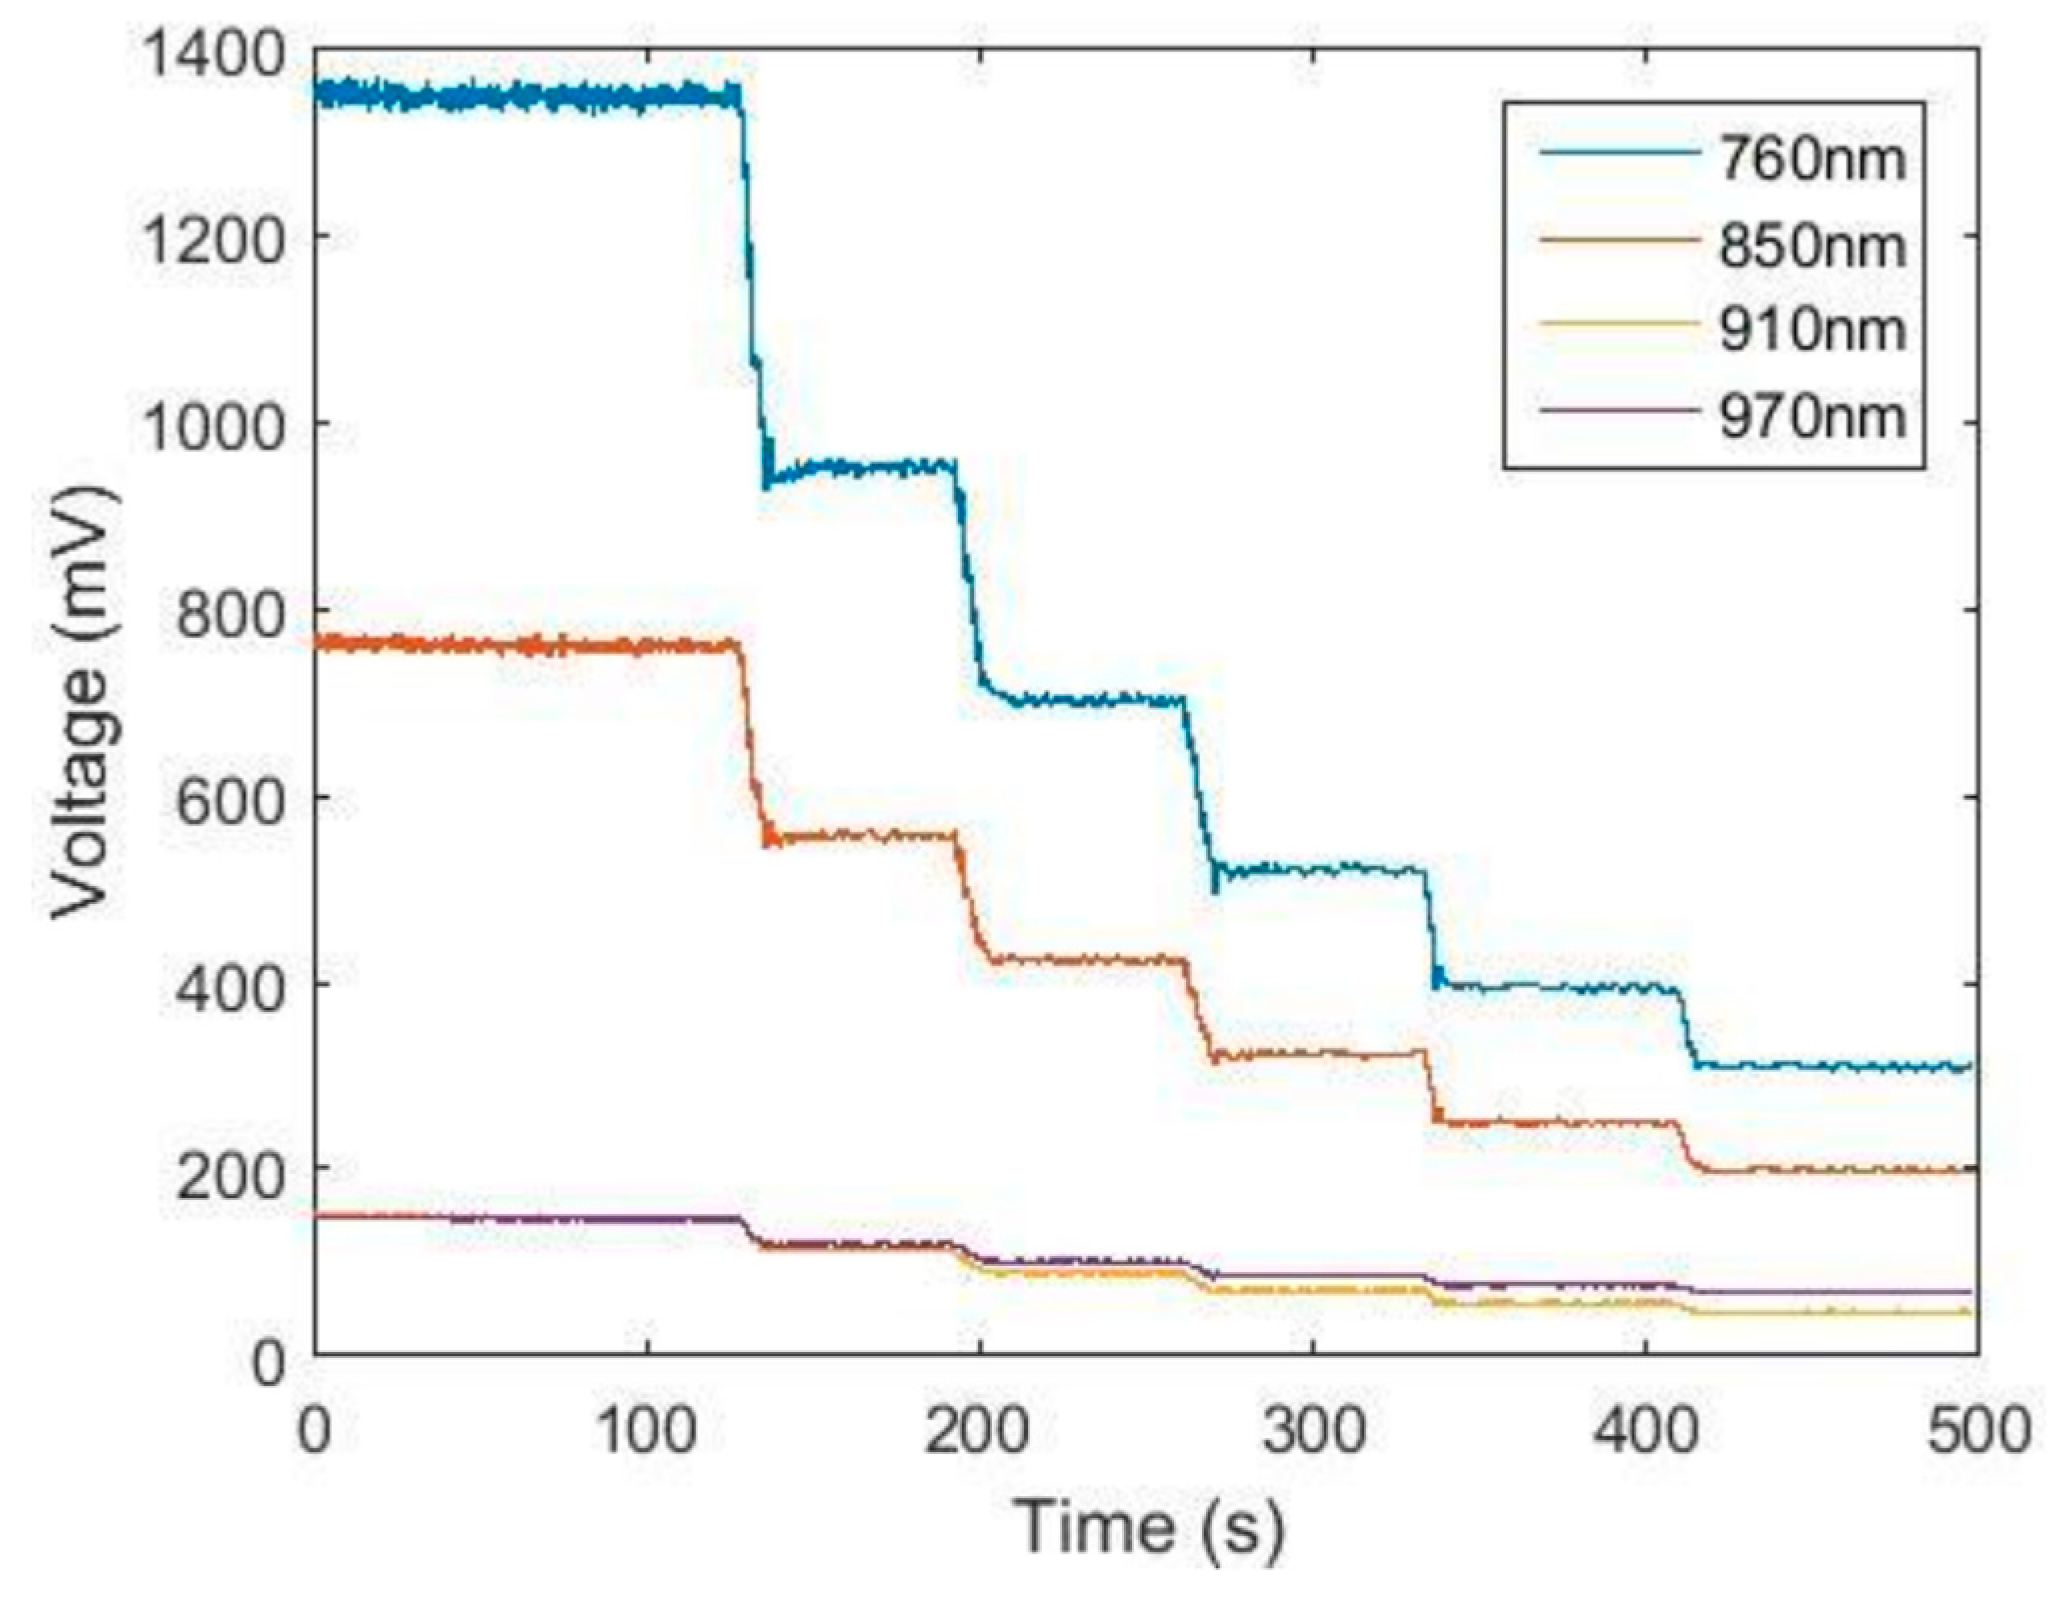
Figure 3.
Graph of the liner result for the ink drop experiment on the test equipment.
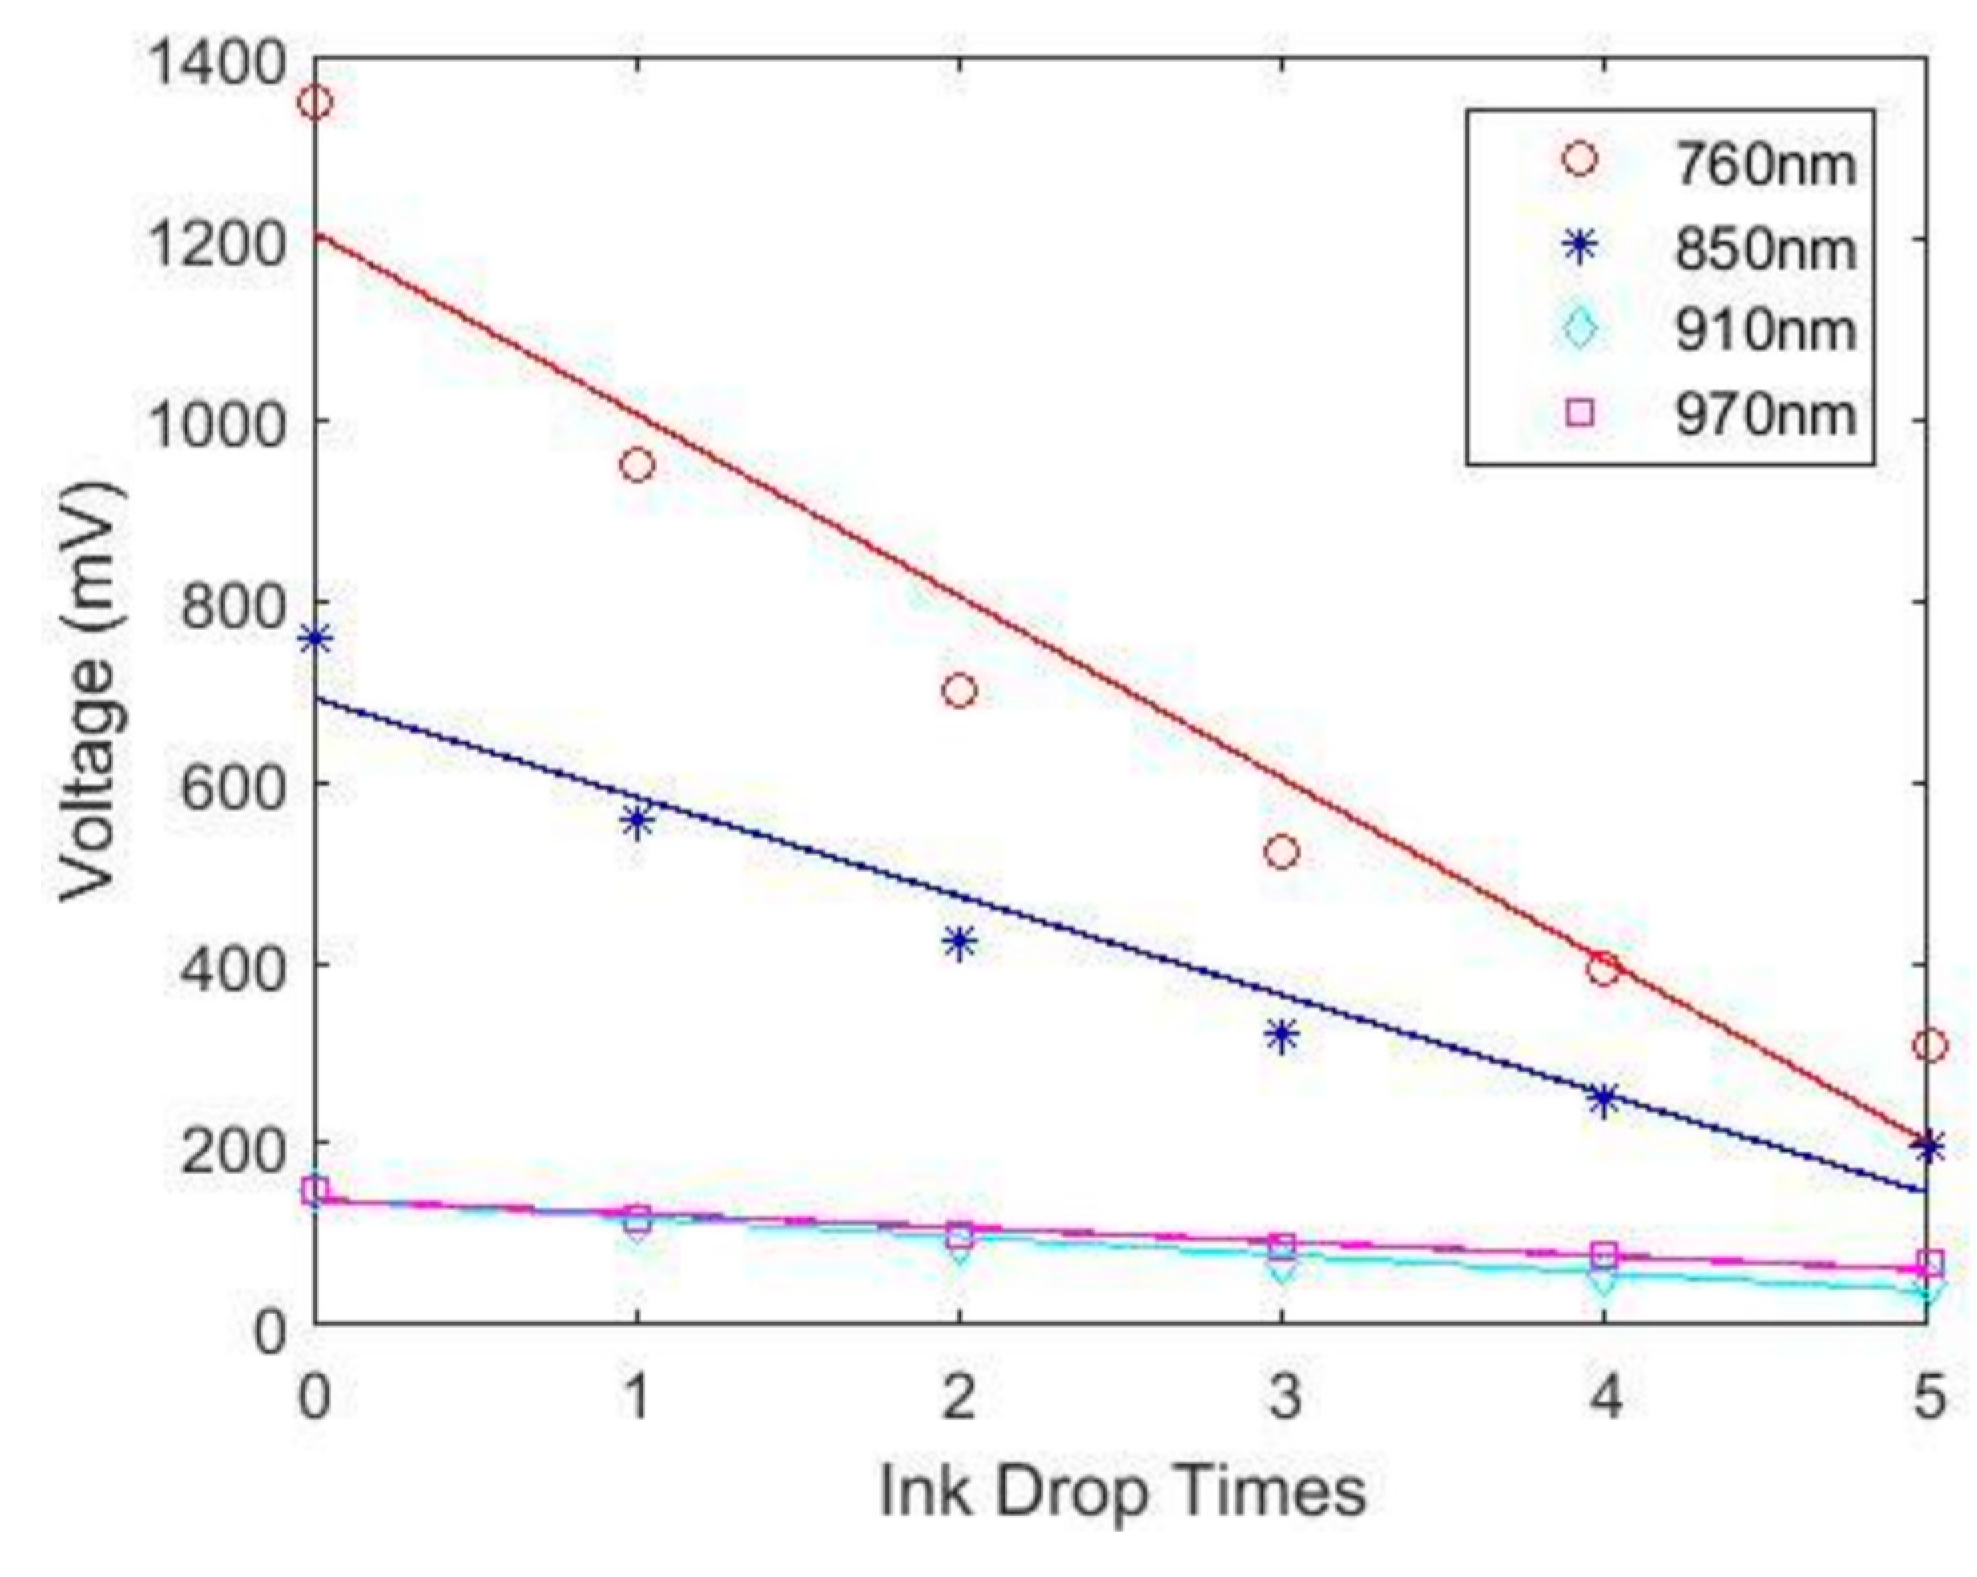
Figure 4.
Raw data for channel 2.
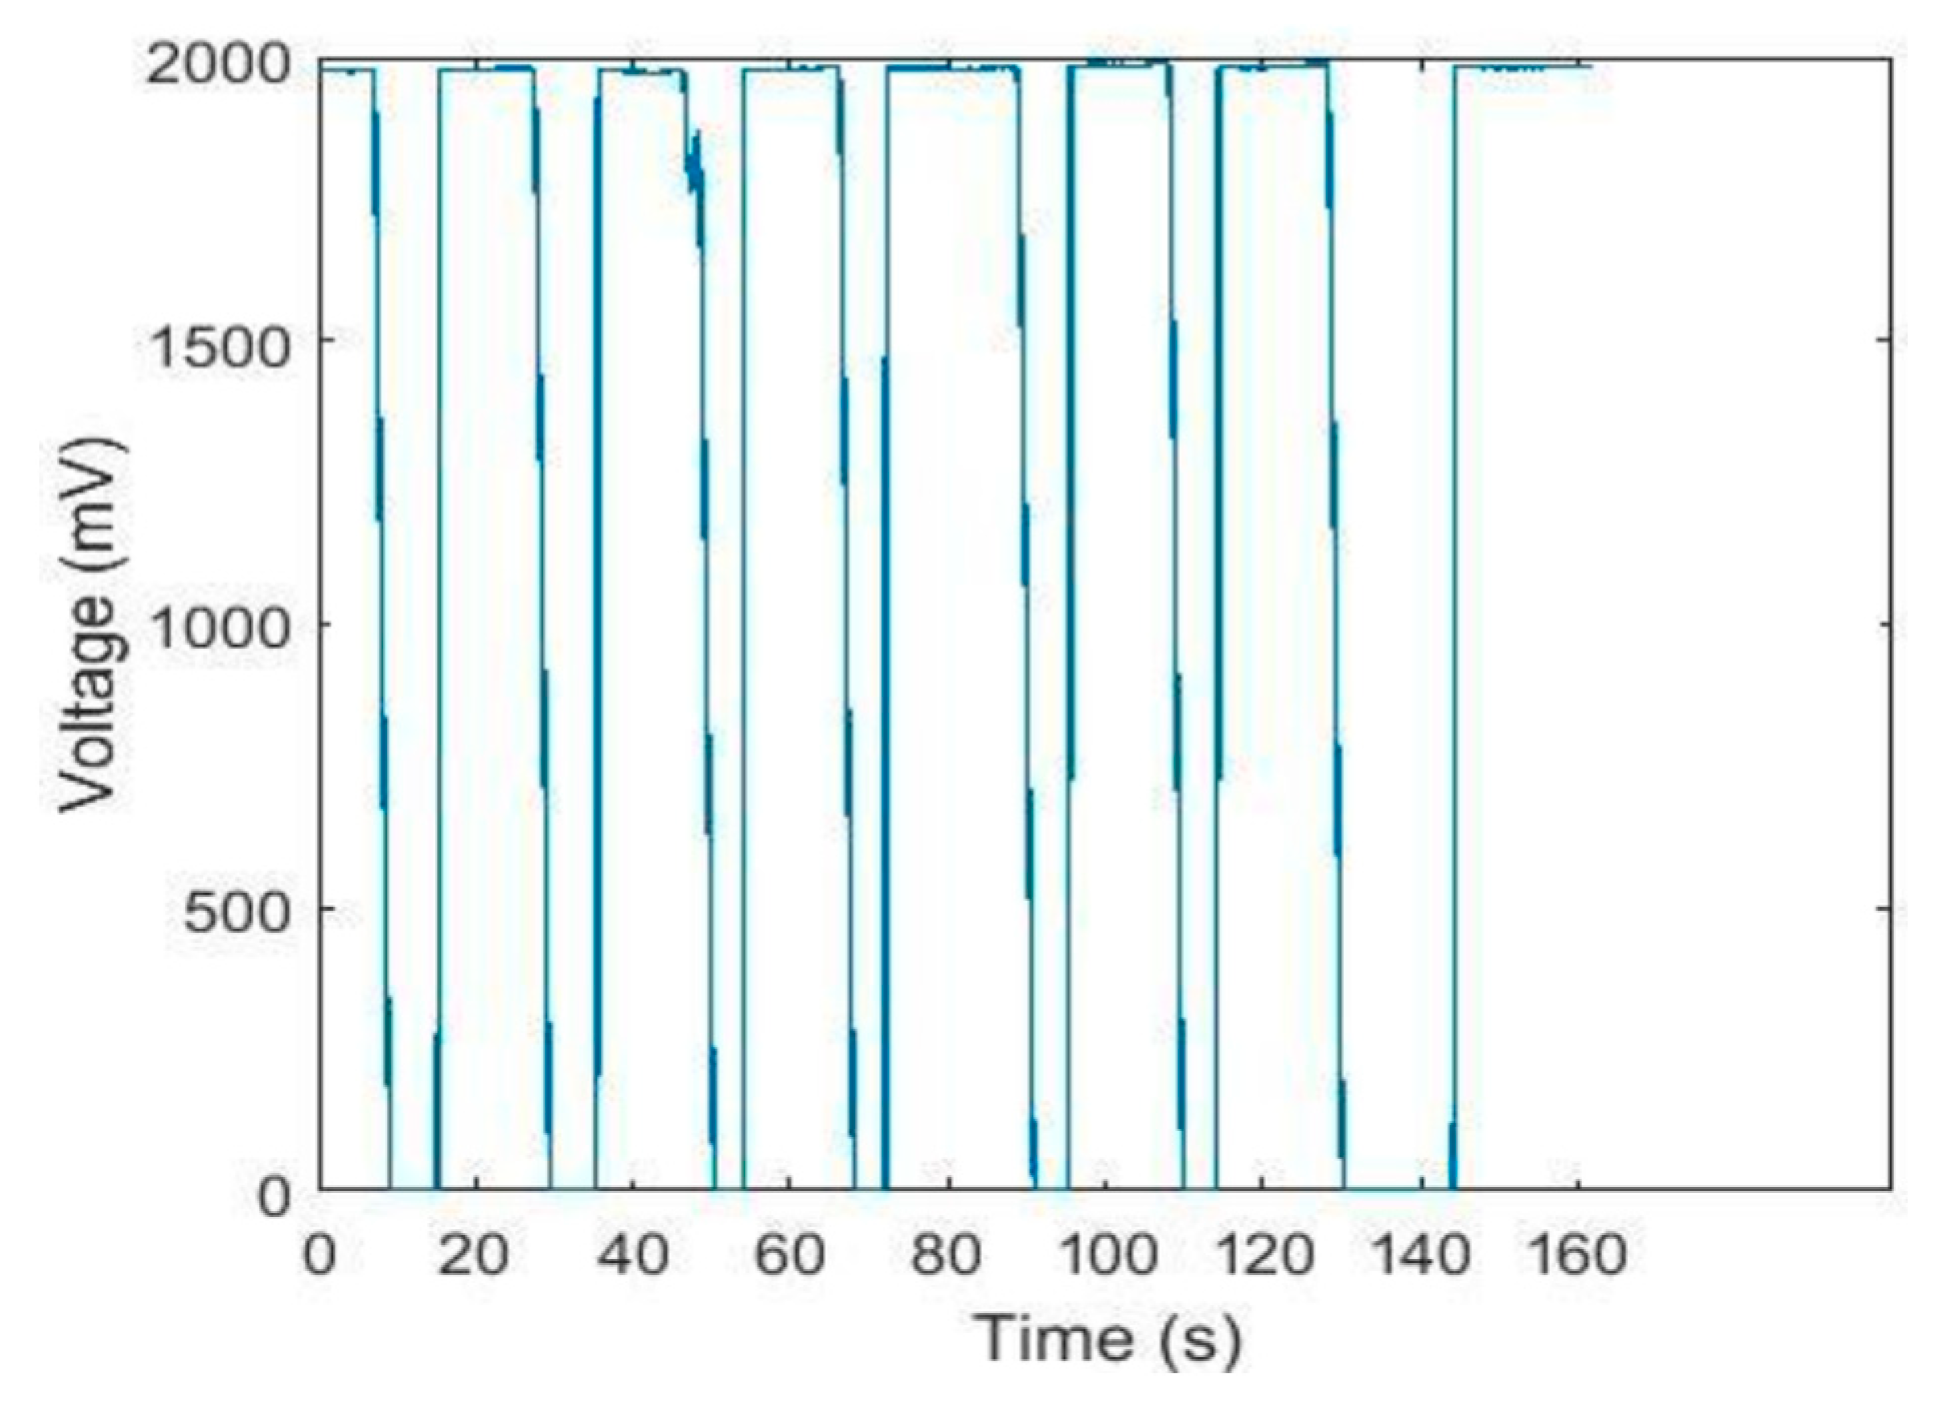
Figure 5.
Raw data for channel 1.

Figure 6.
Crosstalk test of 760 nm near-infrared light.
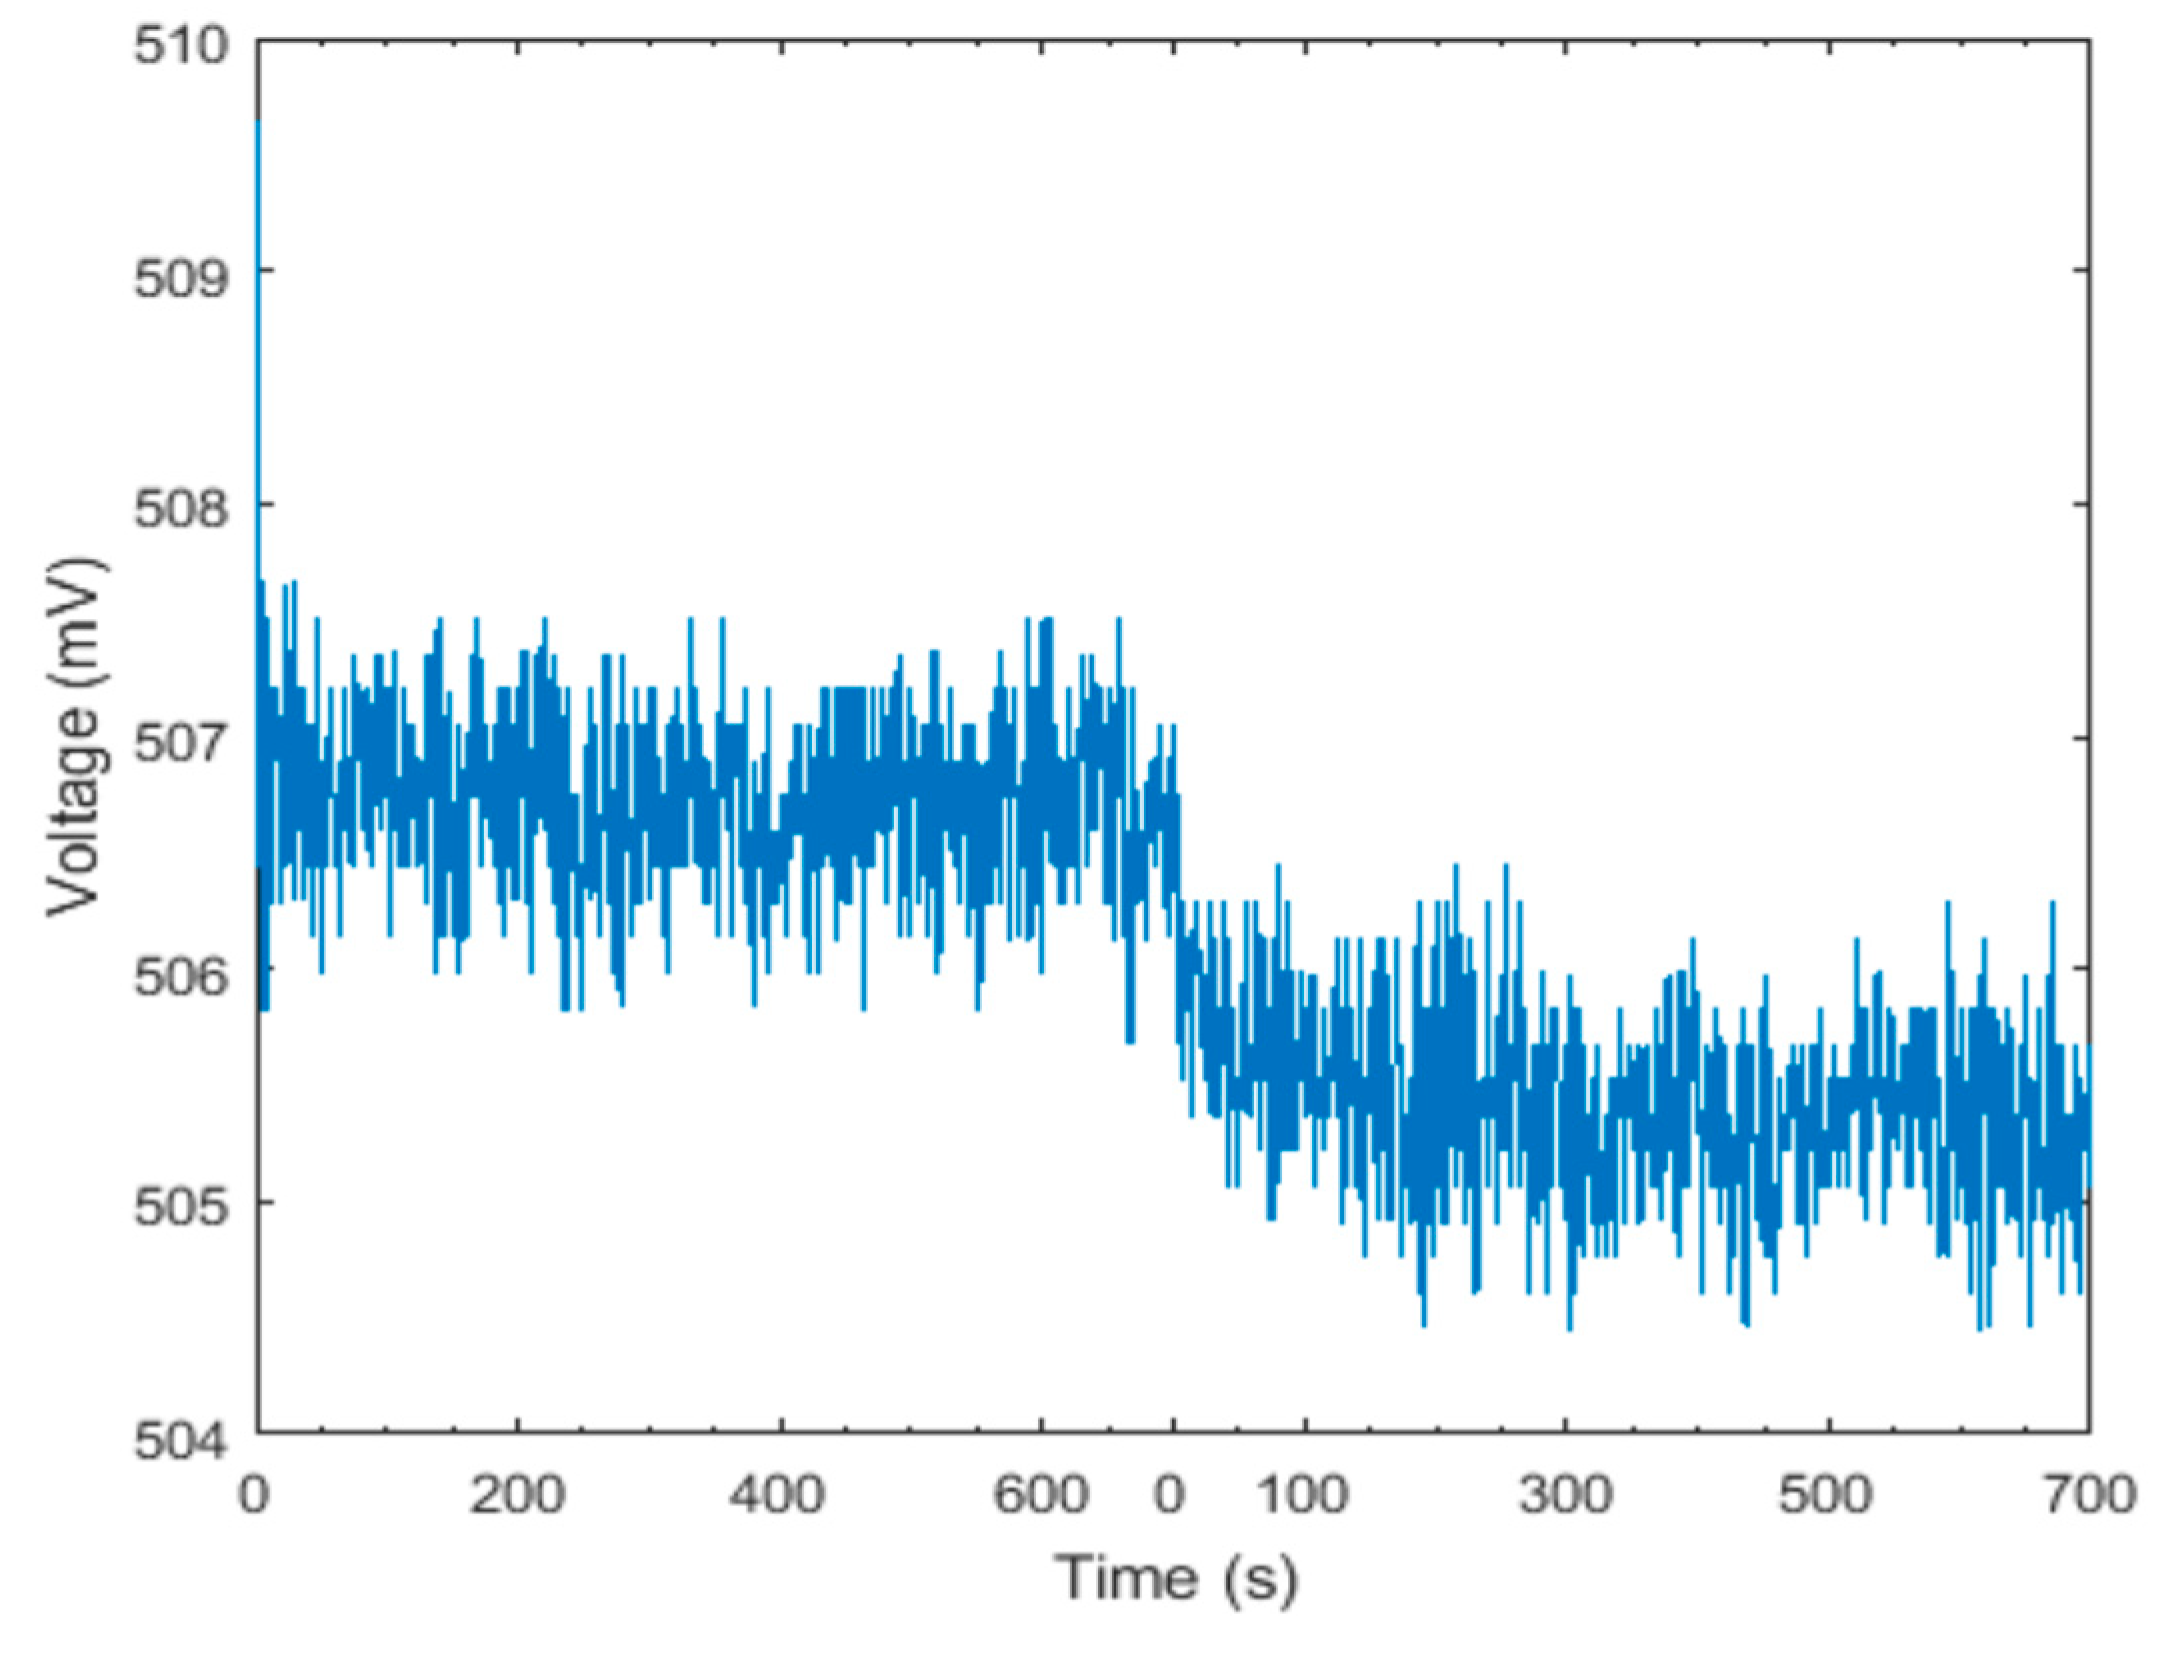

Table 1.
Comparison of light-absorbing substances that can be added to water.
| Absorbent materials | Advantages | Stability |
|---|---|---|
| Whole blood | Providing true tissue spectra and oxygenation capabilities. | Several hours |
| Fuel molecule | Providing wavelength peak information for spectra. | Several days |
| Ink | Providing monotonic absorption of the spectrum. | Several weeks |
Table 2.
Crosstalk on each channel.
| Channel | Mean (mV) | Mean Square Deviation (mV) |
|---|---|---|
| 1 | 4.128 | 0.104 |
| 2 | 3.981 | 0.099 |
| 3 | 3.932 | 0.096 |
| 4 | 3.880 | 0.098 |
| 5 | 3.964 | 0.099 |
| 6 | 3.852 | 0.104 |
| 7 | 4.192 | 0.103 |
| 8 | 3.992 | 0.103 |
Table 3.
Crosstalk on near-infrared light at various wavelengths.
| Wavelength (single wavelength always light) |
Mean (mV) |
Mean Square (mV) | Wavelength (four wavelengths light up in time) |
Mean (mV) |
Mean Square (mV) | Mean Difference |
Mean difference/Mean |
|---|---|---|---|---|---|---|---|
| 760nm | 506.724 | 0.377 | 760nm | 505.440 | 0.385 | -1.284 | -0.003 |
| 850nm | 306.756 | 0.346 | 850nm | 306.485 | 0.364 | 0.018 | 5.775e-05 |
| 910nm | 65.980 | 0.314 | 910nm | 66.113 | 0.323 | 0.008 | 1.225e-04 |
| 970nm | 81.589 | 0.323 | 970nm | 81.681 | 0.331 | 0.008 | 1.028e-04 |
Disclaimer/Publisher’s Note: The statements, opinions and data contained in all publications are solely those of the individual author(s) and contributor(s) and not of MDPI and/or the editor(s). MDPI and/or the editor(s) disclaim responsibility for any injury to people or property resulting from any ideas, methods, instructions or products referred to in the content. |
© 2023 by the authors. Licensee MDPI, Basel, Switzerland. This article is an open access article distributed under the terms and conditions of the Creative Commons Attribution (CC BY) license (http://creativecommons.org/licenses/by/4.0/).
Copyright: This open access article is published under a Creative Commons CC BY 4.0 license, which permit the free download, distribution, and reuse, provided that the author and preprint are cited in any reuse.


