Submitted:
22 December 2023
Posted:
25 December 2023
You are already at the latest version
Abstract
We report on the occurrence of natural Magnesium Alumina Silicate Hydrate (M-(A)-S-H) cement at Feragen and Leka in eastern and western Trøndelag Norway, respectively. Both occurrences are located in the sub-arctic climate zone and form in glacial till and moraine material deposited on ultramafic rock during the Weichselian glaciation. Weathering of serpentinized peridotite dissolve brucite and result in a relative high pH alkaline fluid that subsequently reacts with the felsic minerals of the till (quartz, plagioclase, K-feldspar) to form a cement consisting of an amorphous material or a mixture of nanocrystalline Mg-rich phyllosilicates, including illite. The presence of plagioclase in the till results in the enrichment of alumina in the cement, i.e., forms M-A-S-H instead of the M-S-H cement. Dissolution of quartz results in numerous etch-pits and negative quartz crystals filled with M-A-S-H cement. Where the quartz dissolution is faster that the cement precipitation, a honeycomb-like texture is formed. Compositionally the cemented till (tillite) contains more MgO and has a higher loss of ignition than the till, suggesting that the cement is formed by a MgO fluid that previously reacted with the peridotite. The M-(A)-S-H cemented till represent a new type of duricrust, coined magsilcrete. The study of natural Mg-cement provides information on peridotites as a Mg-source for Mg-cement and as a feedstock for CO2 sequestration.
Keywords:
Serpentinization
; weathering
; CO2 sequestration
; Feragen and Leka ultramafic complexes
; brucite
; natural (M-(A)-S-H) cement
; duricrust
1. Introduction
Portland cement production contributes c. 8% of the annual anthropogenic CO2 release [1], albeit some of the CO2 is recaptured over time. The technology for producing the magnesium analog by calcination of magnesite (MgCO3) has been available for a century but is even more energy consuming and as well hampered by a high CO2 release [2]. The search for a CO2 neutral or CO2 consuming cement has been focused on the Mg-system [2,3] and hydrated magnesium carbonate (HMC) and magnesium silica hydrates (M-(A)-S-H) are two promising candidates. The HMC cement consist of the hydrocarbonates – hydromagnesite, nesquehonite, landsfordite, dypingite and artenite. Hydrocarbonate formation are also reported from many ultramafic complexes [4,5] and notably Wilson et al. [6] and Power et al. [7] demonstrate that hydrocarbonate can act as a cement by stabilize mine-tailings. Hydration reaction of magnesium oxide and silica produces magnesium silicate hydrate (M-S-H), which provides binding characteristics like Portland cement binder [8]. The formation of magnesium silicates hydrate has been observed at the interfacial zone of cement-based materials in contact with clays [9] and/or as secondary products from the degradation of cementitious materials by groundwater or seawater [10]. M-S-H cement also form in nature. de Ruiter and Austrheim [11] report tillite cemented by M-S-H and Nisiki et al. [12] describes M-S-H formed on ultramafic rocks by seepage with high activity of Si. Experimentally the presence of aluminum leads to the formation of M-A-S-H where Al3+ can replace Mg2+ in the octahedral sites and Si4+ in the tetrahedral positions [13]. The performance and properties of M-S-H cement may be improved by adding Al [14]. Natural M-A-S-H cement has to our knowledge not previously been recorded.
Magnesium cement has several advantages over Portland cement, in addition to being CO2 neutral. It forms at a lower pH than Portland cements and is a promising matrix for storage of nuclear waste [15,16]. According to Bernard [17] binders containing M-S-H also have good mechanical properties, dense microstructure and potentially good resistance to leaching. Thus M-S-H is currently of interest as an environmentally friendly alternative to Portland cement due to its potentially lower carbon footprint [2] and for the encapsulation of nuclear waste [18]. The source of MgO is a limiting factor for a large-scale production of Mg cement [3].
De Ruiter and Austrheim [11] discovered and described natural M-S-H from Feragen where a tillite consisting of clasts of quartz, feldspar and ultramafic material was cemented by a hydrous Mg-silicate cement with the average composition of Mg8Si8O20(OH)8·6H2O, which is a mixture of nanocrystalline Mg-rich phyllosilicates (e.g. kerolite, stevensite and serpentine). The authors suggested that the cement forms from a reaction of quartz with high pH and Mg-rich fluids, which are the result of the dissolution of brucite from the serpentinized ultramafite. De Ruiter and Austrheim [11] focused on the similarity in structure and composition of the naturally formed Mg-silicate cement and human-made M-S-H (magnesium silicate hydrate) cement [19,20,21]. De Ruiter et al. [22] elaborated on the reaction between the high pH fluid and quartz and highlighted the importance of deformation to enhance dissolution rates of quartz and documented by TEM work that the quartz at the contact with cement developed a µm thick amorphous zone.
In this paper we give additional information of the Feragen M-S-H cement described by de Ruiter and Austrheim [11] and de Ruiter et al. [22]. In addition, we describe a second occurrence from Leka, Norway, reported in a master thesis by Hu [23], where M-S-H grade into M-A-S-H cement in the presence of plagioclase. Here we add a Raman study of the cement at Leka to show that this, like the Feragen cement is amorphous.
2. Methods
Most back-scattered electron (BSE) images and all determination of mineral and cement composition was performed with a Cameca SX100 electron microprobe at the Institute of Geoscience, University of Oslo. Analyses were carried out with an acceleration voltage of 15kv, a beam current of 10 nA and counting time of 10 s for peak and background. For most of the cement analyzes a defocused beam with a diameter of 5 µm was used to reduce evaporation of volatiles. Standard used were synthetic oxides and natural minerals. Matrix corrections followed procedures described by Pouchou and Pichoir [24]. The amount of H2O was estimated by subtracting the sum of the analyzed oxides from 100%.
Whole-rock geochemical analyses were performed by Actlabs Laboratories Ltd., using the lithium metaborate/tetraborate fusion ICP whole-rock and the trace element ICP/MS packages. For the lithium metaborate/tetraborate fusion ICP Whole Rock Package for major element analysis, samples were prepared and analyzed in a batch system. Each batch contains a method reagent blank, certified reference material and 17% replicates. Samples are mixed with a flux of lithium metaborate and lithium tetraborate and fused in an induction furnace. The molten melt is immediately poured into a solution of 5% nitric acid containing an internal standard and mixed continuously until completely dissolved (~30 minutes). The samples were run for major oxides and selected trace elements on a combination simultaneous/sequential Thermo Jarrell–Ash ENVIRO II ICP or a Varian Vista 735 ICP. Calibrations were performed using 7 prepared USGS and CANMET certified reference materials. One of the 7 standards is used during the analysis for every group of ten samples (www.actlabs.com). FeO was determined through titration, using a cold acid digestion of ammonium metavanadate, and hydrofluoric acid in an open system. Ferrous ammonium sulphate was added after digestion and potassium dichromate was the titrating agent. Weight fractions of dry CO2 sample gas were measured by infrared absorption after decomposing 0.2g of sample material in a resistance furnace in pure environment at 1000 oC, using an ELTRA CW-800 (www.actlab.com). For four samples, it was possible to obtain material from both the yellow and the brown weathering zones, but for one sample, only the yellow zone could be separated.
A Horiba Jobin–Yvon (T64000) Spectrograph in micro-single mode configuration was used for the Raman experiments. A Semrock Razoredge longpass filter served to block the Rayleigh light. The entrance slit-width was set to 100 microns. Combined with a 900 lines pr. mm grating, a spectrograph focal length of 640 mm and a 1024 × 256 open electrode CCD with square pixels of 2.56-micron size, a spectral width of 5.1 cm−1 was achieved. The spectral range from 70 to 1800 cm−1 was measured for every sample.
A Spectra-Physics diode pumped Millennia Pro model SJ12 laser yielding 200mW of power at 532.1 nm was used. The beam was guided through a Pellin-Broca prism followed by a pinhole at 1.5m distance to clean up the laser light. A set of three neutral density (ND) filters together with losses at mirrors and the built-in beamsplitter, was used for damping the power to 1.5mW measured at the sample through an Olympus 100x objective. All Raman spectra were scale calibrated against 4-Acetamidophenol (Paracetamol) before and after the sample measurements. No attempts to control polarization was done.
3. Results
3.1. Geological setting and climatic conditions
The Feragen Ultramafic complex (FUC) is located in east central Norway at an altitude between 700 and 900 m a.s.l. (Figure 1a). The area is among the coldest in Europe and located in the subarctic climate zone with monthly mean temperatures ranging between -25 and + 8 oC. The Leka ophiolite complex (LOC) is located on Leka island, Trøndelag, central Norway (Figure 1b) at a latitude of 65 oN. Leka is also situated in the sub-arctic climate zone with monthly mean temperatures ranging between -1 and +15 oC. Like most parts of Scandinavia, the FUB and LOC was glaciated during the Weichselian. This constrains the maximum age of the weathering and duricrust formation to <10ka. The FUC is exposed over an area of 14km2. The FUC consists of partly serpentinized harzburgite and dunite [25]. The FUC was extensively mined for chromite, starting in 1824 and terminated in 1939. The mine tailing and locally the mines shafts are coated with hydrocarbonates (4, 22). The carbonation of the mine tailings starts ca. 10 cm below the surface and is particularly well developed on the down facing side of rock fragments in the tailing [22]. On the surface at both FUC and LOC hydrocarbonates only form under overhangs. This together with below surface carbonation of the mine-tailings suggest that the hydrocarbonates are unstable in direct contact with acid rainwater. The LOC contains all the principal components of an ophiolite including a mantle section dominated by peridotite and a layered crustal sequence with alternating dunite, pyroxenite and locally plagioclase rich (anorthositic) layers [26]. The ultramafic parts are exposed over an area of ca 20 km2 and is partly serpentinized [27]. Northeast of the village Solsem, South-west Leka (Figure 1b) a m thick conglomerate outcrop over 100 m2 is dominated by local clast from the ultramafite and gabbroic rocks, with minor quartz and k-feldspar. Bøe and Prestvik [28] interpreted the conglomerate at Solsem to be a partly lithified morainic deposited from the glaciation. Hu [23] realized that the cementing material at Solsem was similar to the M-S-H cement described from Feragen, although locally containing Al2O3.
3.2. Field and microtextural observations
The weathering of peridotite leaves a few cm thick weathering rind consisting of an outer yellow rim followed inward by blue rim while the unweathered peridotite displays a dark color [29]. The weathering rind is also seen in clasts inside the cemented moraine. Raman mapping has earlier documented that brucite present in the pristine rock was absent in the weathered rims [29]. Microtextural the weathering is evidenced by disappearance and alteration of brucite coupled with a reduction in Mg in weathering zones and an enrichment of Ni and Fe-oxides in aggregates after brucite [30]. Along fault- and fracture- zones, weathering penetrates deep and can be followed downwards for several meters. Hydrocarbonates and pyroaurite form veins in the weathering zone of the clasts and the bedrock. The brucite contains variable amounts of FeO (Table 1) and grades into ferroan brucite.
The cemented till at Feragen is dominated by felsic clasts and is white colored (Figure 2a,b,c) while the cemented moraine at Leka where the amounts of ultramafic material is high display a brownish to greyish color (Figure 2d,e,f). At Feragen, the M-S-H varies in thickness from 0.5 m to cm thick flakes distributed at the surface (Figure 2b). M-S-H is also developed along trenches dug in connection with the mining operation where the fluid could evaporate [11].
The deformed quartz in the till is dissolved and partly replaced by M-S-H cement along sub-grain boundaries (Figure 3a,b,c).
Locally the quartz is totally dissolved, and a honeycomb texture is developed (Figure 3d). De Ruiter et al. [22] demonstrated through TEM technique that the dissolution of quartz took place through an amorphous substance. Another characteristic microtexture is etchpits on the surface of the quartz grains. K-feldspar is replaced by and aggregate of cement and µm sized illite (Figure 3e). Locally the aggregates after K-feldspar display flow structures with aligned illite grains. Plagioclase of varying composition from albite to bytownite (An88) are found as clasts in the cemented till at Leka.
Like quartz, plagioclase is strongly dissolved and partly replaced by cement (Figure 3f; 4a,b,c,d). The cement surrounding the resorbed plagioclase is enriched in Al (Figure 4b). In the same sample, Ca-carbonate surrounds and replace quartz grains (Figure 5a,b), suggesting that Ca released from plagioclase is consumed to form calcite. The M-(A)-S-H cement surrounds and replaces both calcite and quartz (Figure 5a,b).
Negative quartz crystals, 50 µm long and veins extending more than 200 µm into quartz grains are filled by cement (Figure 6a,b). The location of spots identified by Raman spectra of the cement, quartz and calcite are shown in Figure 6a,b while their corresponding Raman spectra are shown in Figure 6c. The Raman spectra of the Ca-carbonate give distinct peaks that is characteristic for calcite, but contributions from quartz are visible. The two Raman spectra for the cement are very broad and featureless and no clear peaks could be identified.
3.3. Composition of the cement.
The cement at both Feragen and Leka is dominated by SiO2-MgO-H2O (Table 2). Most of the analyses from Feragen contain low Al2O3 and cluster in the central part triangular SiO2-MgO-H2O diagram while the cement from Leka display more variation (Figure 7a). A high H2O and low MgO variety is present at Leka (Figure 7a). Analyses from Leka contain high Al2O3 (up to 20 wt. %) adjacent to dissolving plagioclase grains. The increase in Al2O3 take place on behave of SiO2 (Figure 7b). The alkalies are low around 0.1 wt. %, but locally concentration up to 2 and 3 wt. % of respectively Na2O and K2O is measured.
3.4. The composition of the weathering rinds
To trace the origin of the elements in the cement we compare weathering rinds of the peridotite with its nonweathered equivalent to test the microtextural indications that peridotite release MgO during weathering. Table 3 lists the compositions for the outer (yellow) and inner (blue) weathering zones compared to the dark pristine peridotite for six samples from Feragen. Also listed in table 1 are two samples of gravel developed locally at the surface of the peridotite. The calculated MgO/SiO2, MgO/Fe2O3, MgO/NiO ratios decreases form the pristine peridotite to the inner blue and outer yellow weathering rinds (Figure 8). This is in accordance with the textural evolution and suggest that MgO leaves the system. The decreasing MgO/NiO ratio in the weathered zones and in the clay gravel fraction (Table 3) suggests that NiO do not follow MgO and remains in the regolith as reported for peridotite regolith in general [31] and for this area [29,30]. The Lanthanide concentration is low (for some of the elements it is below detection limits). There is no obvious systematic change in Lanthanide concentrations and pattern from the unaltered zone to the weathering rinds.
3.5. Composition of till and tillite.
Till is produced by mechanical weathering and is assumed to produce a robust average composition of the upper continental crust [32,33,34,35]. Two samples of till from a 40 cm deep trench dug across a mudboil (Figure 9a,b) at Feragen were collected and analyzed for major and trace elements and compared with the nearby tillite (Figure 9c). The two till samples are similar in composition and characterized with elevated SiO2 and low Al2O3 and MgO contents (Table 4). The nearby tillite share the composition of the till for most elements but contain 10 wt. % of MgO and a high LOI content. The chondrite normalized Lanthanide pattern (Figure 10) reveal that the till samples and the cemented till display similar patterns, with a fractionated Light Lanthanides (La/Gd=5.8) and an almost horizontal Intermediate Lanthanides and Heavy Lanthanide segments. The compositions including the Lanthanide patterns suggests that the tillite formed from the till by addition of MgO and H2O. The Ni concentration in the tillite is low and it appears that the Ni remains in the regolith as is also evident from the textural evolution and the compositions (Table 4).
4. Discussion
4.1. Formation of natural M-S-H and M-A-S-H cement.
The microtextures and the geochemistry suggest that the Mg present in the cement is derived from the weathering zone of the peridotite by dissolution of brucite. The other natural occurrence of M-S-H cement [11] is also deposited on an ultramafic complex implying that also in that case Mg come from the ultramafic complex. Quartz in contact with M-S-H cement both at Feragen and Leka display dissolution textures (etch pitch and negative crystals filled by M-S-H cement) and in accordance with [10] we interpret that the Si is derived from the felsic material deposited on the ultramafite. We cannot exclude that some Si is derived from dissolved Mg-silicates. However, in the absence of quartz, the Mg fluid form hydrocarbonates and not M-S-H cement. The M-A-S-H is texturally associated with plagioclase and like quartz, plagioclase is dissolved and replaced by cement (Figure 4b). We therefore consider that the M-A-S-H cement obtained its Al from the dissolving plagioclase. The zonation of Al in cement suggest that Al is locally derived. In experimentally formed M-A-S-H cement, Al is added as metakaolin or amorphous Al2O3[13]. The rare occurrence of natural M-S-H cement may reflect the very special geochemical environment where quartz is brought in contact with olivine bearing rocks by glacial activity. Such environment may be restricted to glacial terrains where olivine and quartz are mechanically brought in contact. In magmatic systems olivine and quartz will react at high temperature to form orthopyroxene preventing coexisting olivine in rocks formed by magmatic processes. Glaciers and ice sheets are covering up to 30% of land surface area during glacial cycles [36]. The Snowball Earth Hypothesis suggests that ice entire covered the earth at least twice in its history and the potential for M-S-H formation should be high. Diamictite is present through the geological record on all continent and represent lithified till with a potential for M-S-H formation. Further work will show if the few reports of natural M-S-H cement [11,12] reflects our ignorance of surface processes or if we at Leka and Feragen observe a very rare geological process.
Experimentally produced M-S-H and M-A-S-H cement are produced from amorphous substances in order to speed up reaction rates. Zhang et al. [8] documented that MSH cement can be formed experimentally by reacting brucite and silica-fume. In the natural cases reported here we observe that MSH can form by reacting quartz and a high pH fluid derived by dissolution of brucite. Raman spectra presented for experimentally produced M-S-H cement with varying Mg-Si ratio display peaks suggesting brucite [37,38]. The spectra obtained from the natural occurring cement at Leka (Figure 6c) lack distinct peaks and are typical for an amorphous substance.
4.2. Rate of reaction.
If the cement formed in the time span of 200 years as implied by the presence of M-S-H in the entrance to the Cr-mines which were operating between 1824 and 1939, de Ruiter et al. [22] calculated a dissolution rate for quartz of 1.75x10⁻¹⁰ mol m-2s, which is 3 order of magnitude faster than the dissolution rate predicted by experimental studies. The microtextures of plagioclase suggest that this mineral also dissolve fast. The selective dissolution and replacement by cement along crystal planes (Figure 6a) and veins (Figure 6b) suggest that experimental determined dissolution rates may not capture the way dissolution and reprecipitation occur in natural rock and that nature provides mechanisms that can greatly enhance dissolution rates. De Ruiter and Austrheim [22] noticed that the quartz from the tillite was strongly deformed as evidenced by undulous extinction and that the cement formed along subgrains. Bacterial activity may also enhance dissolution rates. Ferroan brucite found at both Feragen (Table 1) and Leka [27] may suggest bacterial activity [39]. Whether the identification and cultivating of such mechanisms will speed up the kinetics to satisfy an industrial process, remains an open question.
4.3. The magnesium budgets.
Ultramafic rocks represent a major source of MgO in the form of magnesium silicates. To covert the Mg in silicate to a form that is reactive and applicable in an industrial process is problematic. Gardner and Sui [3] write that there is as yet no known process for making magnesium oxide from natural basic magnesium silicates in an energy-efficient manner, although in may well be possible to invent one given enough support for necessary research. Mg in the form of brucite (MgxFe2+ (1-x)(OH)2) is a reactive substance [40] that will form MSH cement [41]. The work of Scott et al. [42] demonstrate that brucite (Mg(OH)2) can be produced from olivine and serpentine through a combination of hydrolysis and acid digestion. To our knowledge this is still not an industrial process. In nature brucite form from olivine rich rocks during serpentinization according to the reaction: Mg1.8Fe.2SiO4 + H2O = (Mg,Fe)3Si2O5(OH)4 + (Mg,Fe)(OH)2 + Fe3O4 + H2 . The amount of brucite formed during serpentinization is dependent on a number of parameters such as the rock type being serpentinized, the degree of serpentinization. In addition, the amount of Fe in brucite will increase its amount. We notice that in both at Feragen (Table 1) and Leka [27] the brucite contains high FeO and classifies as Ferroan brucite. The brucite is intergrown with serpentine and difficult to separate mechanically. However, the brucite dissolves is surface water to produce a Mg containing high pH fluid. This may represent an important way to capture the brucite. Where this fluid comes in contact with the atmosphere it may deposits hydro carbonates (HMC cement) seen as white coatings under overhangs and in mine-tailings. Beinlich and Austrheim [4] measured the composition of the fluid at Feragen. The pH of mine water ranges from 9.4 to 10.6 with Mg2+ and Si (as SiO2) from 13 to 88.5 mg/L and 0 to 11.5 mg/l respectively. The alkaline water from Leka has a pH up to 10 with Mg and silica in the same range as measured at Feragen [5]. The Mg content of the fluid at Feragen and Leka is one order of magnitude lower than fluid from other similar ultramafics [43,44]. This may mean that the measured fluid had already formed hydrocarbonates. It remains to be tested if the fluid from brucite dissolution can be collected before it deposits hydrocarbonates and if this fluid has advantages as a Mg source over the seawater that contains 52 mmol/l Mg[45].
In nature Mg-silicate can react with CO2 to form magnesite. Although magnesite is not suitable for producing cement by calcination analog to Portland cement, it is not known if a fluid produced from magnesite will form HMS cement similar our observation at Feragen and Leka. Possibly the lower pH of such a fluid will prevent the fast dissolution of quartz and plagioclase as described above.
4.4. Serpentinization and weathering
Serpentinization and weathering are used synonymous by some author, but at Leka and Feragen they are two separated processes. While weathering occurs at and close to the surface, serpentinization occur at higher temperature (>200 oC). As pointed out by Goldich [46] the weathering sequence of igneous rocks is reverse of the Bowen’s reaction series meaning that minerals formed at high temperature like olivine weathers faster than rocks formed at lower temperature. Olivine rich rocks are consequently more strongly weathered than most other rocks. Olivine rich rocks contain low concentrations of Al2O3 (typically between 3 and 0.5%) and cannot form abundant Al rich phases like kaolinite. Their natural weathering product will be quartz of clay phases consisting of Mg and Si and not necessarily brucite. This is illustrated by [47] who showed that peridotite clast of the Solund basin is altered to dewelite(clay) and quartz. A preconditioning of the peridotite by serpentinization is required to form brucite and weathering is required to dissolve the brucite and form the alkaline fluid.
4.5. The M-(A)-S-H cemented till - a new type of duricrust.
The M-(A)-S-H cemented rock at Feragen and Leka developed within till and moraine at the surface of ultramafic complexes. The M-A-S-H cemented till bear many resemblances on the members of duricrust (calcrete, silicrete). As illustrated in Figure 2 a,d the cemented till appears as cemented gravel. The first use of the term calcrete was indeed referred to as lime-cemented gravel by Lamplugh [48]. Formation of M-(A)-S-H cemented as a reaction between a precursor sediment and a fluid is a common way of forming duricrust. For example, the calcrete silcrete duricrust at Tswaane were developed within the precursor Kalahari Group sediment by laterally supplied cementing agents [49]. The duricrust formation in the Kalahari case involve reaction between the cementing fluid and the early formed deposited duricrust. The complex relationship between calcite, quartz and M-(A)-S-H cement described above and illustrated in Figure 5a and b suggest that two fluids were involved similar to the duricrust described by Nash et al. [49,50]. Based on the similarities with respect to appearance and formation we interpret the M-(A)-S-H cemented till to represent a new type of duricrust coined magsilcrete. Our knowledge of Martian and planetary crust in general is partly based on testing of crustal analogs [51]. Magsilcrete represent a new analog to be tested towards remote sensing and rover data considering that mafic and ultramafic rocks must be the source material of Martian duricrust [52] where polar glacial ice sheets are present and episodic glaciation took place.
4.6. Formation of natural M(A)SH cement as a geological process
Alteration processes of peridotite (serpentinization, carbonation and weathering) has recently gained increased attention. Serpentinization affect the petrophysical properties of rock and as such influences the geophysical imaging of the lithosphere and its geodynamic evolution. Peridotite (dunite) is the ultimate host rock for in situ CO2 sequestration. Reaction between olivine and CO2 according to the reaction Mg2SiO2 + CO2 = 2MgCO3 and SiO2 form 2 mol of magnesite and 1 mole quartz and produces a rock referred to as listvenite. Weathering of peridotite or its alteration product control the Mg-cycle. Mg is a highly mobile element during weathering and preferentially leached out of the crust compared with Si, because Si-rich minerals (alkali feldspar and quartz) are more resistant to chemical and physical weathering than mafic minerals [53].
The formation of magsilcrete as an alteration process of peridotite has up to now not been considered neither as an Mg-reservoir during Mg-cycle modelling nor during modelling of peridotite as feedstock for CO2 sequestration. As Mg is consumed during magsilcrete formation, less Mg is available for Mg-carbonates. The Mg runoff from the crust is also influence by formation of magsilcrete. Mg isotopes are applied to monitor Mg-cycle. Riverine and ocean waters are enriched in 24Mg compared to the chondritic Mg isotopic composition of the Earth’s mantle (Beinlich et al. 54). Beinlich et al. [54] relates this to formation of carbonates (magnesite and dolomite) enriched in 24Mg and the strong weathering of these phase. As magsilcrete forms at low temperatures in equilibrium with hydromagnesite, nesquehonite, landsfordite, artenite and dypingite it is also likely that it fractionates Mg-isotope. It remains to be determined how this low temperature alteration (weathering) fractionates Mg isotope and thus change the foundation for modelling the Mg-cycle.
5. Conclusions
The natural process of forming M-(A)-S-H cement involve two steps - formation of brucite by serpentinization of peridotite and subsequent dissolution of brucite during weathering to form a reactive Mg rich high pH fluid. The alkaline fluid dissolve quartz and precipitate M-S-H cement. Where plagioclase is present in the reacting material Al enters the cement and forms M-A-S-H cement. Both M-S-H and M-A-S-H is formed in glaciated area where glaciation deposited quartz and feldspar on to surface of ultramafic complexes. The cemented till and moraine belong to the family of duricrusts and represent a new type of duricrust that we call magsilcrete.
Author Contributions
Conceptualization, Håkon Austrheim; Investigation, Depan Hu; Methodology, Niels Andersen; Visualization, Depan Hu; Writing – original draft, Håkon Austrheim; Writing – review & editing, Niels Andersen.
Funding
The Raman work was cover through the NRF supported project NATSORB.
Informed Consent Statement
Not applicable.
Data Availability Statement
Not applicable.
Acknowledgments
We thank Dag Dysthe, Andreas Beinlich, Lisa de Ruiter and Ole Ivar Ulven for discussion and advice during the progress of this work.
Conflicts of Interest
The authors declare that there that there is no conflict of interest regarding the publication of this paper.
References
- Schrivener, K.L.; John, V.M.; Gartner, E.M. Eco-efficient cement: Potential economically viable solutions for a low-CO2 cement-based materials industry. Cem. Concr. Res., 2018, 114, 2-26. [CrossRef]
- Walling, S.A.; Provis, J.L. Magnesia-based cements: a journey of 150 years, and cements for the future? Chem. Rev. 2016, 116, 4170–4204. [Google Scholar] [CrossRef]
- Gartner, E.; Sui, T. Alternative cement clinkers. Cem. Concr. Res. 2018, 114, 27–39. [Google Scholar] [CrossRef]
- Beinlich, A.; Austrheim, H. In situ sequestration of atmospheric CO2 at low temperature and surface cracking of serpentinized peridotite in mine-shafts. Chem. Geol. 2012, 332–333, 32–44. [CrossRef]
- Økland, I.; Huang, S.; Dahle, H.; Thorseth, I.H.; Pedersen, R.B. Low temperature alteration of serpentinized ultramafic rok and implication for microbial life. Chemical Geology 2012 318-319, 75-87. [CrossRef]
- Wilson, S.A.; Dipple, G.M.; Power, I.M.; Thom, J.M.; Andersen, R.G.; Raudsepp, M.; Gabites, J.E.; Southam, G. Carbon dioxide fixation within mine wastes of ultramafic-hosted ore deposits: Examples from the Clinton Creek and Cassiar crysotille deposits, Canada. Economic Geology 2009, 104, 95–112. [Google Scholar] [CrossRef]
- Power, I.M., Wilson, S A.; Dipple, G.M. Serpentine carbonation for CO2 sequestration. Elements. 2013, 9, 115–121. [CrossRef]
- Zhang, T.; Vandeperre, L. J.; Cheeseman, C. R. Formation of magnesium silicate hydrate (M-S-H) cement pastes using sodium hexametaphosphate. Cement and Concrete Research 2014, 65, 8–14. [Google Scholar] [CrossRef]
- Jenni, A.; Mäder, U.; Lerouge, C.; Gaboreau, S; Schwyn, B. In situ interaction between different concretes and Opalinus clay, Physics and Chemistry of the Earth, Parts A/B/C, 2014, 70, 71-83. [CrossRef]
- Mäder, U.; Jenni, A.; Lerouge, C.; Gaboreau, S.; Miyoshi, S.; Kimura, Y.; Cloet, V.; Fukaya, M.; Claret, F.; Otaka, T.; Shibata, M.; Lothenbach, B. 5-year chemico-physical evolution of concrete-claystone interfaces, Swiss J Geosci. 2017, 110, 307-327.
- de Ruiter, L.; Austrheim, H. Formation of magnesium silicate hydrate cement in nature. J. Geol. Soc. Lond. 2018, 175, 308–320. [Google Scholar] [CrossRef]
- Nishiki, Y.; Sato, T.; Katoh, T.; Otake, T.; Kikuchi, R. Percipitation of magnesium silicatehydrates in natural alkaline surface environments. Clay Science 2020, 24, 1–13. [Google Scholar]
- Benard, E.; Lothenbach, B.; Cau-Dit-Coumes, C.; Pochard, I.; Rentsch, D. Aluminium incorporation into magnesium silicate hydrate (M-S-H) Cement and Concrete Research 2020, 128, 105931. [CrossRef]
- Benard, E.; Lothenbach, B.; German, A.; Rentsch, D.; Winnefeld, F. Effect of aluminate and carbonate in magnesium silicate cement. Cem. Concr. Composites 2023, 139, 105010. [Google Scholar] [CrossRef]
- Mariske, M.R.; Debus, C.; Di Lorenzo, F.; Bernard, E.; Churakov, S.V.; Ruiz-Agudo, C. Immobilization of (Aqueous) Cations in Low pH M-S-H Cement. Appl. Sci. 2021, 11, 2968. [Google Scholar] [CrossRef]
- Zhang, T.; Cheeseman, C. R.; Vandeperre, L. J. Development of low pH cement systems forming magnesium silicate hydrate (M-S-H). Cem. Concr. Res. 2011, 41, 439–442. [Google Scholar] [CrossRef]
- Bernard, E. Research progress on magnesium silicate hydrate phases and future opportunities. RILEM Technical Letters 2022, 7, 47–57. [Google Scholar] [CrossRef]
- Zhang, T.; Li, T.; Zou, Y.; Li, S.; Zhi, Y; Cheeseman, C.R. Immobillization of radionuclide 133Cs by magnesium silicate hydrate cement, Materials 2012, 13. 2012. [Google Scholar] [CrossRef]
- Brew, D.R.M.; Glasser, F.P. Synthesis and characterization of magnesium silicate hydrate gels. Cem. Concr. Res. 2005, 35, 85–98. [Google Scholar] [CrossRef]
- Roosz, C.; Grangeon, S.; Blanc, P.; Montoullout, V.; Lothenbach, B.; Henocq, P.; Giffaut, E.; Vieillard, P.; Gaboreau, S. Crystal structure of magnesium silicate hydrates (M-S-H): The relation with 2:1 Mg-Si phyllosilicates. Cem. Concr. Res. 2015, 73 228-237. [CrossRef]
- Zhang, Y.; Chang, J.; Zhao, J.; Fang, Y. Nanostructural characterization of Al(OH)3 formed during the hydration of calcium sulfoaluminate cement. J. Am. Ceram. Soc. 2018, 101, 4262–4274. [Google Scholar] [CrossRef]
- De Ruiter, L.; Gunnæs, A.E.; Dysthe, D.K.; Austrheim, H. Quartz dissolution associated with magnesium silicate hydrate cement precipitation. Solid Earth 2021, 12, 389–404. [Google Scholar] [CrossRef]
- Hu, D. The Characterization of the cementing materials in the ultramafic tillites from Feragen and Leka, Norway. Master Thesis University of Oslo. 2015 pp 124.
- Pouchou, J.L.; Pichoir, F. Quantitative Analysis of Homogeneous or Stratified Microvolumes Applying the Model PAP in Heinrich, K.F.J.; Newbury, D.E. (Eds.) Springer Boston MA, USA, 1991.
- Moore, A. C.; Hultin, I. Petrology, mineralogy, and origin of the Feragen ultramafic body, Sor-Trondelag, Norway. Norsk Geologisk Tidsskrift. 1980, 60, 235–254. [Google Scholar]
- Prestvik, T. The Caledonian ophiolite complex of Leka, central Norway. In: Panayiotou, A. (Ed.), Ophiolites. Geol. Surv. Dep, Cyprus, 1980, 555-556.
- Iyer, K.; Austrheim, H.; John, T.; Jamtveit, B. Serpentinization of the oceanic lithosphere and some geochemical consequences: Constraints from the Leka Ophiolite Complex, Norway. Geohem. Geol. 2008, 249 66-90. [CrossRef]
- Bøe, P; Prestvik, T. A serpentinite conglomerate on the Island of Leka, Nord-Trøndelag. Norsk Geologisk Tidsskrift 1974, 54, 117-121.
- Ulven O., I.; Beinlich, A.; Hövelmann, J.; Austrheim, H.; Jamtveit, B. Subarctic physicochemical weathering of serpentinized peridotite. Earth Planet. Sci. Lett. 2017, 468, 11–26. [Google Scholar] [CrossRef]
- Beinlich, A.; Austrheim, H.; Mavromatis, V.; Grguric, B.; Putnis, C.V.; Putnis, A. Peridotite weathering is the missing ingredient of Earth’s continental crust composition. Nature Com. 2018, 9:634.
- Gleeson, S.A.; Herrington, R.J.; Durango, J.; Velasquez, C.A.; Koll, G. The mineralogy and geochemistry of the Cerro Matoso, S.A. Ni laterite deposit, Montelibano, Colombia. Econ. Geol. 2004, 99, 1197-1213. 2004, 99. [Google Scholar] [CrossRef]
- Goldschmidt, V.M. Grundlagen der quantitativen geochemie. Forschritte der Mineralogie, Krystallographie and Petrologie 1933, 17, p.112.
- Goldschmidt, V.M. Geochemistry. Oxford University Press, Oxford 1958.
- Canil, D. and Lacourse, T. An estimate for the bulk composition of juvenile upper continental crust derived from glacial till in the North American Cordillera. Chem. Geol. 2011, 284, 229‐239. [CrossRef]
- Gaschnig, R.M.; Rudnik, R.L.; McDonough, W.F.; Kaufman, A.J.; Valley, J.W.; Hu, Z.; Gao, S.; Beck, M.L. Compositional evolution of the upper continental crust through time, as constrained by ancient glacial diamictites. Geochim. Cosmochim. Acta 2016, 186, 316-343. [CrossRef]
- Hawkings, J.R.; Wadham, J.L.; Benning, L.G.; Hendry, K.R.; Tranter, M.; Tedstone, A.; Nienow, P.; Raiswell, R. Ice sheets as a missing source of silica to the polar oceans. Nature Com. 2017, 8: 4198. [CrossRef]
- Lothenbach, B.; Nied, D.; L’Hopital, E.; Achiedo, G.; Dauzeres, A. Magnesium and calcium silicate hydrates. Cement and Concrete Research 2015, 2015 77, 60–68. [Google Scholar] [CrossRef]
- Nied, D.; Enemark-Rasmussen, K.; L’Hopital, E.; Skibsted, J. Properties of magnesium silicate hydrates(M-S-H) Cement and Concrete Research 2015 79, 323-332. [CrossRef]
- Templeton, A.S.; Ellison, E.T. Formation and loss of metastable brucite: does Fe(II)-bearing brucite support microbial activity in serpentinizing ecosystems? Philosophical Transactions Royal Society. 2020 A378:20180423. [CrossRef]
- Hövelmann, J.; Putnis, C.; Ruiz-Agudo, E.; Austrheim, H. Direct Nanoscale Observations of CO2 Sequestration during Brucite (Mg (OH)2) dissolution. Environmental Science & Technology. 2012,.
- De Ruiter, L., Putnis, C.V., Hövelmann, J., King, H.E. and Austrheim, H. Direct Observation of the Coupling between Quartz Dissolution and Mg-Silicate Formation. ACS Earth and Space Chemistry 2021, 2021. [CrossRef]
- Scott, A.; Oze, C.; Shah, V.; Yang, N.; Shanks, B.; Cheeseman, C.; Marshall, A.; Watson, M. Transformation of abundant magnesium silicate minerals for enhanced CO2 sequestration. Communications Earth & Environment. 2021, 2, 25. [CrossRef]
- Barnes, L.; O’Neil, J.R. The relationship between fluids in some fresh alpine-type ultramafics and possible modern serpentinization, Western United States. Geol. Soc. Am. Bull. 1969, 1969 80, 1947. [Google Scholar] [CrossRef]
- Boschetti, T.; Toscani, L. Springs and streams of the Taro-Ceno Valleys (Northern Appennini, Italy): reaction path modeling of waters interacting with serpentinized ultramafic rocks. Chem. Geol. 2008 257, 76–91. [CrossRef]
- Seeger, M.; Otto, W.; Flick, W. Magnesium Compounds. In: Ullmann’s Encyclopedia of Industrial Chemistry. John Wiley & Sons, Ltd.2011. [CrossRef]
- Goldich, S.S. A study of rock weathering. 1938 J. of Geol. 46, 17-58. Available online: https://www.journal.uchicago.edu/doi/abs/10.1086/624619.
- Beinlich, A.; Austrheim, H.; Glodny, J.; Erambert, M.; Andersen, T.B. CO2 sequestration and extreme Mg depletion in serpentinised peridotite clasts from the Devonian Solund basin, SW-Norway. Geochim Cosochim Acta 2010, 74:6935-6964. [CrossRef]
- Lamplugh, G.W. Calcrete. Geological Magazine 1902, 9, 575. [Google Scholar] [CrossRef]
- Nash, D.J.; Shaw, P. Silica and carbonate relationships in silicret-calcrete intergrade duricrusts from the Kalahari of Botswana and Namibia. J. of African Earth Sciences 1998, 27, 11–25. [Google Scholar] [CrossRef]
- Nash, D.J.; McLaren, S.J.; Webb, J.A. Petrology, geochemistry and environmental significance of silicrete-calcrete intergrade duricrust at Kang Pan and Tswaane, Central Kalahari, Botswana. Earth Surf. Process. Landforms 2004, 29, 1559–1586. [Google Scholar] [CrossRef]
- Lewinger, W.; Comin, F.; Matthews, M.; Saaj, C. Earth analogue testing and analysis of Martian duricust properties. Acta Astronautical. 2018, 152, 567–579. [Google Scholar] [CrossRef]
- Clark, B.C.; Baird, A.K.; Weldon, R.J.; Tusaki, D.M.; Schnabel, L.; Candelaria, M.P. Chemical composition of Martian fines. J. Geophys. Res. Solid Earth 1982 87, B12, 10059‐10067. [CrossRef]
- Holland, H.D. The chemical evolution of the Atmosphere and Ocean, Princeton University Press, Princeton, NJ. 1984.
- Beinlich, A.; Mavromatis, V.; Austrheim, H.; Oelkers, E.H. Inter-mineral Mg isotope fractionation during hydrothermal ultramafic rock alteration- Implications for the global Mg-cycle. Earth and Planet. Sci. Letter 2014, 2014 392, 166–176. [Google Scholar] [CrossRef]
- Taylor, S.R.; McLennan, S.M. The Continental Crust: Its Composition and Evolution. Blackwell, Oxford, 1-312 1985.
Figure 1.
Geological maps of a) the Feragen and b) Leka ultramafic complexes with location of exposed M-(A)-S-H).
Figure 1.
Geological maps of a) the Feragen and b) Leka ultramafic complexes with location of exposed M-(A)-S-H).
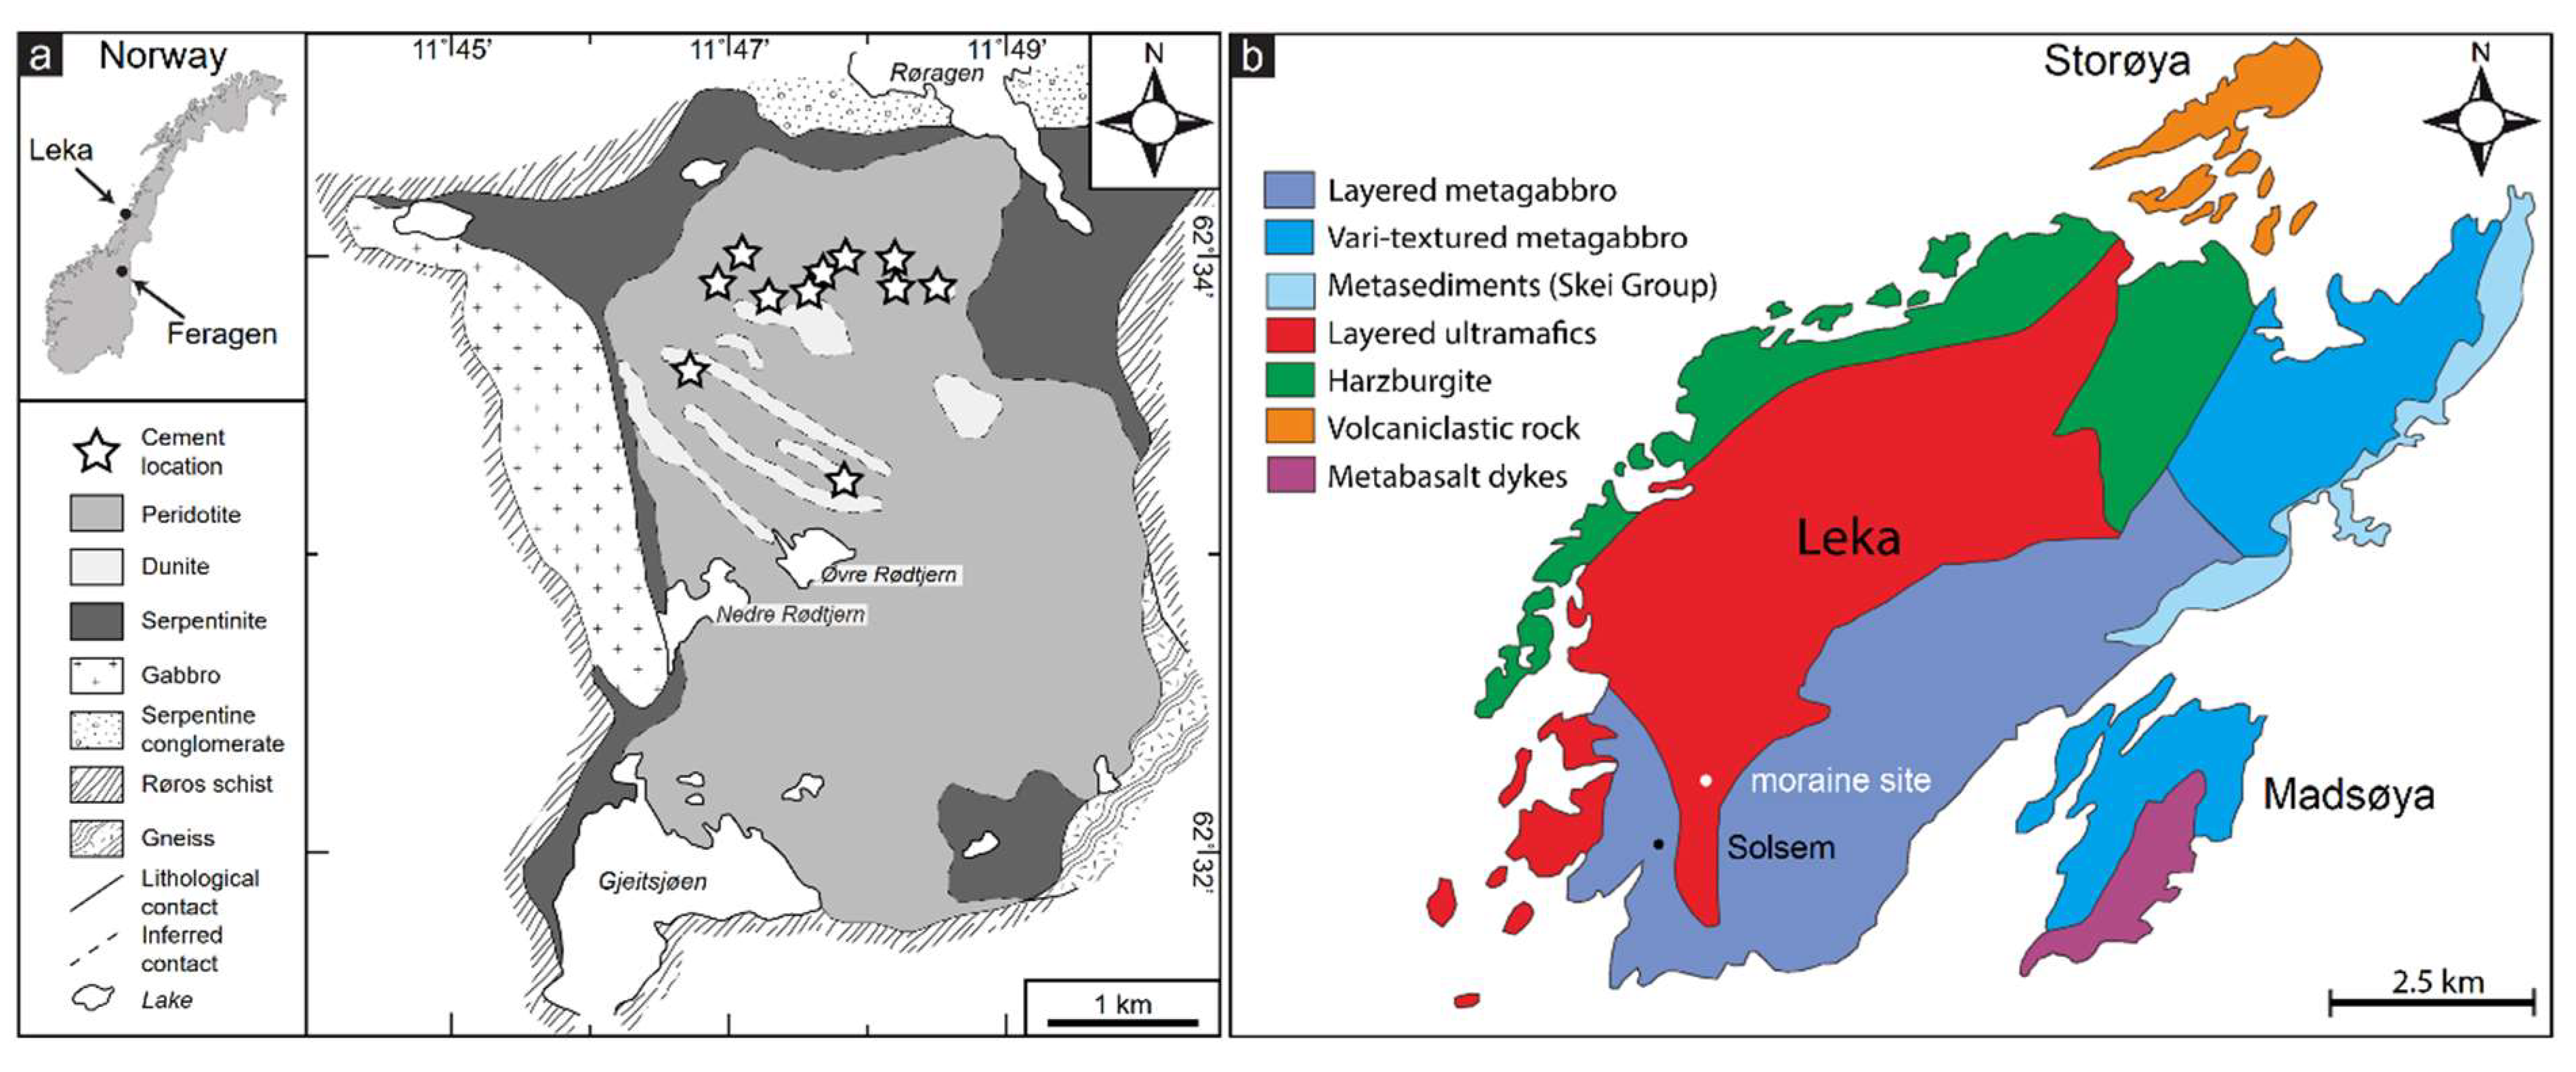
Figure 2.
Field photos of M-(A)-S-H cemented till and moraine. a,b,c Feragen and d,e,f Leka. .
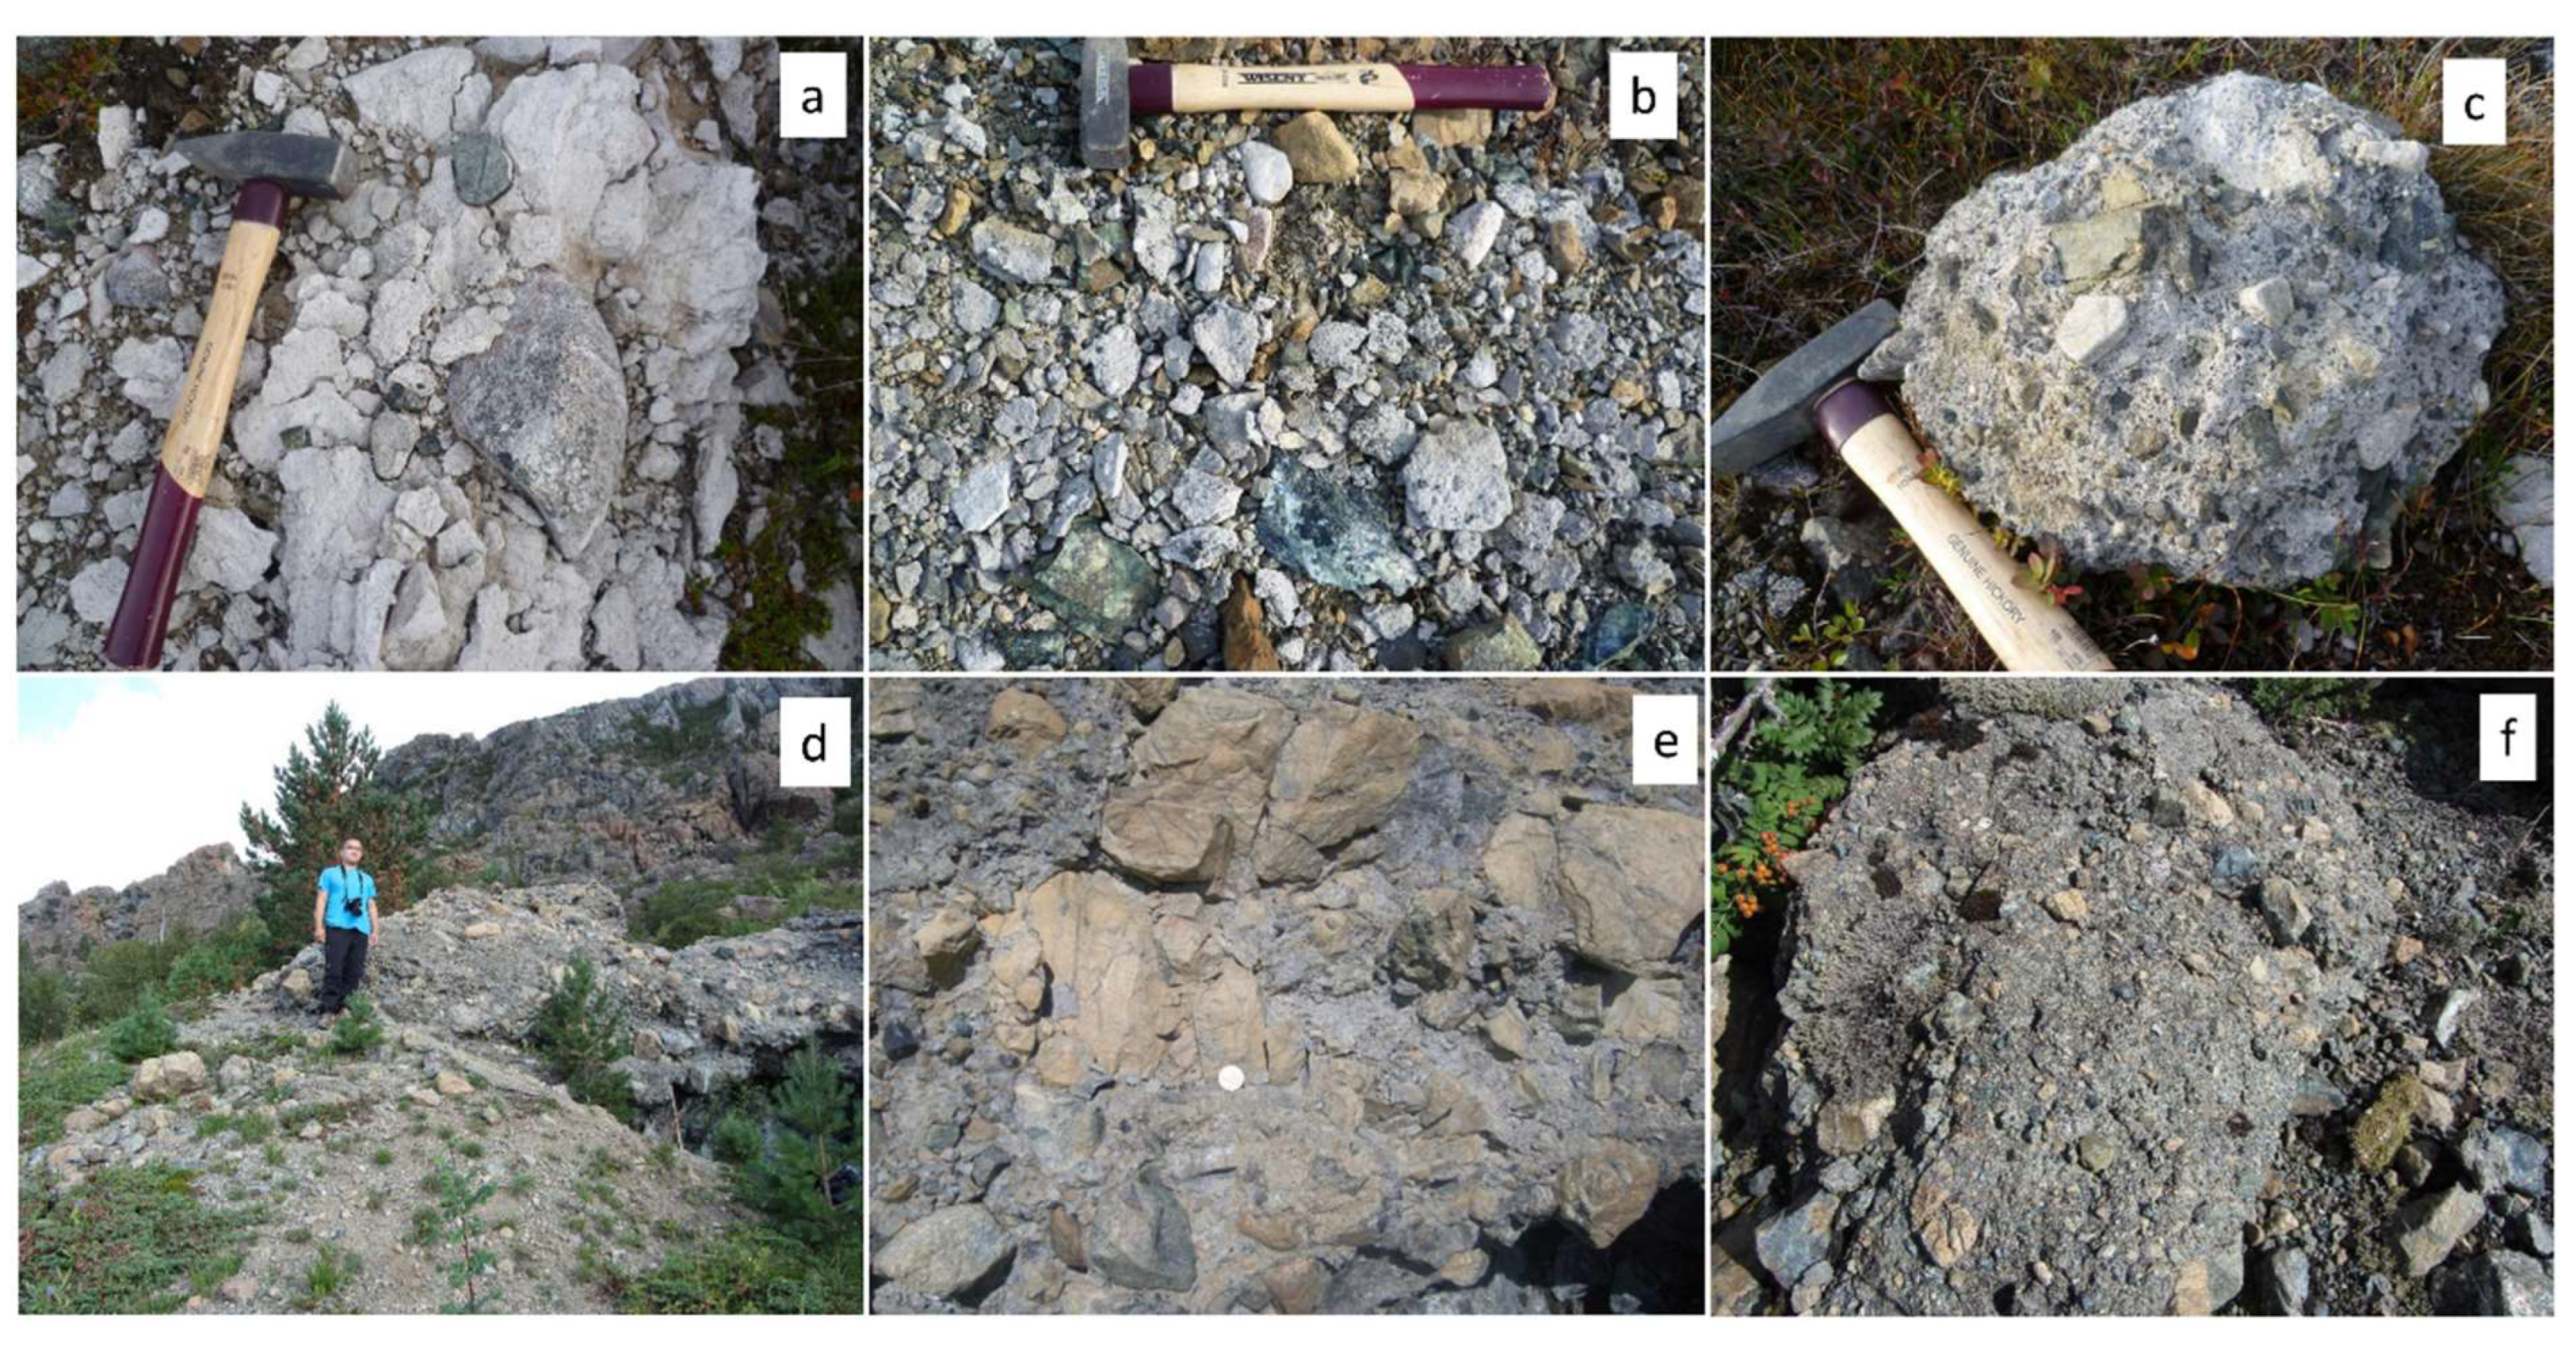
Figure 3.
Microtextures of M-(A)-S-H cemented till. a) BSE image showing large quartz grain fragmented by M-S-H cement. b, c) Mg and Si maps of same fragmented grain. d) Honeycomb microtexture after quartz. Some cells contain remnants of partly dissolved quartz. e) M-S-H cement with altered K-feldspar seen as an area of illite rich inclusions. f) Partly dissolved plagioclase (An44), Leka. Veins and fingers of cement penetrate the plagioclase and results in fragmentation and replacement of the grain. Abbreviations: K-fsp: kalifeldspar, mu: muscovite, plag: plagioclase.
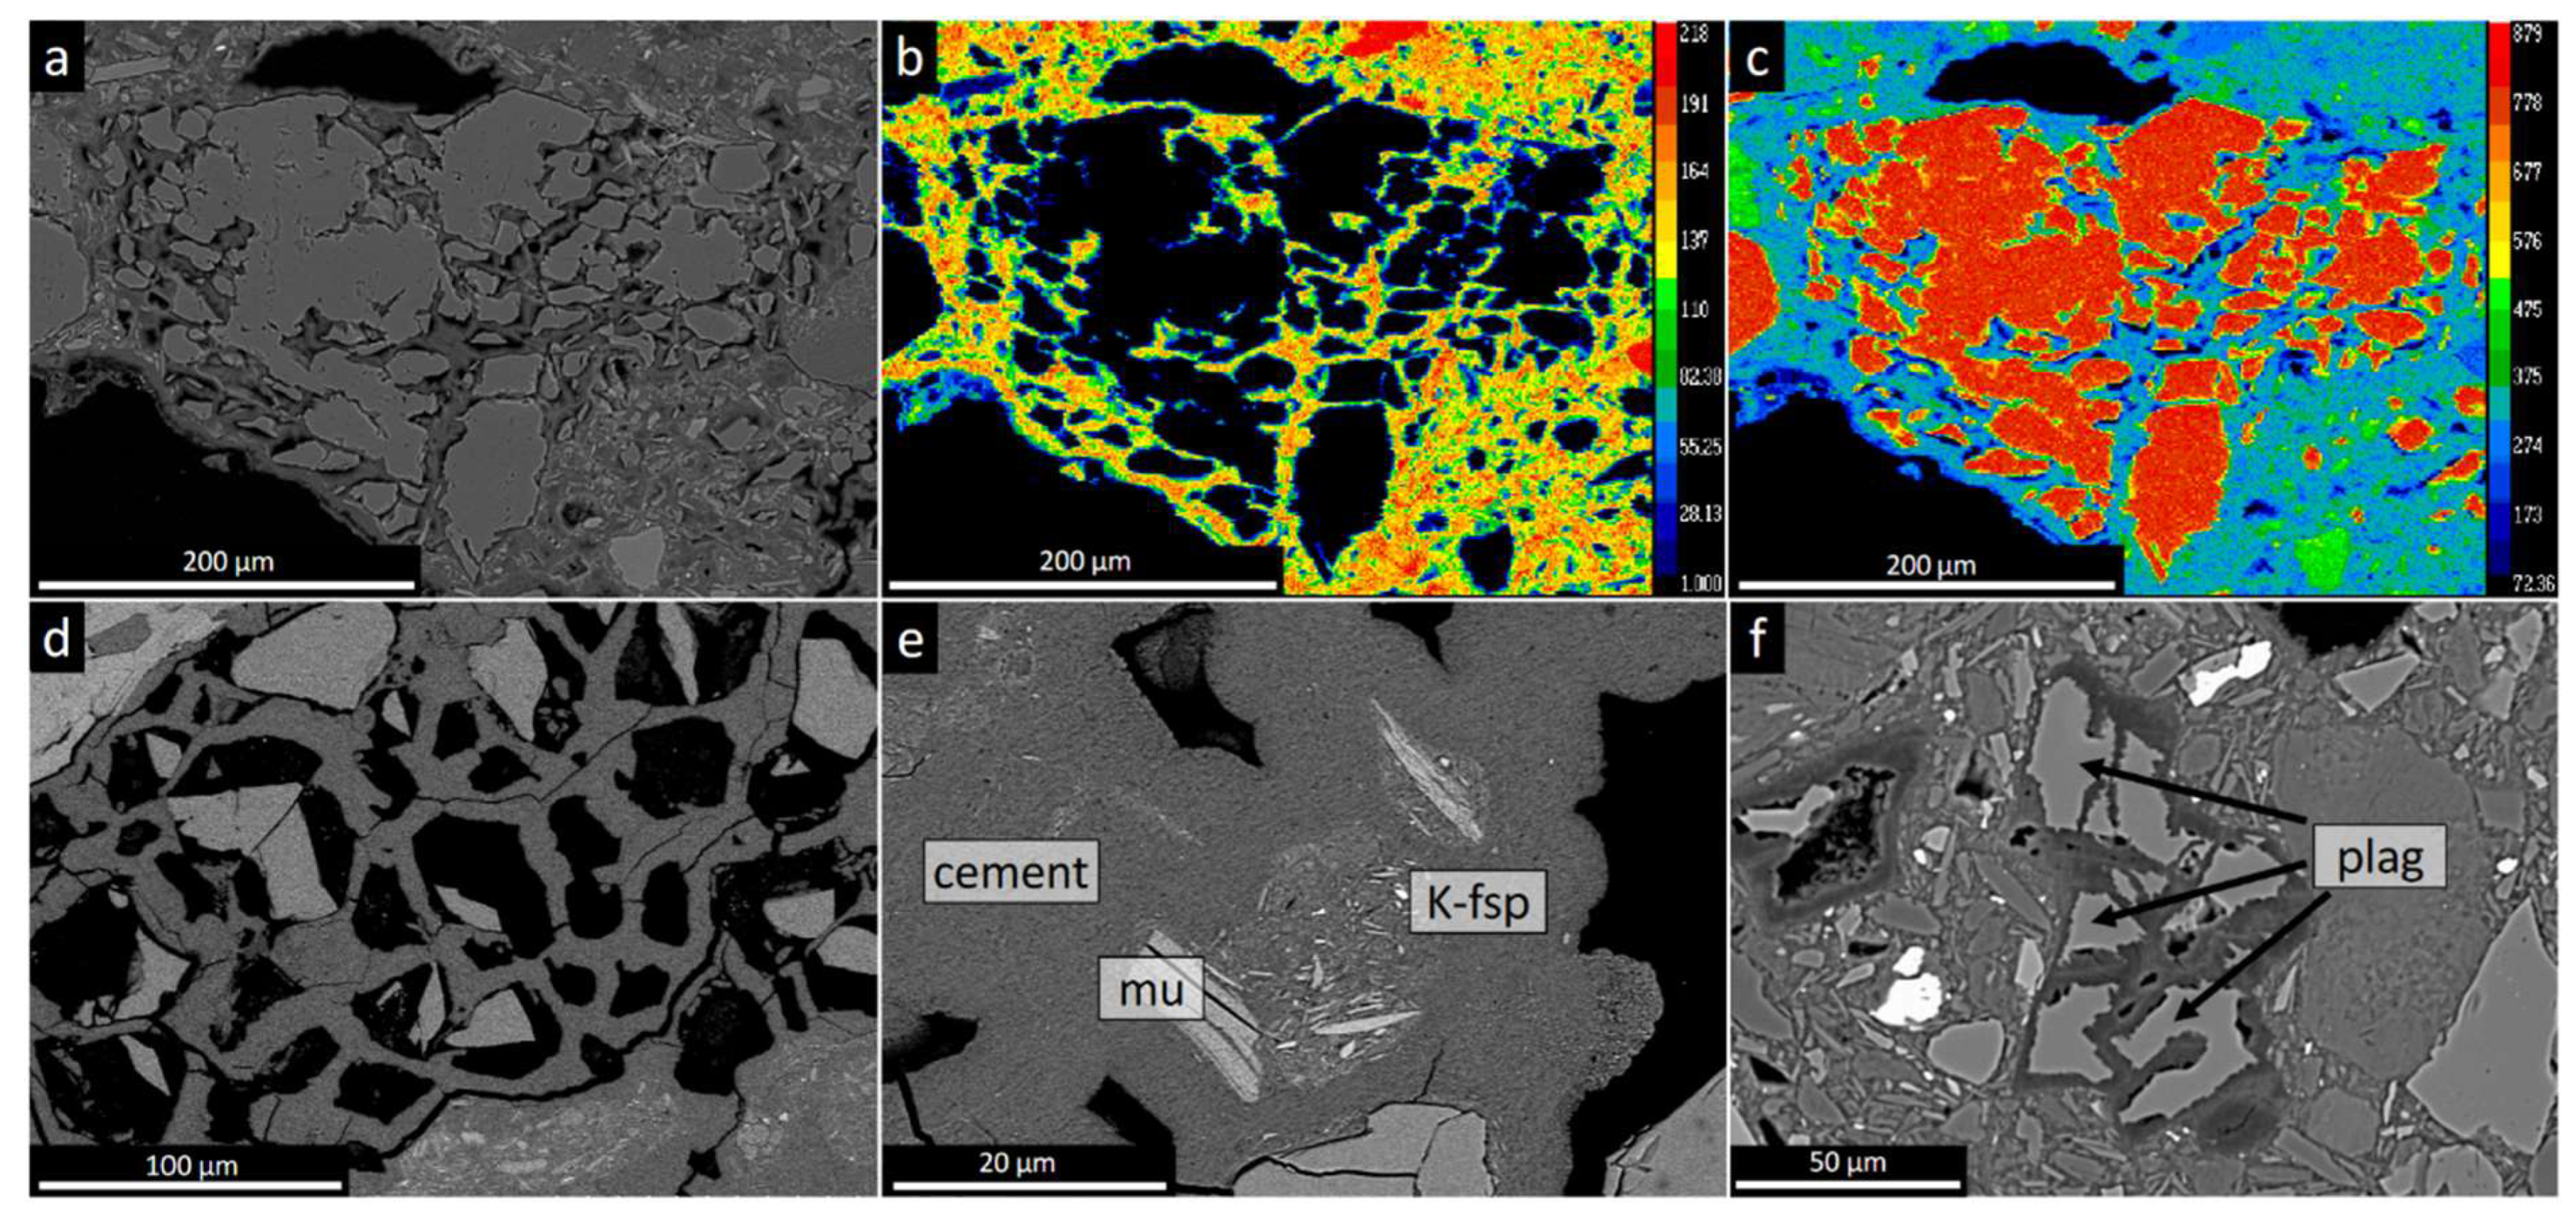
Figure 4.
Plagioclase-quartz-cement relationships. a) BSE image of adjacent grains of quartz and plagioclase surrounded by cement. b) Al map over the same area. Note that the Al is present in the cement around the plagioclase and decreases away from the plagioclase grain. c) Si map of the same area. The cement contains lower Si in the Al rich zone adjacent to the plagioclase. d) Mg map of the same area. Notice a thin zone of lower Mg content in the cement adjacent to the relict plagioclase grain. Abbreviations: mash: Al containing cement, plag: plagioclase, mu: muscovite, srp: serpentine, cc: calcite, cpx: clinopyroxene, msh: M-S-H cement, void: empty space.
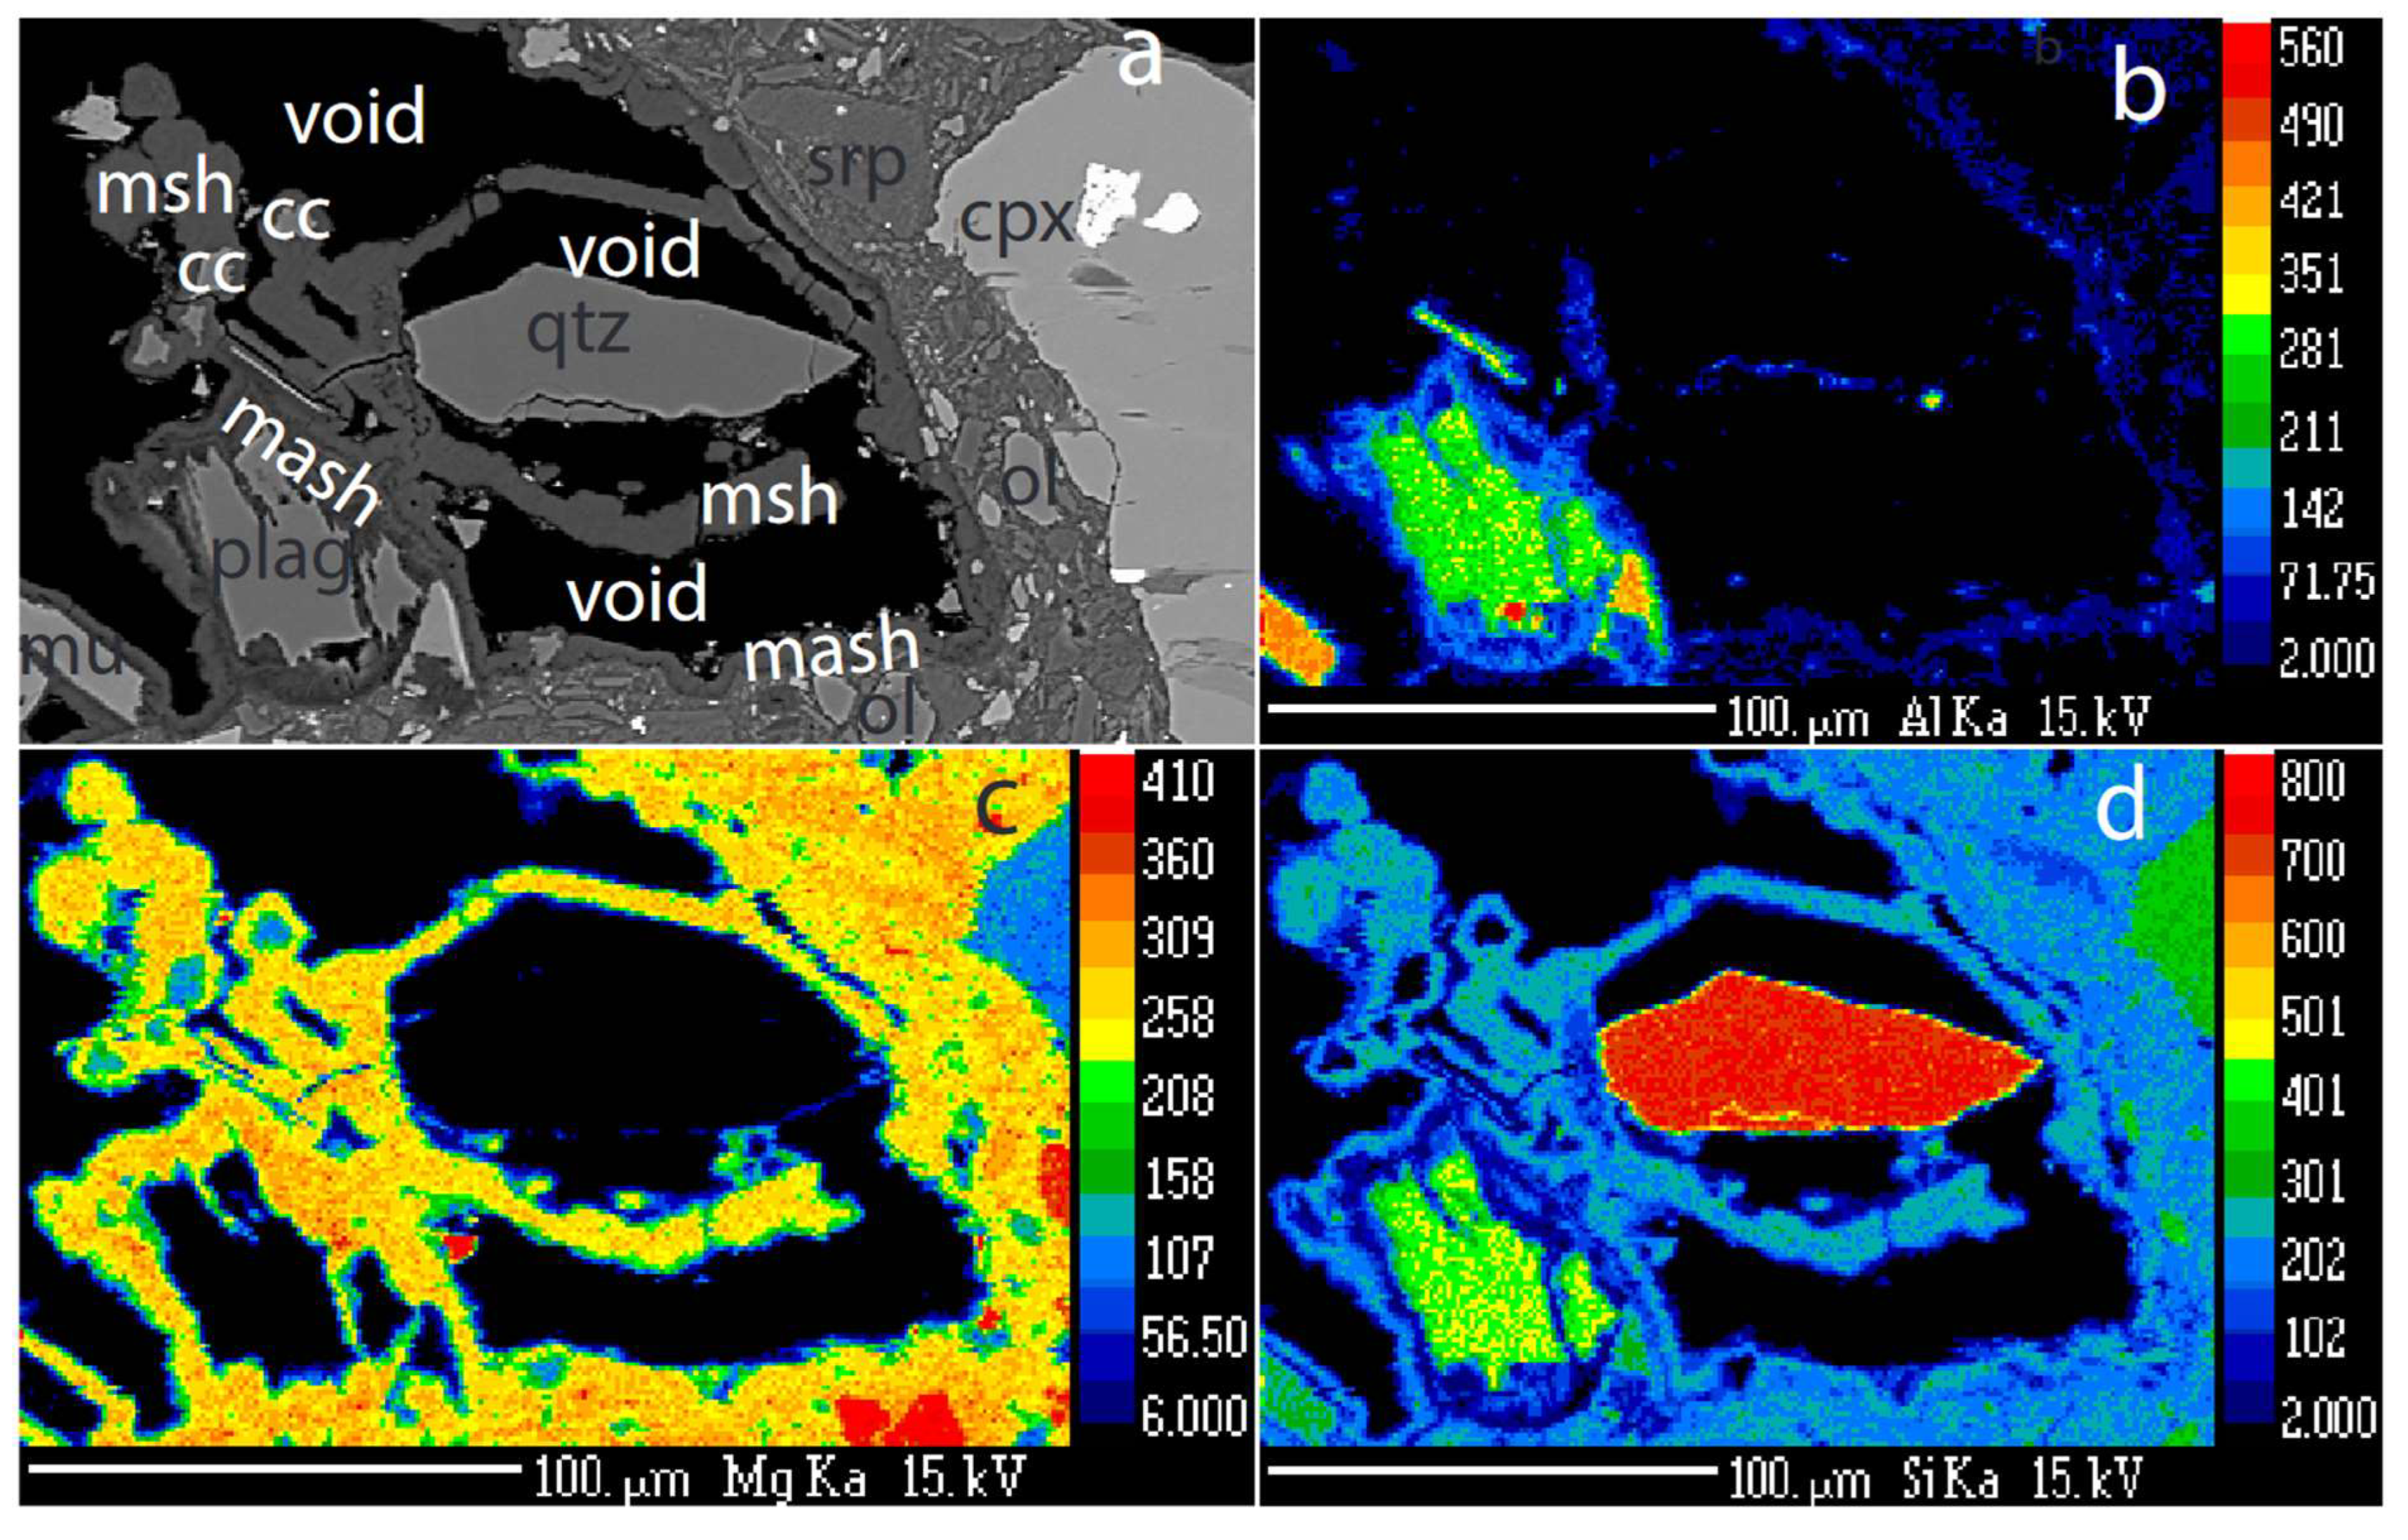
Figure 5.
Calcite, quartz, cement relationships. a) BSE image of calcite surrounding quartz grain. Veins of cement penetrated and fragment calcite grains. Abbreviations: qtz: quartz, msh: MSH cement, cc: calcite b) BSE image of calcite vein penetrating and fragmenting quartz grain.
Figure 5.
Calcite, quartz, cement relationships. a) BSE image of calcite surrounding quartz grain. Veins of cement penetrated and fragment calcite grains. Abbreviations: qtz: quartz, msh: MSH cement, cc: calcite b) BSE image of calcite vein penetrating and fragmenting quartz grain.
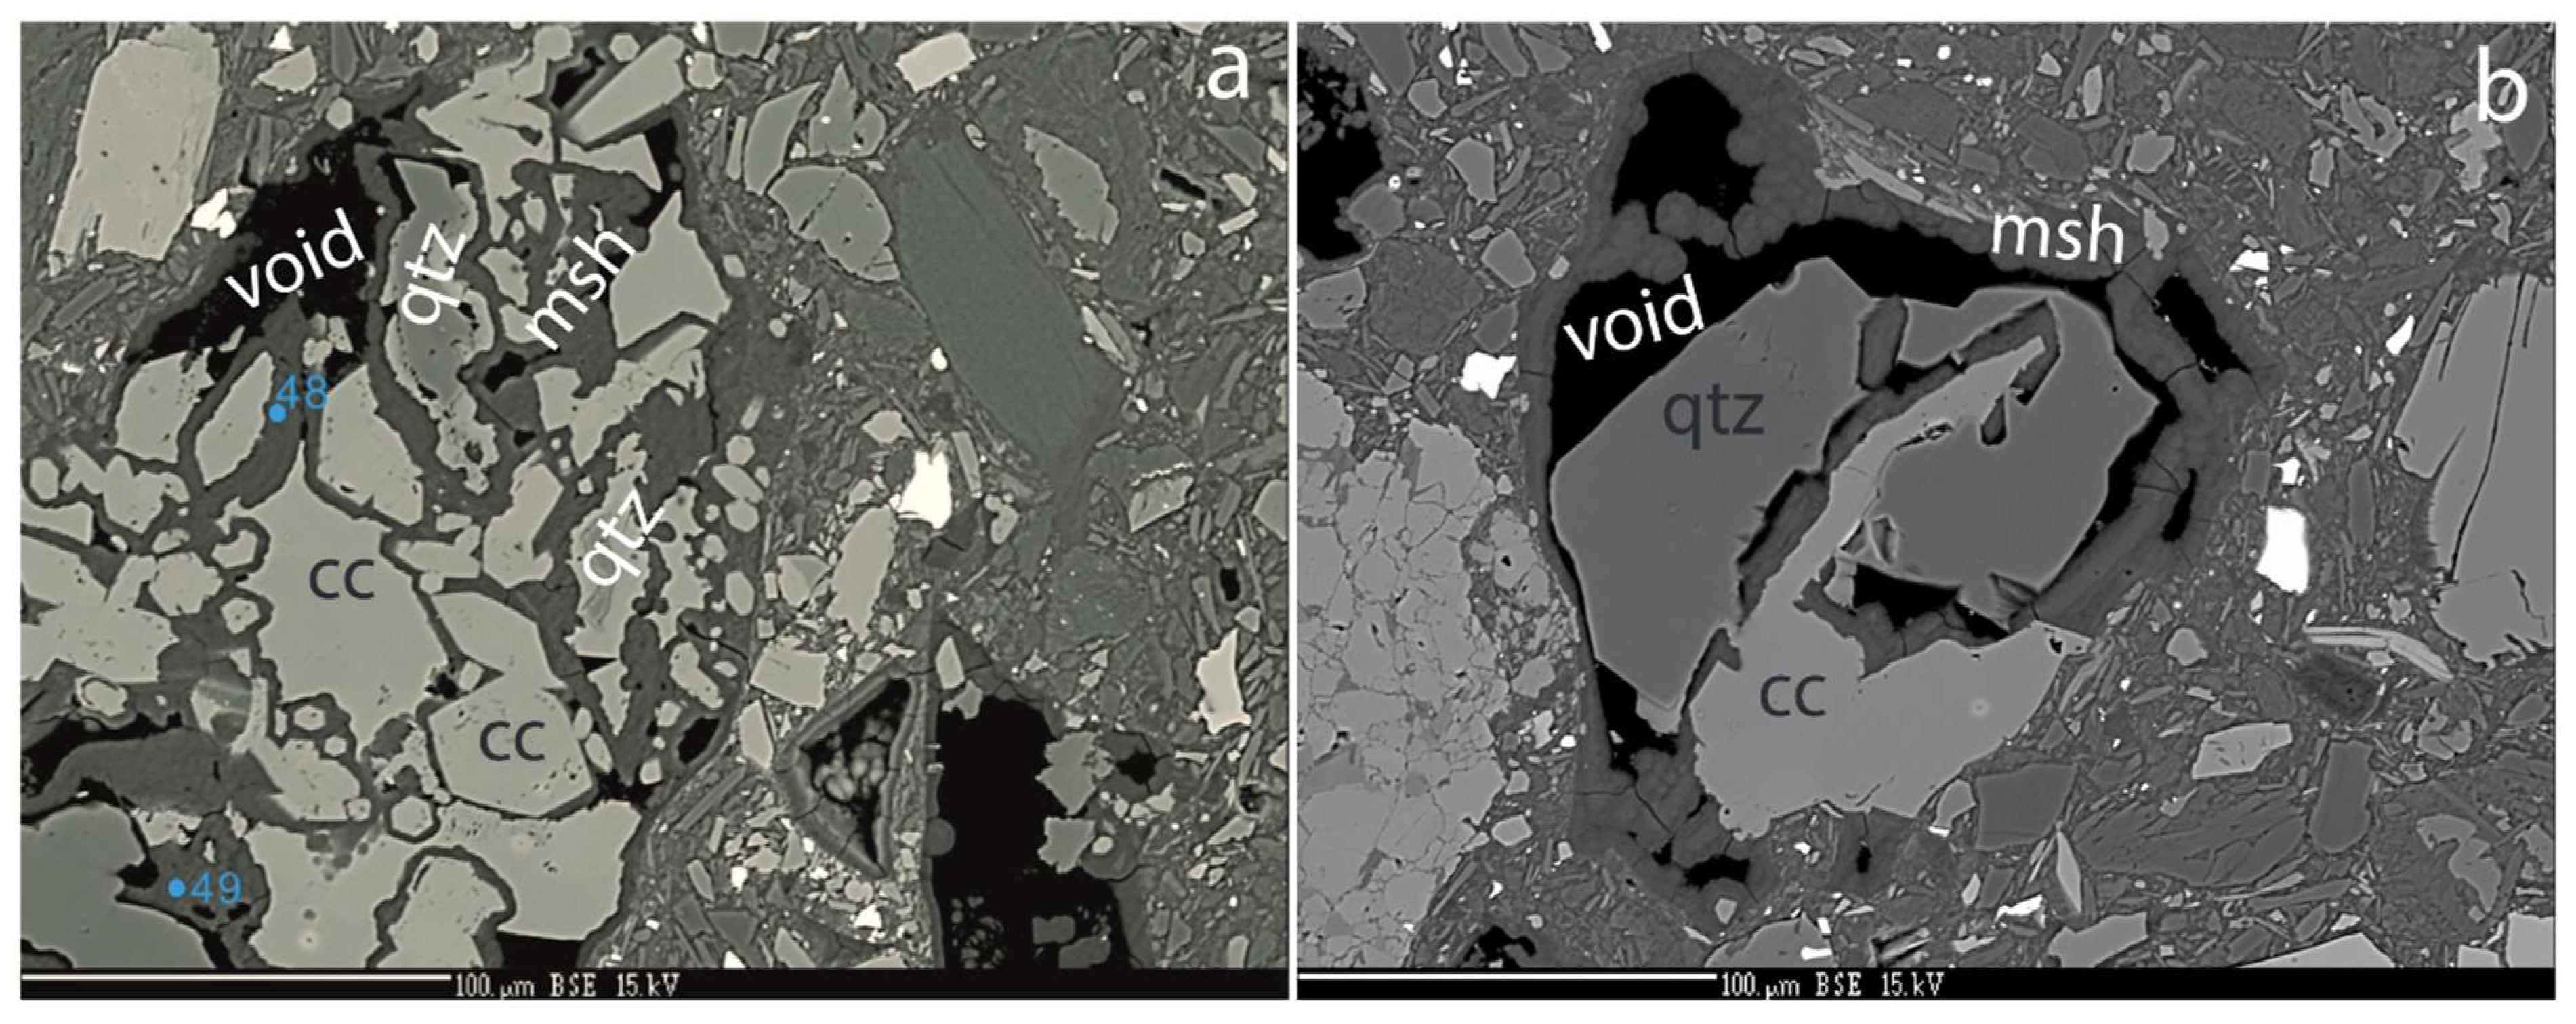
Figure 6.
a) Quartz with 50 µm long negative crystals partly filled by M-(A)-S-H cement. b) Veins filled with M-(A)-S-H cement extend > 100 µm into the quartz grain. In the lower right corner, a honeycomb texture has developed. c) Raman spectra of cement filling, dissolved quartz, and carbonate. a) The sharp peaks at 463 and 126 cm−1 and the broad peak at 205 cm−1 are typical for quartz. b) This spectrum has a peak pattern localized at 154w, 280m, 712m, 1085s and 1435w diagnostic of carbonate as situated in Calcite. In addition to these comes visible residues of the quartz matrix surrounding the Calcite grain. c) & d) Both these Raman spectra are very broad and featureless, and no clear peaks could be identified, typical for an amorphous phase.
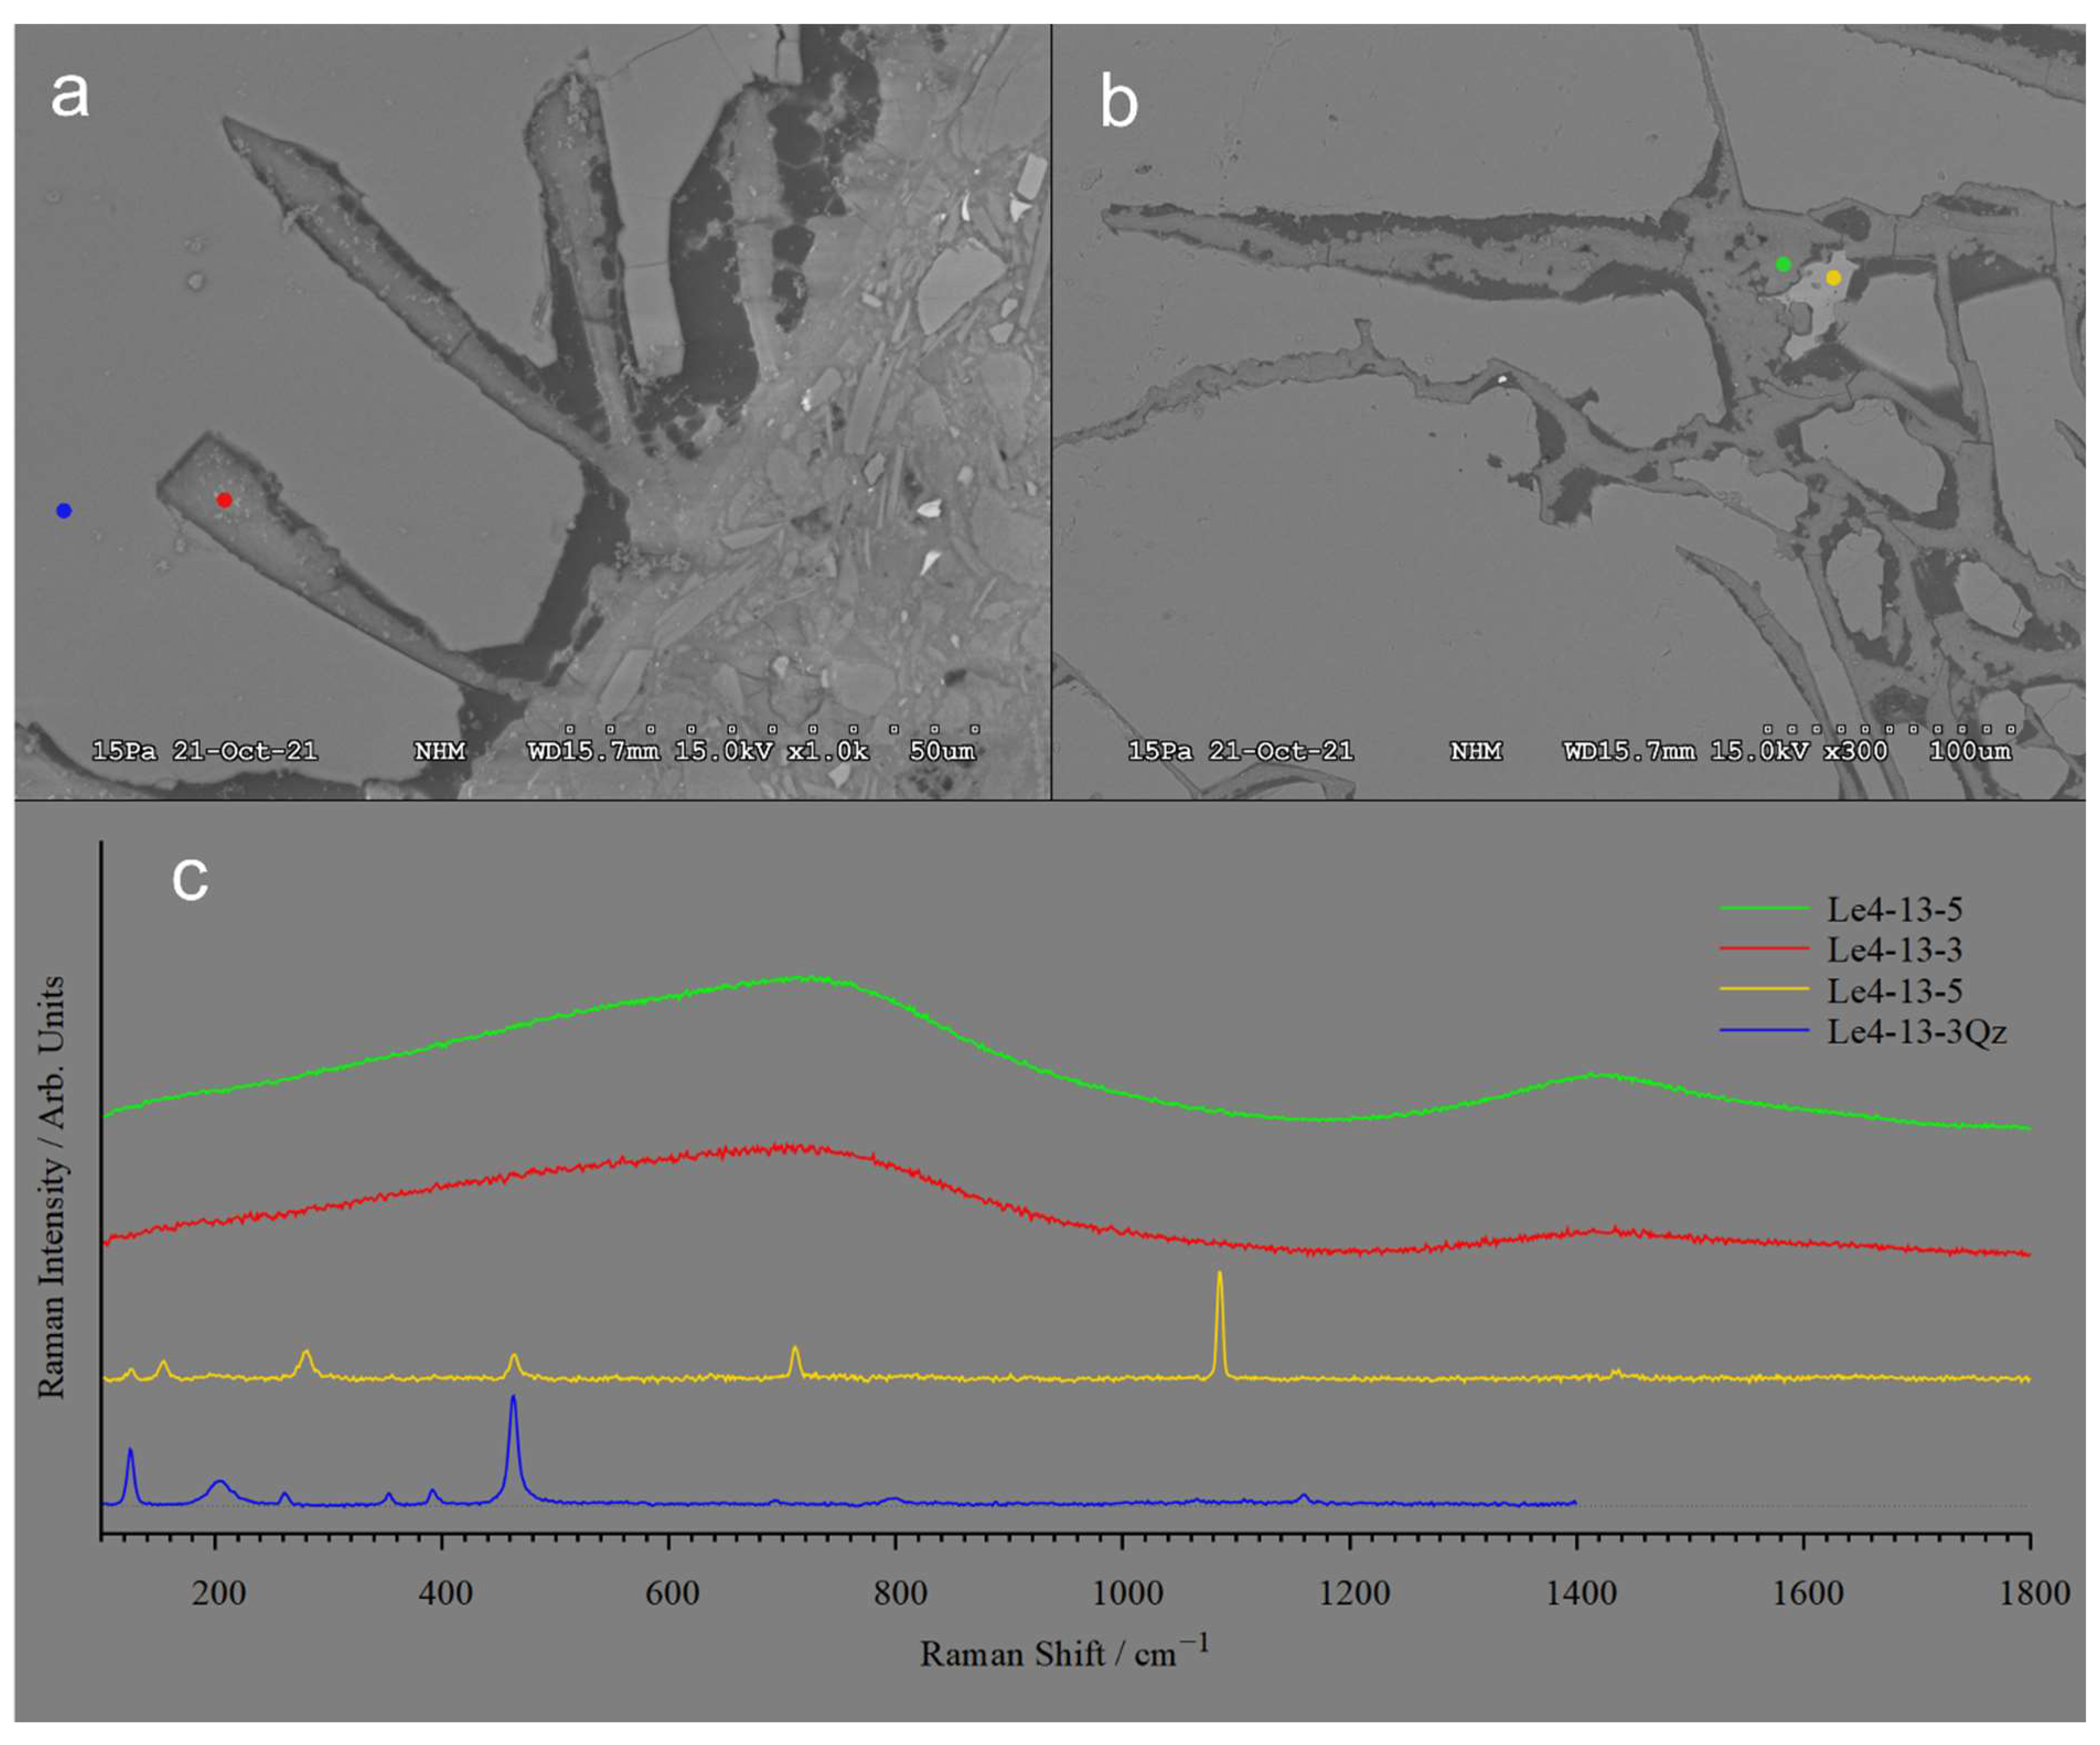
Figure 7.
a. Composition of cement from Feragen and Leka plotted in triangular (SiO2-MgO-H2O) diagram (weight %). The samples from Feragen and some of the analysis from Leka cluster in the center of diagram, while the rest of the Leka analysis show a widespread with high H2O content. b. Same samples plotted in a triangular SiO2-MgO-H2O diagram. The samples from Feragen plot along the SiO2 – MgO line. The Leka samples contain variable amounts of Al2O3.
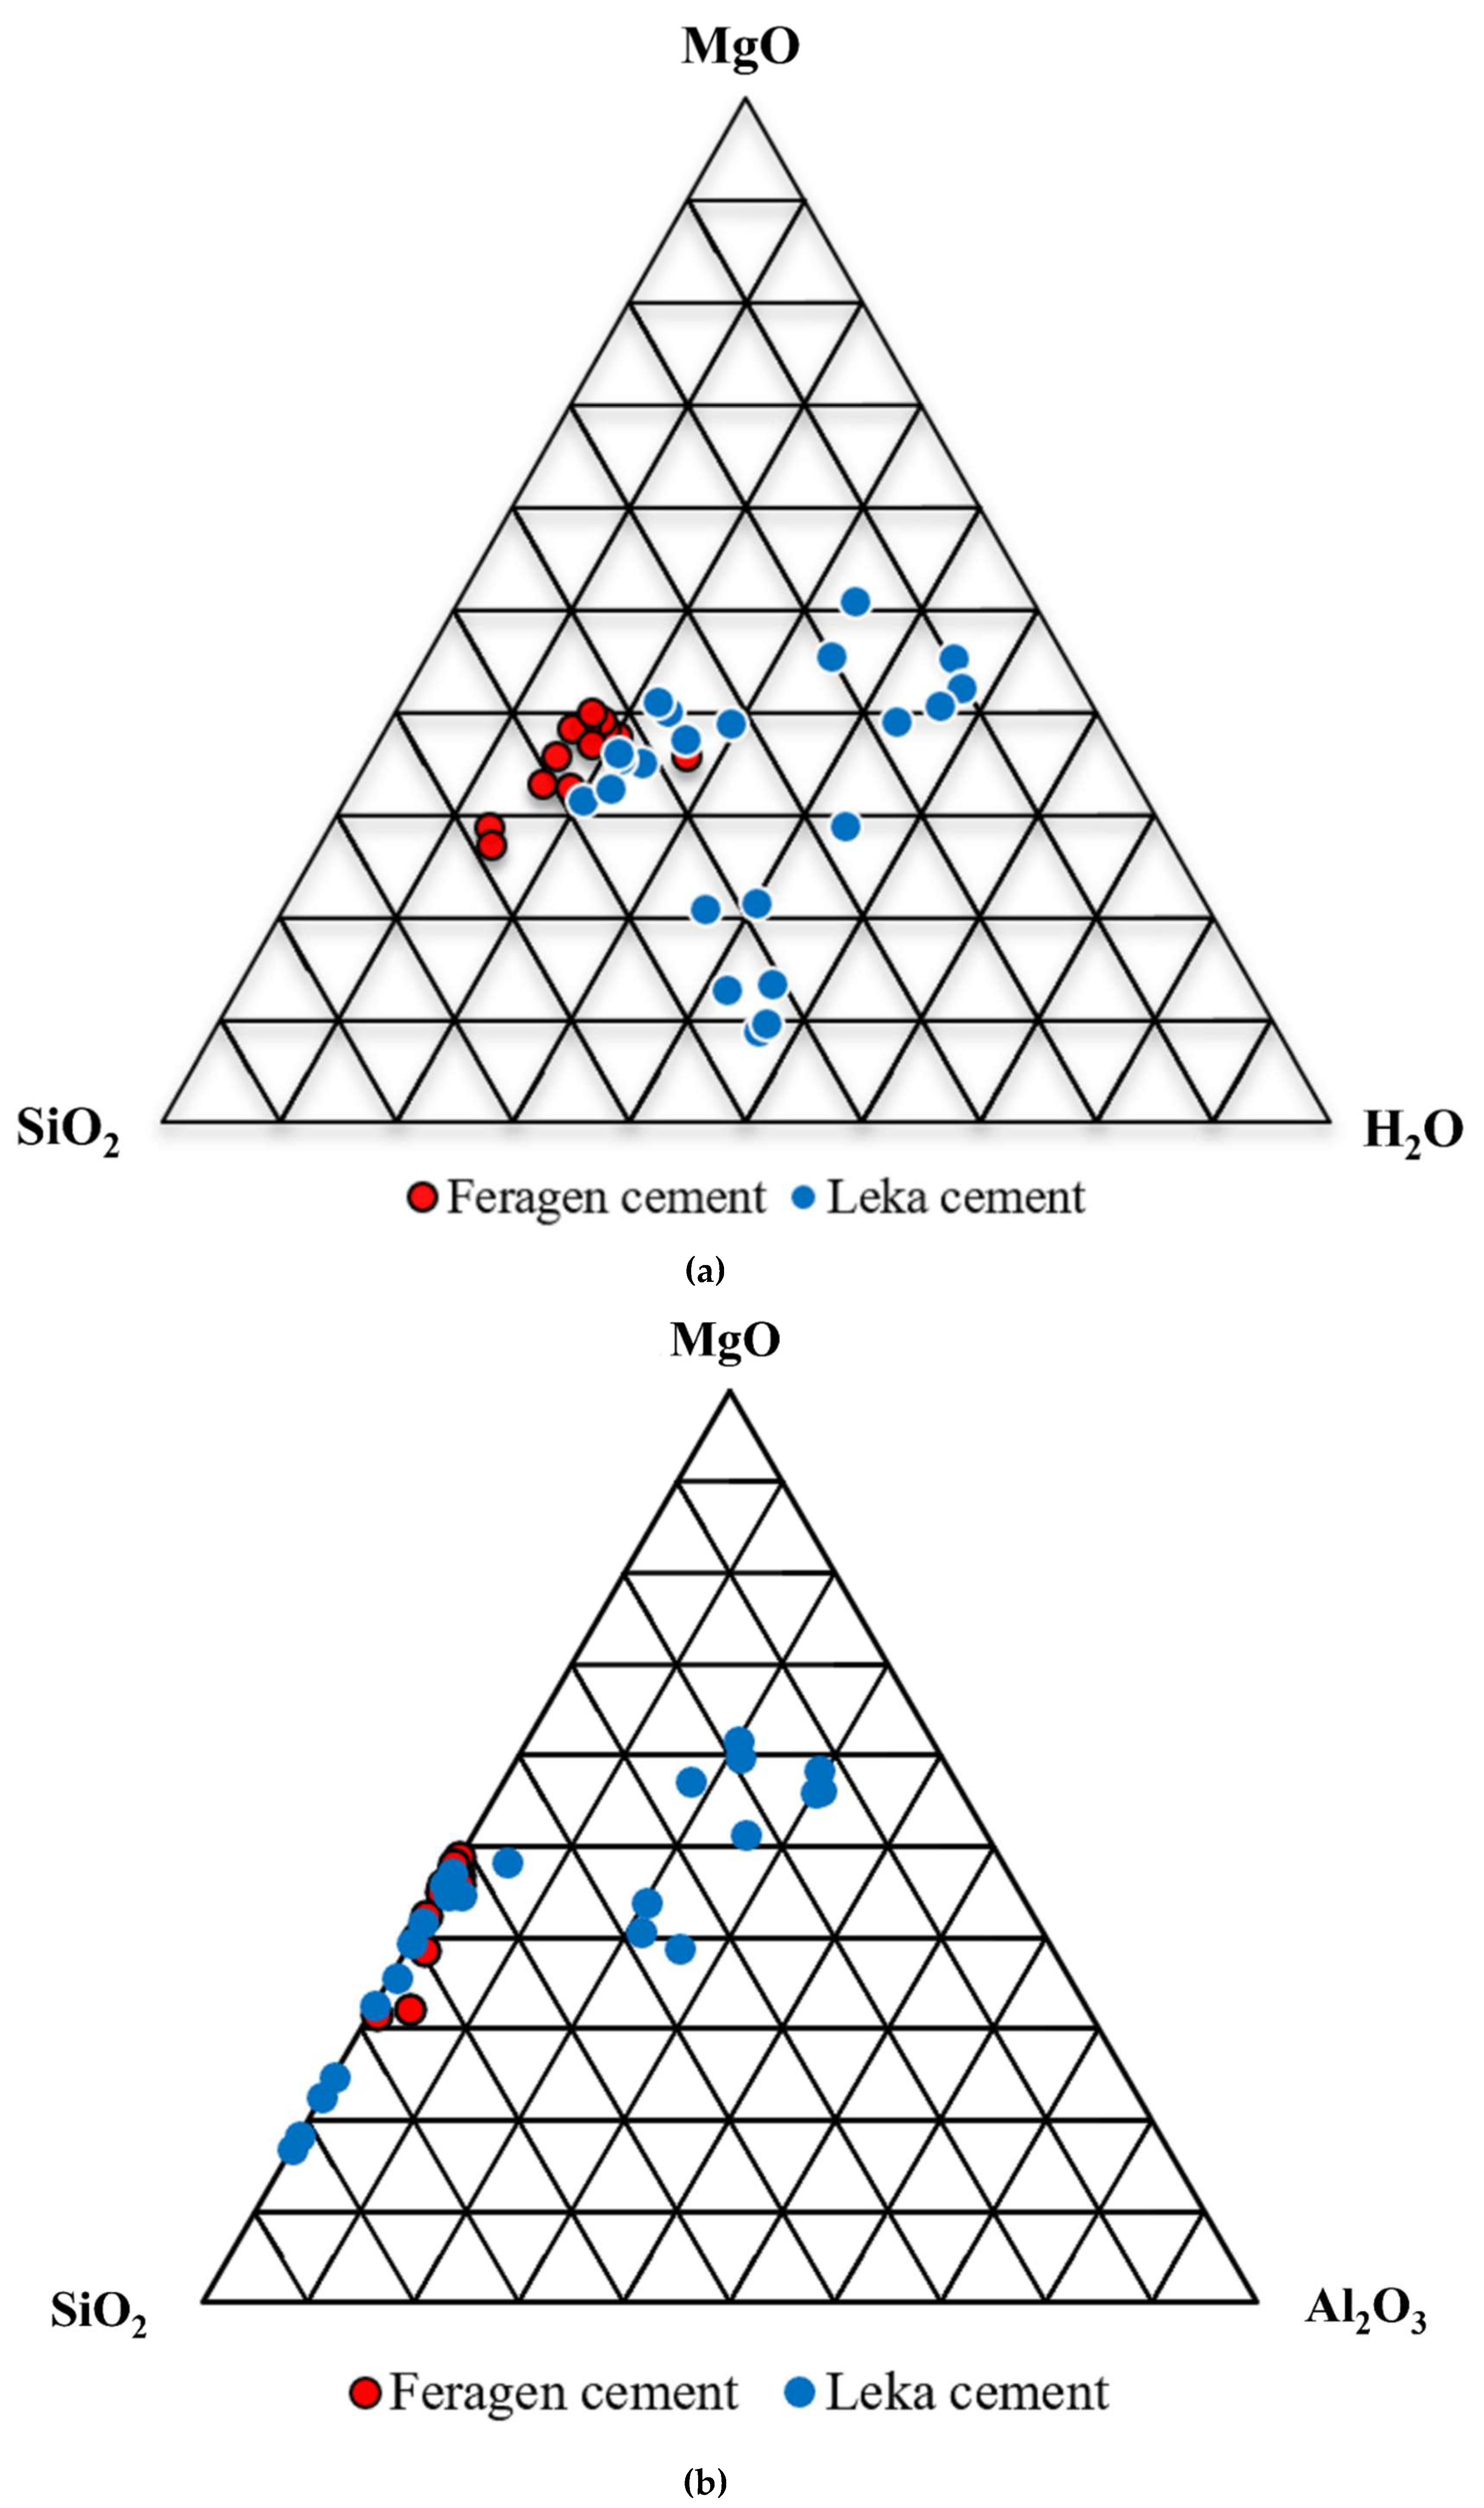
Figure 8.
Oxide ratios across the weathering rinds for six samples from Feragen. The error bars denote the 1-sigma standard deviation of the data variability. MgO/NiO, MgO/SiO2 and MgO/FeO ratios all decreases in the traverse from the pristine peridotite to the intermediate and outer zones. The data is in accordance with a loss of MgO during weathering.
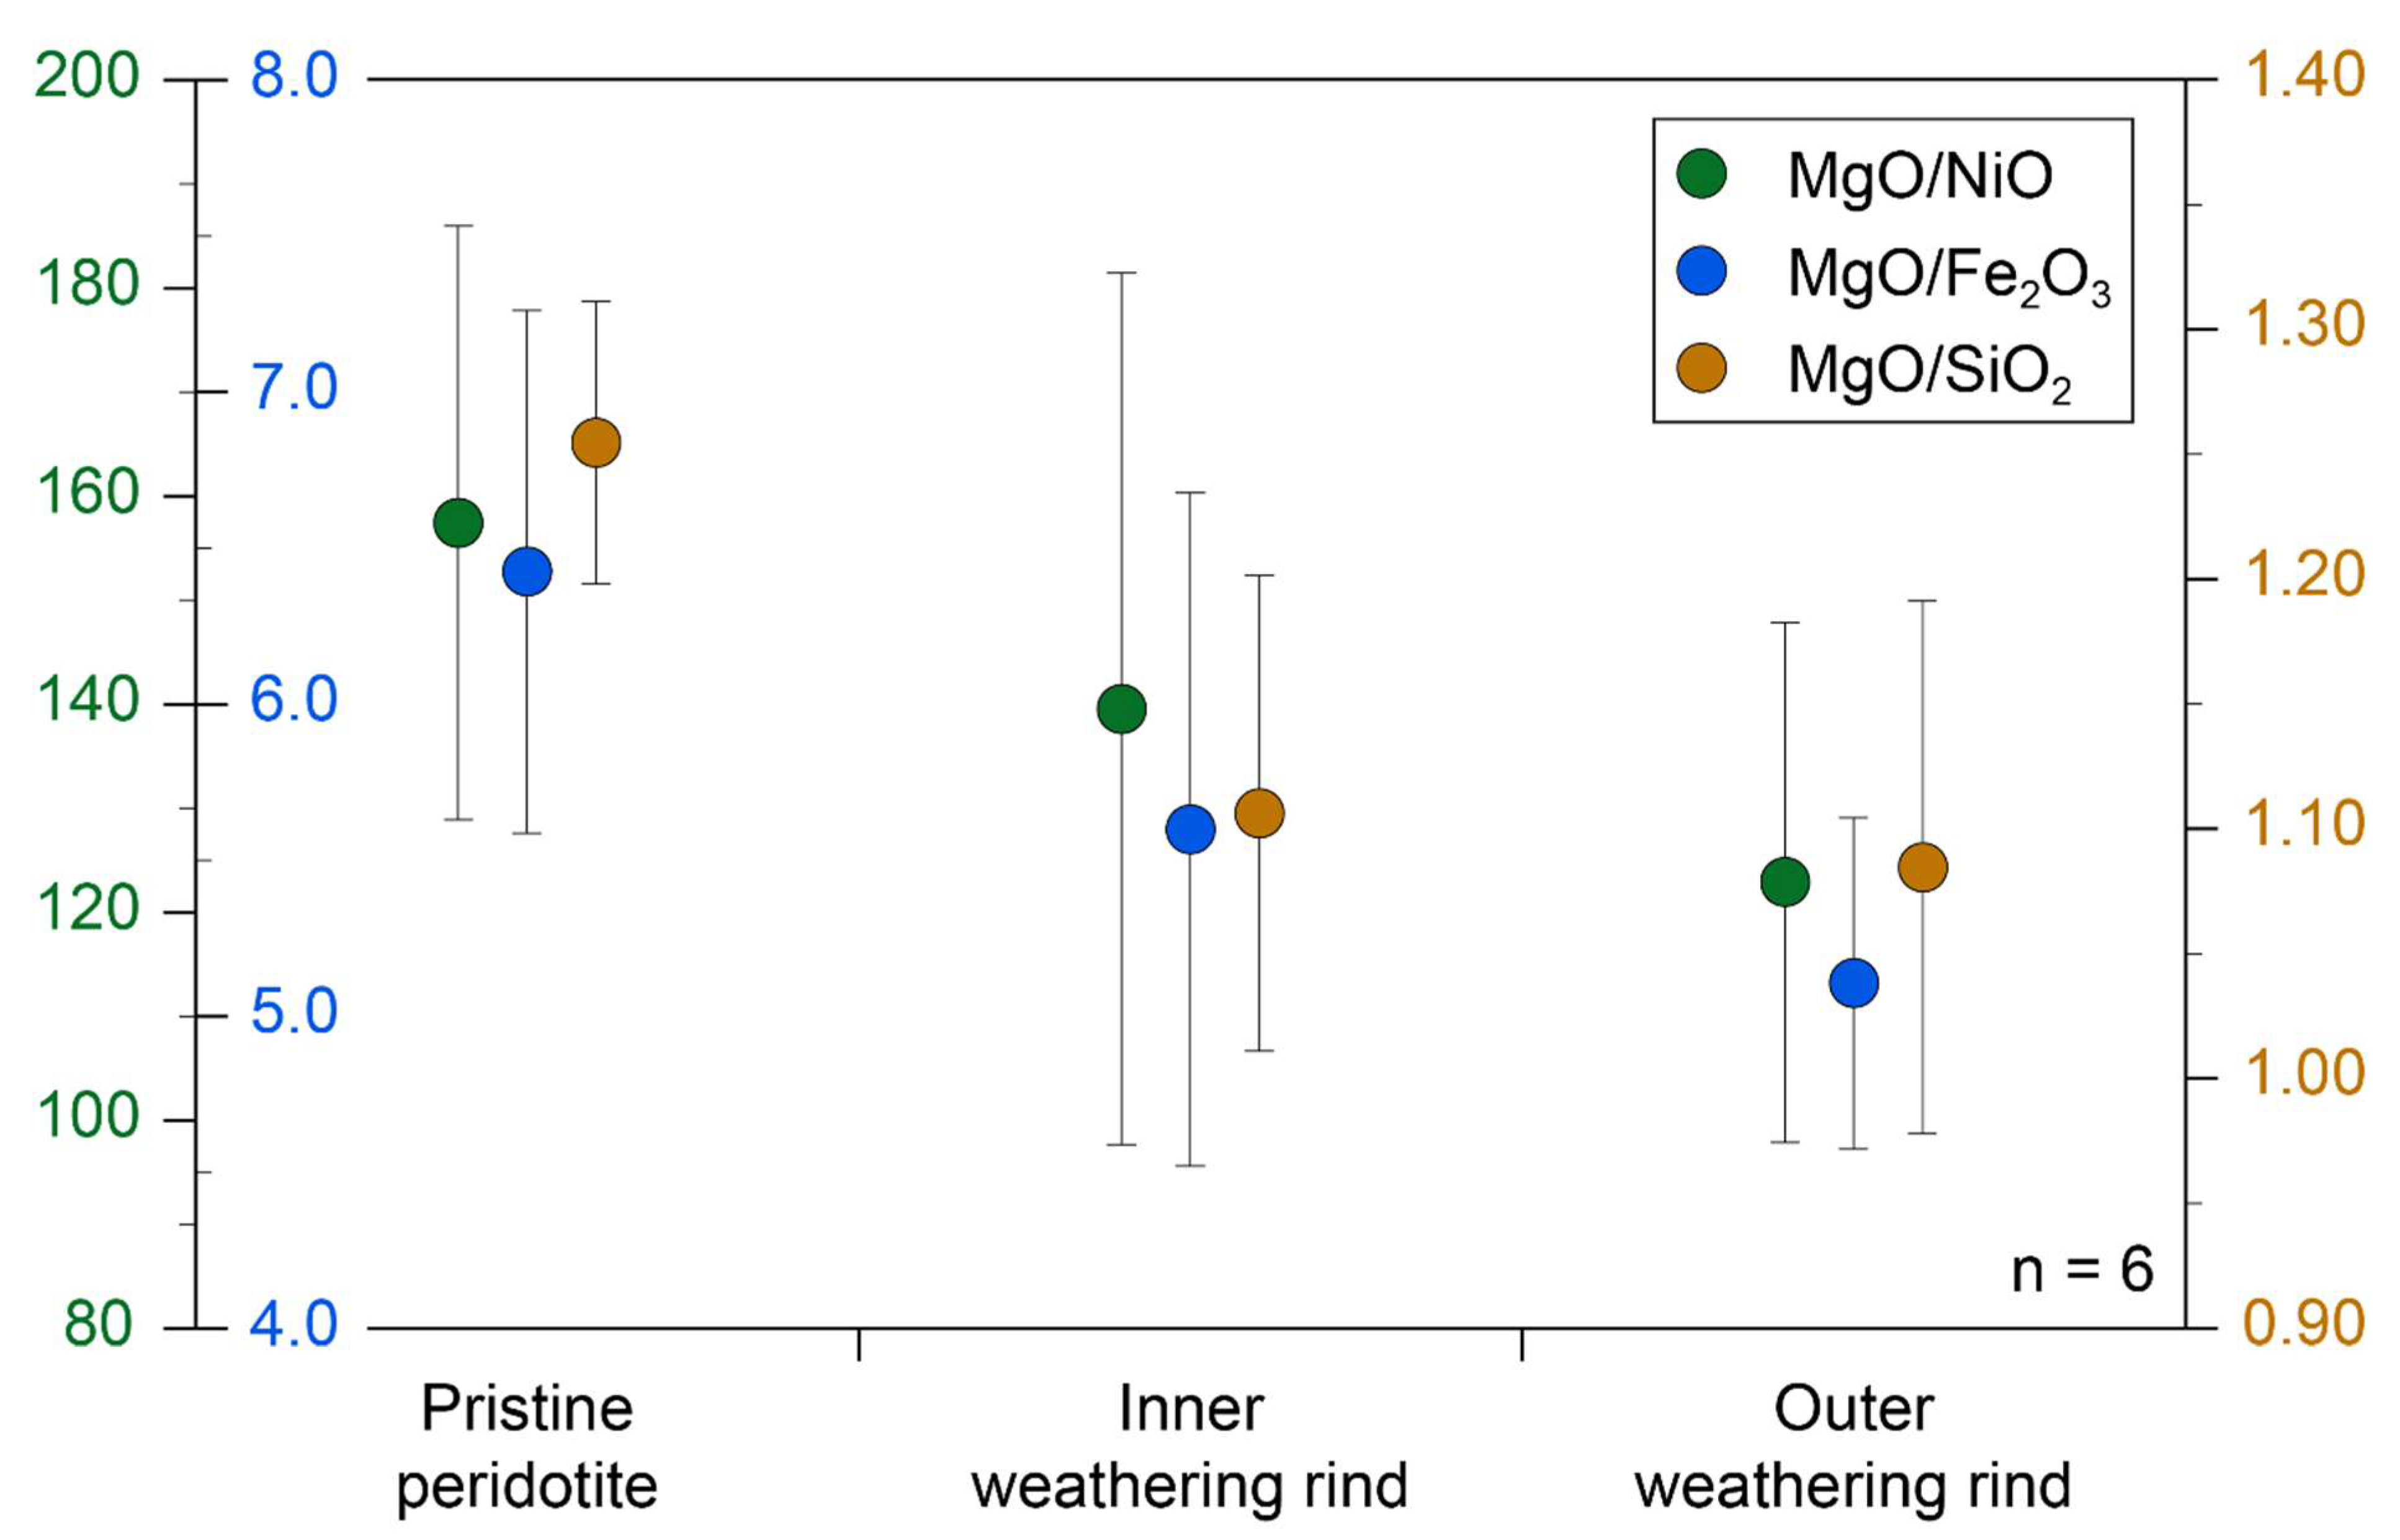
Figure 9.
a) Frostboil with till locally covers the ground at Feragen. b) A trench dug through a frostboil reveal a white sand without apparent ultramafic material. c) M-S-H cemented till adjacent to frostboil. A sample (F21-15) from this outcrop was analyzed for major and trace elements and compared with till from the trench (F18-15 and F19-15).
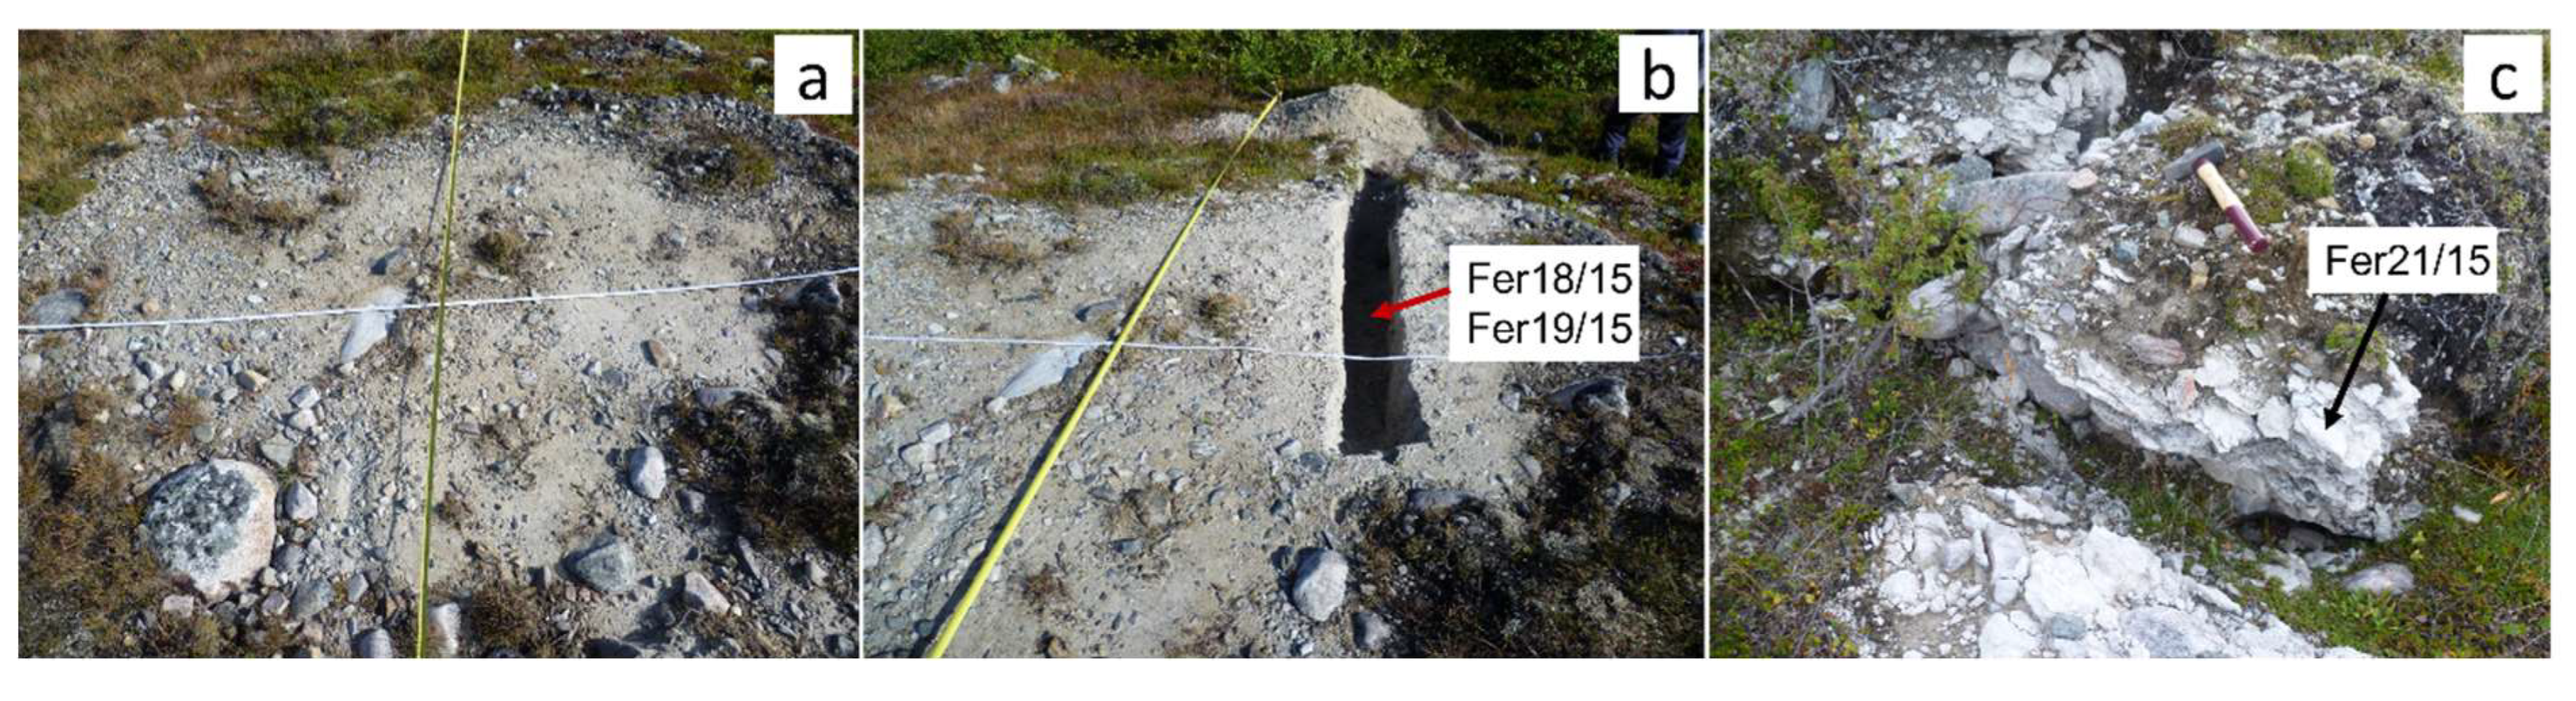
Figure 10.
Lanthanide patterns. Chondrite normalized lanthanide pattern for two samples of till (FER18/15 and FER19/15) compared with one sample (FER21/15) from nearby M-S-H cemented till(tillite). Normalization factors are after Taylor and McClennan [55]. The close similarity of the three samples suggests that the tillite has inherited their Lanthanides composition from the till.
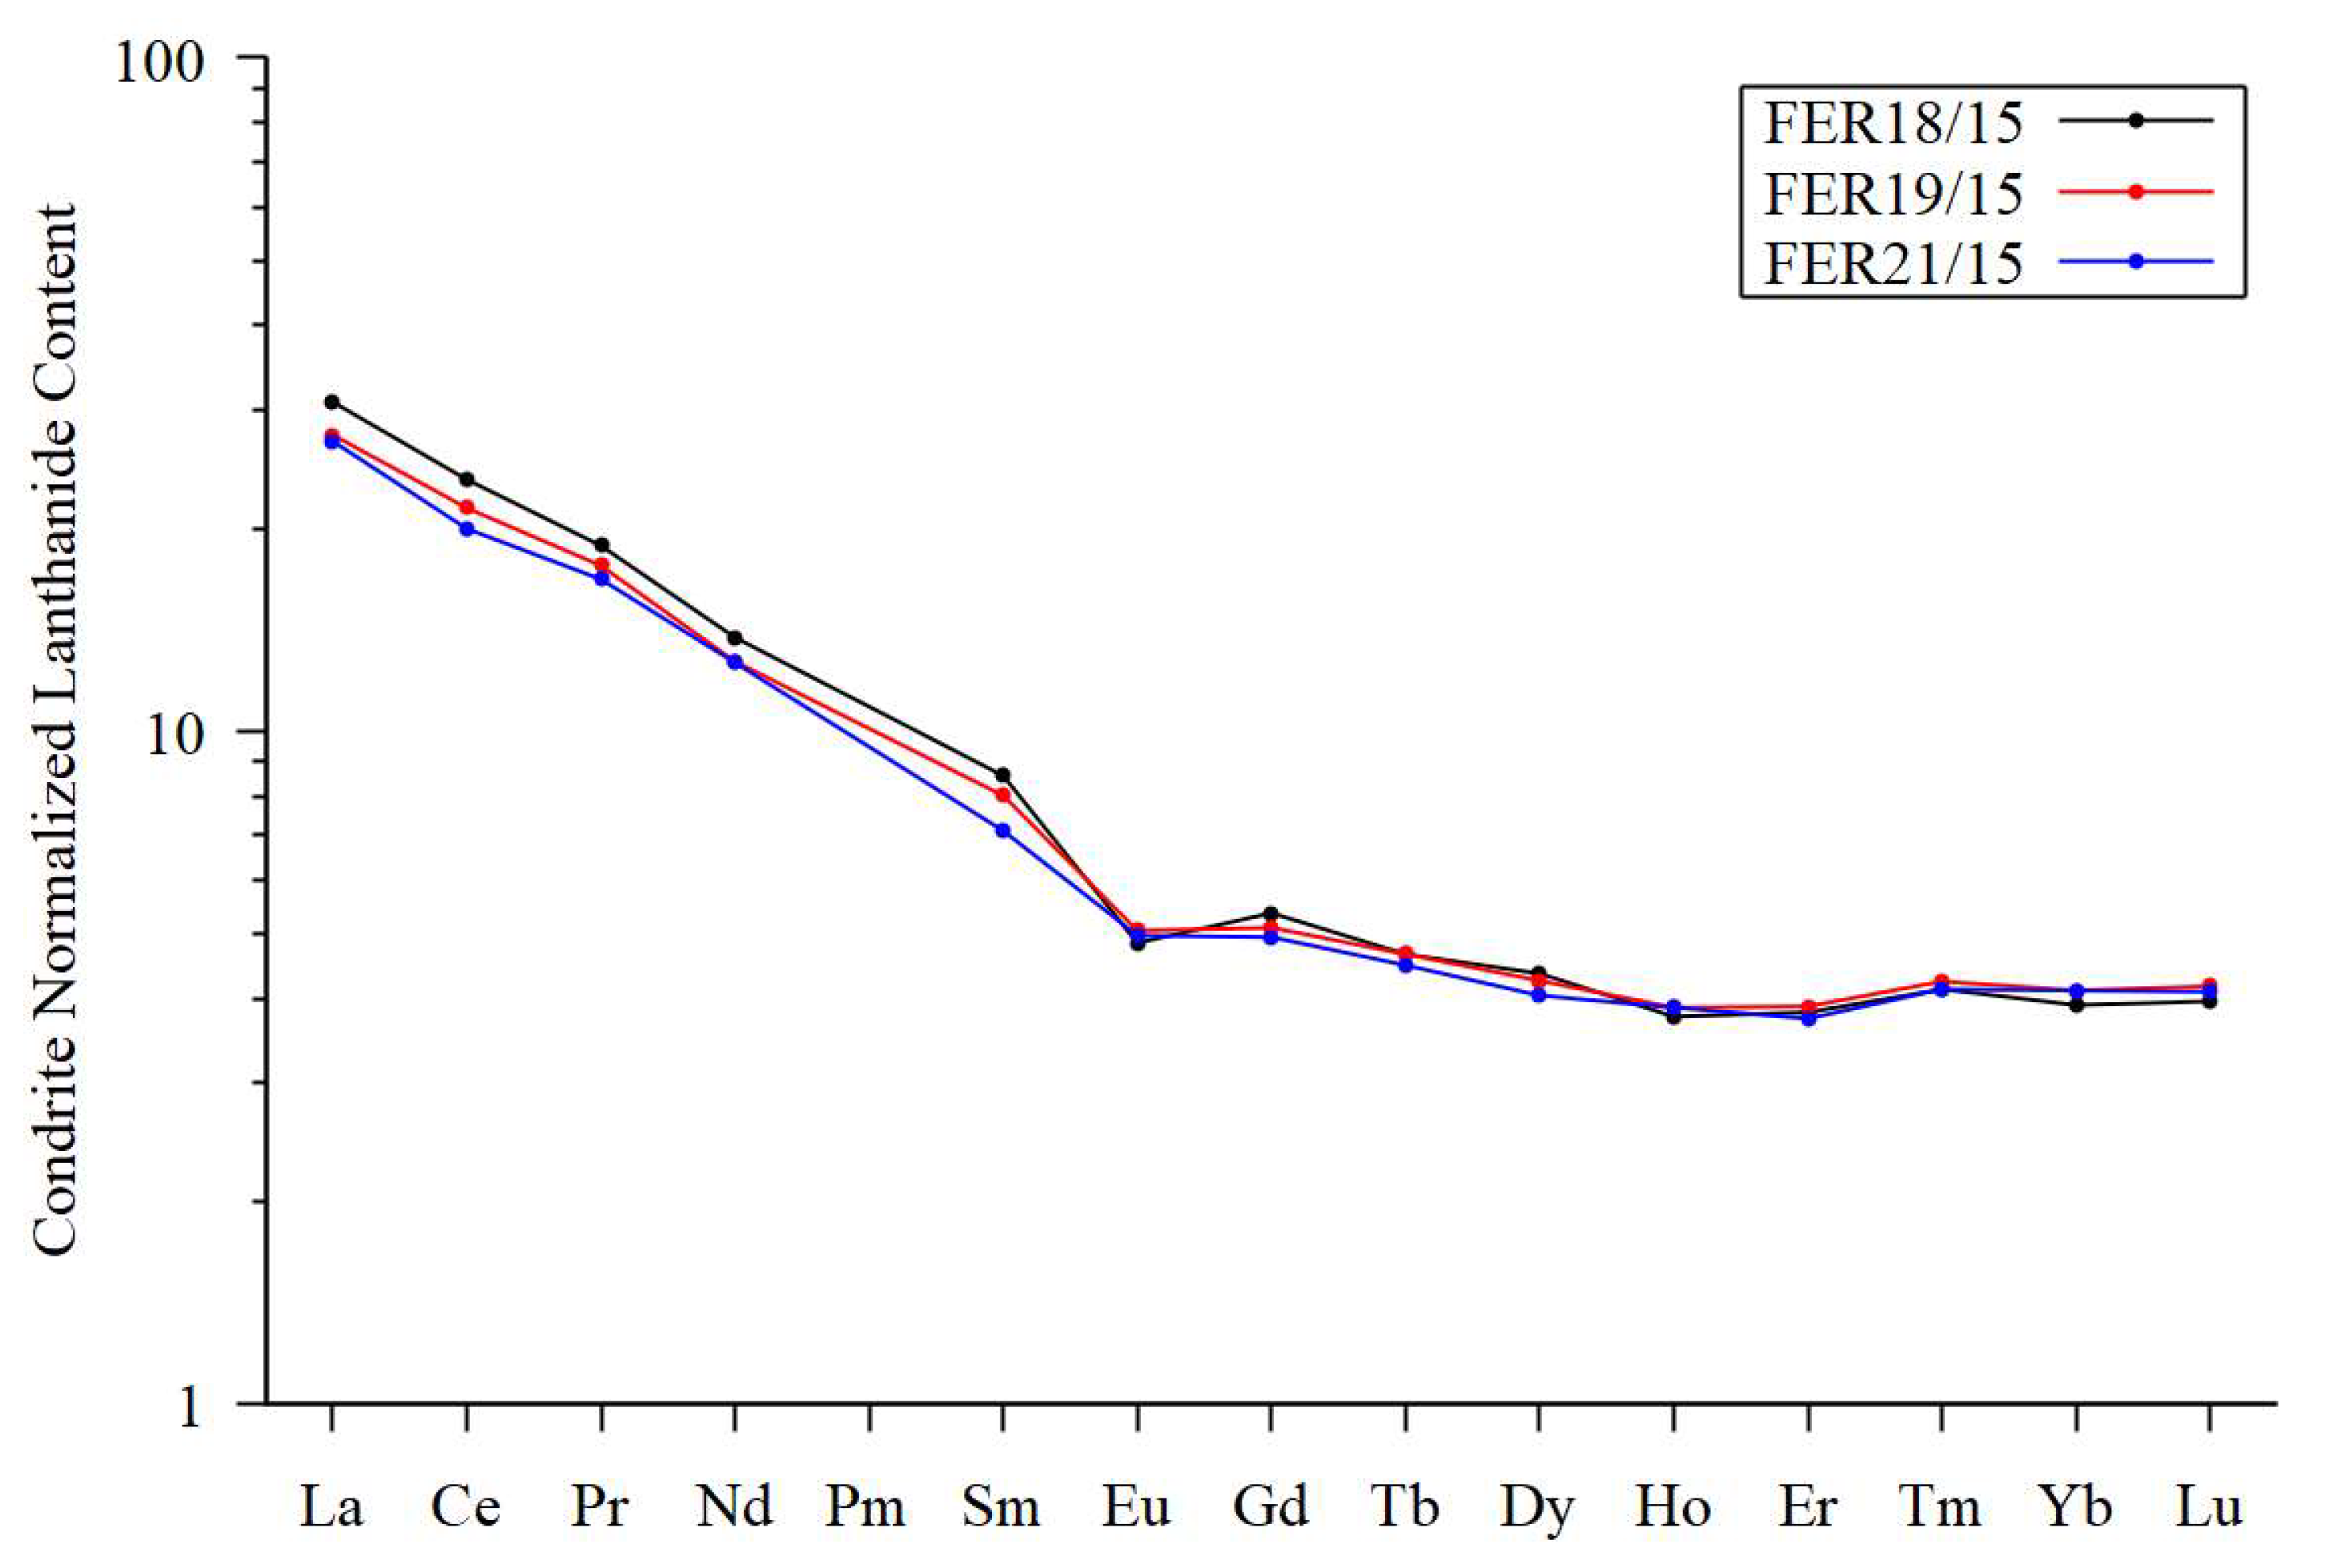

Table 1.
Brucite, Feragen.
| SiO2 | 2,81 | 0,83 | 0,16 |
|---|---|---|---|
| Al2O3 | 0,01 | 0,00 | 0,01 |
| FeO | 15,00 | 6,28 | 9,75 |
| MnO | 0,29 | 0,30 | |
| MgO | 55,19 | 61,98 | 60,10 |
| CaO | 0,00 | 0,07 | 0,07 |
| Cr2O3 | 0,01 | 0,06 | 0,00 |
| NiO | 0,54 | 0,06 | 0,60 |
| Total | 74,16 | 69,56 | 70,95 |
Table 2.
Composition of cement in lithified till and moraine.
| Feragen | ||||||||||||||
|---|---|---|---|---|---|---|---|---|---|---|---|---|---|---|
| Sample | F9-12 | F9-12 | F8-12 | F8-12 | F8-12 | F8-12 | F8-12 | F8-12 | F8-12 | F8-12 | F8-12 | F7-12 | F7-12 | F7-12 |
| SiO2 | 54.75 | 57.66 | 42.96 | 42.09 | 42.30 | 42.58 | 37.24 | 43.39 | 45.49 | 44.55 | 43.23 | 48.07 | 49.61 | 47.67 |
| TiO2 | 0.05 | 0.01 | 0.00 | 0.00 | 0.01 | 0.01 | 0.00 | 0.01 | 0.00 | 0.00 | 0.00 | 0.00 | 0.00 | 0.01 |
| Al2O3 | 3.16 | 0.75 | 0.18 | 0.15 | 0.77 | 0.36 | 0.03 | 1.27 | 0.01 | 0.13 | 0.00 | 0.39 | 1.55 | 0.06 |
| FeO | 0.43 | 0.12 | 0.15 | 0.07 | 0.10 | 0.13 | 0.16 | 0.60 | 0.06 | 0.16 | 0.05 | 0.29 | 0.38 | 0.88 |
| MnO | 0.00 | 0.00 | 0.05 | 0.01 | 0.02 | 0.02 | 0.00 | 0.00 | 0.00 | 0.01 | 0.03 | 0.09 | 0.09 | 0.07 |
| MgO | 27.38 | 26.76 | 38.95 | 37.45 | 37.98 | 38.81 | 35.59 | 37.75 | 38.37 | 36.63 | 39.77 | 32.19 | 32.12 | 35.11 |
| CaO | 0.28 | 0.06 | 0.07 | 0.07 | 0.02 | 0.01 | 0.05 | 0.06 | 0.10 | 0.06 | 0.05 | 0.23 | 0.11 | 0.41 |
| Na2O | 0.20 | 0.00 | 0.00 | 0.01 | 0.00 | 0.00 | 0.02 | 0.06 | 0.02 | 0.07 | 0.01 | 0.01 | 0.06 | 0.08 |
| K2O | 0.72 | 0.03 | 0.03 | 0.04 | 0.13 | 0.02 | 0.01 | 0.29 | 0.02 | 0.08 | 0.01 | 0.09 | 0.40 | 0.02 |
| Cr2O3 | 0.00 | 0.00 | 0.00 | 0.00 | 0.00 | 0.04 | 0.00 | 0.02 | 0.00 | 0.00 | 0.00 | 0.05 | 0.14 | 0.02 |
| NiO | 0.01 | 0.01 | 0.07 | 0.05 | 0.00 | 0.06 | 0.02 | 0.03 | 0.00 | 0.00 | 0.03 | 0.08 | 0.01 | 0.05 |
| Total | 86.97 | 85.36 | 82.41 | 79.89 | 81.31 | 82.03 | 73.03 | 83.47 | 84.05 | 81.63 | 83.17 | 81.48 | 84.25 | 84.37 |
| H2O | 13.03 | 14.64 | 17.59 | 20.11 | 18.69 | 17.97 | 26.97 | 16.53 | 15.95 | 18.37 | 16.83 | 18.52 | 15.75 | 15.63 |
| Leka | ||||||||||||||
| Sample | L14.1a | L14.1a | L14.1a | L14.1a | L14.1b | L14.1b | L14.1b | L14.1b | L14.1b | L14.1b | L14.1b | L14.1b | L14.1b | |
| SiO2 | 23.04 | 7.78 | 8.20 | 8.45 | 14.48 | 44.33 | 40.95 | 45.08 | 43.40 | 42.94 | 38.24 | 26.22 | 27.47 | |
| TiO2 | 0 | 0.00 | 0.01 | 0.00 | 0.01 | 0.01 | 0.00 | 0 | 0.00 | 0.01 | 0.00 | 0.01 | 0.01 | |
| Al2O3 | 12.89 | 18.47 | 18.68 | 18.42 | 16.42 | 0.02 | 0.03 | 0.01 | 0.03 | 0.04 | 0.31 | 14.75 | 20.04 | |
| FeO | 0.73 | 0.14 | 0.15 | 0.36 | 0.17 | 0.07 | 0.04 | 0.07 | 0.08 | 0.07 | 0.05 | 0.86 | 0.17 | |
| MnO | 0.05 | 0.00 | 0.04 | 0.02 | 0.06 | 0.00 | 0.00 | 0.00 | 0.00 | 0.01 | 0.09 | 0.05 | 0.01 | |
| MgO | 24.59 | 36.78 | 34.42 | 34.24 | 32.52 | 8.94 | 13.51 | 13.04 | 9.68 | 20.84 | 21.38 | 31.96 | 30.11 | |
| CaO | 0.73 | 0.10 | 0.11 | 0.04 | 0.14 | 0.13 | 0.14 | 0.06 | 0.11 | 0.17 | 0.11 | 1.37 | 2.82 | |
| Na2O | 0.14 | 0.00 | 0.03 | 0.00 | 0.03 | 0.04 | 0.02 | 0.01 | 0.00 | 0.01 | 0.01 | 0.75 | 1.96 | |
| K2O | 0.01 | 0.00 | 0.00 | 0.04 | 0.28 | 0.05 | 0.01 | 0.06 | 0.04 | 0.02 | 0.05 | 0.13 | 0.02 | |
| Cr2O3 | 0.04 | 0.07 | 0.00 | 0.00 | 0.00 | 0.01 | 0.01 | 0.00 | 0.00 | 0.00 | 0.00 | 0.00 | 0.02 | |
| NiO | 0.22 | 0.15 | 0.18 | 0.42 | 0.00 | 0.01 | 0.01 | 0.00 | 0.02 | 0.00 | 0.02 | 0.03 | 0.03 | |
| Total | 62.44 | 63.46 | 61.78 | 61.88 | 64.12 | 53.63 | 54.67 | 58.32 | 53.31 | 64.09 | 60.19 | 76.10 | 82.65 | |
| H2O | 37.56 | 36.54 | 38.22 | 38.12 | 35.88 | 46.37 | 45.33 | 41.68 | 46.69 | 35.91 | 39.81 | 23.90 | 17.35 | |
| Sample | L14.1b | L14.1b | L14.1b | L14.1b | L14.1b | L14.1b | L14.1b | L14.1b | L14.1b | |||||
| SiO2 | 11.37 | 17.45 | 42.79 | 13.01 | 35.13 | 41.83 | 33.58 | 48.01 | 45.05 | |||||
| TiO2 | 0.01 | 0.02 | 0.00 | 0.00 | 0.00 | 0.01 | 0.00 | 0.01 | 0.01 | |||||
| Al2O3 | 12.59 | 12.23 | 0.75 | 14.04 | 3.61 | 1.70 | 8.34 | 0.10 | 0.31 | |||||
| FeO | 0.16 | 0.47 | 0.05 | 0.13 | 0.13 | 0.16 | 0.64 | 0.03 | 0.01 | |||||
| MnO | 0.04 | 0.05 | 0.00 | 0.04 | 0.01 | 0.00 | 0.11 | 0.00 | 0.01 | |||||
| MgO | 35.48 | 39.53 | 35.18 | 43.30 | 36.09 | 35.20 | 37.34 | 31.35 | 32.47 | |||||
| CaO | 0.00 | 0.04 | 0.06 | 0.23 | 0.07 | 0.15 | 0.08 | 0.45 | 0.39 | |||||
| Na2O | 0.05 | 0.00 | 0.00 | 0.35 | 0.00 | 0.03 | 0.01 | 0.00 | 0.00 | |||||
| K2O | 0.09 | 0.02 | 0.00 | 0.02 | 0.03 | 0.44 | 0.02 | 0.02 | 0.00 | |||||
| Cr2O3 | 0.00 | 0.06 | 0.00 | 0.01 | 0.00 | 0.03 | 0.05 | 0.00 | 0.02 | |||||
| NiO | 0.08 | 0.09 | 0.01 | 0.17 | 0.09 | 0.00 | 0.03 | 0.01 | 0.00 | |||||
| Total | 59.85 | 69.95 | 78.75 | 71.31 | 75.03 | 79.58 | 80.20 | 79.97 | 78.25 | |||||
| H2O | 40.15 | 30.05 | 21.25 | 28.69 | 24.97 | 20.42 | 19.80 | 20.03 | 21.75 | |||||
Table 3.
Whole rock composition of the blue(inner) and yellow(outer) weathering rinds compared with pristine peridotite(dark) and two samples of gravel.
Table 3.
Whole rock composition of the blue(inner) and yellow(outer) weathering rinds compared with pristine peridotite(dark) and two samples of gravel.
| Sample | F09.11 | F12.11 | R17.11 | ||||||
|---|---|---|---|---|---|---|---|---|---|
| Dark | Blue | Yellow | Dark | Blue | Yellow | Dark | Blue | Yellow | |
| SiO2 | 36.31 | 39.62 | 38.86 | 35.33 | 37.82 | 39.54 | 34.86 | 37.29 | 38.5 |
| Al2O3 | 0.14 | 0.19 | 0.22 | 0.06 | 0.11 | 0.14 | 0.48 | 0.32 | 0.47 |
| Fe2O3 | 2.46 | 4.08 | 5.21 | ||||||
| FeO | 4.5 | 3.3 | 2.9 | ||||||
| Fe2O3(T) | 7.88 | 8.4 | 8.66 | 6.00 | 8.12 | 8.25 | 7.46 | 7.74 | 8.43 |
| MnO | 0.11 | 0.12 | 0.12 | 0.09 | 0.09 | 0.05 | 0.11 | 0.11 | 0.11 |
| MgO | 44.19 | 40.92 | 41.83 | 43.16 | 38.28 | 36.43 | 42.85 | 40.21 | 38.92 |
| CaO | 0.05 | 0.21 | 0.06 | 0.05 | 0.05 | 0.04 | 0.12 | 0.09 | 0.08 |
| Na2O | 0.04 | 0.06 | 0.07 | 0.01 | 0.03 | 0.04 | < 0.01 | 0.01 | 0.01 |
| K2O | 0.02 | 0.02 | 0.04 | < 0.01 | < 0.01 | 0.02 | < 0.01 | < 0.01 | < 0.01 |
| TiO2 | 0.001 | 0.002 | 0.002 | 0.001 | 0.001 | 0.002 | 0.004 | 0.002 | 0.003 |
| P2O5 | < 0.01 | 0.04 | 0.07 | < 0.01 | < 0.01 | 0.07 | < 0.01 | < 0.01 | 0.01 |
| LOI | 10.28 | 10.03 | 10.1 | 15.35 | 14.77 | 14.36 | 12.29 | 12.42 | 11.49 |
| Total | 99 | 99.61 | 100 | 100.1 | 99.3 | 98.94 | 99.2 | 98.59 | 98.37 |
| CO2 | 1.09 | 0.47 | 0.46 | ||||||
| MgO/SiO2 | 1.22 | 1.03 | 1.08 | 1.22 | 1.01 | 0.92 | 1.23 | 1.08 | 1.01 |
| Mg0/Fe2O3T | 5.61 | 4.87 | 4.83 | 7.19 | 4.71 | 4.42 | 6.38 | 5.76 | 5.13 |
| MgO/NiO | 153 | 113 | 131 | 114 | 90 | 72 | 167 | 145 | 141 |
| Fe2O3/FeO | 0.5 | 1.2 | 1.8 | ||||||
| Sc | 3 | 3 | 3 | 2 | 2 | 3 | 4 | 4 | 4 |
| Be | < 1 | < 1 | < 1 | < 1 | < 1 | < 1 | <1 | <1 | <1 |
| V | 7 | 12 | < 5 | 7 | 6 | 11 | 24 | 15 | 21 |
| Cr | 2090 | 2370 | 1930 | 520 | 700 | 480 | 7420 | 4840 | 6460 |
| Co | 114 | 121 | 123 | 103 | 109 | 93 | 100 | 106 | 103 |
| Ni | 2190 | 2760 | 2430 | 2870 | 3240 | 3840 | 1950 | 2100 | 2090 |
| Cu | < 10 | < 10 | < 10 | < 10 | < 10 | 10 | < 10 | < 10 | < 10 |
| Zn | 40 | 50 | 70 | 40 | 40 | 80 | 50 | 40 | 60 |
| Ga | < 1 | < 1 | < 1 | < 1 | < 1 | < 1 | < 1 | < 1 | < 1 |
| Ge | 0.9 | 1 | 0.9 | 1 | 1.1 | 1.1 | 0.7 | 0.7 | 0.8 |
| As | < 5 | < 5 | < 5 | < 5 | < 5 | < 5 | < 5 | < 5 | < 5 |
| Rb | < 1 | 1 | < 1 | 1 | 1 | 2 | < 1 | < 1 | < 1 |
| Sr | < 2 | 3 | 2 | < 2 | < 2 | < 2 | < 2 | < 2 | < 2 |
| Y | < 0.5 | < 0.5 | < 0.5 | < 0.5 | 1.1 | 0.6 | < 0.5 | < 0.5 | < 0.5 |
| Zr | 2 | 2 | < 1 | 3 | 3 | 3 | < 1 | < 1 | < 1 |
| Nb | < 0.2 | < 0.2 | 0.3 | < 0.2 | < 0.2 | < 0.2 | < 0.2 | < 0.2 | < 0.2 |
| Mo | < 2 | < 2 | < 2 | < 2 | < 2 | < 2 | < 2 | < 2 | < 2 |
| Ag | < 0.5 | < 0.5 | < 0.5 | < 0.5 | < 0.5 | < 0.5 | < 0.5 | < 0.5 | < 0.5 |
| In | < 0.1 | < 0.1 | < 0.1 | < 0.1 | < 0.1 | < 0.1 | < 0.1 | < 0.1 | < 0.1 |
| Sn | < 1 | < 1 | < 1 | < 1 | < 1 | < 1 | < 1 | < 1 | < 1 |
| Sb | 0.9 | 1.2 | 1.1 | 0.9 | 1 | 0.8 | < 0.2 | < 0.2 | < 0.2 |
| Cs | < 0.1 | < 0.1 | < 0.1 | < 0.1 | 0.1 | 0.1 | < 0.1 | < 0.1 | < 0.1 |
| Ba | 2 | 7 | 13 | 4 | 4 | 10 | 11 | < 3 | < 3 |
| La | 0.05 | 0.22 | 0.17 | 0.11 | 0.24 | 1.19 | 1.26 | 0.3 | 0.07 |
| Ce | 0.07 | 0.21 | 0.29 | 0.08 | 0.16 | 0.87 | 2.46 | 0.44 | 0.16 |
| Pr | < 0.01 | 0.04 | 0.04 | 0.01 | 0.05 | 0.14 | 0.27 | 0.05 | 0.02 |
| Nd | < 0.05 | 0.12 | 0.15 | < 0.05 | 0.19 | 0.55 | 0.92 | 0.13 | 0.06 |
| Sm | < 0.01 | 0.05 | 0.02 | 0.05 | 0.11 | 0.12 | 0.1 | 0.03 | 0.02 |
| Eu | 0.011 | 0.013 | 0.011 | 0.005 | 0.005 | 0.015 | 0.023 | 0.005 | 0.005 |
| Gd | < 0.01 | 0.02 | 0.04 | < 0.01 | 0.18 | 0.04 | 0.04 | 0.01 | < 0.01 |
| Tb | < 0.01 | < 0.01 | < 0.01 | < 0.01 | 0.03 | 0.01 | < 0.01 | < 0.01 | < 0.01 |
| Dy | < 0.01 | 0.03 | 0.02 | < 0.01 | 0.22 | 0.1 | 0.02 | < 0.01 | < 0.01 |
| Ho | < 0.01 | < 0.01 | < 0.01 | < 0.01 | 0.04 | 0.02 | < 0.01 | < 0.01 | < 0.01 |
| Er | < 0.01 | 0.01 | 0.01 | < 0.01 | 0.12 | 0.05 | < 0.01 | < 0.01 | < 0.01 |
| Tm | 0.005 | 0.005 | 0.005 | 0.005 | 0.016 | 0.011 | 0.005 | 0.005 | 0.005 |
| Yb | < 0.01 | 0.04 | 0.02 | < 0.01 | 0.08 | 0.07 | < 0.01 | < 0.01 | 0.01 |
| Lu | 0.002 | 0.006 | 0.003 | 0.004 | 0.011 | 0.007 | 0.002 | 0.002 | 0.002 |
| Hf | < 0.1 | < 0.1 | < 0.1 | < 0.1 | < 0.1 | < 0.1 | < 0.1 | < 0.1 | < 0.1 |
| Ta | 0.24 | 0.32 | 0.29 | 0.31 | 0.3 | 0.38 | < 0.01 | < 0.01 | 0.01 |
| W | 1.6 | 2.6 | 1.6 | 3.9 | 23.8 | 2.8 | < 0.5 | < 0.5 | < 0.5 |
| Tl | < 0.05 | < 0.05 | < 0.05 | < 0.05 | < 0.05 | < 0.05 | < 0.05 | < 0.05 | < 0.05 |
| Pb | < 5 | < 5 | 6 | < 5 | < 5 | 7 | < 5 | < 5 | < 5 |
| Bi | < 0.1 | < 0.1 | < 0.1 | < 0.1 | < 0.1 | < 0.1 | < 0.1 | < 0.1 | < 0.1 |
| Th | < 0.05 | < 0.05 | < 0.05 | < 0.05 | < 0.05 | 0.11 | 0.17 | < 0.05 | < 0.05 |
| U | < 0.01 | 0.02 | 0.02 | 0.02 | 0.03 | 0.07 | < 0.01 | < 0.01 | < 0.01 |
Table 4.
Composition of till from trench through mudboil(FER18/15 and 19/15) and nearby tillite (FER21/15).
Table 4.
Composition of till from trench through mudboil(FER18/15 and 19/15) and nearby tillite (FER21/15).
| FER18/15 | FER19/15 | FER21/15 | |
|---|---|---|---|
| Trench | Trench | Magcrete | |
| SiO2 | 87,72 | 89,58 | 72,81 |
| Al2O3 | 4,48 | 4,23 | 4,25 |
| Fe2O3(T) | 1,54 | 1,42 | 1,01 |
| MnO | 0,02 | 0,02 | 0,01 |
| MgO | 0,79 | 0,63 | 9,98 |
| CaO | 0,26 | 0,3 | 0,24 |
| Na2O | 0,69 | 0,7 | 0,56 |
| K2O | 2,11 | 1,99 | 1,9 |
| TiO2 | 0,2 | 0,21 | 0,16 |
| P2O5 | 0,04 | 0,03 | 0,03 |
| LOI | 0,7 | 0,52 | 9,4 |
| Total | 98,55 | 99,61 | 100,4 |
| Be | < 1 | < 1 | < 1 |
| V | 15 | 13 | 12 |
| Cr | 110 | 230 | 30 |
| Co | 4 | 4 | 3 |
| Ni | 40 | 40 | 60 |
| Cu | < 10 | < 10 | < 10 |
| Zn | < 30 | < 30 | < 30 |
| Ga | 5 | 4 | 4 |
| Ge | 1 | 0,8 | 1,1 |
| As | < 5 | < 5 | < 5 |
| Rb | 53 | 49 | 51 |
| Sr | 39 | 45 | 36 |
| Y | 8,7 | 9,1 | 9,5 |
| Zr | 164 | 188 | 136 |
| Nb | 4 | 3,8 | 4,1 |
| Mo | < 2 | 4 | < 2 |
| Ag | 0,7 | 0,8 | 0,5 |
| In | < 0.1 | < 0.1 | < 0.1 |
| Sn | < 1 | < 1 | < 1 |
| Sb | 0,4 | 0,4 | 0,5 |
| Cs | 0,8 | 0,7 | 0,8 |
| Ba | 387 | 376 | 344 |
| La | 11,3 | 10,1 | 9,88 |
| Ce | 22,6 | 20,5 | 19,1 |
| Pr | 2,58 | 2,41 | 2,3 |
| Nd | 9,78 | 9,01 | 8,97 |
| Sm | 1,98 | 1,85 | 1,64 |
| Eu | 0,421 | 0,439 | 0,432 |
| Gd | 1,64 | 1,56 | 1,51 |
| Tb | 0,27 | 0,27 | 0,26 |
| Dy | 1,66 | 1,62 | 1,54 |
| Ho | 0,32 | 0,33 | 0,33 |
| Er | 0,95 | 0,97 | 0,93 |
| Tm | 0,147 | 0,151 | 0,147 |
| Yb | 0,97 | 1,02 | 1,02 |
| Lu | 0,151 | 0,159 | 0,156 |
| Hf | 3,5 | 4,1 | 3,2 |
| Ta | 0,55 | 0,52 | 0,53 |
| W | 1,5 | 1,4 | 1,1 |
| Tl | 0,23 | 0,23 | 0,22 |
| Pb | 7 | 7 | 7 |
| Bi | < 0.1 | < 0.1 | < 0.1 |
| Th | 2,66 | 2,23 | 1,99 |
| U | 0,83 | 0,85 | 0,73 |
Disclaimer/Publisher’s Note: The statements, opinions and data contained in all publications are solely those of the individual author(s) and contributor(s) and not of MDPI and/or the editor(s). MDPI and/or the editor(s) disclaim responsibility for any injury to people or property resulting from any ideas, methods, instructions or products referred to in the content. |
© 2023 by the authors. Licensee MDPI, Basel, Switzerland. This article is an open access article distributed under the terms and conditions of the Creative Commons Attribution (CC BY) license (http://creativecommons.org/licenses/by/4.0/).
Copyright: This open access article is published under a Creative Commons CC BY 4.0 license, which permit the free download, distribution, and reuse, provided that the author and preprint are cited in any reuse.


