
Submitted:
19 April 2024
Posted:
22 April 2024
You are already at the latest version
Abstract
This research concerns in to understand the link between urban heat and cool island, the Local Climatic Zones (LCZ) and atmospheric systems during the winter season in the city of Balneário Camboriú, Southern Brazil. To collect meteorological data on urban environmental, 11 permanent points in the Balneário Camboriú metropolitan region were installed. To understand the atmos-pheric systems operating in the region, a synoptic analysis of the dates was performed, and then, the LCZs map created for the city in World Urban Database and Acess Portal Tools was used to cor-relate the magnitudes of the heat and cool islands found in Balneário Camboriú in the winter period. The results indicate that the increasing verticalization with the construction of skyscrapers in Balneário Camboriú has a significant influence on local conditions for the occurrence of heat and cold islands. The findings indicate that LCZs with sparsely distributed buildings (LCZs 6, 8 and 9) and LCZs with dense vegetation (LCZ A) have lower intensity magnitudes of heat and cool con-ditions. The biggest magnitudes of heat and cool islands were reported in LCZs 1 and 3 during the timeframe. The synoptic analysis supports earlier researches that points to atmospheric stability (Anticyclonic domain) as a favorable atmospheric setting for the emergence of urban hear and coolness islands.
Keywords:
urban heat island
; urban cool island
; local climate zones
; winter period
; magnitude
; atmospheric circulation
; Balneário Camboriú
; verticalization
; coastal cities
1. Introduction
Several variables influence the urban climate, including local climatic patterns and geographic features, which determine whether the climate is continental or marine. Although the first two elements are beyond human control, anthropogenic activities are directly responsible for climate change that impacts local weather. As a result, rising urbanization and urban morphology are factors directly generated by humans [1].
In this regard, the increase of urbanization and excessive human activity has resulted in a significant change in the earth’s surface and atmospheric conditions. It is at the earth’s surface where the most microclimate variability occurs, depending on the city’s structure (size, form, and relationships), and this influences the climatic qualities of the environment [2].
Urban Heat Islands (UHI) are a well-known phenomenon that cause considerable increases in air temperature (Ta) [3,4]. The first suggested the notion of IHU was in 1833, after noting the difference in Ta between urban and rural habitats [5,6,7,8,9,10].
UHI can develop both during the day and at night, however according to various authors, they are more common during the summer and typically peak at night [3,11,12,13]. The effects of UHI are caused by a variety of factors, including biological, economic, and meteorological processes, changes in scaling, changes in the canopy layer, air pollution, anthropogenic heat, thermal properties of materials, building geometry and dimensions (Urban Canyon), and the reduction of green spaces [14,15,16,17].
The notion of Urban Cool Islands (UCI) applies both during the day and at night. They may weaken or even invert throughout the day, as in metropolitan regions, which may have lower temperatures than rural places. This is due to variables such as skyscraper shadowing, the presence of vegetation, bodies of water, and other things that can reduce surface Ta in dense metropolitan environments as compared to rural locations. The size of UCI changes with the seasons or throughout the daily cycle and is largely reliant on current meteorological circumstances [18,19].
Depending on the meteorological conditions at the time the measurements are collected, the presence of UCI can be noticed in specific locations of the city. On sunny days, densely covered spaces may be cooler than outside regions, while on overcast days, these effects may be mitigated [18].
Urban bodies of water, such as rivers, seas, reservoirs, lakes, and tiny lagoons, are one of the variables that lead to the establishment of freshwater islands. These water bodies serve a critical role in enhancing the thermal environment of cities. Studies have shown that they have a significant cooling effect [20], identifying three main characteristics: 1) the thermal effect of water bodies compared to other types of land use; 2) the relationship between the characteristics of the water body and the water temperature; and 3) the impact of the spatial characteristics of water bodies (area, geometry) on the cooling effect.
The distribution of temperature in an urbanized region is also affected by the urban layout. Several researches have used the Local Climatic Zones (LCZs) technique to study the association between UHI/ UCI and urban morphology. LCZs were created with the goal of describing urban settings for microscale temperature investigations. The landscapes were described by structure (height and spacing of buildings and trees), surface (im)permeability, and other characteristics that impact microscale measurements [21]. The World Urban Database and Access Portal Tools (WUDAPT) was created with the goal of enabling the definition of LCZs and enhancing the flow of work done using this technique. It provides free mapping of cities through LCZs [22].
To predict UHI behavior based on structure, location, and urban (im)permeability is always important in researches in urban climatology [23,24]. One example is the evaluation of the growth of UHI in Aracaju, Brazil, between 2014 and 2016, associating it with the city’s diverse climate zones [25], in which was confirmed the production of stronger UHI during the colder season, which is driven by a decrease in air speed. Furthermore, the proximity to the water helped to reduce heat while also enhancing local natural ventilation.
Balneário Camboriú is the most verticalized city in Southern Hemisphere [26]. Its subtropical location implies that it is subject to the influence of several atmospheric conditions [27]. These active systems are antagonistic forces that cause clashes throughout the year at various times. Extratropical active systems, such as polar masses and fronts, and intertropical (tropical masses and disturbed currents) are examples.
Previous study has demonstrated that Balneário Camboriú has varied habitats in two local climatic zones, and some interact with atmospheric systems in a complex way, resulting in diverse microclimatic environments [28,29,30]. In this regard, the study concerns to comprehend the link between the UHI and UCI in the Local Climatic Zones existent in the city of Balneário Camboriú, as determined by the atmospheric systems during winter days, from June 1st to 14th 2022.
2. Materials and Methods
2.1. Area Characterization
The research area is the city of Balneário Camboriú in the state of Santa Catarina (SC), Southern Brazil. Its central point is located at 26° 59’ 42” south latitude and 48° 37’ 46” west longitude. Balneário Camboriú is located in the Itajaí Valley Mesoregion and is part of the Itajaí microregion [31], in the North Coast of Santa Catarina. (Figure 1).
Balneário Camboriú is bounded to the north by Itajaí, to the south by Itapema, and to the east by Camboriú municipalities. The Atlantic Ocean lies to the west. The primary road into the city is BR 101, which runs to the west of the municipality and acts as the border between Camboriú and Balneário Camboriú (Figure 1).
According to the Brazilian Institute of Geography and Statistics (IBGE), the absolute population of Balneário Camboriú in the 2022 census was 139,115 people, occupying an area of 46.80 km2. The whole population is concentrated in the Balneário Camboriú urban area, with a population density of 3,077.70 people per squared kilometer.
In comparison to the 2010 census, the population of Balneário Camboriú increased by 28.74%. In that year, the city had 149,227 residents, accounting for 1.73% of the entire population of the state of Santa Catarina. The population distribution by gender revealed that 47.55% were males and 52.45% were women. The statistics also revealed the municipality’s age makeup, with 26.0% of the population being under the age of 18, 62.2% being adults, and 11.8% being old. These figures are spread throughout the 14 neighborhoods of the city. [31].
2.2. Points and Instruments Used for Collection
For this investigation, 11 fixed points for sample collection were chosen. Figure 2 depicts the distribution of these collecting stations in the Balneário Camboriú urban area.
The 11 points were counted from 00 to 10, being 00 the natural/rural reference for the calculations, and points from 01 to 10, the urban environments. The collection locations depicted in Figure 2 were chosen to reflect a wide range of land uses and occupations within the municipality. Chart 1 provides information on the 11 collecting stations located across the research region.
Chart 1 shows the nomenclature assigned to each location, as well as its geographic coordinates, height in respect to sea level, and a brief description of the environment in which it is located. In addition, an aerial image from Google Earth Pro (2021) in which the collecting site is placed and the land cover within a radius of 100 meters may be viewed.
A low-cost polypropylene meteorological shelter was erected at the selected locations, as recommended by [32]. An HT 500 Instrutherm thermo-hygrometer was installed in each weather shelter. These gadgets, dubbed dataloggers, were set to gather Ta data every 30 minutes. The accuracy and precision of the equipment was measured, tested and used in other research, including in the same city in previous research in a previous collection period, but part of the same project to investigate the urban climate of Balneário Camboriú [28,30].
2.3. Analysis of the Magnitude of UHI and UCI
The magnitude of UHI and UCI were calculated using the thermal differential values between the warmest and coolest points in the research region [33]. Equation 1 expresses the thermal magnitude.
Where:
Mhpi is the magnitude of the UHI or UCI at a given point (pi) at time h;
Thpi is the Ta recorded at a given point (pi) at time h;
Thpr is the Ta recorded at the reference point (pr) at time h (Point 00).
Because it is located in an area with dense vegetation and low urban concentration, this study uses Point 00 as a reference point for determining the magnitude of UHI and UCI. According to the index shown in Table 1, the categorization of magnitudes according to intensity was developed in line with what was pointed out by [33].
Furthermore, in order to investigate the overall synoptic processes, the atmospheric systems operating in the research region had to be identified. The GOES-13 satellite photos, which are available on the CPTEC/INPE website, as well as the surface synoptic charts given by the Brazilian Navy, were investigated for this purpose.
For winter period in this latitude, day time was considered the period between 7am to 6pm, and night time from 6:30pm until 6:30am of the next day [29].
3. Results
3.1. LCZ in Balneário Camboriú
World Urban Database and Access Portal Tools (WUDAPT) technique [21,30] was used in this research to determine the Local Climate Zones for Balneário Camboriú. The following LCZs were found by the authors in the research area: LCZ 1, LCZ 2, LCZ 3, LCZ 4, LCZ 5, LCZ 6, LCZ 8, LCZ A, LCZ B, LCZ D, LCZ E, LCZ F, and LCZ G. As indicated in Figure 3, the data collecting locations are located in five of these LCZs: LCZ 1, LCZ 3, LCZ 6, LCZ 8, and LCZ 9.
LCZ 1 is defined as an area with a high density of tall structures [21] (more than 10 stories), few or no trees, and is located near the beach sand strip (LCZ F) and the Atlantic Ocean (LCZ G). LCZ 3 is located in the furthest part of the Atlantic Ocean and is defined as a region with a high density of low structures with up to three stories, few or no trees, and heavily paved land. LCZ 1 and LCZ 3 best depict Balneário Camboriú, urbanized areas with few or no trees and heavy traffic [30].
LCZ 6 is located in the northern portion of the municipality and is distinguished by a spaced layout of medium-sized buildings (between 3 and 9 stories) and permeable soil covering. LCZ 08 is the class that includes single-story low-rise structures. LCZ 09, on the other hand, is one of the least urbanized classes in this study, with fewer buildings, more permeable soil covering, and a larger prevalence of trees. LCZ A is made up of heavily forested vegetation that is mostly permeable.
Point 00, as indicated in Figure 3, is located in LCZ 9, which is distinguished by low-rise building designs and permeable soil. Point 01 lies near LCZ A (thick vegetation), on the Camboriú River’s right bank, LCZ 8 (big low-rise structures and impermeable soil), and LCZ 9, whereas Point 02 is completely immersed in LCZ 3, in an area of low, compact buildings with impermeable soil.
Points 03 and 04 are in LCZ 1 (skyscraper, compact, and waterproof). What distinguishes the two is that Point 04 is influenced by LCZ F, which is characterized by exposed soil, which does not occur with Point 03 because it is inserted in LCZ 1 and under its influence only. Point 05, on the other hand, is in an LCZ 3, near to LCZ 1, and point 06 is in both LCZ 1 and LCZ A. Point 07 sits at the bank of a creek (LCZ A) and in an LCZ 6 with medium-sized structures. Point 08 is in an LCZ 8 and point 09 and 10 in LCZ 3.
3.2. Ta data from Collection Points
Using Point 00 as the reference point for this study, the average Ta recorded at this position for the data collecting period was 16.1°C. During the investigated time period, the absolute maximum and lowest Ta recorded at the reference site were 23.6°C and 8.9°C, respectively, resulting in a thermal amplitude of 14.7°C. Table 3 displays the average temperature data, absolute maximum and lowest temperatures, and thermal amplitude of the 11-research area representative locations.
During this study, the lowest average Ta reported in Balneário Camboriú was 15.9°C, recorded at Point 01, a location impacted by three separate local climate zones, LCZ 8, LCZ 9, and LCZ A. The highest average Ta for the data collecting period, 17.2°C, was recorded at Point 09, as was the absolute maximum temperature, 28.8°C. Point 09 is situated inside LCZ 3. Point 03 in LCZ 1 had the lowest absolute maximum temperature and the greatest absolute minimum temperature (22.3°C and 9.5°C, respectively), as well as the lowest thermal amplitude measured throughout the examined time. Point 01 had the lowest absolute minimum temperature in the study region, at 7.8°C.
3.3. Magnitudes of UHI and UCI in Balneário Camboriú
Figure 4 depicts the absolute maximum and lowest magnitudes of daily UHI and UCI (7am to 6pm) for each Ta recording station.
Maximum UHI magnitudes reached moderate intensity throughout the day in Points 01, 06, 07, 08, and 10. The UHI achieved their peak magnitude throughout the analysis period at points 02 and 04, respectively. Points 03, 05, and 09 recorded extremely intense heat islands.
During the day, the UCI were detected with moderate intensity at the greatest number of collection places (01, 02, 04, 06, 07, 08, 09, and 10). The magnitudes of the UCI were greatest at Points 03 and 05, with very strong and strong intensities, respectively. The intensity of both Ta islands was found to be lower at night, between 6:30 p.m. and 6 a.m., compared to the daylight period. Figure 5 depicts the magnitudes of the nighttime UHI and UCI.
Moderately intense nocturnal UHI were detected at locations 01, 02, 06, 08, 09, and 10. UHI of high intensity were reported at points 03, 04, and 05. Point 07 was the only one with a high UHI intensity. Five of these places had the same UHI intensities as during the day. Another four places had lesser UHI magnitudes, with just one showing an increase in heat intensity when compared to daylight.
During the night, points 03, 04, 06, 07, and 08 recorded islands of low intensity coolness. UCI of moderate intensity was found at locations 02, 05, 09, and 10. During the night period, Point 01 reported an UCI with a high intensity. When the magnitudes of the UCI were compared during the day and at night, it was discovered that the intensity of the UCI remained constant in three spots. During the night, five points reported a drop in the intensity of the UCI, while two places recorded an increase in the intensity of the coolness.
When monitoring UHI and UCI hourly, fluctuations in the incidence of phenomena can be observed throughout the day. Figure 6, Figure 7 and Figure 8 depict the hourly evolution (between 00:00 and 23:00) of the magnitudes of UHI and UCI recorded at the 10 places examined between June 1st and 14th, 2022. For better visualization, the points were separated into three groups.
Except for Point 01, all sites in Figure 6 displayed UHI of weak, moderate, or strong intensity, and in a time span that began at 4 p.m. and ended around 6 a.m. At each place, UCI appear at various periods. Point 01, for example, had negative magnitudes in practically all of the period’s recordings. Points 03, 05, 06, 07, 08, and 09 all displayed negative magnitudes between the early morning and early afternoon. Only at night and on specified days did points 02 and 09 record negative magnitudes.
In the case of UHI, heat bubbles display increased intensity at the end of the day (5/6pm) and the early hours of the night (till 11pm) at points 01, 03, 04, 05, 06, 07, 08, and 10. The most significant UHI at point 02 occurred between 1pm to 3pm The most extreme UHI was observed during the morning and early afternoon (between 8:30am and 2pm) at Point 09, which had the highest UHI magnitude value of the time (8.4°C). According to Figure 6, the heat at Point 09 was the most substantial over the time.
The UCI observed during the analysis period do not follow an hourly trend. Points 01, 02, and 09 in Figure 8 recorded the lowest negative magnitudes at 8pm and remained on the UCI until the early morning hours of the following day, but with less intensity. During the day, the other places reported the lowest magnitudes of UCI. The most powerful of them occurred in the morning at points 03 and 06, while points 04, 05, 07, 08, and 10 reported more substantial UCI between 12pm and 2pm. Figure 6, Figure 7 and Figure 8 further reveal that the maximum intensities of the UHI and UCI phenomena found in this investigation occurred between June 11th and 14th.
The era’s synoptic analysis revealed that two distinct synoptic conditions occurred throughout the data collecting period, which were classified as cyclonic and anticyclonic. The passage of polar frontal systems and frontal cyclones affected or influenced the city during the cyclonic days. Overcast sky, air instability with rainfall, and minimum temperatures over 15.0°C define this period. Clear skies and no cloud cover were seen during the anticyclonic period, resulting in surface heating by direct solar radiation during the day and adiabatic cooling during the night. Minimum Ta were below 15.0°C throughout this time period.
The cyclonic phase is between the 1st to 3rd of June 2022, and the 6th to 10th of June 2022, with a preponderance of atmospheric instability, cloudiness, and low-intensity rain. The city was under the authority of the Atlantic Polar Migratory Anticyclone and the Polar Air Mass during June 4th and 5th, as well as the 11th to 14th. The existing thermal disparity between these two anticyclonic period temporal slices is attributable to the loss of intensity of the Atlantic polar air mass as a result of fast warming and thermal increase. Otherwise, the Polar Air Mass that reached Balneário Camboriú was vigorous between June 11th to 14th, lowering temperatures and sustaining atmospheric stability, promoting dry days without clouds and contributing to the balance of daytime and evening energy.
3.4. Relation of LCZs, Average Ta and Day and Night Magnitudes of the UHI/UCI at Each Point
Table 4 shows how distinct metropolitan areas and their local climatic zones (as well as the affects of other neighboring zones) affect daytime and nighttime temperatures, as well as how these temperatures vary during the investigated period.
The highest average daily Ta recorded was 19.3°C at Point 9 (LCZ 3), while the lowest was 17.4°C at Point 1 (LCZ 9). Point 7 (LCZ 6) had the greatest average overnight Ta of 15.8°C, while Point 1 (LCZ 9) had the lowest average nighttime temperature of 4.5°C.
The magnitudes of the UHI discovered during the investigated period reveal that the maximum magnitude discovered during the day was 1.6°C at Point 9 (LCZ 3), while the lowest magnitude discovered during the day was -0.3°C at Point 1 (LCZ 9). The maximum magnitude during the night period was 1.1°C at Point 7 (LCZ 6). Point 1 (LCZ 9) had the lowest nighttime magnitude of -0.2°C.
Ta at LCZ 1 range from 17.5°C to 18.1°C during the day and from 15.4°C to 15.7°C at night. Magnitudes range from -0.1°C and 1.0°C during the day and 0.7°C and 1.0°C at night. Ta at LCZ 3 range from 17.6°C to 19.3°C during the day and 15.1°C to 15.6°C at night, with magnitudes ranging from 0.3°C to 1.6°C during the day and 0.4°C to 0.9°C at night.
The average Ta in LCZs 6 and 8 ranges from 17.6°C to 19.3°C during the day and from 15.1°C to 15.6°C at night. Variations in magnitude were found from 0.1°C to 0.8°C during the day and from 0.7°C to 1.1°C at night. LCZ 9 had the lowest Ta fluctuation, with -0.3°C magnitude during the day and -0.2°C magnitude at night.
Regarding the third column of Table 4, which concerns the LCZ influence, it was observed that the magnitudes presented at these points are related to the LCZ with the greatest vertical density, as points 01, 04, 05, 06 and 07 are located in areas of contact between different LCZs (Figure 3), with the LCZ mentioned in the third column being the one that had the most impact on the values mentioned.
4. Discussion
The research findings clearly revealed that skyscraper building in Balneário Camboriú has a significant influence on local Ta conditions [28,30]. The presence of these high-rise structures in the metropolis has an impact on heat absorption, ventilation, and the creation of heat islands. These changes in the urban landscape are responsible for modifying the conventional thermal field dynamics reported in the literature. In addition, the size and direction of the metropolitan road network influence the intensity or attenuation of these temperature shifts. Narrow streets and street direction can have an impact on shade, air circulation, and heat accumulation in certain places, amplifying the effects of verticalization on the thermal field.
The materials utilized in urban buildings have a high thermal capacity and thermal emittance, resulting in delayed cooling late in the afternoon and at night [2]. Thus, heat island magnitudes rapidly grow after sunset, peaking at night and declining till daybreak [2,21].
The magnitudes of UHI and UCI varied less throughout the day and night periods at places in LCZs with sparse array building architectures (LCZs 6, 8, and 9). The same is true for the points influenced by LCZ A (Point 06, LCZ 1), with the dense vegetation typical of this LCZ contributing to climate control in nearby areas, even in densely urbanized LCZs such as LCZ 1, LCZ 3, and LCZ 6, attenuating the difference in the intensities of heat and cool island phenomena due to the strong presence of trees [21].
The LCZs 1 and 3 reported more substantial magnitudes of urban heat and coolness in well-defined temporal spaces. The nighttime UHI in LCZ 1 last from late afternoon till before daybreak. This LCZ’s UCI are likewise highly defined, occurring during the day. Unlike LCZ 1, LCZ 3 tracks the presence of high-intensity UHI during the day. The UCI seen in this LCZ have a low to moderate intensity and are virtually usually documented at night [30].
The effect of LCZ F (exposed soil) on the Ta of LCZ 1 minimizes the incidence of UCI, as seen at point 03 vs point 04. Both are in typical LCZ 1 zone, however at point 03, the existence of the sand strip near to LCZ 1 and the higher incidence of solar radiation impact the heating of the local air. Point 03, on the other hand, is in a highly built-up region with towering structures that obstruct much of the sun radiation and local air movement. Sea wind does not necessarily have a favorable influence on Ta reduction, especially in metropolitan settings. As a result, urban morphology and land use become the primary factors affecting Ta in these places [34].
In metropolitan regions, the horizontal Ta gradient increases from the outskirts to the city center. This trend, however, can be disrupted depending on intra-urban land uses, which, as demonstrated by the data, alter temperature. Factors such as dense vegetation, closeness to water bodies, and the energy balance itself on a microscale can cause the local air to be colder than the metropolitan norm, resulting in “cold islands” [14]. Furthermore, the humidity in the urban atmosphere is higher than the natural/rural atmosphere during winter period [35] which may be a factor that contributes to the increase in the magnitude of urban heat islands.
Because urban morphology alters heating patterns in these places, it is believed that the urban layout is an essential agent affecting the distribution of temperature in this environment [36,37,38,39]. It is feasible to comprehend the distinct hourly patterns and intensity of heat islands by connecting the magnitudes of heat islands with the LCZ calculated for each position.
Furthermore, the synoptic factors associated with the magnitudes of UHI found in this experiment are consistent with studies indicating the occurrence of the most intense UHI and UCI under very specific atmospheric conditions of clear skies, low wind speed, little or no cloudiness, and no precipitation [2,9,18,40]. Also, independent of the features of buildings and land use, temperatures inside urban areas tend to homogenize in situations of meteorological instability, such as increased wind speed and cloudiness [14,41].
5. Conclusions
This study was a substantial attempt to increase information about climatic dynamics in towns confronting a trend of intensified verticalization in a coastal subtropical environment. The findings and conclusions are important contributions to understanding the specific climatic difficulties that these metropolitan regions confront.
The experiment results indicate that LCZs with a sparse building layout (LCZ 6, LCZ 8, and LCZ 9) and LCZs with a high presence of flora (LCZ A) have lower intensity magnitudes of heat and coolness. The period’s largest magnitudes of UHI and UCI were reported in LCZs 1 and 3. The observation showed that there is no correlation between the average magnitude of UHI and UCI and the defines LCZs. This study’s synoptic analysis confirms earlier research that points to atmospheric stability (Anticyclonic domain) as a favorable atmospheric setting for the emergence of UHI and UCI.
However, there is a restriction to the study of the influence of sea breeze in this research, which is the lack of a higher number of sea breeze measurement equipment wind speed and direction at a greater number of data collecting stations. In this study, it was not able to conduct a more in-depth investigation of the impact of the marine wind. This is a severe drawback since it limits a comprehensive knowledge of wind patterns and climatic fluctuations in Balneário Camboriú.
Finally, this experiment demonstrates the need for additional in-depth investigation into the thermal variation of the Balneário Camboriú urban area. A longer time of data collection is required, as well as the examination of additional atmospheric and environmental/urban factors at the surface level, such as relative air humidity, wind flow, and the sky view factor techniques. A comparison between summer and winter conditions will be of interest and also the comparison of atmospheric humidity.
Author Contributions
Conceptualization, A.N.S., I.L.H., C.A.W and J.P.A.G.; methodology, I.L.H., C.A.W., I.T.C., A.C.I., O.F.B. and J.P.A.G.; software, L.W., I.T.C., A.C.I. and C.A.W.; validation, A.N.S, I.L.H., C.A.W., I.T.C., A.C.I., O.F.B. J.P.A.G., S.S. and A.M.; formal analysis, A.M. and E.G.; investigation, L.W. and C.A.W.; resources, A.N.S., A.C.I., L.W. and C.A.W.; data curation, A.N.S, I.L.H., C.A.W. and I.T.C.; writing—original draft preparation, A.N.S., A.C.I., L.W. and C.A.W.; writing—review and editing, A.M., C.A.W.; visualization, C.A.W., E.G. and A.M.; supervision, C.A.W., J.P.A.G., E.G. and. A.M.; project administration, C.A.W.; funding acquisition, E.G., C.A.W. All authors have read and agreed to the published version of the manuscript.
Funding
This study was financed in part by the Coordenação de Aperfeiçoamento de Pessoal de Nível Superior-Brasil (CAPES)-Finance Code 001. Conselho Nacional de Desenvolvimento Científico e Tecnológico (CNPq) for proving the Research and Productivity research: grant process number 306505/2020-7.
Acknowledgments
We thank the Conselho Nacional de Desenvolvimento Científico e Tecnológico (CNPq) for proving the Research and Productivity research: grant process number 306505/2020-7.
Conflicts of Interest
The authors declare no conflict of interest.
References
- Tan, P.Y. & Hamid, A. R. B. A. Urban ecological research in Singapore and its relevance to the advancement of urban ecology and sustainability. Landscape and Urban Planning, 2014, 125, 271–289. [CrossRef]
- Oke, T.R. Boundary Layer Climates. Methuen, London, New York (1987).
- Gagliano, A.; Nocera; F.; Aneli, S. Computational Fluid Dynamics Analysis for Evaluating the Urban Heat Island Effects. Energy Procedia 2017, v. 134, p. 508-517.
- Wu, X.; Wang, G.; Yao, R.; Wang.; Yu, D.; Gui, X. Investigating Surface Urban Heat Islands in South America Based on MODIS Data from 2003–2016. Remote Sens. 2019, 11, 1212. [CrossRef]
- Nakata-Osaki, C. M.; Souza, L. C. L.; Rodrigues, D. S. THIS – Tool for Heat Island Simulation: A GIS extension model to calculate urban heat island intensity based on urban geometry. Computers, Environment and Urban Systems, v 67, 2018, p. 157-168. [CrossRef]
- Yang, C., Wang, R., Zhang, S., Ji, C., Fu, X. Characterizing the Hourly Variation of Urban Heat Islands in a Snowy Climate City during Summer. International Journal of Environmental Research and Public Health, 2019, 16(14), 2467. [CrossRef]
- Niu, L.; Tang, R.; Jiang, Y.; Zhou, X. Spatiotemporal Patterns and Drivers of the Surface Urban Heat Island in 36 Major Cities in China: A Comparison of Two Different Methods for Delineating Rural Areas. Sustainability 2020, 12, 478. [CrossRef]
- Quan, J. Multi-Temporal Effects of Urban Forms and Functions on Urban Heat Islands Based on Local Climate Zone Classification. Int. J. Environ. Res. Public Health 2019, 16, 2140. [CrossRef]
- Amorim, M.C.C.T.; Dubreuil, V. Intensity of Urban Heat Islands in Tropical and Temperate Climates. Climate 2017, 5, 91. [CrossRef]
- Amani-Beni, M.; Zhang, B.; Xie, G.-D.; Shi, Y. Impacts of Urban Green Landscape Patterns on Land Surface Temperature: Evidence from the Adjacent Area of Olympic Forest Park of Beijing, China. Sustainability 2019, 11, 513. [CrossRef]
- Leal-Filho, W.; Echevarria Icaza, L.; Emanche, V.O.; Zheng, Y.; Ren, C.; Xu, Y.; Wang, R.; Ho, J.; Lau, K.; Ng, E. GIS-based mapping of Local Climate Zone in the high-density city of Hong Kong. Urban Climate 2018, 24, 419–448. [CrossRef]
- Mandelmilch, M.; Ferenz, M.; Mandelmilch, N.; Potchter, O. Urban Spatial Patterns and Heat Exposure in the Mediterranean City of Tel Aviv. Atmosphere 2020, 11, 963. [CrossRef]
- Mohajerani, A.; Bakaric, J.; Jeffrey-Bailey, T. The urban heat island effect, its causes, and mitigation, with reference to the thermal properties of asphalt concrete. Journal of Environmental Management, 2017, 197, pp. 522-538. [CrossRef]
- Arnfield, A. J. Two decades of urban climate research: a review of turbulence, exchanges of energy and water, and the urban heat island. International Journal of Climatology: a Journal of the Royal Meteorological Society, 2003, 23(1), 1-26. [CrossRef]
- Yow, D. M. Urban heat islands: Observations, impacts, and adaptation. Geography Compass, 2007, 1(6), 1227-1251. [CrossRef]
- Gago, E. J.; Roldan, J.; Pacheco-Torres, R.; Ordóñez, J. The city and urban heat islands: A review of strategies to mitigate adverse effects. Renewable and sustainable energy reviews 2013, 25, 749-758. [CrossRef]
- Cakmakli, A. B., & Rashed-Ali, H. A Climate-Based Critical Analysis of Urban Heat Island Assessment Methods and Mitigation Strategies. Journal of Green Building, 2022, 17(4), 129-149. [CrossRef]
- Krüger, E., Drach, P., Emmanuel, R. Atmospheric Impacts on Daytime Urban Heat Island. Air, Soil and Water Research 2018, 11. [CrossRef]
- Jurus, P., Resler, J., Derbek, P., Krc, P., Belda, M., Benesova, N., Vlcek, O., Srbova, D., Eben, K., Hrubes, P. High resolution modelling of anthropogenic heat from traffic in urban canopy: A sensitivity study. Smart Cities Symposium Prague 2016, SCSP, art. no. 7501031. [CrossRef]
- Zhang, Q., Wu, Z., Guo, G. The cooling effect of water landscape in high-density urban built-up area a case study of the center urban district of Guangzhou.2nd International Conference on Frontiers of Sensors Technologies (ICFST), 2017 Shenzhen, 2017, pp. 394-400. [CrossRef]
- Stewart, I. D.; Oke, T. R. Local climate zones for urban temperature studies. Bulletin of the American Meteorological Society, 2012, v. 93, n. 12, p. 1879-1900. [CrossRef]
- Demuzere, M.; Kittner, J.; Bechtel, B. LCZ Generator: A Web Application to Create Local Climate Zone Maps. Front. Environ. 2012, Sci.9:637455. [CrossRef]
- Chieppa, J., Bush, A., & Mitra, C. Using “Local Climate Zones” to detect urban heat island on two small cities in Alabama. Earth Interactions, 2018, 22(16), 1-22. [CrossRef]
- Dimitrov, S., Popov, A., Iliev, M. An Application of the LCZ Approach in Surface Urban Heat Island Mapping in Sofia, Bulgaria. Atmosphere 2021, 12(11), 1370. [CrossRef]
- Anjos, M.; Lopes, A. Urban Heat Island and Park Cool Island Intensities in the Coastal City of Aracaju, North-Eastern Brazil. Sustainability 2017, 9, 1379. [CrossRef]
- Wollmann, C.A.; Gobo, J.P.A.; Chiquetto, J.P.; Shooshtarian, S.; Rotili Junior, D.H. Balneário Camboriú: The “Brazilian Dubai” and the Greatest Verticalization Process in the Southern Hemisphere. Bulletin of International Association for Urban Climate. 2020. Issue No. 78.
- Alvares, C.A.; Stape, J.L.; Sentelhas, P.C.; Gonçalves, J.L.M.; Sparovek, G. Köppen’s climate classification map for Brazil. Meteorol. Z. 2014, 22, 711–728. [CrossRef]
- Wollmann, C.A.; Hoppe, I.L.; Gobo, J.P.A.; Simioni, J.P.D.; Costa, I.T.; Baratto, J.; Shooshtarian, S. Thermo-Hygrometric Variability on Waterfronts in Negative Radiation Balance: A Case Study of Balneário Camboriú/SC, Brazil. Atmosphere 2021, 12, 1453. [CrossRef]
- Writzl, L., Wollmann, C. A., Costa, I. T., Gobo, J. P. A., Shooshtarian, S., & Matzarakis, A. (2022). Outdoor Human Thermal Comfort along Bike Paths in Balneário Camboriú/SC, Brazil. Atmosphere, 13(12), 2092. [CrossRef]
- Hoppe, IL, Wollmann, CA, Buss, AS, Gobo, JPA e Shooshtarian, S. Local Climate Zones, Sky View Factor and magnitude of daytime / nighttime urban heat islands in Balneário Camboriú, Sc, Brazil. Climate 2022, 10(12), 197. [CrossRef]
- IBGE Cidades@: Censo 2022. Available online: https://cidades.ibge.gov.br/brasil/sc/balneario-camboriu/panorama (accessed on 16 December 2023).
- Hoppe, I. L.; Wollmann, C.; Baratto, J. Performance de um novo modelo de abrigo meteorológico de baixo custo. Caminhos de Geografia, Uberlândia, v. 23, n. 86, p. 71–84, 2022.
- Garcia, F. F. Manual de climatologia aplicada: clima médio ambiente planificacion. Madrid, Síntesis, 1996. 285 p.
- Anjos, M.; Lopes, A.; Lucena, A. J.; Mendonça, F. Sea breeze front and outdoor thermal comfort during summer in northeastern Brazil. Atmosphere 2020, 11, 1013. [CrossRef]
- Mayer, H., Matzarakis, A., Iziomon, M. G. Spatio-temporal variability of moisture conditions within the urban canopy layer. Theor. Appl. Climatol. 2003, 76, 165–179. [CrossRef]
- Touchaei, A. G.; Wang, Y. Characterizing urban heat island in Montreal (Canada)—Effect of urban morphology. Sustainable Cities and Society, 2015, 19, 395-402. [CrossRef]
- Liu, Y., Li, Q., Yang, L., Mu, K., Zhang, M., & Liu, J. Urban heat island effects of various urban morphologies under regional climate conditions. Science of the total environment, 2020, 743, 140589. [CrossRef]
- Boccalatte, A., Fossa, M., Gaillard, L., & Menezo, C. Microclimate and urban morphology effects on building energy demand in different European cities. Energy and Buildings, 2020, 224, 110129. [CrossRef]
- Yuan, C., Adelia, A. S., Mei, S., He, W., Li, X. X., & Norford, L. (2020). Mitigating intensity of urban heat island by better understanding on urban morphology and anthropogenic heat dispersion. Building and Environment, 2020, 176, 106876. [CrossRef]
- Heisler, G. M., Brazel, A. J., The Urban Physical Environment: Temperature and Urban Heat Islands. Urban Ecosystem Ecology 2015, [S.l.], John Wiley & Sons, Ltd. p.29–56. [CrossRef]
- Amorim, M. C. C. T. Daily evolution of urban heat islands in a Brazilian tropical continental climate during dry and rainy periods. Urban Climate, 2020, v. 34. [CrossRef]
Figure 1.
Location map of the study area. Source: The authors (2024).
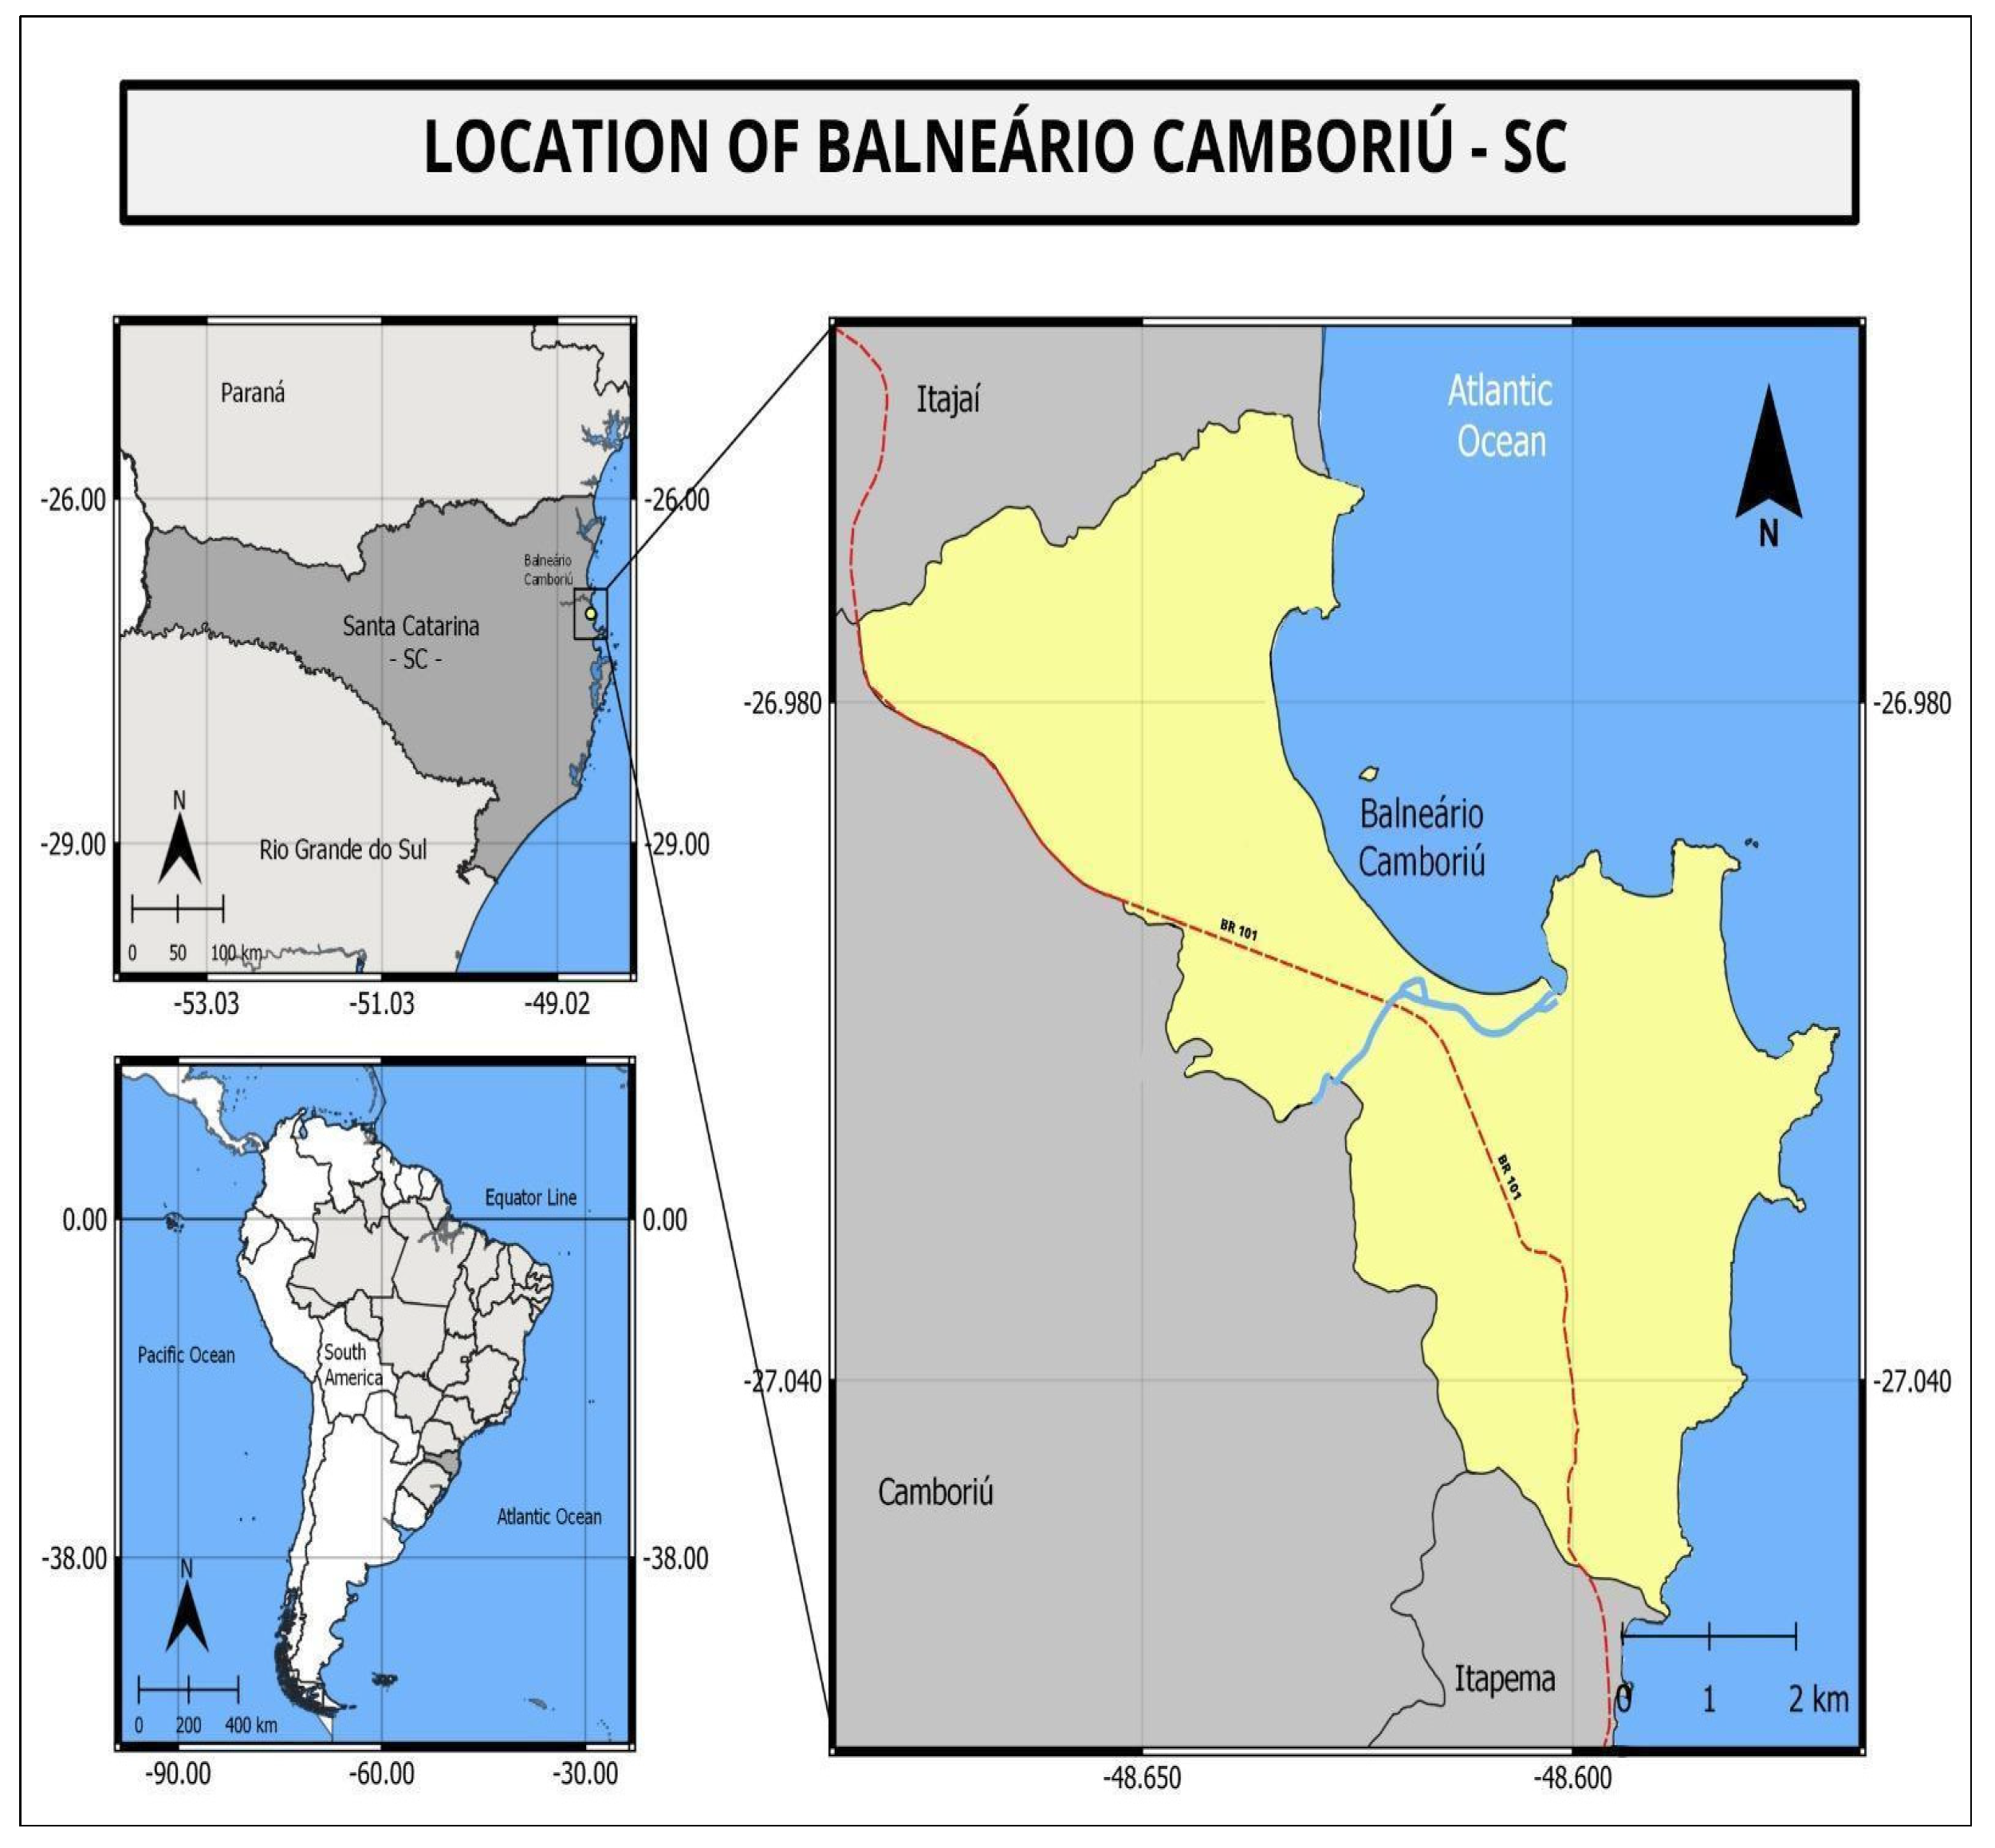
Figure 2.
Location of collection points for climate variables. Source: The authors (2024).
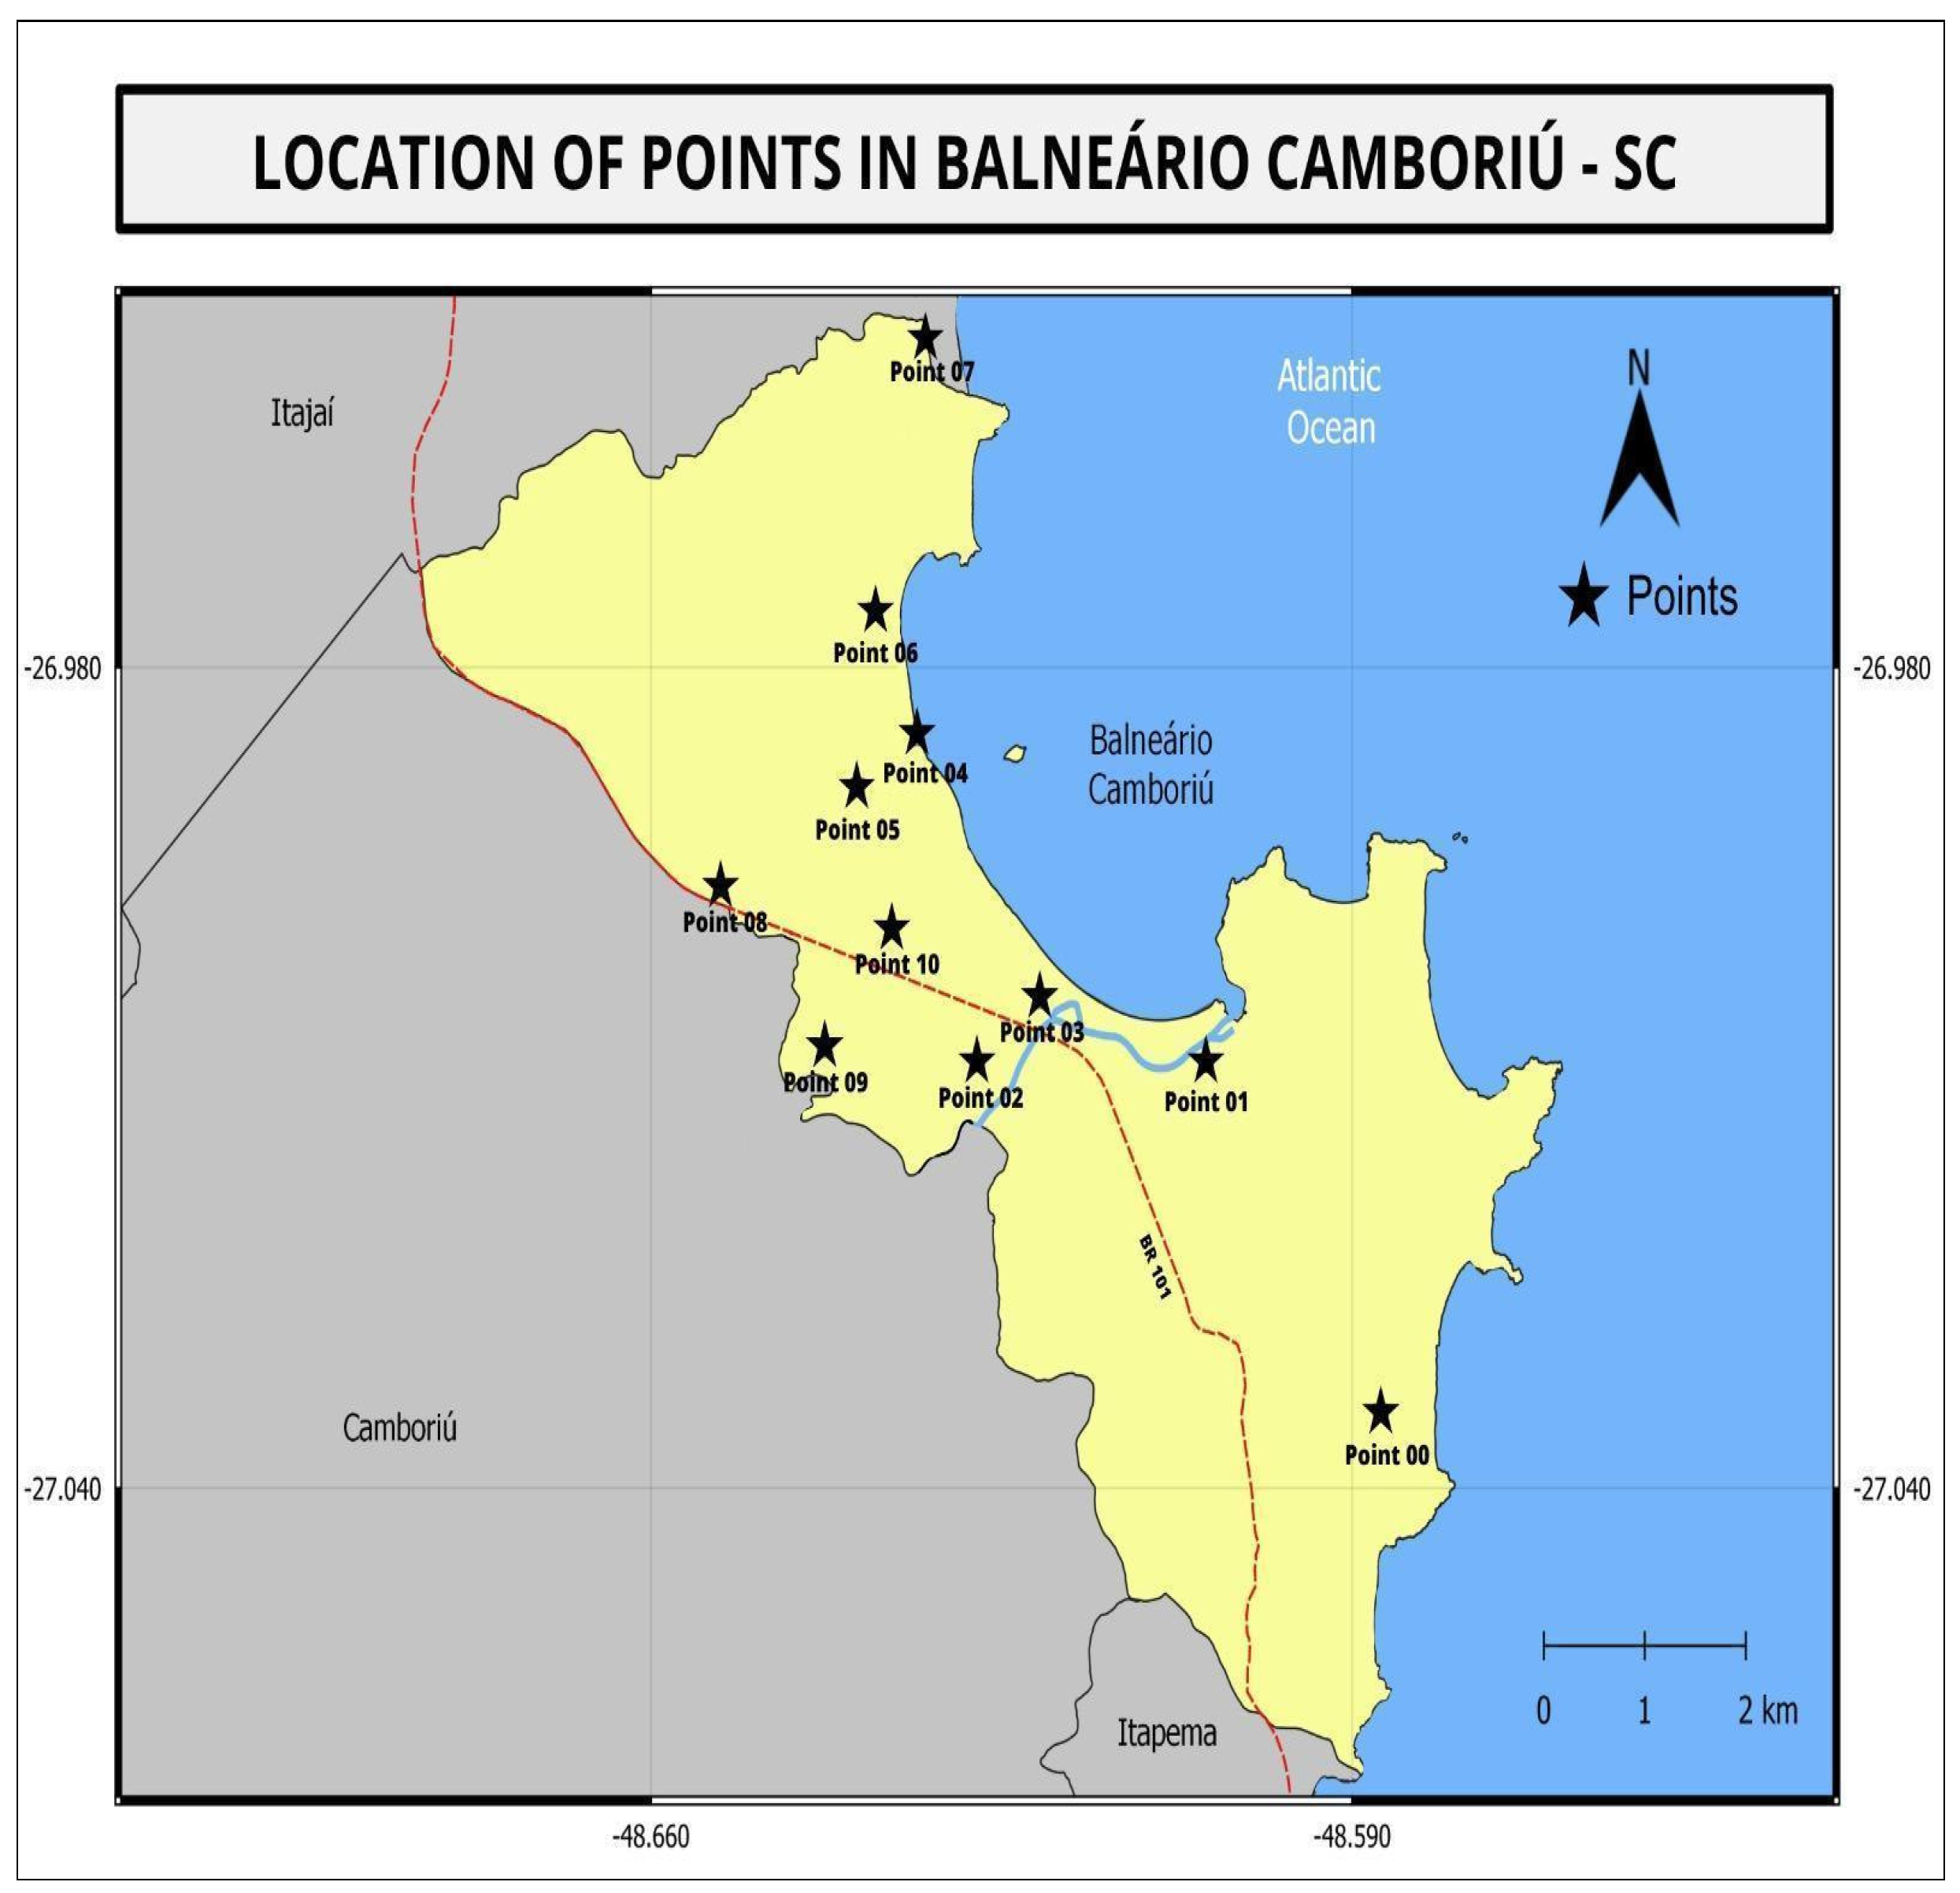
Chart 1.
Characterization and description of collection points, with information on geographic coordinates, altitude and land use occupation.
Chart 1.
Characterization and description of collection points, with information on geographic coordinates, altitude and land use occupation.
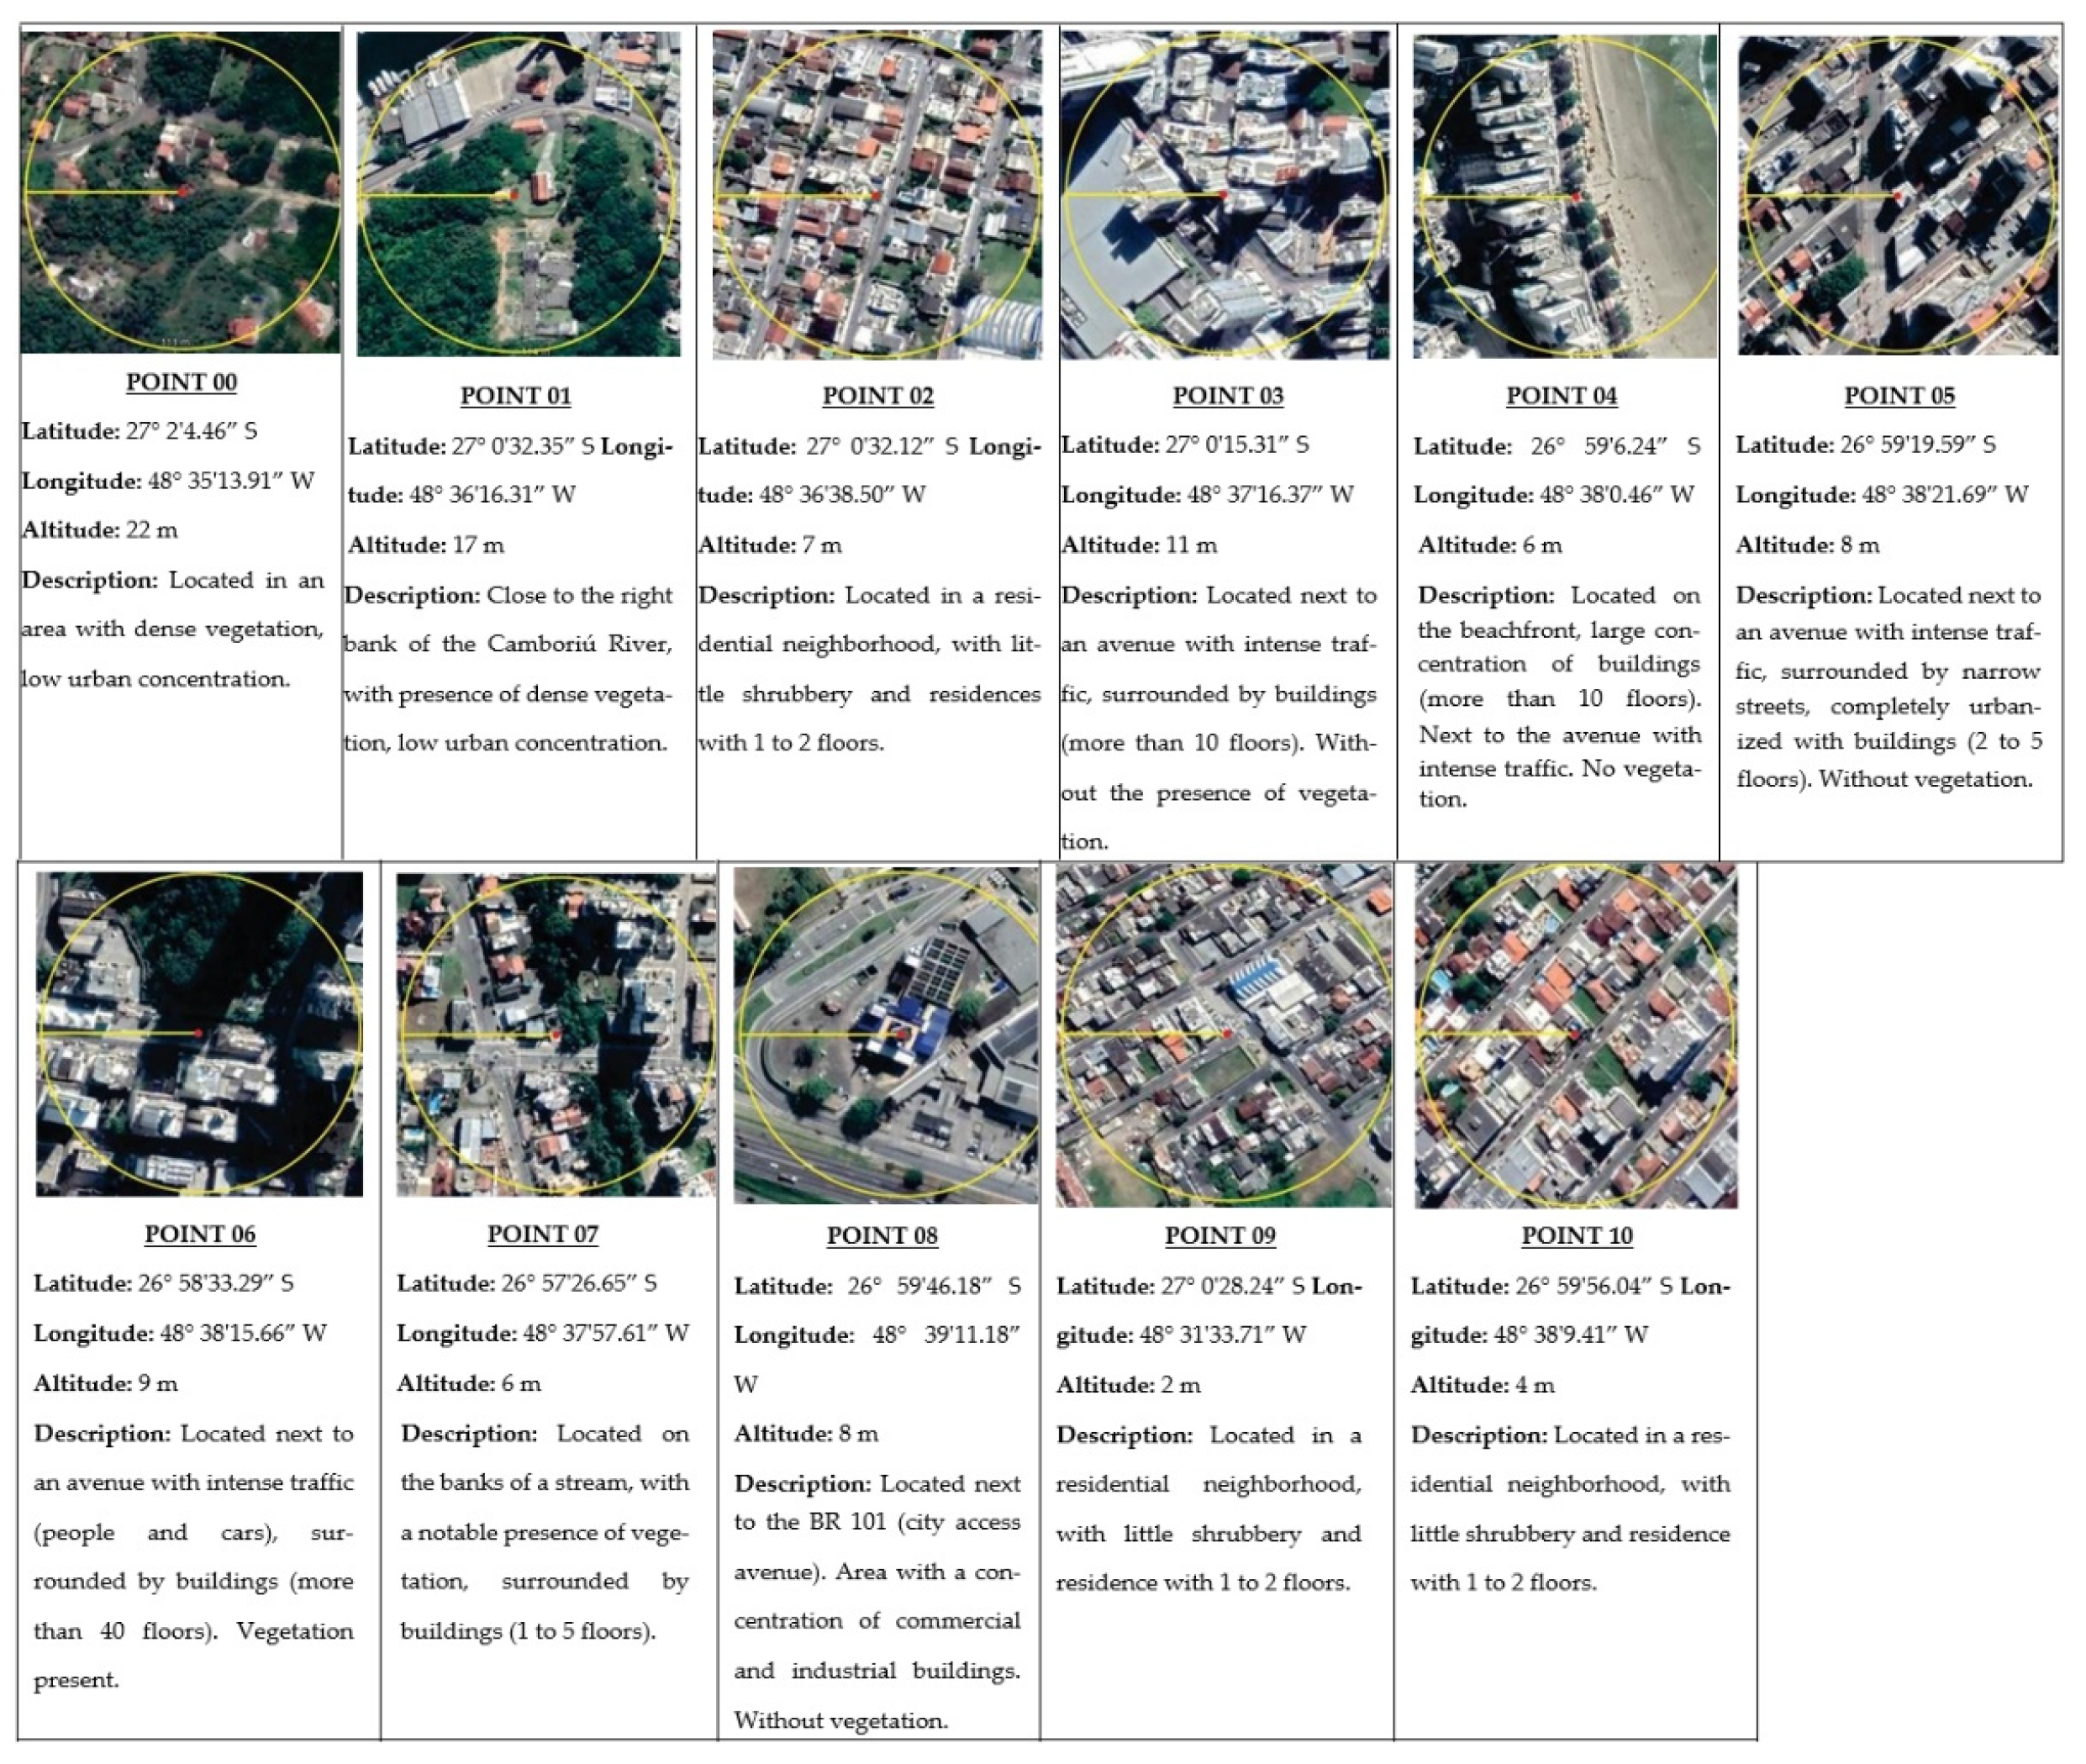
Figure 3.
Location of data collection points in relation to the LCZs defined in Balneário Camboriú. Adapted from [30].
Figure 3.
Location of data collection points in relation to the LCZs defined in Balneário Camboriú. Adapted from [30].
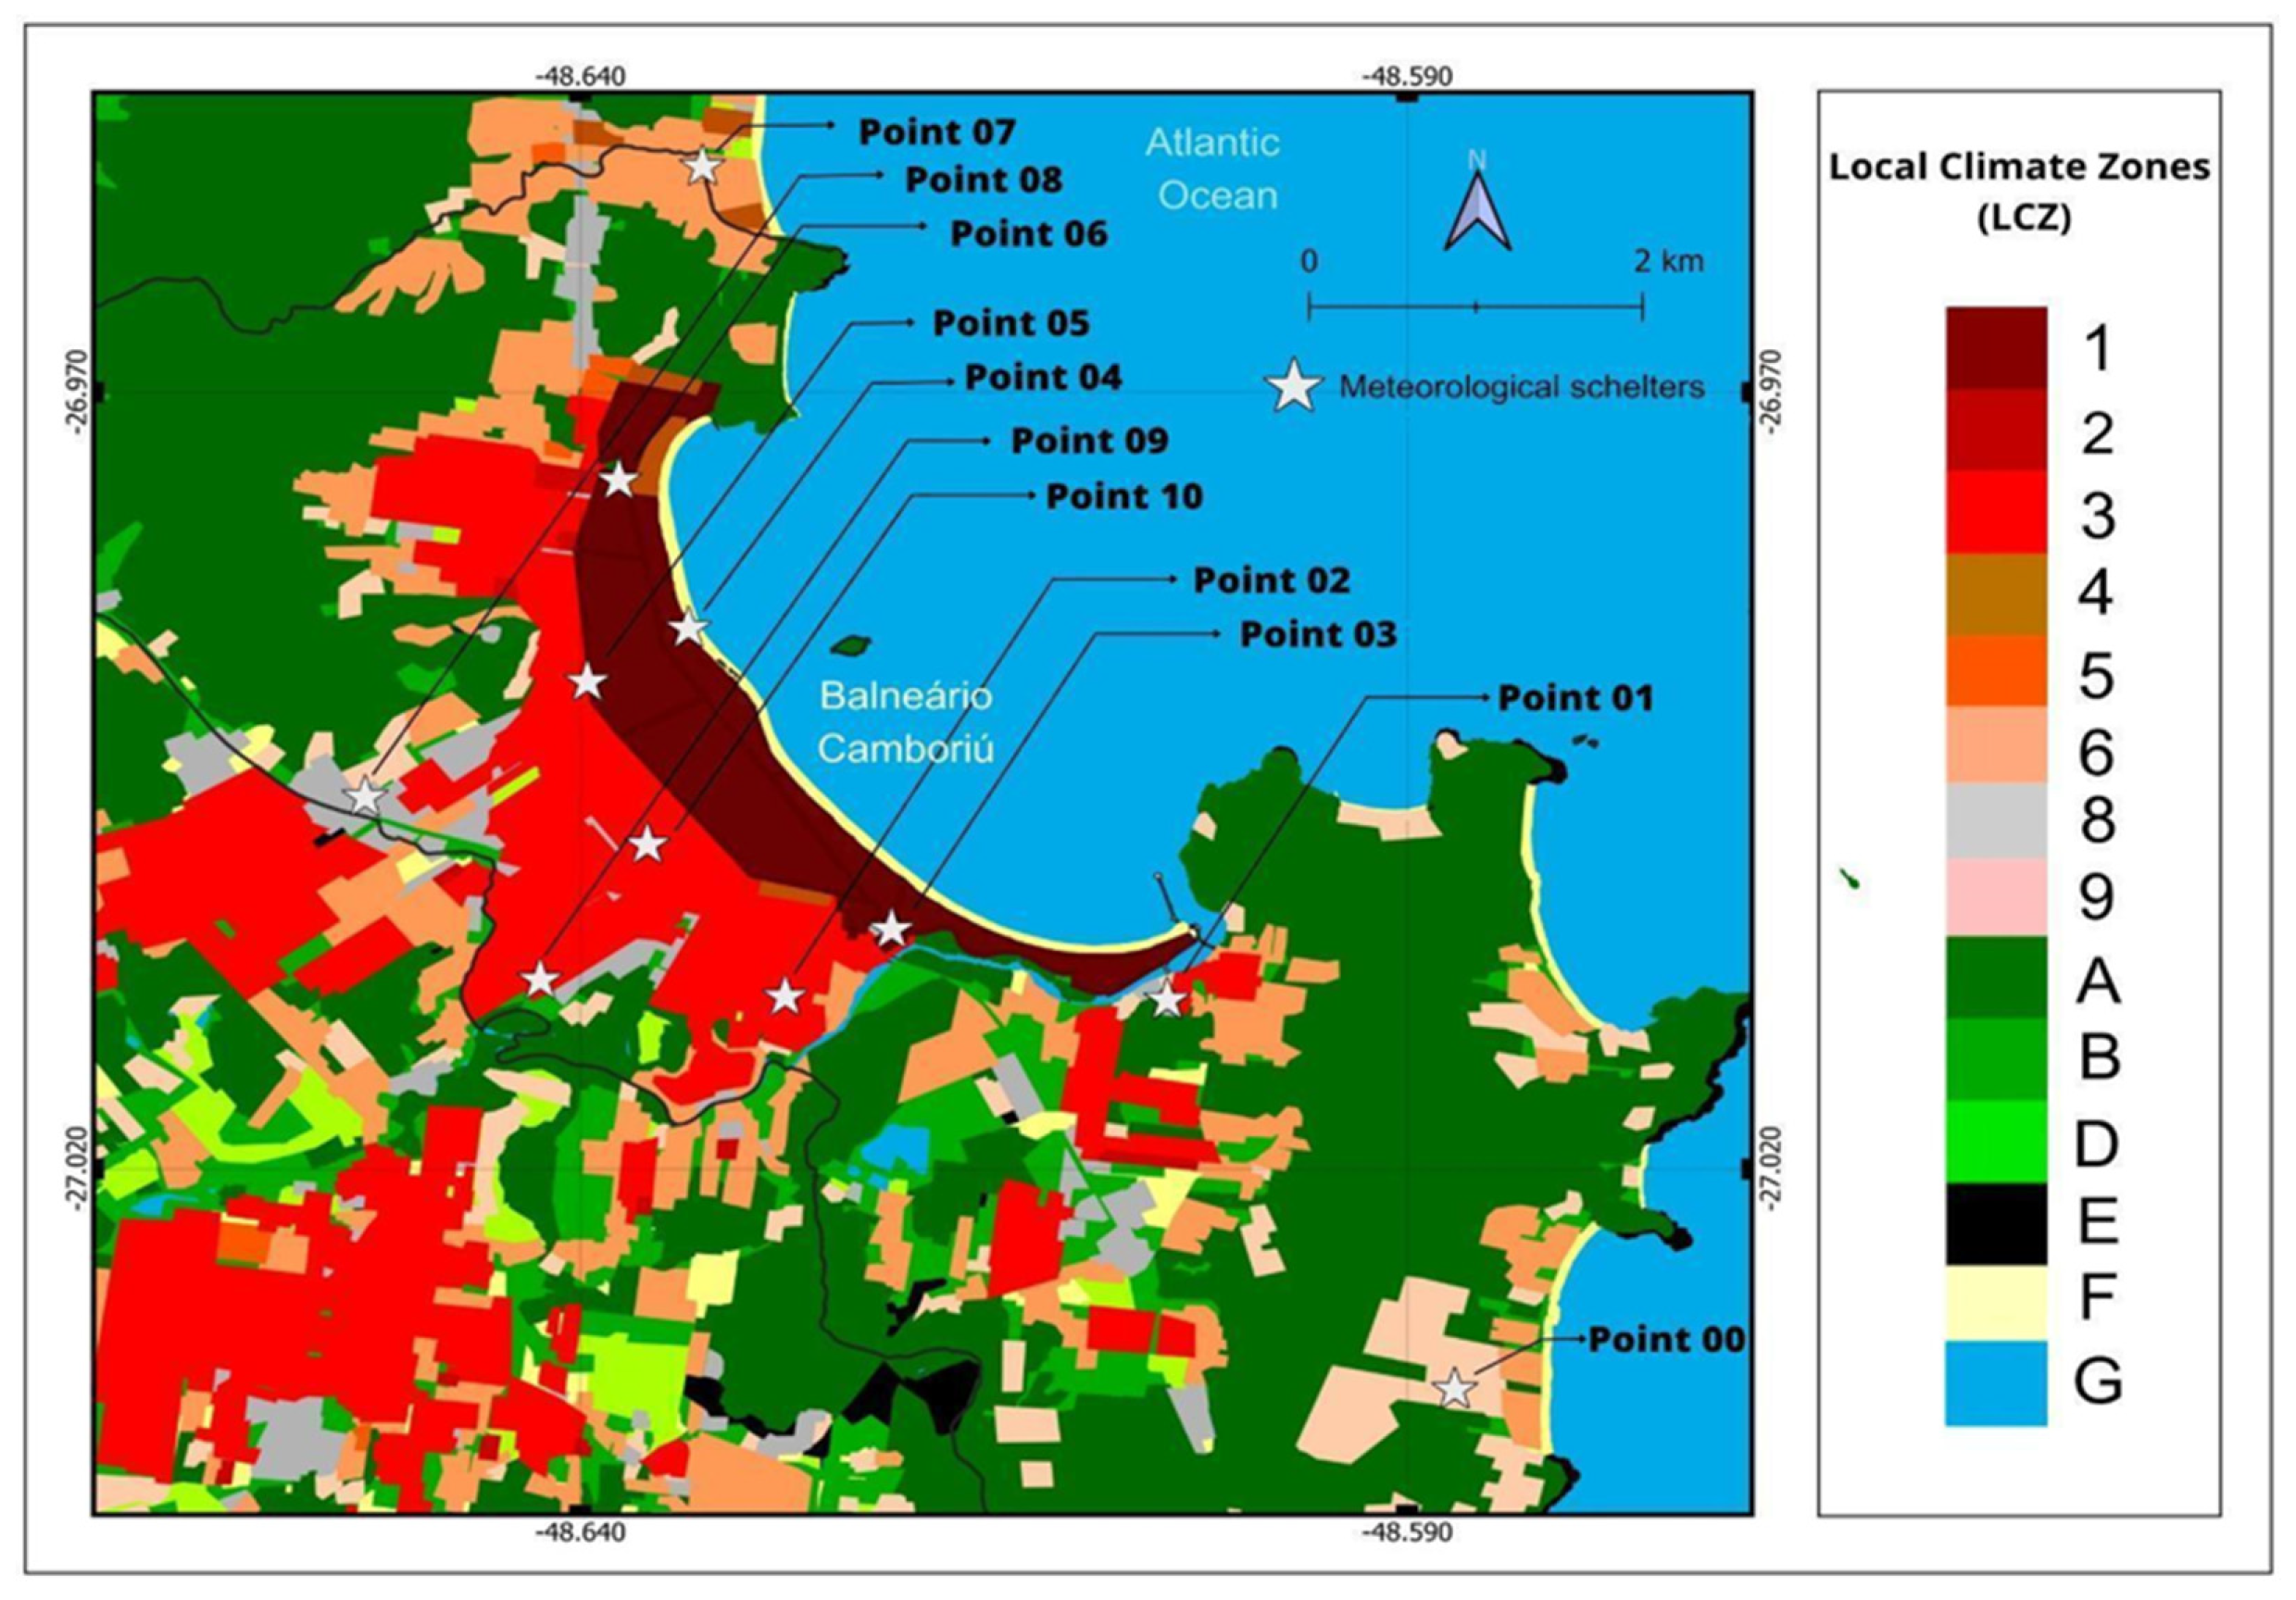
Figure 4.
Magnitudes of daytime UHI and UCI in Balneário Camboriú, in the period from June 1st to 14th, 2022. Source: Authors (2024).
Figure 4.
Magnitudes of daytime UHI and UCI in Balneário Camboriú, in the period from June 1st to 14th, 2022. Source: Authors (2024).
Figure 5.
Magnitudes of nocturnal UHI and UCI in Balneário Camboriú, in the period from June 1st to 14th, 2022. Source: Authors (2024).
Figure 5.
Magnitudes of nocturnal UHI and UCI in Balneário Camboriú, in the period from June 1st to 14th, 2022. Source: Authors (2024).
Figure 6.
Magnitudes and intensities of UHI and UCI at points 01, 02 and 03, between June 1st and 14th, 2022, in Balneário Camboriú/SC, Brazil. Source: The authors (2024).
Figure 6.
Magnitudes and intensities of UHI and UCI at points 01, 02 and 03, between June 1st and 14th, 2022, in Balneário Camboriú/SC, Brazil. Source: The authors (2024).
Figure 7.
Magnitudes and intensities of UHI and UCI at points 04, 05 and 06, between June 1st and 14th, 2022, in Balneário Camboriú/SC, Brazil. Source: The authors (2024).
Figure 7.
Magnitudes and intensities of UHI and UCI at points 04, 05 and 06, between June 1st and 14th, 2022, in Balneário Camboriú/SC, Brazil. Source: The authors (2024).
Figure 8.
Magnitudes and intensities of UHI and UCI at points 07, 08, 09 and 10, between June 1st and 14th, 2022, in Balneário Camboriú/SC, Brazil. Source: the authors (2024).
Figure 8.
Magnitudes and intensities of UHI and UCI at points 07, 08, 09 and 10, between June 1st and 14th, 2022, in Balneário Camboriú/SC, Brazil. Source: the authors (2024).
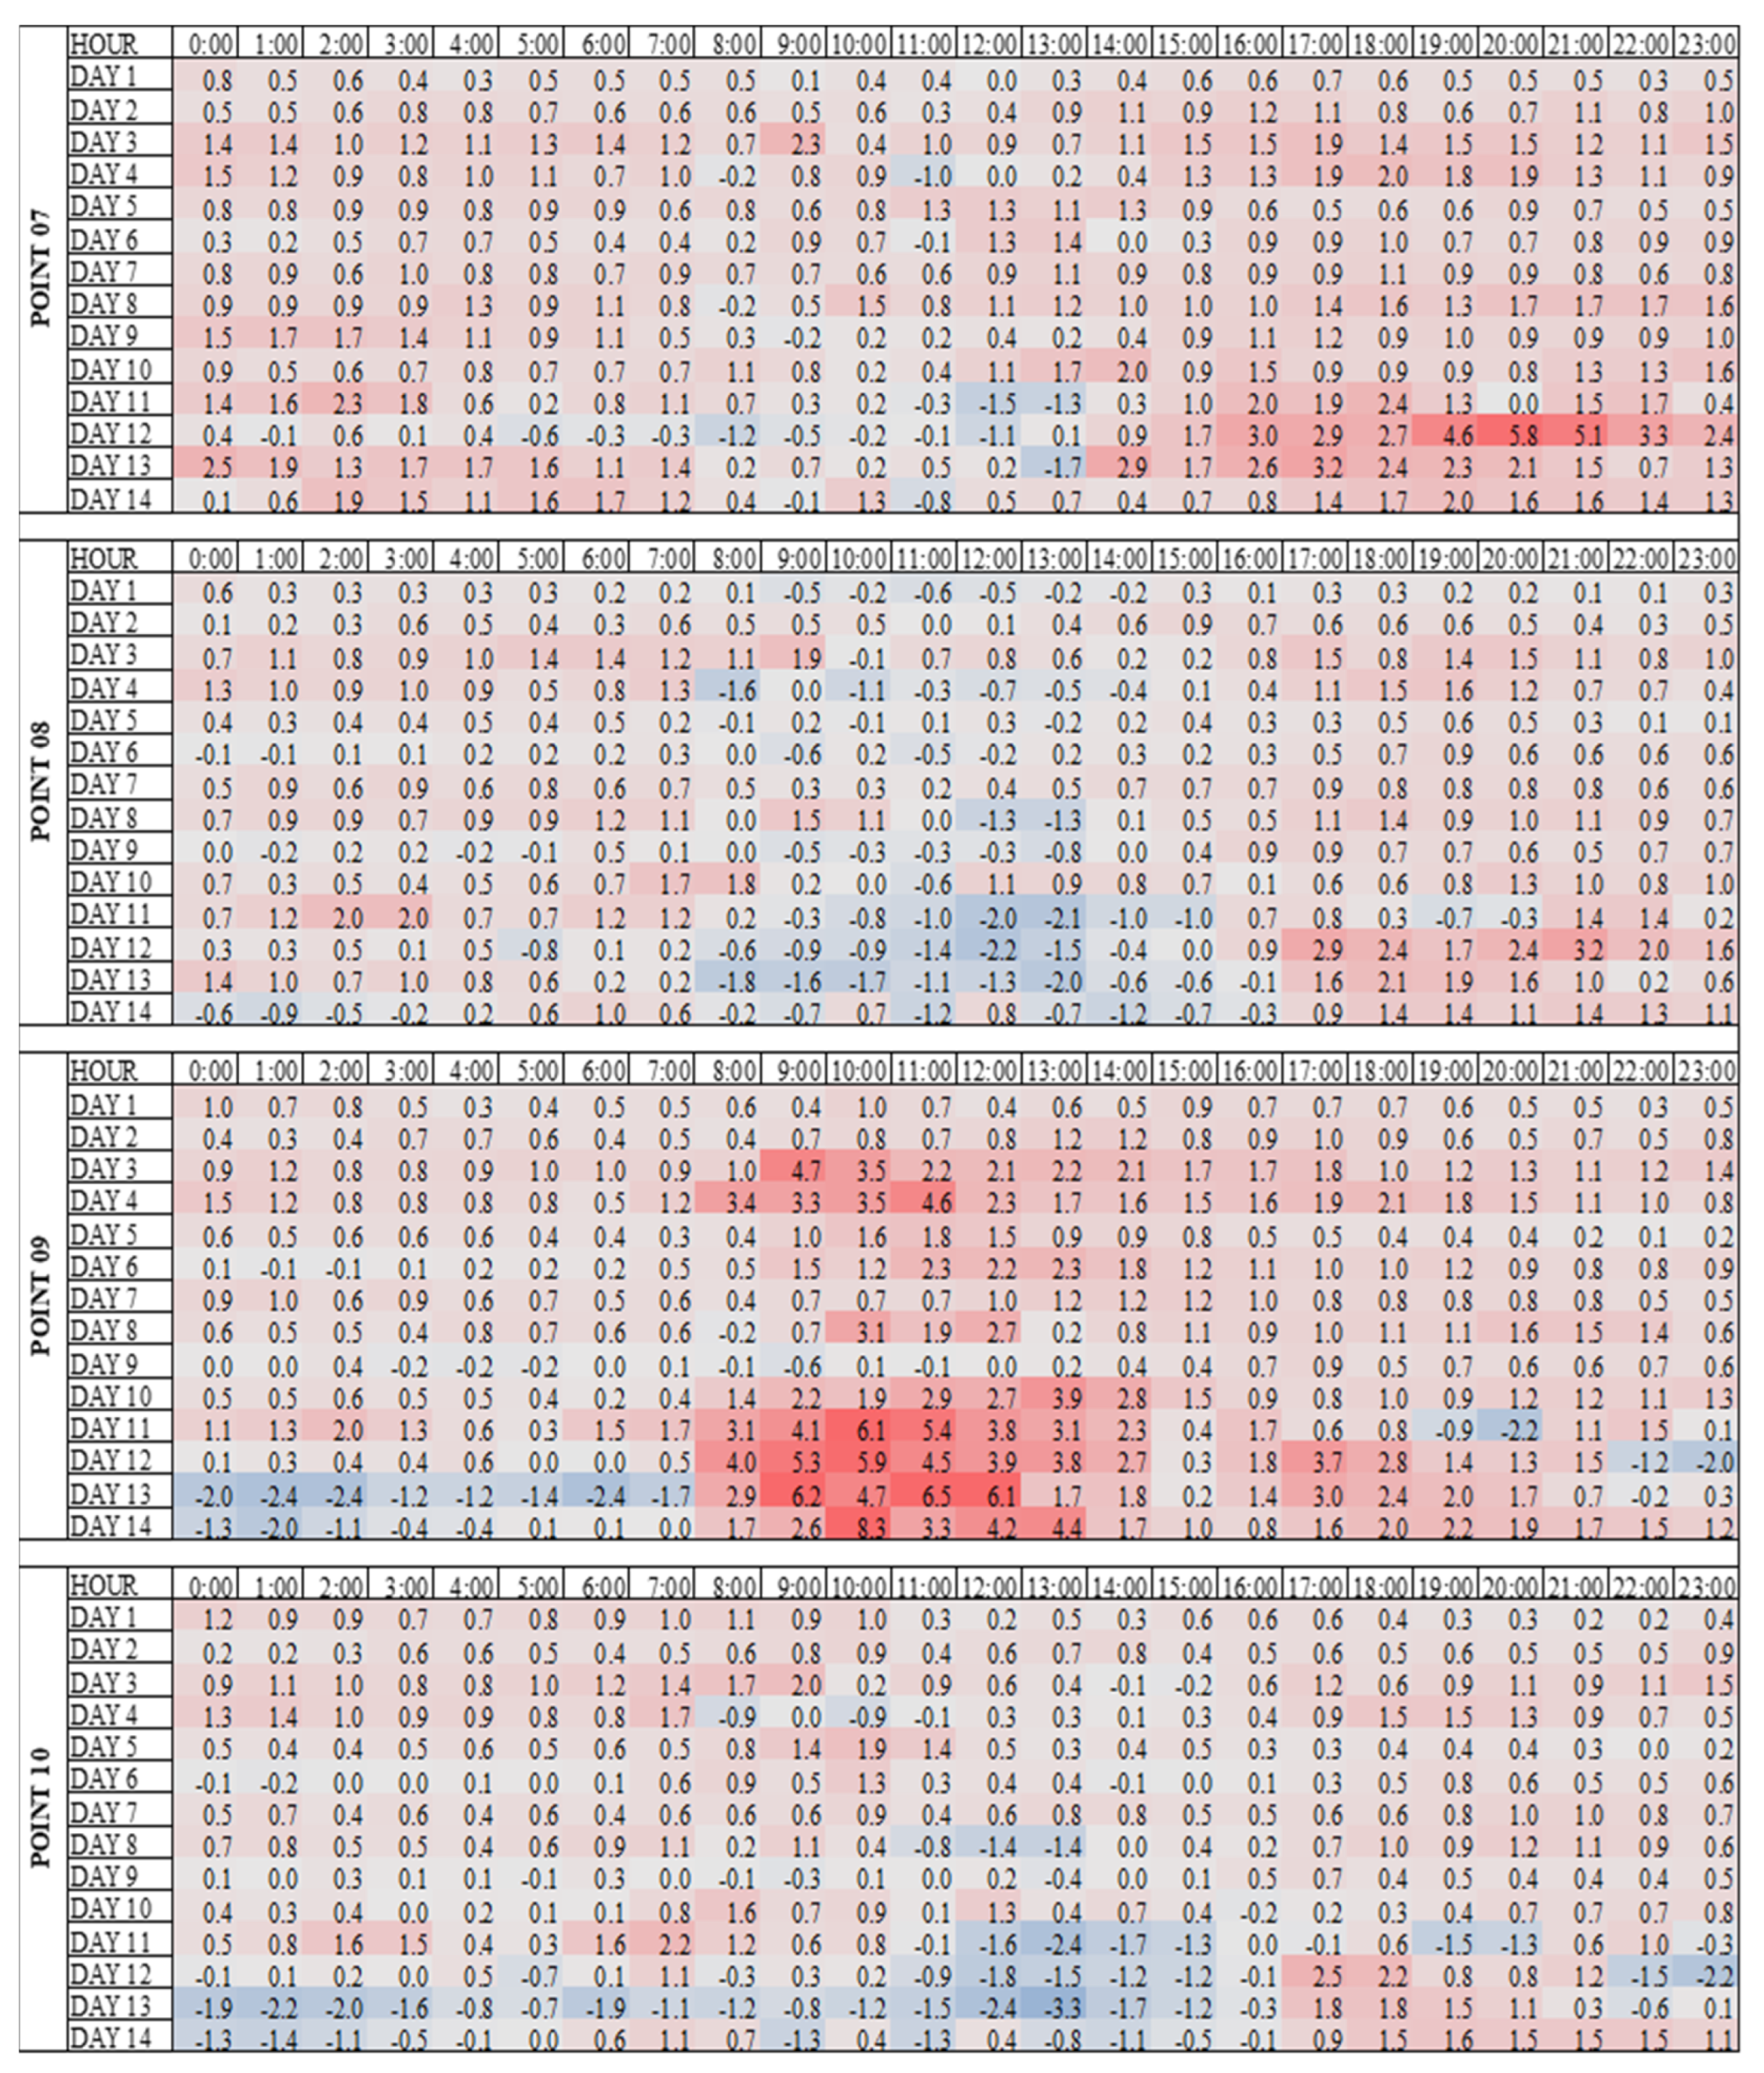

Table 1.
Classification of the magnitudes of urban heat and cool islands [33].
Table 1.
Classification of the magnitudes of urban heat and cool islands [33].
| Magnitude (°C) | Intensity | Category |
|---|---|---|
| > 6.0 | Very strong | UHI |
| 4.0 to 6.0 | Strong | |
| 2.0 to 4.0 | Moderate | |
| 0.0 to 2.0 | Weak | |
| -2.0 to 0.0 | Weak | UCI |
| -4.0 to -2.0 | Moderate | |
| -6.0 to -4.0 | Strong | |
| < -6.0 | Very strong |
Table 3.
Ta data (°C): averages, absolute maximums, absolute minimums and thermal ranges for each collection point between June 1st to 14th 2022. Source: Data collection and organized by the authors (2024).
Table 3.
Ta data (°C): averages, absolute maximums, absolute minimums and thermal ranges for each collection point between June 1st to 14th 2022. Source: Data collection and organized by the authors (2024).
| Ta (°C) | P00 | P01 | P02 | P03 | P04 | P05 | P06 | P07 | P08 | P09 | P10 |
|---|---|---|---|---|---|---|---|---|---|---|---|
| Average | 16.1 | 15.9 | 16.6 | 16.6 | 16.8 | 16.6 | 16.5 | 17.0 | 16.5 | 17.2 | 16.4 |
| Maximum | 23.6 | 23.3 | 24.9 | 22.3 | 24.5 | 22.6 | 23.9 | 24.6 | 22.9 | 28.8 | 22.7 |
| Minimum | 8.9 | 7.8 | 8.5 | 9.5 | 8.8 | 8.9 | 9.0 | 8.6 | 8.9 | 8.2 | 8.7 |
| Amplitude | 14.7 | 15.5 | 16.4 | 12.8 | 15.7 | 13.7 | 14.9 | 16.0 | 14.0 | 20.6 | 14.0 |
Table 4.
Relationship between LCZs and average Ta (day and night) and the average magnitudes (daytime and nighttime) at each collection point. Source: the authors (2024).
Table 4.
Relationship between LCZs and average Ta (day and night) and the average magnitudes (daytime and nighttime) at each collection point. Source: the authors (2024).
| AVERAGE (°C) | ||||||
|---|---|---|---|---|---|---|
| Point | LCZ | LCZ Influence |
Daily Ta | Night Ta | Daily Magnitude |
Night Magnitude |
| 01 | LCZ 9 | LCZ A and 8 | 17.4 | 14.5 | -0.3 | -0.2 |
| 02 | LCZ 3 | - | 18.4 | 15.1 | 0.7 | 0.4 |
| 03 | LCZ 1 | - | 17.5 | 15.7 | -0.1 | 1.0 |
| 04 | LCZ 1 | LCZ F | 18.1 | 15.5 | 0.5 | 0.8 |
| 05 | LCZ 3 | LCZ 1 | 17.6 | 15.6 | 0.0 | 0.9 |
| 06 | LCZ 1 | LCZ A | 17.7 | 15.4 | 0.1 | 0.7 |
| 07 | LCZ 6 | LCZ A | 18.4 | 15.8 | 0.8 | 1.1 |
| 08 | LCZ 8 | - | 17.7 | 15.4 | 0.1 | 0.7 |
| 09 | LCZ 3 | - | 19.3 | 15.2 | 1.6 | 0.5 |
| 10 | LCZ 3 | - | 17.9 | 15.1 | 0.3 | 0.4 |
Disclaimer/Publisher’s Note: The statements, opinions and data contained in all publications are solely those of the individual author(s) and contributor(s) and not of MDPI and/or the editor(s). MDPI and/or the editor(s) disclaim responsibility for any injury to people or property resulting from any ideas, methods, instructions or products referred to in the content. |
© 2024 by the authors. Licensee MDPI, Basel, Switzerland. This article is an open access article distributed under the terms and conditions of the Creative Commons Attribution (CC BY) license (http://creativecommons.org/licenses/by/4.0/).
Copyright: This open access article is published under a Creative Commons CC BY 4.0 license, which permit the free download, distribution, and reuse, provided that the author and preprint are cited in any reuse.


