Submitted:
21 December 2023
Posted:
22 December 2023
You are already at the latest version
Abstract
Keywords:
1. Introduction
2. Steel Frames Erection Tolerances: Stochastic Methods #RSS and #RSP
2.1. Eurocode Standard Requirements – Tolerance Criteria


2.2. Two Stochastic Methods for Statistical Parameters of Frame Imperfections
2.2.1. #RSS Method (Random Storey Sway)
2.2.1. #RSP Method (Random Storey Positions)
3. Verifications of the Stochastic Methods of #RSS and #RSP
3.1. Random Storey Sway (#RSS) Method Verification
3.2. Random Storey Position (#RSP) Method Verification


4. Discussion on #RSS and #RSP Approach
5. Conclusions
Author Contributions
Funding
Data Availability Statement
Acknowledgments
Conflicts of Interest
References
- Melcher, J. Classification of structural steel members initial imperfections. In: Proc. of structural stability research council: proceedings 1980, Lehigh University, Bethlehem, Pennsylvania, 1980, https://scholarsmine.mst.edu/ccfss-library/234.
- Kala, Z. Sensitivity assessment of steel members under compression. Eng. Struct. 2009, 31, 1344–1348. [Google Scholar] [CrossRef]
- Chen, G.; Zhang, H.; Rasmussen, K.J.; Fan, F. Modeling geometric imperfections for reticulated shell structures using random field theory. Eng. Struct. 2016, 126, 481–489. [Google Scholar] [CrossRef]
- Wang, J.; Li, H.-N.; Fu, X.; Li, Q. Geometric imperfections and ultimate capacity analysis of a steel lattice transmission tower. J. Constr. Steel Res. 2021, 183, 106734. [Google Scholar] [CrossRef]
- Liu, W.; Rasmussen, K.J.R.; Zhang, H.; Xie, Y.; Liu, Q.; Dai, L. Probabilistic study and numerical modelling of initial geometric imperfections for 3D steel frames in advanced structural analysis. Structures 2023, 57, 105190. [Google Scholar] [CrossRef]
- Ma, T.; Xu, L. Effects of column imperfections on capacity of steel frames in variable loading. J. Constr. Steel Res. 2020, 165, 105819. [Google Scholar] [CrossRef]
- Dario Aristizabal-Ochoa, J. Second-order slope–deflection equations for imperfect beam–column structures with semi-rigid connections. Eng. Struct. 2010, 32, 2440–2454. [Google Scholar] [CrossRef]
- Nowak, A.S.; Collins, K.R. Reliability of Structures. McGraw-Hill. 2000. Available online: https://www.researchgate.net/publication/37427378_Reliability_of_Structures.
- Liu, W.; Rasmussen, K.J.R.; Zhang, H. Systems reliability for 3D steel frames subject to gravity loads. Structures 2016, 8, 170–182. [Google Scholar] [CrossRef]
- Liu, W. System Reliability-Based Design of Three-Dimensional Steel Structures by Advanced Analysis. Ph.D. Thesis, The University of Sydney, Sydney, Australia, 2016. Available online: https://ses.library.usyd.edu.au/handle/2123/16126 (accessed on 10 December 2023).
- British Standard Institution (BSI). BSI). BS EN 1090-2:2018: Execution of steel structures. In BS EN 1090-2:2018; BSI Standards Limited: London, 2018. [Google Scholar]
- Baláž, I.; Koleková, Y.; Agüero, A.; Balážová, P. Consistency of imperfections in steel Eurocodes. Appl. Sci. 2023, 13, 554. [Google Scholar] [CrossRef]
- Kala, Z. Sensitivity analysis of steel plane frames with initial imperfections. Eng. Struct. 2011, 33, 2342–2349. [Google Scholar] [CrossRef]
- Zhang, Z.-J.; Chen, B.-S.; Bai, R.; Liu, Y.-P. Non-Linear Behavior and Design of Steel Structures: Review and Outlook. Buildings 2023, 13, 2111. [Google Scholar] [CrossRef]
- Shayan, S.; Rasmussen, K.J.R.; Zhang, H. On the modelling of initial geometric imperfections of steel frames in advanced analysis, J. Constr. Steel Res. 2014, 98, 167–177. [Google Scholar] [CrossRef]
- Gu, J.X.; Chan, S.L. Second-order analysis and design of steel structures allowing for member and frame imperfections, Int. Journal Numer. Methods Eng. 2005, 62, 601–15. [Google Scholar] [CrossRef]
- Kala, Z. Strain energy and entropy based scaling of buckling modes. Entropy 2023, 25, 1630. [Google Scholar] [CrossRef] [PubMed]
- European Committee for Standardization. Part 1-1: General Rules and Rules for Buildings. In EN 1993-1-1:2005+A1:2014 Eurocode 3: Design of Steel Structures; European Committee for Standardization, Brussels, Belgium, 2014.
- Kim, S.E. Practical advanced analysis for steel frame design. Ph.D. Thesis, Purdue University, West Lafayette, 1996. [Google Scholar]
- Chan, S.L.; Huang, H.Y.; Fang, L.X. Advanced analysis of imperfect portal frames with semirigid base connections, J. Eng. Mech. 2005, 131, 633–40. [Google Scholar] [CrossRef]
- European Committee for Standardization. EN 1990:2002: Eurocode—Basis of Structural Design; European Committee for Standardization: Brussels, Belgium, 2002. [Google Scholar]
- De Domenico, D.; Falsone, G.; Settineri, D. Probabilistic buckling analysis of beam-column elements with geometric imperfections and various boundary conditions. Meccanica 2018, 53, 1001–1013. [Google Scholar] [CrossRef]
- Kala, Z.; Valeš, J. Imperfection sensitivity analysis of steel columns at ultimate limit state. Archives of Civil and Mechanical Engineering 2018, 18, 1207–1218. [Google Scholar] [CrossRef]
- Chepurnenko, A.; Turina, V.; Akopyan, V. Simplified method for calculating the bearing capacity of slender concrete-filled steel tubular columns. CivilEng 2023, 4, 1000–1015. [Google Scholar] [CrossRef]
- Quan, C.Y.; Walport, F.; Gardner, L. Equivalent imperfections for the out-of-plane stability design of steel beams by second-order inelastic analysis. Eng. Struct. /: Part B, 113481. https, 1134. [Google Scholar]
- Kala, Z.; Valeš, J. Sensitivity assessment and lateral-torsional buckling design of I-beams using solid finite elements. J. Constr. Steel Res. 2017, 139, 110–122. [Google Scholar] [CrossRef]
- Zhang, H.; Shayan, S.; Rasmussen, K.J.R.; Ellingwood, B.R. System-based design of planar steel frames, I: Reliability framework. J. Constr. Steel Res. 2016, 123, 135–143. [Google Scholar] [CrossRef]
- Lindner, J.; Gietzelt, R. Imperfektionsannahmen für Stützenschiefstellungen (Assumptions for imperfections for out-of-plumb of columns). Stahlbau 1984, 53, 97–102. [Google Scholar]
- Kala, Z.; Melcher, J.; Puklický, L. Material and geometrical characteristics of structural steels based on statistical analysis of metallurgical products. Journal of Civil Engineering and Management 2009, 15, 299–307. [Google Scholar] [CrossRef]
- Hungtington, D.E.; Lyrintzis, C.S. Improvements to and limitations of Latin hypercube sampling, Probabilistic. Eng. Mech. 1998, 13, 245–253. [Google Scholar] [CrossRef]
- McKay, M.D.; Beckman, R.; Conover, W. A comparison of three methods for selecting values of input variables in the analysis of output from a computer code, Technometrics 1979, 21, 239–245. 21. [CrossRef]
- Iman, R.L.; Conover, W.J. A distribution-free approach to inducing rank correlation among input variables, Commun. Stat. Simul. Comput. 1982, 11, 311–334. [Google Scholar] [CrossRef]
- Mahmood, A.; Varabuntoonvit, V.; Mungkalasiri, J.; Silalertruksa, T.; Gheewala, S.H. A Tier-wise method for evaluating uncertainty in life cycle assessment. Sustainability 2022, 14, 13400. [Google Scholar] [CrossRef]
- Xie, M.; Yuan, J.; Jia, H.; Yang, Y.; Huang, S.; Sun, B. Probabilistic seismic sensitivity analyses of high-speed railway extradosed cable-stayed bridges. Appl. Sci. 2023, 13, 7036. [Google Scholar] [CrossRef]
- Magini, R.; Moretti, M.; Boniforti, M.A.; Guercio, R. A Machine-learning approach for monitoring water distribution networks (WDNs). Sustainability 2023, 15, 2981. [Google Scholar] [CrossRef]
- Dynardo GmbH, OptiSLang software manual: Methods for multi-disciplinary optimization and robustness analysis, Weimar, 2019. https://www.ansys.
- Kala. Z.; Valeš, J.; Jönsson, J. Random fields of initial out of straightness leading to column buckling, J. Civ. Eng. Manag. 2017, 23, 902–913. [CrossRef]
- Kala. Z.; Stability problems of steel structures in the presence of stochastic and fuzzy uncertainty. Thin-Walled Struct. 2007, 45, 861–865. [Google Scholar] [CrossRef]
- Jindra, D.; Kala, Z.; Kala, J. Ultimate Load Capacity of Multi-Story Steel Frame Structures with Geometrical Imperfections: A Comparative Study of Two Methods. In Modern Building Materials, Structures and Techniques; MBMST 2023. Lecture Notes in Civil Engineering; Springer: Cham, Switzerland, 2023; Volume 392. [Google Scholar] [CrossRef]
- Odrobiňák, J.; Farbák, M.; Chromčák, J.; Kortiš, J.; Gocál, J. Real geometrical imperfection of bow-string arches—Measurement and global analysis. Appl. Sci. 2020, 10, 4530. [Google Scholar] [CrossRef]
- Jin, T.; Yu, H.; Li, J.; Hao, G.; Li, Z. Design and seismic performance of tied braced frames. Buildings 2023, 13, 1652. [Google Scholar] [CrossRef]
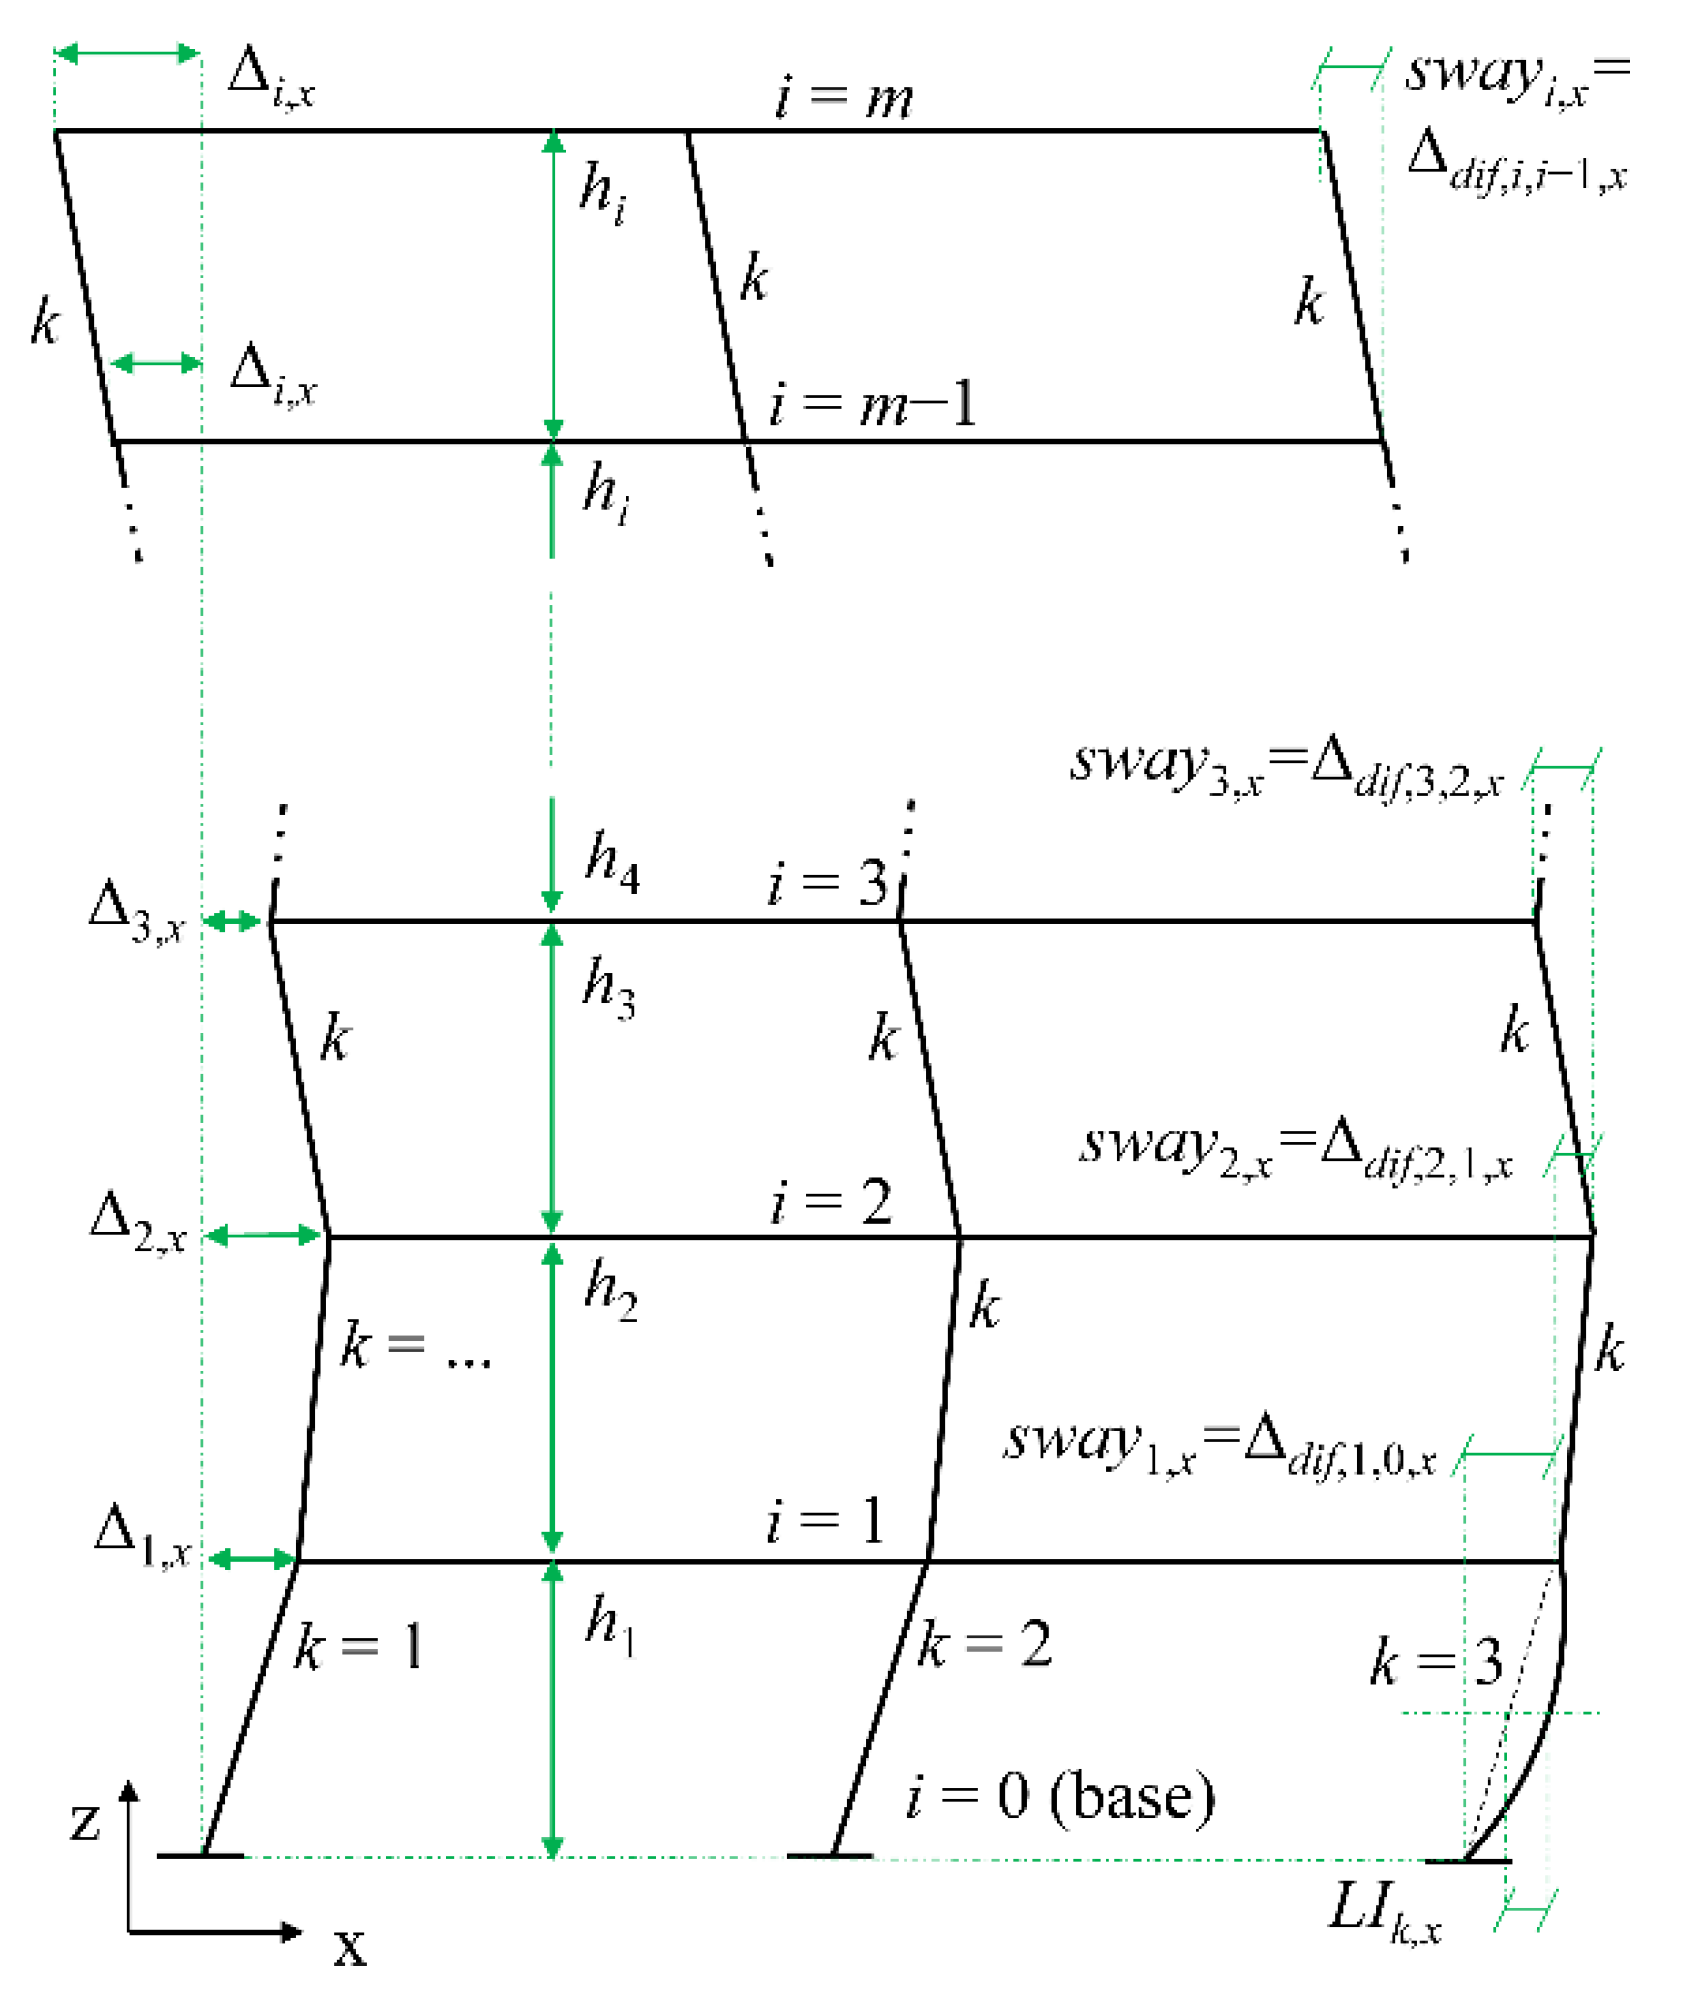
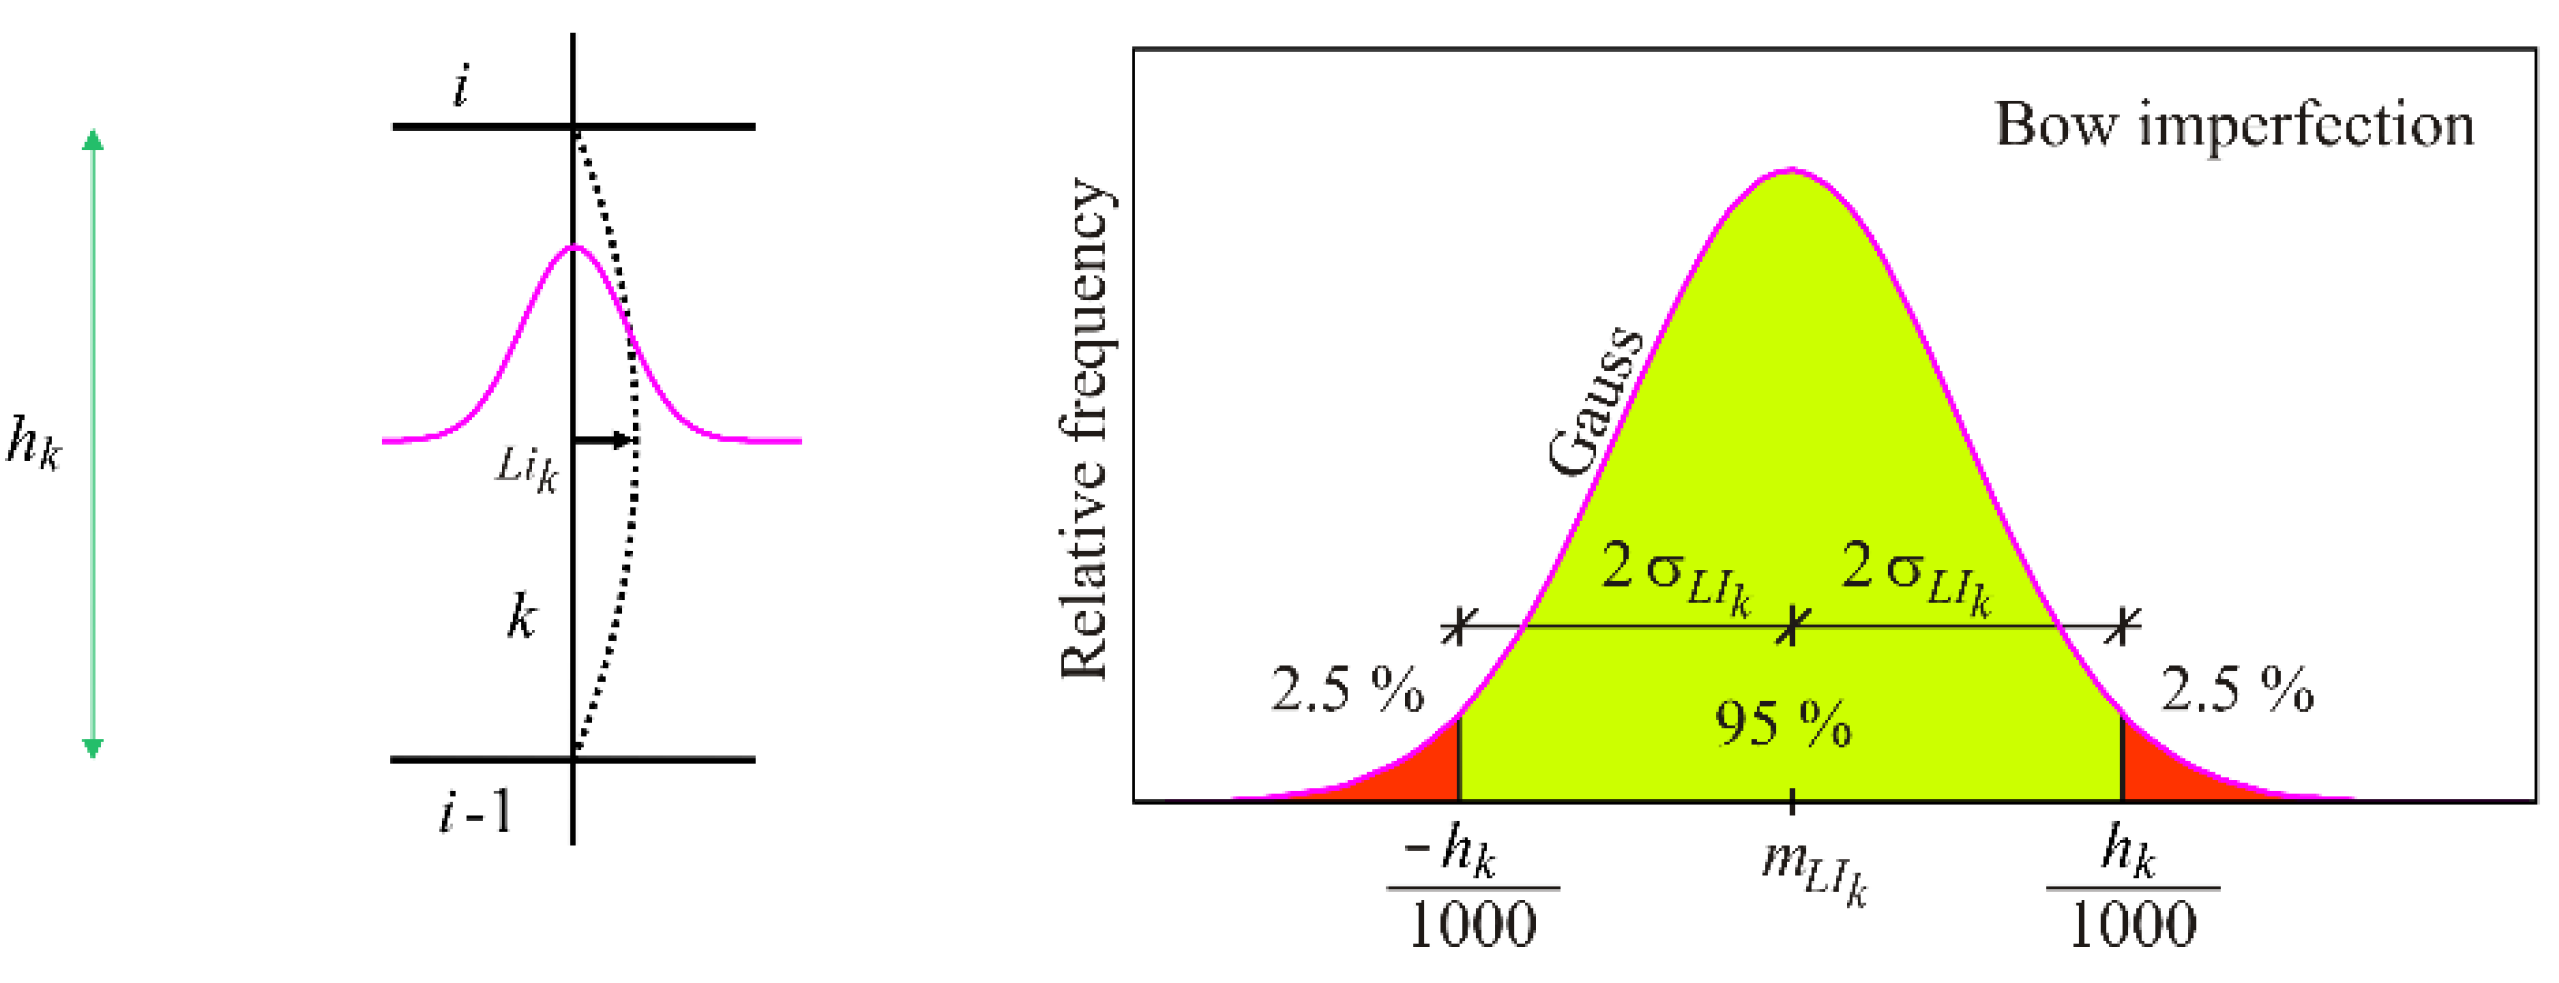
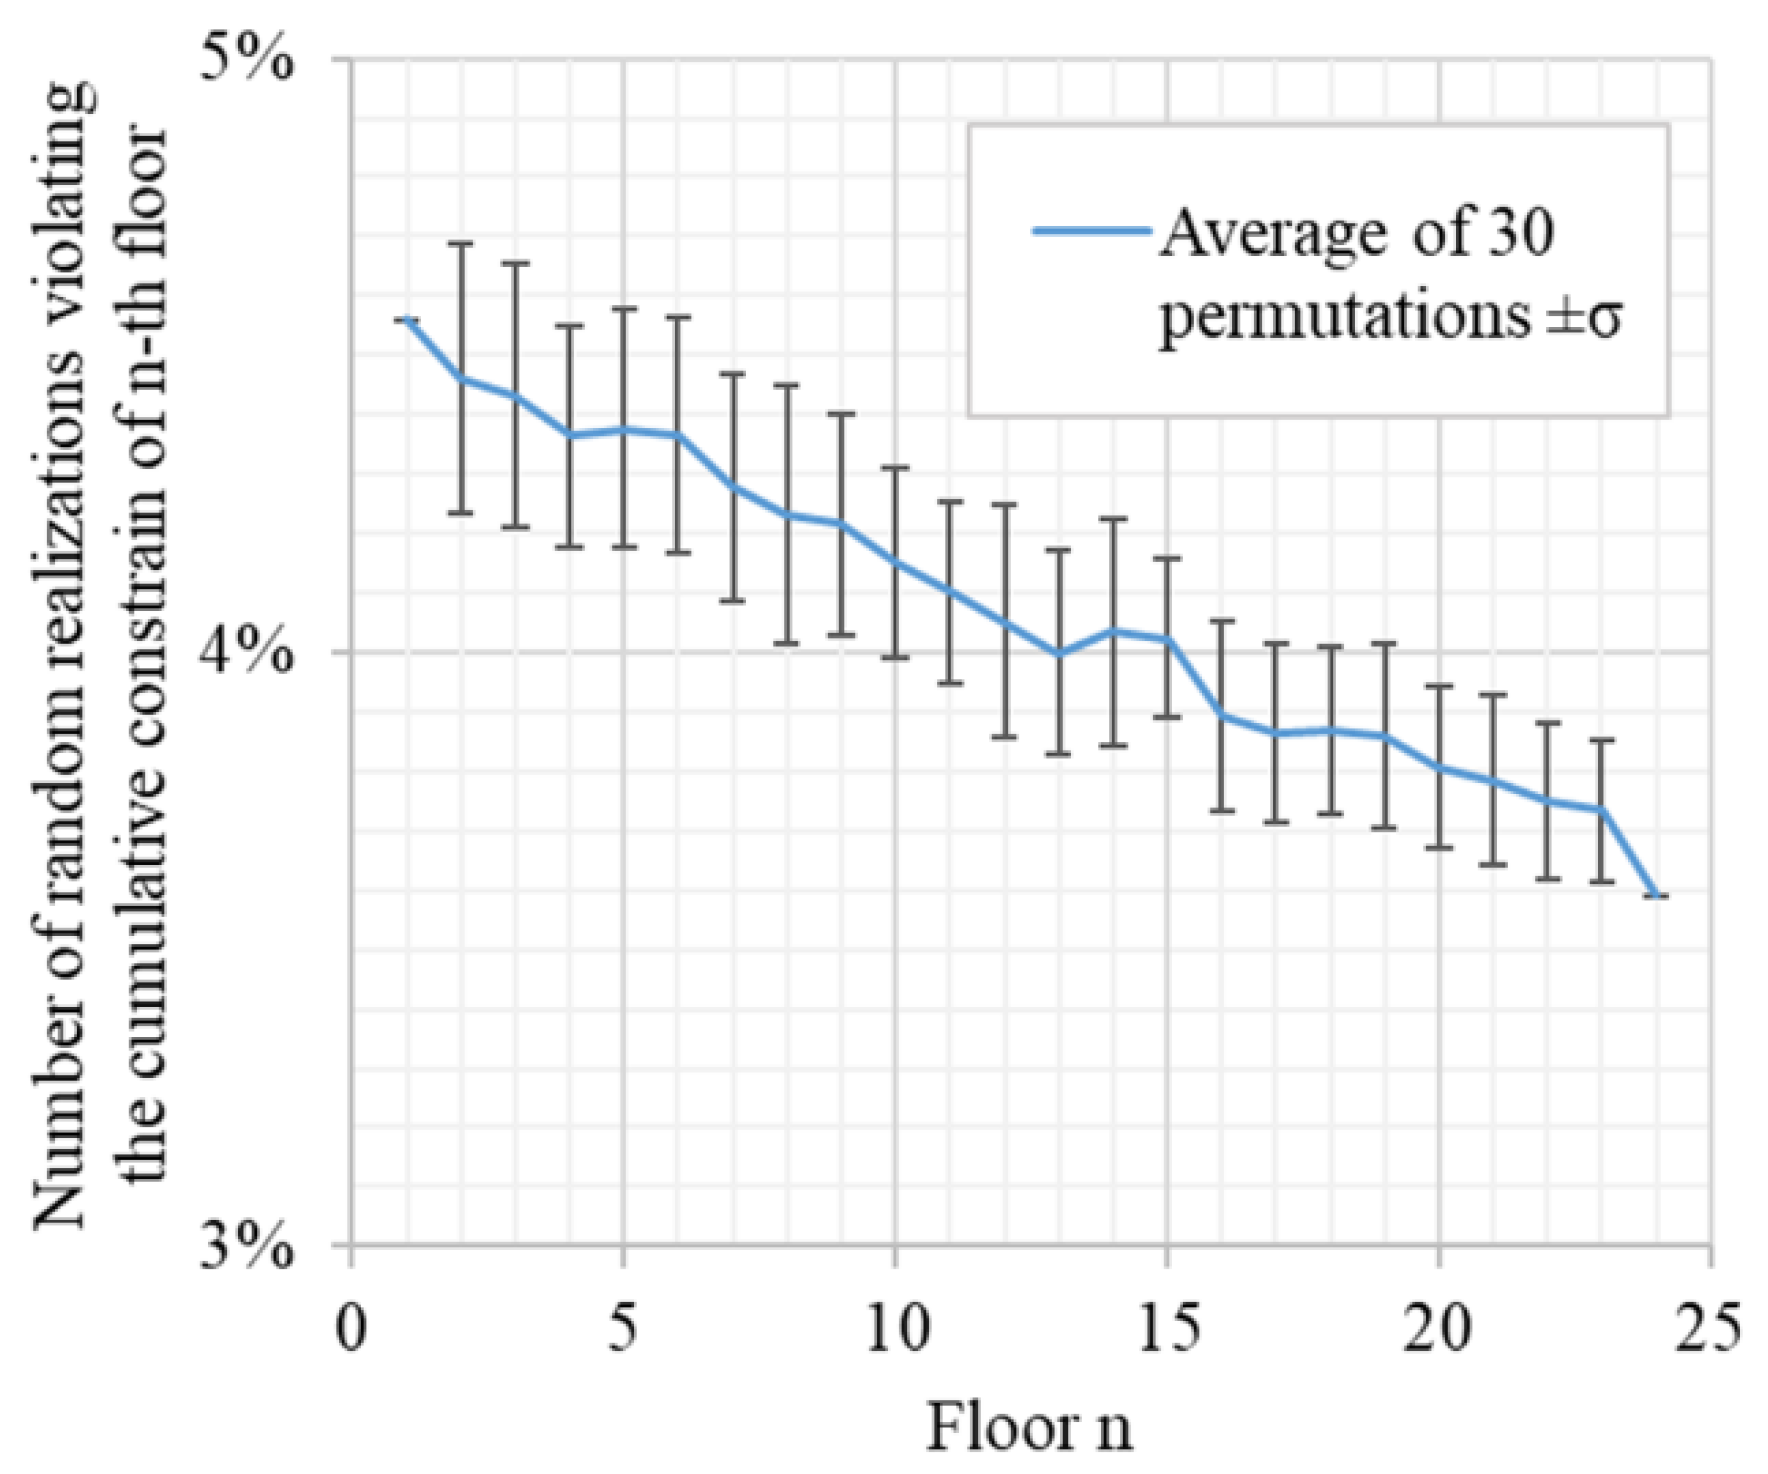
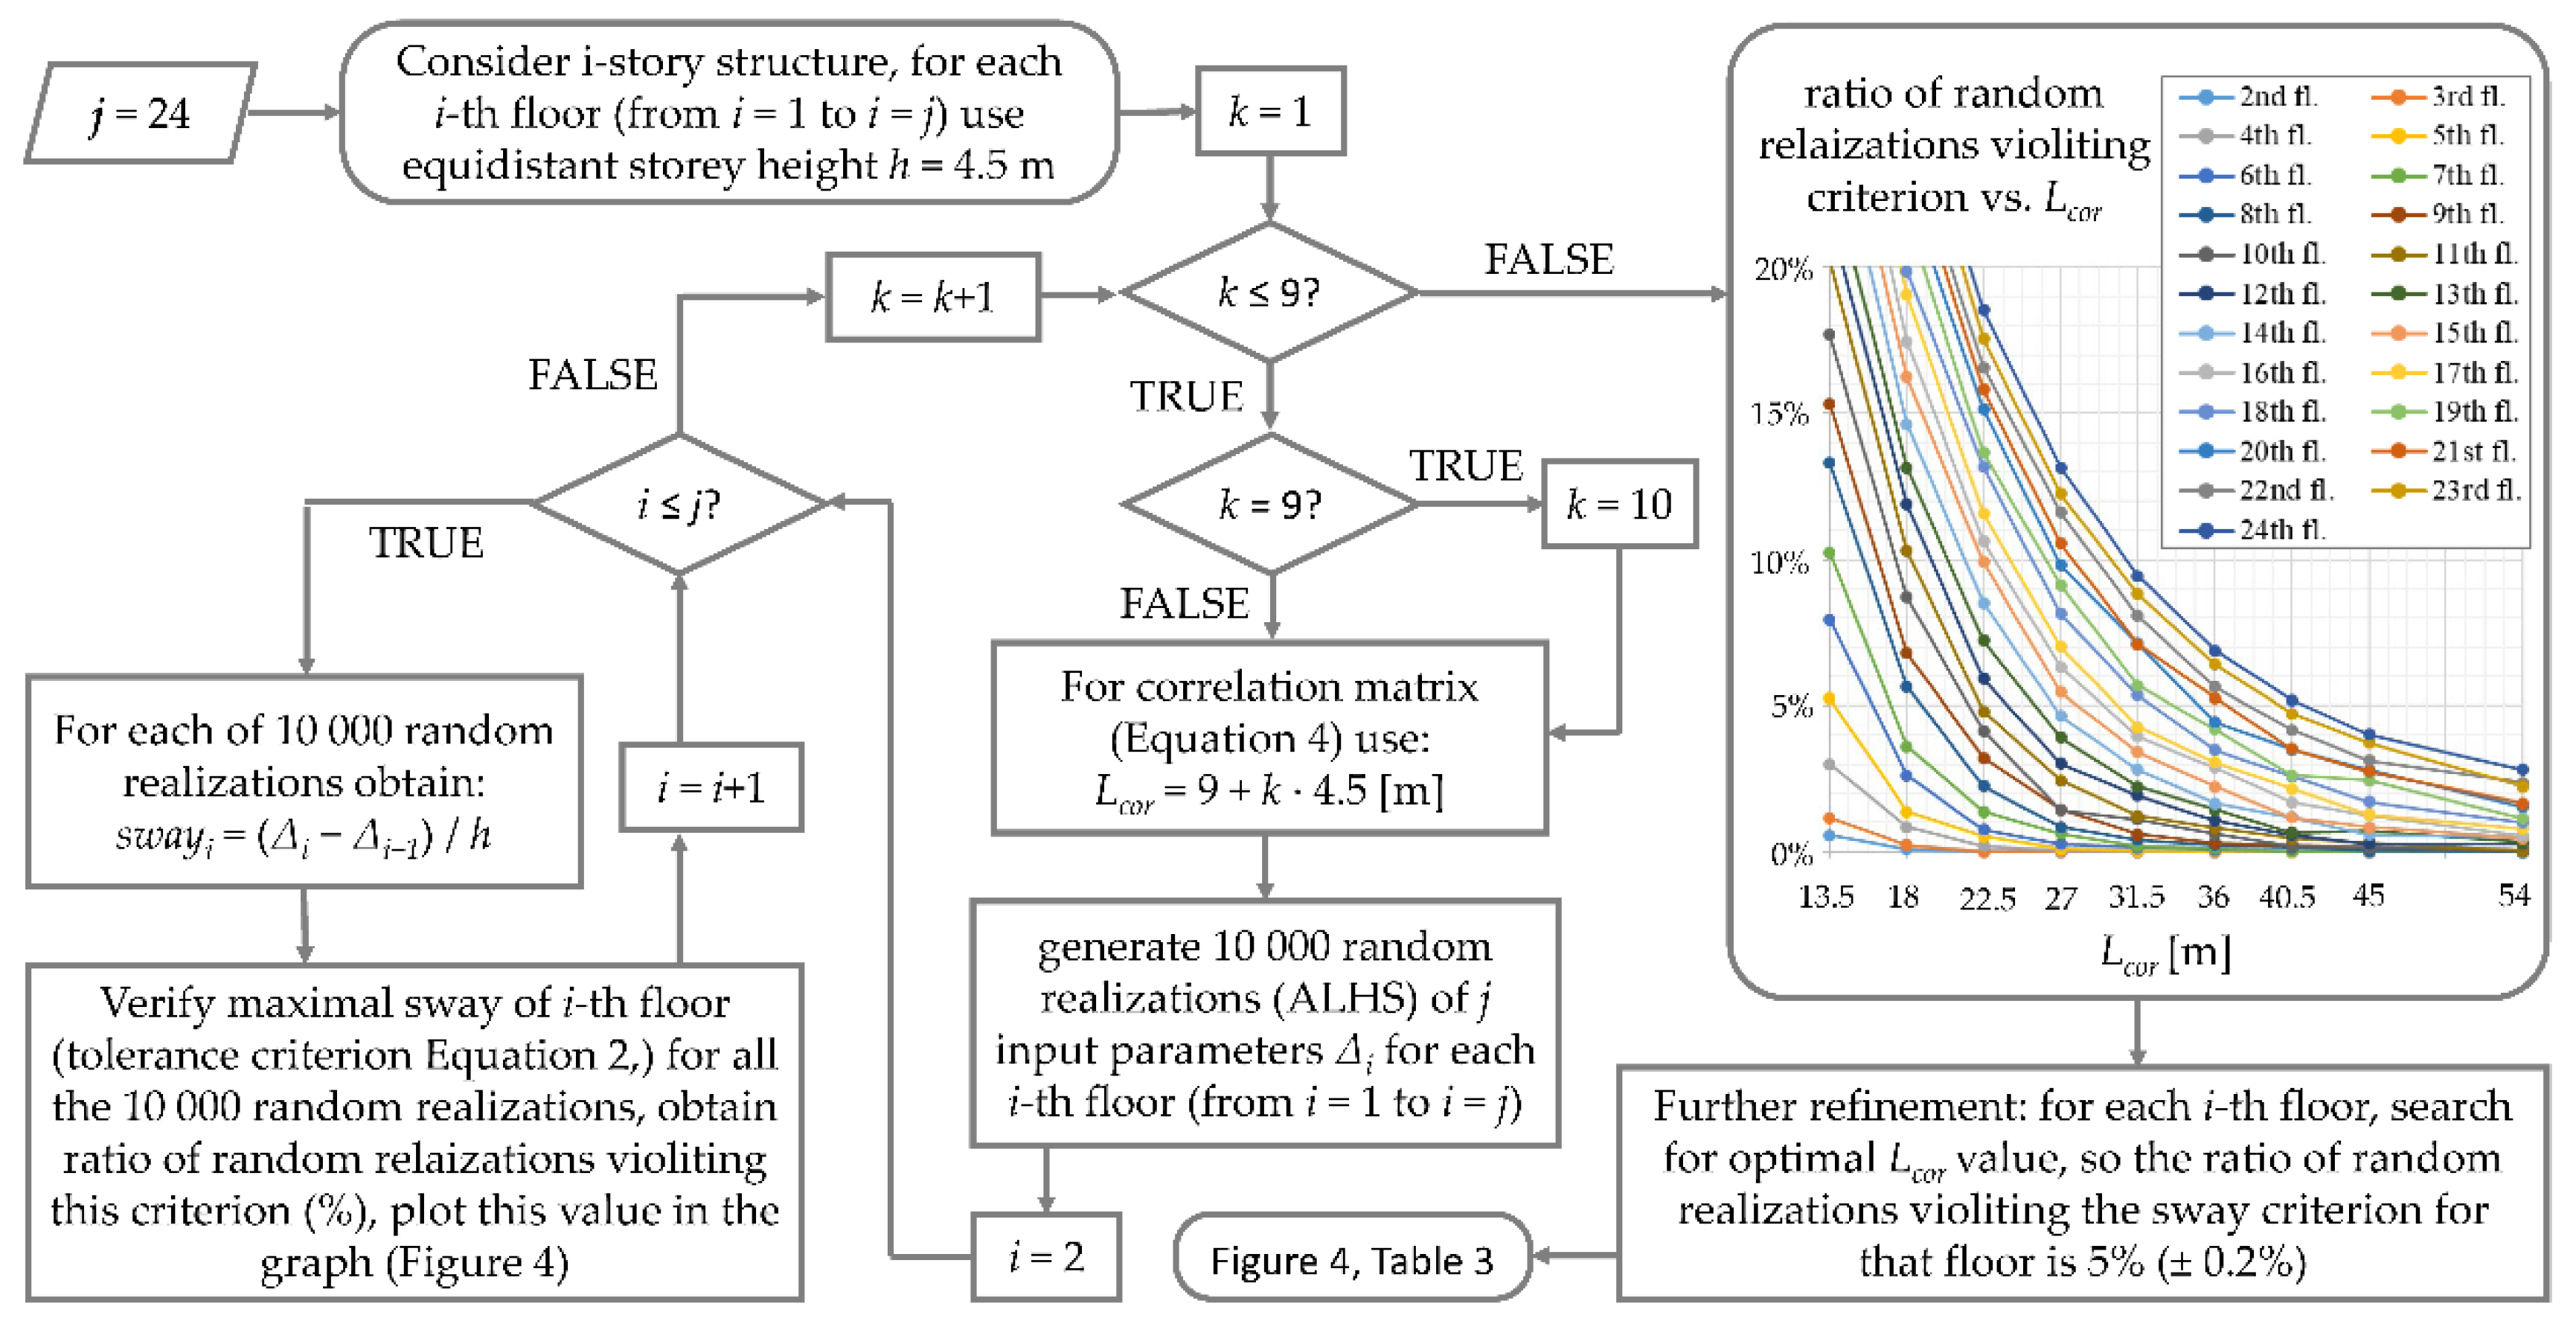

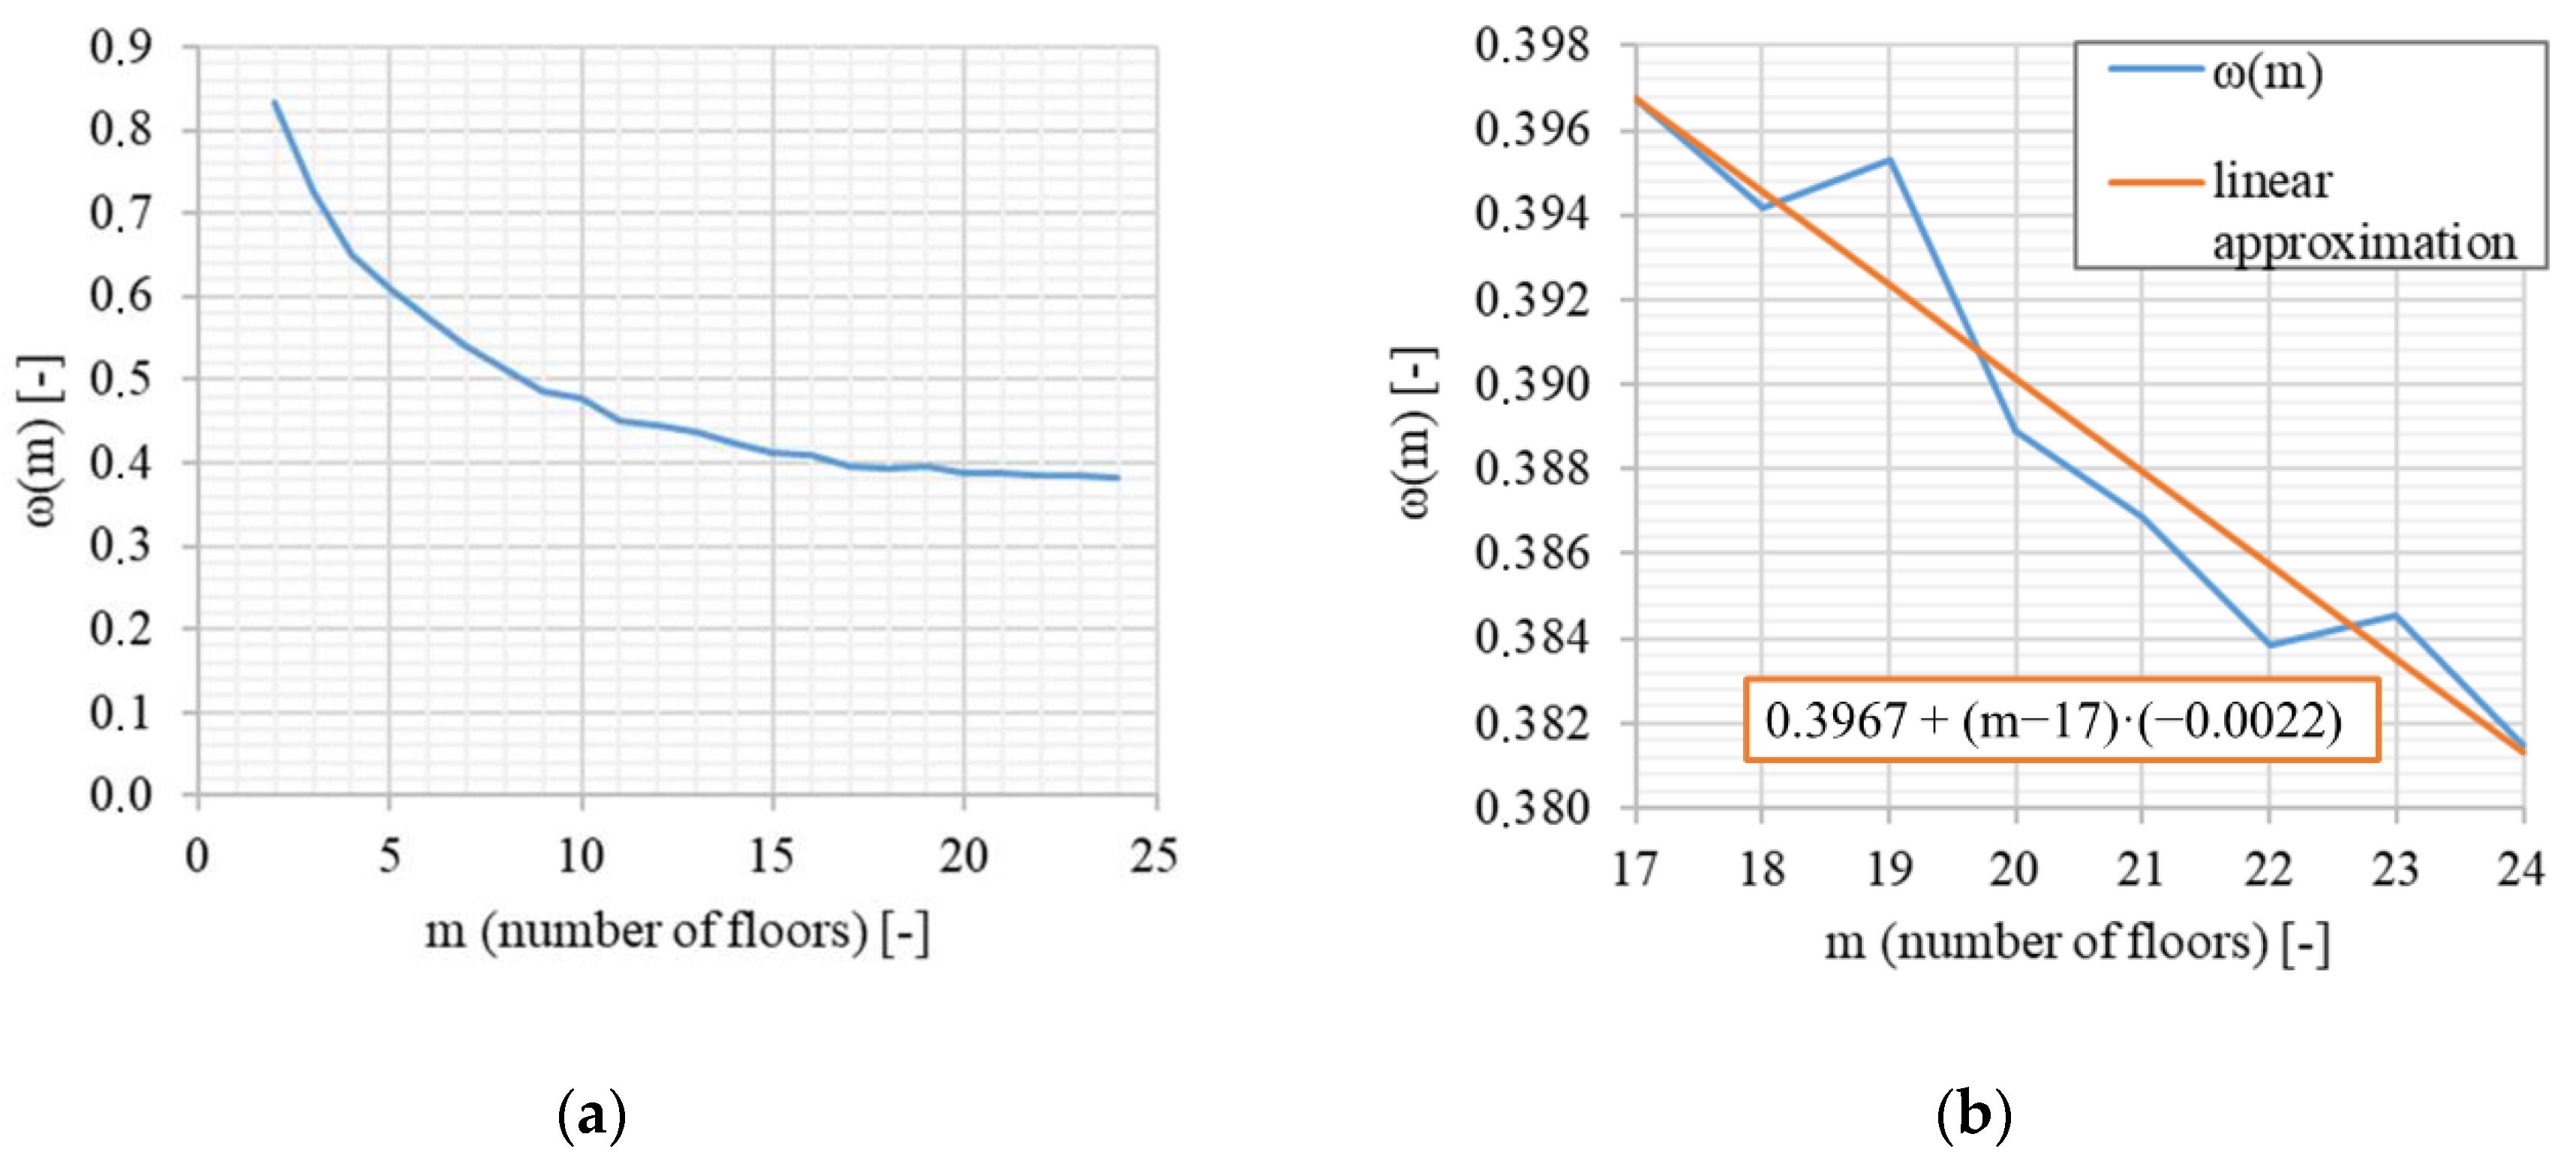
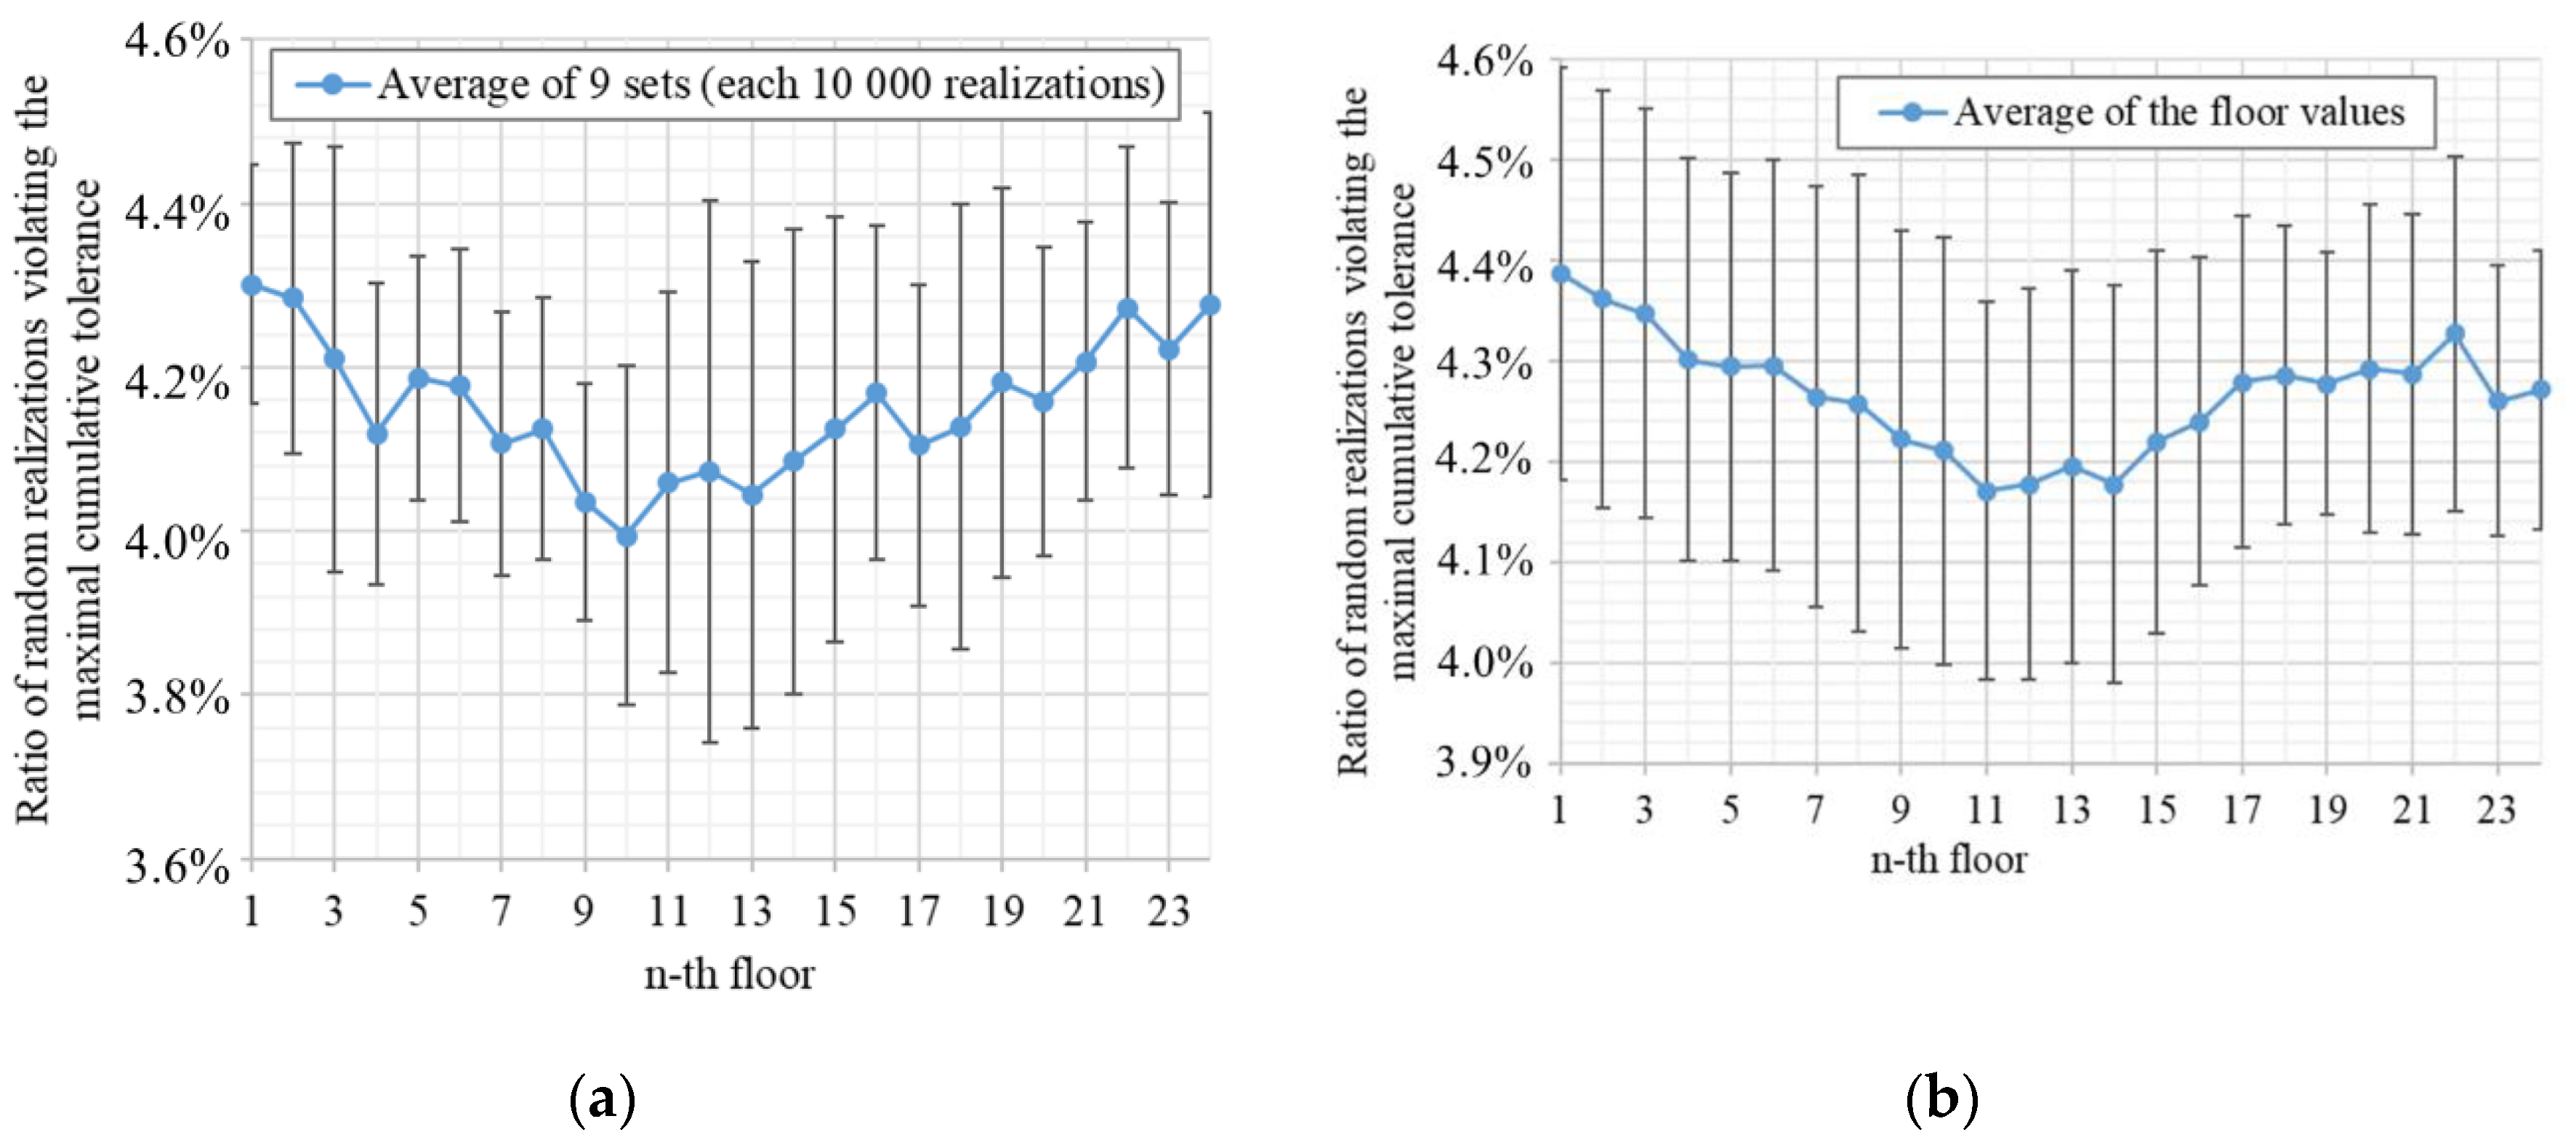
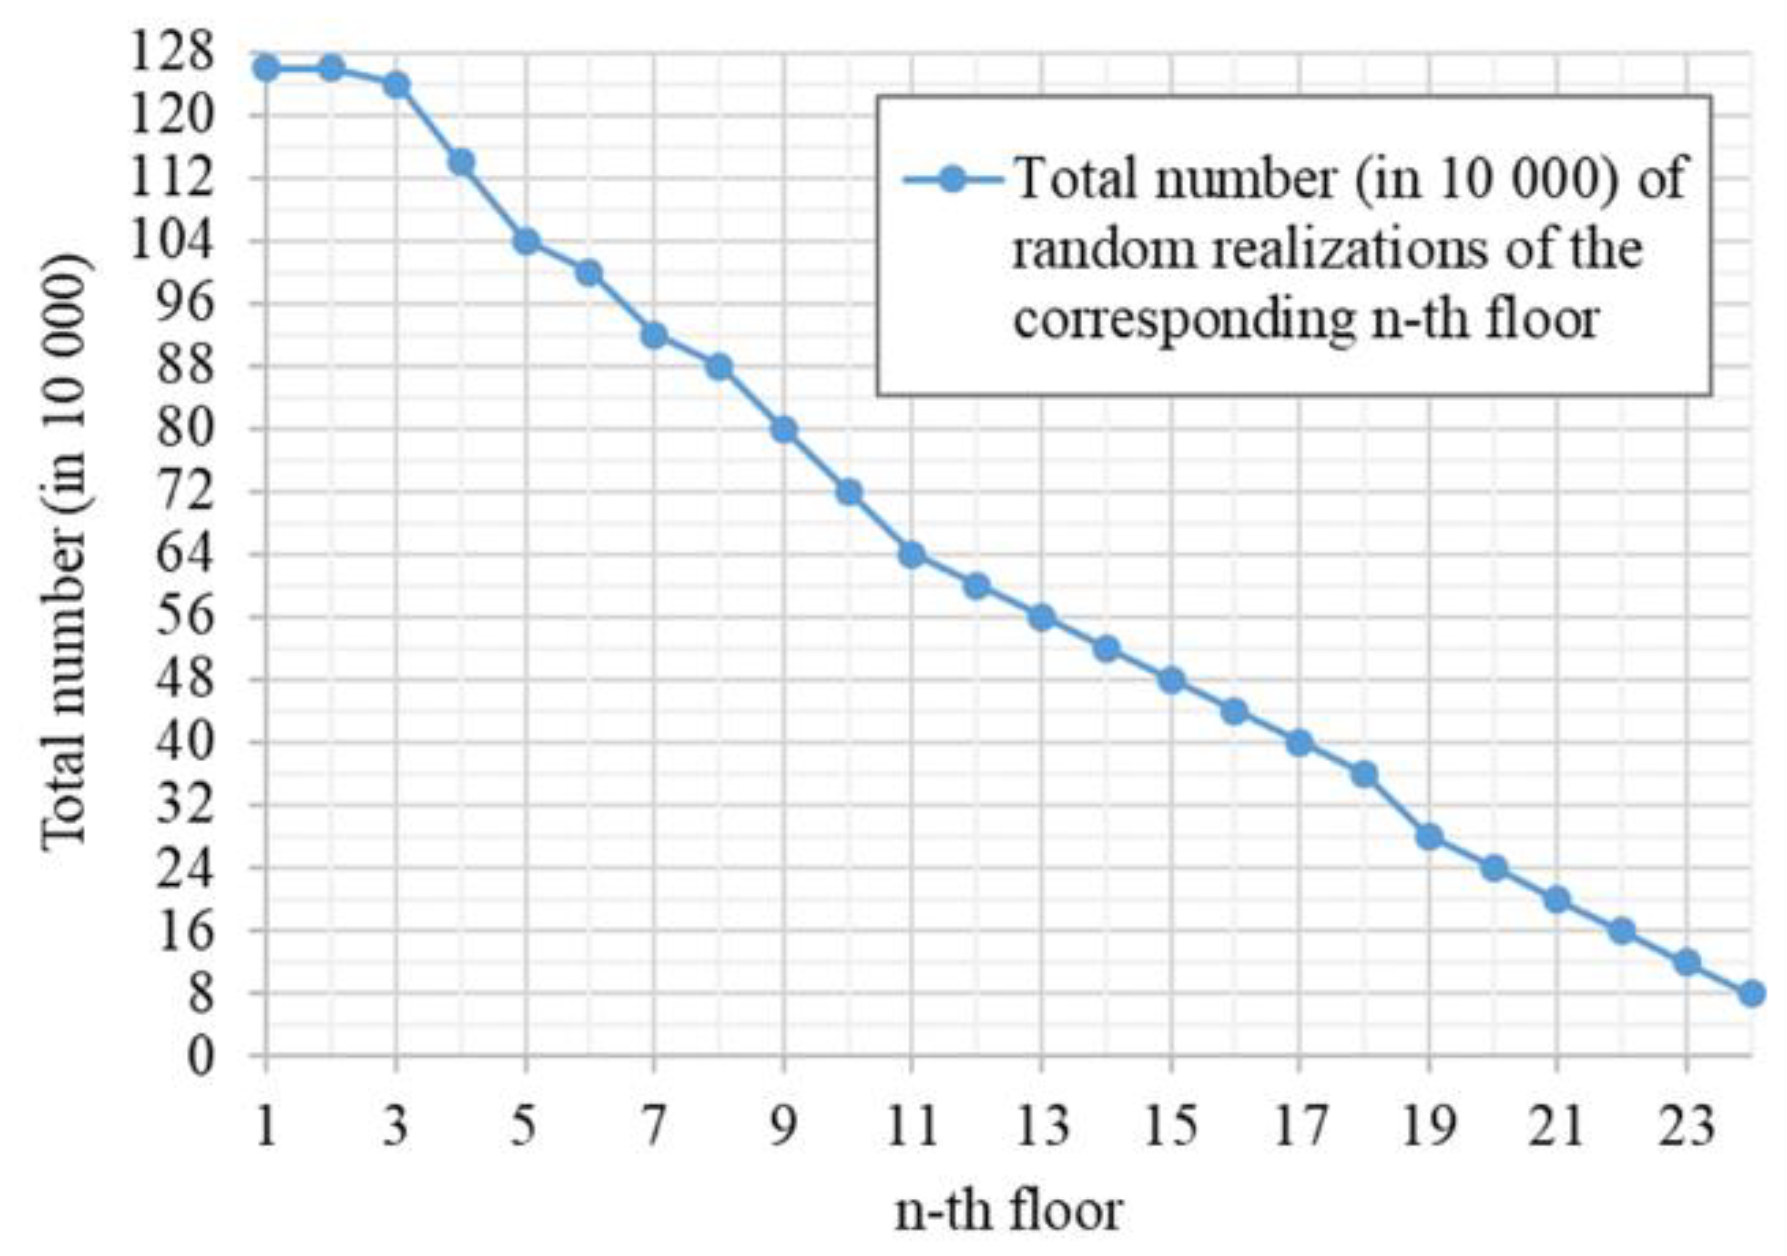
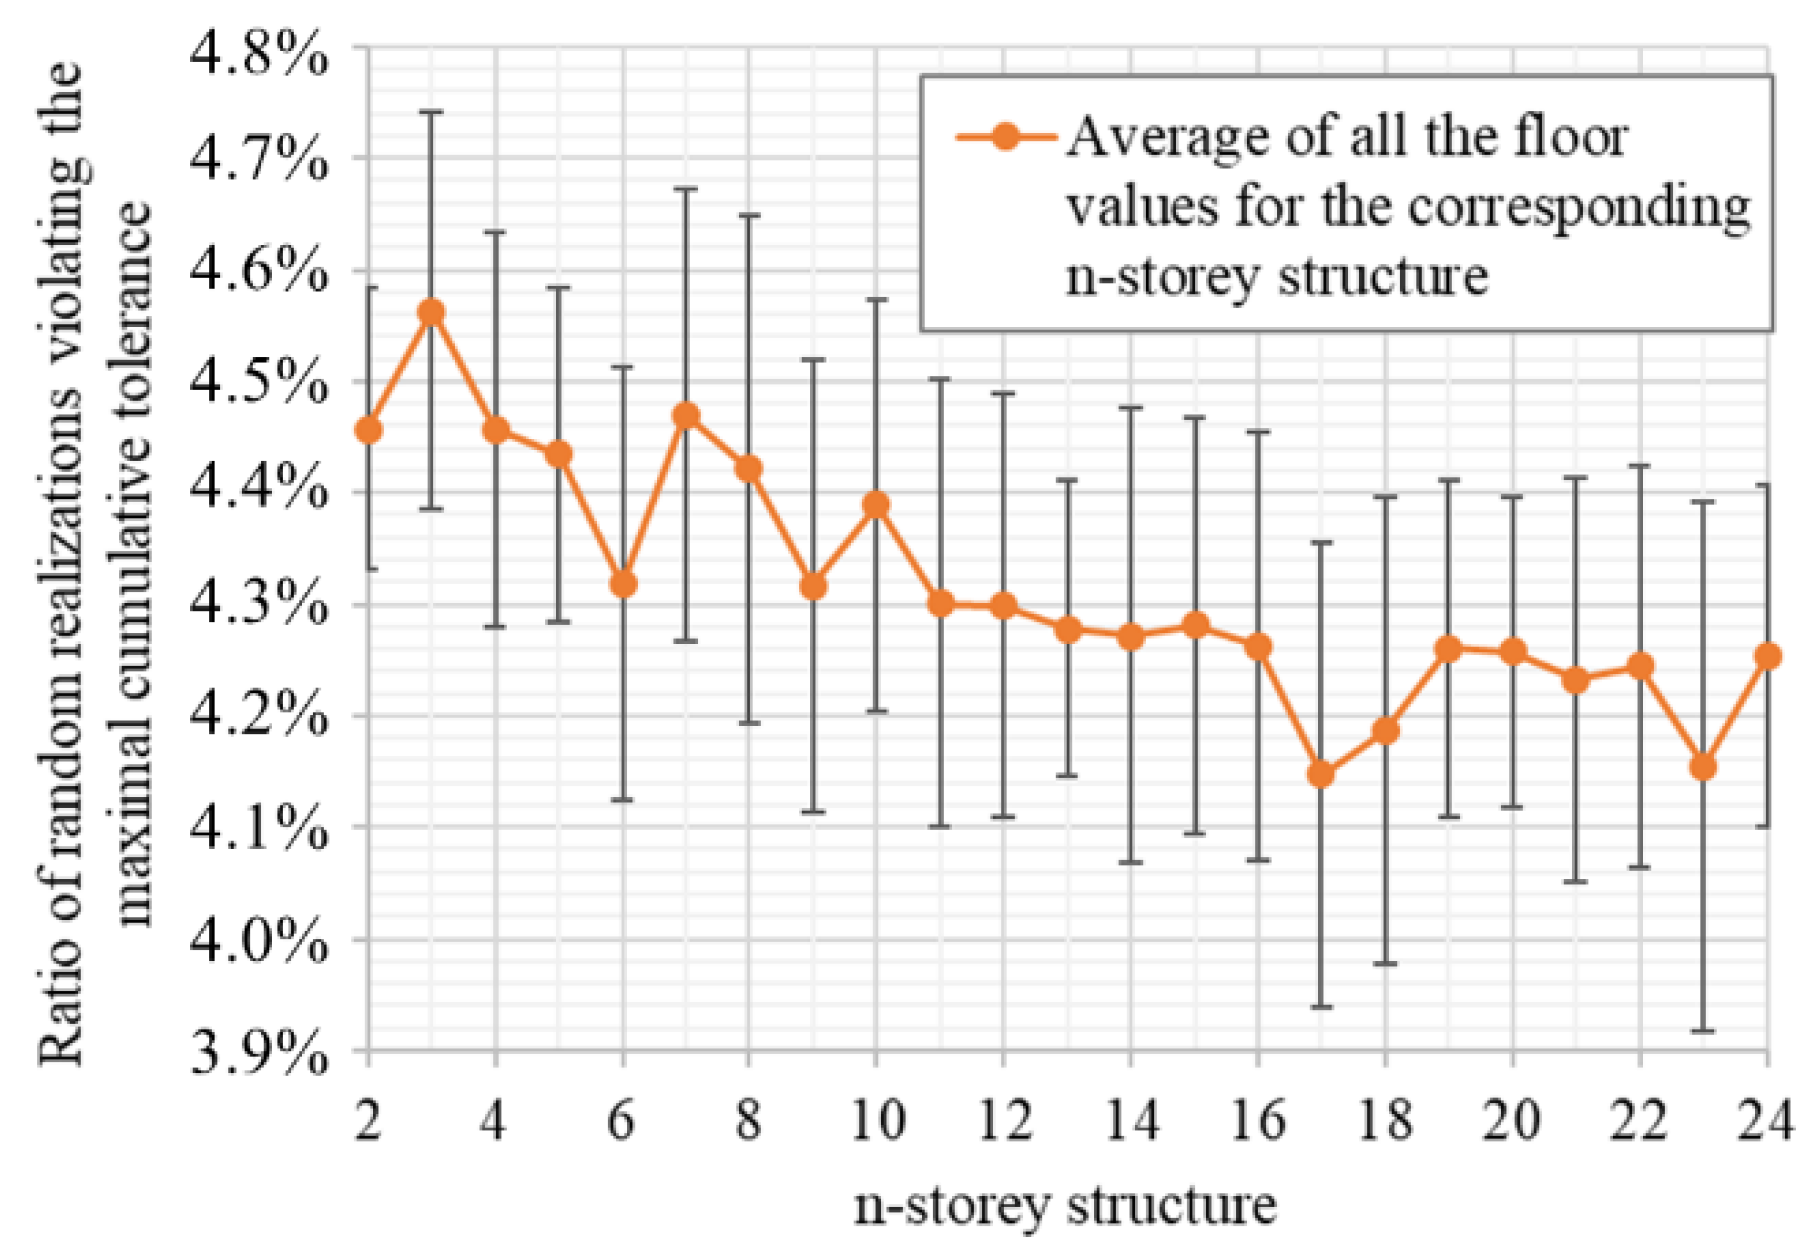
| Assigned permutation | Story-set | |||||||||||||||||||||||
|---|---|---|---|---|---|---|---|---|---|---|---|---|---|---|---|---|---|---|---|---|---|---|---|---|
| A | B | C | D | E | F | G | H | I | J | K | L | M | N | O | P | Q | R | S | T | U | V | W | X | |
| I. | 1 | 2 | 3 | 4 | 5 | 6 | 7 | 8 | 9 | 10 | 11 | 12 | 13 | 14 | 15 | 16 | 17 | 18 | 19 | 20 | 21 | 22 | 23 | 24 |
| II. | 15 | 8 | 13 | 23 | 19 | 24 | 20 | 9 | 12 | 10 | 4 | 18 | 21 | 2 | 1 | 22 | 5 | 7 | 6 | 3 | 14 | 17 | 16 | 11 |
| III. | 6 | 21 | 1 | 11 | 9 | 10 | 24 | 16 | 22 | 3 | 19 | 18 | 4 | 13 | 8 | 14 | 15 | 5 | 17 | 2 | 7 | 20 | 23 | 12 |
| Story number i | Σhj [m] | σΔj [mm] | Story number i | Σhj [m] | σΔj [mm] |
|---|---|---|---|---|---|
| 1 | 4.5 | 7.500 | 13 | 58.5 | 27.042 |
| 2 | 9.0 | 10.607 | 14 | 63.0 | 28.062 |
| 3 | 13.5 | 12.990 | 15 | 67.5 | 29.047 |
| 4 | 18.0 | 15.000 | 16 | 72.0 | 30.000 |
| 5 | 22.5 | 16.771 | 17 | 76.5 | 30.923 |
| 6 | 27.0 | 18.371 | 18 | 81.0 | 31.820 |
| 7 | 31.5 | 19.843 | 19 | 85.5 | 32.692 |
| 8 | 36.0 | 21.213 | 20 | 90.0 | 33.541 |
| 9 | 40.5 | 22.500 | 21 | 94.5 | 34.369 |
| 10 | 45.0 | 23.717 | 22 | 99.0 | 35.178 |
| 11 | 49.5 | 24.875 | 23 | 103.5 | 35.969 |
| 12 | 54.0 | 25.981 | 24 | 108.0 | 36.742 |
| m-story structure | Lcor [m] (for h = 4.5 m) | ω(m) [-] | m-story structure | Lcor [m] (for h = 4.5 m) | ω(m) [-] |
|---|---|---|---|---|---|
| 1 | - | - | 13 | 25.60 | 0.4376 |
| 2 | 7.50 | 0.8333 | 14 | 26.60 | 0.4222 |
| 3 | 9.80 | 0.7259 | 15 | 27.90 | 0.4133 |
| 4 | 11.70 | 0.6500 | 16 | 29.50 | 0.4097 |
| 5 | 13.72 | 0.6098 | 17 | 30.35 | 0.3967 |
| 6 | 15.51 | 0.5744 | 18 | 31.93 | 0.3942 |
| 7 | 17.06 | 0.5416 | 19 | 33.80 | 0.3953 |
| 8 | 18.46 | 0.5128 | 20 | 35.00 | 0.3889 |
| 9 | 19.73 | 0.4872 | 21 | 36.56 | 0.3869 |
| 10 | 21.44 | 0.4764 | 22 | 38.00 | 0.3838 |
| 11 | 22.34 | 0.4513 | 23 | 39.80 | 0.3845 |
| 12 | 24.00 | 0.4444 | 24 | 42.20 | 0.3815 |
Disclaimer/Publisher’s Note: The statements, opinions and data contained in all publications are solely those of the individual author(s) and contributor(s) and not of MDPI and/or the editor(s). MDPI and/or the editor(s) disclaim responsibility for any injury to people or property resulting from any ideas, methods, instructions or products referred to in the content. |
© 2023 by the authors. Licensee MDPI, Basel, Switzerland. This article is an open access article distributed under the terms and conditions of the Creative Commons Attribution (CC BY) license (http://creativecommons.org/licenses/by/4.0/).


