
Submitted:
19 December 2023
Posted:
20 December 2023
Read the latest preprint version here
Preprints on COVID-19 and SARS-CoV-2
Abstract
We studied the weekly number and the growth/decline rates of COVID-19 deaths in the 8 period October 31, 2022 – February 9, 2023, finding that that COVID-19 winter wave reached its 9 peak during the three holyday weeks extending from December 16, 2002 to January 5, 2023, and it 10 was definitely trending downward, returning to the same number of deaths of the end of October 11 2022, in the week February 3 – 9, 2023. During this period of fifteen weeks, that wave caused a 12 number of deaths as large as 8,526. Its average growth rate was +7.89% deaths per week (ten 13 weeks), while the average weekly decline rate was -12.32% (five weeks). Currently, Italy is expe- 14 riencing a new COVID-19 wave, with the latest six weekly bulletins (October 26, 2023 – December 15 14, 2023) showing that the deaths have climbed from 148 to 322. The weekly growth rate has risen 16 by +14.08% deaths, on average. In the hypothesis that this 2023-2024 wave have a duration similar 17 to that of 2022-2023, with: i) a comparable extension of both the growing period and of the decline 18 period and ii) similar growth/decline rates, a prediction can be cast regarding the number of 19 COVID-19 deaths in the period November 2023 - January 2024. They could reach the amount of 20 4100-4200
Keywords:
COVID-19
; Confirmed deaths
; Winter holyday season
; Italy
; Prediction
1. Introduction
During the 2022-2023 autumn-winter period in Italy, we have observed a typical recurring pattern in the curve of the daily confirmed COVID-19 deaths. In fact, the number of daily deaths began to increase after the schools’ opening (end of September 2022) [1]. Then this increasing trend stabilized around a quite high value of 200-300 weekly deaths by the beginning of October 2022. Afterwards, winter came in Italy with a combination of meteorological, social and environmental factors, including: i) more rigid temperatures, ii) several holyday periods, among which All Saints’/Dead festivities (November, 1-2), the Celebration of the Immaculate Conception (December, 8) the Christmas and New Year festivities (December, 24 – January, 6), and iii) people gatherings in closed spaces.
It is well known that within a gathering, to which many people take part, the presence of infected persons is highly likely. This can ignite infections inside the gathering, as the spread of COVID-19 occurs via airborne particles and droplets. In addition, in a gathering, infected individuals have more opportunities to come at close quarters with other people, with an infection rate resulting higher than in other situations. Not only that, but after a gathering event, the participants return to their lives, thus contributing to the spread of the epidemic throughout society [2,3].
As a results of this series of festivities and consequent people gatherings, the curve of daily confirmed COVID-19 deaths started a new climb, somewhere around the end of October, 2022, up to a peak that was registered around the beginning of January 2023, after exactly ten weeks since the climb has begun, and with a weekly number of deaths as large as 800 registered in those three holidays weeks. After that peak, a quite rapid downward trend began which stabilized in circa five weeks, returning almost to the same number of COVID-19 confirmed deaths that were experienced when that wave had started (end of October, 200-300 deaths).
In the end, during this observed period of fifteen weeks, that 2022-2023 COVID-19 wave caused a number of deaths as large as 8,526, with: a) an average number of weekly deaths equal to 568, b) an average growth rate of +7.89% deaths per week (for ten consecutive weeks), and c) an average decline rate of -12.32% (for five consecutive weeks). All those data are officially available at the web site of the Italian Ministry of Health that publishes, on a regular weekly basis, its epidemiological bulletins [4].
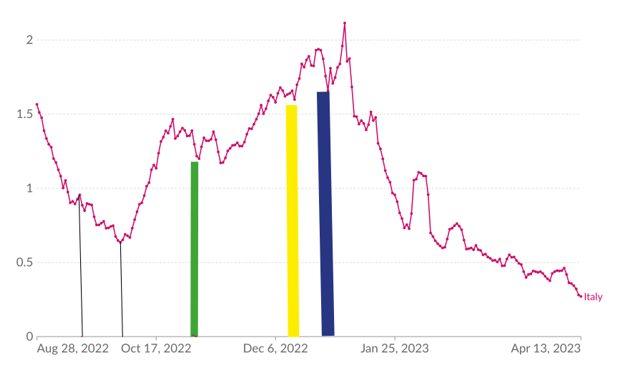
The situation we have summarized has a visual counterpart in Figure 1, where the daily new confirmed COVID-19 deaths (per million people) in Italy is plotted over the period that goes from the end of August 2022 to the mid of April 2023.
In particular, the two leftmost black thin vertical bars in Figure 1 demarcate the period when the schools opened (mid of September – beginning of October, 2022). The green thick bar marks the period when All Saints’/Dead festivities occurred (beginning of November 2022). The yellow thick bar, instead, marks the period corresponding to the Celebration of the Immaculate Conception (December, 8) and finally the blue thick bar delineates the beginning of the period of the Christmas and New Year festivities. The curve also shows, very clearly, all the increasing and decreasing trends we have described before. The curve represented in Figure 1, with all its data, has been drawn from the data source provided by the Our World in Data initiative [5].
The aim of this brief report is to analyze the weekly number and the growth/decline rates of the COVID-19 deaths of the 2022-2023 COVID-19 winter season, along with the periods in time when it peaked and then declined down thus reaching a stable situation. All this effort is done with the intent to project those numeric figures onto the ongoing Italian COVID-19 situation which is experiencing a resurgence in cases and deaths, a sign that the epidemic has not yet told its last word.
In the period from October 26, 2023 to December 14, 2023: in these six consecutive weeks, in fact, the corresponding six Ministry bulletins have confirmed that COVID-19 deaths have climbed from 148 to 322 on a per week basis, with an average weekly growth rate of +14.08% [4].
The final objective of this study is to cast a prediction of the death toll Italy will pay to the current COVID-19 wave, under the hypothesis that it will have a duration similar to that of 2022-2023 (fifteen weeks) with comparable values of: i) the duration of the growing period (ten weeks) and of the decline period (five weeks) and ii) the growth/decline rates.
In simple words, we are trying to use a method based on the concept of the so-called predictive analogy where the fundamental idea is that future events and outcomes can be forecast by comparing them to past experiences and patterns. This approach requires drawing parallels between similar situations to predict an event or a trend [6,7].
We know very well that this approach is subject to many limitations and runs the risk of failure. Nonetheless, we have decided to use neither the traditional COVID-19 spread indicators of the classical SIR/SEIR models, nor alternative but simpler regression models [8], because recent studies have shown that more basic and intuitive metrics can establish a better correlation, than traditional indicators, with both the number of hospitalized patients and deaths during a COVID-19 epidemic [9,10]. Even if epidemiologists may remain skeptical about the use of those basic metrics for carrying out a real time surveillance, we are confident that our approach can still be useful to predict deaths over a rather long period of time, essentially because it is not influenced by the large number of asymptomatic carriers which remain still unknown and have often contributed to the failure of traditional epidemiological methods used to modeling the COVID-19 diffusion.
In conclusion, we have used analogy, in this context, to compare two analogs (the two COVID-19 winter waves occurred in two consecutive years in Italy), and then to cast a prediction on the number of deaths, based on the observed similarities and parallels. This prediction has been anticipated in the Abstract and will be explained in detail in Section of Results.
2. Materials and Methods
In this Section, we provide sufficient details to allow readers to replicate our results. To begin, it is worth revealing the source of data we have used for our study. We have already anticipated that they have been all drawn by just one official source: The Italian Ministry of Health. More specifically, this Institute issues, on a per week basis, a comprehensive bulletin where the number of confirmed COVID-19 deaths are published [4]. Obviously, even if we know that, because of varying protocols and decisions in the attribution of the cause of death, the number of confirmed deaths may slightly vary over time, these bulletins provide the official number of the COVID-19 deaths registered by the Italian health authorities.
As of today (December 15, 2023), this source of data comprises 59 weekly bulletins, starting from the week: October 28 - November 3, 2022 until the latest week: December 6 – December 14, 2023. In all these bulletins, a Table is shown, filled with a weekly update of a variety of COVID-19 indicators. Beyond many others, the number of the weekly confirmed deaths is shown, reported in the third column of the Table (in a red color).
Said about the source of our data, the method of analysis we have used has been the following. Inspired by the information portrayed in Figure 1 above, where the beginning, the end, and the peak of the COVID-19 winter wave of 2022/2023 were reported, we downloaded from the web site of the Italian Ministry all the fifteen bulletins corresponding to the fifteen weeks of interest of the winter season of year. They were the following: 1) October 28 – November 3, 2022; 2) November 4 – November 10, 2022; 3) November 11 – November 17, 2022; 4) November 18 – November 24, 2022; 5) November 24 – December 1, 2022; 6) December 2 – December 8, 2022; 7) December 9 – December 15, 2022; 8) December 16 – December 22, 2022; 9) December 23 – December 29, 2022; 10) December 30, 2022 – January 5, 2023; 11) January 6 – January 12, 2023; 12) January 13 – January 19, 2023; 13) January 20 – January 26, 2023; 14) January 27 – February 2, 2023; 15) February 3 – February 9, 2023.
From those fifteen bulletins, we extracted the fifteen values of the weekly deaths and then we computed the percentage of the change for each consecutive pair of values of the growth/decline rates of the series, comparing the most recent value in the series with the previous one, according to the well-known formula:
Percentage change of the weekly growth/decline factor = (((Number of deaths of the current week/ Number of deaths of the previous week) * 100) – 100) %,
All this has produced an ordered series of fourteen different values of the percentage changes of the growth/decline factor, corresponding to the fifteen weeks under observation. Of the first nine of these values, we computed the average, obtaining the percentage average of the weekly growth rates of the deaths during the ten consecutive weeks when the curve of the year 2022/2023 was in its increasing phase. Similarly, we used the last five values returned by the Formula above, to get the percentage average of the weekly decline rates of the deaths occurred during the five consecutive weeks when the curve of deaths of 2022-2023 had declined down to its initial baseline in the year 2022-2023 (value of the baseline: circa 200-300 weekly deaths).
At that point, we repeated the same procedure above for the latest seven bulletins issued by then Italian Health Ministry, relative to the latest seven weeks of the current year 2023. Specifically, we started by downloading the bulletins of the following weeks: 1) October 26 – November 1, 2023; 2) November 2 – November 8, 2023; 3) November 9 – November 15, 2023; 4) November 16 – November 22, 2023; 5) November 23 – November 29, 2023; 6) November 30 – December 6, 2023; 7) December 7 – December 14, 2023.
From these seven bulletins, we extracted the six actual values of the weekly COVID-19 deaths and then we computed the percentage of the changes of the growth factor, based on the same Formula 1 above. We obtained a series of six values of the weekly percentage changes of the growth rate of the deaths, relative to the seven consecutive weeks of the current 2023/2024 COVID-19 infection (which is still in its climbing phase, as of December 15, 2023). Finally, we computed the percentage average of these six weekly growth rates of deaths.
At this point, to cast our prediction we had two alternatives, both based on the concept of analogy. To summarize, we remind that we can count on: the series of the percentage values of the changes of the growth/decline factors for the year 2022/2023, comprised of fourteen vales, plus: 1) a percentage average of the first nine values of the series above (average weekly growth trend), relative to the first ten consecutive weeks when the curve of the deaths of 2022/2023 was climbing, and 2) a percentage average of the last five value of the series above (average weekly decline trend) relative to the last five weeks when the curve of deaths of 2022-2023 was definitely in its downward phase. Finally, we also have all the fifteen actual values of the number of deaths experienced during the entire period of fifteen weeks mentioned above.
Of year 2023/2024, instead, we have only seven actual values of the number of deaths experienced during the period of seven weeks from the end of October 2023 till our current days. Moreover, we have a series of only six percentage values of the changes of the growth factor (which are relative to the seven consecutive weeks of the current 2023/2024 COVID-19 infection). Obviously, we also have the percentage average of the values of this series (average weekly growth trend) relative to the first six weeks of year 2023/2024.
The problem to solve now is how to predict the eight remaining actual weekly values of the COVID-19 deaths, for the period which goes from now to the beginning of February 2024, thus yielding a full series of fifteen values.
There are two alternatives to achieve this result, based on two different sets of assumptions. We will term the first set of assumptions as Assumption A and the second one as Assumption B.
In fact, under the conditions of Assumption A, we take as valid the hypothesis that: i) the 2023-2024 COVID-19 wave will have a duration similar to that of 2022-2023 (fifteen weeks), ii) a comparable extension of both the growing period (ten weeks) and of the decline period (five weeks) will occur, and iii) in the year 2023/2024, we will re-use the average weekly growth trend of year 2022-2023 to calculate the first three actual values of the COVID-19 deaths and we will re-use the average weekly decline trend of year 2022-2023 to calculate the last five actual values of the COVID-19 deaths series.
Under the hypothesis of Assumption B, instead, conditions i) and ii) still hold unchanged, but with a difference in condition iii) consisting in the idea to use the average growth factor, computed so far with the first seven weeks of year 2023-2024, as a basis for the calculations needed to predict all the remaining eight values of year 2023-2024.
With this change in condition iii), another problem emerge of how predicting the (percentage) average decline trend to be applied to the last five weeks of year 2023/2024, only starting from the (percentage) average weekly growth trend we have computed for ascending phase of the same year 2023-2024.
To solve this problem, one can adopt this strategy, based again on the concept of analogy, which is as follows. We take the (percentage) average weekly growth trend of year 2022/2023 and the (percentage) average weekly decline rate of year 2022-2023, then we calculate the average change between these two values, using Formula 2 below:
Change between the average weekly growth trend and the average weekly decline trend = (((Average weekly decline trend / Average weekly growth trend) * 100) – 100) %,
At that point, we know that on average in the year 2022/2023 the change between the two growth and decline trends has been equal to a given percentage quantity equal to say X%.
The idea is to apply this change factor X also to the average weekly growth trend measured in the year 2023-2024 to get the correspondent value of the average weekly decline trend for year 2023-2024. This can be done as follows. With this X value, we can compute a new value Y% = ((Average weekly growth factor * X) / 100) %. Finally, with Y we can finally obtain the percentage average weekly decline trend for year 2023-2024, by applying the following formula:
Average weekly decline trend = (Average weekly growth trend + Y) %,
Now, we can apply our average weekly growth trend to all the tree missing weeks of the year 2023-2024 and obtain the three predicted values of the COVID-19 deaths for those three weeks.
Then, we can apply our average weekly decline trend to the last five weeks of the period and obtain the five predicted values of the COVID-19 deaths for those five weeks that complete the period of interest for the year 2023-2024. These eight predictions will lead us to the beginning of February 2024.
All the results that can be obtained with the Methods we have discussed are presented in the next Section.
3. Results
We now present the results we have obtained using the data and the methods described in the previous Section.
They are all summarized in Table 1 which will be commented in the following.
The first fact to notice is that in the first column of Table 1 all the fifteen weeks of interest are listed, both for years 2022-2023 and 2023-2024. The second column reports the number of confirmed weekly deaths due to COVID-19, again for years 2022-2023 and 2023-2024. The values we have predicted with our model are shown with the Italic font in the Table. Specifically, on the left of the slash symbol, the predictions are reported which have been made under the conditions of Assumption A, while on the right the predictions can be found achieved under the conditions of Assumption B. In the third column, the changes of the weekly growth/decline factors are shown. Again, we show the predicted values in Italic. Also in this case, the predictions of Assumption A and of Assumption B are respectively shown on the left and on the right of the slash symbol.
Obviously, the most important result of this study is the predicted number of deaths based on the methods described in the previous Section. It amounts, respectively, to: 4,166 and 4,123 COVID-19 deaths (as shown in the last row of Table 1), depending on the use of the conditions of, respectively, Assumption A and Assumption B, used to carry out the relative calculations. A detailed discussion on the relevance of this result follows in the next Section.
4. Discussion
Analogy is often used for comparing two analogs, based on obvious similarities between the elements that comprise the analyzed phenomena. As such, it assumes that the two phenomena of interest follow almost the same behavior, on the basis of which similar outcomes can be predicted. Obviously, the degree of similarity, on which analogy is based, is greatly influenced by the considered attributes. Needless to say, these are exactly both the strengths and the limitations of our approach
In the specific case of our study, in fact, similarities can be found, mainly, in: i) the winter period of investigation, with its meteorological conditions, ii) the behavior of people during the winter holydays, with their typical attitude toward gatherings, iii) the total number of administered vaccinations which is not greatly changed in the two periods of interest (as an example, consider that the number of boosters administered during the period October-December 2023 were as few as 1,500,000 [11], while the total number of fully vaccinated people were almost 48,000,000 in Italy since October 2022 [12]).
Differences, instead, can be found in: a) the number of weekly confirmed COVID-19 cases during the two different periods (as an example, consider that the weekly confirmed cases at the end of October 2023 were almost 170,000, while in the same period of 2024 they were as few as 28,000 [4]), b) the number of COVID-19 patients in intensive care (ICU): here, consider that at the end of October 2023 there were more than 200 people in ICU, while in the same period of 2024 they were as few as 100 [4], and c) the emergence of new sub-variants of the virus.
All this said, from the perspective of the parallel we have drawn with its working hypotheses, we are persuaded that our analogical study can be a considered as a useful source of knowledge, especially if the values we have predicted are thought of as simply indicating a trend or some kind of reference values. This means that we expect that our analysis may err in predicting the precise values, with our predicted values which could be higher or lower than the actual ones, with equal probability. Nonetheless, if we try to find sense to our predictions, we are sure that even thinking and discussing analogies may generate useful (and sometimes crucial) information.
We also think that our findings and their implications should be discussed in a broadest context. For example, the total number of COVID-19 deaths we have predicted for the period November 2023 – January 2024 should be interpreted as an early sign of concern about possible increased hospitalizations and the pressure on healthcare facilities, with health authorities that should urge the public to adhere to health guidelines and to get tested for COVID-19 if symptoms arise.
Finally of interest are two other comparisons. The first one regards our prediction and the actual number of confirmed deaths of the period of interest in the year 2022-2023. There is a sensible difference between the two values: 8,526 vs, 4,100-4,200, thus confirming the downward trend of the epidemic in Italy. Nonetheless, it is useful to remember, as an exemplar case from the paste, that a great concern was expressed by the Italian health authorities, in the winter period of year 1969-1970, when the so-called Asian flu (a subtype of the H3N2 flu virus) caused as many as 5,000 deaths in Italy [13,14].
This is a confirmation that if our predicted number of deaths will actually occur, Italians need to adopt a cautious attitude, using common sense and persevering with good practices and vigilance, while avoiding to give in to an excessive feeling of paranoia.
5. Conclusions
We have drawn a parallel between the two winter periods of years 2022-2023 and 2023-2024, worried by the COVID-19 infection trend that has recently rose up again in Italy. Based on the concept of forecast by analogy, we have tried to predict the possible number of deaths that could happen in Italy in the period end of October 2023 – beginning of February 2024. We found that this number could amount to almost 4,100-4,200, thus representing a confirmation that this infection has not yet had its last word in Italy.
Funding
This research received no external funding.
Institutional Review Board Statement
Not applicable: neither humans nor animals nor personal data are being involved in this study.
Informed Consent Statement
Not applicable as this study did not involve humans.
Data Availability Statement
Data are available in a public, open access repository, maintained by the Italian Health Ministry at: https://www.salute.gov.it/portale/nuovocoronavirus/archivioBollettiniNuovoCoronavirus.jsp.
Conflicts of Interest
The author declares no conflict of interest.
References
- Casini, L.; Roccetti, M. Reopening Italy’s schools in September 2020: a Bayesian estimation of the change in the growth rate of new SARSCoV-2 cases. BMJ Open 2021. [CrossRef] [PubMed]
- Liu, C.; Huang, J.; Chen, S.; Wang, D.; Zhang, L.; Liu, X.; Lian, X. The impact of crowd gatherings on the spread of COVID-19. Environmental Research 2022, 213. [Google Scholar] [CrossRef] [PubMed]
- Cappi, R.; Casini, L.; Tosi, D.; Roccetti, M. Questioning the seasonality of SARS-COV-2: a Fourier spectral analysis. BMJ Open 2021. [CrossRef]
- Italian Ministry of Health. Weekly Bulletins – COVID-19. Available online: https://www.salute.gov.it/portale/nuovocoronavirus/archivioBollettiniNuovoCoronavirus.jsp (accessed on 15 december 2023).
- Mathieu, E.; Ritchie, L.; Rodés Guirao, C.; Appel, D.; Gavrilov, C.; Giattino, C.; Hasell, J.; McDonald, B.; Dattani, S.; Beltekian, D.; Ortiz-Ospina, E.; Roser, M. The impact of crowd gatherings on the spread of COVID-19. Coronavirus Pandemic (COVID-19), 2023. Available from: https://ourworldindata.org/covid-deaths. (accessed on 15 December 2023).
- El Aoun, C.; Eleuch, H.; Ben Ayed, H.; Aïmeur, E.; Kamun, F. Analogy in Making Predictions. Journal of Decision Systems 2007, 16. [Google Scholar] [CrossRef]
- Bar, M. The proactive brain: using analogies and associations to generate predictions. Trends in Cognitive Sciences 2007, 11. [Google Scholar] [CrossRef]
- Cooper, I.; Mandal, A.; Tosi, D.; Antonopoulos, C.G. A SIR model assumption for the spread of COVID-19 in different communities. Chaos Solitons & Fractals 2020, 139. [Google Scholar]
- Gaspari, M. Questioning the seasonality of SARS-COV-2: a Fourier spectral analysis. Epidemiologic Methods 2022, 11. [Google Scholar]
- Roccetti, M. Excess mortality and COVID-19 deaths in Italy: A peak comparison study. Mathematical Biosciences and Engineering 2023, 20. [Google Scholar] [CrossRef]
- Italian Ministry of Health. Vaccinations 2023-2024 – COVID-19. Available online: https://www.governo.it/it/cscovid19/report-vaccini/ (accessed on 15 December 2023).
- Mattiuzzi, C. , Lippi G. Update on the status of COVID-19 vaccination in Italy - 23. Immunological Research 2023, 71. [Google Scholar]
- Italian Historical Video Archive - Istituto Luce. Flu Epidemic in Italy, 1969-1970. Available online: https://www.raiplay.it/video/2020/03/Frontiere---Coronavirus-Asiatica-del-1969-In-Italia-5000-morti-e-13-milioni-a-letto-d93814e9-3b14-4e5c-8b41-e0eaa87f7cd0.html (accessed on 15 December 2023).
- Rizzo, C.; Bella, A.; Viboud, C.; Simonsen, L.; Miller, M.A.; Rota, M.C.; Salmaso, S.; Ciofi degli Atti, M.L. Trends for Influenza-related Deaths during Pandemic and Epidemic Seasons, Italy, 1969–2001. Emerging Infectious Diseases 2007, 13. [Google Scholar] [CrossRef] [PubMed]
Figure 1.
Daily new confirmed COVID-19 deaths per million people in Italy: on the y-axis the 7-day rolling average of weekly deaths relative to Italian population, in the period (x-axis): end of August 2022 – mid of April, 2023. Sources: Our World in Data (2023).
Figure 1.
Daily new confirmed COVID-19 deaths per million people in Italy: on the y-axis the 7-day rolling average of weekly deaths relative to Italian population, in the period (x-axis): end of August 2022 – mid of April, 2023. Sources: Our World in Data (2023).
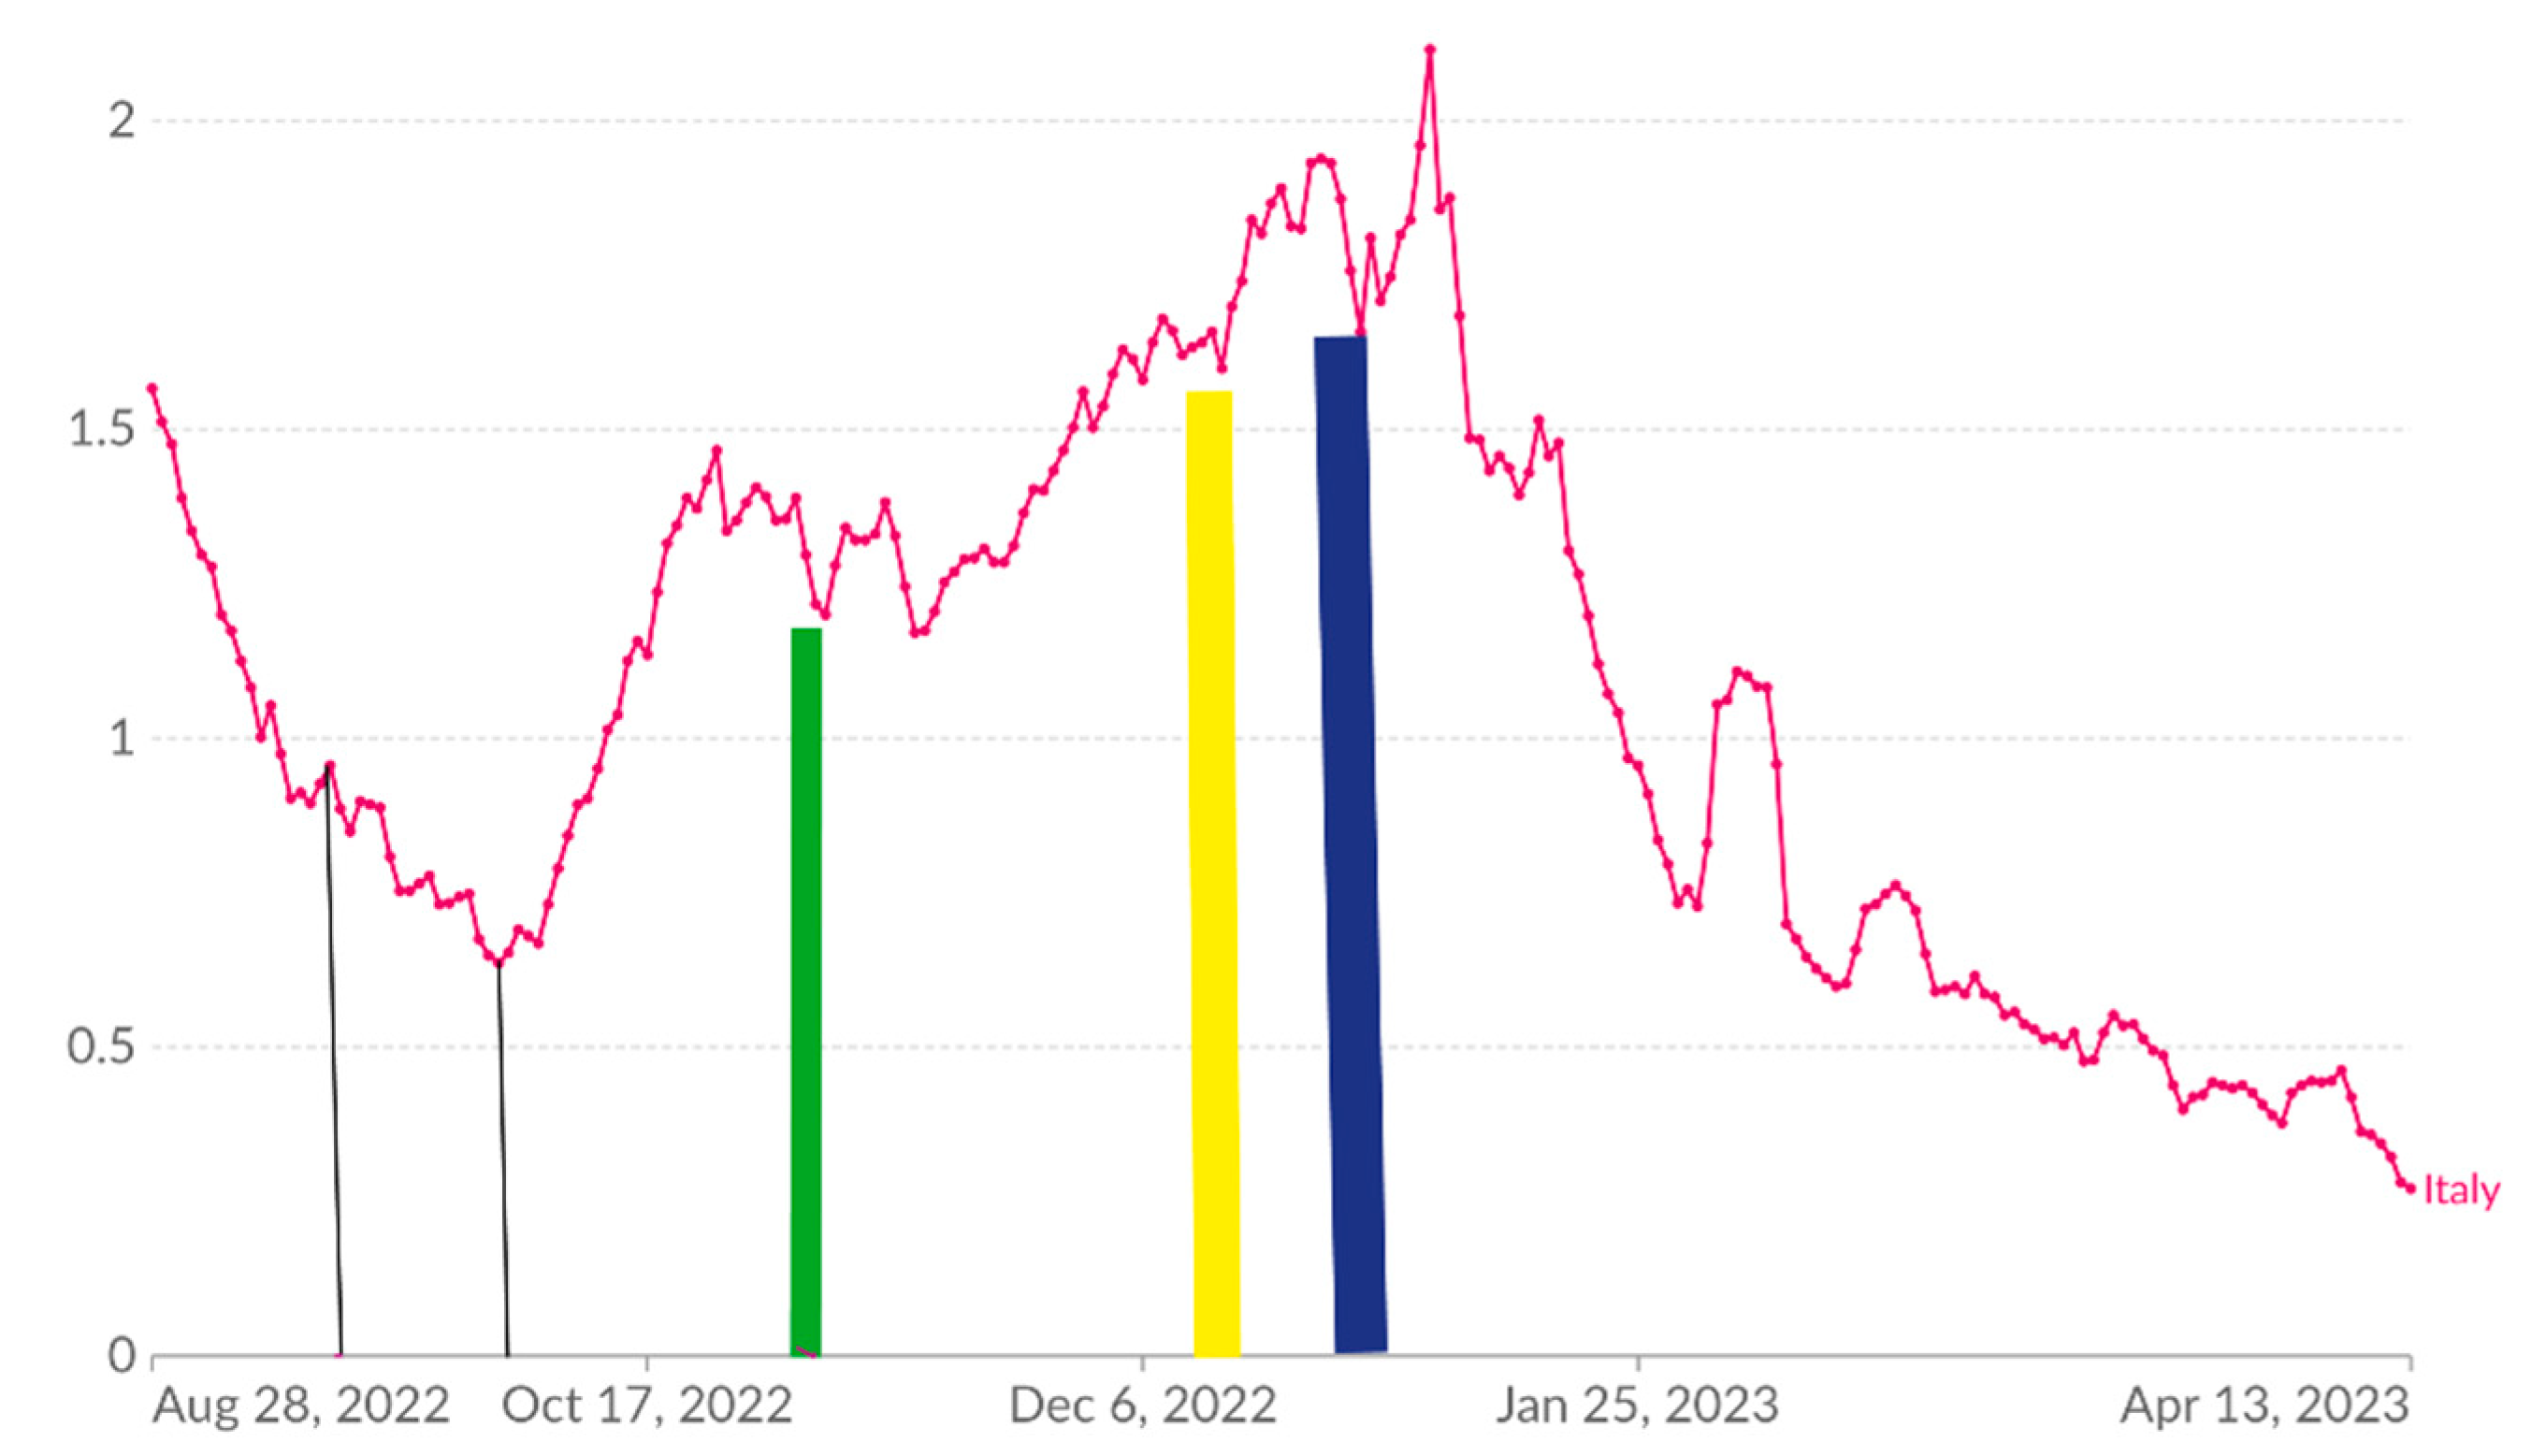

Table 1.
Number of COVID-19 confirmed weekly deaths and changes of the growth/decline trends. In Italic, the predicted values. Predicted values based on Assumption A are on the left of the slash (/). Predicted values based on assumption B are on the right of the slash symbol.
Table 1.
Number of COVID-19 confirmed weekly deaths and changes of the growth/decline trends. In Italic, the predicted values. Predicted values based on Assumption A are on the left of the slash (/). Predicted values based on assumption B are on the right of the slash symbol.
| # Weeks First line: 2022-2023 Second line: 2023-2024 |
Number of weekly deaths First line: 2022-2023 Second line: 2023-2024 |
Changes First line: 2022-2023 Second line: 2023-2024 |
|---|---|---|
| 1-October 28 – November 3, 2022 1-October 26 – November 1, 2023 |
411 148 |
null |
| 2-November 4 – November 10, 2022 2-November 2 – November 8, 2023 |
549 163 |
+33.58% +10.13% |
| 3-November 11 – November 17, 2022 3-November 9 – November 15, 2023 |
533 192 |
-2.91% +17.79% |
| 4-November 18 – November 24, 2022 4-November 16 – November 22, 2023 |
580 235 |
+8.81% +22.39% |
| 5-November 24 – December 1, 2022 5-November 23 – November 29, 2023 |
635 291 |
+9.48% +23.83% |
| 6-December 2 – December 8, 2022 6-November 30 – December 6,2023 |
686 307 |
+8.03% +5.5% |
| 7-December 9 – December 15, 2022 7-December 7 – December 14, 2023 |
719 322 |
+4.81% +4.88% |
| 8-December 16 – December 22, 2022 8-December 15 – December 21, 2023 |
798 347/367 |
+10.99% +7.89/14.08% |
| 9-December 23 – December 29, 2022 9-December 22 – December 28, 2023 |
706 374/419 |
-11.53% -7.89/14.08% |
| 10-December 30, 2022 – January 5, 2023 10-December 29, 2023 – January 4, 2024 |
775 404/478 |
+9.77% +7.89/14.08% |
| 11-January 6 – January 12, 2023 11-January 5 – January 11, 2024 |
576 354/372 |
-25.68% -12.32/-22.1% |
| 12-January 13 – January 19, 2023 12-January 12 – January 18, 2024 |
495 310/290 |
-14.06% -12.32/-22.1% |
| 13-January 20 – January 26, 2023 13-January 19 – January 25, 2024 |
345 272/226 |
-12.66% -12.32/-22.1% |
| 14-January 27 – February 2, 2023 11-January 26 – February 1, 2024 |
439 238/176 |
+27.25% -12.32/-22.1% |
| 15-February 3 – February 9, 2023 11-February 2 – January 8, 2024 |
279 209/137 |
-36.45% -12.32/-22.1% |
| End of period of investigation 2022/23: Cumulative number of deaths 2023/24: Predicted number of deaths |
8,526 4,166/4,123 |
- |
Disclaimer/Publisher’s Note: The statements, opinions and data contained in all publications are solely those of the individual author(s) and contributor(s) and not of MDPI and/or the editor(s). MDPI and/or the editor(s) disclaim responsibility for any injury to people or property resulting from any ideas, methods, instructions or products referred to in the content. |
© 2023 by the authors. Licensee MDPI, Basel, Switzerland. This article is an open access article distributed under the terms and conditions of the Creative Commons Attribution (CC BY) license (http://creativecommons.org/licenses/by/4.0/).
Copyright: This open access article is published under a Creative Commons CC BY 4.0 license, which permit the free download, distribution, and reuse, provided that the author and preprint are cited in any reuse.


