Submitted:
18 December 2023
Posted:
19 December 2023
You are already at the latest version
Abstract
Hepatocellular carcinoma (HCC) is characterized by uncontrolled cellular proliferation driven by aberrant signal transduction. Cells respond to potential carcinogenic signals by inducing cellular senescence (CS) as a defense mechanism. However, assessing CS levels in various tumors is challenging due to heterogeneity and the lack of universal CS markers. This study integrates single-cell RNA sequencing (scRNA-seq) and bulk RNA-seq data from HCC samples to analyze gene expression profiles. HCC-specific senescence-related pathways are identified, and genes from these pathways distinguish molecular subtypes associated with senescence in HCC. These subtypes exhibit significant variations in biological and clinical attributes. A specific CS risk model is developed, revealing associations between CS scores and prognosis, clinical staging, immune infiltration, immunotherapy response, and drug sensitivity. The key gene G6PD is identified as a potential senescence-related target in liver cancer. Molecular experiments confirm the effective suppression of HepG2 cell proliferation, invasion, and migration upon G6PD knockdown. In summary, this analysis enhances our understanding of HCC-specific senescence molecular features and introduces a novel senescence-related biomarker, offering promising implications for future research.
Keywords:
cell senescence
; hepatocellular carcinoma
; G6PD
; molecular subtypes
; immunotherapy
Introduction
Liver carcinoma represents a major global health challenge, of which hepatocellular carcinoma (HCC) is the predominant form. HCC is the fourth leading cause of cancer-associated mortality worldwide [1]. Sorafenib, a multi-targeted tyrosine kinase inhibitor, is pivotal in HCC management [2]. Additionally, the combined administration of atezolizumab and bevacizumab has emerged as an innovative therapeutic strategy to support the patient’s immune system and limit tumor angiogenesis and growth [3]. These therapeutic avenues underscore the importance of multi-targeted approaches in treating patients with HCC.
Despite promising results in clinical trials, the above treatments are efficacious for only a subset of patients. Thus, the situation underscores the importance of identifying the HCC molecular signatures to enable the tailoring of the most appropriate therapeutic regimens. Recent research introduced a novel cancer treatment modality that combines pro-senescence drugs with senolytics [4], which shed light on the therapeutic promise of the cellular senescence (CS) phenotype in tumor management. While identifying senescent traits across various diseases can guide clinical interventions, describing senescence features in various tumors is still being explored and investigated.
CS represents a stress response aimed at eliminating superfluous, damaged, or aberrant cells. This phenomenon involves the persistent cessation of cell proliferation accompanied by pro-inflammatory mediator secretion, which is commonly known as the senescence-associated secretory phenotype (SASP) [5]. Initial studies described the tumor-suppressive properties of CS predicated on its capacity to inhibit tumorigenic proliferation [6]. However, emerging evidence underscored the paradoxical role of senescence in promoting cancer progression through SASP-mediated intercellular interactions [7]. Specifically, the tumorigenic promotion of specific SASP components has been highlighted. For example, IL-6 and IL-8 are prevalent within the SASP [8] and are cancer cell proliferation drivers. CCL5 amplifies tumorigenic proliferation by modulating c-MYC and cyclin D1 [9]. Furthermore, CXCL5 and VEGF augmented vascular density in heterograft tumor models[10].
Beyond angiogenesis, the SASP milieu fosters cell motility and invasion, intensifying cancer cell invasive capacity and facilitating metastatic dissemination [11,12]. Concurrently, clinical trials investigating senolytics (a therapeutic cocktail comprising dasatinib and quercetin designed for selective senescent cell extermination) demonstrated potential for alleviating age-associated pathologies and extending the lifespan in experimental animals [13]. However, concerns regarding the specificity and deleterious adverse effects of senescent cell clearance via senolytics moderate their therapeutic promise [14]. Thus, the clinical benefits of senescence-based interventions currently remain elusive. Delineating senescence signatures in HCC could provide pivotal insights for therapeutic strategizing.
In this study, a preliminary analysis was conducted using both bulk RNA sequencing (RNA-seq) and single-cell RNA (scRNA) datasets to improve understanding of HCC senescence signatures. The approach successfully pinpointed the HCC-specific senescence pathways. Specific genes from these pathways were used to construct two predictive models using machine learning algorithms. These models were designed to robustly evaluate the associations between varying degrees of senescence signatures and the clinical and molecular biological traits of patients with HCC.
Collectively, this study revealed the pivotal senescence markers in HCC and established insights to construct reliable prediction frameworks. Serendipitously, this study also discovered a novel HCC senescence marker. Overall, the findings potentially contribute to personalized therapeutic strategies and prognostic assessments. The results provide valuable insights into the underlying mechanisms of HCC development and can guide future clinical research and drug development.
Results
Quality Control and Annotation of Single-cell Data
Figure S1 presents the basic information of all individual single-cell samples and the specific details before and after quality control. In total, the screening yielded 33,117 cells. Subsequently, these cells underwent t-SNE dimensionality reduction analysis via the RunTSNE function. The 13 cell subclusters were annotated using classic immune cell markers (Figure S2). Specifically, subclusters 2, 7, and 10 were identified as T cells (expressing CD2, CD3D, CD3E, and. CD3G), subclusters 1 and 4 represented macrophages (expressing CD163 and CD68), subcluster 11 comprised B cells (expressing CD19, CD79A, and MS4A1), subcluster 9 consisted of plasma cells (expressing CD79A and JSRP1), subcluster 12 included mast cells (expressing TPSAB1 and CPA3), subcluster 5 was identified as fibroblasts (expressing ACTA2, PDGFRB, and NOTCH3), subcluster 8 represented endothelial cells (expressing PECAM1), while subclusters 0, 3, and 6 corresponded to HCC (expressing GPC3, CD24, and MDK).
The distribution of 10 samples was illustrated in a t-SNE plot (Figure 1A). Figure 1B showcases the t-SNE plot after clustering, representing the different subclusters. Figure 1C illustrates the distribution of annotated cells in the t-SNE plot. Marker genes for the eight subclusters were identified using the FindAllMarkers function, where genes with an adjusted p-value < 0.05 were selected. The top five most significant marker genes were determined for each subcluster (Figure 1D). Additionally, the proportions of these eight subclusters across all samples were analyzed (Figure 1E). Subsequently, the CNV changes in the single-cell data were predicted using CopyKAT, which enabled the discrimination between tumor cells and normal cells within each sample. Among the cells analyzed, 9,505 were identified as cancer cells, while 20,985 were classified as normal cells. Figure 1F depicts the CopyKAT-generated t-SNE plot, specifically highlighting the predicted malignant cells and normal cells.
Analysis of Aberrant Senescence-associated Pathways in HCC using Bulk RNA-seq and scRNA Data
Data on the senescence-associated pathways were obtained from the GSEA repository. Subsequently, the respective enrichment scores for these pathways across both malignant and non-malignant cellular contexts were computed using ssGSEA. The scores were standardized by applying z-score normalization based on the enrichment scores for each pathway. There were significant differences in the senescence-related pathway scores between malignant and non-malignant cells (Figure 2A). Following this, the gene expression patterns in tumor and normal tissue samples were analyzed using bulk RNA-seq data from TCGA-LIHC. Initial use of the GSEA software revealed significant enrichments of three pathways exclusively in TCGA dataset tumor tissues: REACTOME_CELLULAR_SENESCENCE, REACTOME_DNA_DAMAGE_TELOMERE_STRESS_INDUCED_SENESCENCE, and KEGG_P53_SIGNALING_PATHWAY (Figure 2B).
Subsequently, the scores of these TCGA-LIHC senescence-related pathways were compared using ssGSEA to evaluate the disparities between the cancerous and adjacent non-cancerous tissues. Importantly, the heat map analysis demonstrated higher enrichment scores for the REACTOME_DNA_DAMAGE_TELOMERE_STRESS_INDUCED_SENESCENCE, REACTOME_CELLULAR_SENESCENCE, and KEGG_P53_SIGNALING_PATHWAY pathways in tumor tissues as compared to the adjacent non-cancerous tissues (Figure 2C). The enriched scores presented compelling evidence for the abnormal activation of the P53 signaling, DNA damage-induced telomere stress-induced senescence, and CS in HCC pathways.
Clinical Characteristics and Outcomes of Molecular Subtypes
A subsequent exploration of the TCGA-LIHC cohort assessed variations in clinical features among these subtypes. The analysis revealed pronounced disparities in histological grading and clinical outcomes across distinct senescence subtypes (Figure 4). Furthermore, we conducted a comparative analysis of various clinical characteristics among the three molecular subtypes of HCC patients from both the GSE14520 and HCCDB18 datasets. The results of this analysis are presented in Supplementary Table 1 and Supplementary Table 2.
Biological Disparities Among Senescence Subtypes in HCC
CS is pivotal in tumor progression through diverse pathways and was investigated by examining the biological disparities among various previously identified senescence subtypes. Prior research posited that cancer cells induce CS by impeding the cell cycle. The scores for the cell cycle process in each sample were computed using 31 cell cycle-associated genes, and then the scores were compared among the senescence subtypes. Intriguingly, the Cluster3 subtype, associated with the poorest prognosis, manifested an elevated score in the cell cycle process (Figure 5A). Furthermore, the G1/S phase and G2 checkpoint score assessment revealed that the cluster3 subtype registered high scores for both (Figs. 5B, 5C).
Tumor cells tend to activate telomerase activity to mitigate telomere attrition. Consistent with this, the telomere elongation analysis indicated that the cluster3 subtype demonstrated higher scores (Figure 5D). Furthermore, senescent cells might influence tumor migration and metastasis by releasing cytokines that stimulate epithelial–mesenchymal transition (EMT). Contrary to expectations, the cluster3 subtype exhibited a diminished EMT score, suggesting reduced activity (Figure 5E).
The exploration of hypoxia and the angiogenesis scores determined that the cluster1 subtype had elevated scores for both (Figs. 5F-G). The immune and stromal scores revealed that the cluster3 subtype had the least immune activity (Figure 5H). Examining the scores for 22 immune cell types highlighted significant variances across the senescence-related subtypes. Specifically, Clusters 2 and 3 are predominantly associated with enhanced infiltration of tumor-suppressive T cells and B cells, demonstrating significant correlations. In contrast, Cluster 1 is associated with tumor-promoting M2 macrophages, also showing significant relevance. However, there is no apparent correlation between natural killer (NK) cells, dendritic cells (DCs), and eosinophils with the senescence-related cluster. (Figure 5I). Furthermore, the evaluation of 10 tumor-related pathways revealed disparities among the subtypes (Figure 5J). Lastly, the inflammatory score assessments revealed that Cluster 3 had significantly lower scores than Cluster 1 and Cluster 2 (Figure 5K). Collectively, the results highlighted the pronounced differences in multiple biological attributes such as cell cycle, telomere elongation, EMT, hypoxia, angiogenesis, immune response, and inflammation across different senescence subtypes. This evidence emphasized the viability of differentiating senescence subtypes in HCC based on molecular markers.
Differential Mutation Features Among Senescence Subtypes in HCC
The CNV results from TCGA-LIHC were integrated using GISTIC2. During the integration, a confidence level of 0.9 was selected, and the analysis was conducted using hg38 as the reference genome. The analysis results demonstrated notable variances in the CNV among the subtypes (Figs. 6A–C). Additionally, the downloaded single-nucleotide variant (SNV) data from TCGA were analyzed using the maftools package, and the top 15 genes with the highest mutation rates were visualized (Figure 6D).
Application and Validation of Senescence-derived Signature in HCC
The expression profiles of seven predetermined genes were evaluated across various samples using TCGA-LIHC dataset as the training cohort. Subsequently, a corresponding RiskScore was calculated for each sample. These RiskScores underwent ROC analyses via the R timeROC package to evaluate their prognosis classification. The prognostic prediction efficiency was distinctly evaluated for year-long intervals of up to five years. Remarkably, the derived model exhibited substantial efficacy, as indicated by a notable AUC in the ROC analysis. Subsequently, the RiskScores were normalized and converted into z-scores. Samples presenting z-scores > 0 were categorized as high-risk, whereas those with z-scores < 0 were designated as low-risk. The Kaplan-Meier (KM) survival curves revealed a statistically significant disparity in the prognostic outcomes between the high- and low-risk groups (Figure 8A).
The methodology was validated via application to two independent datasets: HCCDB18 and GSE76427. The findings corroborated the findings that the seven-gene risk model demonstrated remarkable consistency and robustness across varying cohorts. Notably, a significant divergence in prognostic outcomes was evident between the high- and low-risk classifications in both the HCCDB18 and GSE76427 datasets (Figs. 8B-C).
Association between Senescence-derived RiskScore and HCC Clinical and Biological Features
The RiskScore was comprehensively analyzed across diverse clinical phenotypes in TCGA-LIHC dataset to delineate the association between the RiskScore and HCC clinical attributes. The data suggested a direct correlation between higher clinical grade and a concomitant rise in RiskScore (Figs. 9A–F). Previous investigations highlighted connections between senescence-associated subtypes and various cellular processes, namely cell cycling, telomerase functionality, hypoxic response, angiogenesis, and immune response. The interrelation between these feature scores and the senescence-associated RiskScore was identified using the Hmisc package. The investigation revealed a marked positive correlation between the CS score and the CCP score (Figure 9G). Simultaneously, a pronounced positive linkage between the CS and telomerase elongation scores was recorded, juxtaposed with a negative association with angiogenic activity (Figs. 9H–J). Additionally, there was a significant association between immune cell infiltration levels and the senescence score (Figure 9K).
Role of Senescence-derived RiskScore in Immunotherapy and Chemotherapy
In this exploration of the association between RiskScore and immunotherapy efficacy, the capacity of RiskScore to prognosticate patient outcomes following immune checkpoint blockade (ICB) therapy was examined, with emphasis on the anti-PD-L1 cohort (IMvigor210). This cohort comprised 348 people who exhibited a spectrum of responses to PD-L1 receptor blockade that spanned partial response (PR), complete response (CR), progressive disease (PD), and stable disease (SD). Notably, individuals in the SD/PD response group had elevated RiskScore levels compared to their counterparts exhibiting other types of responses (Figure 10A).
The percentage analysis between the low and high RiskScore groups revealed significantly better treatment response in the low RiskScore group (Figure 10B). The findings indicated that patients with higher RiskScores had poorer outcomes following treatment (p < 0.05) (Figure 10C). The survival differences among all samples in the IMvigor210 cohort and within different stages were explored. The results demonstrated significant survival disparities in Stage I+II samples (Figure 10D). Contrastingly, no significant survival differences were observed between the high and low RiskScore groups in Stage III+IV samples (Figure 10E). Particularly noteworthy is the exceptional predictive performance of the RiskScore in early-stage clinical samples. Additionally, the response level to traditional chemotherapy drugs, such as cisplatin, was analyzed in the high- and low-risk groups. The results revealed that the high RiskScore group had higher sensitivity to these drugs (Figure 10F).
Clinical Implications of the Senescence-derived RiskScore in HCC
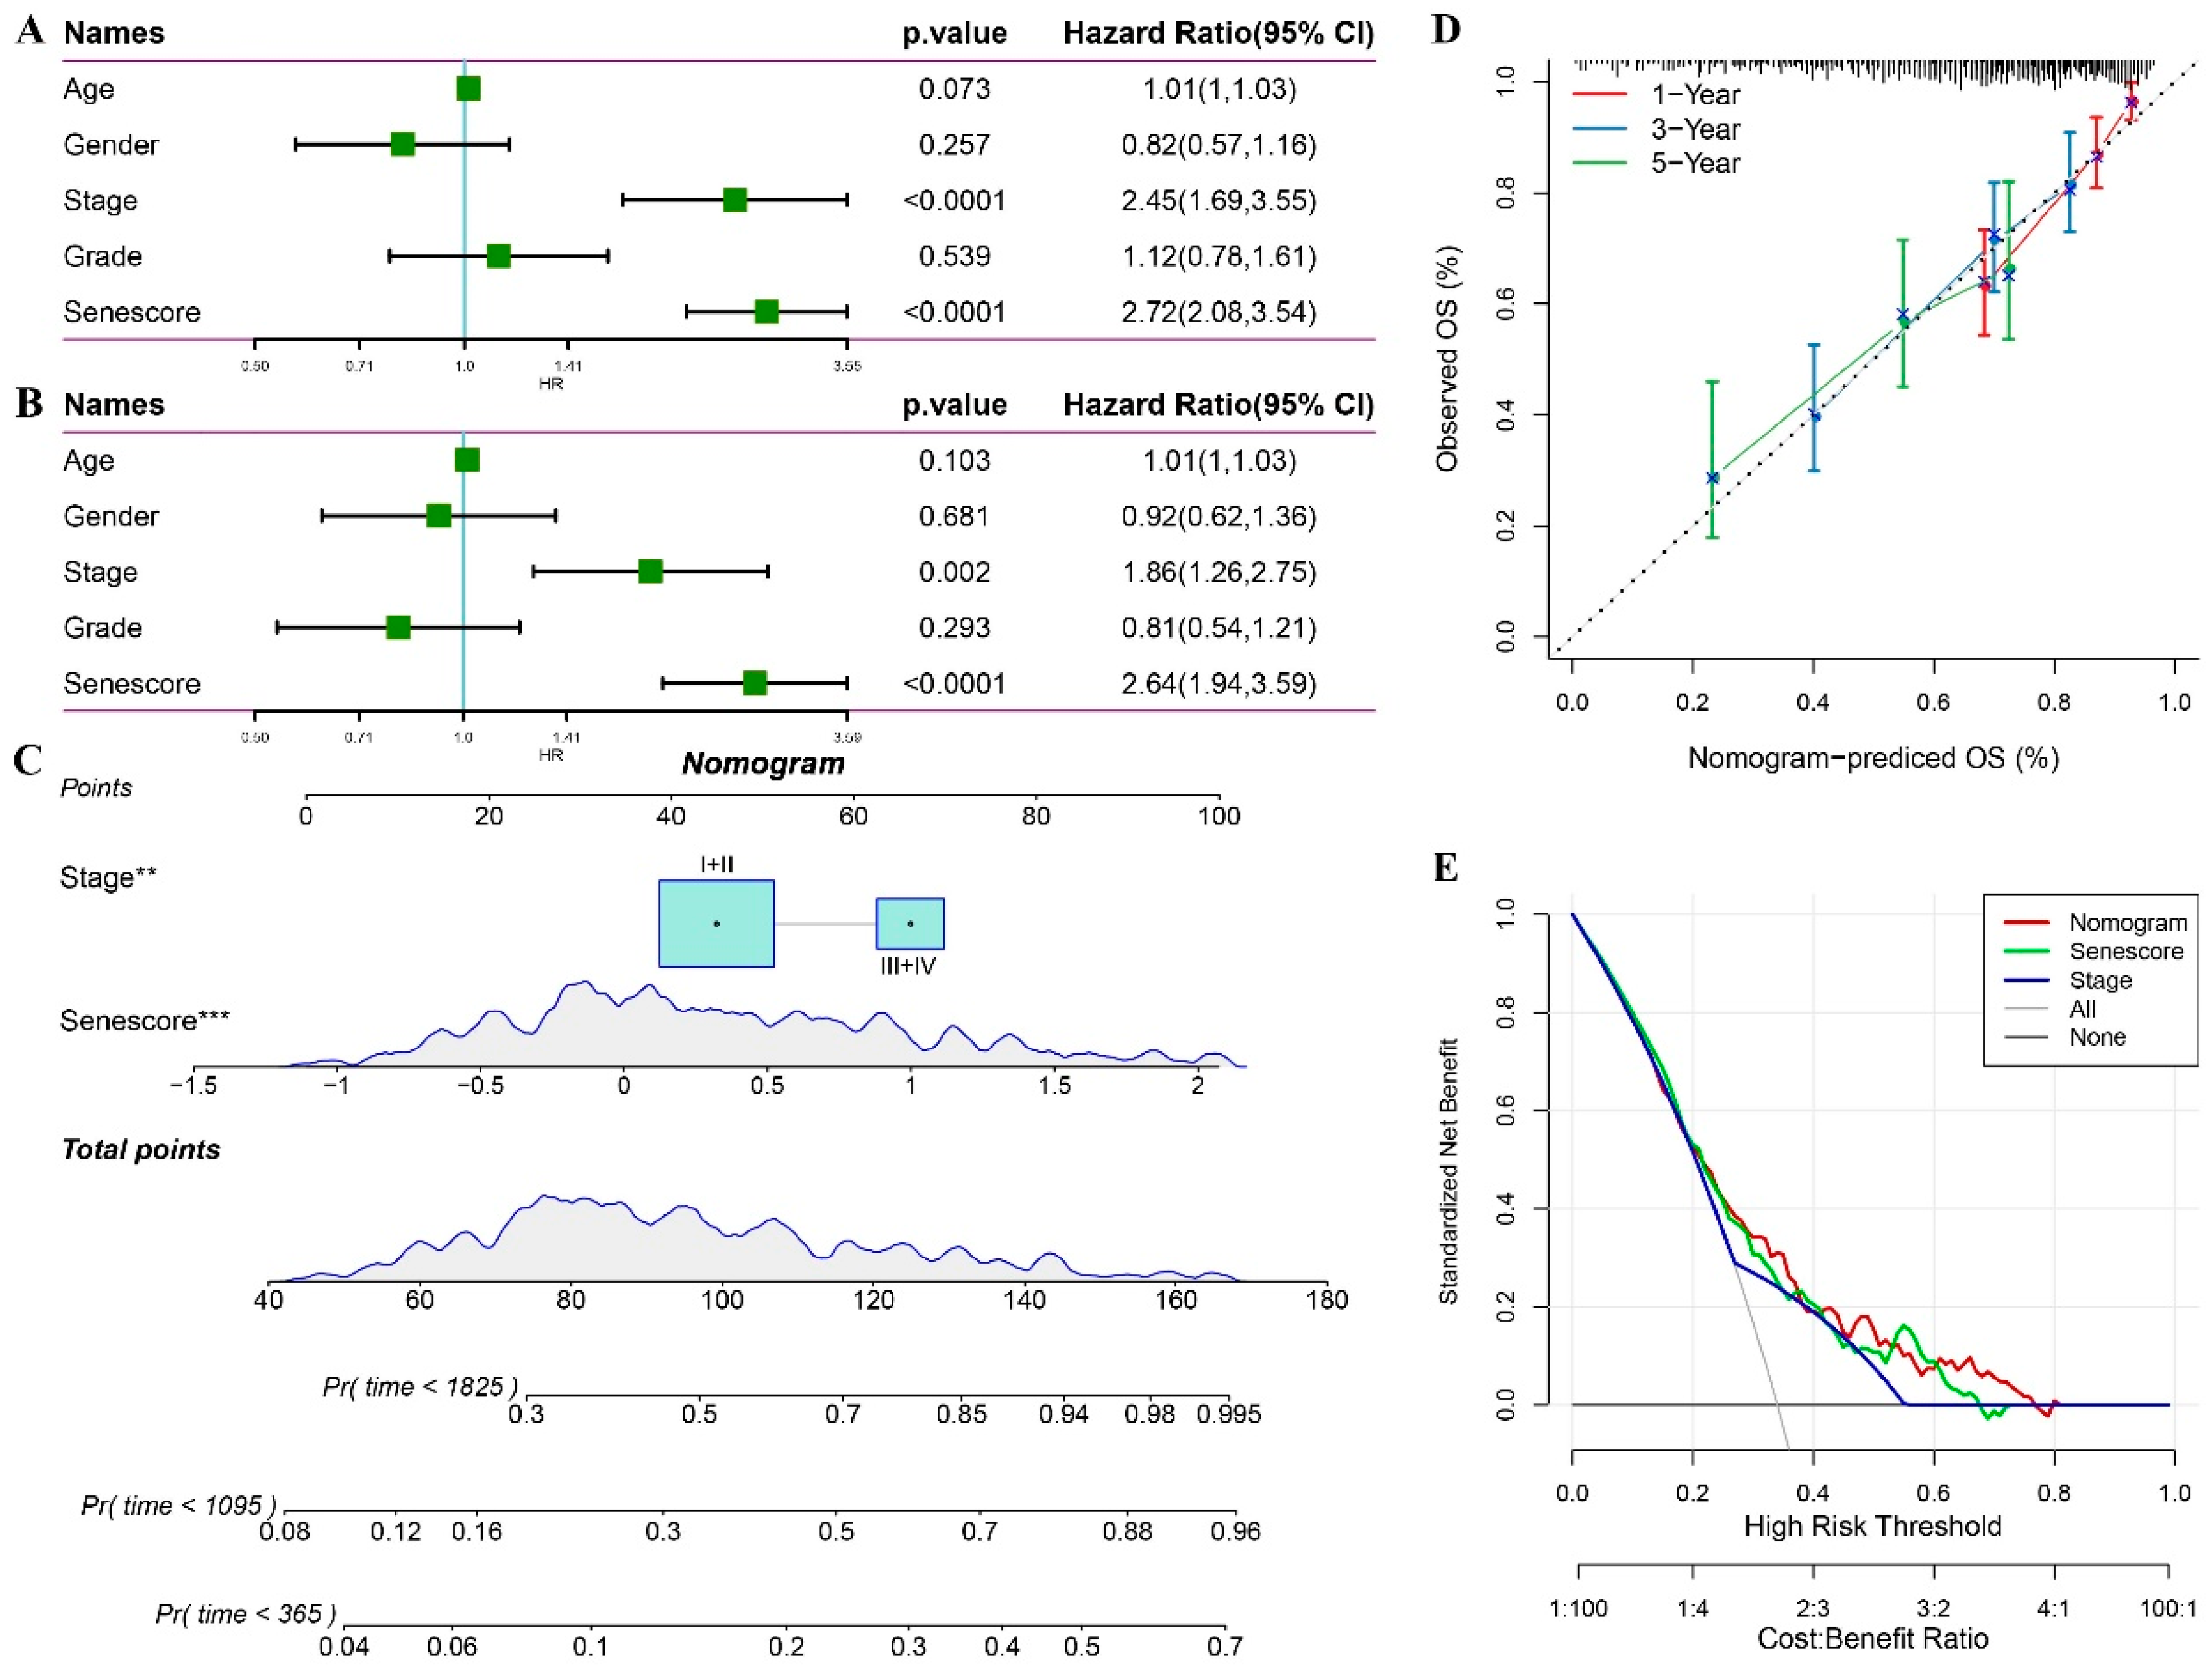
The univariate and multivariate Cox regression analyses of the RiskScore and the HCC clinicopathological features revealed that the RiskScore exerted the most significant prognostic effect (Figs. 11A-B). The RiskScore was combined with other clinicopathological features to quantify patient risk assessment and survival probability, and a forest plot was constructed (Figure 11C). The model results indicated that the RiskScore had the greatest influence on survival prediction. Furthermore, the predictive accuracy of the model was assessed using calibration curves (Figure 11D). The calibration curves for the one-, three-, and five-year time points closely aligned with the standard curve, suggesting the excellent predictive performance of the forest plot. Moreover, the reliability of the model was evaluated using decision curve analysis (DCA) (Figure 11E). Both the RiskScore and nomogram demonstrated substantial net benefits compared to the extreme curve. Compared to other clinicopathological features, the nomogram and RiskScore exhibited the strongest survival prediction ability.
Discussion
HCC represents a highly heterogeneous malignancy characterized by diverse pathogenic determinants and an increased incidence rate. Contemporary postoperative outcomes for patients with HCC remain less than optimal. A significant proportion of patients with HCC exhibit reduced susceptibility to multi-target receptor tyrosine kinase inhibitors and immune checkpoint inhibitors (ICIs), which are exemplified by PD-1/PD-L1 antagonists. This proportion underscores the importance of precisely identifying a prognostic biomarker to inform therapeutic decisions. A pivotal cellular phenomenon in senescence and tumorigenesis in HCC, CS warrants elucidation, specifically regarding the molecular characteristics of senescence, immune profiles, clinical manifestations, and treatment responsiveness.
Based on the above, a scoring metric predicated on mRNA expression landscapes in HCC was devised in the present study. The metric facilitated correlations between senescent molecular subtypes and the genomic, immune, and clinical spectra in patients with HCC. Significantly, risk stratification using CS features proficiently predicted patient outcomes and revealed directions for therapy. Collectively, the findings present a comprehensive paradigm to understand the CS-associated markers in HCC, catalyzing further investigations and biomarker discovery.
The present study identified the HCC-specific senescence-associated pathways. While numerous senescence-centric pathways demonstrated differential significance, only three signaling pathways were significant following integrated single-cell data and GSEA screening. Earlier investigations explored the senescence hallmark pathways in clear cell renal cell carcinoma. However, the defined pathways markedly differed from those in the present study, which highlighted the distinctive molecular nuances of senescence in dissimilar tumors [15].
Concurrent studies on prostate cancer examined its molecular heterogeneity and immune milieu dynamism, where three CS genes with prognostic potential were isolated [16]. Aligning with these insights, the present study also constructed a multi-gene model for HCC as a prospective tool for predicting prognoses and evaluating therapeutic responses. The results suggested the intrinsic flexibility of senescence attributes across tumor types, likely modulated by the inherent traits of the tumor and the surrounding immune environment. A profound understanding of senescence attributes can inspire a more refined understanding of senescence mechanisms across diverse malignancies, thereby refining prognostic evaluations and tailoring therapeutic interventions for HCC.
The molecular biological variances across diverse senescence subgroups were investigated, where distinctions in signaling pathways and variations in tumor characteristic expression were emphasized. Numerous senescence features mirror those of cancer. However, their interplay in tumorigenesis remains debated. The common hallmarks shared by senescence and cancer include genomic instability, epigenetic alterations, persistent inflammation, and ecological dysregulation, collectively referred to as “meta-features”. Despite lacking direct counterparts in cancer, certain senescence features (impaired protein homeostasis, mitochondrial dysfunction, and altered intercellular communication) are also considered detrimental factors that contribute to tumor progression. Interestingly, other specific senescence features, such as telomere attrition and stem cell exhaustion, counteract the emergence of cancer hallmarks, including infinite replicative potential and phenotypic versatility, thereby acting as antagonistic attributes.
The findings revealed that Cluster 3 exhibited a significantly poorer prognosis. Simultaneously, malignant features such as cell cycle scored higher in Cluster 3. However, Cluster 3 had lower levels of other characteristics, such as EMT and vascular formation. Interestingly, although these results appear contradictory, similar patterns were identified when analyzing the senescence subtypes in other tumors [17]. Moreover, two other senescence characteristics have been highlighted: disabled macroautophagy and CS, whose tumor-suppressive and tumor-promoting roles are environment-dependent [18]. Therefore, it is suggested that senescence does not always promote the malignancy process in tumors. By selectively inhibiting the detrimental functions of senescence and amplifying the beneficial effects of CS, it might be possible to offset the adverse factors associated with senescence in tumor treatment. Thus, the heterogeneity in malignant attributes across senescence subgroups highlights the potential of stratifying HCC based on senescence phenotypes.
Senescence-associated molecular characteristics were systematically quantified in HCC to define their clinical implications. The resultant quantified attributes were then encapsulated into a risk score metric. The primary focus was to discern correlations between risk scores extrapolated from these senescence molecular markers and pivotal clinical indices: patient prognosis, intricate pathological nuances, and oncological pharmacotherapy responsiveness. A cross-sectional data analysis underscored discernible variations in the senescence risk score when compared across a spectrum of pathological gradations and histopathological echelons. Remarkably, the prognostic algorithm demonstrated substantial precision in predicting the clinical course of patients with HCC. Furthermore, the risk score established its position as a standalone prognostic biomarker, a claim substantiated across diverse HCC cohorts, thereby cementing the robustness of the investigative outcomes.
Notably, in clinical practice, the judicious selection of therapeutic agents is paramount for overcoming drug resistance, augmenting objective response rates (ORR), and enhancing overall survival, particularly in patients with advanced HCC. Phase III trials that examined sorafenib reported that the ORR defined by the modified Response Evaluation Criteria in Solid Tumors (mRECIST) was 10%–15% [19]. Contrastingly, lenvatinib-treated patients had an ORR of 24.1% [20]. In this context, the potential of a senescence risk score to prognosticate drug efficacies in HCC cohorts was evaluated. The analysis results highlighted that patients in the high-risk scores group had heightened susceptibility to established chemotherapeutic agents, exemplified by cisplatin. Developing the senescence risk quantifier could potentially revolutionize therapeutic stratification, particularly for patients in advanced disease stages or with bleak prognostic outlooks, thereby facilitating enhanced clinical resolutions.
The applications of the senescence risk score also extend to immunotherapy. Notably, the CheckMate-040 trial [1], which spotlighted nivolumab as a monotherapeutic agent, heralded a new era in HCC immunotherapy. The idea was echoed by the subsequent KEYNOTE-224 study that underscored the therapeutic ability of pembrolizumab in the HCC therapeutic landscape [21]. Despite the advances in ICIs, monotherapeutic ICI paradigms, particularly those using PD-1/PD-L1, have not achieved their envisioned therapeutic peak. Hence, augmenting ICI therapeutic outcomes through novel regimens remains imperative.
The preliminary insights of the present study highlight the prognostic potential of the risk score in immunotherapeutic cohorts. Alarmingly, patients categorized as high-risk had a suboptimal clinical prognosis post-immunotherapy. This finding suggested the necessity of an exhaustive clinical appraisal of this cohort to delineate optimal therapeutic strategies. Based on the abovementioned findings and discussions, it is cautiously posited that formulating a senescence risk scoring system is promising for augmenting the efficacy of existing therapies for patients with HCC.
In the present study, the importance of identifying G6PD as an HCC biomarker in CS is reiterated. The fundamental role of G6PD is to provide adequate reducing power essential for growth and maintaining redox homeostasis[22]. Recent investigations revealed G6PD involvement in various cellular processes beyond red blood cell diseases through redox signaling[23,24]. G6PD activity deficiency impairs antioxidant defense mechanisms and disrupts cell signal transduction. Furthermore, dysregulated G6PD activation has been linked to tumor initiation and progression towards malignancy. Previous studies elucidated the substantial roles of G6PD in regulating apoptosis, STAT3- and STAT5-mediated tumorigenesis[25], colon cancer metastasis[26], and p53-mutated cancers[27]. However, while some prior findings suggested that G6PD involvement in different signaling pathways promoted HCC progression, its specific role as a CS marker in liver cancer cells remains elusive.
Consequently, the present study validated the significance of G6PD as an essential biomarker within the HCC senescence model and substantiated its influence on the malignant features of HCC tumor cells. These findings were supported across multiple HCC cohorts and by molecular biology experiments. Thus, investigations focusing on delineating the role of G6PD in senescence would contribute to a more comprehensive understanding of its functional implications in HCC.
Despite preliminary data revealing the relationship between the CS score and HCC clinical outcomes, immune therapy, and chemotherapy sensitivity, the study limitations must be acknowledged. First, defining the senescence characteristics of patients with HCC relies on their transcriptome information. Research incorporating additional omics data, including proteomics and genomics, could provide a more comprehensive understanding of the senescence features in such patients. Furthermore, the fact that the cohorts currently undergoing immune therapy in the studies were not derived from an HCC cohort might have affected the immune therapy effects.
In summary, HCC-specific senescence-related pathways were investigated, and two prognostic models were developed using genes associated with these pathways. The risk model, which characterizes senescence in HCC, exhibited robust predictive efficacy. Specifically, the risk score effectively guided the clinical outcomes of patients with HCC and potentially assessed the degree of immune cell infiltration, guided clinical drug usage, and evaluated immune therapy effectiveness. As a foundation for precise prognosis prediction in patients with HCC, the risk score is a new quantitative evaluation method for the CS level in HCC and aids in developing personalized treatment plans.
Methods and Materials
Data Resources
HCC data in TPM (transcripts per million) format were obtained from the Cancer Genome Atlas (TCGA) database and accompanied by pertinent clinical phenotype information. Concurrently, an additional HCC high-throughput sequencing dataset, the HCCDB18 cohort, was downloaded from the HCCDB database. Furthermore, GSE76427 dataset expression profile data and survival information were retrieved from the Gene Expression Omnibus (GEO) database. The data filtration criteria were as follows: 1) samples lacking survival information were excluded; 2) samples without survival time data were removed; 3) samples with undefined status were eliminated; 4) Ensembl identifiers were converted to gene symbols; 5) probes were transformed to gene symbols; concurrently, a single probe that mapped to multiple genes was excluded; 6) the average expression level of repeated gene symbols was used to determine their expression level.
The refined dataset comprised 365 tumor specimens and 50 adjacent non-tumor tissue samples from TCGA-LIHC (liver HCC). One hundred and fifteen tumor tissues were identified from the GSE76427 dataset, and an additional 212 tumor tissues were obtained from the HCCDB18 cohort. In addition to these datasets, HCC scRNA data (GSE149614) were acquired from the GEO database. Furthermore, the online tool BEST (https://rookieutopia.com/) was used to assess the G6PD expression profiles in HCC and examine its prognostic implications[28].
Single-cell Data Processing
The single-cell dataset underwent rigorous filtering and normalization to ensure high-quality data. Initially, gene expression was filtered by requiring that at least three cells expressed each gene, and each cell expressed a minimum of 250 genes. Additionally, mitochondrial and rRNA content were screened with stringent criteria to ensure that gene expression levels per cell were <5000 and >100, with mitochondrial content limited to <15%. The data from 10 samples were standardized with log-normalization. High-variation genes were identified through the FindVariableFeatures function, which enabled the detection of genes exhibiting substantial variation across cells.
The FindIntegrationAnchors function was utilized for canonical correlation analysis (CCA) to integrate the data from multiple samples and overcome batch effects, followed by sample integration using the IntegrateData method. To reduce dimensionality and identify key cellular features, the expression values of all genes were scaled using the ScaleData function, followed by principal component analysis (PCA) to reduce the dimension to 30. The resolution parameter for cellular clustering was set at 0.2, enabling the identification of distinct cellular subpopulations. The distribution of filtered and processed cells in a low-dimensional space was visualized using the RunTSNE function. This visualization enabled the projection of the cells onto a two-dimensional plane, yielding a visual representation of their spatial arrangement.
The resulting clusters were annotated by assigning immune cell types to each subcluster based on classical marker genes. Specific marker genes for each subcluster were identified using the FindAllMarkers function. Differentially expressed genes were characterized using a log-fold change threshold (logFC) of 0.5 and a minimum expression percentage (Minpct) of 0.35. Copy number variation (CNV) changes in the single-cell data were predicted using the CopyKAT package to discriminate tumor cells from normal cells within each sample. Furthermore, the cell senescence-related pathways were downloaded from the Gene Set Enrichment Analysis (GSEA) website. Pathway-specific scores were computed using single-sample (ss)GSEA to assess their association with malignant and non-malignant cells. Lastly, z-score normalization was applied to the enrichment scores of each pathway to improve comparability.
Gene Set Source and Quantification
The specific sources of the gene set used in this study are as follows: 1) 31 cell cycle progression (CCP) genes and 24 genes for tumor angiogenesis signatures were from previous studies [29,30]; 2) 27 genes related to the G1/S phase were from the Kyoto Encyclopedia of Genes and Genomes (KEGG) website; 3) hallmark gene sets (REACTOME_TELOMERE_EXTENSION_BY_TELOMERASE, HALLMARK_EPITHELIAL_MESENCHYMAL_TRANSITION, HALLMARK_G2M_CHECKPOINT, HALLMARK_INFLAMMATORY_RESPONSE, and HALLMARK_HYPOXIA), were from the GSEA website; 4) the relevant gene sets for 10 tumor-related pathways were from a previous study [31].
The gene sets mentioned earlier were calculated using single-sample (ss) GSEA to obtain corresponding scores. The immune and stromal scores were computed using the ESTIMATE algorithm[32], a computational approach that estimates the immune and stromal components present within the tumor microenvironment. These scores provide an assessment of the overall immune cell infiltration and stromal activity levels in each sample. Additionally, the immune cell scores were determined using the CIBERSORT algorithm[33], which calculates the proportions of different immune cell types within the sample. These scoring calculations were all conducted using TCGA samples.
Cell Culture and Transfection
The human HCC cell line HepG2 (KCB200507YJ) was obtained from the Chinese Academy of Sciences. The HepG2 cells were cultured in RPMI 1640 medium supplemented with 10% fetal bovine serum (FBS), glutamine, and HEPES at a temperature of 37 °C in a 5% CO2 incubator. G6PD expression was enhanced by transfecting the cells with a lentiviral vector (CMV enhancer-MCS-polyA-EF1A-zsGreen-sv40-puromycin, Shanghai Gene Chem Co., Ltd., Shanghai, China).
Western Blot, Colony Formation, and Transwell Assays
Total proteins from the HepG2 cells were extracted using phenylmethylsulfonyl fluoride (PMSF)-supplemented radioimmunoprecipitation assay (RIPA) buffer. The protein concentration was determined using a bicinchoninic acid (BCA) assay kit (Servicebio, Wuhan, China). The protein samples were incubated with anti-G6PD (Affinity Biosciences, Cat# DF6444) and anti-GAPDH (Affinity Biosciences, Cat# AF7021). The HepG2 cell colony formation and Transwell assays were performed as described previously [34].
Statistical Analysis
Beyond the specified bioinformatics approaches, the data were analyzed using R version 4.1.0 (www.r-project.org) and GraphPad Prism version 8.0. The relationship between two continuous variables was assessed with Spearman’s rank correlation. The significance of differences between the two groups was evaluated using Student’s t-test. A p-value < 0.05 denoted statistical significance.
Supplementary Materials
The following supporting information can be downloaded at the website of this paper posted on Preprints.org.
Author Contributions
XH and FL designed the research. XH and FL performed the study and analyzed the data. XH and FL drafted the paper. QG revised the paper. All authors contributed to the article and approved the submitted version.
Acknowledgments
We thank Home for Researchers editorial team (www.home-for-researchers.com) for language editing service.
Conflicts of Interest
The authors declare no conflict of interest associated with this manuscript.
References
- Yau, T.; Kang, Y.-K.; Kim, T.-Y.; El-Khoueiry, A.B.; Santoro, A.; Sangro, B.; Melero, I.; Kudo, M.; Hou, M.-M.; Matilla, A.; et al. Efficacy and Safety of Nivolumab Plus Ipilimumab in Patients With Advanced Hepatocellular Carcinoma Previously Treated With Sorafenib: The CheckMate 040 Randomized Clinical Trial. JAMA Oncology 2020, 6, e204564–e204564. [Google Scholar] [CrossRef]
- Llovet, J.M.; Ricci, S.; Mazzaferro, V.; Hilgard, P.; Gane, E.; Blanc, J.-F.; de Oliveira, A.C.; Santoro, A.; Raoul, J.-L.; Forner, A.; et al. Sorafenib in Advanced Hepatocellular Carcinoma. New England Journal of Medicine 2008, 359, 378–390. [Google Scholar] [CrossRef]
- Finn, R.S.; Qin, S.; Ikeda, M.; Galle, P.R.; Ducreux, M.; Kim, T.-Y.; Kudo, M.; Breder, V.; Merle, P.; Kaseb, A.O.; et al. Atezolizumab plus Bevacizumab in Unresectable Hepatocellular Carcinoma. New England Journal of Medicine 2020, 382, 1894–1905. [Google Scholar] [CrossRef]
- Wang, L.; Jin, H.; Jochems, F.; Wang, S.; Lieftink, C.; Martinez, I.M.; De Conti, G.; Edwards, F.; de Oliveira, R.L.; Schepers, A.; et al. cFLIP suppression and DR5 activation sensitize senescent cancer cells to senolysis. Nature Cancer 2022, 3, 1284–1299. [Google Scholar] [CrossRef]
- Muñoz-Espín, D.; Serrano, M. Cellular senescence: from physiology to pathology. Nature Reviews Molecular Cell Biology 2014, 15, 482–496. [Google Scholar] [CrossRef]
- Campisi, J. Aging, Cellular Senescence, and Cancer. Annual Review of Physiology 2013, 75, 685–705. [Google Scholar] [CrossRef]
- Kim, Y.H.; Choi, Y.W.; Lee, J.; Soh, E.Y.; Kim, J.-H.; Park, T.J. Senescent tumor cells lead the collective invasion in thyroid cancer. Nature Communications 2017, 8, 15208. [Google Scholar] [CrossRef]
- Orjalo, A.V.; Bhaumik, D.; Gengler, B.K.; Scott, G.K.; Campisi, J. Cell surface-bound IL-1α is an upstream regulator of the senescence-associated IL-6/IL-8 cytokine network. Proceedings of the National Academy of Sciences 2009, 106, 17031–17036. [Google Scholar] [CrossRef]
- Eyman, D.; Damodarasamy, M.; Plymate, S.R.; Reed, M.J. CCL5 secreted by senescent aged fibroblasts induces proliferation of prostate epithelial cells and expression of genes that modulate angiogenesis. Journal of Cellular Physiology 2009, 220, 376–381. [Google Scholar] [CrossRef]
- Kawagoe, Y.; Kawashima, I.; Sato, Y.; Okamoto, N.; Matsubara, K.; Kawamura, K. CXCL5-CXCR2 signaling is a senescence-associated secretory phenotype in preimplantation embryos. Aging Cell 2020, 19, e13240. [Google Scholar] [CrossRef]
- Coppé, J.-P.; Patil, C.K.; Rodier, F.; Sun, Y.; Muñoz, D.P.; Goldstein, J.; Nelson, P.S.; Desprez, P.-Y.; Campisi, J. Senescence-Associated Secretory Phenotypes Reveal Cell-Nonautonomous Functions of Oncogenic RAS and the p53 Tumor Suppressor. PLOS Biology 2008, 6, e301. [Google Scholar] [CrossRef]
- Krtolica, A.; Parrinello, S.; Lockett, S.; Desprez, P.-Y.; Campisi, J. Senescent fibroblasts promote epithelial cell growth and tumorigenesis: A link between cancer and aging. Proceedings of the National Academy of Sciences 2001, 98, 12072–12077. [Google Scholar] [CrossRef]
- Zhu, Y.; Tchkonia, T.; Pirtskhalava, T.; Gower, A.C.; Ding, H.; Giorgadze, N.; Palmer, A.K.; Ikeno, Y.; Hubbard, G.B.; Lenburg, M.; et al. The Achilles’ heel of senescent cells: from transcriptome to senolytic drugs. Aging Cell 2015, 14, 644–658. [Google Scholar] [CrossRef]
- Reyes, N.S.; Krasilnikov, M.; Allen, N.C.; Lee, J.Y.; Hyams, B.; Zhou, M.; Ravishankar, S.; Cassandras, M.; Wang, C.; Khan, I.; et al. Sentinel <i>p16</i><sup>INK4a+</sup> cells in the basement membrane form a reparative niche in the lung. Science 2022, 378, 192–201. [Google Scholar] [CrossRef]
- Gong, Q.; Chen, X.; Liu, F.; Cao, Y. Machine learning-based integration develops a neutrophil-derived signature for improving outcomes in hepatocellular carcinoma. Frontiers in Immunology 2023, 14. [Google Scholar] [CrossRef]
- Wang, X.; Ma, L.; Pei, X.; Wang, H.; Tang, X.; Pei, J.-F.; Ding, Y.-N.; Qu, S.; Wei, Z.-Y.; Wang, H.-Y.; et al. Comprehensive assessment of cellular senescence in the tumor microenvironment. Briefings in Bioinformatics 2022, 23. [Google Scholar] [CrossRef]
- Gong, Q.; Jiang, Y.; Xiong, J.; Liu, F.; Guan, J. Integrating scRNA and bulk-RNA sequencing develops a cell senescence signature for analyzing tumor heterogeneity in clear cell renal cell carcinoma. Frontiers in Immunology 2023, 14. [Google Scholar] [CrossRef]
- López-Otín, C.; Pietrocola, F.; Roiz-Valle, D.; Galluzzi, L.; Kroemer, G. Meta-hallmarks of aging and cancer. Cell Metabolism 2023, 35, 12–35. [Google Scholar] [CrossRef]
- Cheng, A.-L.; Kang, Y.-K.; Chen, Z.; Tsao, C.-J.; Qin, S.; Kim, J.S.; Luo, R.; Feng, J.; Ye, S.; Yang, T.-S.; et al. Efficacy and safety of sorafenib in patients in the Asia-Pacific region with advanced hepatocellular carcinoma: a phase III randomised, double-blind, placebo-controlled trial. The Lancet Oncology 2009, 10, 25–34. [Google Scholar] [CrossRef]
- Kudo, M.; Finn, R.S.; Qin, S.; Han, K.-H.; Ikeda, K.; Piscaglia, F.; Baron, A.; Park, J.-W.; Han, G.; Jassem, J.; et al. Lenvatinib versus sorafenib in first-line treatment of patients with unresectable hepatocellular carcinoma: a randomised phase 3 non-inferiority trial. The Lancet 2018, 391, 1163–1173. [Google Scholar] [CrossRef]
- Zhu, A.X.; Finn, R.S.; Edeline, J.; Cattan, S.; Ogasawara, S.; Palmer, D.; Verslype, C.; Zagonel, V.; Fartoux, L.; Vogel, A.; et al. Pembrolizumab in patients with advanced hepatocellular carcinoma previously treated with sorafenib (KEYNOTE-224): a non-randomised, open-label phase 2 trial. The Lancet Oncology 2018, 19, 940–952. [Google Scholar] [CrossRef]
- Yang, H.-C.; Wu, Y.-H.; Yen, W.-C.; Liu, H.-Y.; Hwang, T.-L.; Stern, A.; Chiu, D.T.-Y. The Redox Role of G6PD in Cell Growth, Cell Death, and Cancer. Cells 2019, 8, 1055. [Google Scholar] [CrossRef]
- Chen, T.-L.; Yang, H.-C.; Hung, C.-Y.; Ou, M.-H.; Pan, Y.-Y.; Cheng, M.-L.; Stern, A.; Lo, S.J.; Chiu, D.T.-Y. Impaired embryonic development in glucose-6-phosphate dehydrogenase-deficient Caenorhabditis elegans due to abnormal redox homeostasis induced activation of calcium-independent phospholipase and alteration of glycerophospholipid metabolism. Cell Death & Disease 2018, 8, e2545–e2545. [Google Scholar] [CrossRef]
- Yang, C.-A.; Huang, H.-Y.; Lin, C.-L.; Chang, J.-G. G6PD as a predictive marker for glioma risk, prognosis and chemosensitivity. Journal of Neuro-Oncology 2018, 139, 661–670. [Google Scholar] [CrossRef]
- Bromberg, J. Stat proteins and oncogenesis. The Journal of Clinical Investigation 2002, 109, 1139–1142. [Google Scholar] [CrossRef]
- Zhang, X.; Zhang, X.; Li, Y.; Shao, Y.; Xiao, J.; Zhu, G.; Li, F. PAK4 regulates G6PD activity by p53 degradation involving colon cancer cell growth. Cell Death & Disease 2017, 8, e2820–e2820. [Google Scholar] [CrossRef]
- Jiang, P.; Du, W.; Wang, X.; Mancuso, A.; Gao, X.; Wu, M.; Yang, X. p53 regulates biosynthesis through direct inactivation of glucose-6-phosphate dehydrogenase. Nature Cell Biology 2011, 13, 310–316. [Google Scholar] [CrossRef]
- Liu, Z.; Liu, L.; Weng, S.; Xu, H.; Xing, Z.; Ren, Y.; Ge, X.; Wang, L.; Guo, C.; Li, L.; et al. BEST: a web application for comprehensive biomarker exploration on large-scale data in solid tumors. Journal of Big Data 2023, 10, 165. [Google Scholar] [CrossRef]
- Wang, L.; Lankhorst, L.; Bernards, R. Exploiting senescence for the treatment of cancer. Nature Reviews Cancer 2022, 22, 340–355. [Google Scholar] [CrossRef]
- Cuzick, J.; Swanson, G.P.; Fisher, G.; Brothman, A.R.; Berney, D.M.; Reid, J.E.; Mesher, D.; Speights, V.O.; Stankiewicz, E.; Foster, C.S.; et al. Prognostic value of an RNA expression signature derived from cell cycle proliferation genes in patients with prostate cancer: a retrospective study. The Lancet Oncology 2011, 12, 245–255. [Google Scholar] [CrossRef]
- Sanchez-Vega, F.; Mina, M.; Armenia, J.; Chatila, W.K.; Luna, A.; La, K.C.; Dimitriadoy, S.; Liu, D.L.; Kantheti, H.S.; Saghafinia, S.; et al. Oncogenic Signaling Pathways in The Cancer Genome Atlas. Cell 2018, 173, 321–337. [Google Scholar] [CrossRef] [PubMed]
- Yoshihara, K.; Shahmoradgoli, M.; Martínez, E.; Vegesna, R.; Kim, H.; Torres-Garcia, W.; Treviño, V.; Shen, H.; Laird, P.W.; Levine, D.A.; et al. Inferring tumour purity and stromal and immune cell admixture from expression data. Nature Communications 2013, 4, 2612. [Google Scholar] [CrossRef] [PubMed]
- Newman, A.M.; Liu, C.L.; Green, M.R.; Gentles, A.J.; Feng, W.; Xu, Y.; Hoang, C.D.; Diehn, M.; Alizadeh, A.A. Robust enumeration of cell subsets from tissue expression profiles. Nature Methods 2015, 12, 453–457. [Google Scholar] [CrossRef] [PubMed]
- Gong, Q.; Guo, Z.; Sun, W.; Du, X.; Jiang, Y.; Liu, F. CX3CL1 promotes cell sensitivity to ferroptosis and is associated with the tumor microenvironment in clear cell renal cell carcinoma. BMC Cancer 2022, 22, 1184. [Google Scholar] [CrossRef] [PubMed]
Figure 1.
Visualization and Annotation of Cell Subgroups. t-SNE plot of sample distribution (A), clustered subgroups (B), and annotated cell distribution (C). D. Dot plot of marker gene expression in annotated subgroups. E. Proportions and cell numbers of annotated subgroups. F. Malignant and non-malignant cell distribution.
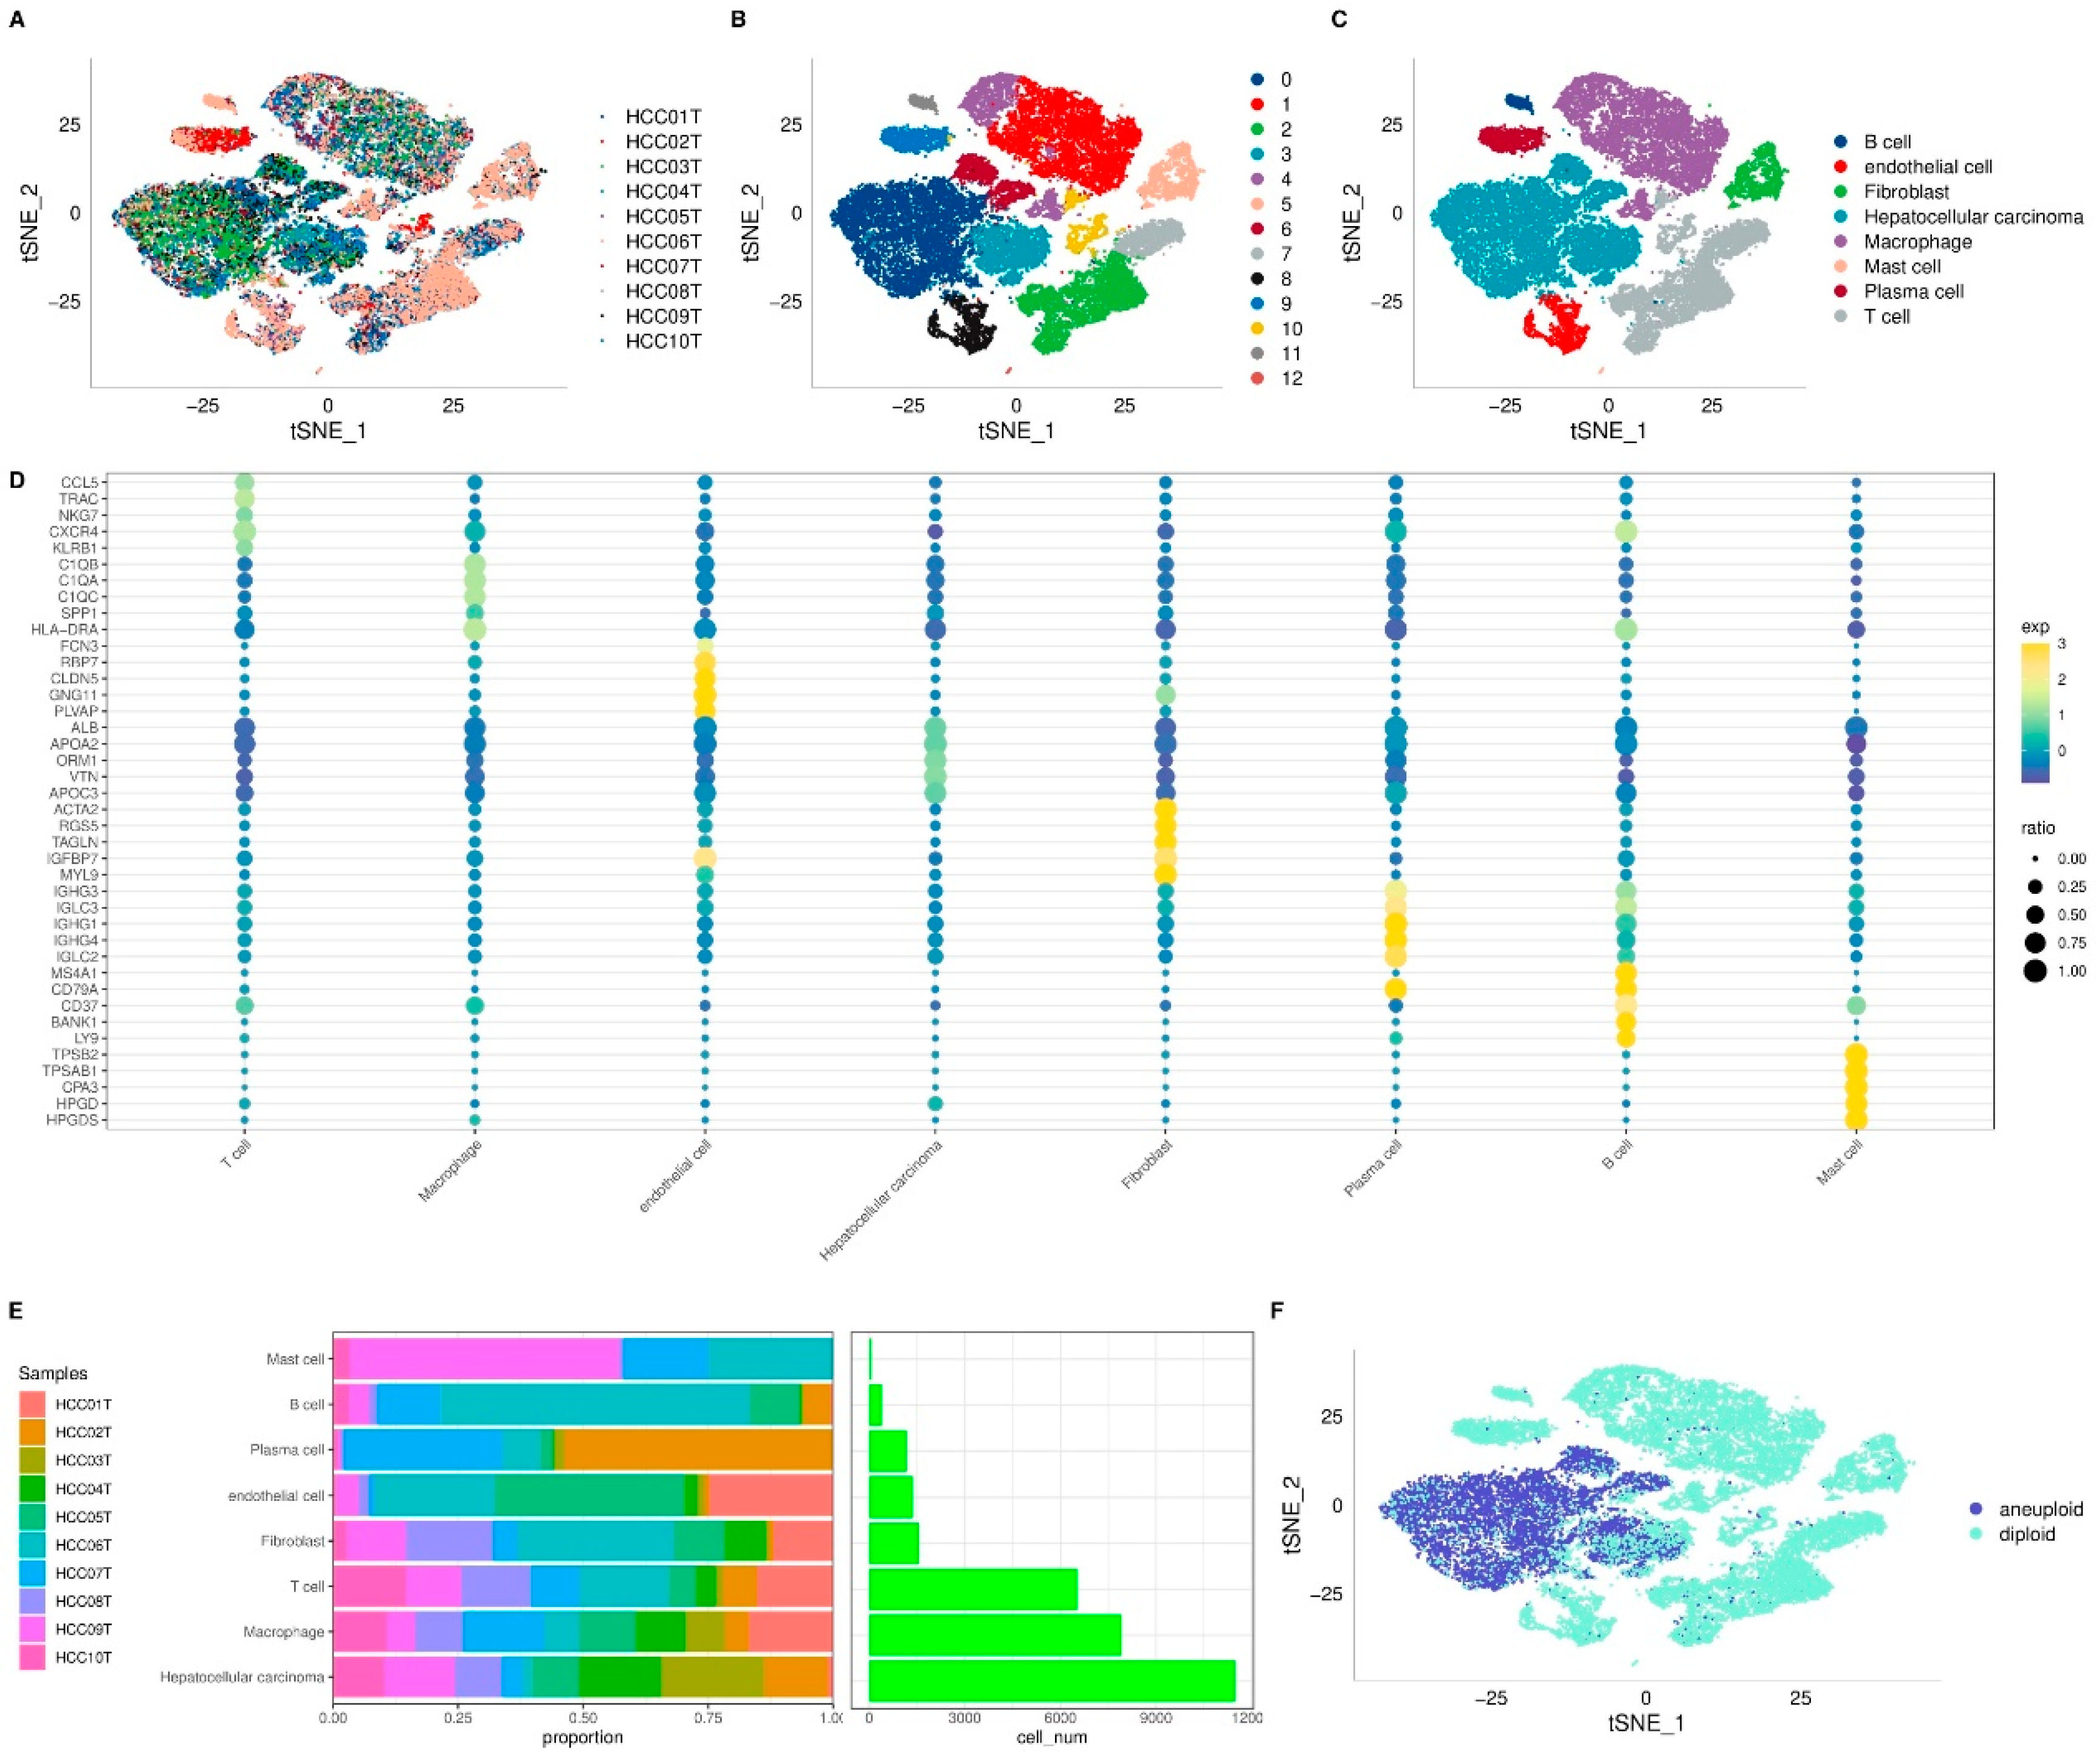
Figure 2.
Identification of Senescence-related Pathways in HCC. A. Single-cell analysis reveals differential senescence-related pathways through gene set variation analysis (GSVA). B. GSEA results for senescence-related pathways in bulk data. C. Comparison of ssGSEA scores for senescence-related pathways in bulk data. *p < 0.05; ***p < 0.001.
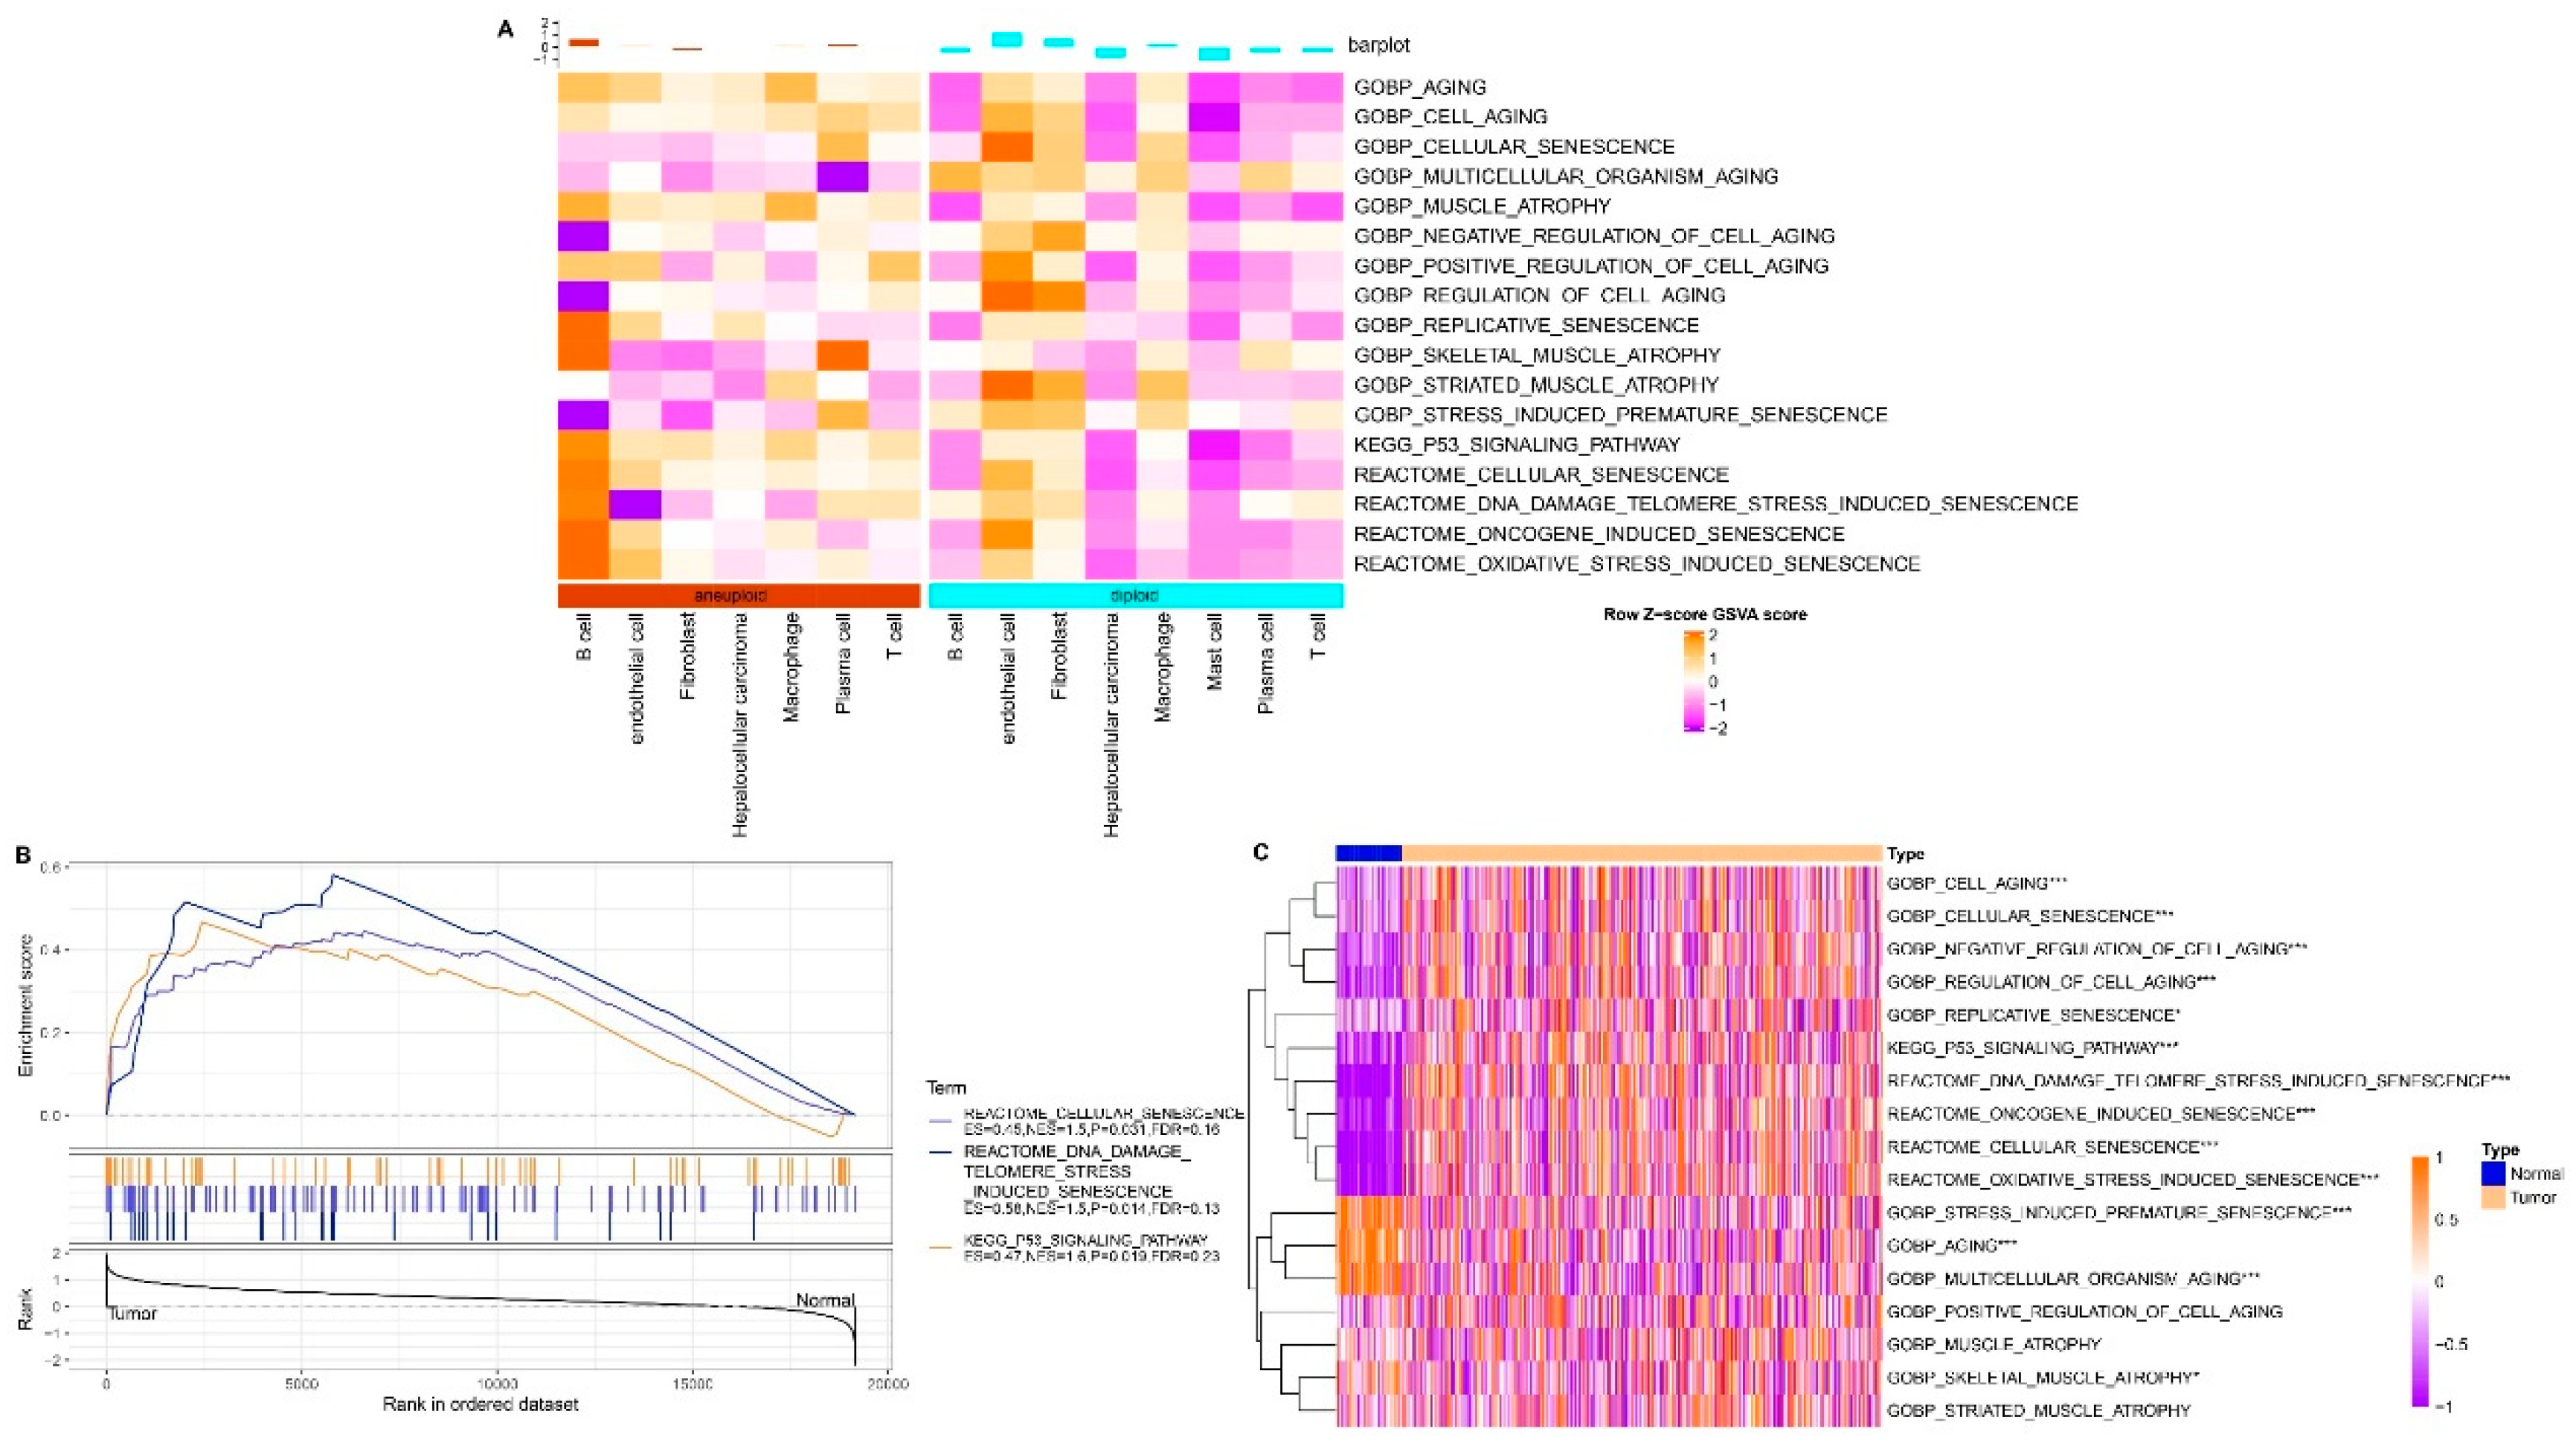
Figure 3.
Analysis of Subtypes and Prognostic Implications in HCC cohorts. A. CDF curve for LIHC cohort. B. Change in area curve from consensus clustering analysis. C. Visualization of sample groupings at k = 3 through a heatmap. D. KM survival curve demonstrating the outcomes of three distinct subtypes within TCGA-LIHC cohort. E. KM survival curve illustrating the prognosis of three subtypes in the HCCDB18 cohort.
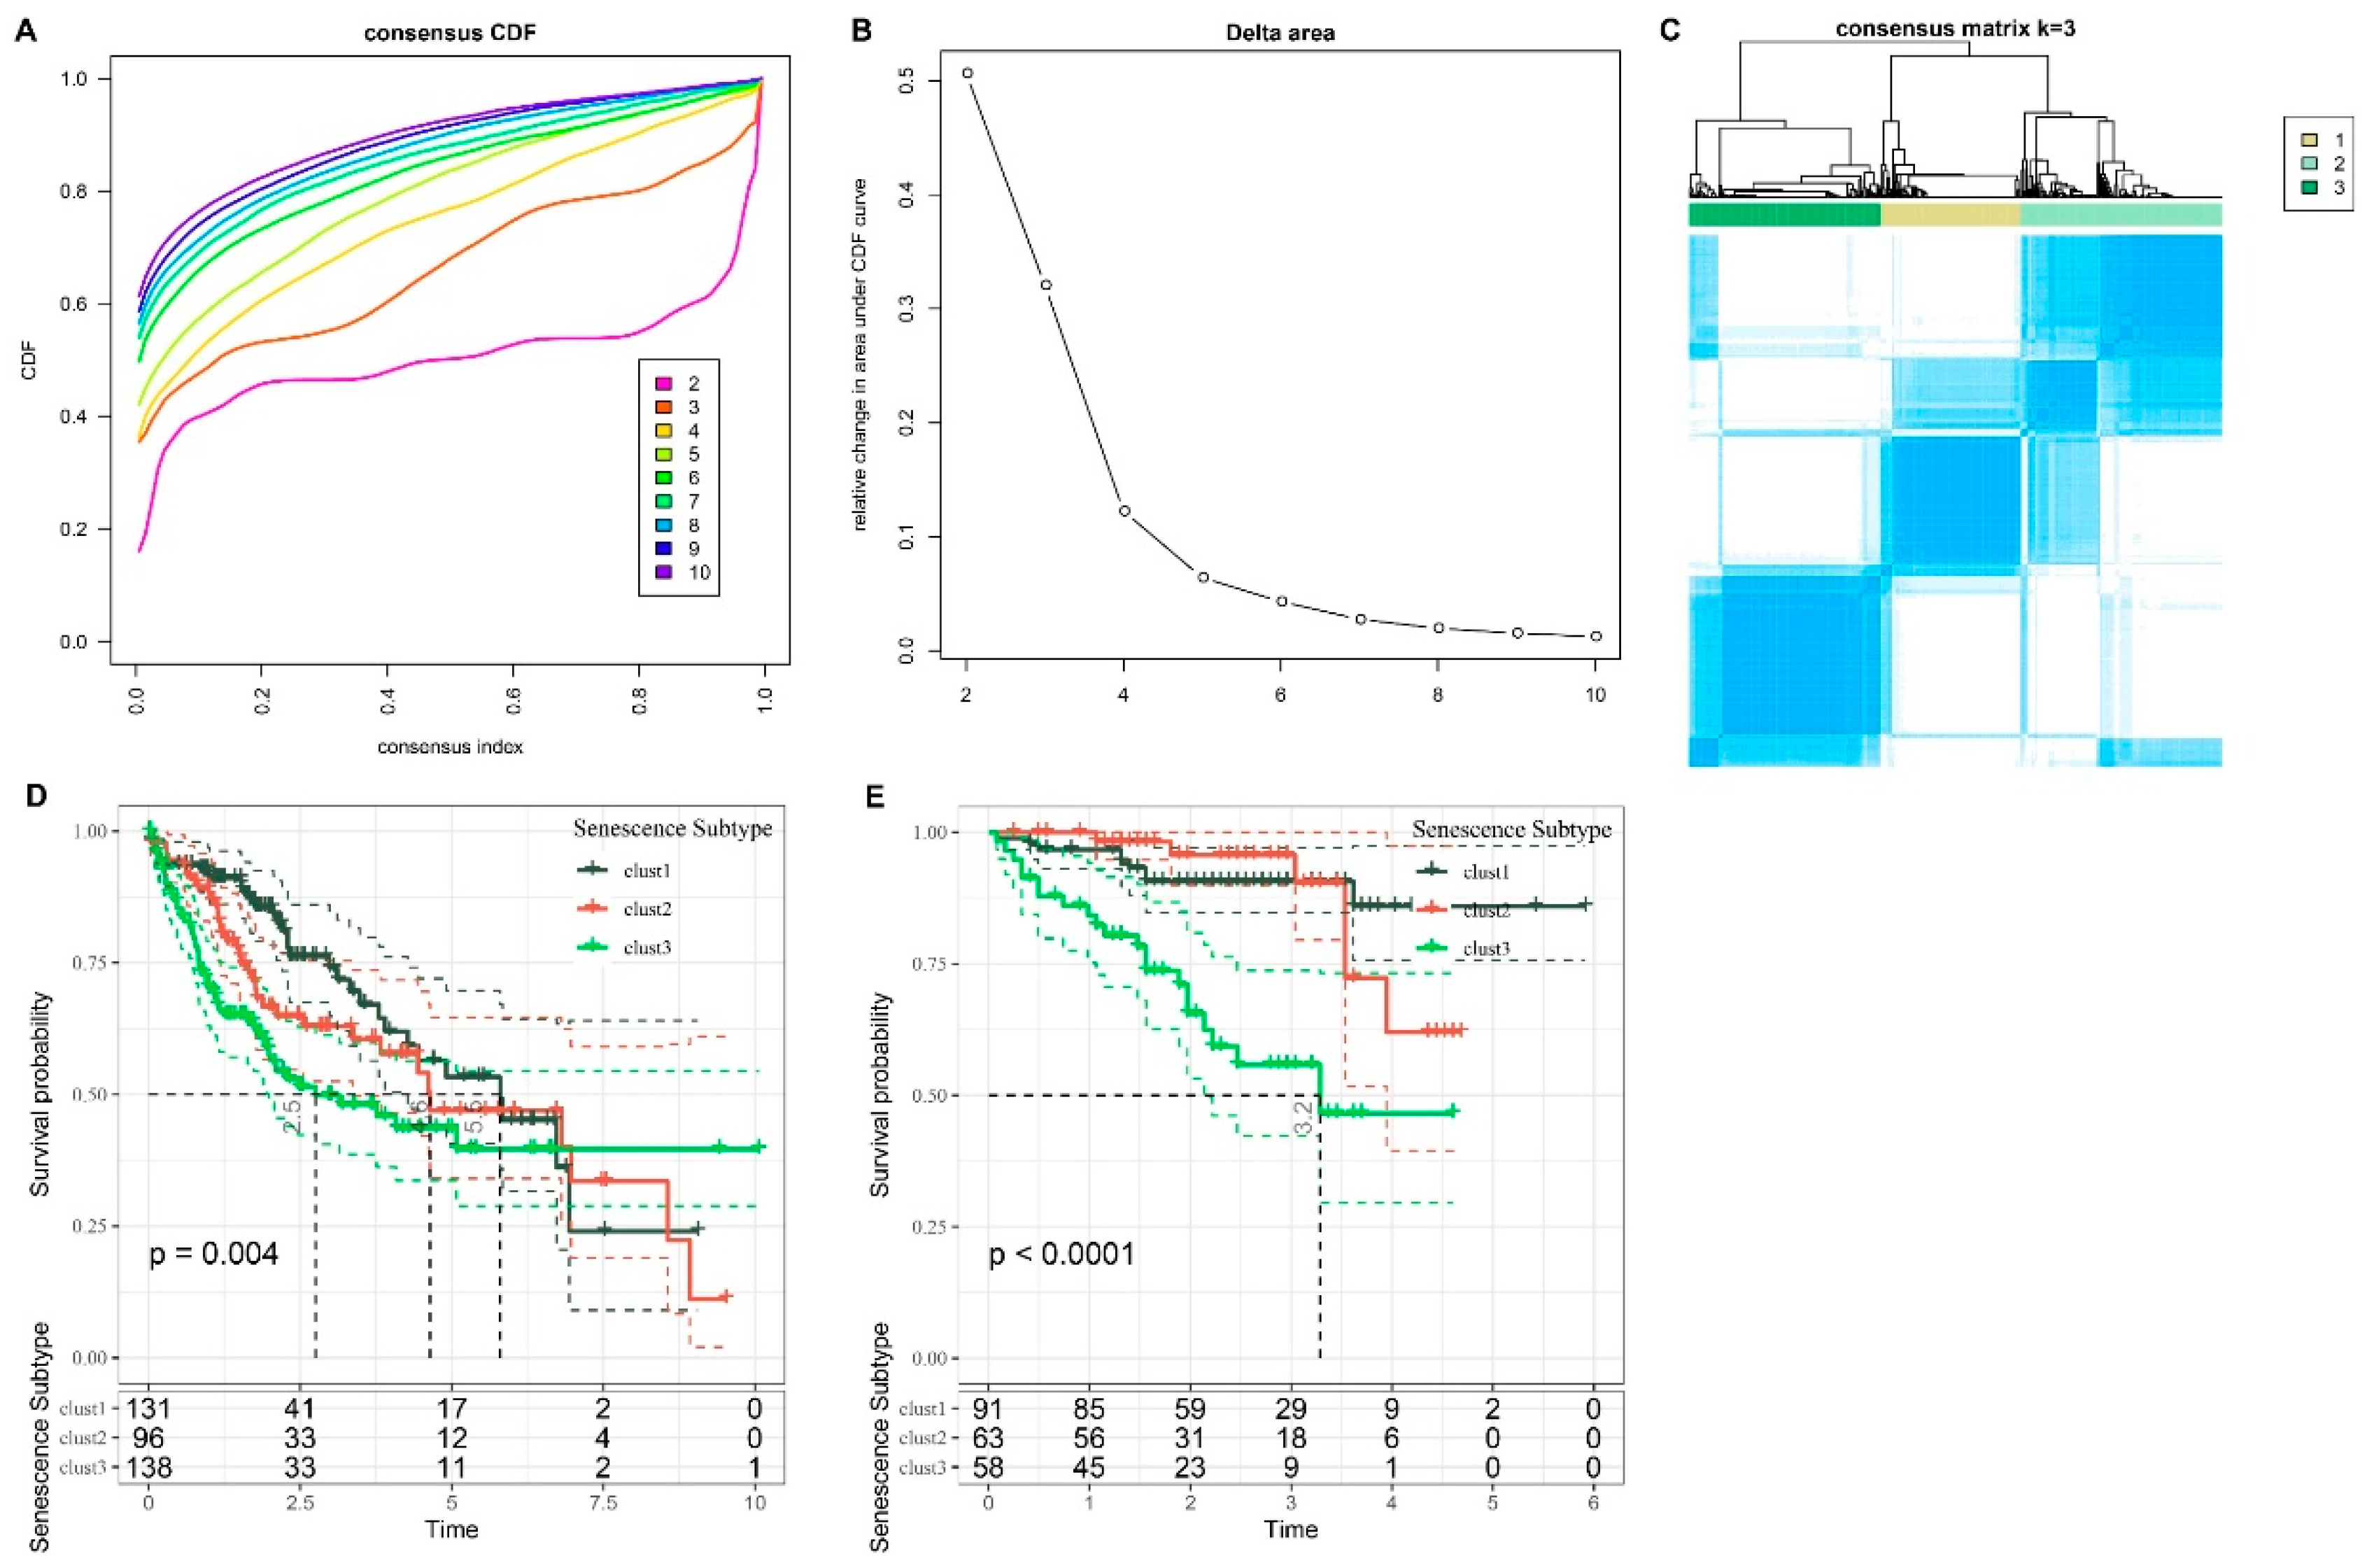
Figure 4.
Comparative Analysis of Clinical Feature Distribution Among Molecular Subtypes in TCGA-LIHC Cohort.
Figure 4.
Comparative Analysis of Clinical Feature Distribution Among Molecular Subtypes in TCGA-LIHC Cohort.
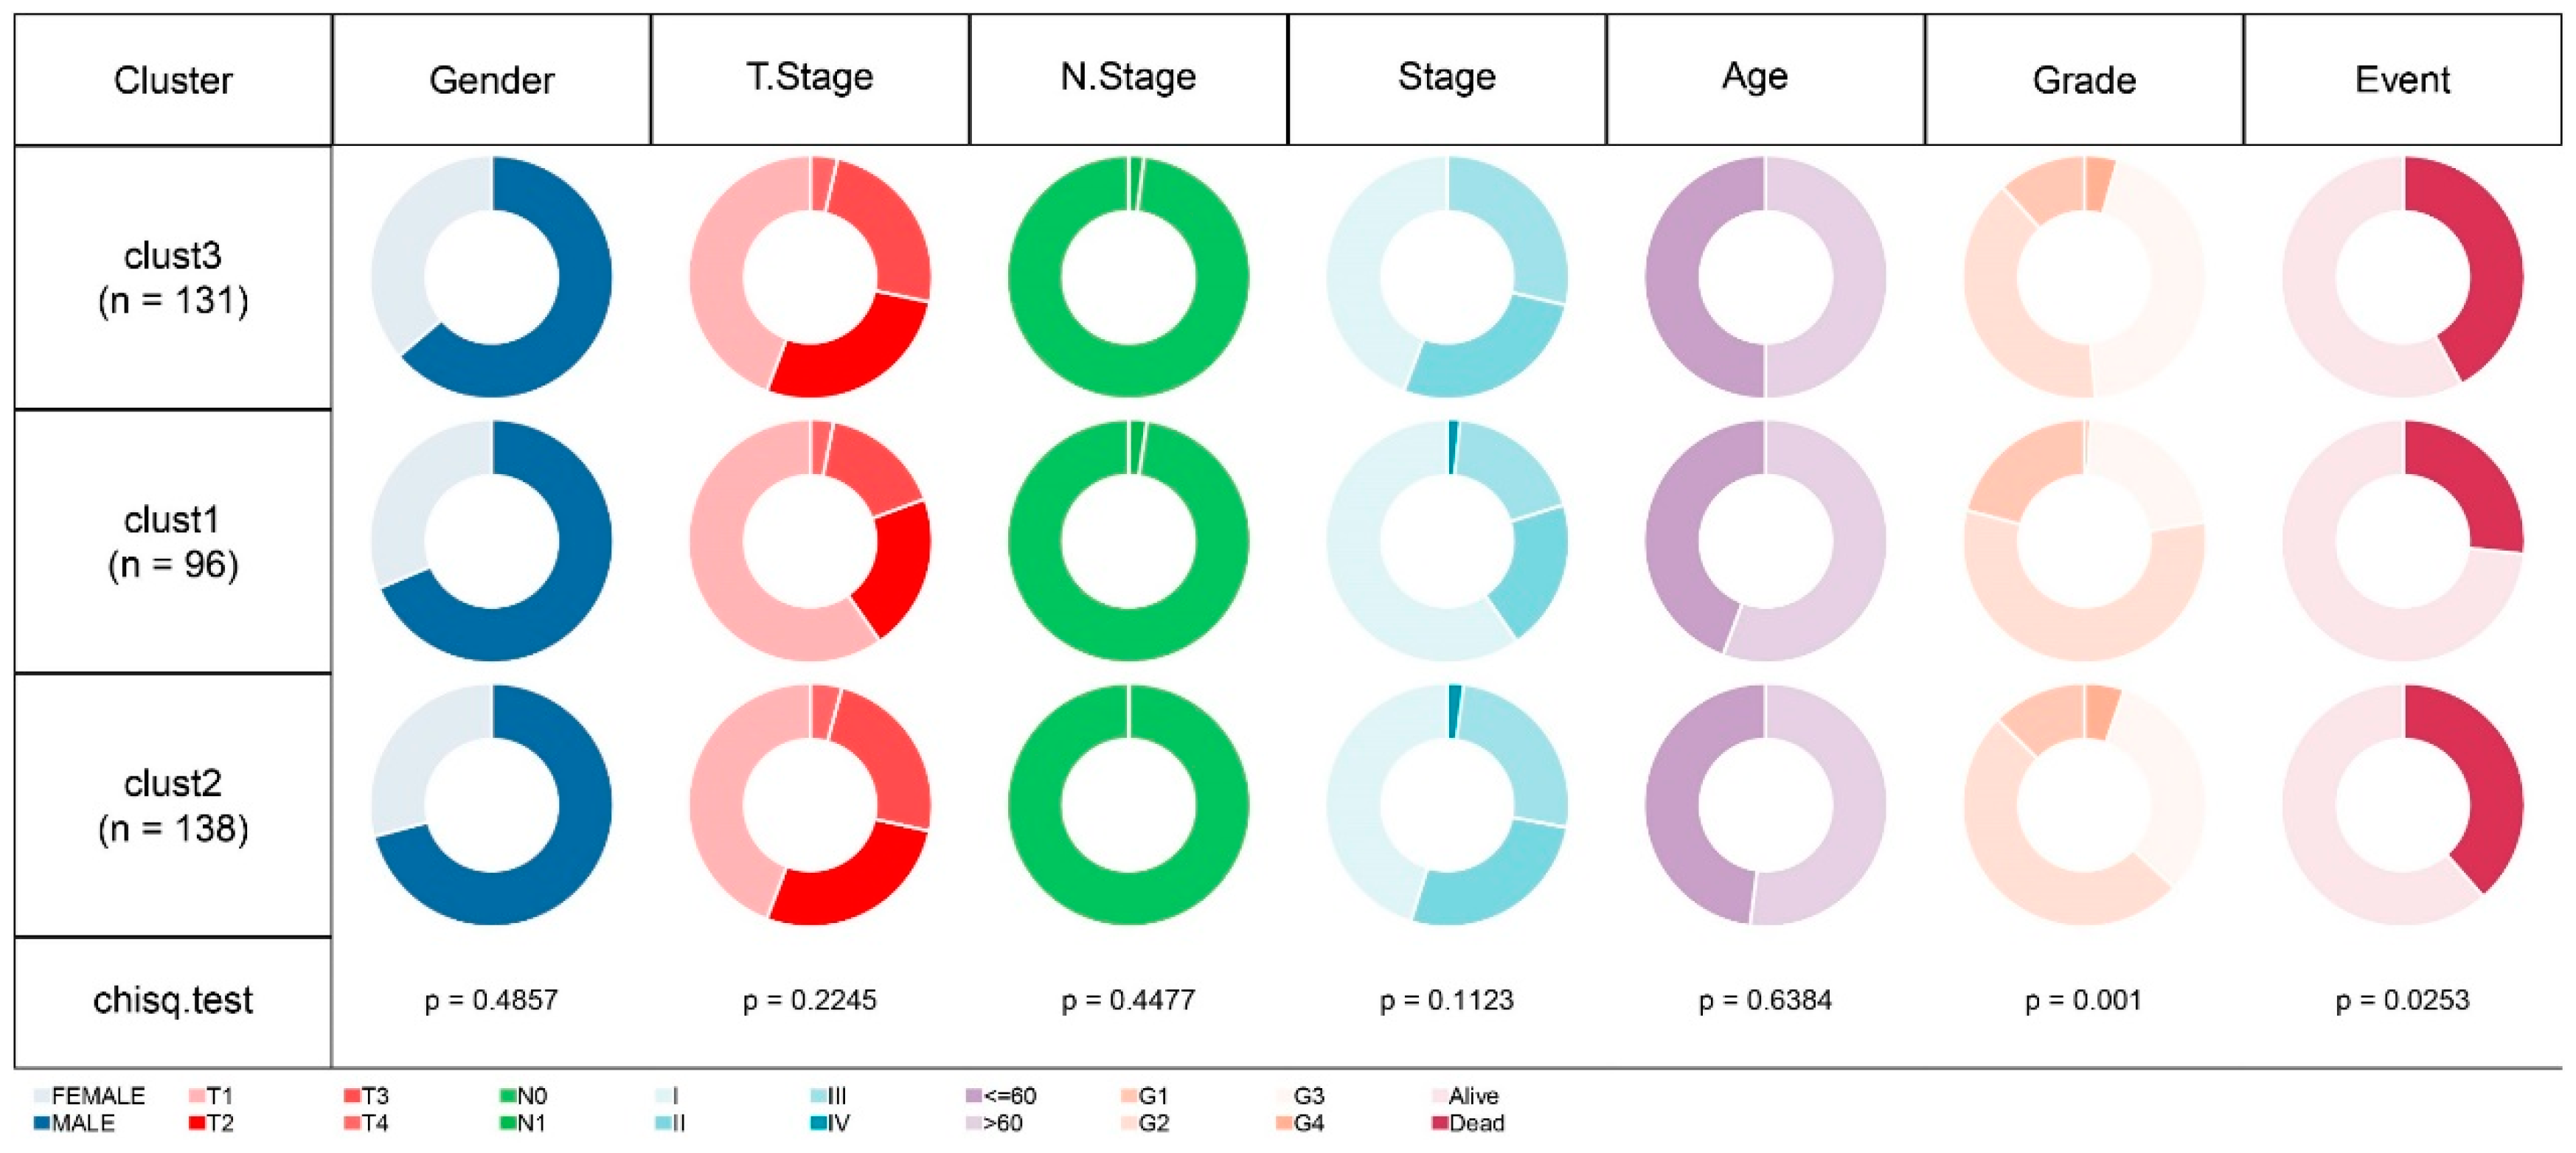
Figure 5.
Comparative Analysis of Scores Across Three Subtypes in TCGA-LIHC Dataset. A. CCP scores. B. G1/S phase scores. C. G2M checkpoint scores. D. Telomerase extension scores. E. EMT scores. F. Hypoxia scores. G. Angiogenesis scores. H. Immune scores (ESTIMATE algorithm). I. 22 Immune cell type scores (CIBERSORT algorithm). J. Ten pathway-related tumor scores. K. Inflammatory factor scores. ns, p ≥ 0.05; *p < 0.05; **p < 0.01; ***p < 0.001; ****p < 0.0001.
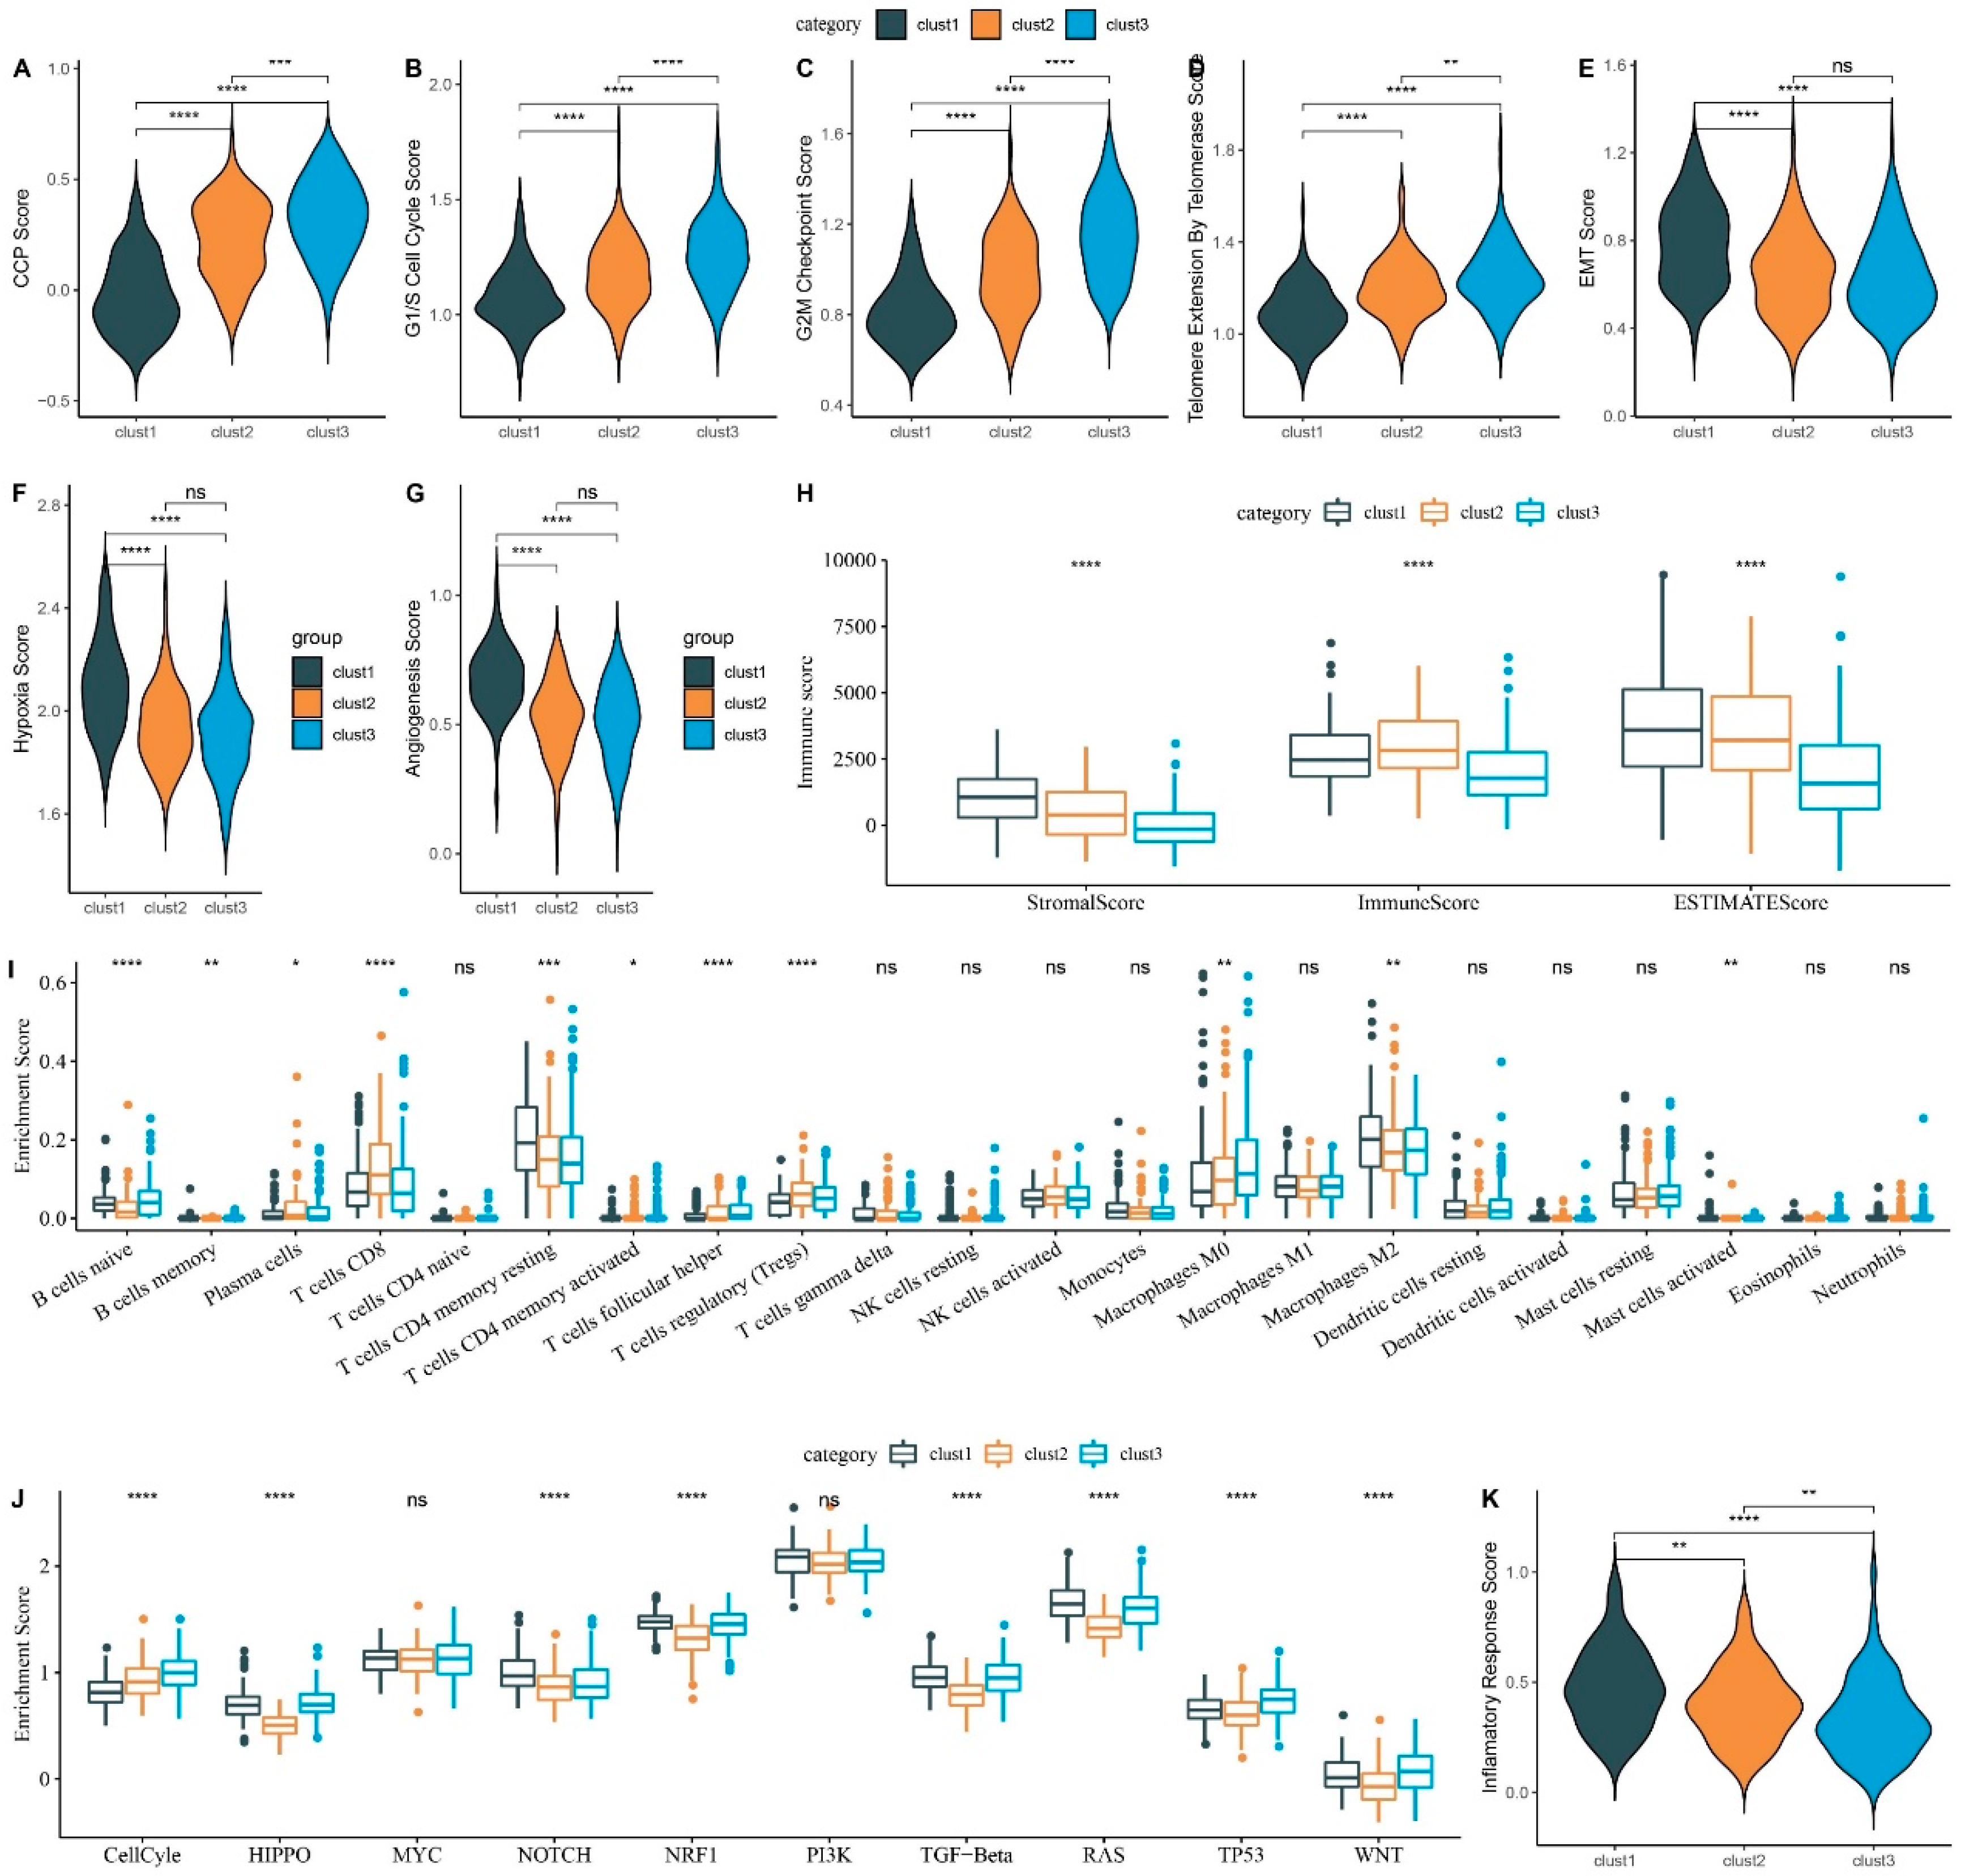
Figure 6.
CNV and SNV Mutation Analysis. Peak plot of CNV in cluster1 subtype (A), cluster2 subtype (B), and cluster3 subtype (C). D. Waterfall plot of top 15 genes with SNV mutations among subtypes.
Figure 6.
CNV and SNV Mutation Analysis. Peak plot of CNV in cluster1 subtype (A), cluster2 subtype (B), and cluster3 subtype (C). D. Waterfall plot of top 15 genes with SNV mutations among subtypes.
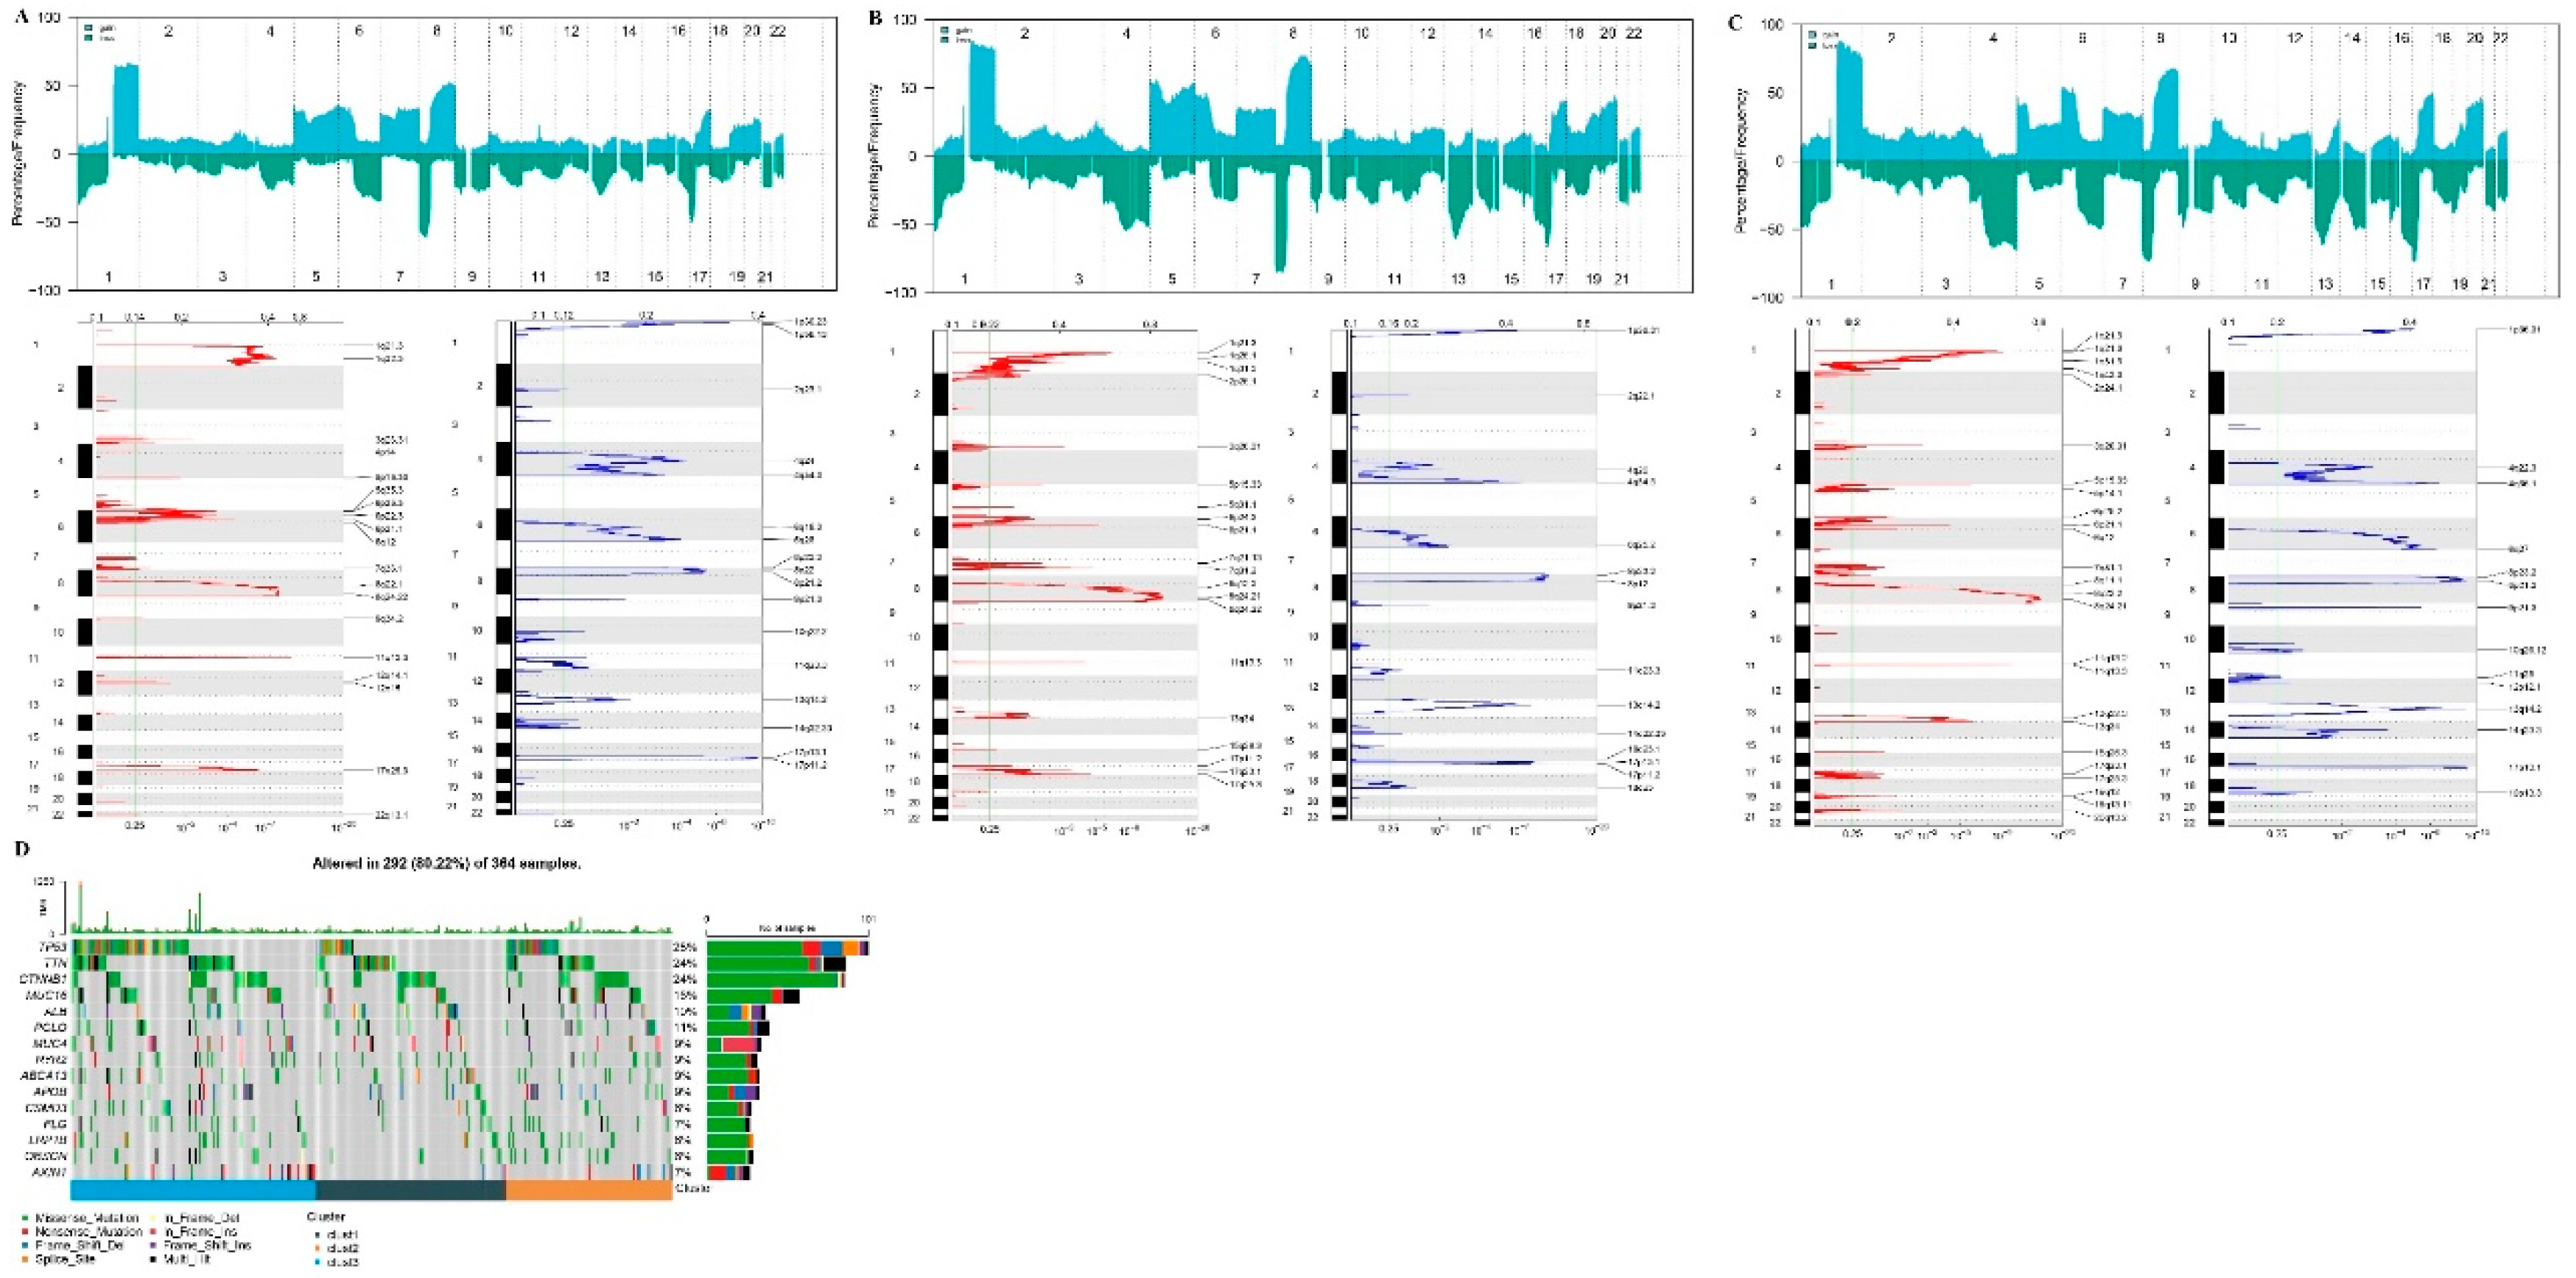
Figure 7.
Differential Gene Screening Among Three Subtypes and Risk Model Construction. Volcano plot for differential analysis of cluster1 vs. no_cluster1 (A), cluster2 vs. no_cluster2 (B), and cluster3 vs. no_cluster3 (C). D. Identification of 729 candidates among differentially expressed genes. E. Trajectory of each independent variable as lambda changes. F. Confidence interval under lambda. G. Coefficients of the seven genes in the model. H. Western blot assay to evaluate G6PD protein expression in HepG2 cells. I. Colony formation assay to evaluate HepG2 cell proliferation. J-K. Transwell assay assesses HepG2 cell migration (J) and invasion (K). *p < 0.05.
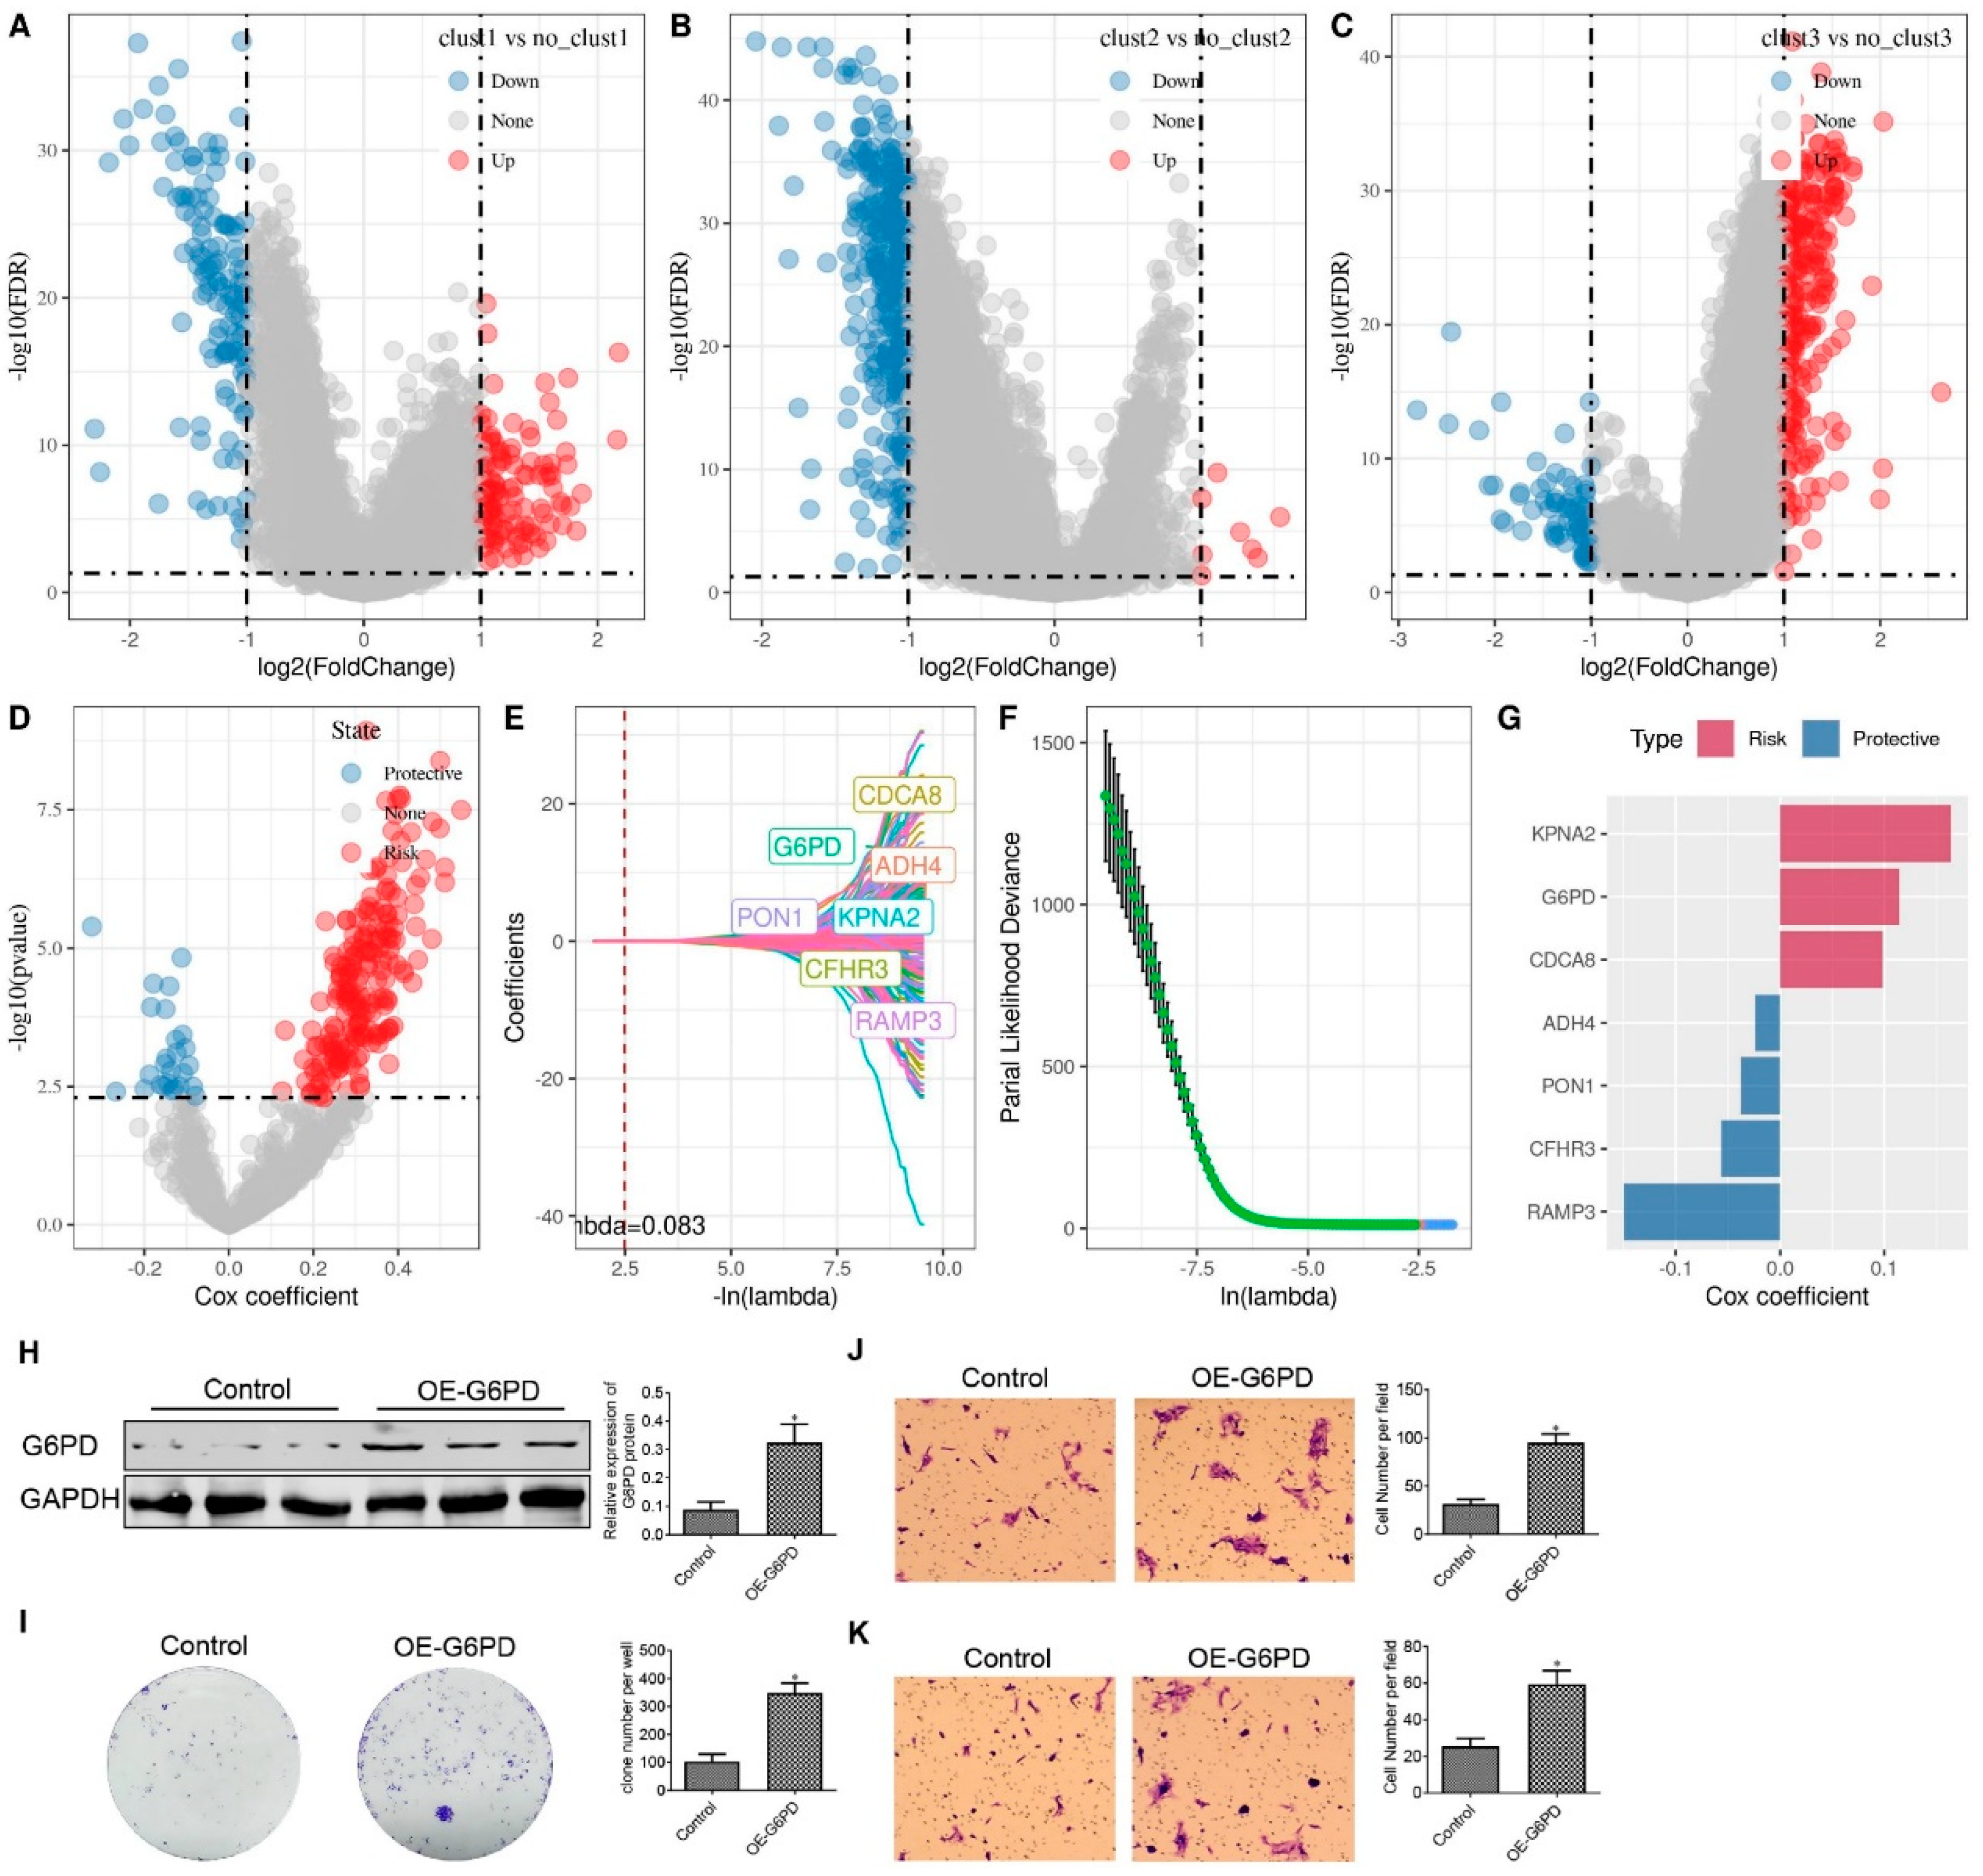
Figure 8.
Performance Evaluation of Seven-gene Risk Models from TCGA, HCCDB18, and GSE76427 Datasets. A–C. ROC curves and KM curves of the risk model constructed from seven TCGA dataset genes (A), seven HCCDB18 dataset genes (B), and seven GSE76427 dataset genes (C).
Figure 8.
Performance Evaluation of Seven-gene Risk Models from TCGA, HCCDB18, and GSE76427 Datasets. A–C. ROC curves and KM curves of the risk model constructed from seven TCGA dataset genes (A), seven HCCDB18 dataset genes (B), and seven GSE76427 dataset genes (C).
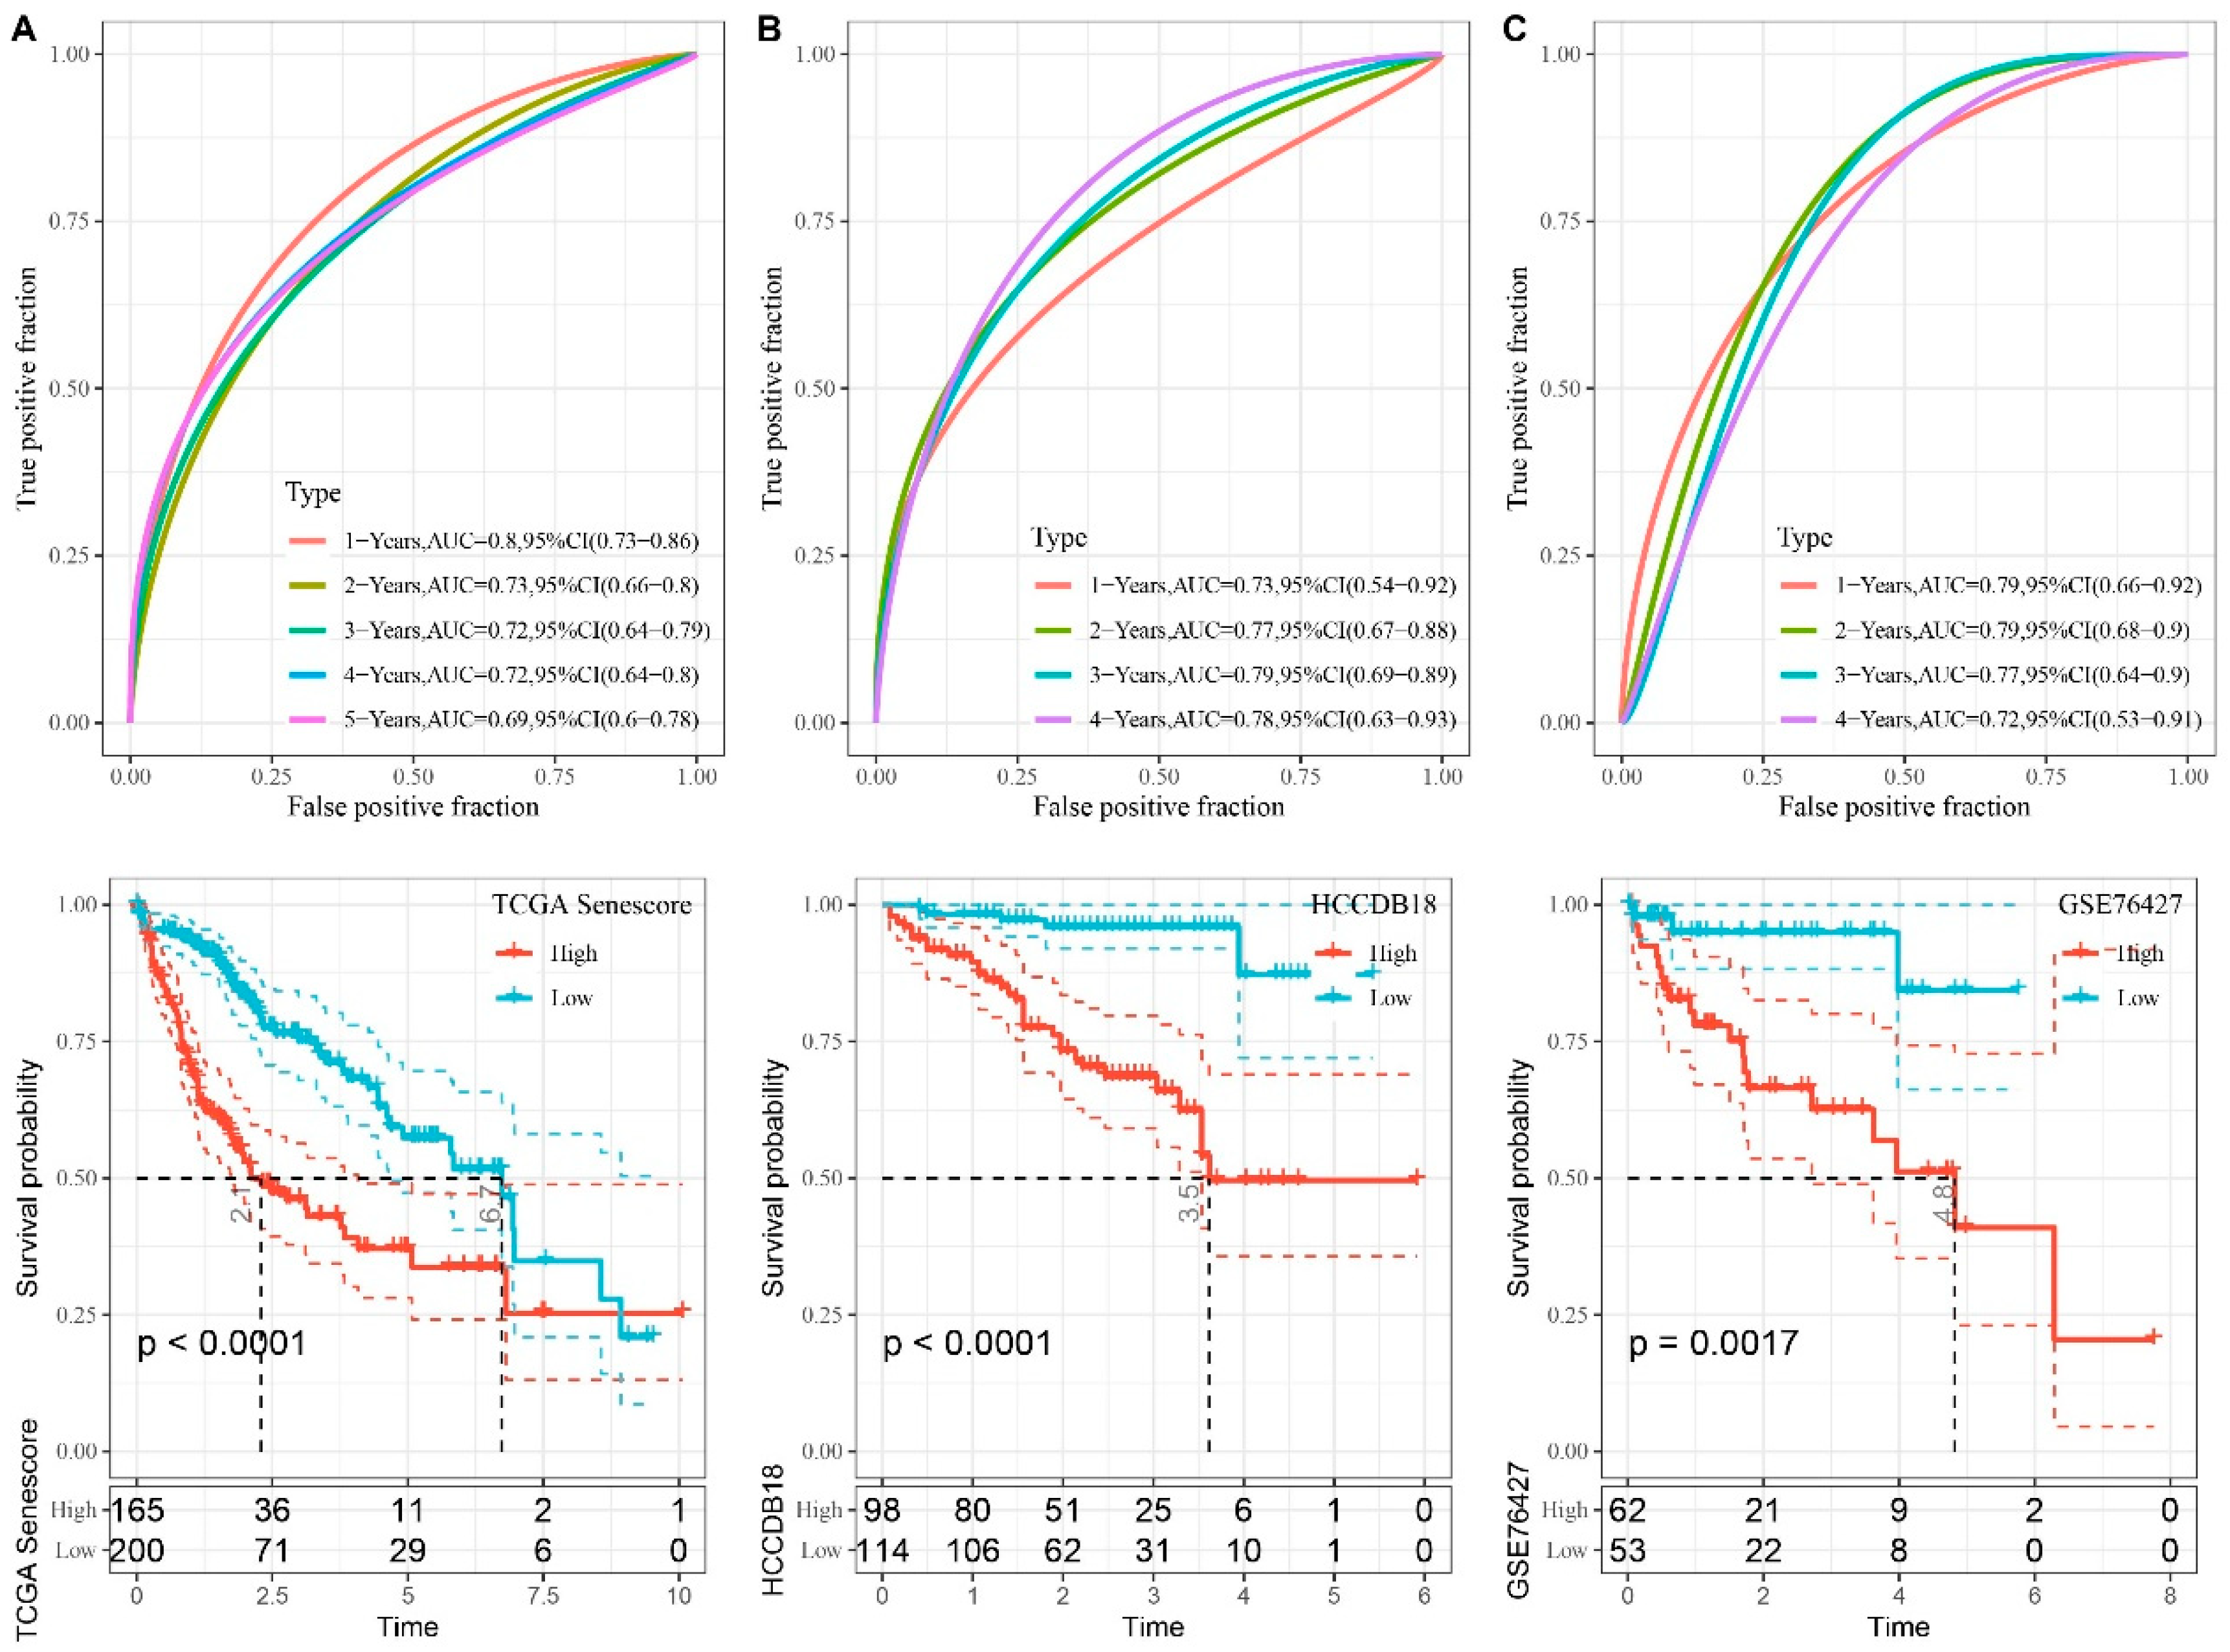
Figure 9.
Association between RiskScore and Clinical Phenotypes and Biomarkers. A–F. Differences in risk scores across clinical phenotypes. Scatter plot demonstrating the correlation between CCP scores and RiskScore (G), between telomerase telomere extension scores and RiskScore (H), between hypoxia scores and RiskScore (I), and between angiogenesis scores and RiskScore (J). K. Heatmap depicting the correlation between immune cell infiltration predicted by CIBERSORT and RiskScore. ns, p ≥ 0.05; p < 0.05; **p < 0.01; ***p < 0.001; ****p < 0.0001.
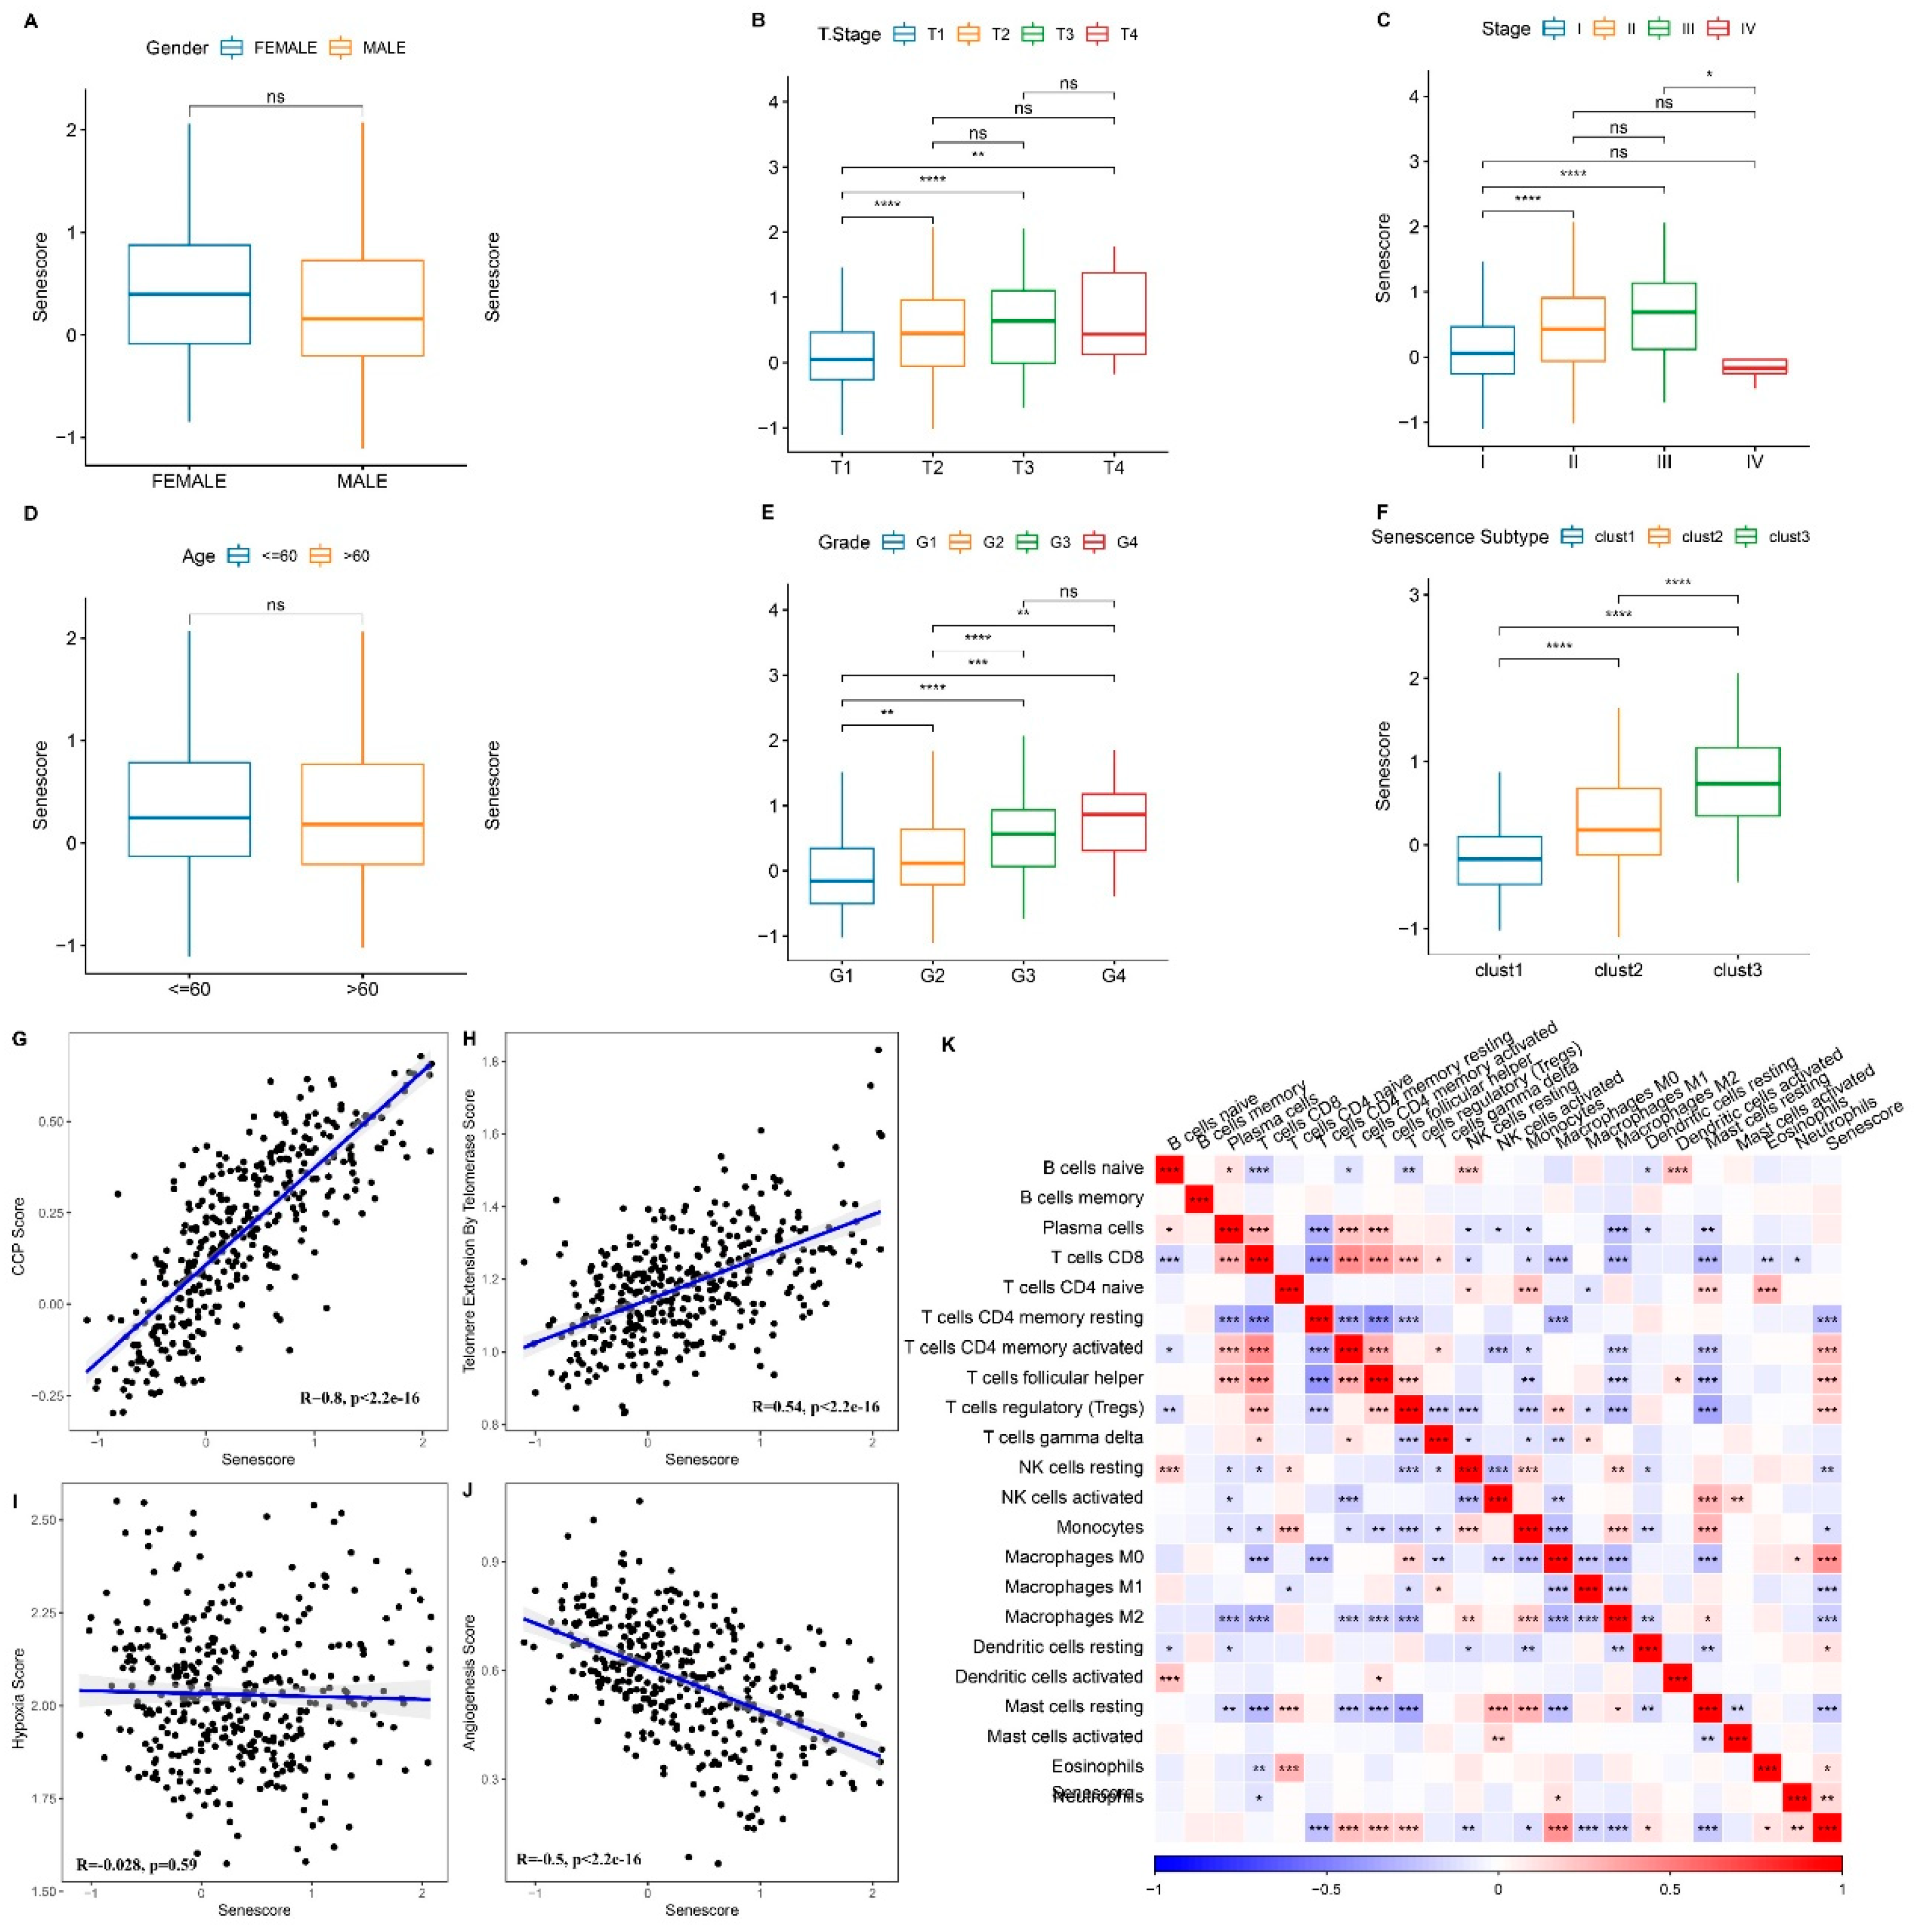
Figure 10.
Exploring RiskScore and its Influence on Immunotherapy and Drug Sensitivity. A. Differential RiskScore among immunotherapy responses. B. Distribution of immunotherapy response among RiskScore groups. C. Prognostic differences among RiskScore groups. Prognostic differences among RiskScore groups in early-stage patients (D) and advanced-stage patients (E). F. Differential drug sensitivity between high and low RiskScore groups in TCGA-LIHC cohort. **p < 0.01; ****p < 0.0001.
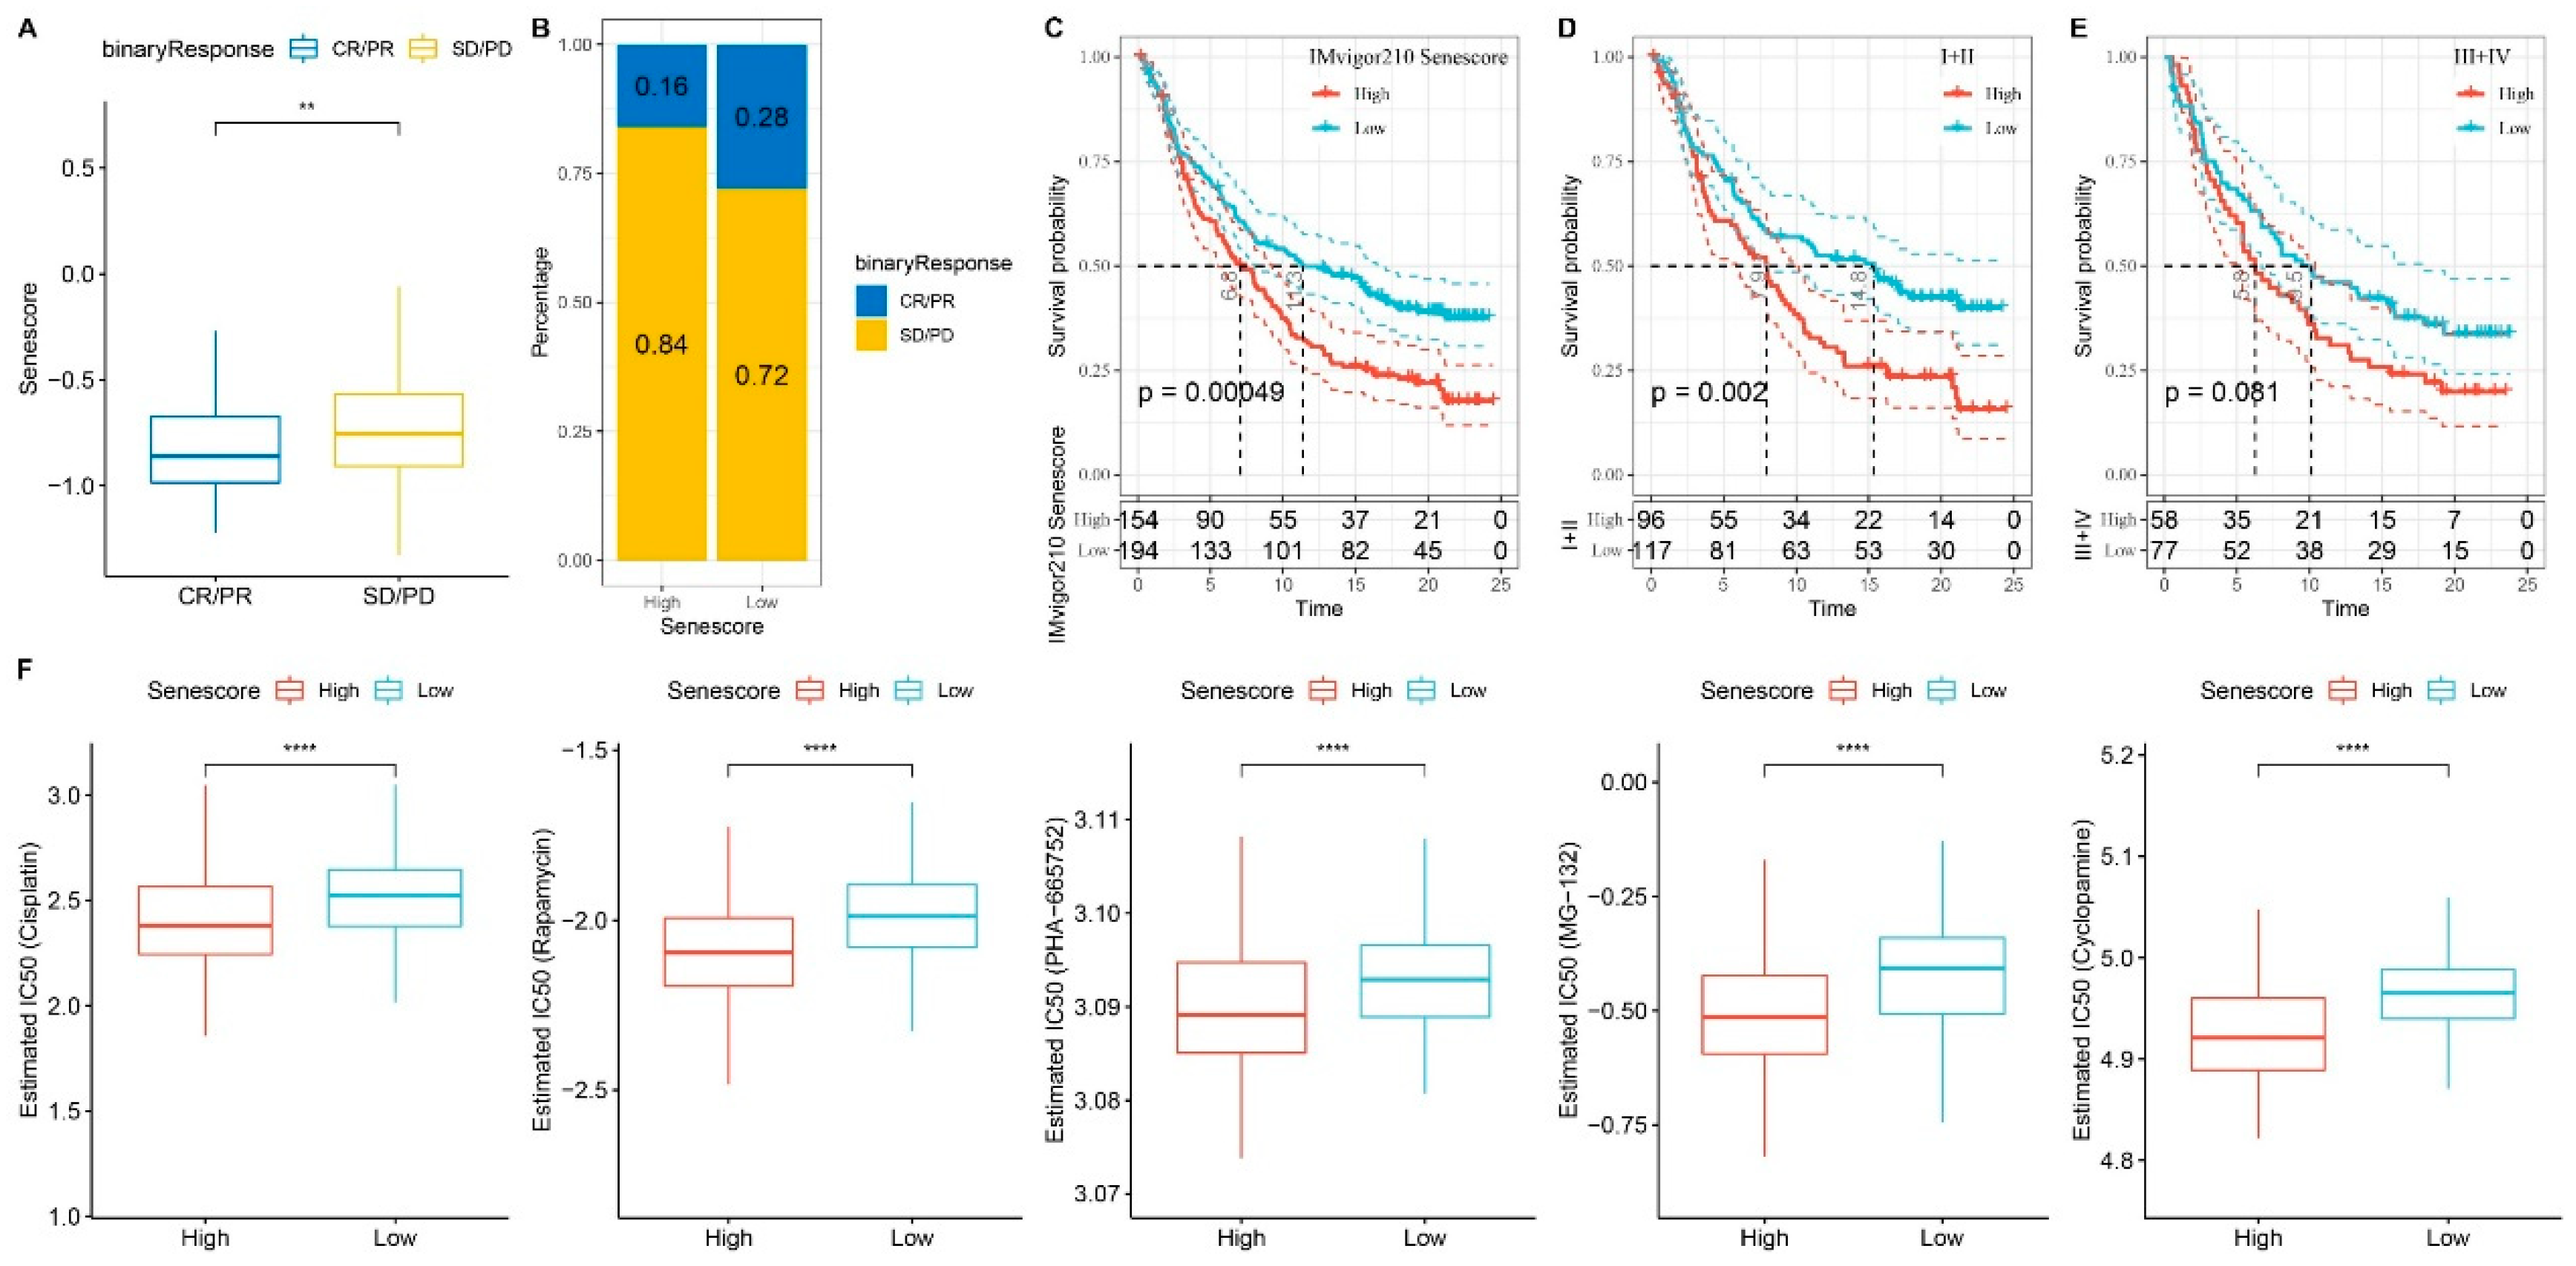
Figure 11.
Statistical Model Analysis of RiskScore and Clinical Clinicopathological Features. Univariate (A) and multivariate (B) Cox analyses of RiskScore and clinical pathological features. C. Nomogram model. D. Calibration curves of the nomogram at one, three, and five years. E. Nomogram decision curve. **p < 0.01; ***p < 0.001.
Disclaimer/Publisher’s Note: The statements, opinions and data contained in all publications are solely those of the individual author(s) and contributor(s) and not of MDPI and/or the editor(s). MDPI and/or the editor(s) disclaim responsibility for any injury to people or property resulting from any ideas, methods, instructions or products referred to in the content. |
© 2023 by the authors. Licensee MDPI, Basel, Switzerland. This article is an open access article distributed under the terms and conditions of the Creative Commons Attribution (CC BY) license (http://creativecommons.org/licenses/by/4.0/).
Copyright: This open access article is published under a Creative Commons CC BY 4.0 license, which permit the free download, distribution, and reuse, provided that the author and preprint are cited in any reuse.


