Submitted:
18 December 2023
Posted:
19 December 2023
You are already at the latest version
Abstract
Honey has been employed for the treatment of wounds and diseases for ancient time, thanks to its antimicrobial and curative properties. This study aims to present the biochemical characteristics, including the amount of sugar, total phenols, phenolic chemicals, antioxidant properties, and antibacterial activities of a specific type of French honey (Sologne summer forest) in comparison with a manuka honey. According to our findings, the Manuka honey tested has 23% fewer polyphenols total than Sologne summer forest honey. The results showed that the Sologne summer honey had a different polyphenols profile than Manuka honey with specific polyphenol like p- Hydroxybenzoic acid. Additionally, the antioxidant activity of the two honeys is comparable (9 μmole Trolox.g-1 honey). Furthermore, the antibacterial activity of the two honeys is comparable against Pseudomonas aeruginosa and Staphylococcus aureus. Our research indicates for the first time that there are significant nutritional and biological potentials for a French honey from the Sologne summer forest.
Keywords:
Antioxidant
; Antibacterial
; Polyphenol
; Sologne summer forest honey
; Manuka Honey
1. Introduction
Honey has been used for wound and disease treatment since ancient times because of its antimicrobial and healing properties (Bogdanov et al., 2008; Molan, 1999). Numerous studies have shown that honey possesses several beneficial biological activities, including antibacterial, antioxidant, ACE-inhibitory, antibrowning, and anti-inflammatory properties (Chang et al., 2011; Liu et al., 2013). Although sugars make up the majority of honey's composition, other minor ingredients such as proteins, minerals, and phenolic compounds also significantly contribute to the honey's biological activities (Moniruzzaman et al., 2013). Honey's biological activities and compositions differ, primarily based on its botanical and geographic origins (Alzahrani et al., 2012). It has been shown that there is a significant correlation between the antioxidant capacity of honey (ORAC), the phenolic content, and the color of honey (Brudzynski and Miotto, 2011). In other words, the darker a honey, the more antioxidant it is. In addition, antioxidant activity is also correlated with antibacterial activity against certain bacteria (Escherichia coli). Thus, chestnut and buckwheat honeys are known to have strong antioxidant potential.
New Zealand Manuka honey is known for its high antibacterial activity due to its high level of non-peroxide compounds, with Methylglyoxal (MGO) being the primary compound responsible for these effects (Beitlich et al., 2014; Mavric et al., 2008). Manuka honey is effective against vancomycin-resistant enterococci (Cooper et al., 2002) and various types of Pseudomonas aeruginosa (Roberts et al., 2019). The non-peroxide components of honey containing hydrogen peroxide and MGO provide the majority of the antibacterial activity (Lu et al., 2013). Mānuka honey also has the highest antioxidant capacity, mainly due to polyphenolic substances like flavonoids and phenolic acids (Deng et al., 2018; Gheldof et al., 2002; Inoue et al., 2005). Manuka honey has been found to protect macrophage cells from oxidative damage by blocking the expression of inflammatory mediators (Gasparrini et al., 2018). Additionally, 16 phenolic compounds in Manuka honey have been found to have protective effects against apoptosis and oxidative damage to lipids and proteins (Alvarez-Suarez et al., 2016). In 2018, Deng also compared the qualities of buckwheat honey (from China) to those of Manuka and showed that they could be equivalent in terms of antioxidant and antibacterial power. Polish honeydew honey is also comparable to Manuka honeys in term of antioxidant properties (Gośliński et al., 2020). From our knowledge, there is no published research on the biological activities of French honey.
The aim of the study is to present the initial findings regarding the biochemical characteristics, antioxidant properties, and antibacterial activities of a specific type of French honey (Sologne summer forest). Additionally, the study aims to compare this honey with a Manuka honey.
2. Material and Methods
2.1. Honeys Samples
Sologne summer honey were provided by Famille VACHER Compagny from an apiary in a chestnut forest in La Ferté Saint Aubain (France) in 2020. 1 kg of Manuka honey from New Zealand (MGO 400+) was supplied by KIWO (French distributor: Europ Labo F-67610 LA WANTZENAU).
2.2. Characterization of Honeys
Physicochemical and melisso-palynological analyses.
The characterization analyses were carried out by AB Labo (COFRAC N°1-5527) in accordance with the EU methods. The electrical conductivity was measured in μS.cm-1 between 154 and 1550 in accordance with decree 02/15/77 P.3. Chromatographic techniques were used to analyze the sugar content of the honey samples. A 60% acetonitrile solution (5 mL) was used to dissolve 0.2g of honey. Following the dissolution, a 0.45 μm syringe filter was used to filter the mixture. To generate the calibration curve, a mixture of fructose, glucose, sucrose, and maltose standards was combined with a 60% acetonitrile solution and then diluted to different concentrations ranging from 0.5 to 30 mg/ml. A Waters e2695 high-performance liquid chromatography (HPLC) system with ELSD was used to determine the sugar content. A Phenomenex NH2 column (4.6 × 250 mm, 5.0 μm) was used for the separation, and the mobile phase consisted of 80/20 acetonitrile/H2O flowing at a rate of 1.0 ml/min. The injection volume was 10 μL, and the column was maintained at 30 °C. The quantitative pollen analyses were carried out by optical microscopy in a measurement range of between 9% and 93% (internal method of the laboratory).
Polyphenols analyze.
The Folin-Ciocalteu technique was used to determine the total phenolic content of honeys (Singleton et al., 1999). Distilled water was used to dilute honey by a factor of ten. One milliliter of this solution was then combined with the same amount of Folin-Ciocalteu reagent and well mixed. Five milliliters of a 1M sodium carbonate solution were added to the solution to make 10 mL. For a further hour, the reaction was incubated at room temperature in the dark. Gallic acid was employed at normal concentrations, and the absorbance was measured at 765 nm. The analysis was done by Lubrizol laboratory.
The characterization and quantification of the main phenolic compounds was carried out by UPLC-DAD-MS (HPLC Agilent Tech, MS Esquire 6000 – Bruker Daltonics) by the POLYPHENOLS BIOTECH laboratory (France). A step of pre-purification of the samples was initially carried out on SPE cartridge to concentrate the sample by removing the sugar. The resulting solutions were filtered on PTFE (0.45 μm) and then injected (1 μL) into a column Agilent C18 column (2.1 mm × 100 mm, 1.8 μm) at a temperature of 25°C. The solvents used are: A = H2O/HCOOH 0.1% and B = ACN/ HCOOH 0,1% at a flow rate of 0.4ml/min. The following (min, (%) B)) elution conditions were used: 0 (1), 0.4 (1), 2 (10), 8 (35), 9 (50), 13 (70), 16 (92), 17.2 (100), 17.4 (1), and 22.2 (1). At the output of the diode barrel detector, the eluance is injected into the mass spectrometer. The analyses are performed in negative and/or positive mode. The spectrum of LC-MS was acquired in full scan, on the entire range of masses (m/z) ranging from 100 to 1400. The data was processed with the software "Hystar" version 3.0.
2.3. Analyzes of Antioxidant and Antibacterial Activities
Antioxidant activity
The antioxidant activity was evaluated by an ORAC test in microplates. AAPH generates free radicals, which lead to the oxidation of the fluorescent indicator protein ‚-PE. Trolox (0–4 μM) was utilized as the standard, and all chemicals were produced in a 75 mmol/L phosphate buffer with a pH of 7.0. The phosphate buffer was used to appropriately dilute the honey samples. First, methanol was used to dissolve quercetin dihydrate (1 μM) as a positive control. Buffer (1:249, v/v) was then added to the mixture. The 1:1 association between Trolox and ORAC value remained unaffected when methanol was utilized in the control sample, blank, and standard. The reaction mixtures contained 100 μL of AAPH (500 mM), 40 μL of 75 mmol/L phosphate buffer (pH 7.0), 60 μL of test chemical, and 1000 μL of ‚-PE (0.92 nmol/L, preincubated for 15 min at 37 °C). Following the addition of AAPH, the plate was automatically shaken for three seconds. Fluorescence was then recorded every two minutes for seventy minutes using a microplate fluorescence reader FL600 (BioTek, Inc., VT) that was kept at 37 °C. The emission and excitation wavelengths were 565 and 540 nm, respectively. The ORAC values, which were reported as μmol Trolox equivalent (TE)/g, were computed. The results are expressed in μmole Trolox/g of honey.
Antibacterial analyzes
The Minimum Inhibitory Concentration (MIC) was determined by the ACM PHARMA laboratory in France. The two strains investigated are Pseudomonas aeruginosa CIP 82.118 (ATCC 9027) and Staphylococcus aureus CIP4.83 (ATCC 6538), which are typical bacteria linked to infections from wounds.
Preparation of strains
Internal cultures of bacteria are stored in inclined agar dishes following the guidelines of instruction I.PH.CON.007. The culture was transferred onto an inclined TSA agar. The culture was then incubated at a temperature range of 30-35°C for a period of 18-24 hours. A suspension of bacteria, with a concentration ranging from 108 to 109 CFU/ml, was prepared using densimat by making necessary adjustments. Consecutive dilutions were made at a ratio of 1/10 in a solution containing 0.85% NaCI, until a concentration of germs ranging from 101 to 102 CFU/mL was achieved. To ascertain the inoculum, 1 ml of the 10-7 dilution (double test) is placed in a petri dish and subsequently mixed thoroughly with 15-20 ml of TSA agar at a temperature of 45°C.
To determine the minimum inhibitory concentration (MIC), a bacterial suspension containing 105-106 CFU/mL was used to inoculate the 96-wells microplate for each bacterial strain. The preparation has been conducted using identical methods for both products. Multiple control measures were conducted simultaneously:
- -
- 1negative control was achieved by introducing 220 µL of unseeded Mueller Hinton broth.
- -
- 9 negative controls were achieved by introducing 220 µL of each dilution of each test product.
- -
- 1 positive control was achieved for each stain by introducing 200 µL of steril Mueller Hinton broth + 20 µL of a suspension of germs titrating between 105 and 106 CFU/ml.
The determination of the Minimum Inhibitory Concentration (MIC) consists in preparing a range comprising 9 dilutions of honey to be tested to frame the supposed value of the MIC.
The honey samples were prepared at different concentrations ranging from 0,7% to 90% (w/v) in Mueller Hinton broth. Typically, 1: 18 grams of the honey was measured and placed in a vial. Then, 2 ml of Mueller Hinton broth were added and vortex to achieve homogenization, resulting in a thick solution with a dark brown color at 90%. The 90% honey solution was then diluted by the 2fold serial dilution method until a final concentration to 0,7%. Within a 96-wells round-bottom microplate, 200 microliters of each product dilution were combined with 20 microliters of bacterial suspension at a concentration of 105-106 CFU/mL. The homogenization of the wells was achieved through the process of suction and repulsion. After being incubated for 18 hours at a temperature of 37°C±1°C, the wells were visually examined to determine if there was any disturbance or not. The wells were all tested using TSA gelose, and the repairing petri dishes were incubated for 24 hours at a temperature of 37°C ± 1°C.
2.4. Statistical Analysis
All statistical analyses were performed using R software (version 1.2.5033). Normality was determined using Shapiro-Wilk test, before using multiple comparisons tests (Mann Whitney U test for non-parametric data, and One or Two-Ways ANOVA with Tukey’s Post Hoc comparisons tests).
3. Results
3.1. Characterization of Honeys
3.1.1. Physicochemical and Melisso-Palynological Analysis
Sologne summer forest honeys
The Sologne honey sample have an electrical conductivity of 815 μS.cm-1. The quantitative pollen analysis is mainly composed of chestnut. The percentage of chestnut pollen is 81%, rare pollens (<9%) are Rosaceae; Apiaceae, Campanulaceae, Trifolium repens, Brassicaceae Labiaceae, Phacelia, Helianthus annuus, Asteraceae, Centaurea cyanus, Parthenocissus Centaureae, Ilex, Ericaceae, Fagopyrum, Borago officinalis, Dipsacaceae, Onagraceae, Ligustrum, and Trifolium pratense.
The sugar concentrations are, respectively, 34.5%, 27.1%, and 0.5% for fructose, glucose, and sucrose. We conclude that the Sologne summer forest honey is blossom honey with a dominance of chestnut.
Manuka honey
Manuka honey has an electrical conductivity of 462 μS.cm-1. This electrical conductivity is slightly lower than the specification threshold for Manuka honey, which must be > 500 μS.cm-1. Quantitative pollen analysis of Manuka honey shows a majority of Manuka pollens. The percentage of pollen of interest is 64%. Rare pollens (<9%) are Asteraceae, Salix, Rosaceae and Lotus. The pollen spectrum analyzed is compatible with a New Zealand origin. Finally, Manuka honey has a rate of 40% fructose, 31% glucose, and an undetected sucrose rate. The sugar levels are therefore in line with expectations for Manuka honey. In conclusion, the Manuka honey used for our study is indeed from New Zealand but presents an atypical profile.
The levels of sucrose (<5%) and the sum of fructose and glucose in both honeys was higher than 60 g/100 g, which is in compliance with the Codex Standards (“Value-added products from beekeeping. Codex standard for honey.,” n.d.).
3.1.2. Polyphenols Analyzes
Total polyphenols
Sologne summer forest honey demonstrates a polyphenol concentration of 492 mg.kg-1 (Table 1). The Manuka honey analyzed in this study shows a polyphenol concentration of 400 mg.kg-1 (Table 1). Scientific literature suggests that typical values for Manuka honey range from 300 to 800 mg.kg-1. The sample of Manuka honey used is therefore in the low range of standard concentrations of polyphenols. In a study by Chang et al. (2011), the overall phenolic content of sixteen types of floral honeys varied from 49 to 1008 mg.kg-1 (Chang et al., 2011). Liu's research also found diverse phenolic content in six different floral honeys, ranging from 307 mg.kg-1 to 822 mg.kg-1 (Liu et al., 2013). Based on our findings, Sologne Summer honey displays a relatively high phenolic content compared to other floral honeys from diverse botanical and geographical sources. Furthermore, Sologne summer honey exhibits a significant increase in polyphenol content compared to Manuka honey (+23%), as indicated by statistical analysis (Anova: F1,4 = 19.71, p-value = 0.011) (Table 1).
Polyphenolic profile
The polyphenols profile of Sologne summer and Manuka honeys are summarized in the Table 2.
We observe 8 different polyphenols in Sologne summer honey, and 6 in Manuka honey. Sologne summer honey is relatively rich and varied profile with, for example, the presence of p- Hydroxybenzoic acid, p-coumaric acid or even shikimic acid in remarkable quantities. The polyphenol profile of Manuka honey (Figure 1A) presents strong disparities compared to that of Sologne honey (Figure 1B). It also seems atypical, because usually we can find polyphenols such as p-hydroxybenzoic acid, p-coumaric acid, qercitin, galangin or even chrysin. Note also the very high concentration of phenyllactic acid, which was the main polyphenol identified in this Manuka honey. To establish a consistent composition associated with its source, it is imperative to conduct a repeatability study encompassing all the physico-chemical, organoleptic, and melliso-palynological analyses.
3.2. Analyzes of Antioxidant and Antibacterial Activities
3.2.1. Antioxidant Activity
Both Manuka and Sologne summer forest honeys have statistically equivalent antioxidant activities (respectively 9 and 8.4 μmole Trolox.g-1 honey, Table 3) (Anova: F1,4 = 0.08, p-value = 0.79). The antioxidant activity of Manuka honey is lower than expected. Usually, Manuka honeys have an ORAC value of 12.4–26.9 µmol TE/g (Anand et al., 2018). Several studies have demonstrated a strong association between the phenolic content and antioxidant activity of honey (Bertoncelj et al., 2007; Ferreira et al., 2009).
3.2.2. Antibacterial Activities
Under the test conditions, the minimum inhibitory concentration of Sologne summer honey and Manuka honey are both 22.5% against the bacteria Pseudomonas aeruginosa and Staphylococcus aureus. Sologne summer honey and Manuka honey therefore have an equivalent antibacterial activity and are in line with the scientific literature (Deng et al., 2018).

Table 4.
minimum inhibitory concentration of Sologne summer honey and Manuka honey against the bacteria Pseudomonas aeruginosa and Staphylococcus aureus. (+) means bacterial growth (cloudy) and presence of bacteria growth after re-picking on culture media (-) means no bacterial growth (clear) and no presence of bacteria growth after re-picking on culture media.
| Wells | Positive control | 1 | 2 | 3 | 4 | 5 | 6 | 7 | 8 | 9 | |
| Initial concentration of honey (%) | 90% | 45% | 22.5% | 11.25% | 5.625% | 2.81% | 1.40% | 0.70% | 0.35% | ||
| Pseudomonas aeruginosa | + | Honey V - Sologne | - | - | - | + | + | + | + | + | + |
| + | Honey Manuka | - | - | - | + | + | + | + | + | + | |
| Staphylococcus aureus | + | Honey V - Sologne | - | - | - | + | + | + | + | + | + |
| + | Honey Manuka | - | - | - | + | + | + | + | + | + | |
| Samples negative control | - | - | - | - | - | - | - | - | - | ||
| Negative control | - | - | - | - | - | - | - | - | - | ||
4. Conclusion
The Sologne summer honey tested can be characterized as a blossom honey with a predominant presence of chestnut. The Manuka honey used in the study is sourced from New Zealand, although it is atypical. Although the physico-chemical and pollen analysis may deviate slightly from the expected standards, the antioxidant and antibacterial test results align well with the existing scientific literature. It was therefore used as the reference Manuka honey for the remainder of the study. The Sologne honey exhibits a polyphenol concentration of 492 mg.kg-1, which is 23% higher than the concentration of Manuka honey used in this study. The polyphenol profiles of Manuka and Sologne honeys exhibit significant disparities, both in terms of their biochemical composition and the quantities of polyphenols present. Sologne honey is characterized by distinct polyphenols, such as shikimic acid, or high concentrations of polyphenols known for their biological activity, such as p-coumaric acid. Both Manuka honey and Sologne honey exhibit substantial antioxidant activity, with a comparable antioxidant power of 8.4 μmole Trolox/g for Sologne summer honey. Both honeys exhibit comparable antibacterial activity, consistent with the scientific literature (with a CMI of 22.5% in the trial against Pseudomonas aeruginosa and Staphylococcus aureus).
In conclusion, even if Sologne summer and Manuka forest honeys have different biochemical profiles, the antioxidant and antibacterial powers of these two honeys are statistically equivalent.
Conflict of interest
The authors declare that they have no known competing financial interests or personal relationships that could have appeared to influence the work reported in this paper. The study was paid by Famille VACHER Compagny.
References
- Alvarez-Suarez, J.M., Giampieri, F., Cordero, M., Gasparrini, M., Forbes-Hernández, T.Y., Mazzoni, L., Afrin, S., Beltrán-Ayala, P., González-Paramás, A.M., Santos-Buelga, C., Varela-Lopez, A., Quiles, J.L., Battino, M., 2016. Activation of AMPK/Nrf2 signalling by Manuka honey protects human dermal fibroblasts against oxidative damage by improving antioxidant response and mitochondrial function promoting wound healing. J. Funct. Foods 25, 38–49. [CrossRef]
- Alzahrani, H.A., Alsabehi, R., Boukraâ, L., Abdellah, F., Bellik, Y., Bakhotmah, B.A., 2012. Antibacterial and Antioxidant Potency of Floral Honeys from Different Botanical and Geographical Origins. Molecules 17, 10540–10549. [CrossRef]
- Anand, S., Pang, E., Livanos, G., Mantri, N., 2018. Characterization of Physico-Chemical Properties and Antioxidant Capacities of Bioactive Honey Produced from Australian Grown Agastache rugosa and its Correlation with Colour and Poly-Phenol Content. Molecules 23, 108. [CrossRef]
- Beitlich, N., Koelling-Speer, I., Oelschlaegel, S., Speer, K., 2014. Differentiation of manuka honey from kanuka honey and from jelly bush honey using HS-SPME-GC/MS and UHPLC-PDA-MS/MS. J. Agric. Food Chem. 62, 6435–6444. [CrossRef]
- Bertoncelj, J., Doberšek, U., Jamnik, M., Golob, T., 2007. Evaluation of the phenolic content, antioxidant activity and colour of Slovenian honey. Food Chem. 105, 822–828. [CrossRef]
- Bogdanov, S., Jurendic, T., Sieber, R., Gallmann, P., 2008. Honey for Nutrition and Health: A Review. J. Am. Coll. Nutr. 27, 677–689. [CrossRef]
- Brudzynski, K., Miotto, D., 2011. The relationship between the content of Maillard reaction-like products and bioactivity of Canadian honeys. Food Chem. 124, 869–874. [CrossRef]
- Chang, X., Wang, J., Yang, S., Chen, S., Song, Y., 2011. Antioxidative, antibrowning and antibacterial activities of sixteen floral honeys. Food Funct. 2, 541–546. [CrossRef]
- Cooper, R.A., Molan, P.C., Harding, K.G., 2002. The sensitivity to honey of Gram-positive cocci of clinical significance isolated from wounds. J. Appl. Microbiol. 93, 857–863. [CrossRef]
- Deng, J., Liu, R., Lu, Q., Hao, P., Xu, A., Zhang, J., Tan, J., 2018. Biochemical properties, antibacterial and cellular antioxidant activities of buckwheat honey in comparison to manuka honey. Food Chem. 252, 243–249. [CrossRef]
- Ferreira, I.C.F.R., Aires, E., Barreira, J.C.M., Estevinho, L.M., 2009. Antioxidant activity of Portuguese honey samples: Different contributions of the entire honey and phenolic extract. Food Chem. 114, 1438–1443. [CrossRef]
- Gasparrini, M., Afrin, S., Forbes-Hernández, T.Y., Cianciosi, D., Reboredo-Rodriguez, P., Amici, A., Battino, M., Giampieri, F., 2018. Protective effects of Manuka honey on LPS-treated RAW 264.7 macrophages. Part 2: Control of oxidative stress induced damage, increase of antioxidant enzyme activities and attenuation of inflammation. Food Chem. Toxicol. 120, 578–587. [CrossRef]
- Gheldof, N., Wang, X.-H., Engeseth, N.J., 2002. Identification and quantification of antioxidant components of honeys from various floral sources. J. Agric. Food Chem. 50, 5870–5877. [CrossRef]
- Gośliński, M., Nowak, D., Kłębukowska, L., 2020. Antioxidant properties and antimicrobial activity of manuka honey versus Polish honeys. J. Food Sci. Technol. 57, 1269–1277. [CrossRef]
- Inoue, K., Murayama, S., Seshimo, F., Takeba, K., Yoshimura, Y., Nakazawa, H., 2005. Identification of phenolic compound in manuka honey as specific superoxide anion radical scavenger using electron spin resonance (ESR) and liquid chromatography with coulometric array detection. J. Sci. Food Agric. 85, 872–878. [CrossRef]
- Liu, J.-R., Ye, Y.-L., Lin, T.-Y., Wang, Y.-W., Peng, C.-C., 2013. Effect of floral sources on the antioxidant, antimicrobial, and anti-inflammatory activities of honeys in Taiwan. Food Chem. 139, 938–943. [CrossRef]
- Lu, J., Carter, D.A., Turnbull, L., Rosendale, D., Hedderley, D., Stephens, J., Gannabathula, S., Steinhorn, G., Schlothauer, R.C., Whitchurch, C.B., Harry, E.J., 2013. The Effect of New Zealand Kanuka, Manuka and Clover Honeys on Bacterial Growth Dynamics and Cellular Morphology Varies According to the Species. PLOS ONE 8, e55898. [CrossRef]
- Mavric, E., Wittmann, S., Barth, G., Henle, T., 2008. Identification and quantification of methylglyoxal as the dominant antibacterial constituent of Manuka (Leptospermum scoparium) honeys from New Zealand. Mol. Nutr. Food Res. 52, 483–489. [CrossRef]
- Molan, P.C., 1999. Why honey is effective as a medicine. I. Its use in modern medicine. Bee World 80, 80–92. [CrossRef]
- Moniruzzaman, M., Sulaiman, S.A., Khalil, M., Gan, S., 2013. Evaluation of physicochemical and antioxidant properties of sourwood and other Malaysian honeys: A comparison with manuka honey. Chem. Cent. J. 7, 138. [CrossRef]
- Roberts, A.E.L., Powell, L.C., Pritchard, M.F., Thomas, D.W., Jenkins, R.E., 2019. Anti-pseudomonad activity of manuka honey and antibiotics in a specialized ex vivo model simulating cystic fibrosis lung infection. Front. Microbiol. 10. [CrossRef]
- Singleton, V.L., Orthofer, R., Lamuela-Raventós, R.M., 1999. [14] Analysis of total phenols and other oxidation substrates and antioxidants by means of folin-ciocalteu reagent, in: Methods in Enzymology, Oxidants and Antioxidants Part A. Academic Press, pp. 152–178. [CrossRef]
- Value-added products from beekeeping. Codex standard for honey. [WWW Document], n.d. URL https://www.fao.org/3/w0076e/w0076e30.htm (accessed 12.12.23).
Figure 1.
UPLC-DAD chromatogram at 280nm for Manuka honey (A) and Sologne honey (B).
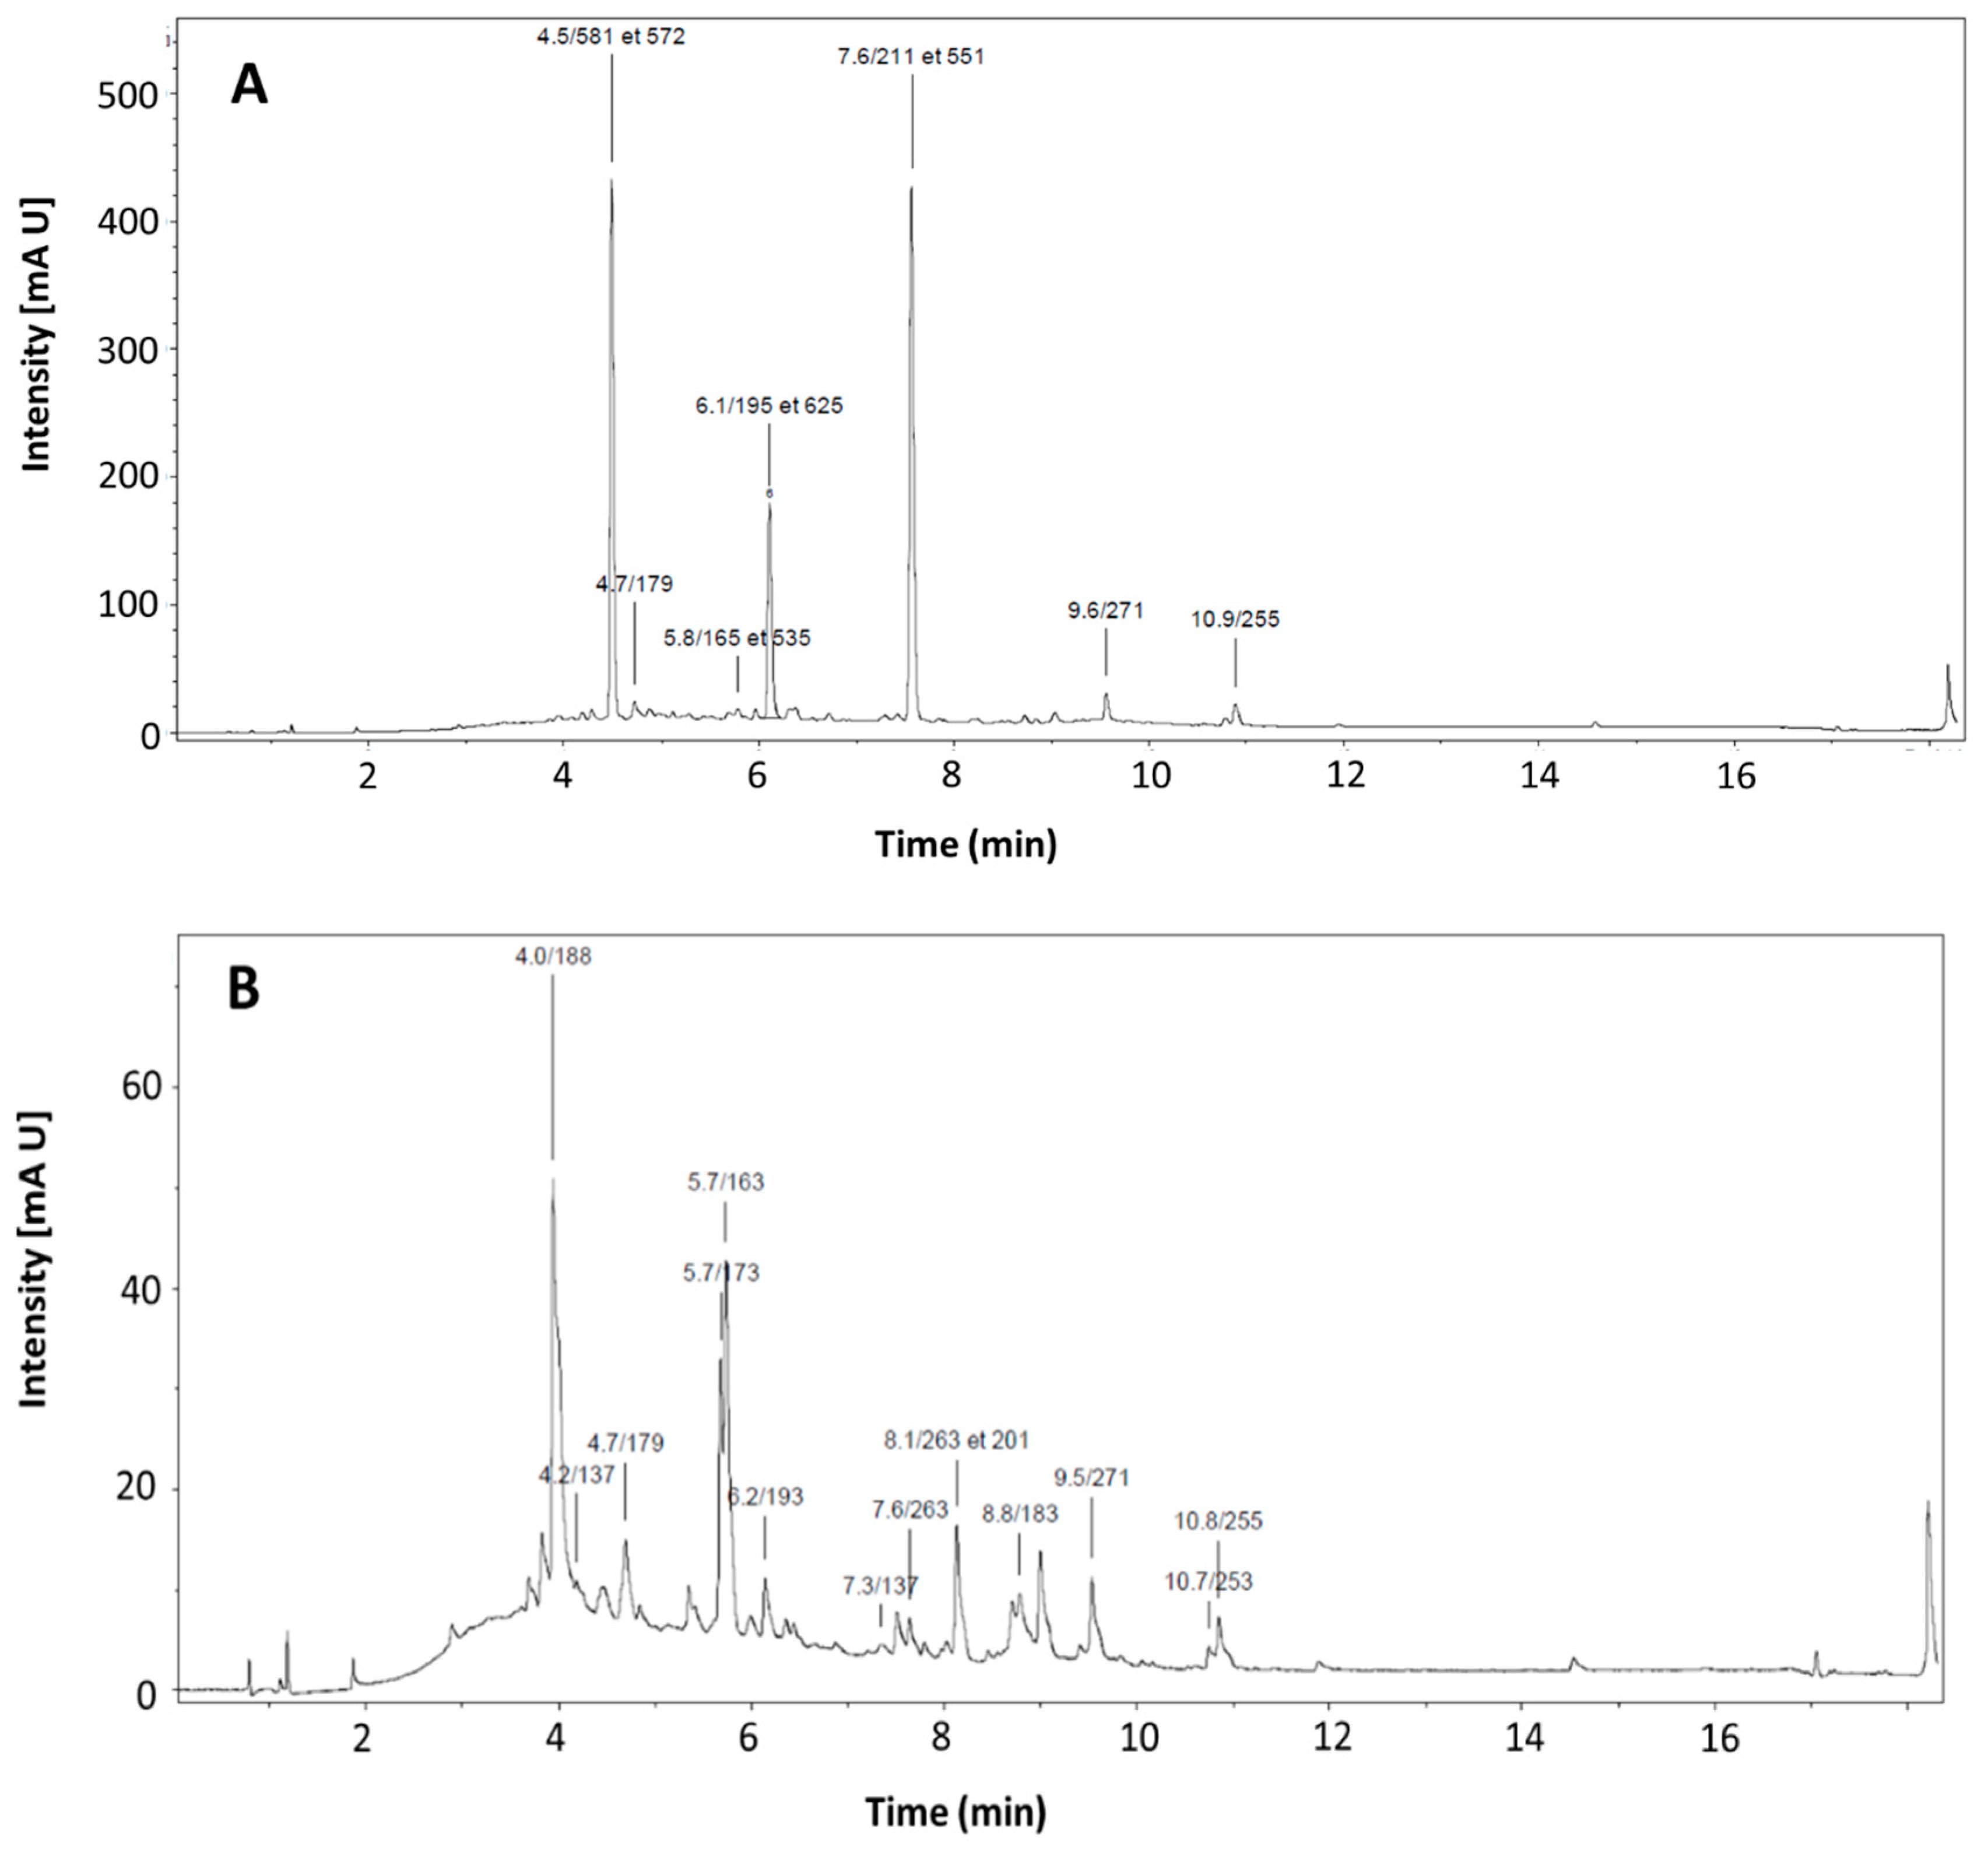
Table 1.
Determination of total polyphenols (mg.g-1 honey) by the Folin-Cioclateu method.
| Reference | Sample | Total concentration of polyphenols |
| E2203 | Manuka Honey | 0.400 ± 0.005* |
| E2204 | Sologne Honey | 0.492 ± 0.014 |
* n = 3 replicates for each honey, Anova: F1,4 = 19.71, p-value = 0.011.
Table 2.
Characterization and quantification of polyphenols (mg.kg-1). *Different letters represent significative differences between concentrations of a same polyphenol (Tukey’s Post Hoc test, p > 0.05).
Table 2.
Characterization and quantification of polyphenols (mg.kg-1). *Different letters represent significative differences between concentrations of a same polyphenol (Tukey’s Post Hoc test, p > 0.05).
| Polyphenols | Sologne Honey | Manuka Honey |
| Leptosin | - | 15.06 ± 0.44a |
| p-Hydroxybenzoic acid | 1.38 ± 0.04a | - |
| Caffeic acid | 3.02 ± 0.12a | 2.00 ± 0.11c |
| p-coumaric acid | 9.13 ± 0.51a | - |
| shikimic acid | 7.47 ± 0.61a | - |
| Salicylic acid | 1.98 ± 0.13a | - |
| Phenyllactic Acid + Dev Leptosin | - | 218.38 ± 6.64a |
| Methoxyphenyllactic acid | - | 43.09 ± 0.70a |
| Pinobanskine | 3.26 ± 0.16a | 6.28 ± 0.20c |
| Chrysina | 0.15 ± 0.05a | - |
| Pinocembrin | 1.91 ± 0.09a | 4.26 ± 0.15c |
Table 3.
Antioxidant activity (µmole Trolox.g-1 honey). n = 3 replicates for each honey, Anova: F1,4 = 0.08, p-value = 0.79*.
Table 3.
Antioxidant activity (µmole Trolox.g-1 honey). n = 3 replicates for each honey, Anova: F1,4 = 0.08, p-value = 0.79*.
| Sample | Antioxidant activity |
| Manuka Honey | 9.00 ± 0.52* |
| Sologne Honey | 8.43 ± 0.87 |
Disclaimer/Publisher’s Note: The statements, opinions and data contained in all publications are solely those of the individual author(s) and contributor(s) and not of MDPI and/or the editor(s). MDPI and/or the editor(s) disclaim responsibility for any injury to people or property resulting from any ideas, methods, instructions or products referred to in the content. |
© 2023 by the authors. Licensee MDPI, Basel, Switzerland. This article is an open access article distributed under the terms and conditions of the Creative Commons Attribution (CC BY) license (http://creativecommons.org/licenses/by/4.0/).
Copyright: This open access article is published under a Creative Commons CC BY 4.0 license, which permit the free download, distribution, and reuse, provided that the author and preprint are cited in any reuse.


