1. Introduction
Liquid argon (LAr) technology is widely used by many previous and current neutrino experiments, such as MicroBooNE [
1], ArgoNeuT [
2], ICARUS [
3], and it is also planned to be employed by future experiments such as SBND [
4], as well as one of the next-generation large-scale neutrino experiments DUNE [
5]. Neutrinos are mostly detected by their interactions with argon nuclei, in which many types of hadrons are involved, including both the knockout of nucleons, and the production of mesons. These neutrino-induced hadrons can also interact with nucleons before they escape the nucleus. This may change the kinematics and types of final-state particles that are detected, which complicates the reconstruction of neutrino interactions. These are known as final-state interaction (FSI) effects. In addition, the propagation and further interactions of these final-state hadrons also need to be simulated properly. Therefore, the knowledge of hadron-argon cross sections is required, which is useful to inform FSI and improve simulations as well as their associated uncertainties.
However, there is little experimental data available on argon, and the predictions are mostly derived by interpolating cross-section results from lighter and heavier nuclei [
6], such as carbon, sulfur, and iron, which have more data available [
7,
8,
9,
10]. In those experiments, the common setup is to implement a beam of a certain type of hadron of interest, and shoot the beam towards a thin target of the material of interest. The survival rate of the beam hadron after the thin target can be measured and be used to calculate the cross section. The increasing popularity of LAr-based detectors has motivated efforts towards making cross-section measurements on LAr. The LArIAT collaboration proposed the thin-slice method to measure hadron-argon cross section using a LAr time projection chamber (LArTPC) [
11], which itself can no longer be considered as a thin target of LAr for hadrons. The precise track reconstruction of LArTPC enables researchers to hypothetically divide the detector into several thin slices, and each slice can be considered as an independent thin-target measurement.
The original method treats the measured cross section in each bin independently, and performs an effective correction in each bin to account for inefficiency and bin migration caused by detector resolution. We keep the essential idea of the thin-slice method, and further develop the method with more rigorous statistical procedures, including using multi-dimensional unfolding to consider the full correlations of different measurements. In this paper,
Section 2 shows the derivation of the cross-section formula, and
Section 3 describes the slicing method in more details.
Section 4 describes the measurement procedures on a simplified simulation sample, where all results are derived using an IPython notebook, referred to as
hadron-Ar_XS [
12]. Some further discussions on the results as well as summary are given in
Section 5.
2. Cross-section formula
The total cross section
as a function of the incident particle’s kinetic energy
E1 is defined according to
where
denotes the particle beam flux, and
is the infinitesimal reduction of flux.
n is the number density of the target material. By moving
, the infinitesimal path length of the particle inside the material, to the right-hand side of Equation
1, and then integrating both sides, we get
where
is the path length integral. This assumes the cross section
remains constant within the variation of
E during its passage of
.
2 For a certain area and a certain period of time, the number of surviving particles detected is proportional to the outgoing particle flux, and thus we have
We can also define the number of interacting particles as
. Therefore, after measuring the number of incident particles and the number of surviving particles, the total cross section can be calculated as
When it comes to the exclusive cross section
3, we denote
a as the signal interaction, and
b as all the other interactions, and thus we have
, where
is the reduction of flux due to the signal interaction. Also we have
. Separating
based on the type of interactions into
in Equation
4, we get
and
in Equation
5 are not separable given the logarithm function at the right-hand side. Only when
, which implies that
is very small, and the thin-target approximation holds, then we can use the approximation
and get
Therefore, we have
which is in fact a direct implication from the definition of exclusive cross-section
However, in the slicing method described in
Section 3,
in each slice we used to calculate
is not necessarily small. Therefore, we seek to get an unbiased cross-section formula without the thin-target approximation. From Equation
1 and
8, we have
For a finite
, we can estimate this relationship as
where
is the effective mean value for the cross section within the variation of
E during the passage of
.
4 Therefore, combining with Equation
4, we have the expression for any channel
a as
Because we can never measure
in an infinitely small
E bin, we will express
as
in the following sections. In the thin-target approximation,
, Equation
11 can be approximated to Equation
7.
3. Slicing method
A LArTPC cannot be seen as a thin target in terms of hadrons, whose mean free path in LAr is on the order of 10 to 100 cm. However, thanks to its high-resolution track reconstruction ability, the LArIAT collaboration proposed the thin-slice method [
11], where they hypothetically divide the detector into several slices along the hadron beam direction. Each slice is viewed as a thin target, with a width of several millimeters based on the spacing of the sensing wires. When detecting tracks in the TPC, each slice serves as an independent thin-target experiment. By detecting where the track ends, we know where the interaction happens, and thus fill in the corresponding energy bins of
and
, which are used to calculate the cross section. The final results are rebinned to wider energy bins such as 50 MeV in order to gain statistics.
Based on the thin-slice method, Ref [
13] based on a study on the ProtoDUNE-SP experiment [
14] first proposed the idea of energy-slicing, where each energy bin is directly considered as a slice, since the cross section is measured as a function of the kinetic energy of the incident particle.
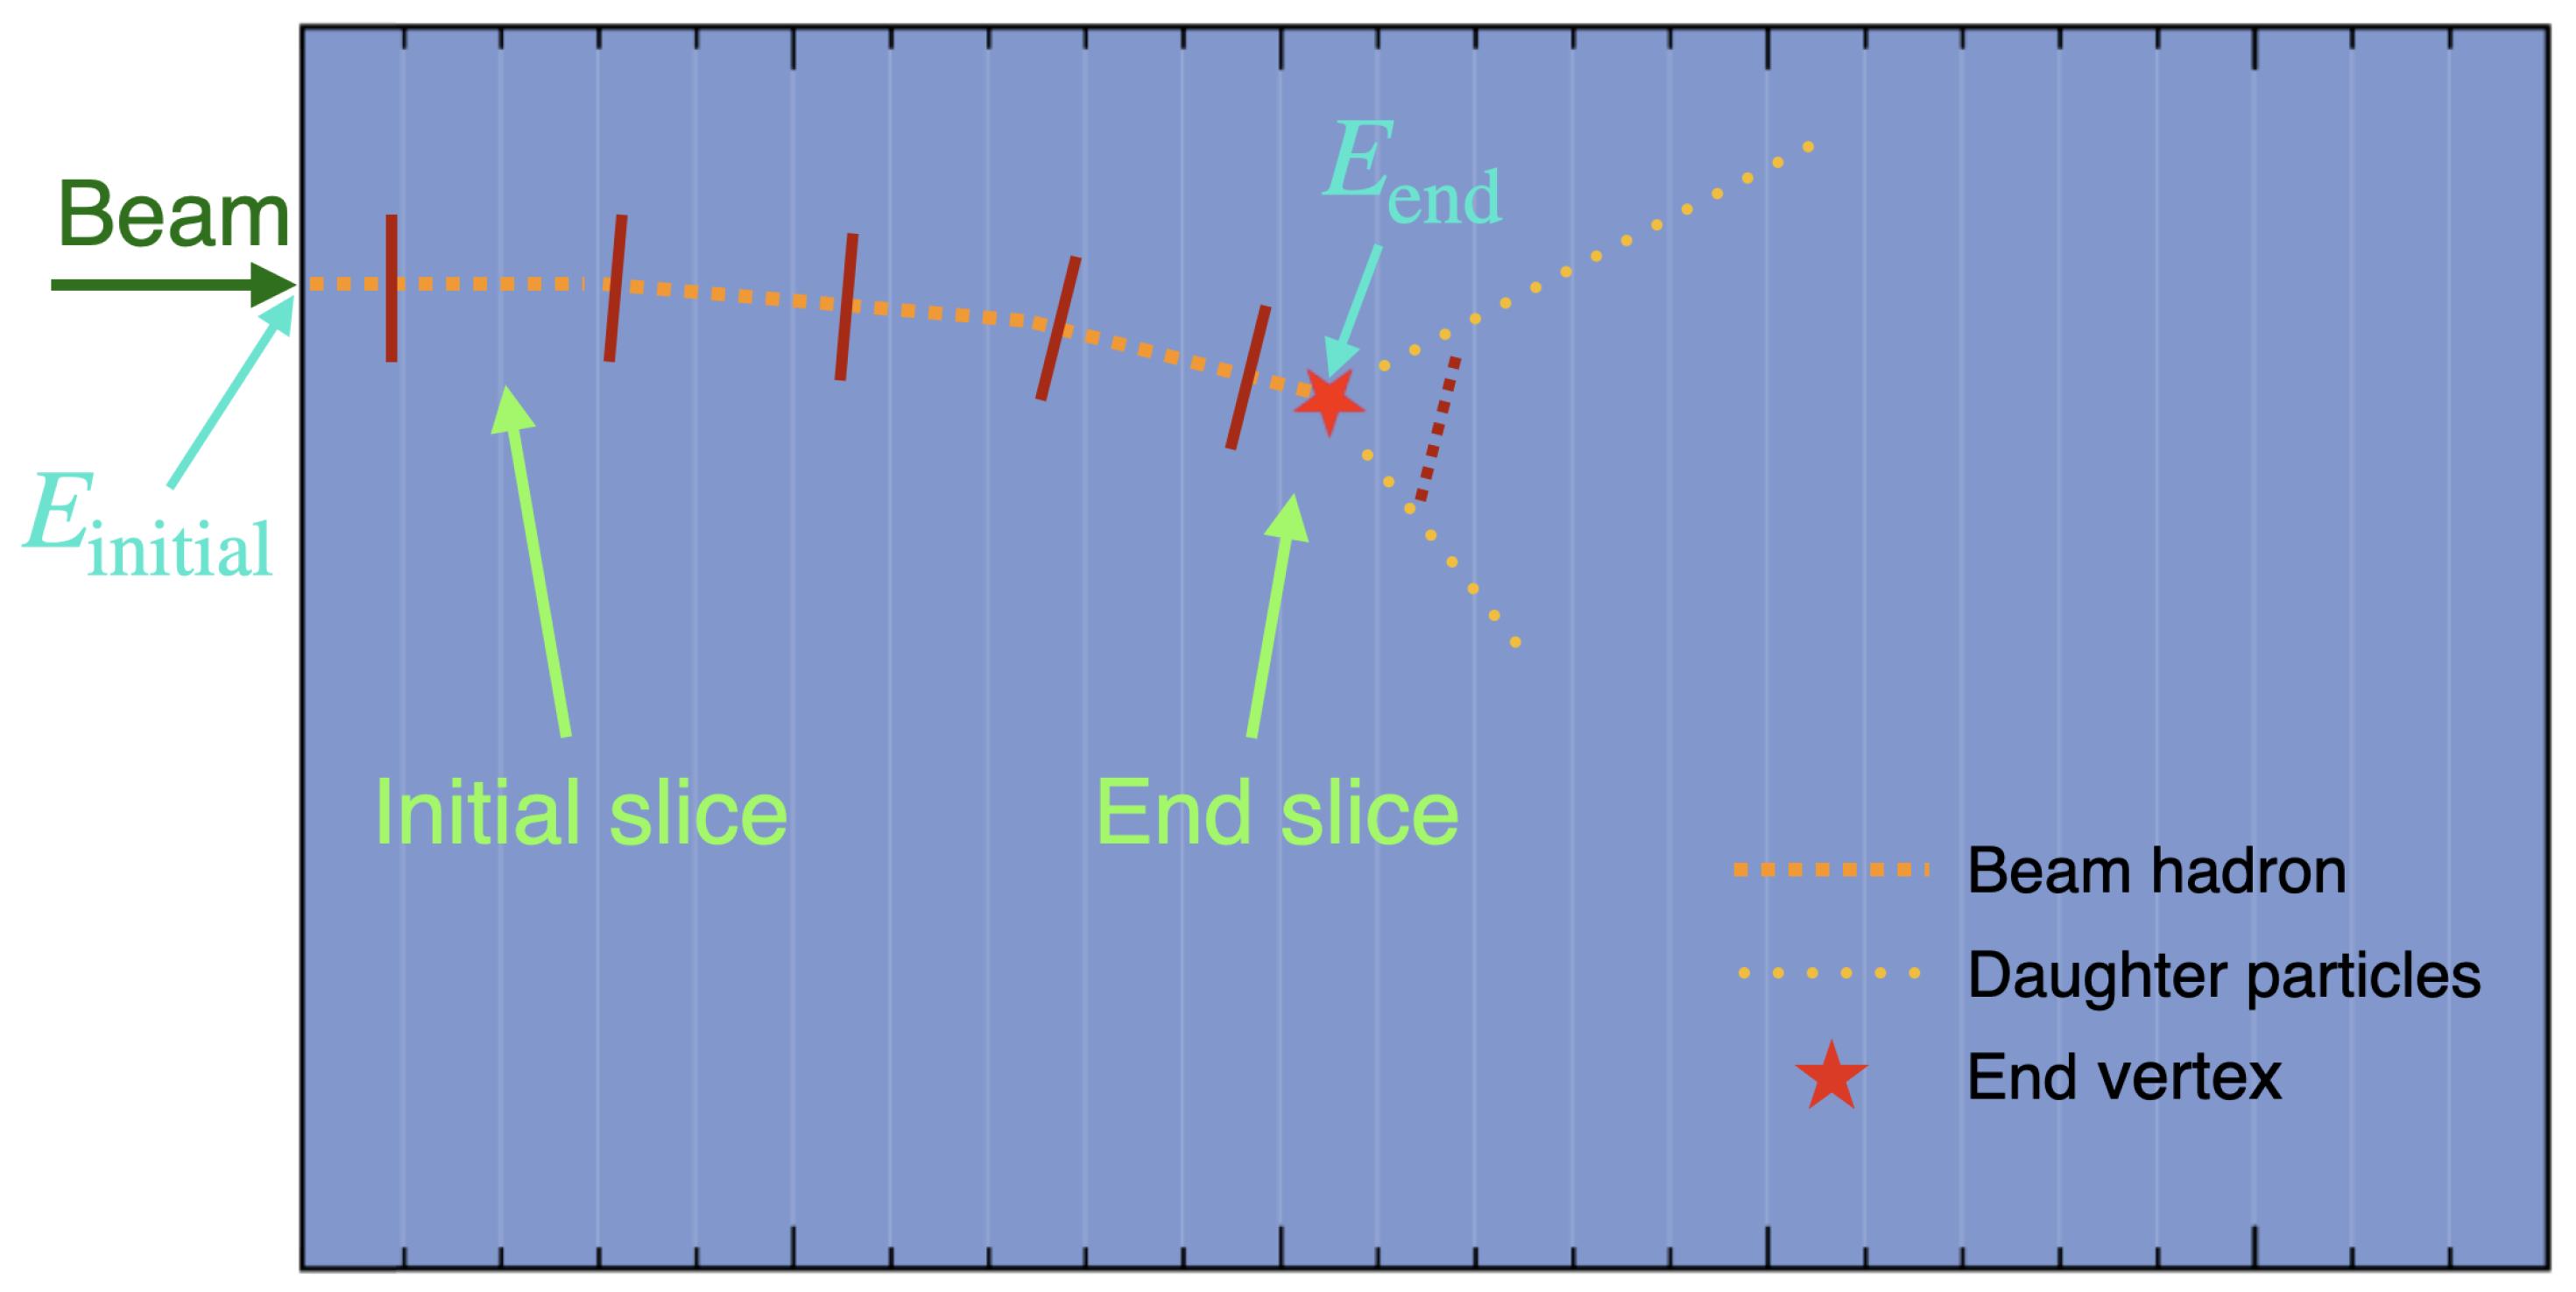
5 Figure 1 shows an illustration of a LArTPC. A beam hadron is incident from the left side of the detector, and leaves a track inside the detector. The beam hadron track ends at the end vertex, where either an interaction occurs or the hadron comes to rest, potentially producing some daughter particles, which can be used to determine the type of the interaction. The kinetic energy of the beam hadron when it enters the detector is denoted as
, which is known from beam and it approximately follows a Gaussian distribution given the momentum spread. The kinetic energy of the beam hadron at the end vertex is denoted as
. Given these two energies, the track can be divided into several slices based on the pre-defined energy bins. The bin edges are indicated by dark red bars in
Figure 1, where the last bar is dashed because the beam hadron does not reach that energy. As shown in
Figure 1, the first complete slice is referred to as the initial slice; the slice which has the end vertex is referred to as the end slice. If the interaction occurring at the end vertex is a signal interaction, then the end slice is also referred to as the interaction slice.
The piece of track prior to the initial slice is referred to as an incomplete slice, which will not be used. On the contrary, is inside the end slice.
For convenience, we define the slice index
from 1 to the number of energy bins
N, starting with the highest energy bin. Therefore, for each beam hadron track, there is an initial slice index
, an end slice index
, as well as an interaction slice index
, which is assigned as null if the interaction occurring at the end vertex is not the signal interaction. In addition, if the end vertex is inside the incomplete slice, then the whole track is not usable, and thus the indices for all three slices will be assigned as null. For a sample of events with a beam hadron track in the detector, the distribution of
forms the initial histogram
, and similarly we have the end histogram
and the interaction histogram
. We also define the incident histogram
, which will later appear in the cross section formula
14. Each bin of
counts the number of tracks which reach the energy corresponding to the slice index
, and thus we say the tracks are incident to that slice. Note, for
, one event is likely to contribute to multiple bins, since a track can be incident to a sequence of slices until it interacts. In the thin-slice method, for each track, we fill
into
and
into
, while
is filled from
to
.
can also be calculated by the derived
and
as
6 [
13]
The two expressions are equivalent given
which equals the total number of beam hadron events. Given the relationship between the slice index
and the energy
E by definition, all of these histograms can also be given as energy histograms.
Comparing to Equation
11, replacing
with
,
with
,
with
, and also,
with
, we derive the cross section for the signal interaction in each energy bin is given by
where
is the energy bin width, and
is the stopping power of the hadron in LAr. Therefore, for each beam hadron event, three properties are needed, which are
,
, and whether or not it is the signal interaction, in order to derive the slice index for
,
, and
. This allows us to treat the three indices as a combined 3D variable, and thus enabling the multi-dimensional unfolding discussed in
Section 4.3 and
Section 4.4.
5. Discussions and summary
In the previous section, we described how to extract the true cross section of the simulation sample, as well as how to measure the cross section of a data sample.
is calculated in both cases, which is used to quantify the consistency against the simulation curve. In order to further test the results, we perform toy studies. 400 simulation samples, referred to as toys, each with a sample of 10000 events, are generated in the same way as what is described in
Section 4. The true cross section as well as its covariance matrix is calculated in each toy simulation sample. For each cross-section bin, we calculate the pull value of each toy, which is defined as
where
is the uncertainty for
. In each bin, the pull values are expected to follow a normal distribution.
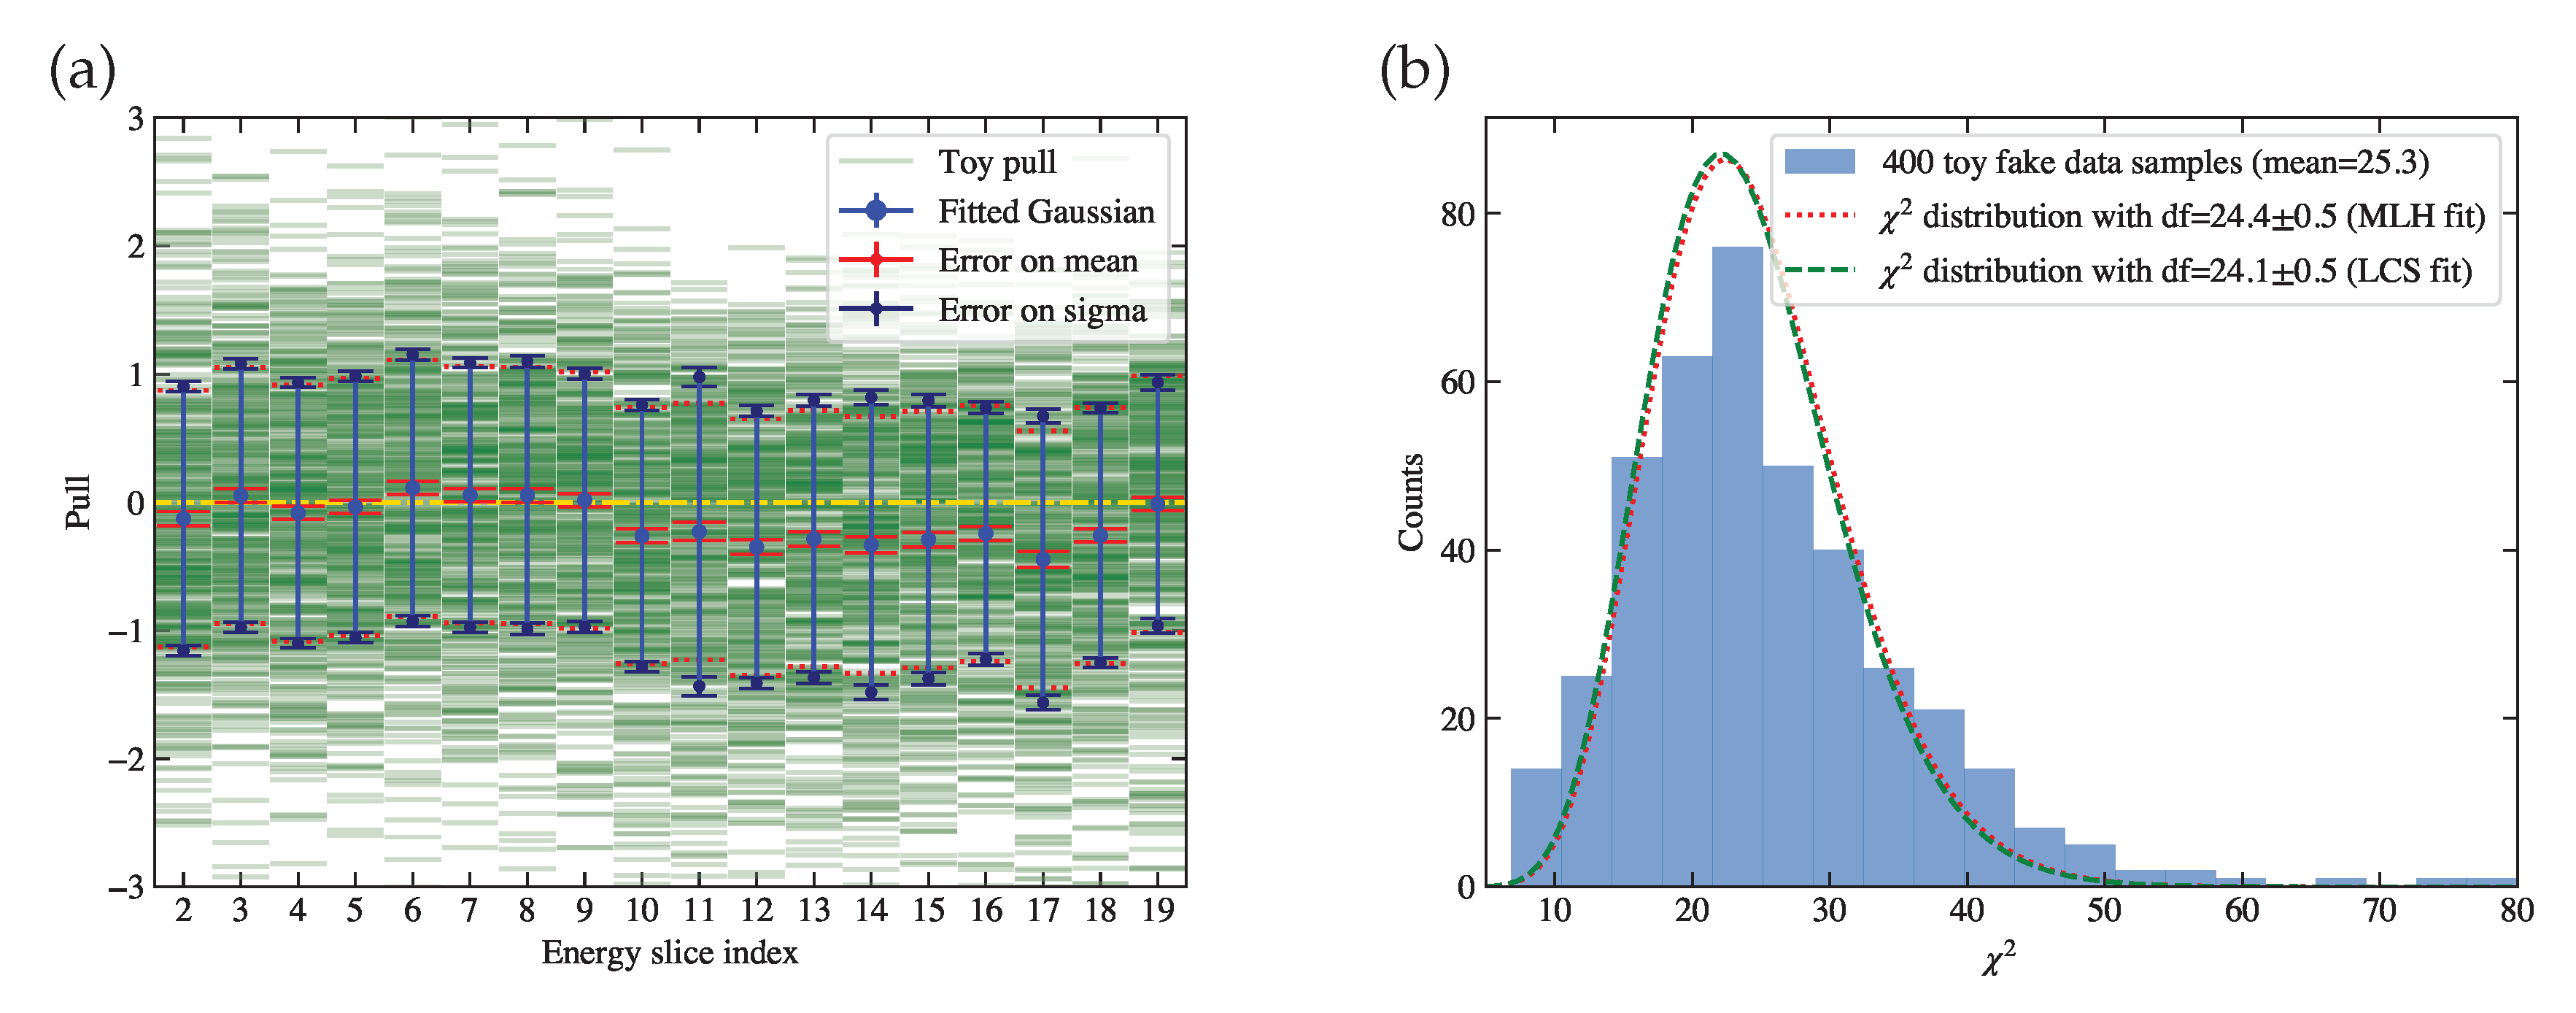
Figure 14 (a) shows the test results, where a Gaussian distribution is fitted on the pull histograms in each cross-section bin as shown as the blue error bars. By visually comparing with the reference lines, we can see they are generally consistent with the expectation that each of them centers at 0 and has a bar length of 1, corresponding to the two parameters in the Gaussian fit. As another test, which takes into account the covariance among cross-section bins, we show in
Figure 14 (b) the histogram of
calculated according to Equation
15 for each toy. A
distribution is fitted on the histogram, whose degree of freedom
, as shown in the legend, is consistent with the expectation, which is 18 as the number of cross-section bins. These tests serve as a validation of the slicing method. They also suggests that given the current statistics of events in each toy, the bias caused by the imperfection of the model
20 is insignificant.
Similarly, we generate 400 toy fake data samples, each with a sample of 10000 events before selection, in order to study the performance of the procedures to measure the cross section. The 400 toy simulation samples used above are combined into a total of 4000000 events, in order to model the response matrix as well as the efficiency plot for each toy fake data sample, and thus we can ignore the statistical uncertainty of the simulation sample. The cross section is measured for each toy fake data sample, and we can also derive the pull distributions in each cross-section bin as well as the histogram of
, as shown in
Figure 15. In subplot (a), we can see the lengths of blue error bars are generally consistent with 1, but some of their central points show a small bias away from 0. This bias is also referred to as unfolding error. The general unfolding results is effectively applying a re-smearing matrix on the truth information [
21]. Treating the re-smeared truth as truth introduces an unfolding error, which can be eliminated by publishing the re-smearing matrix. In addition, the unfolding error tends to be smaller when the regularization becomes weaker with a greater number of iterations. As a result, since we do not include biases, the derived
distribution in
Figure 15 (b) is larger.
In the fake data toy study, the simulation sample used to model the response matrix and the efficiency plot is consistent with the toy fake data samples, because they are generated in the same way. When it comes to real data, we need to consider the uncertainties caused by the differences between data and simulation, which can be estimated by fluctuating the relevant parameters of the simulation sample. Additional model validation procedure is essential to examine the compatibility between data and simulation to ensure the differences are within the quoted simulation uncertainties.
In summary, a method as well as the corresponding procedures for the hadron-argon cross section measurement in a LArTPC detector is provided in this paper. The method requires the inputs of the initial energy and the energy at the end vertex of the track, as well as whether it is signal interaction occurring at the end vertex. The method shows good statistical performance, with no obvious bias except for that caused by unfolding, and good estimation of statistical uncertainties, as suggested by the toy studies. To apply it to real data, the systematic uncertainties due to the difference between data and simulation should be considered, and the parameters of the unfolding algorithm used should be optimized with further investigations into the trade-off between bias and variance. These features can be added to the IPython notebook
hadron-Ar_XS [
12], which also has the potential to be extended to more cross-section studies.
Figure 1.
An illustration of a LArTPC, where a beam hadron is shot into the detector from the left side. More descriptions of the elements in the illustration are provided in the text.
Figure 1.
An illustration of a LArTPC, where a beam hadron is shot into the detector from the left side. More descriptions of the elements in the illustration are provided in the text.
Figure 2.
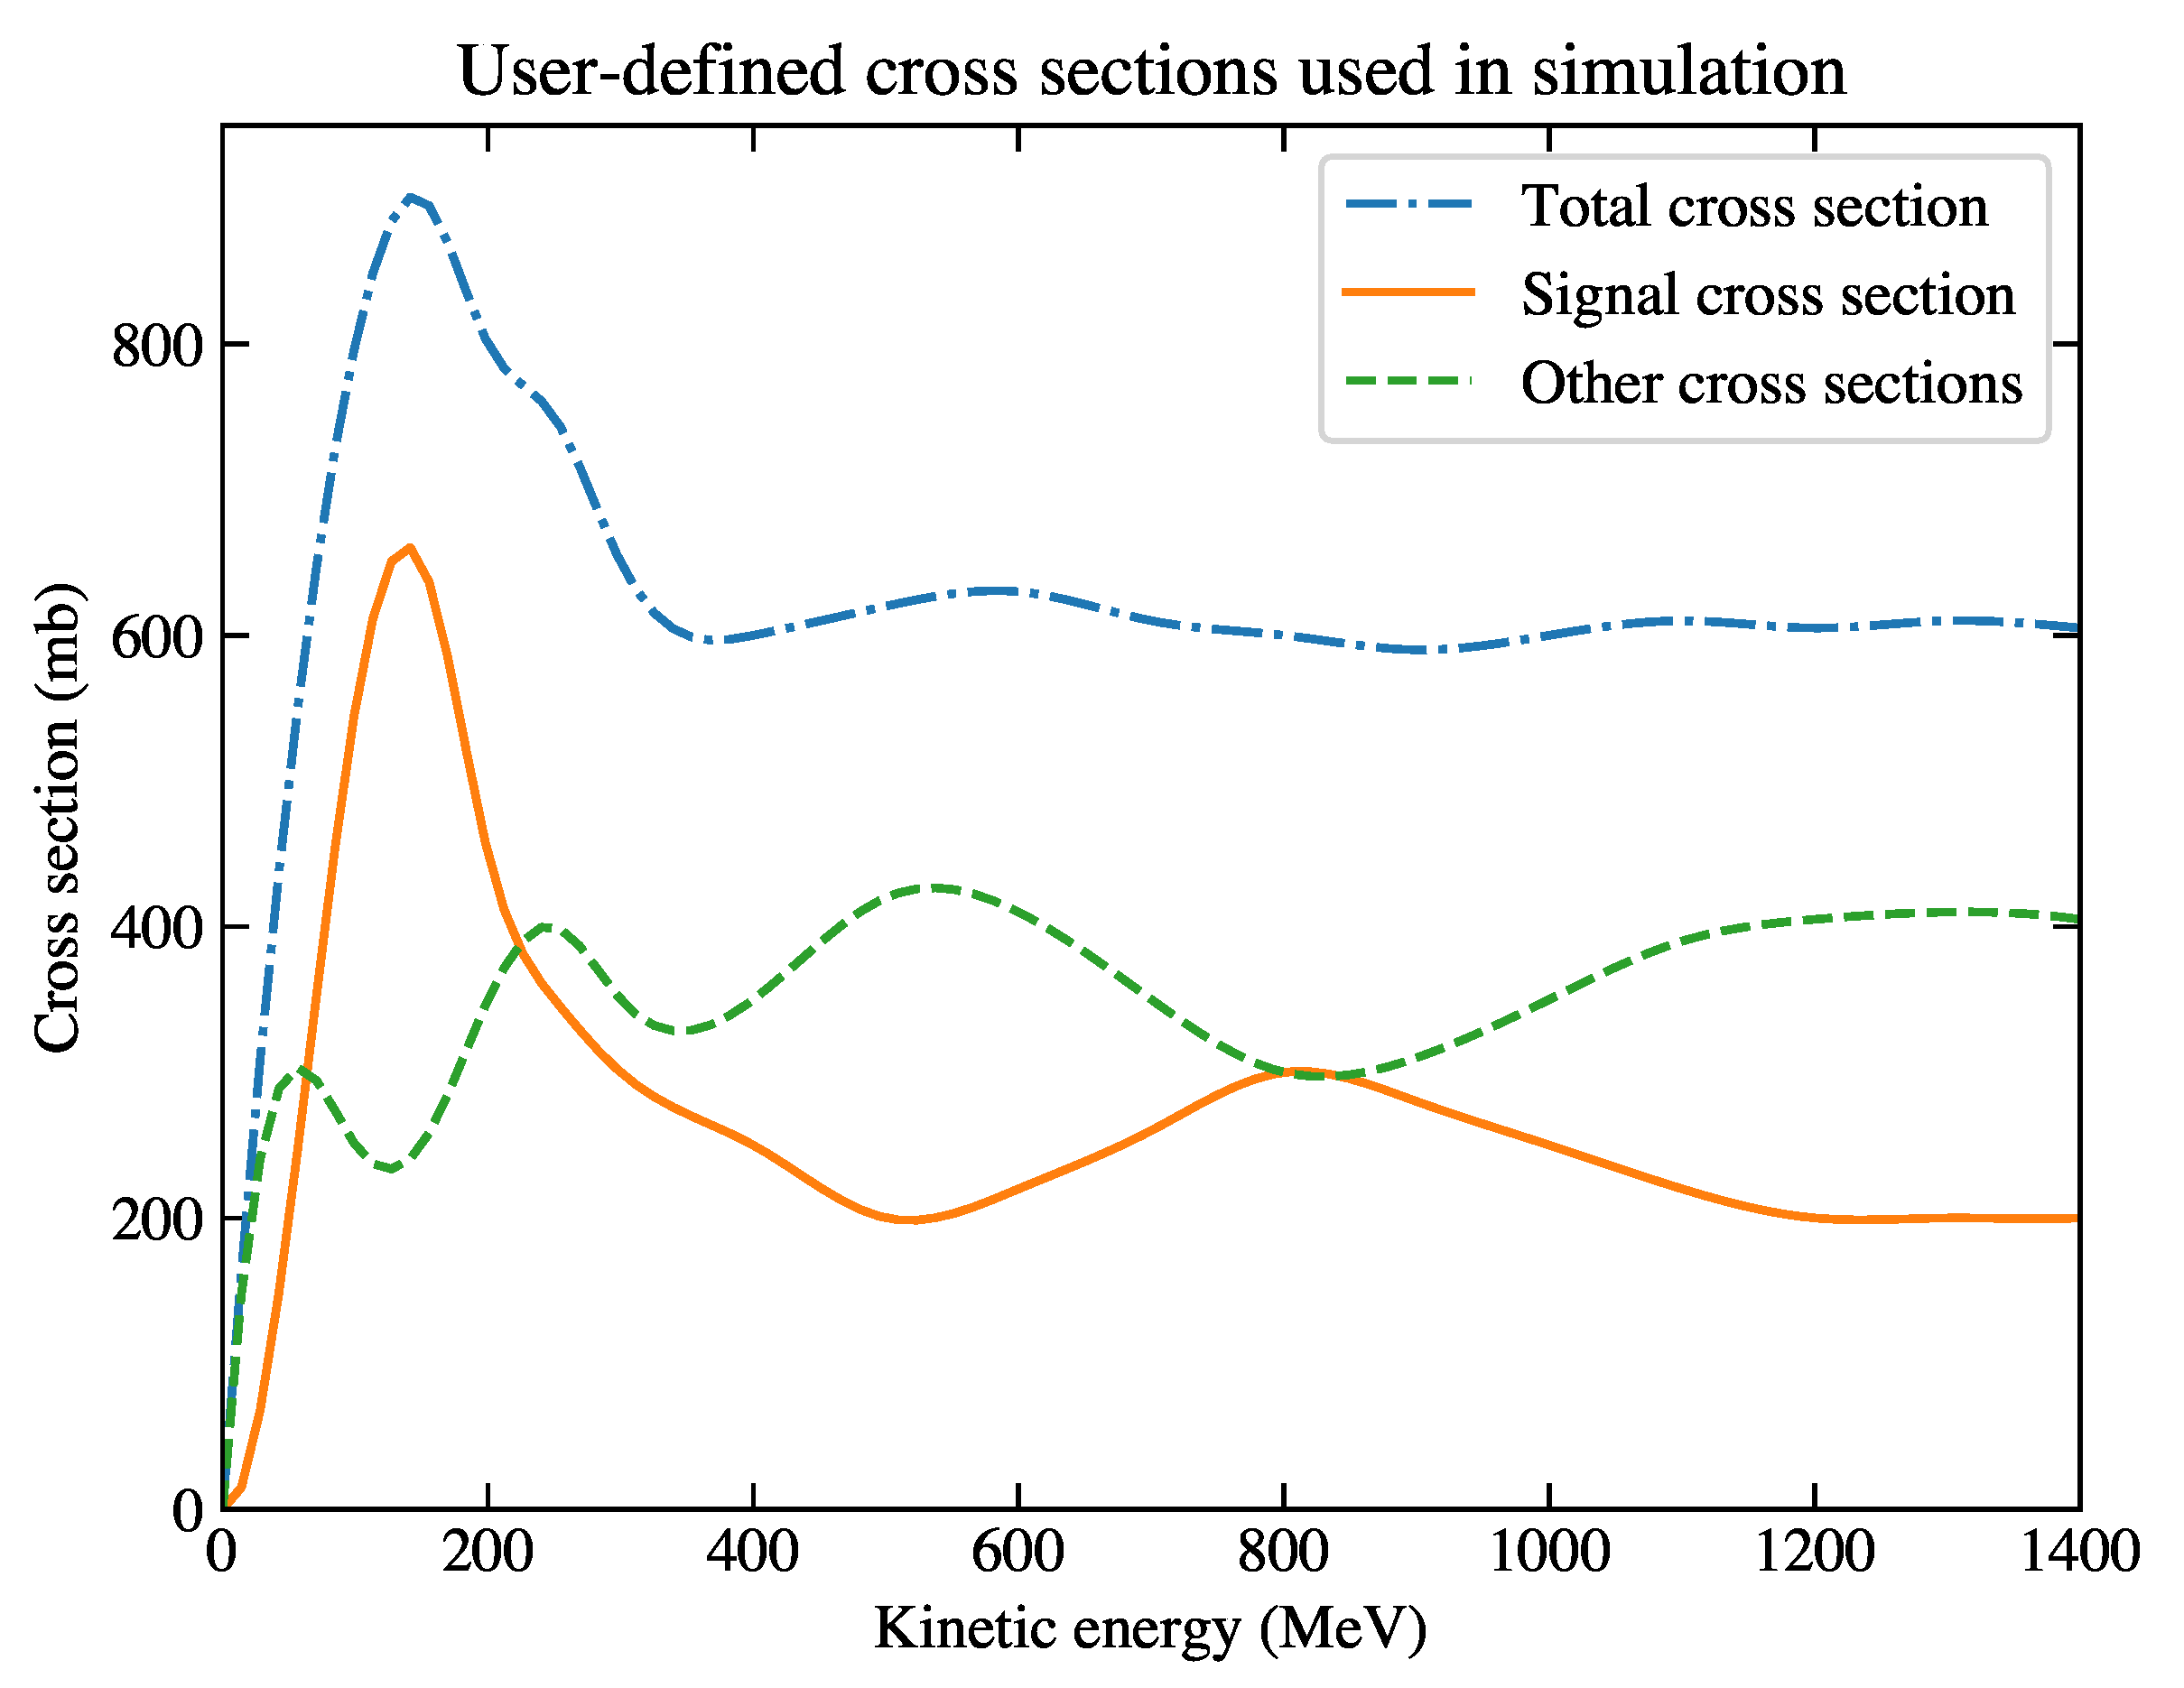
Cross-section curves based on which the simulation is generated. The total cross section (blue dash-dotted curve) is the sum of the signal cross section (orange solid curve) and the other cross sections (green dashed curve).
Figure 2.
Cross-section curves based on which the simulation is generated. The total cross section (blue dash-dotted curve) is the sum of the signal cross section (orange solid curve) and the other cross sections (green dashed curve).
Figure 3.
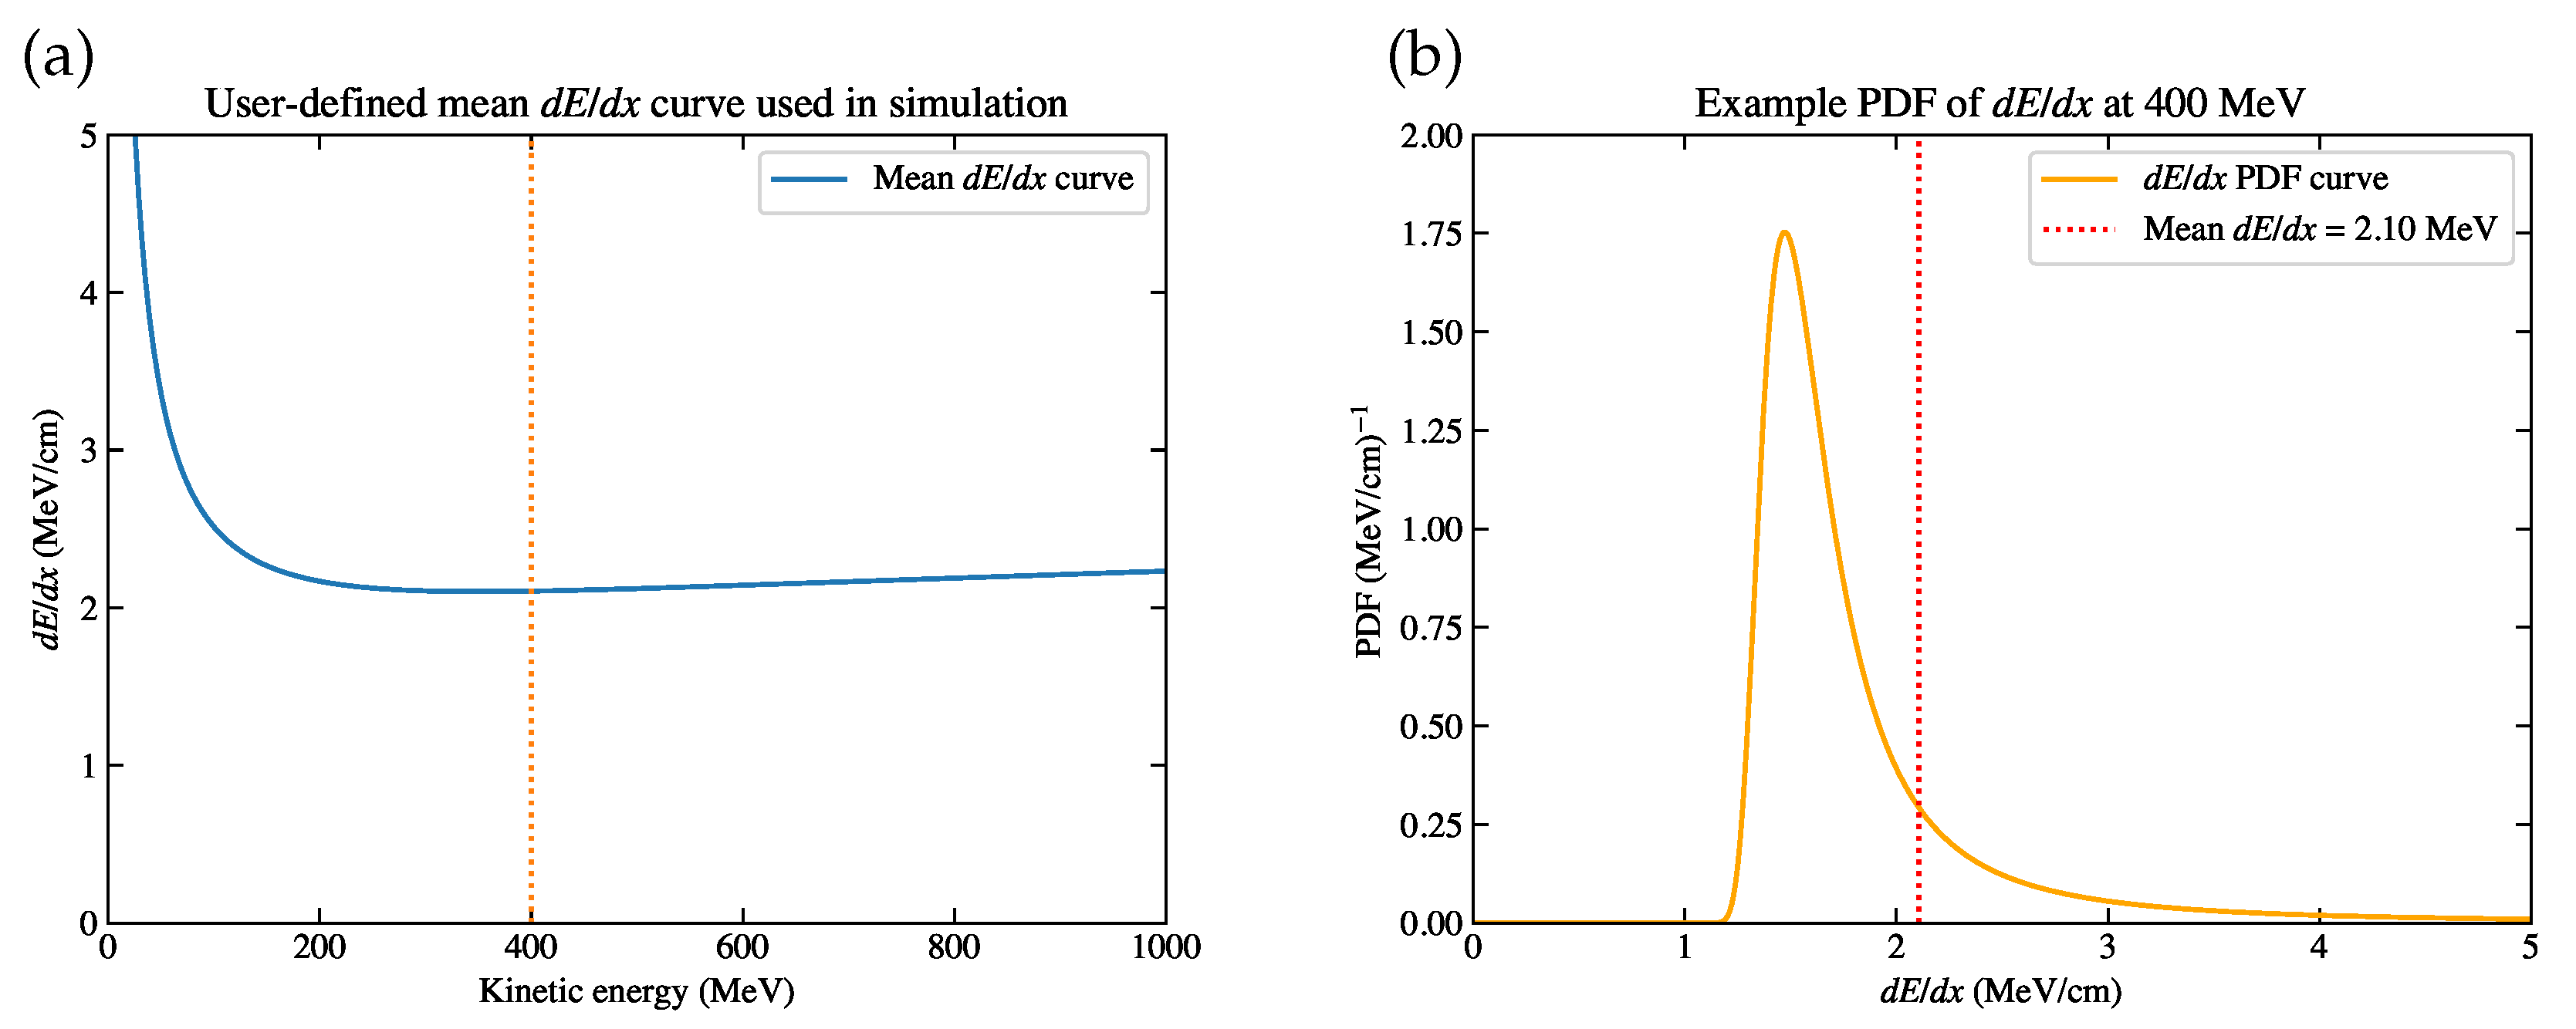
(a) The mean curve used in the simulation. The dashed vertical line at MeV indicates the case of the example distribution. (b) The example distribution at MeV, where the mean approximates 2.10 MeV/cm.
Figure 3.
(a) The mean curve used in the simulation. The dashed vertical line at MeV indicates the case of the example distribution. (b) The example distribution at MeV, where the mean approximates 2.10 MeV/cm.
Figure 4.
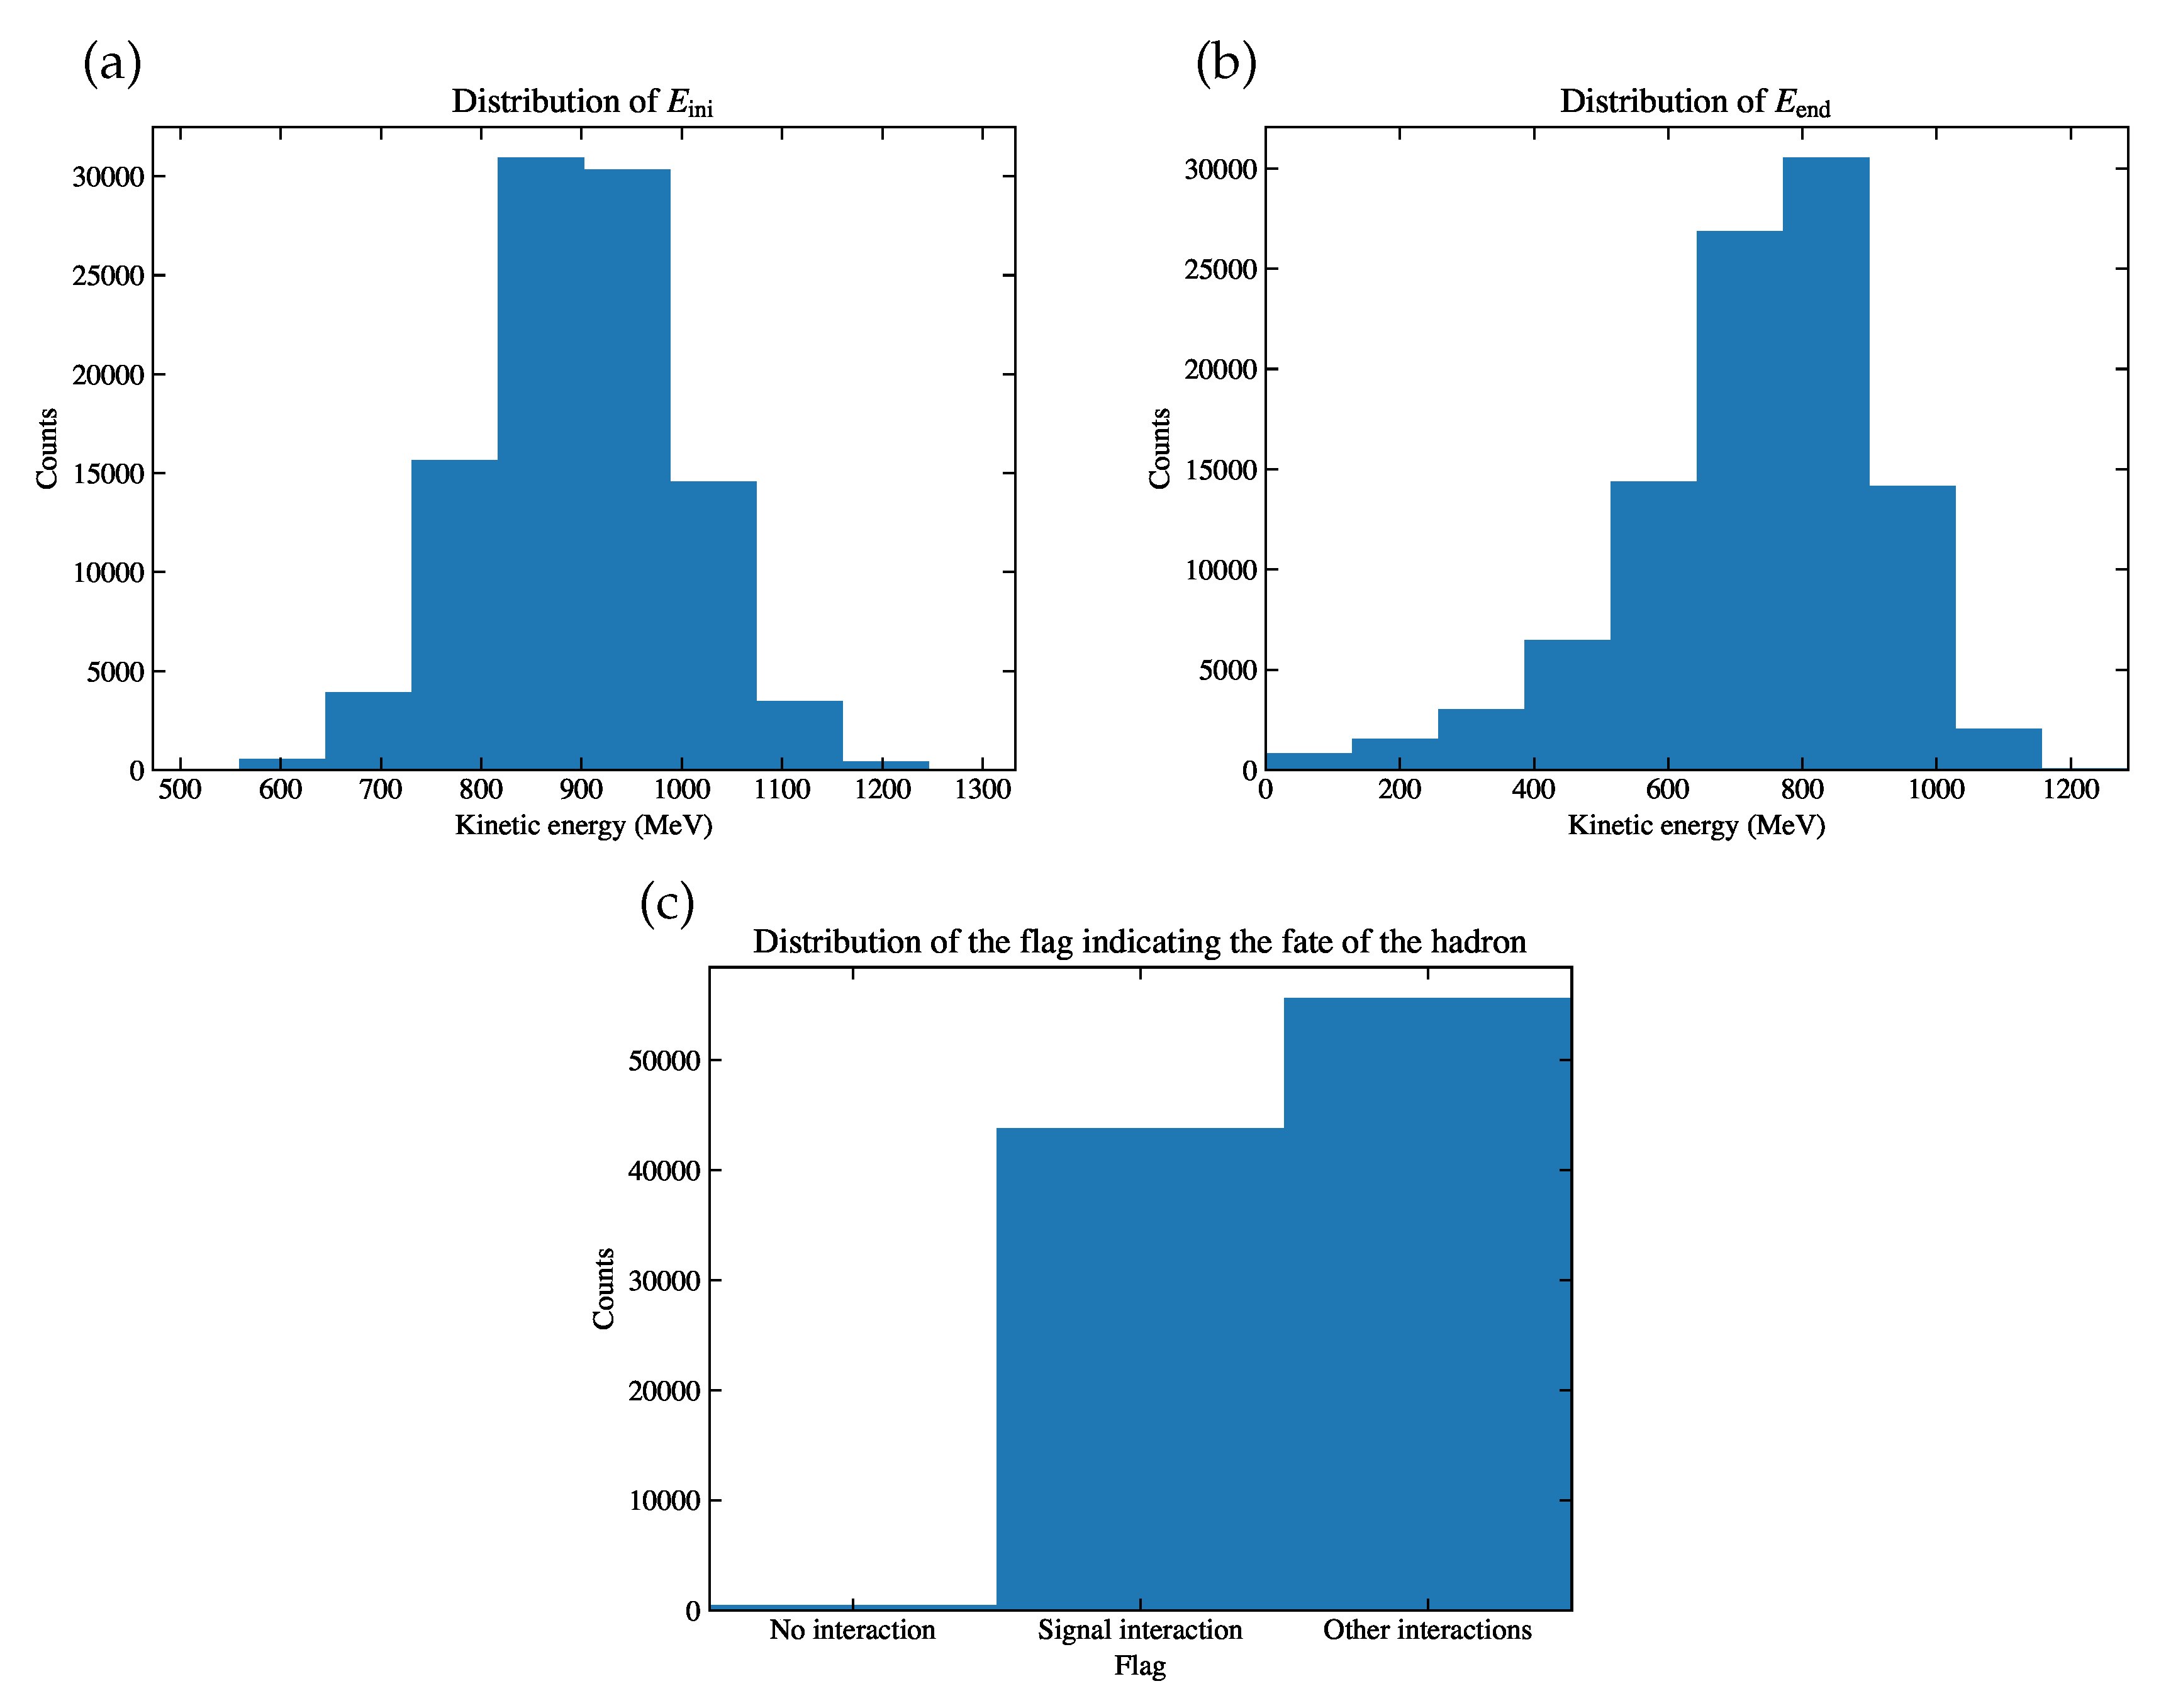
Of the simulation sample, the distribution of (a) , (b) , (c) the flag indicating the fate of the hadron, either it has no interaction before it comes to rest, or it has signal interaction, or other interactions.
Figure 4.
Of the simulation sample, the distribution of (a) , (b) , (c) the flag indicating the fate of the hadron, either it has no interaction before it comes to rest, or it has signal interaction, or other interactions.
Figure 5.
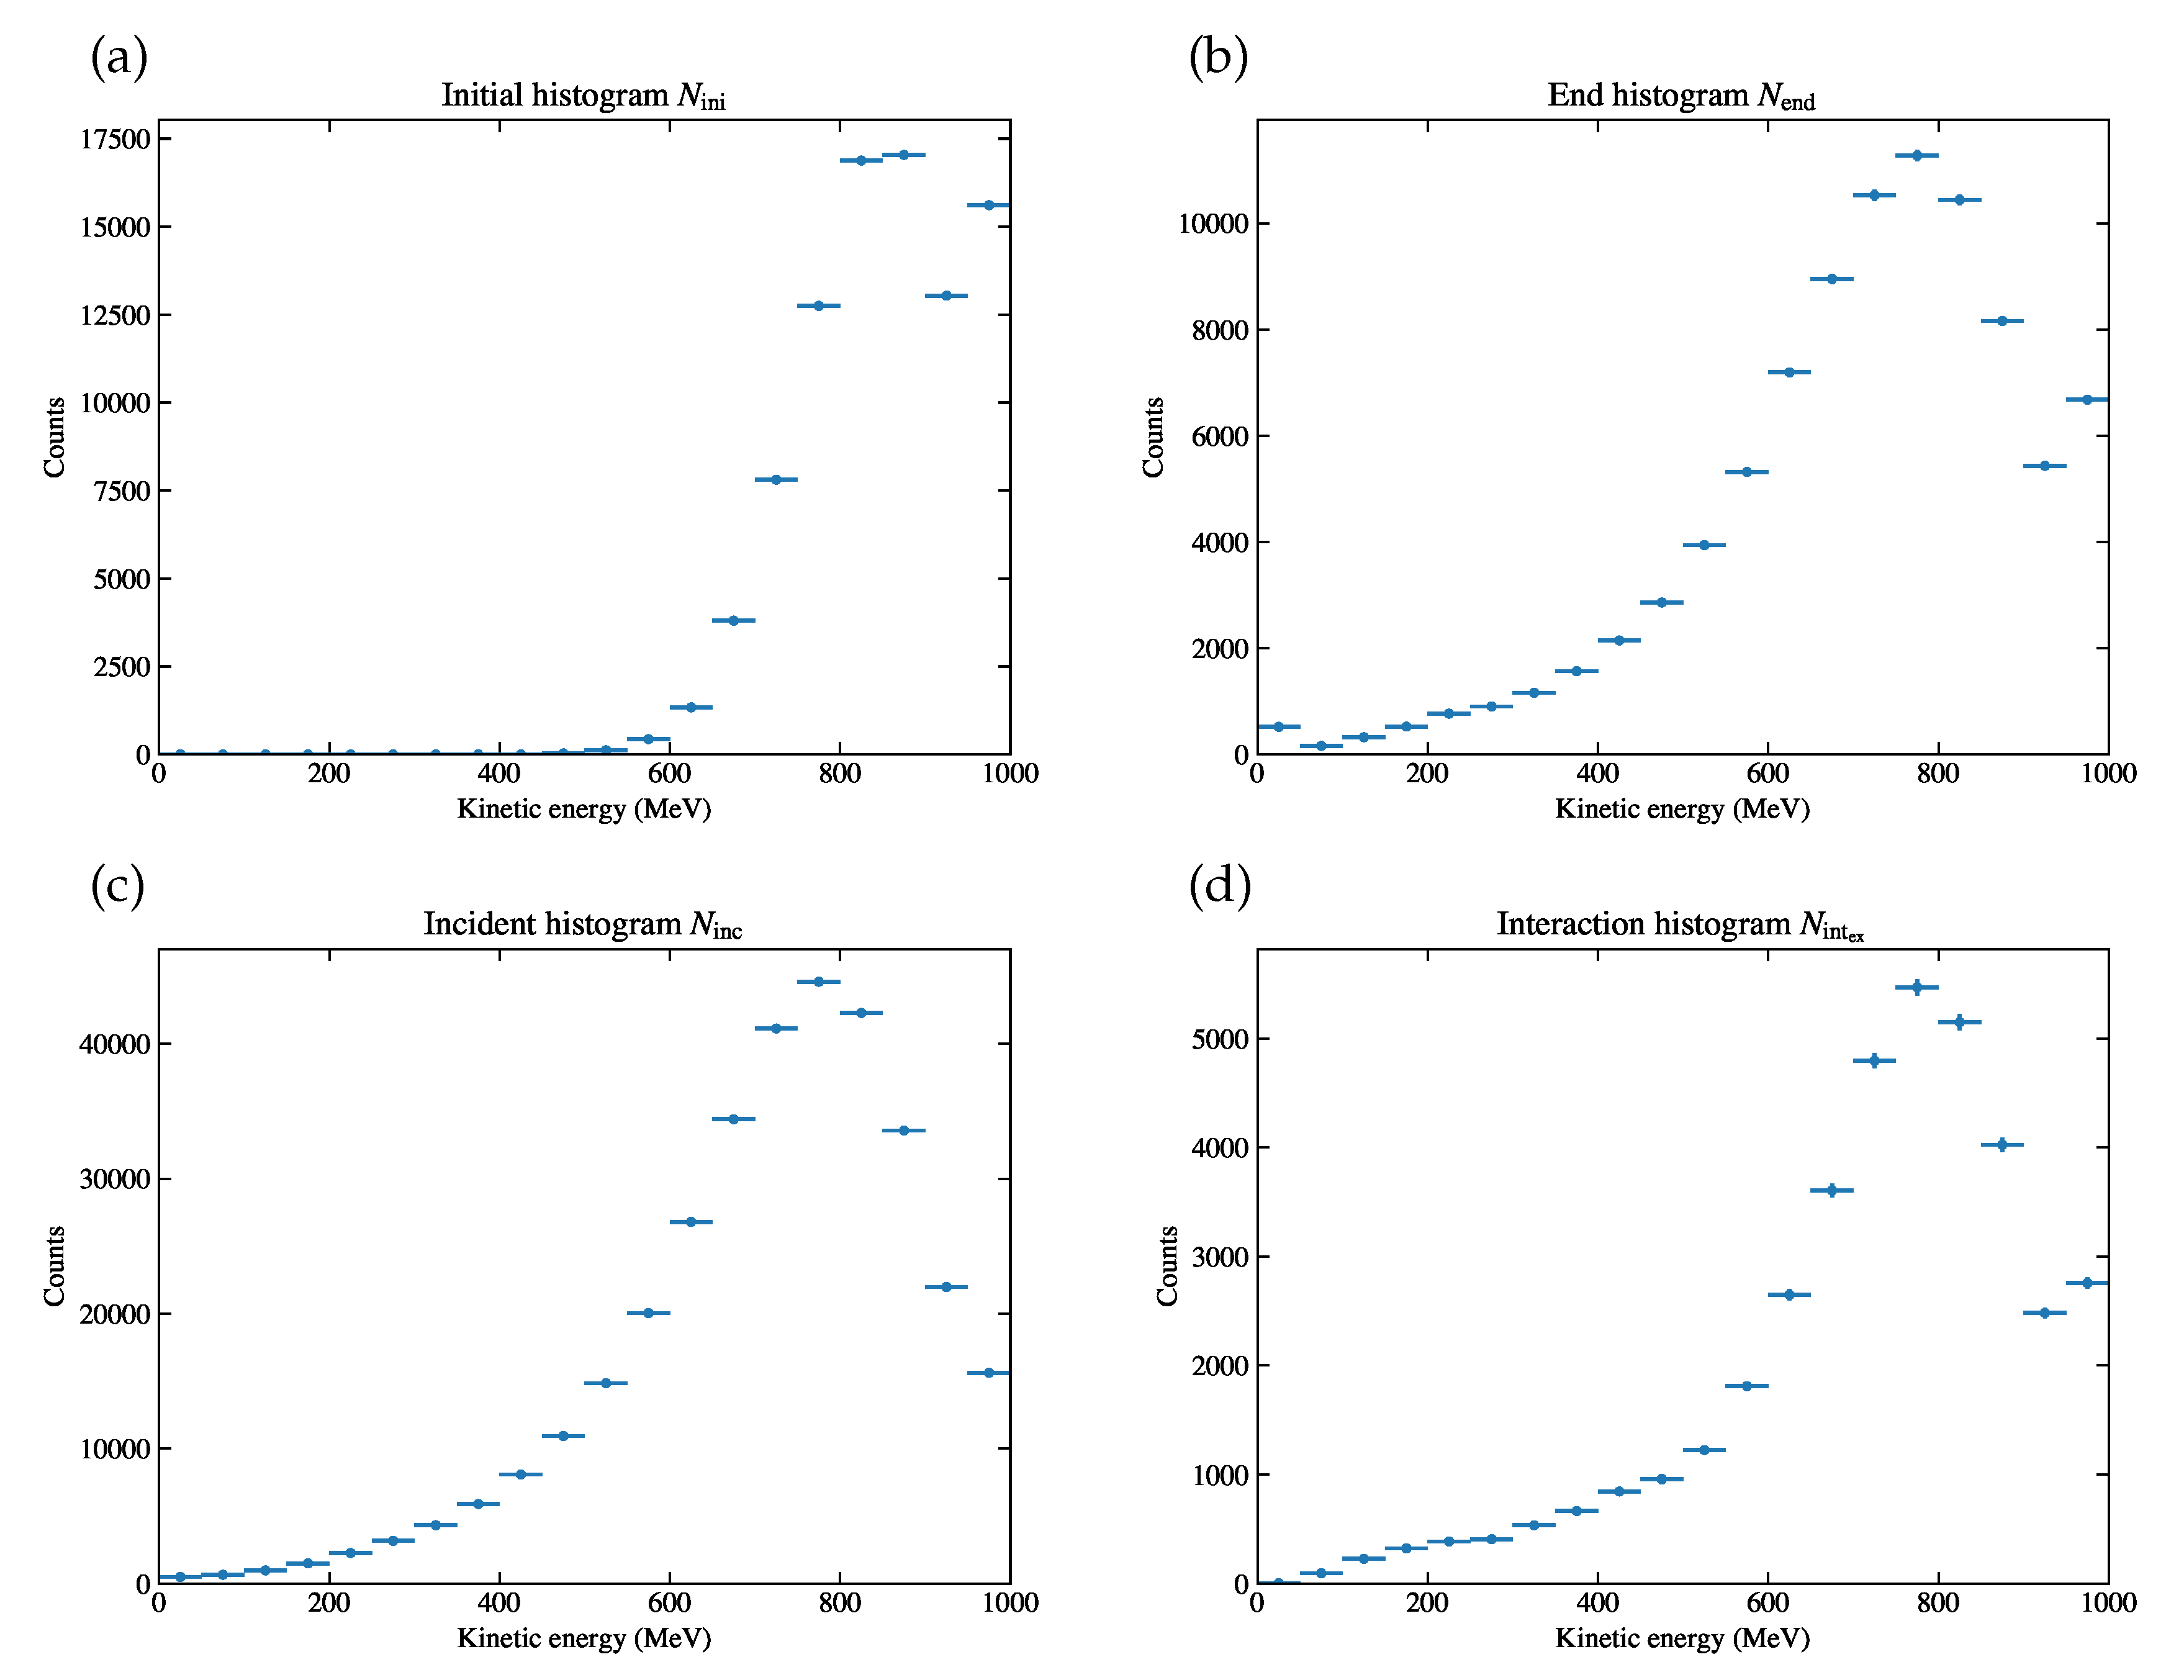
Energy histograms derived from the simulation sample, (a)
, (b)
, (c)
, (d)
. The first and the last energy bins are given as overflows. The derivation of error bars are described later in
Section 4.3.
Figure 5.
Energy histograms derived from the simulation sample, (a)
, (b)
, (c)
, (d)
. The first and the last energy bins are given as overflows. The derivation of error bars are described later in
Section 4.3.
Figure 6.
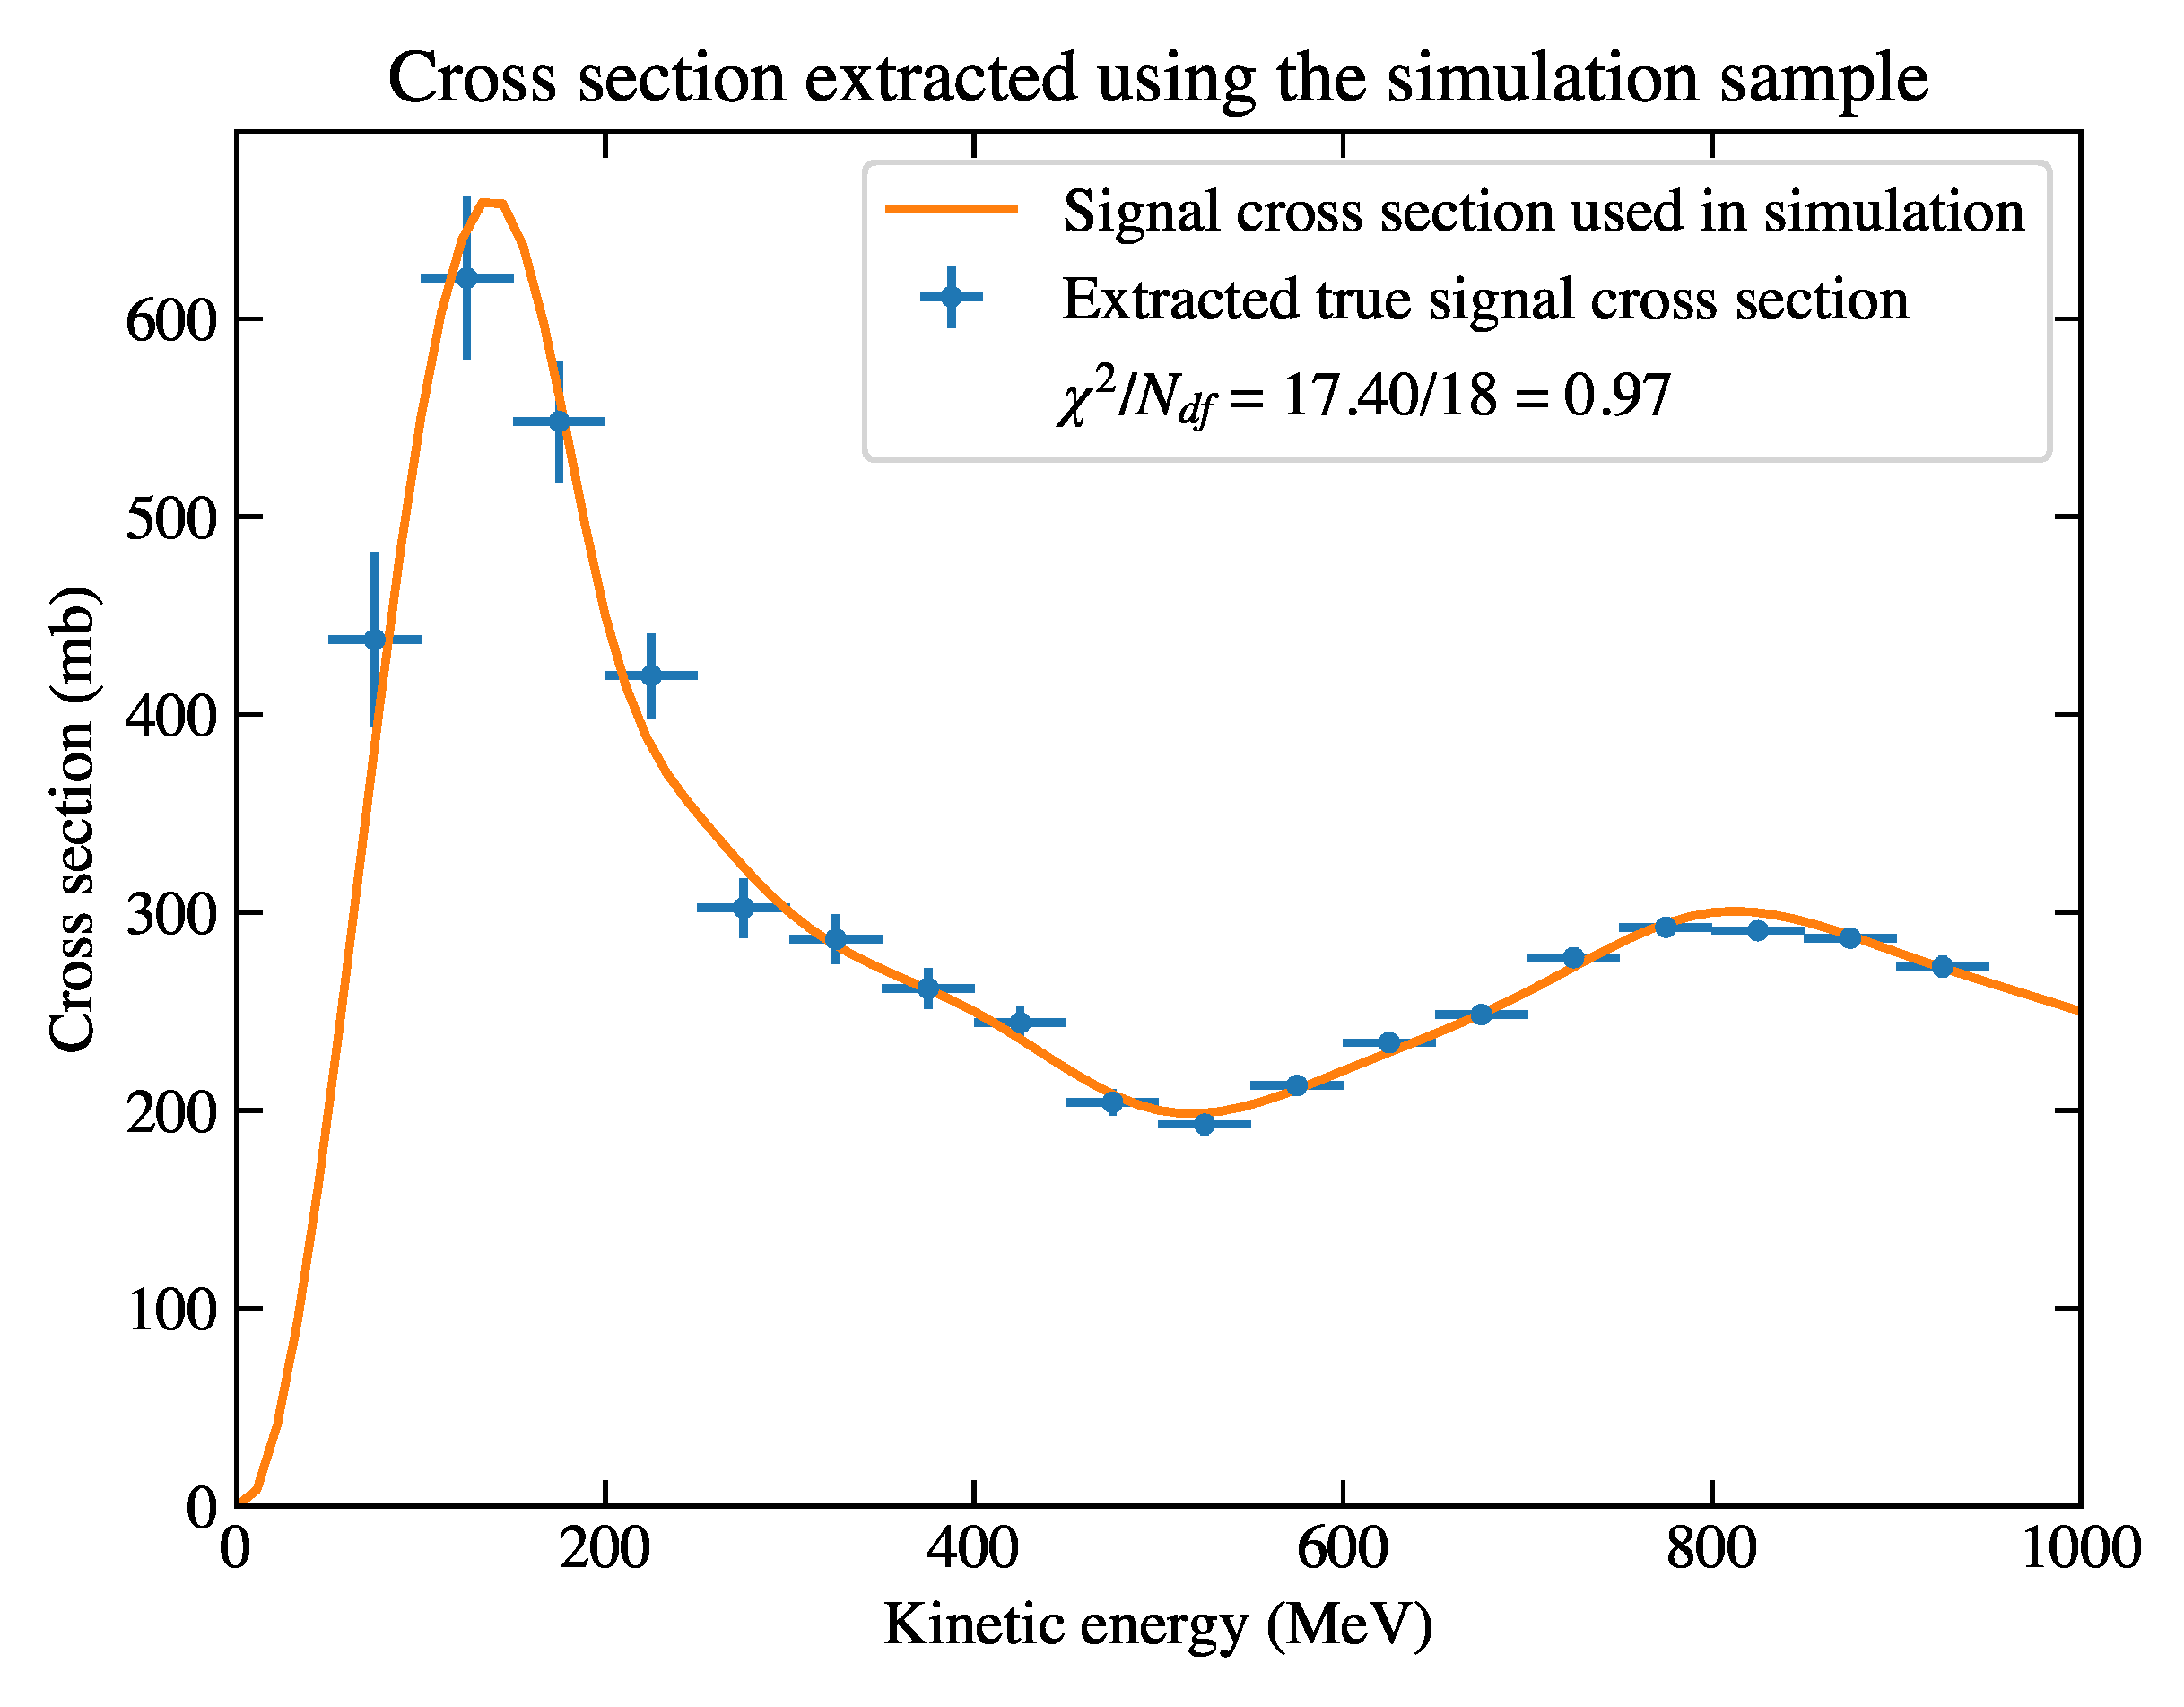
The cross section extracted using the true information of the simulation sample. The reduced
is approximately 1, which suggests good agreement between the sample and the input cross section. The derivation of error bars are described later in
Section 4.3.
Figure 6.
The cross section extracted using the true information of the simulation sample. The reduced
is approximately 1, which suggests good agreement between the sample and the input cross section. The derivation of error bars are described later in
Section 4.3.
Figure 7.
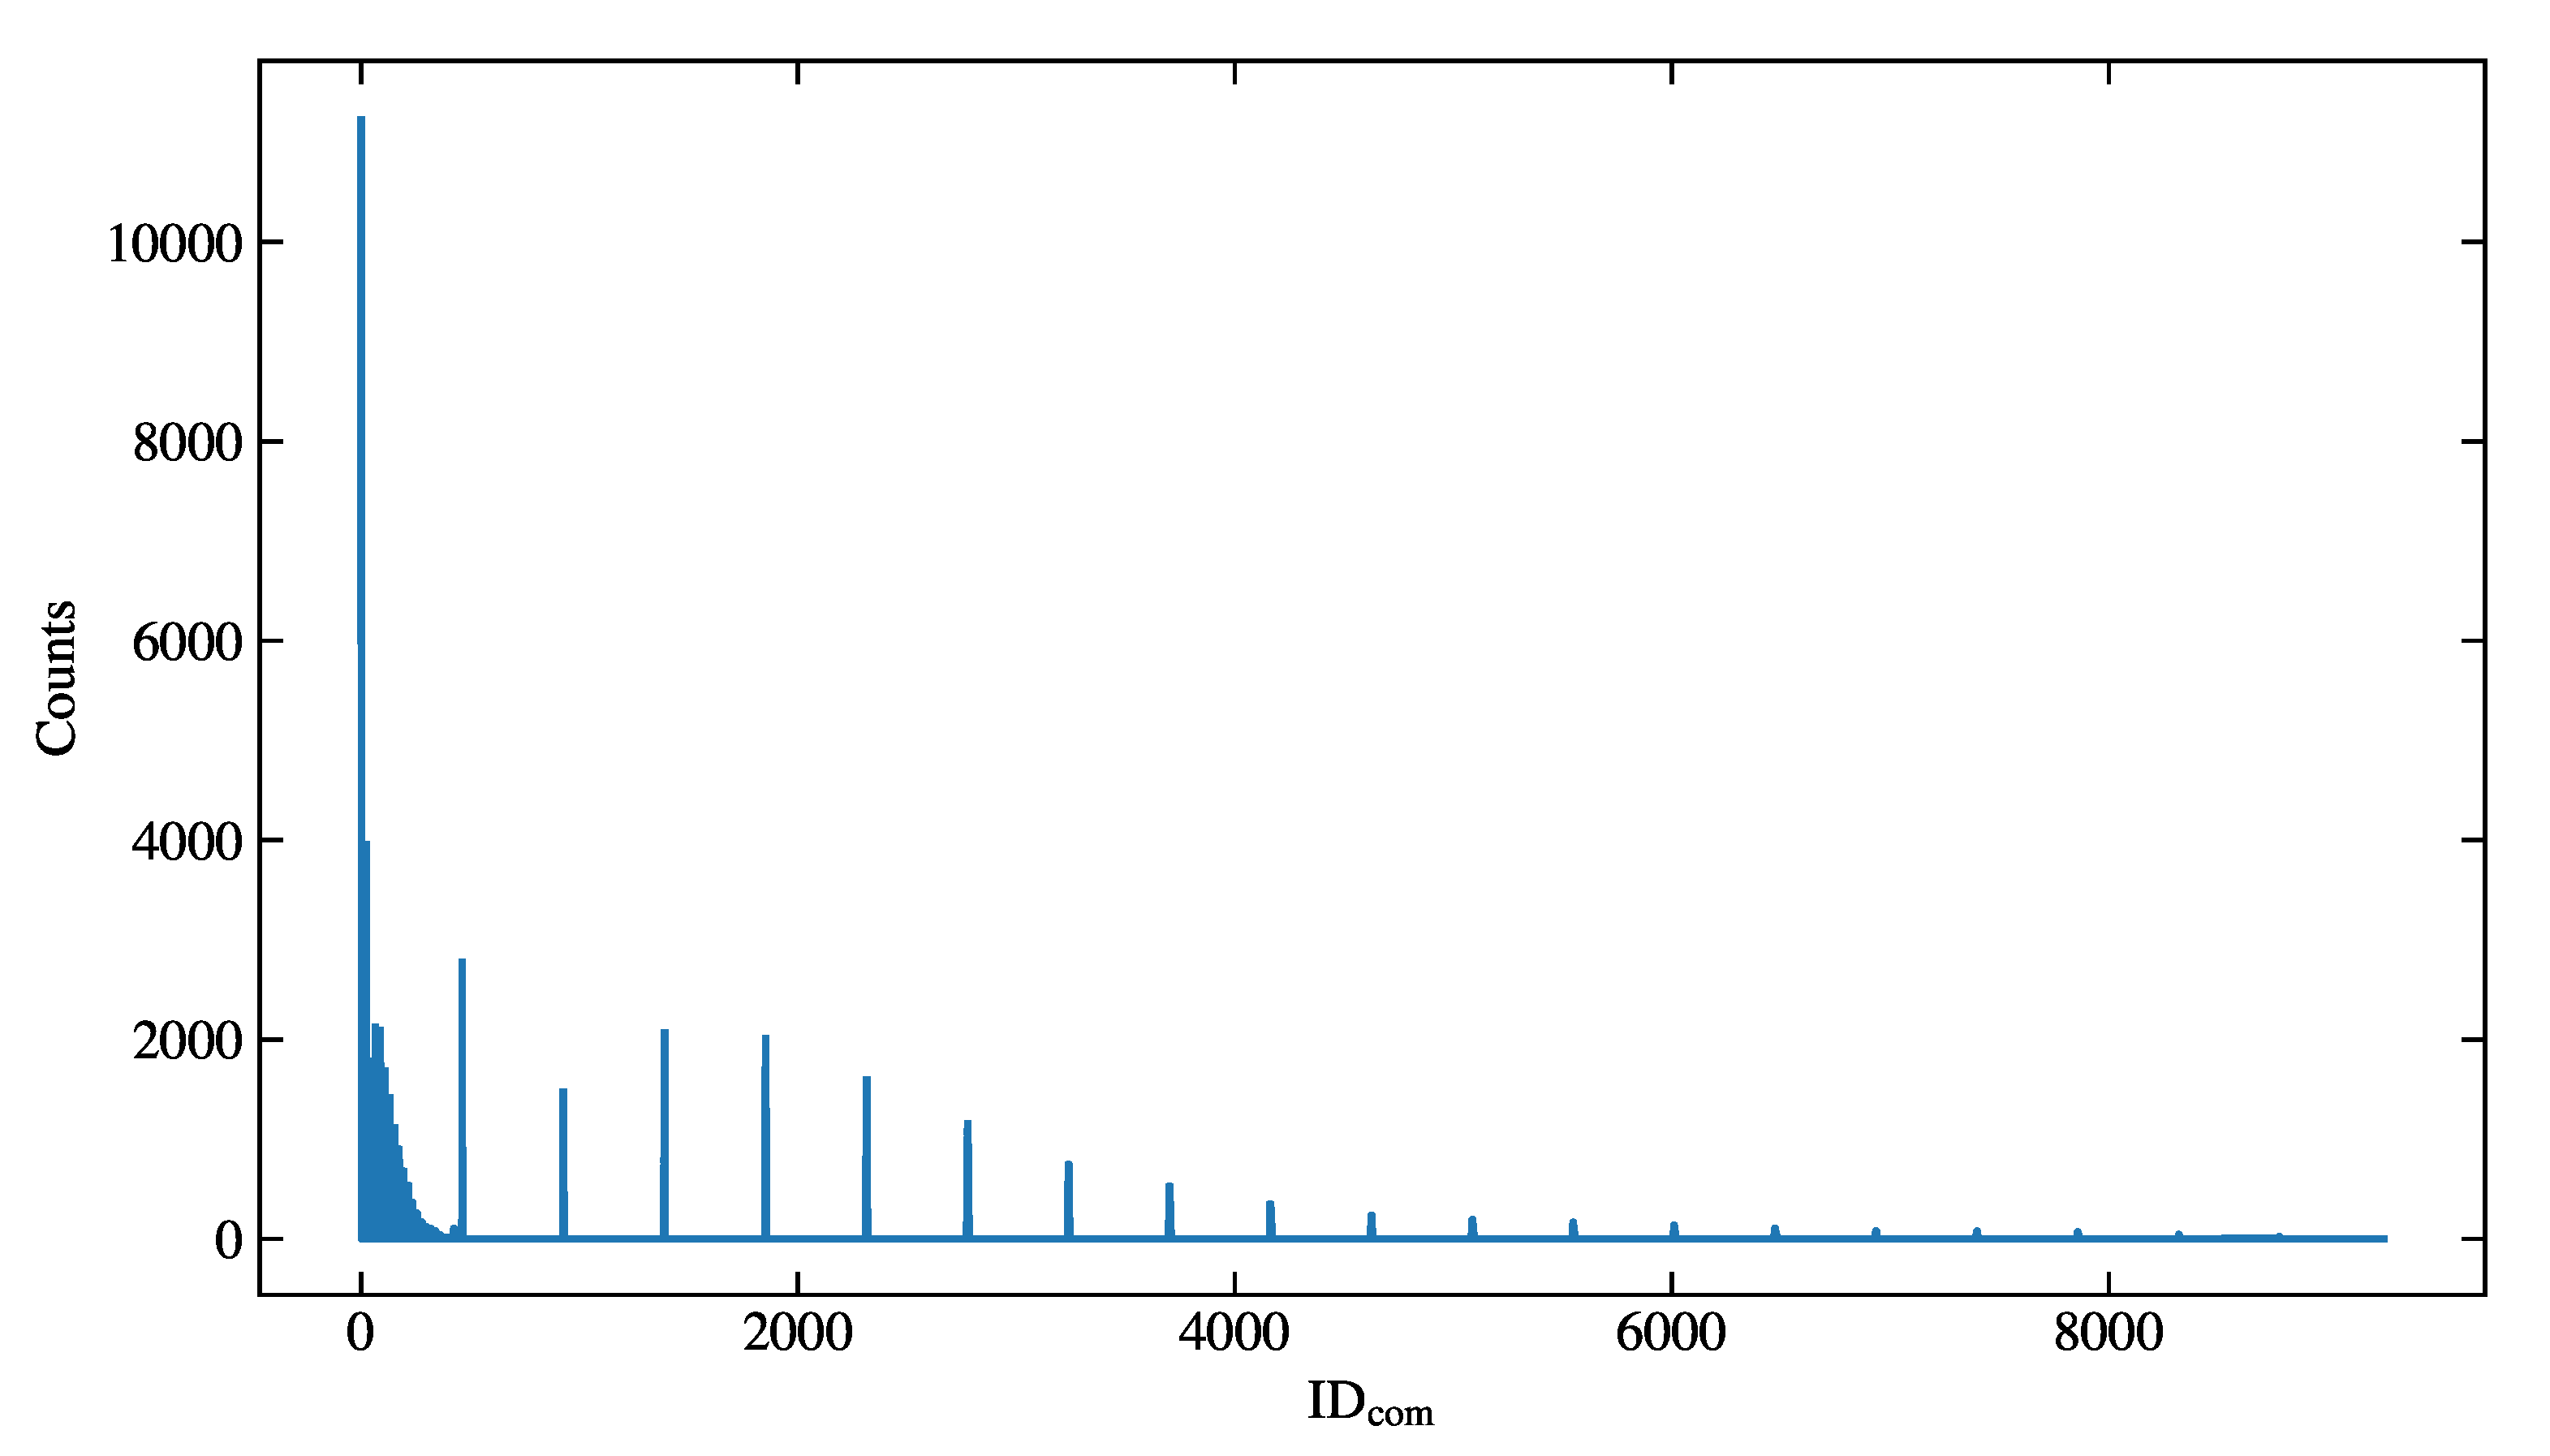
The distribution of the combined variable of the simulation sample.
Figure 7.
The distribution of the combined variable of the simulation sample.
Figure 8.
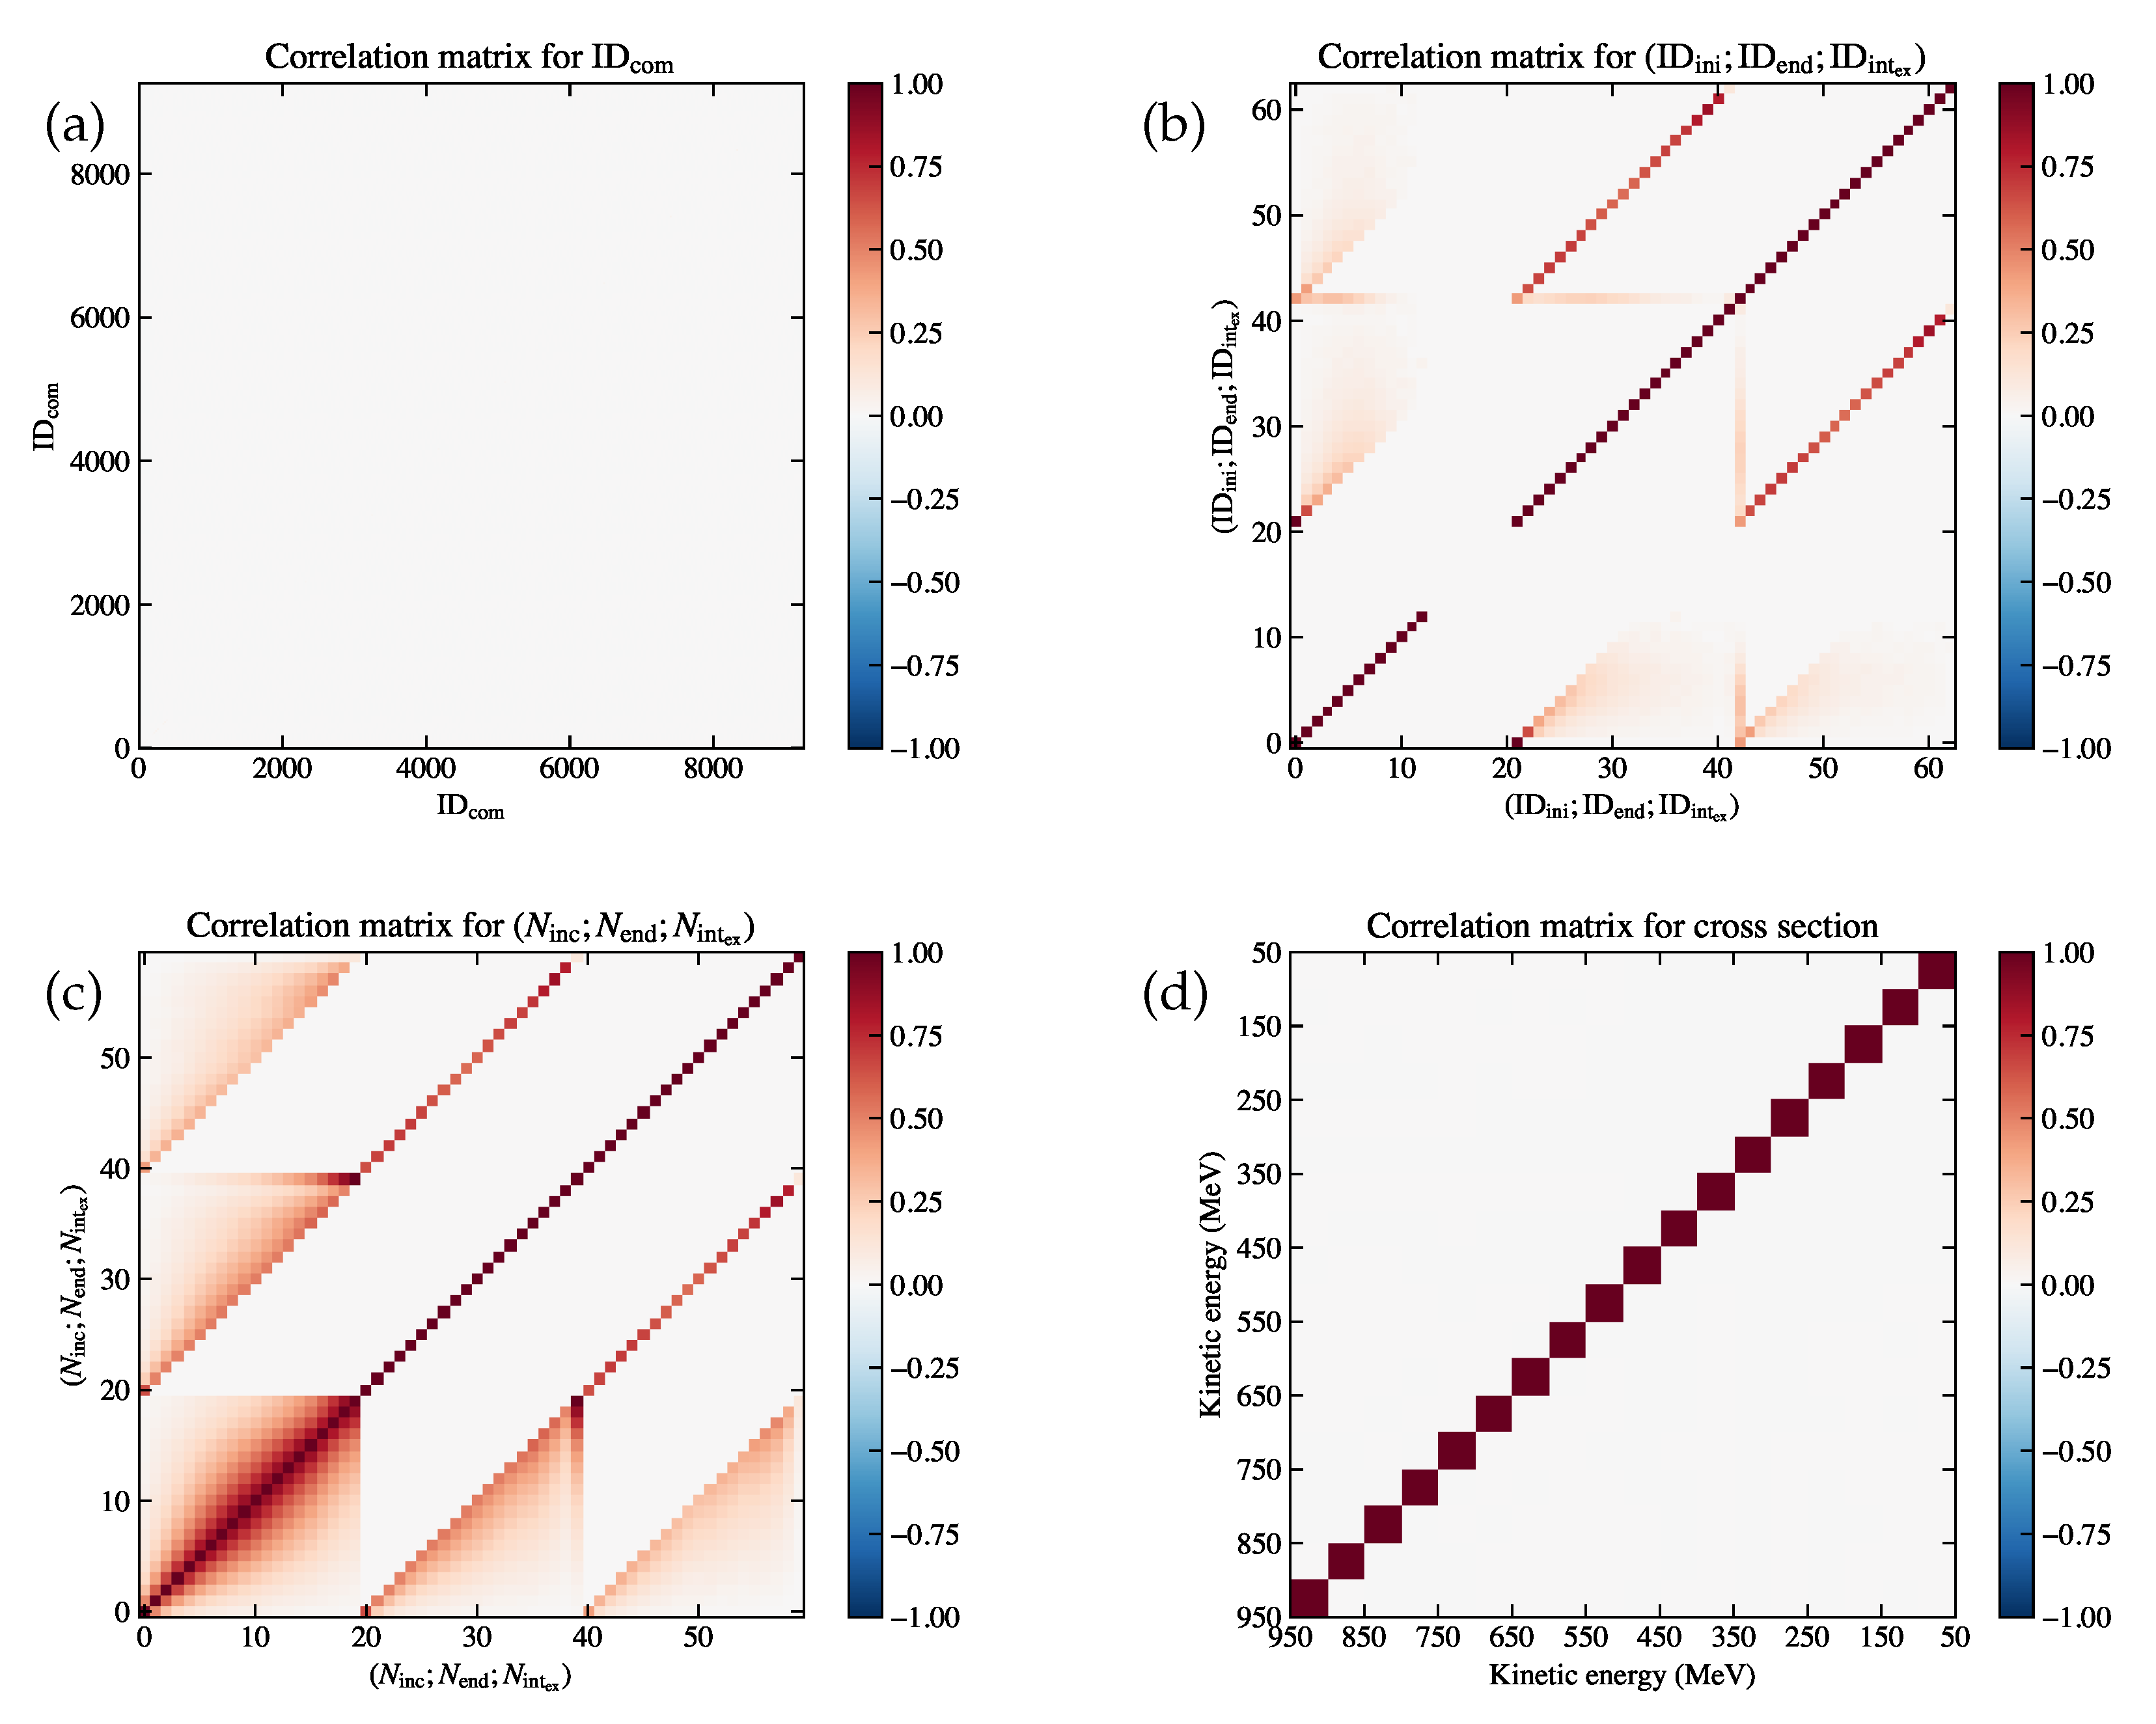
(a) Correlation matrix for the combined variable , which is diagonal since the entry in each bin is derived by counting independently. (b) Correlation matrix for ; ; , where the first block (bin index 0 to 20) corresponds to , the second block (bin index 21 to 41) corresponds to , and the third block (bin index 42 to 62) corresponds to . (c) Correlation matrix for ; ; , where the first block (bin index 0 to 19) corresponds to , the second block (bin index 20 to 39) corresponds to , and the third block (bin index 40 to 59) corresponds to . (d) Correlation matrix for the extracted cross section , which has 18 bins on each axis without the underflow and the overflow bins.
Figure 9.
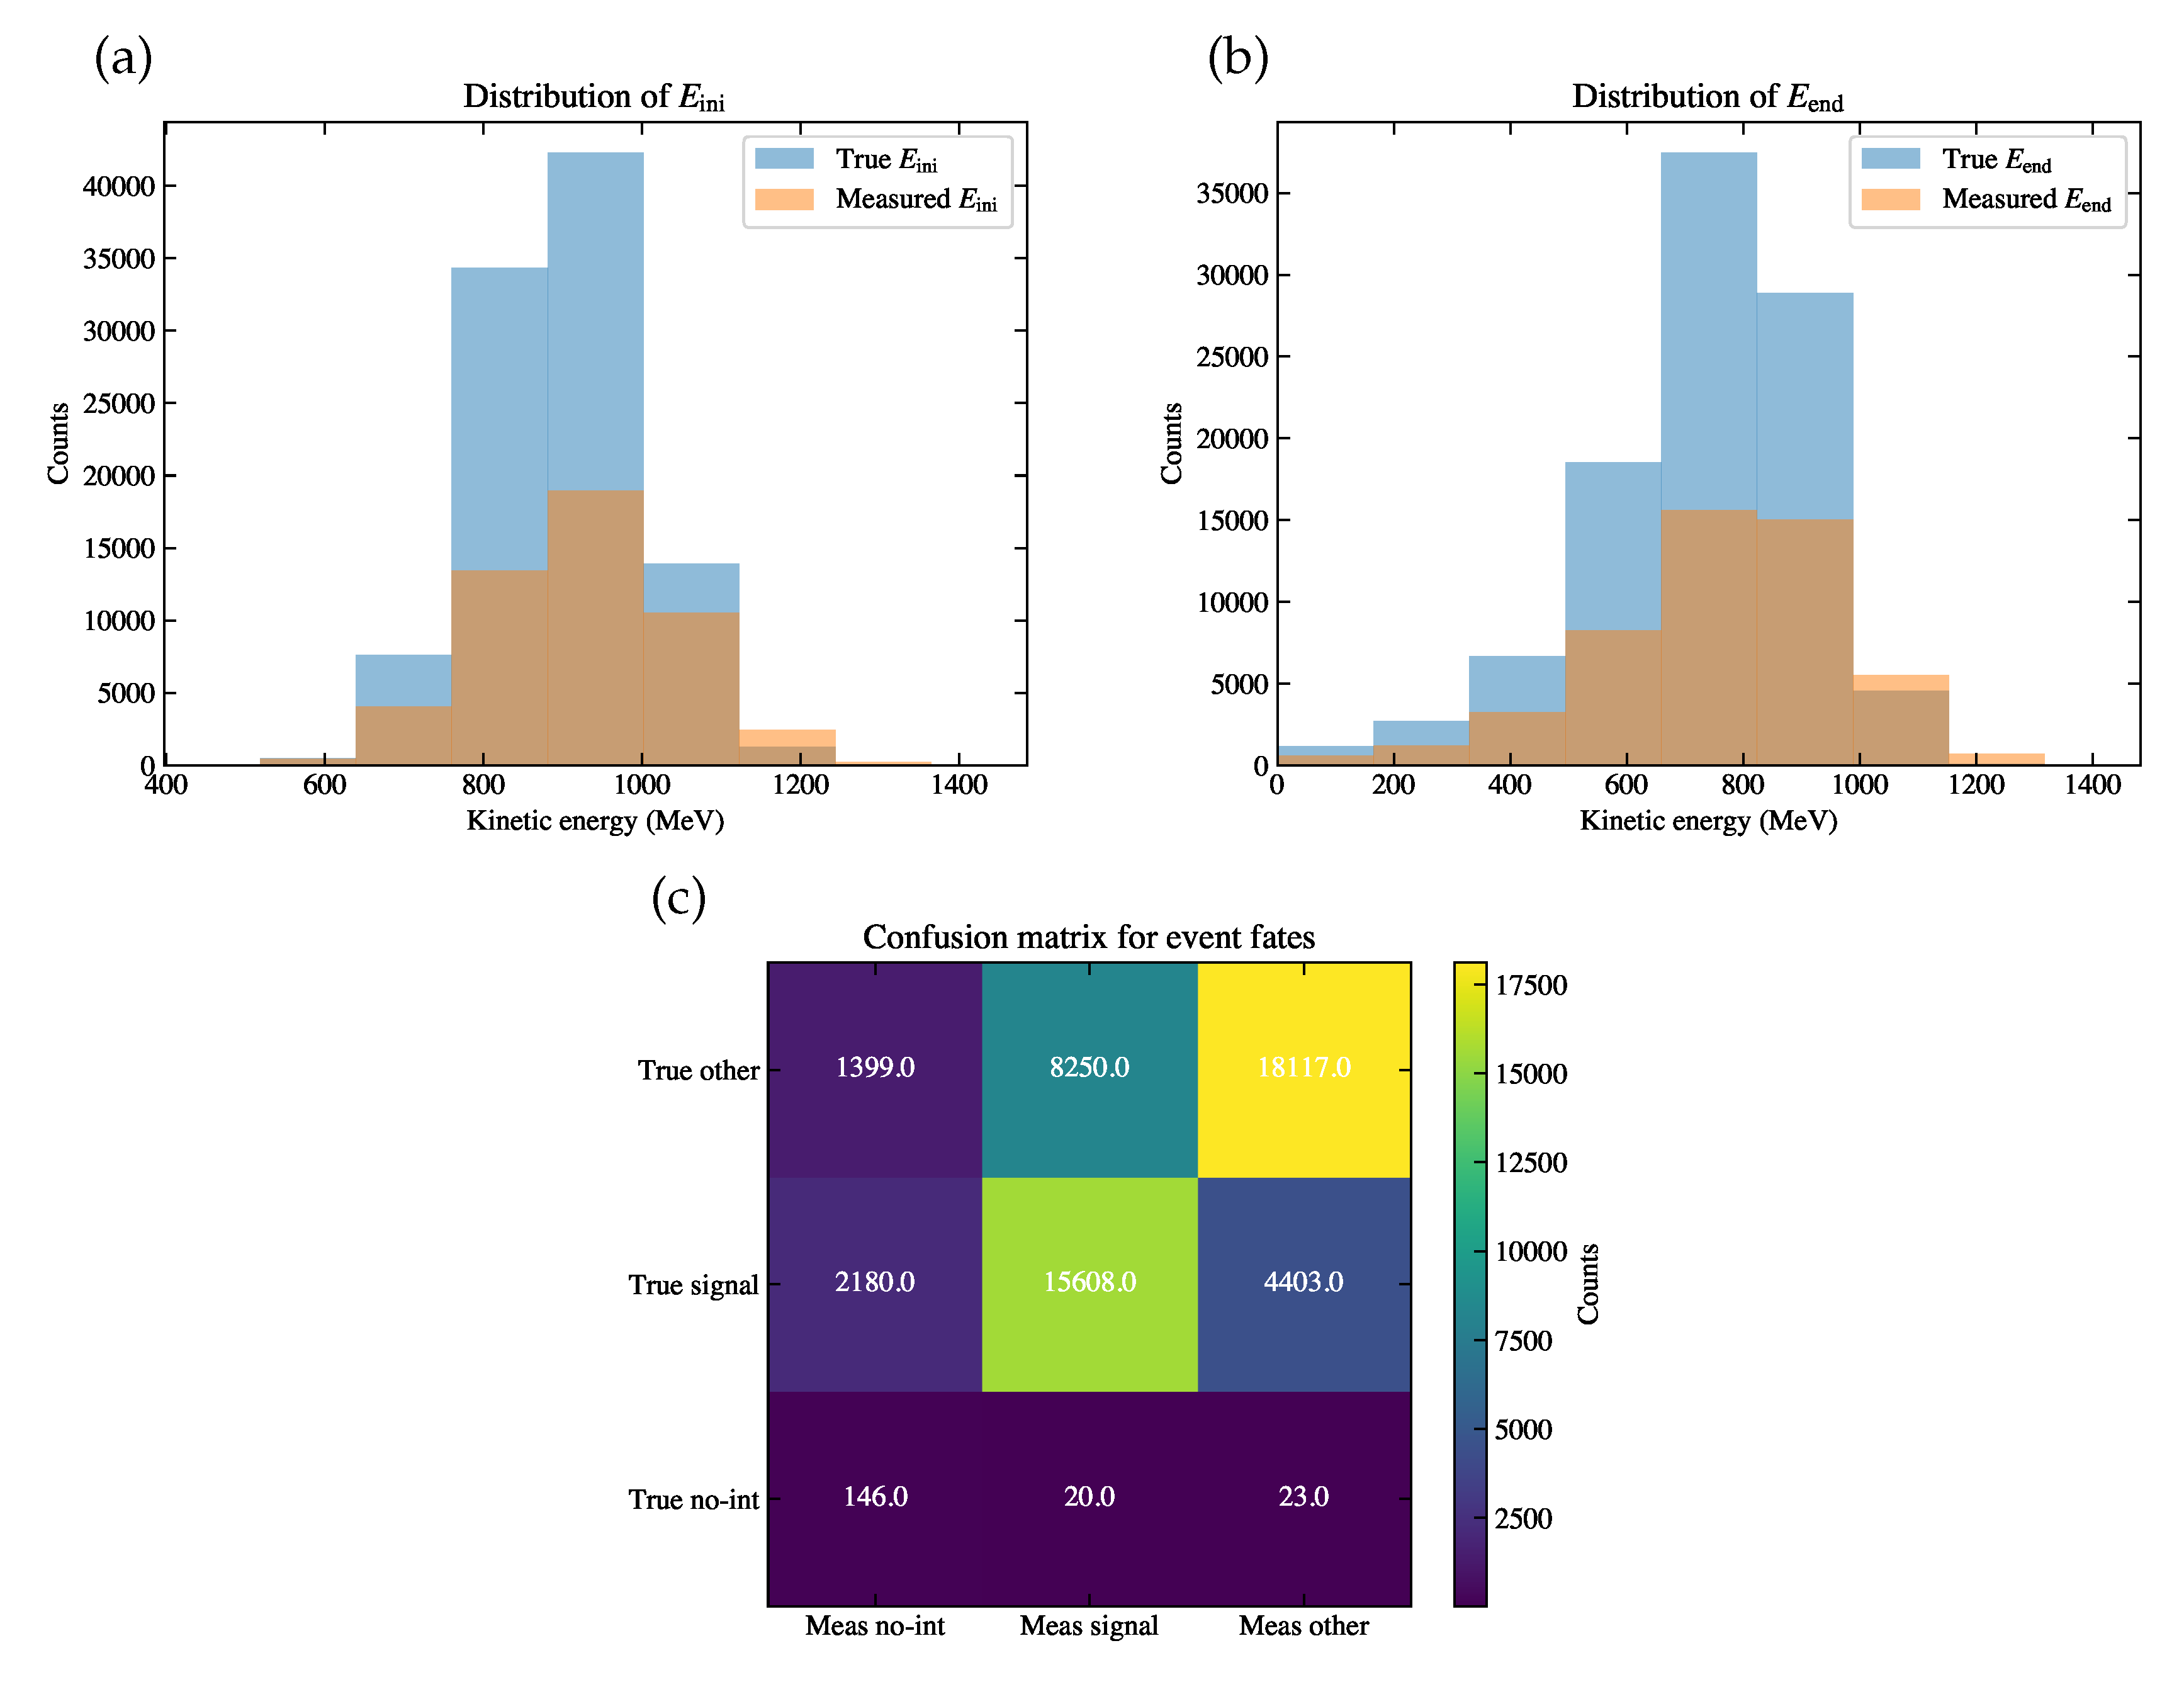
(a) The distribution of (orange histogram) and (blue histogram) for the simulation sample. (b) The distribution of (orange histogram) and (blue histogram) for the simulation sample. (c) The resulting confusion matrix for event fates of the simulation sample. The horizontal axis indicates the measured fates, and the vertical axis indicates the true fates. The color bar indicates the (weighted) event counts in each bin, which add up to be the event counts passing the selection.
Figure 10.
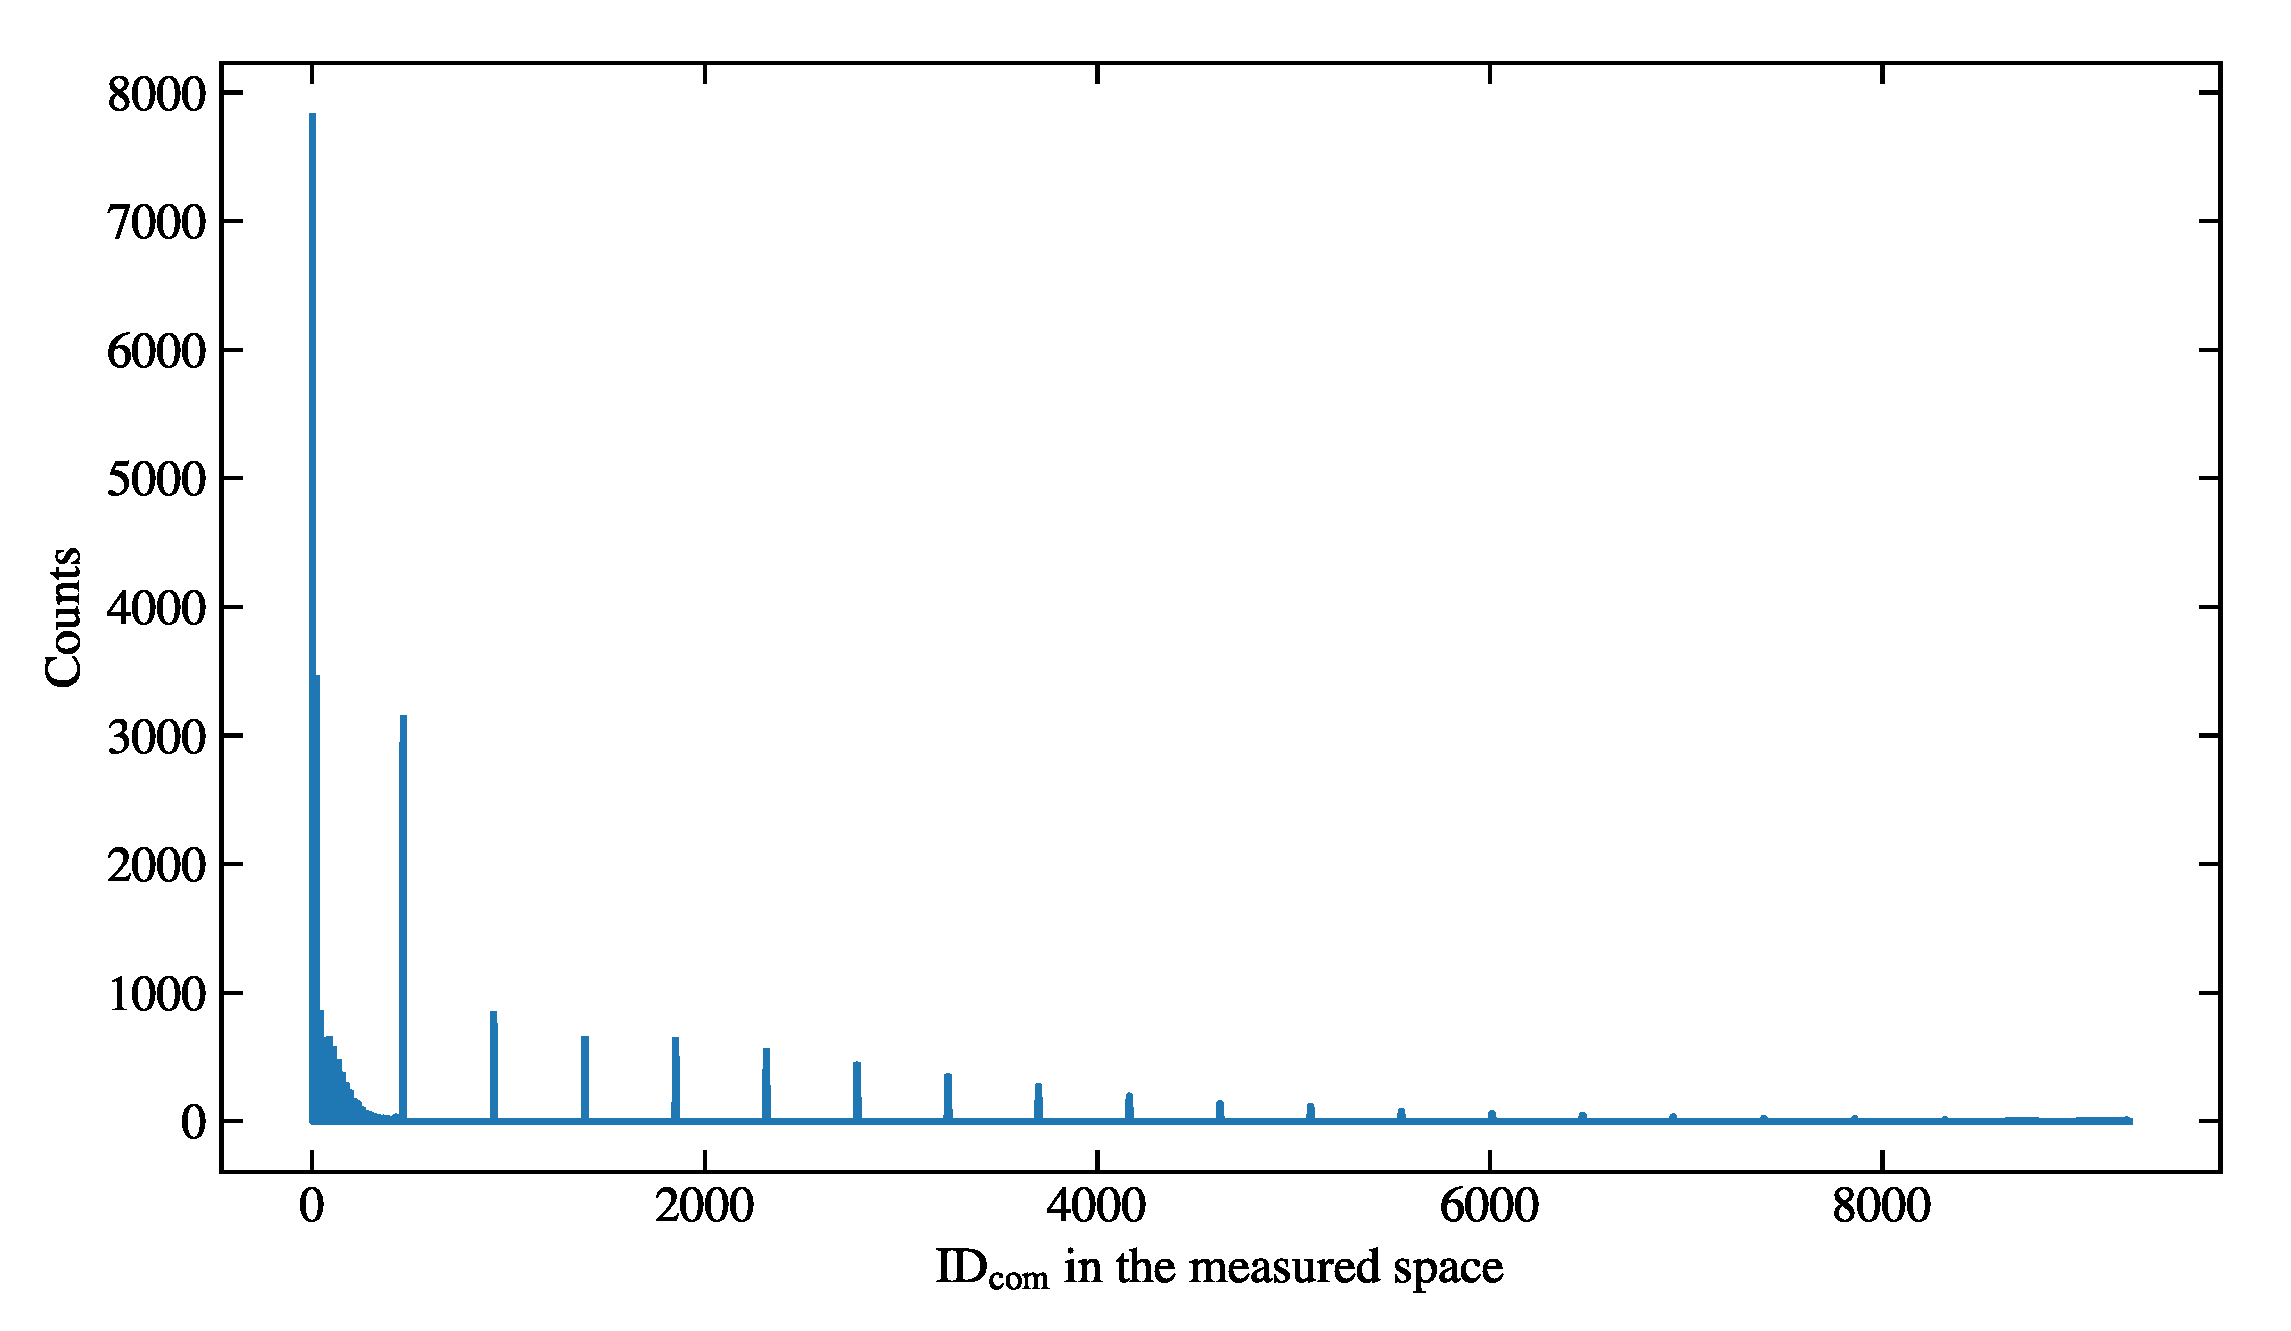
The distribution of the measured combined variable of the simulation sample.
Figure 10.
The distribution of the measured combined variable of the simulation sample.
Figure 11.
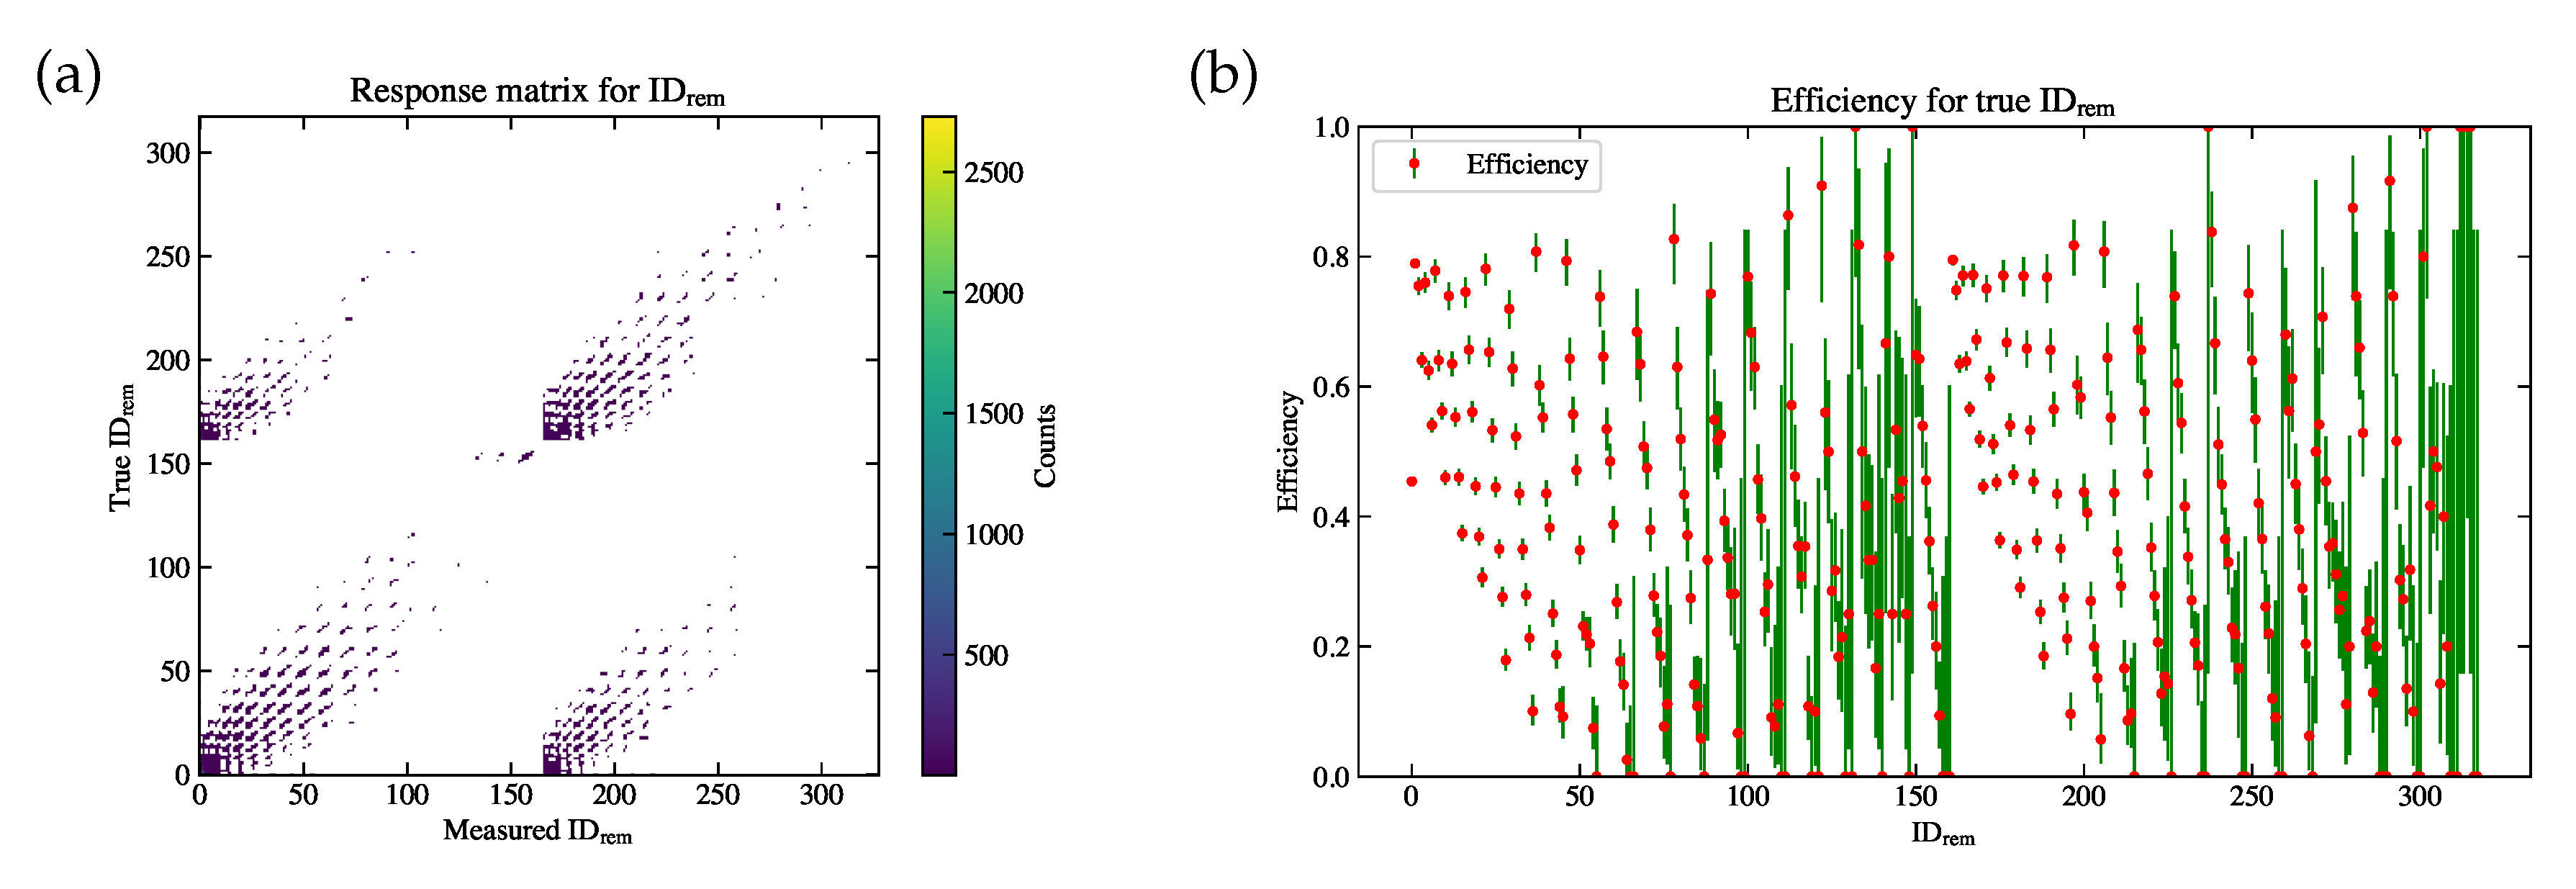
(a) The response matrix modeled using the simulation sample. The horizontal axis is
, and the vertical axis is the true
. The color bar indicates the (weighted) event counts in each bin. (b) The efficiency for each
bin. The uncertainty for efficiency is calculated according to the Clopper Pearson method [
18].
Figure 12.
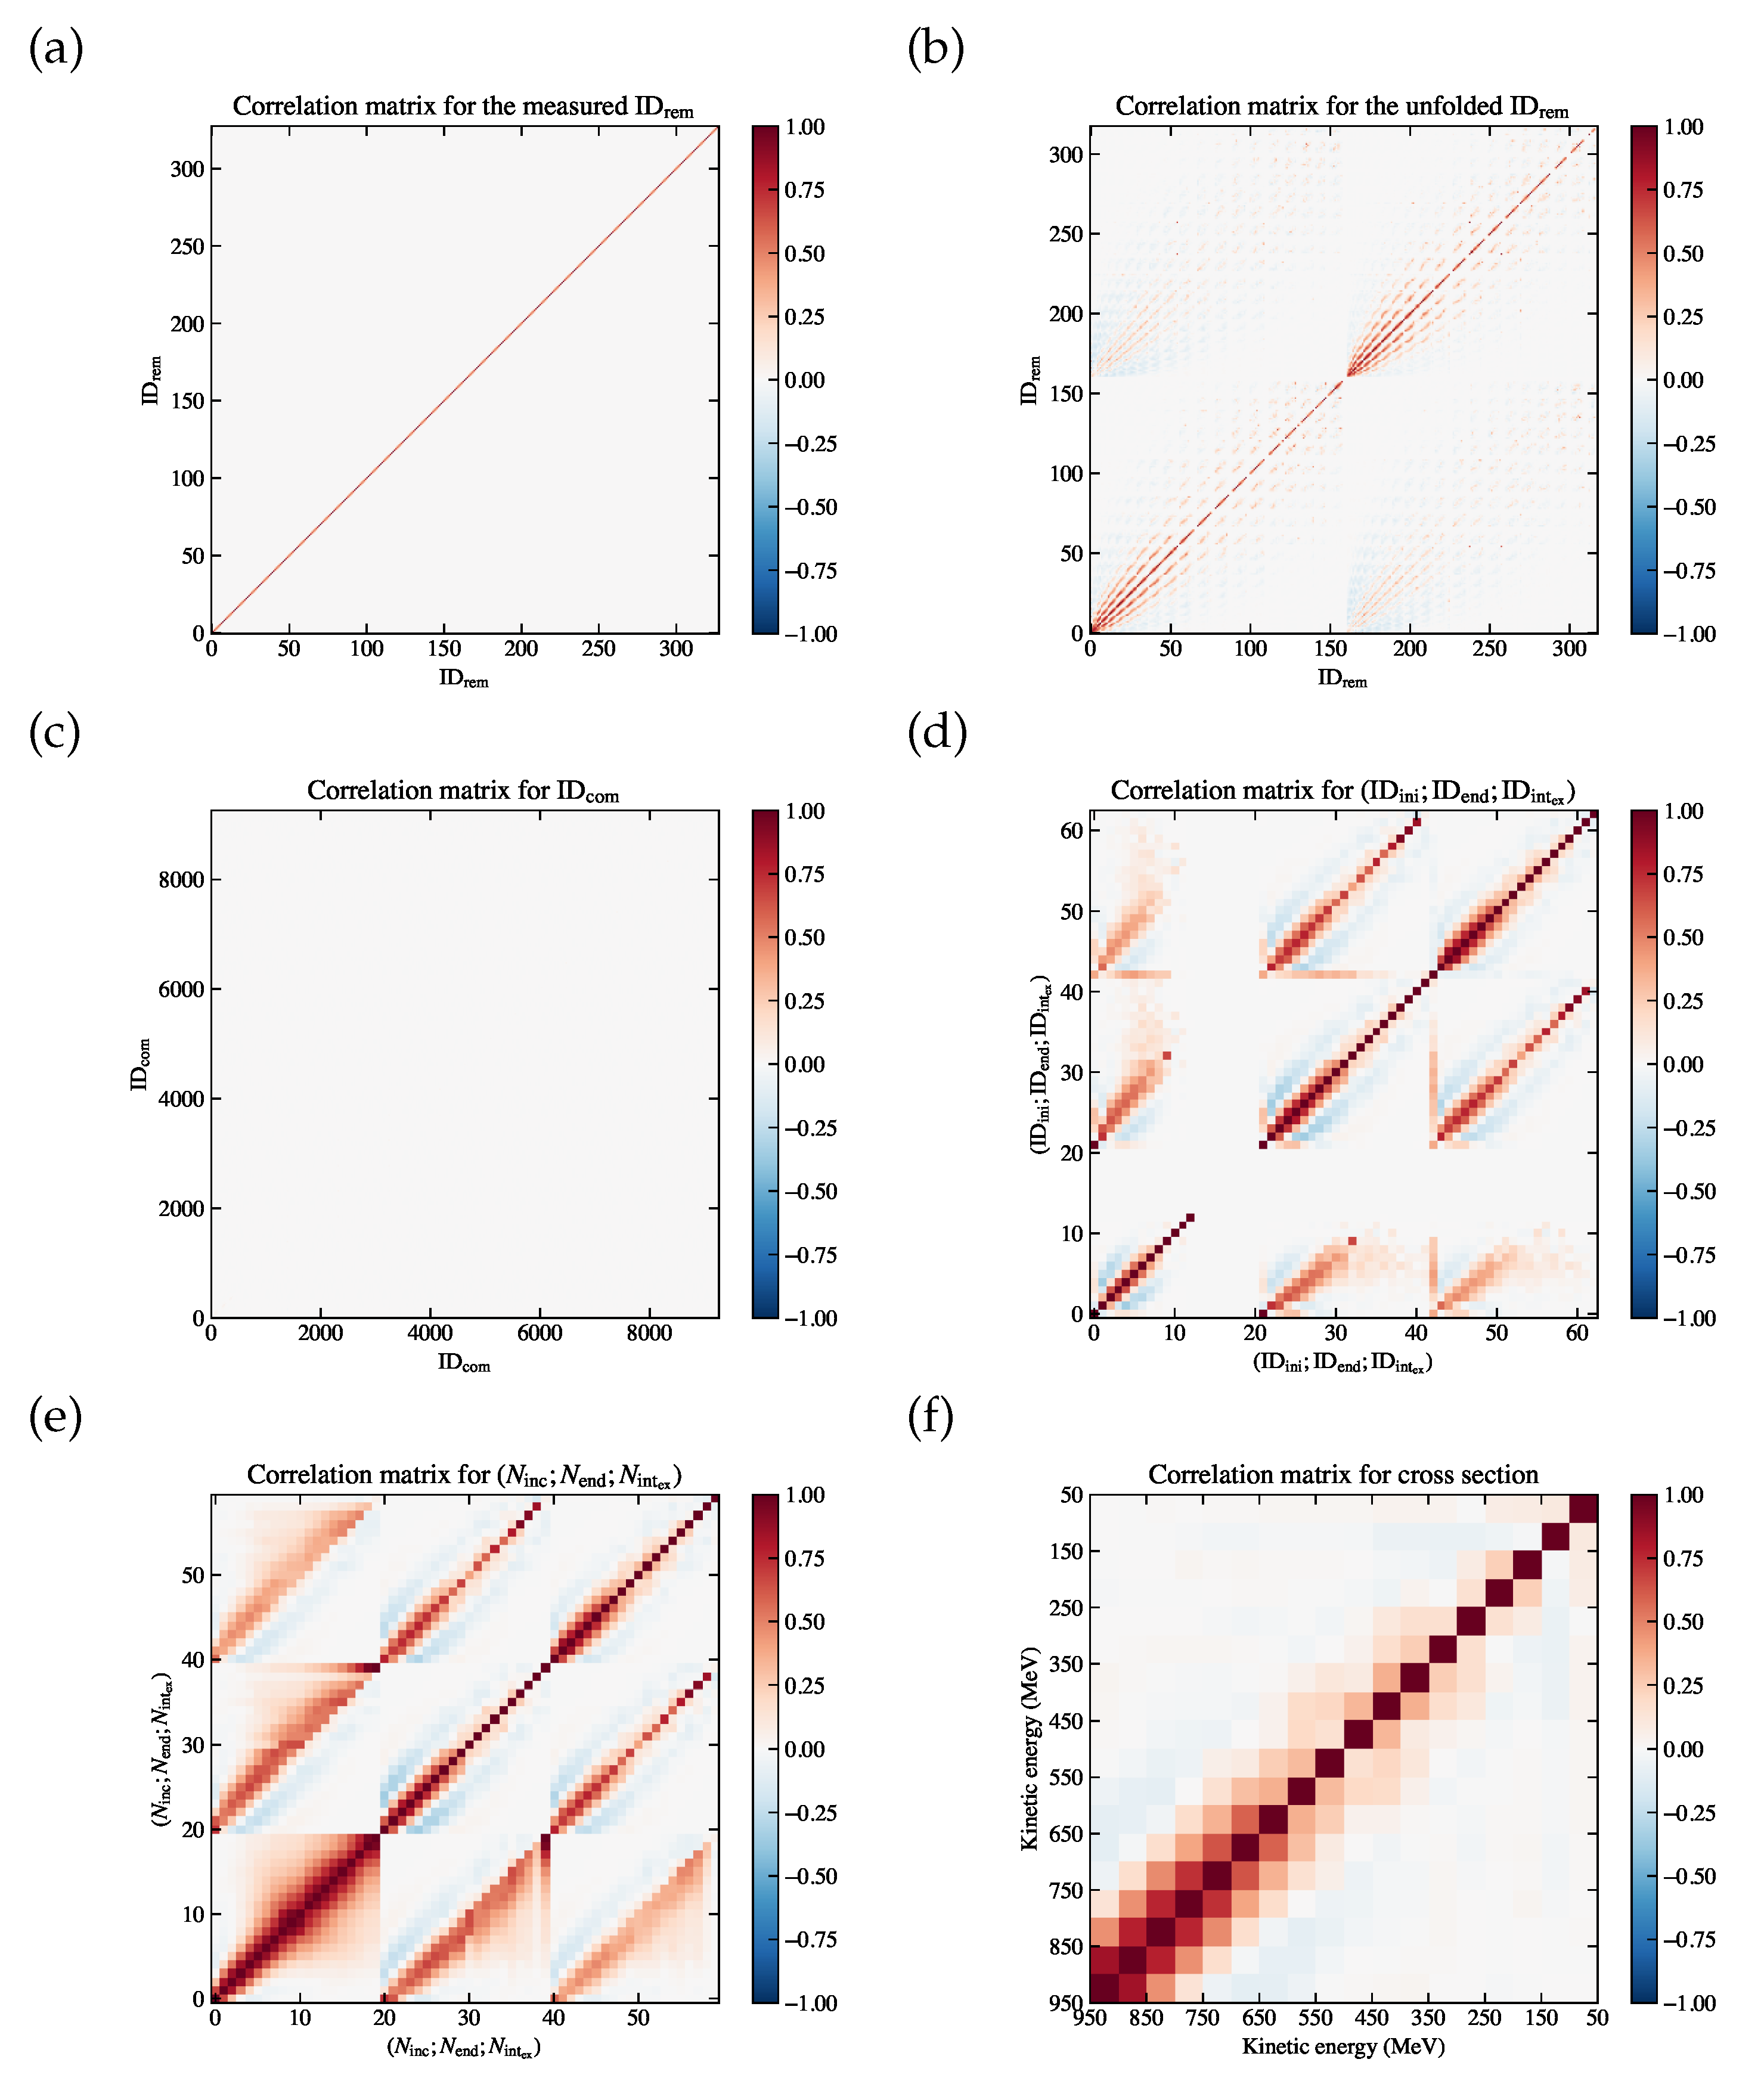
Correlation matrices for (a) , (b) , (c) , (d) , (e) , (f) the measured cross section , for the fake data sample.
Figure 12.
Correlation matrices for (a) , (b) , (c) , (d) , (e) , (f) the measured cross section , for the fake data sample.
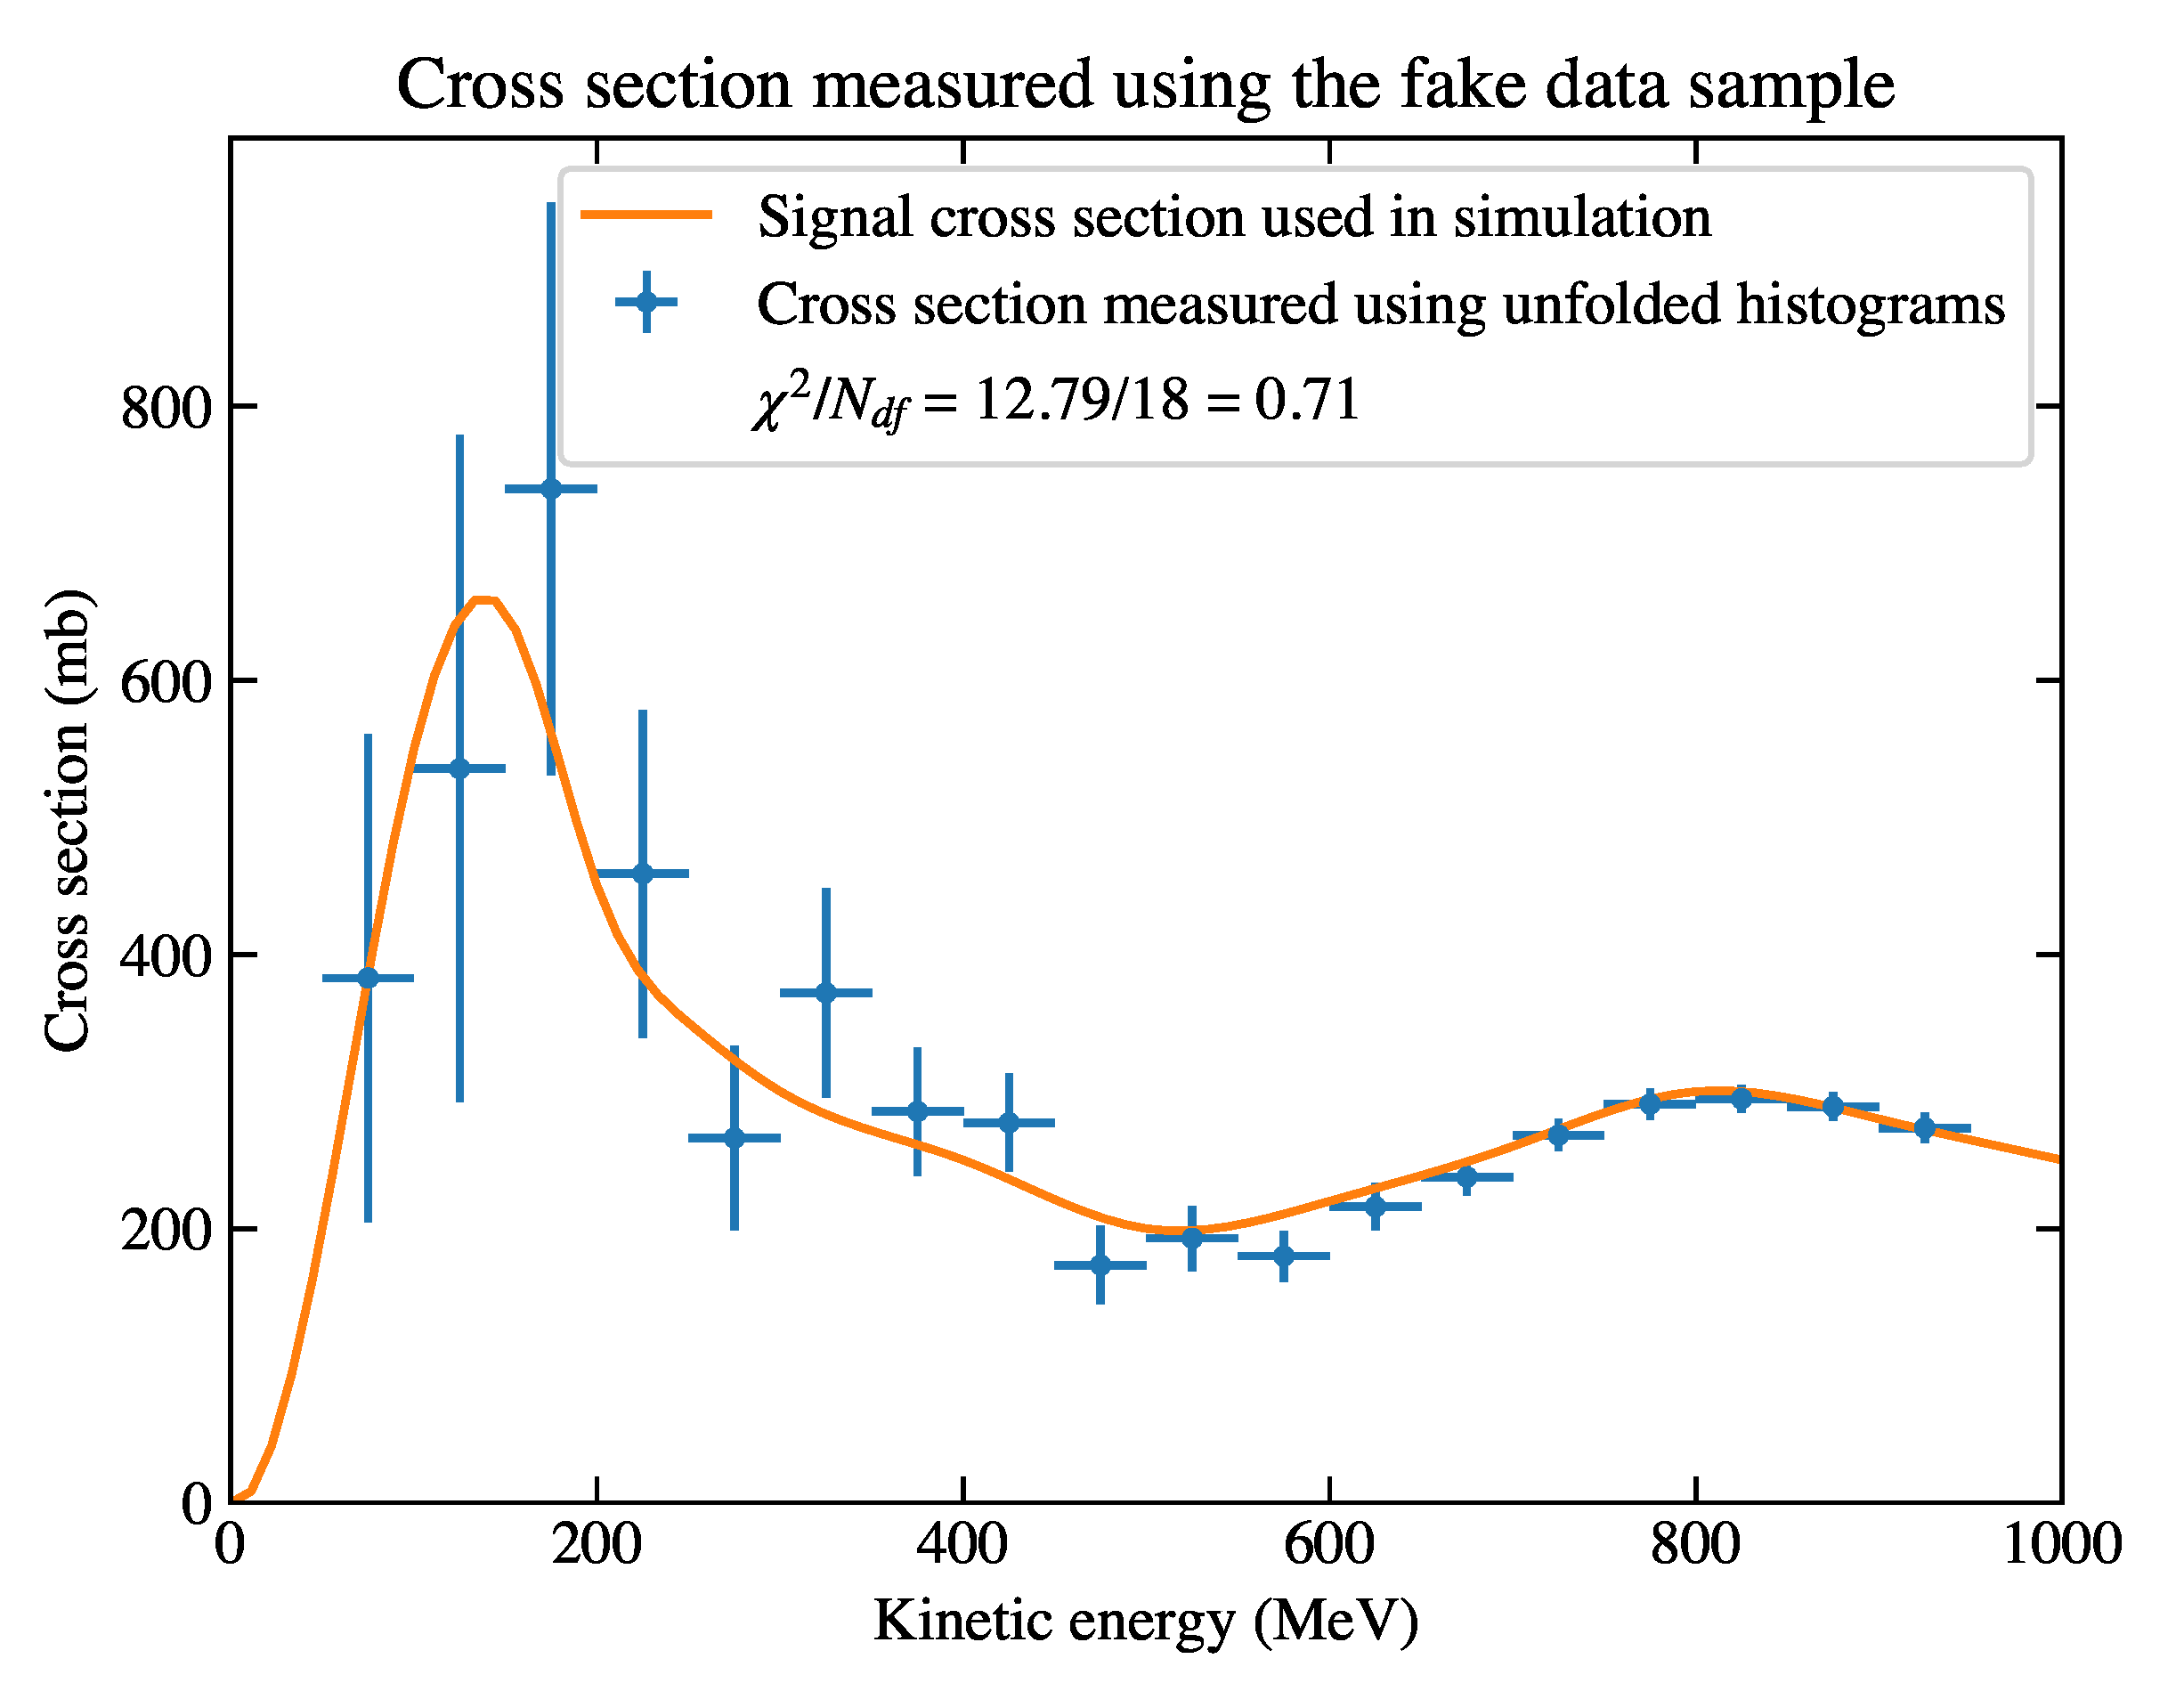
Figure 13.
The cross section measured using the unfolded histograms of the fake data sample. The reduced is approximately 1, which suggests good agreement between the sample and the input cross section.
Figure 13.
The cross section measured using the unfolded histograms of the fake data sample. The reduced is approximately 1, which suggests good agreement between the sample and the input cross section.
Figure 14.
Toy studies using the extracted true cross sections of 400 toy simulation samples. (a) The pull value test results. The horizontal axis is the energy slice index , where corresponds to the energy bin of MeV, and corresponds to the energy bin of MeV. The vertical axis is the pull value. The green lines are the pull values of each toy in each bin. The blue point and its error bars indicate and parameters of the Gaussian fit in each bin. The red lines sandwiching the blue point indicate the fit error of in each bin, which can be visually compared to the dashed orange line for its consistency with 0. The dark blue lines sandwiching the end points of the blue error bars indicate the fit error of in each bin, which can be visually compared to the dotted red line for its consistency with 1. (b) The histogram of against the simulation curve. Fitted distributions using both the maximum likelihood (MLH) fit and the least chi-square (LCS) fit are overlaid, with the result given in the legend.
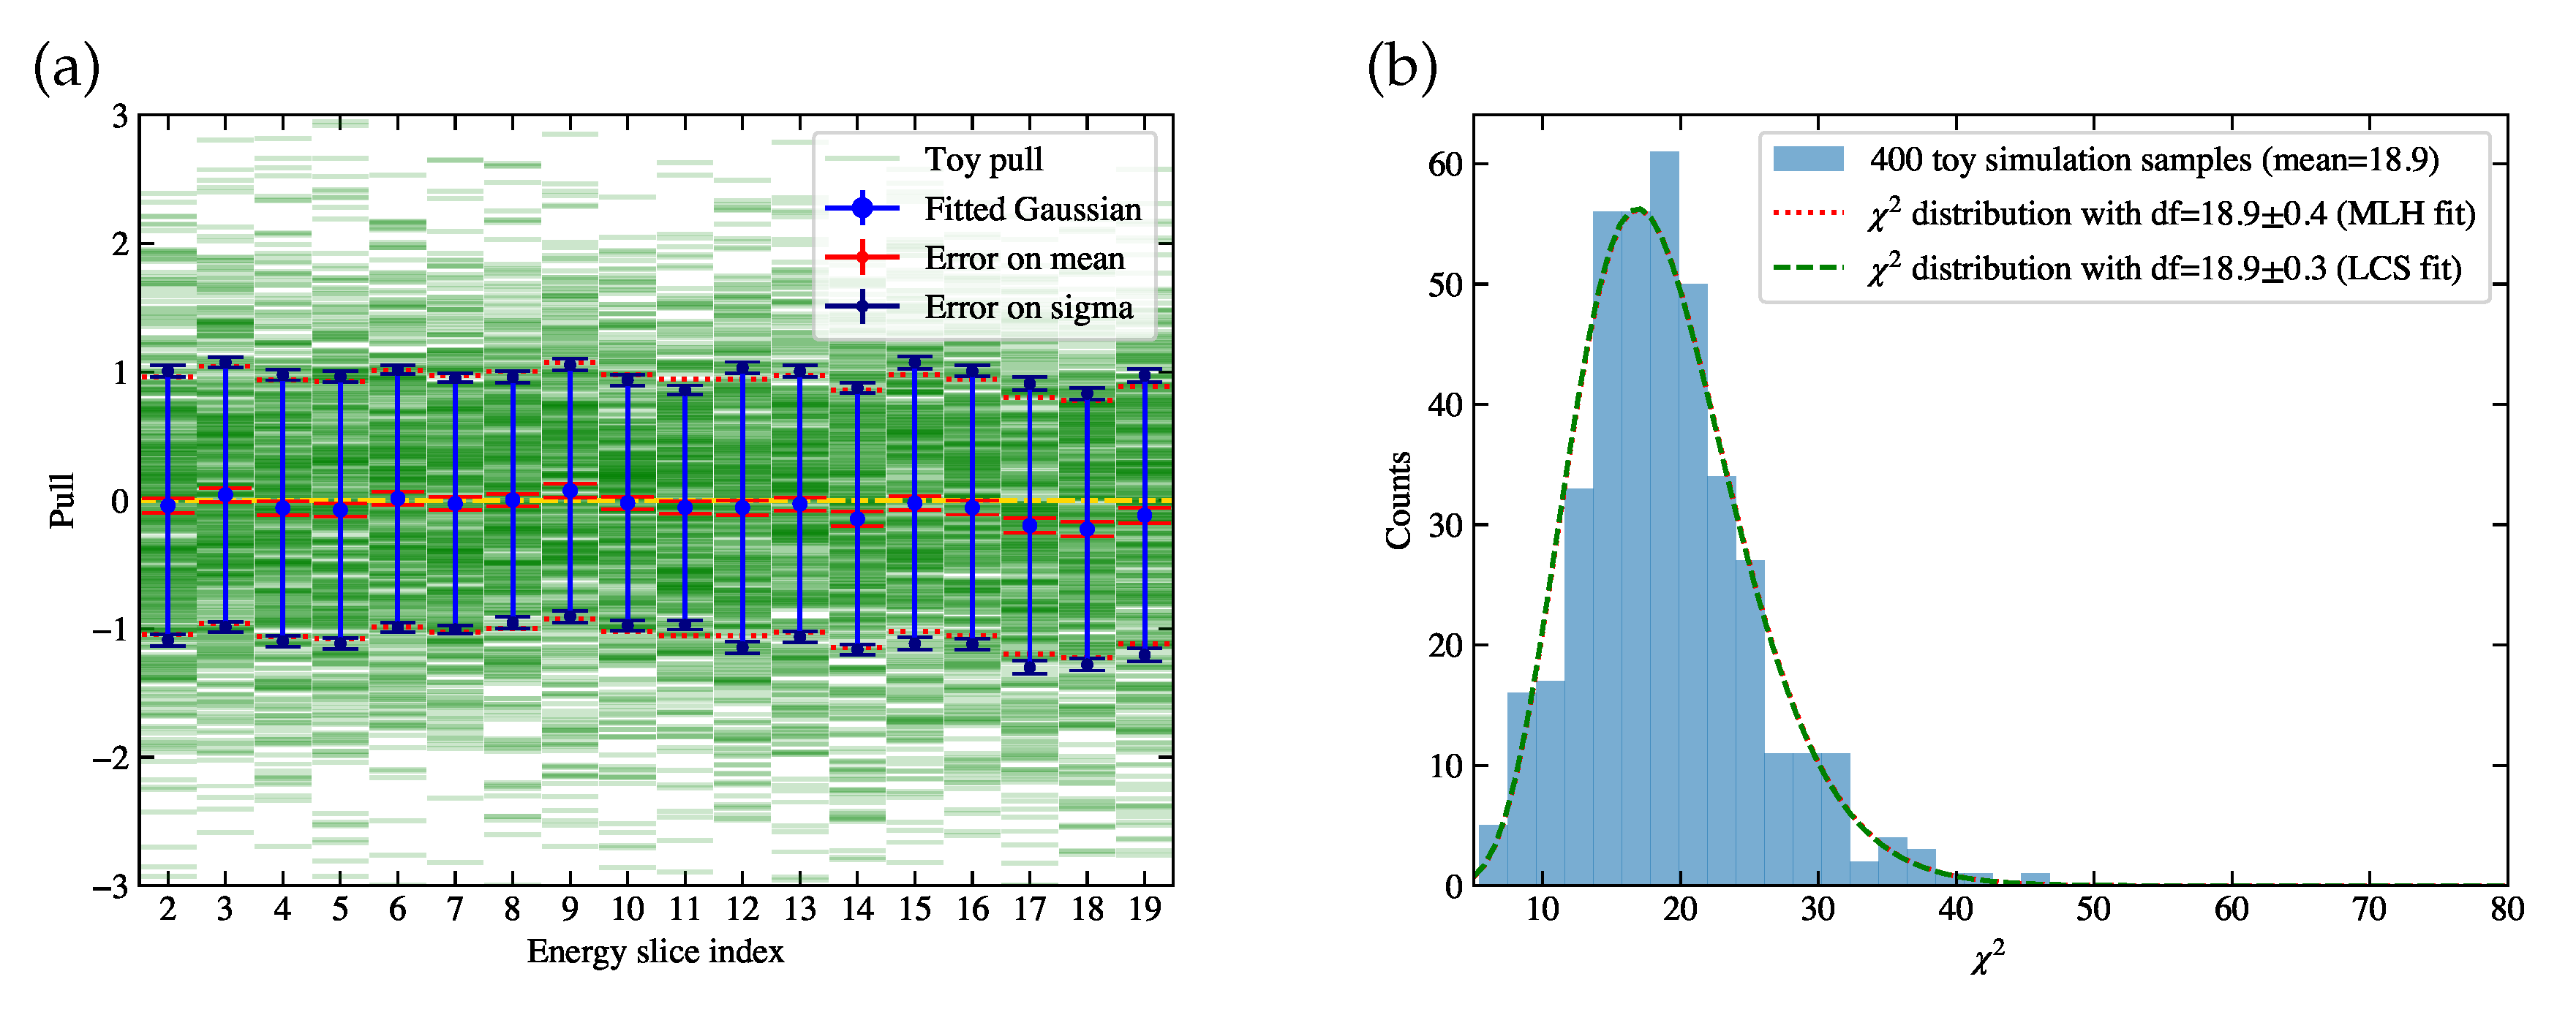
Figure 15.
Toy studies using the measured cross sections of 400 toy fake data samples. The detailed descriptions of subplots (a) and (b) are the same as described in
Figure 14.
Figure 15.
Toy studies using the measured cross sections of 400 toy fake data samples. The detailed descriptions of subplots (a) and (b) are the same as described in
Figure 14.
