Submitted:
13 December 2023
Posted:
14 December 2023
You are already at the latest version
Abstract
Epilepsy is a chronic neurological disorder characterized by recurring seizures resulting from abnormal neuronal hyperexcitability. In the case of pharmacoresistant epilepsy requiring resection surgery, identifying the epileptogenic zone (EZ) is crucial. Fast ripples (FRs; 200-600 Hz) are one of the promising biomarkers that can aid in EZ delineation. However, recording FRs requires small surface electrodes. These microelectrodes suffer from high impedance, which significantly impacts FR observability and detection. In this study, we explored the potential of a conductive polymer coating to enhance FR observability. We employed biophysical modeling to compare two types of microelectrodes: Gold (Au) and Au coated with the conductive polymer poly(3,4-ethylenedioxythiophene)-poly(styrene sulfonate) (Au/PEDOT:PSS). These electrodes were then implanted in the CA1 hippocampal neural network of epileptic mice to record FRs during epileptogenesis. Results showed that polymer-coated electrodes demonstrate two-order lower impedance and a higher transfer function amplitude and cut-off frequency. Consequently, FRs recorded with the PEDOT:PSS coated microelectrode yielded significantly higher signal energy compared to the uncoated one. The coating with PEDOT:PSS improved the observability of recorded FRs and therefore their detection. This work paves the way for the development of signal-specific microelectrodes design allowing better targeting of pathological biomarkers.
Keywords:
Epilepsy
; Fast ripples
; conductive polymers
; microelectrodes
; electrode tissue interface
; PEDOT/PSS
1. Introduction
Epilepsy is one of the most common neurological diseases that affects around 1% of the world’s population [1]. In 30 % of epilepsy cases, patients do not respond to available antiepileptic drugs [2]. For some of these patients, resective surgery can be considered as a potential treatment option [2,3]. However, a positive outcome of resection surgery highly depends on several factors including accurately identifying the epileptogenic zone (EZ) during presurgical evaluation [4]. In that regard, the capacity to rely on objective biomarkers is fundamental to defining the optimal surgical approach for each patient. Depth-EEG recordings performed with intracerebral electrodes are capable of recording local field potentials (LFPs) with a sub-millisecond temporal resolution. Fast ripples (FRs) are pathological high-frequency oscillations (200-600 Hz) observed in LFPs [5,6]. In the last two decades, they gained a vast interest in clinical applications as a possible biomarker of epileptic regions due to their high specificity [7,8,9].
FRs are mainly produced in primary sensory areas and hippocampal–entorhinal circuits of both humans and rodents [4,10,11]. They have been discovered to mirror the underlying network changes during epileptogenesis, as they can be detected weeks before the onset of the first spontaneous seizure [2]. Many studies investigated the pathophysiological mechanisms of FRs generation over the years. Recently, Al Harrach et al. [12] analyzed the evolution of FR during epileptogenesis using computational modeling and in vivo recordings from the CA1 subfield of the hippocampus of epileptic mice. They found that the generation of FRs is linked to two mechanisms: (a) the asynchronous firing of small clusters of pyramidal cells wherein each neuron fires at a frequency smaller than that of the recorded FRs; (b) hyper-excitability in the seizure onset zone which can induce distant pathological plasticity in connected remote networks [12]. This is consistent with another study about the distinct hyperexcitable mechanisms underlying FRs generation [13]
Clinical studies have not only highlighted the important role of FRs in the identification of the EZ but recently they revealed a positive correlation between removing regions generating FRs and postoperative outcome [14,15,16]. However, the accurate detection of FRs remains a challenge due to their short duration, nonstationary type, and low amplitude that often mix with background activity and noise [17,18,19]. Microelectrodes are extensively used to record pathological fast ripples (FRs) due to their ability to provide high spatial resolution and selectivity, allowing the recording of local field potentials (LFPs) from a smaller population of neurons [17,20]. However, they suffer from high impedance caused by their small size, particularly in frequencies below 1 kHz [21]. This impedimetric impact affects the recording of signals in two ways. First, the signal-to-noise ratio (SNR) level decreases due to the higher contribution of thermal noise [22,23]. Second, microelectrodes will have a high cut-off frequency of around 10 kHz. Beyond this threshold, the impedance increases by several folds due to the gradual transformation of the electrode from a resistive to a capacitive regime [21]. This switch results in phase-shift and non-linear distortion of signals which can seriously affect the quality of the recorded FRs[17,24].
Over the past few years, several high-performance microelectrode designs have been proposed with the aim of optimizing neural recording. These designs entail a tradeoff between achieving high electrical performance and maintaining adequate spatial resolution [17,25,26]. In particular, the introduction of coating microelectrodes with conductive polymers (CP) has proven to be a successful strategy for reducing the impedance and cut-off frequency of microelectrodes [27,28]. CPs are mixed ion/electronic conductors that enhance communication between ionically conductive living tissue and electronically conductive electrodes by facilitating the transfer of electrons and ions. The permeability of CPs to ions is crucial for reducing impedance and cut-off frequency, as it enables electrochemical interaction throughout the entire bulk material [29,30].
Among conductive polymers, poly(3,4-ethylenedioxythiophene)-poly(styrene sulfonate) (PEDOT:PSS) is commonly used because of its thermal, electrochemical, and moisture stability, optical transparency, low oxidation potential, and commercial availability [27,28]. It promises to improve signal transfer while maintaining the geometrical size unchanged [17]. PEDOT:PSS is synthesized through the oxidation of its monomers, EDOT (3,4-ethylenedioxythiophene), in the presence of PSS counter ions [27]. Its deposition on microelectrodes has the potential to reduce the impedance by two orders of magnitude and to push the cut-off frequency to a few tens of hertz thanks to its volumetric capacitive behavior [28,31].
Several studies have analyzed the impact of impedance on recorded signal quality focusing on LFPs and individual neuron activities. However, aside from our recent study about the model-guided design of microelectrodes to improve FRs recording [17], no other studies have investigated the impact of the microelectrode impedance on the transfer function of the recording system and its direct impact on FRs observability. In our previous study, we used in silico modeling to test FR observability with different types of microelectrode made with different materials and combined with different coatings [17]. We concluded that using PEDOT/PSS coated microelectrodes can improve FRs observability [17]. There was concern, however, that the results were only based on one day of in vivo recordings. In this study, we investigate the effect of the tuning of a Gold (Au) microelectrode impedance through the coating with PEDOT:PSS (Au/PEDOT:PSS) and its impact on FRs observability during epileptogenesis using a Kainate mouse model of temporal lobe epilepsy. To quantify the impact of PEDOT:PSS coating we developed equivalent circuit models and compared the observed FRs energy feature contents for Au and Au/PEDOT:PSS microelectrodes.
2. Materials and Methods
2.1. Electrode preparation
Gold wires with a diameter of 0.125 mm, insulated by polyester, were procured from the Goodfellow company. A pair of wires was joined together using super glue and insulated with a 2 m layer of Parylene-C (applied using the PDS 2010 CSC deposition system). The electrode tips were delicately wet-polished on silicon 2000 paper at 50 rpm using the Structure Labopol-5 to expose the recording sides and subsequently soldered to the connector (obtained from Digikey, part number 850-10-050-10-001000). PEDOT:PSS was electropolymerized on the electrodes using an aqueous solution containing 0.01 M 3,4-ethylenedioxythiophene (EDOT) and 0.1 M Sodium Polystyrene Sulfonate (NaPSS) under potentiostatic conditions at 1.1 V for a duration of 50 s (Metrohm Autolab B.V) [32]. The applied voltage was referenced against the Ag/AgCl reference electrode.
2.2. Electrodes modeling
Impedance measurements were conducted potentiostatically at a voltage of 0.01 V with respect to the reference electrode, spanning the frequency range from 1 Hz to 10 kHz. The Bode plot of the Au and Au/PEDOT:PSS microelectrodes are depicted in Figure 2.A. The mean values averaged for the five electrodes of each type (coated and uncoated) are given in Table 1. These measurements were modeled using equivalent circuits in Nova 1.2 software (Metrohm Autolab B.V.) to assess the electrochemical characteristics of the interface. The chosen circuits were adapted from the Randles circuit, and modified based on the surface coating. Specifically, we introduced a model for the resistance to current flow induced by ion migration, represented by spread resistivity (). This component varies based on the size of the electrode and the resistivity of the interfacing solution. The non-faradic portion of the current in impedance measurements was quantified by the double-layer capacitance (). For faradic current modeling, we incorporated a charge transfer resistivity (), as well as a Warburg element (W), and a constant phase element (Q). W reflects the impedance dependence on frequency, showing the diffusion of solution species towards and away from the electrode-electrolyte interface due to a gradient in ionic concentration. Q models the surface imperfections and the porosity of the interface, gauging the proximity of the interface to an ideal capacitor [32]. The surface morphology of the electrode was imaged before and after the PEDOT:PSS coating using scanning electron microscopy (SEM) (Carl Zeiss Ultra55). The images were captured with the secondary electron detector (SE) at 5 kV (Figure 1.A and B).
2.3. Transfer function definition
Based on the equivalent circuits of the Electrode Tissue Interface (ETI) presented in Figure 2.B, the transfer function of the system defined by the reatio between the input and output voltage () is given by Eq. (1). The resistivity of the cables and connectors was assumed negligible. has the form of a voltage divider before the amplifier [21,24].
Depending on the coating, the impedance of the electrode can either follow Eq. (2) for Au or Eq. (3) for Au/PEDOT:PSS electrodes.
Additionally, the system is also composed of connectors and wires to the amplifier. It is shown by a shunt Capacitance , depicted on Eq. (4). It is composed of a parasitic capacitive effect from the microwires being emerged in the medium, usually, a few pF [33]. The connectors, wires, and amplifier add another capacitance, which can range from 10 pF to 100 nF. In the presented ETI model the was considered to be equal to 3 nF [24,34].

Table 1.
The mean values of the equivalent circuit elements used in the ETI model for the Gold (Au), and PEDOT/PSS coated Gold (Au/PEDOT:PSS) electrodes of 125 diameter.
Table 1.
The mean values of the equivalent circuit elements used in the ETI model for the Gold (Au), and PEDOT/PSS coated Gold (Au/PEDOT:PSS) electrodes of 125 diameter.
| Circuit | Au | Au/PEDOT:PSS |
|---|---|---|
| Elements | ||
| 3 | 3 | |
| 12.24 | — | |
| 1.036 | 1.73 | |
| 10.97 | — | |
| — | 10.24 |
1 Au: gold electrode, Au/PEDOT:PSS : PEDOT:PSS coated gold electrode.
2.4. Experimental recordings
Intracerebral ElectroEncephalography (iEEG) recording of freely moving animals was performed on a set of five () male mice of 8 to 12 weeks old in accordance with the Kainate mouse model of epilepsy[35]. This animal model was chosen for homology with human mesial temporal lobe epilepsy (MTLE)[36]. During the surgery, anesthetized and analgesized animals are positioned in a stereotaxic frame (Figure 3.A). 50 nL of a 20 mM solution of kainic acid (KA; Sigma-Aldrich) in 0.9% NaCl is injected in the dentate gyrus (DG) of the right hippocampus (RH), at the coordinates AP=-2.0 mm, ML=-1.5 mm, DV=-2.0 mm (all coordinates from bregma), through a cannula of 0.2 mm of diameter.
Two pairs of wire electrodes were implanted in the right (RH) and left (LH) hippocampus, above the DG region (Figure 3.B). The first pair of electrodes consisted of one Au and one Au/PEDOT:PSS wires glued together and inserted in the RH (AP=-2.0 mm, ML=-1.5 mm, DV=-2 mm). The second pair consisted of two Au/PEDOT:PSS microelectrodes and was implanted in the LH (AP=-2.0 mm, ML=+1.5 mm, DV=-2 mm). The electrodes placements were determined according to the atlas of the mouse brain (“Paxinos and Franklin’s the Mouse Brain in Stereotaxic Coordinates [37]). Finally, a stainless steel (SS) electrode was inserted in the skull above the cerebellum as a reference. The wires were all soldered to a connector fixed to the mouse’s skull via dental acrylic cement. Recording sessions of iEEG were performed on days 2, 4, 7, 9, and 11 post-implantation (Figure 3.C). During these sessions, the mice were placed in individual transparent cages inside a Faraday cage and connected to the recording system (Deltamed TM) for two hours at a sampling frequency of 2048 Hz. The initial hour is dedicated to habituation and is not taken into account during subsequent signal processing. This experimental procedure respected the European Union directive in use (Dir ) and was approved by the ethics committee on animal experimentation of Rennes and received agreement from the French national legal entities (agreement N APAFIS # 7872-2017031711448150).
2.5. FRs identification and analysis
FRs underwent manual classification using time and frequency criteria. Events were designated as true FRs if they adhered to the following conditions: i) including at least four clear oscillations in the FRs band (200-600 Hz). ii) having the amplitude of an oscillation at least twice the amplitude of the background. iii) evoking a well-defined spot on the spectrogram, that is not a harmonic of lower frequency oscillations like Ripples (R; 120-200 Hz). These benchmarks are critical since FRs are easily mistaken for noise and artifacts due to the presence of many sharp events. In addition, the band-pass filtering of FRs is misleading since it can lead to misinterpretation of “false-Ripples” [38].
The manual classification process consisted of several steps that are portrayed in Figure 4.A. First, a spectral decomposition was done using a convolution between the signal and Gabor wavelets (Adapted from Ref [39]). Eight Gabor functions are defined to decompose the signal on a filter bank defined by the following frequency bands: [0.5–3.5 Hz], [3.5–8 Hz], (8–15 Hz), (15–30 Hz), (30–80 Hz), High- (80–120 Hz), R (120–200 Hz), FR [200–600 Hz]. The background activity was defined as the signal recorded in the frequency band ranging from to R (3.5–200 Hz). Then after visual pre-selection and classification, the time frames identified as true FR contained the high-frequency event itself along with the activity before and after as depicted in Figure 4.B. Finally, the segmentation of the FRs to determine the time index of the onset and offset was carried out using the algorithm outlined in [40]. An example of the segmentation results are displayed in Figure 4.C and D in the frequency and time domains respectively. The comparison between the two kinds of electrodes was conducted by comparing the energy of the same recorded FR in the FR and Background bands, defined by Equations . (5) and (6).
where and refer to the same signal in the FR and Background bands, respectively.
3. Results
In this study, we evaluated the impact of the microelectrode impedance tuning on the quality of the recorded FRs. Accordingly, we coated standard Au wire electrodes with PEDOT:PSS to study the relation between impedance tuning and FR observability. The electrodes were prepared in pairs as portrayed in Figure 1. The SEM micrographs, presented in Figure 5.A, showed that the morphology of PEDOT:PSS coating is highly dependent on the surface roughness. Therefore, the resulting PEDOT:PSS roughness is due to the surface structure itself. Electrochemical impedance measurement (EIS) was employed to verify the performance of the fabricated electrodes. After coating the Au electrodes with PEDOT:PSS, as predicted the impedance dropped by two orders of magnitude (Figure 2.A). In particular, at 500Hz, it decreased from 110 ± 1.5 k to 1.612 ± 0.2 k. This decrease is due to the PEDOT:PSS volumetric capacitive behavior [28,29]. To characterize the PEDOT:PSS coating we used Cyclic voltammetry (CV) in the same electrochemical cell. Figure 5.B shows the CV curve of the Au/PEDOT:PSS microelectrode obtained in an aqueous solution. After 400 consecutive oxidation–reduction cycles at a scan rate of 100 mV/s [32], the PEDOT:PSS electrochemical properties remained unaltered. Lastly, we measured the impedance variation at 1 KHz over 4 weeks. The impedance magnitude plot is depicted in Figure 5.C in . We observed a slight increase in the impedance over the first week then it decreased to its original value in the following couple of weeks to settle at 2.25 throughout the last week of monitoring indicating its stability (Figure 5.C).
To evaluate the change in the cut-off frequency after coating with PEDOT:PSS, we analyzed the equivalent circuit transfer function (H()) variation. Figure 2.C depicts the transfer functions of the Au and Au/PEDOT:PSS microelectrodes in Bode plot form. As predicted the transfer function of the system (Figure 6) predicts a low-pass filtering effect on the signal, where the shunt capacitance tunes the cut-off frequency. For the Au electrode (without coating), the transfer function does not present a typical profile (Figure 6). There is no predominant capacitive or resistive profile. From 1 Hz to 3 kHz, the slope of the attenuation is -1.1 dB/dec, starting at -3.12 dB. After this point, the slope becomes sharper. At 400 Hz, in the middle of the FR band, the gain of the Transfer function is around -12 dB for = 1 nF. In the case of coated electrodes, the cut-off frequency of the ETI seems to be towards the end of the FR band (Figure 6). Based on the transfer function phase variation, in the FR and lower frequency bands, the phase of the signal should not be altered. The improvement in the filtering effect of the microelectrode after coating is directly related to the decrease in the impedance. The PEDOT:PSS coating shifted the capacitive behavior of the electrodes to a frequency as low as 63 ± 0.1 Hz (Figure 2.B). This is reflected in the transfer function cut-off frequency variation which represents the electrode’s transition from resistive to capacitive behavior[21].
From an electrochemical point of view, the spread resistivity( ) remained unchanged before and after PEDOT:PSS coating at 2 ± 0.1 k since it only depends on the electrode’s geometrical size. increased by three orders of magnitude from 6± 0.5 nF to 1.32 ± 0.12 F as PEDOT:PSS is deposited. rised from 1 ± 0.01 to several G after PEDOT:PSS deposition which signifies that the polymeric film acted as an ideal capacitor and hindered charge transfer at the electrode-electrolyte interface. So, we can safely remove the component from the circuit for the Au/PEDOT:PSS electrode. Due to the rough surface of the Au wires before coating with PEDOT:PSS, we used the constant phase element which accounts for imperfections on the surface with the n value around 0.890 hich is due to the surface roughness as shown in SEM image (Figure 5.A). After coating, the n value of the constant phase element is almost 1 which reflects the capacitive behavior of PEDOT:PSS. Therefore for PEDOT:PSS coated electrodes, we replaced the Q with the Warburg element to model diffusion mass. The value of the Warburg element is 11 ± 0.3 which is quite low in comparison with bare electrodes (840 k). It translates to the resistivity of the system for any mass transfer[41] (in this case, charge) due to PEDOT:PSS coating. This result is in excellent agreement with the cut-off frequency variation.
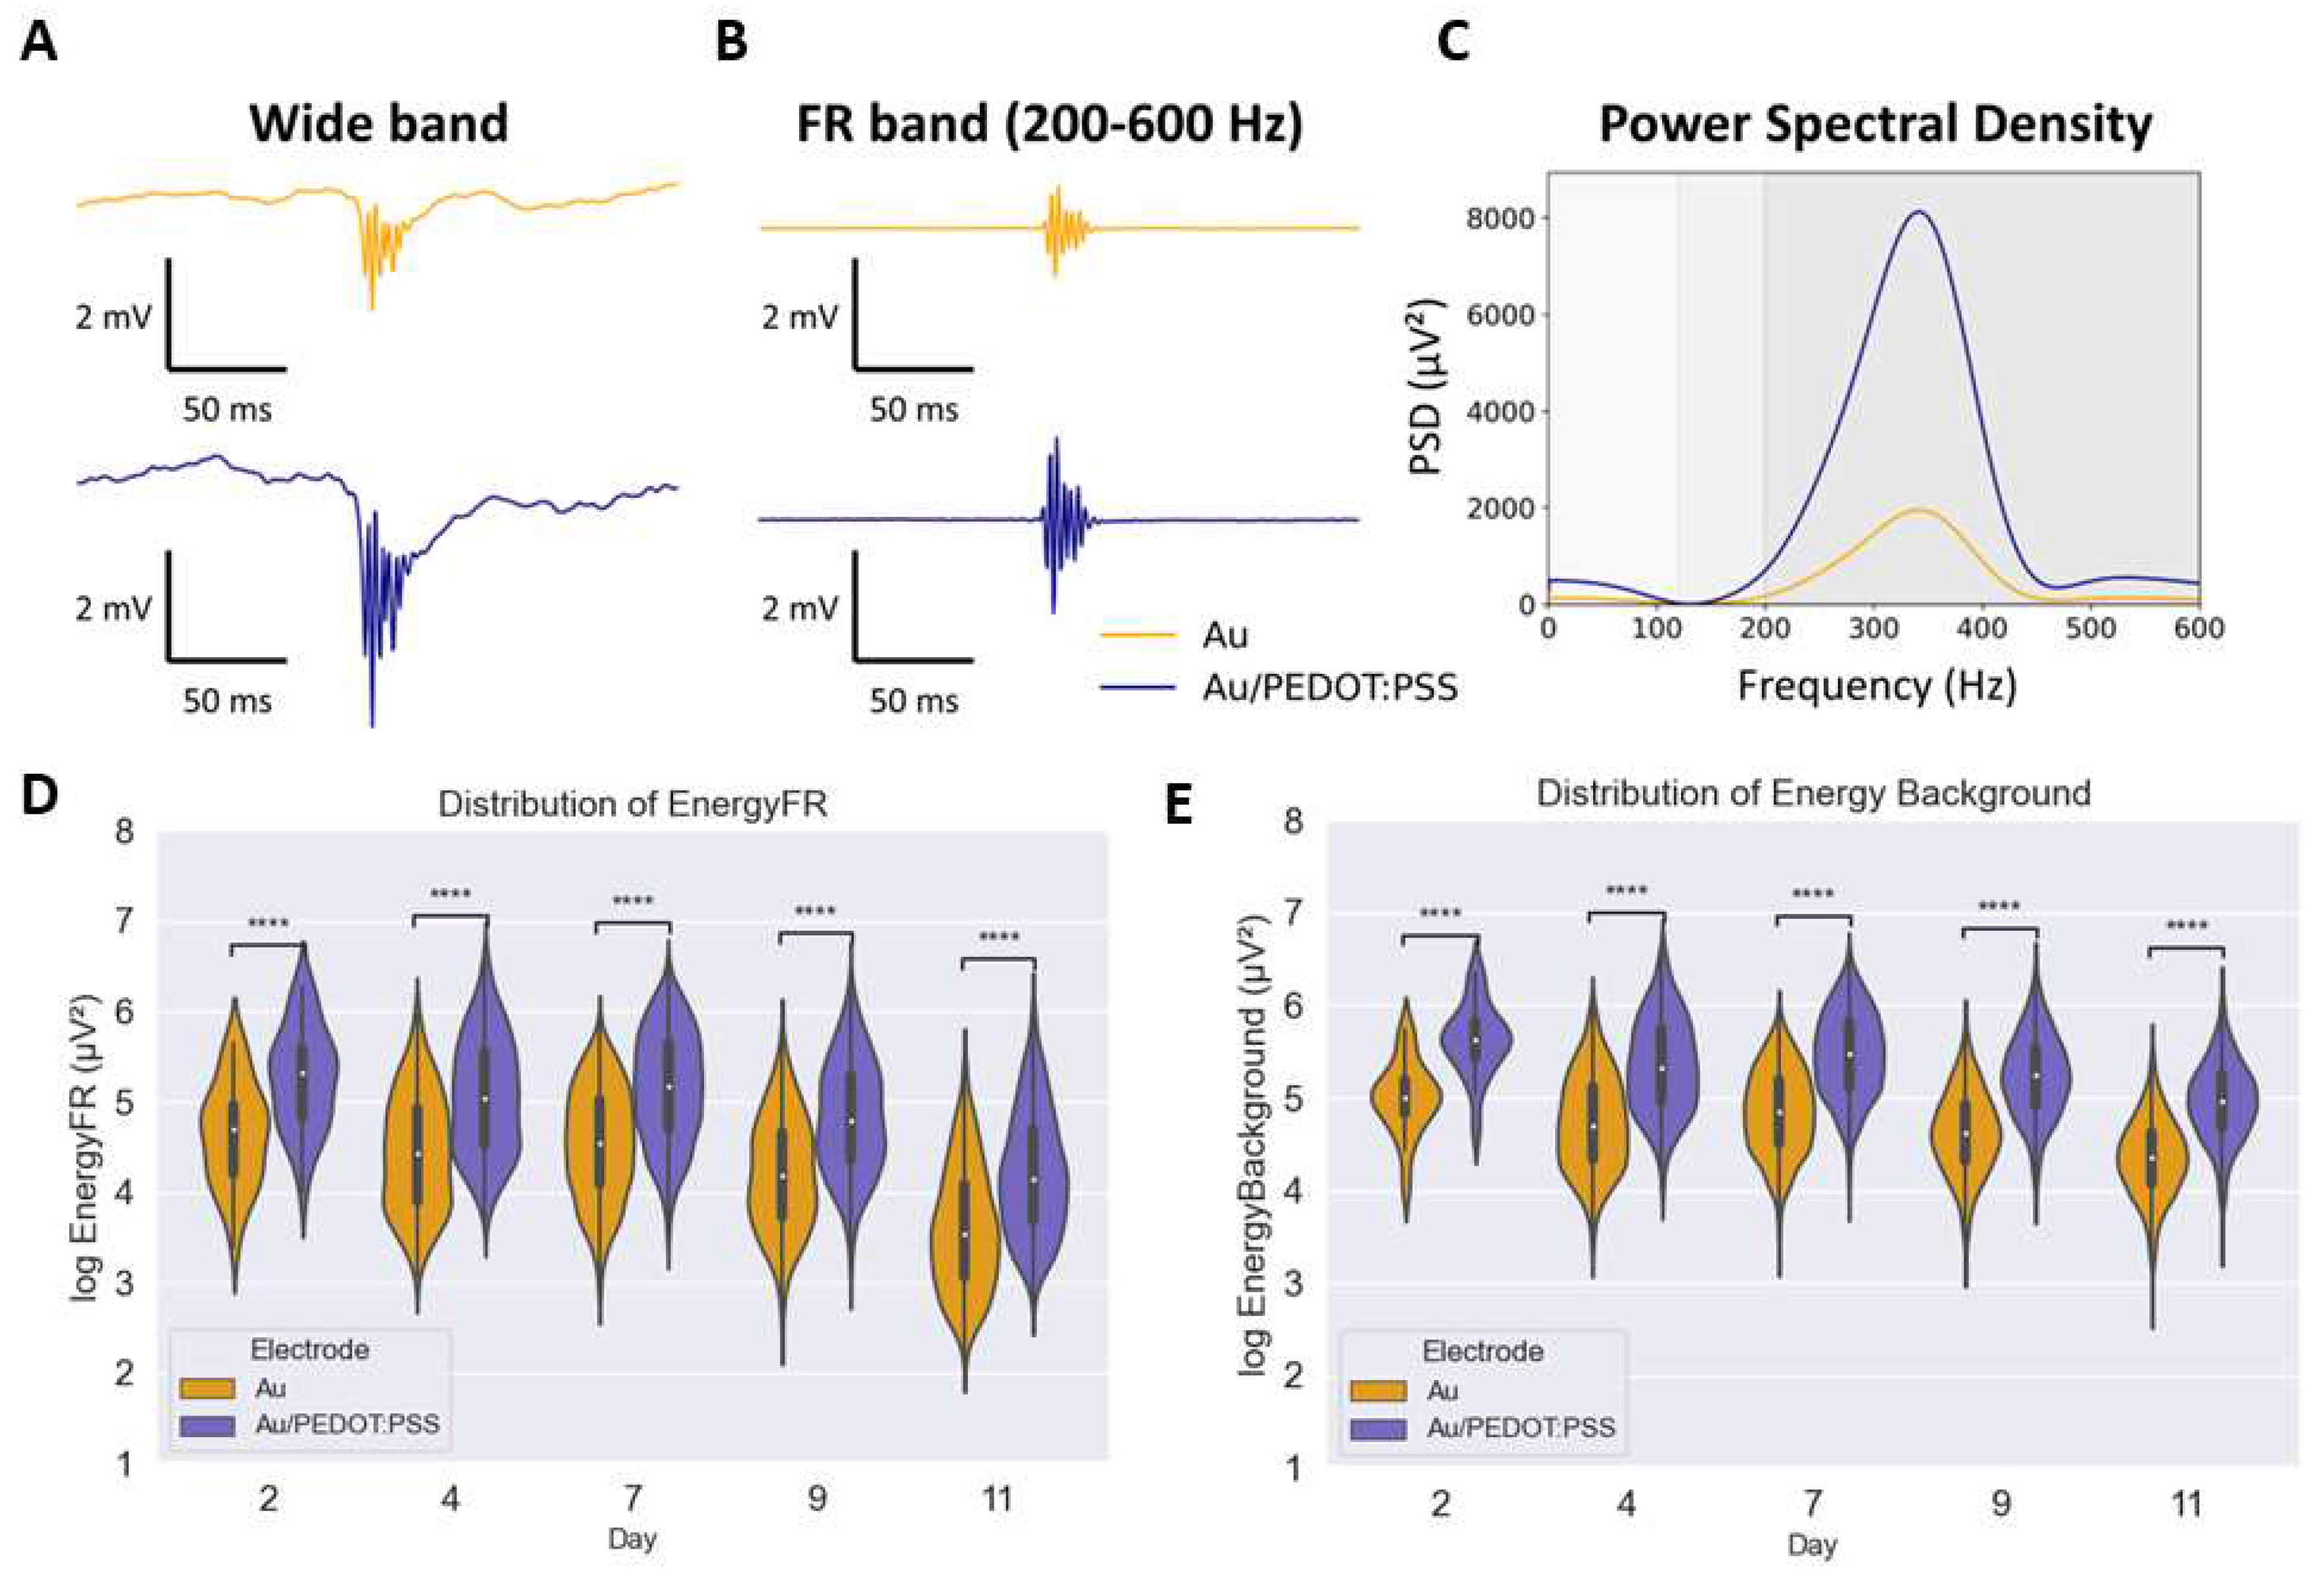
For the segmentation of fast ripples (FRs), we employed the pipeline depicted in Figure 4. This process relies on the visual detection of FRs and subsequent filtering within the frequency band of 200-600 Hz, as explained in detail previously. The analysis of the iEEG recordings shows that the number of FRs varies greatly each day, from 55 on day 2; 336 on day 4; 1791 on day 7; 627 on day 9; and 1713 on day 11. The energy in both FR and background bands was found to be higher for signals recorded with the Au/PEDOT:PSS electrode compared to the Au one, as shown in Figure 7. Both box plots depicted in Figure 7.D and E ) follow the same trend. The energy of the recorded FRs has a similar distribution from day 2 to day 7. However, on day 9, the energy is attenuated on both electrodes and in both the background and the FRs frequency bands. Considering day 2 as the reference: the median value of the energy for the FR band attenuates by 11 % and 10 % for Au and for Au with PEDOT:PSS, respectively. In the background band, the attenuation is slightly inferior, with 7 % on both electrodes. On day 11, this number decreases even more to 25 % and 22 % for Au and Au/PEDOT:PSS electrodes, respectively. The equivalent numbers in the background bands are 13 % and 12 % for Au and Au/PEDOT:PSS respectively. A one-tailed paired samples t-test was performed between the two time series recorded on each day. It revealed statistical significance, with a p-value always inferior to . Therefore, coating electrodes with PEDOT:PSS makes visual detection easier since it gives signals a higher amplitude. However, the improvement is on all frequencies and not only on the FR band. In the FR band, the difference of energy between the electrodes is 6.3 dB on day 2; 6.1 dB on day 9; and 6.2 dB on day 11; based on the median values. On the background band, the difference in energy is very similar: 6.2 dB on days 2 and 9, and 6.1 dB on day 11. Hence, the energy recorded with the Au/PEDOT:PSS is on average 4 times higher than with the Au wire, which would match the prediction of the model for the Transfer Function of the system in Figure 6.
4. Discussion
PEDOT:PSS-coated electrodes are widely used in modern bioelectronics and neural recordings [27,32,42,43]. They have been referred to as the new golden standard for neuroelectronic interfaces [42] since they can improve the SNR ratio during the recording of LFPs [44]. In the context of epilepsy, they can offer a solution to the FR recording issues related to microelectrodes’ high impedance and mechanical mismatch with the brain tissues. However, there is a lack of studies that specifically address the problem of improving FR observability by lowering the impedance of the electrode. In our recent study [17] we investigated using computational modeling the impact of PEDOT/PSS voting on the quality of recorded FRs. This study included preliminary in vivo results that showed that PEDOT/PSS can record FRs with higher energy compared to Au and stainless steel wires. Still, the in vivo results were not conclusive, since they were based on one recording day, and only 2/3 of the mice presented this improvement in the recorded FR signals. This study aimed to experimentally validate the improvement of FR observability and visual detection using PEDOT: PSS-coated gold wire microelectrodes with an improved experimental scheme.
Regarding FR detection, it should be noted that, although various detectors have been used for the automatic detection of FRs, their outcome is highly dependent on the detector type and parameters. As a result, visual detection of FRs is still the golden standard in the field [9]. The results presented in this work indicates that Au/PEDOT:PSS microelectrodes significantly increase the energy of the signal of the signal of interest compared to Au microelectrodes throughout the two weeks of postimplantation recording (Figure ). These findings validate the results presented in the previous study [17] and also suggest that using PEDOT/PSS coated microelectrodes can improve FRs observability and thereupon their detection.
Another result that was observed in this work concerned the signal energy variation postimplantation. According to the segmented FRs, the energy of the signals decreased after the seventh recording day (Figure 7.D and Figure 7.E). This can be explained by the formation of scar tissue around the electrodes. The insertion of the electrodes in the brain triggers a complex trajectory of immune responses which encapsulate the probe with a dense scar. Several events are assigned to the foreign body reaction; including the insertion trauma, the disruption of the blood-brain barrier, and the presence of the probe itself [45]. The main reason behind this cascade is the mechanical mismatch between the brain tissue (young modulus of 200 to 1500 pa) and the electrodes (for example 50 Gpa for silicon probes). Accordingly, the scar tissue, which encapsulates the electrode, can be as thick as 100 m[46,47]. This phenomenon reduces the number of neurons close to the implant and disturbs the impedance of the electrodes. Previous works, based on in vivo impedance spectroscopy, investigated the properties of this scar tissue [46,48]. In particular, Charkhkar et al.[49] observed that the main increase of the impedance takes place during the first week postimplantation then it stabilizes for the PEDOT-coated microelectrodes making it more suitable for chronic implantation compared to the Au one. They attributed this conclusion to improved coupling between microelectrode and brain tissue. This is consistent with our results where we found that the decrease in the signal’s energy after day 7 was significantly lower in the case of PEDOT:PSS coated electrodes. In addition, the ratio of the FRs energy to the background energy was significantly higher for day 11 (P<0.0001) for the Au/PEDOT:PSS microelectrode compared to the Au one. This suggests that for Au/PEDOT:PSS, the attenuation due to the ETI is lower in the FR band compared to the background. This was expected from the transfer function of the system (Figure 6). However, this transfer function did not take into account the scar tissue layer.
Another point to mention would be that we considered the wires’ resistivity null. This resistivity is due to the insulator surrounding the electrodes in the conductive medium of the brain. Its value is equal to a few pF [33]. Moreover, the impedance of the amplifier was equal 50 M according to the technical documentation (Deltamed TM) which we assumed to be infinite. These approximations allowed us to simplify the equivalent circuit since the input of the amplifier is the potential of a capacitance that also accounts for the various parasitic effects in parallel. Nonetheless, the value of the equivalent capacitance is unknown. In the same plane, the effect of the soldering and the connectors and wires contribution is not known either. Our observations show a constant difference of 6 dB between the two materials tested in this study. Therefore, one can only speculate that one of the parasitic capacitance is in the order of 1 nF, and is predominant compared to the others. Accordingly, our model would portray very well the Transfer Function of the system and could be applied to other materials.
The present study is limited by the number of animals used in the in vivo recordings. In addition, the number of recorded FRs varied greatly between the recording sessions. This can be explained by the inherent variability of the kainate model [36], in which epileptogenesis progresses at a different rate in each animal. Furthermore, the rate of FRs is related to the activity of the animal, which is conditioned by its amount of stress. Nonetheless, the high number of segmented events is enough to deduce pertinent results that are in line with our previous findings in [17]. Future work will focus on the influence of the mechanical properties of the electrode on the intensity of the inflammatory response and scar tissue formation. The electrical properties of gliosis caused by the electrode implantation can be improved through PEDOT:PSS coating (reduced mechanical mismatch between the microelectrode and the brain tissue) and should be further investigated. This work proposes new and improved recording microelectrodes specific to the recording of FRs. These PEDOT:PSS coated electrodes contribute to better FR detection results by increasing their observability. Accordingly, they can improve EZ delineation during presurgical evaluation.
Author Contributions
Conceptualization, H.M.,G.Dauly, A.EM. and M.AH.; methodology, G.Dauly, M.AH., F.W., H.M.; validation, G.Dieuset; investigation, H.M., G. Dauly, M.AH.; data curation, G.Dieuset; writing—original draft preparation, H.M., G.D. and M.AH.; writing—review and editing, H.M., G.D., M. AH., A.EM., F.W. and E.I.; visualization, G.D.; supervision, F.W., E.I. and M. AH.; project administration, F.W.; funding acquisition, F.W. and E. I. All authors have read and agreed to the published version of the manuscript.
Funding
This work was supported by the French National Research Agency through the NEURO-SENSE project (ANR-18-CE19-0013).
Institutional Review Board Statement
The animal study protocol was approved by the European Union directive in use (Dir ) and was approved by the ethics committee on animal experimentation of Rennes and received agreement from the French national legal entities (agreement N APAFIS # 2327-2015101914507202)
Data Availability Statement
The data presented in this work will the available upon request.
Acknowledgments
E.I. wishes to thank the CMP cleanroom staff at the Center of Microelectronics in Provence for their technical support during the development of the project.
Conflicts of Interest
The authors declare no conflict of interest.
Abbreviations
The following abbreviations are used in this manuscript:
| EZ | Epileptogenic Zone |
| FRs | Fast Ripples |
| Au | Gold |
| PEDOT:PSS | poly(3,4-ethylenedioxythiophene)-poly(styrene sulfonate) |
| Au/PEDOT:PSS | PEDOT:PSS coated Au |
| LFPs | Local Field Potentials |
| SNR | Signal to Noise Ratio |
| CP | Conductive Polymers |
| EDOT | 3,4-ethylenedioxythiophene |
| ETI | Electrode Tissue Interface |
| LH | Left Hippocampus |
| LR | Right Hippocampus |
| DG | Dentate Gyrus |
| SS | Stainless Steel |
| R | Ripples |
| EIS | Electrochemical Impedance Spectroscopy |
| CV | Cyclic Voltammetry |
References
- Zuberi, S.M.; Wirrell, E.; Yozawitz, E.; Wilmshurst, J.M.; Specchio, N.; Riney, K.; Pressler, R.; Auvin, S.; Samia, P.; Hirsch, E.; Galicchio, S.; Triki, C.; Snead, O.C.; Wiebe, S.; Cross, J.H.; Tinuper, P.; Scheffer, I.E.; Perucca, E.; Moshé, S.L.; Nabbout, R. ILAE classification and definition of epilepsy syndromes with onset in neonates and infants: Position statement by the ILAE Task Force on Nosology and Definitions. Epilepsia 2022, 63, 1349–1397. [Google Scholar] [CrossRef] [PubMed]
- Bragin, A.; Engel, J.; Staba, R.J. High-frequency oscillations in epileptic brain. Current Opinion in Neurology 2010, 23, 151–156. [Google Scholar] [CrossRef] [PubMed]
- Burnos et al., S. The morphology of high frequency oscillations (HFO) does not improve delineating the epileptogenic zone. Clinical Neurophysiology: Official Journal of the International Federation of Clinical Neurophysiology 2016, 127, 2140–2148. [Google Scholar] [CrossRef] [PubMed]
- Engel, J.; Pitkanen, A.; Loeb, J.A.; Dudek, F.E.; Bertram, E.H.; Cole, A.J.; Moshé, S.L.; Wiebe, S.; Jensen, F.E.; Mody, I.; Nehlig, A.; Vezzani, A. Epilepsy biomarkers. Epilepsia 2013, 54, 61–69. [Google Scholar] [CrossRef] [PubMed]
- Zijlmans, M.; Jiruska, P.; Zelmann, R.; Leijten, F.S.; Jefferys, J.G.; Gotman, J. High-frequency oscillations as a new biomarker in epilepsy. Annals of Neurology 2012, 71, 169–178. [Google Scholar] [CrossRef] [PubMed]
- Bragin, A.; Engel, J.; Wilson, C.L.; Fried, I.; Buzsáki, G. High-frequency oscillations in human brain. Hippocampus 1999, 9, 137–142. [Google Scholar] [CrossRef]
- Staba, R.J.; Stead, M.; Worrell, G.A. Electrophysiological Biomarkers of Epilepsy. Neurotherapeutics 2014, 11, 334–346. [Google Scholar] [CrossRef] [PubMed]
- Urrestarazu, E.; Chander, R.; Dubeau, F.; Gotman, J. Interictal high-frequency oscillations (10-500 Hz) in the intracerebral EEG of epileptic patients. Brain 2007, 130, 2354–2366. [Google Scholar] [CrossRef]
- Frauscher, B.; Bartolomei, F.; Kobayashi, K.; Cimbalnik, J.; van ‘t Klooster, M.A.; Rampp, S.; Otsubo, H.; Höller, Y.; Wu, J.Y.; Asano, E.; Engel, J.; Kahane, P.; Jacobs, J.; Gotman, J. High-frequency oscillations: The state of clinical research. Epilepsia 2017, 58, 1316–1329. [Google Scholar] [CrossRef]
- Ibarz, J.M.; Foffani, G.; Cid, E.; Inostroza, M.; De La Prida, L.M. Emergent dynamics of fast ripples in the epileptic hippocampus. Journal of Neuroscience 2010, 30, 16249–16261. [Google Scholar] [CrossRef]
- Li, L.; Bragin, A.; Staba, R.; Engel, J. Unit firing and oscillations at seizure onset in epileptic rodents, 2019. [CrossRef]
- Al Harrach, M.; Benquet, P.; Wendling, F. Long term evolution of fast ripples during epileptogenesis. Journal of Neural Engineering 2021, 18, 046027. [Google Scholar] [CrossRef] [PubMed]
- Demont-Guignard, S.; Benquet, P.; Gerber, U.; Biraben, A.; Martin, B.; Wendling, F. Distinct hyperexcitability mechanisms underlie fast ripples and epileptic spikes. Annals of Neurology 2012, 71, 342–352. [Google Scholar] [CrossRef] [PubMed]
- Qu, Z.; Luo, J.; Chen, X.; Zhang, Y.; Yu, S.; Shu, H. Association Between Removal of High-Frequency Oscillations and The Effect of Epilepsy Surgery: A Meta-Analysis. Journal of Neurological surgery. Part A, Central European Neurosurgery. [CrossRef]
- Wu, J.; Sankar, R.; Lerner, J.; Matsumoto, J.; Vinters, H.; Mathern, G. Removing interictal fast ripples on electrocorticography linked with seizure freedom in children. Neurology 2010, 75, 1686–1694. [Google Scholar] [CrossRef] [PubMed]
- Jacobs, J.; Zijlmans, M.; Zelmann, R.; Chatillon, C.É.; Hall, J.; Olivier, A.; Dubeau, F.; Gotman, J. High-frequency electroencephalographic oscillations correlate with outcome of epilepsy surgery. Annals of Neurology: Official Journal of the American Neurological Association and the Child Neurology Society 2010, 67, 209–220. [Google Scholar] [CrossRef] [PubMed]
- Al Harrach, M.; Dauly, G.; Seyedeh-Mousavi, H.; Dieuset, G.; Benquet, P.; Ismailova, E.; Wendling, F. Improving Fast Ripples Recording with Model-Guided Design of Microelectrodes. IEEE Transactions on Biomedical Engineering 2023. [Google Scholar] [CrossRef]
- Amiri, M.; Lina, J.M.; Pizzo, F.; Gotman, J. High Frequency Oscillations and spikes: Separating real HFOs from false oscillations. Clinical Neurophysiology 2016, 127, 187–196. [Google Scholar] [CrossRef]
- Roehri, N.; Pizzo, F.; Bartolomei, F.; Wendling, F.; Bénar, C.G. What are the assets and weaknesses of HFO detectors? A benchmark framework based on realistic simulations. PLoS ONE 2017, 12, 1–20. [Google Scholar] [CrossRef]
- Buzsáki, G.; Anastassiou, C.A.; Koch, C. The origin of extracellular fields and currents-EEG, ECoG, LFP and spikes. Nature Reviews Neuroscience 2012, 13, 407–420. [Google Scholar] [CrossRef]
- Boehler, C.; Carli, S.; Fadiga, L.; Stieglitz, T.; Asplund, M. Tutorial: guidelines for standardized performance tests for electrodes intended for neural interfaces and bioelectronics. Nature Protocols 2020, 15, 3557–3578. [Google Scholar] [CrossRef]
- Harris, K.D.; Quiroga, R.Q.; Freeman, J.; Smith, S.L. Improving data quality in neuronal population recordings. Nature Neuroscience 2016, 19, 1165–1174. [Google Scholar] [CrossRef]
- Liu, X.; Demosthenous, A.; Donaldson, N. Platinum electrode noise in the ENG spectrum. Medical and Biological Engineering and Computing 2008, 46, 997–1003. [Google Scholar] [CrossRef] [PubMed]
- Stacey et al., W. C. Signal distortion from microelectrodes in clinical EEG acquisition systems. Journal of Neural Engineering 2012, 9, 056007. [Google Scholar] [CrossRef]
- Rivnay, J.; Wang, H.; Fenno, L.; Deisseroth, K.; Malliaras, G.G. Next-generation probes, particles, and proteins for neural interfacing. Science Advances 2017, 3. [Google Scholar] [CrossRef]
- Wang et al., K. High-performance graphene-fiber-based neural recording microelectrodes. Advanced materials 2019, 31, 1805867. [Google Scholar] [CrossRef]
- Sanchez-Sanchez, A.; del Agua, I.; Malliaras, G.G.; Mecerreyes, D. Conductive Poly(3,4-Ethylenedioxythiophene) (PEDOT)-Based Polymers and Their Applications in Bioelectronics, second edi ed.; Elsevier Ltd., 2019; pp. 191–218. [CrossRef]
- Donahue, M.J.; Sanchez-Sanchez, A.; Inal, S.; Qu, J.; Owens, R.M.; Mecerreyes, D.; Malliaras, G.G.; Martin, D.C. Tailoring PEDOT properties for applications in bioelectronics. Materials Science and Engineering R: Reports 2020, 140, 100546. [Google Scholar] [CrossRef]
- Rivnay, J.; Owens, R.M.; Malliaras, G.G. The rise of organic bioelectronics. Chemistry of Materials 2014, 26, 679–685. [Google Scholar] [CrossRef]
- Bianchi, M.; Salvo, A.D.; Asplund, M.; Carli, S.; Lauro, M.D.; Schulze-bonhage, A.; Stieglitz, T.; Fadiga, L.; Biscarini, F. Poly ( 3 , 4-ethylenedioxythiophene ) -Based Neural Interfaces for Recording and Stimulation : Fundamental Aspects and In Vivo Applications. 2022, 210470, 1–30. [Google Scholar] [CrossRef] [PubMed]
- Abidian, M.R.; Martin, D.C. Multifunctional nanobiomaterials for neural interfaces. Advanced Functional Materials 2009, 19, 573–585. [Google Scholar] [CrossRef]
- Cui, X.; Martin, D.C. Electrochemical deposition and characterization of poly(3,4-ethylenedioxythiophene) on neural microelectrode arrays. Sensors and Actuators, B: Chemical 2003, 89, 92–102. [Google Scholar] [CrossRef]
- Robinson, D.A. The Electrical Properties of Metal Microelectrodes. Proceedings of the IEEE 1968, 56, 1065–1071. [Google Scholar] [CrossRef]
- Karki, J. Effect of parasitic capacitance in op amp circuits. Application Report sloa013a, 2000; 1–26. [Google Scholar]
- Suzuki, F.; Junier, M.P.; Guilhem, D.; Sørensen, J.C.; Onteniente, B. Morphogenetic effect of kainate on adult hippocampal neurons associated with a prolonged expression of brain-derived neurotrophic factor. Neuroscience 1995, 64, 665–674. [Google Scholar] [CrossRef] [PubMed]
- Lévesque, M.; Avoli, M. High-frequency oscillations and focal seizures in epileptic rodents. Neurobiology of Disease 2019, 124, 396–407. [Google Scholar] [CrossRef] [PubMed]
- Paxinos, G.; Franklin, K.B. Paxinos and Franklin’s the mouse brain in stereotaxic coordinates; Academic press, 2019.
- Bénar, C.G.; Chauvière, L.; Bartolomei, F.; Wendling, F. Pitfalls of high-pass filtering for detecting epileptic oscillations: A technical note on "false" ripples. Clinical Neurophysiology 2010, 121, 301–310. [Google Scholar] [CrossRef] [PubMed]
- Jrad, N.; Kachenoura, A.; Merlet, I.; Bartolomei, F.; Nica, A.; Biraben, A.; Wendling, F. Automatic Detection and Classification of High-Frequency Oscillations in Depth-EEG Signals. IEEE Transactions on Biomedical Engineering 2017, 64, 2230–2240. [Google Scholar] [CrossRef]
- Harrach, M.A.; Benquet, P.; Wendling, F. Long term evolution of fast ripples during epileptogenesis. Journal of Neural Engineering 2021, 18. [Google Scholar] [CrossRef] [PubMed]
- Mark, E. Orazem, B.T. Electrochemical Impedance Espectroscopy.
- Liang, Y.; Offenhäusser, A.; Ingebrandt, S.; Mayer, D. PEDOT: PSS-based bioelectronic devices for recording and modulation of electrophysiological and biochemical cell signals. Advanced Healthcare Materials 2021, 10, 2100061. [Google Scholar] [CrossRef]
- Rathore, P.; Schiffman, J.D. Effect of pH Value on the Electrical Properties of PEDOT: PSS-Based Fiber Mats. ACS Engineering Au 2023. [Google Scholar] [CrossRef]
- Júnior, C.; Spinelli, B.; Damasceno, I.; Fiuza, F.; Morya, E.; others. All-Polymeric Electrode Based on PEDOT: PSS for In Vivo Neural Recording. Biosensors 2022, 12, 853. [Google Scholar] [CrossRef] [PubMed]
- Boehler, C.; Kleber, C.; Martini, N.; Xie, Y.; Dryg, I.; Stieglitz, T.; Hofmann, U.G.; Asplund, M. Actively controlled release of Dexamethasone from neural microelectrodes in a chronic in vivo study. Biomaterials 2017, 129, 176–187. [Google Scholar] [CrossRef]
- Polikov, V.S.; Tresco, P.A.; Reichert, W.M. Response of brain tissue to chronically implanted neural electrodes. Journal of Neuroscience Methods 2005, 148, 1–18. [Google Scholar] [CrossRef]
- Kozai, T.D.; Vazquez, A.L.; Weaver, C.L.; Kim, S.G.; Cui, X.T. In vivo two-photon microscopy reveals immediate microglial reaction to implantation of microelectrode through extension of processes. Journal of Neural Engineering 2012, 9. [Google Scholar] [CrossRef] [PubMed]
- Johnson, M.D.; Otto, K.J.; Kipke, D.R. Repeated voltage biasing improves unit recordings by reducing resistive tissue impedances. IEEE Transactions on Neural Systems and Rehabilitation Engineering 2005, 13, 160–165. [Google Scholar] [CrossRef] [PubMed]
- Charkhkar, H.; Knaack, G.L.; Mchail, D.G.; Mandal, H.S.; Peixoto, N.; Rubinson, J.F.; Dumas, T.C.; Pancrazio, J.J. Chronic intracortical neural recordings using microelectrode arrays coated with PEDOT-TFB. Acta Biomaterialia 2016, 32, 57–67. [Google Scholar] [CrossRef] [PubMed]
Figure 1.
Microelectrodes preparation and coating. Scanning electron microscope (SEM) images of the cross-section of gold (Au), and Au coated with PEDOT:PSS (Au:PEDOT/PSS) wire microelectrodes implanted into the right (A) and left hippocampus (B) of the mouse. All electrodes have the same diameter of 125 .
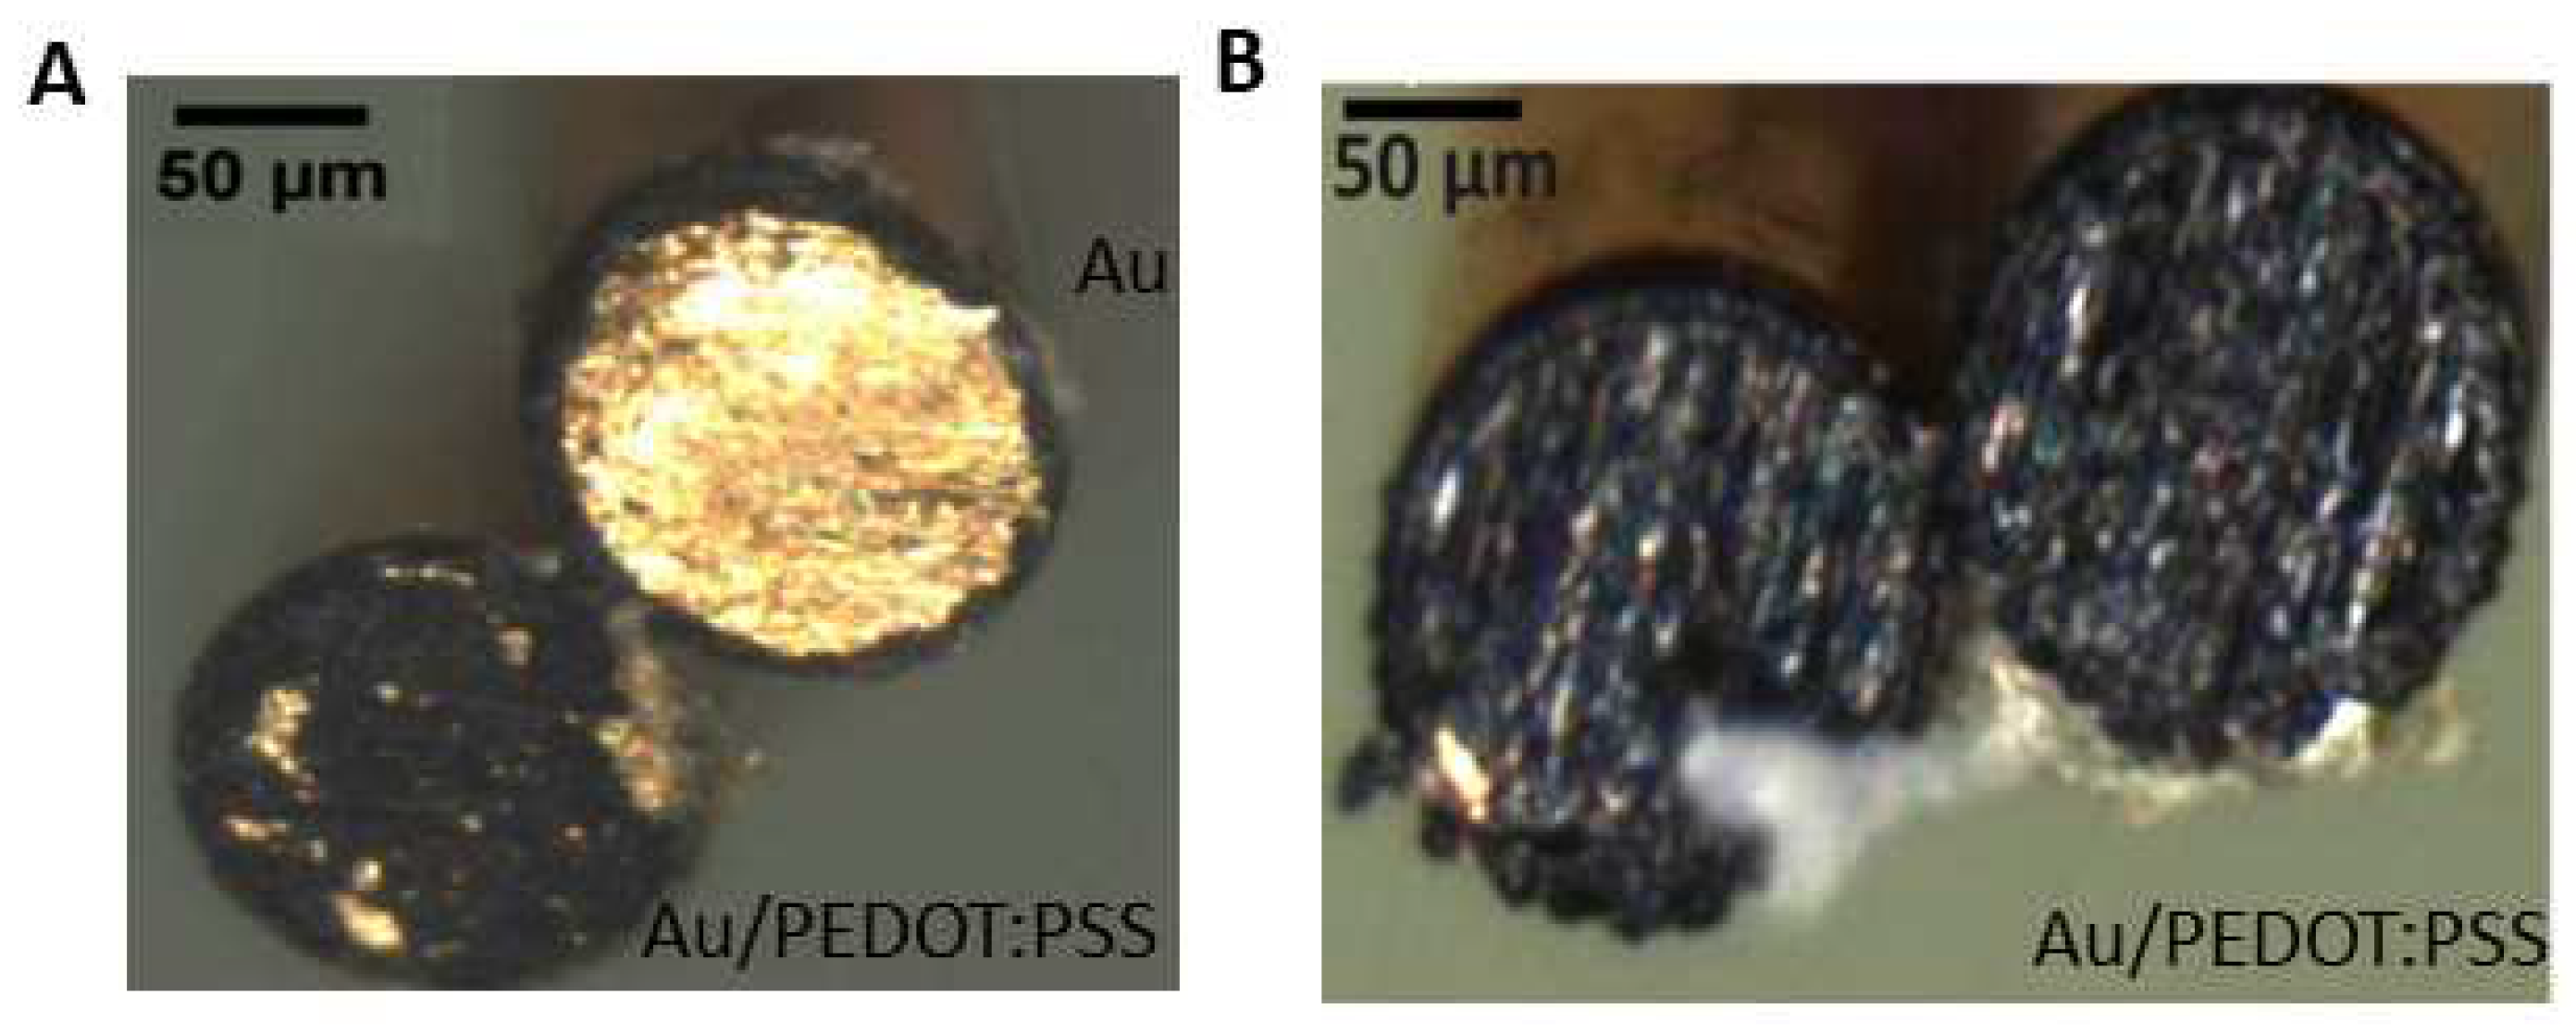
Figure 2.
Electrode Tissue Interface (ETI) model. (A) Bode plot representation of experimentally measured impedance using electrochemical impedance spectroscopy for gold (Au) and PEDOT:PSS coated Au (Au/PEDOT:PSS) microelectrodes. (B) Equivalent circuits for the Au (yellow) and Au/PEDOT:PSS (blue) microelectrodes. For the Au electrode, the equivalent circuit consisted of the spreading resistance (), the charge transfer resistance (), a constant phase element (Q), and double-layer capacitance (). For the Au/PEDOT:PSS the equivalent circuit comprised a spreading resistance (), double-layer capacitance (), and a Warburg element W. For both electrodes the ETI included a shunt capacitance () that followed in series with the equivalent circuit of the electrode.
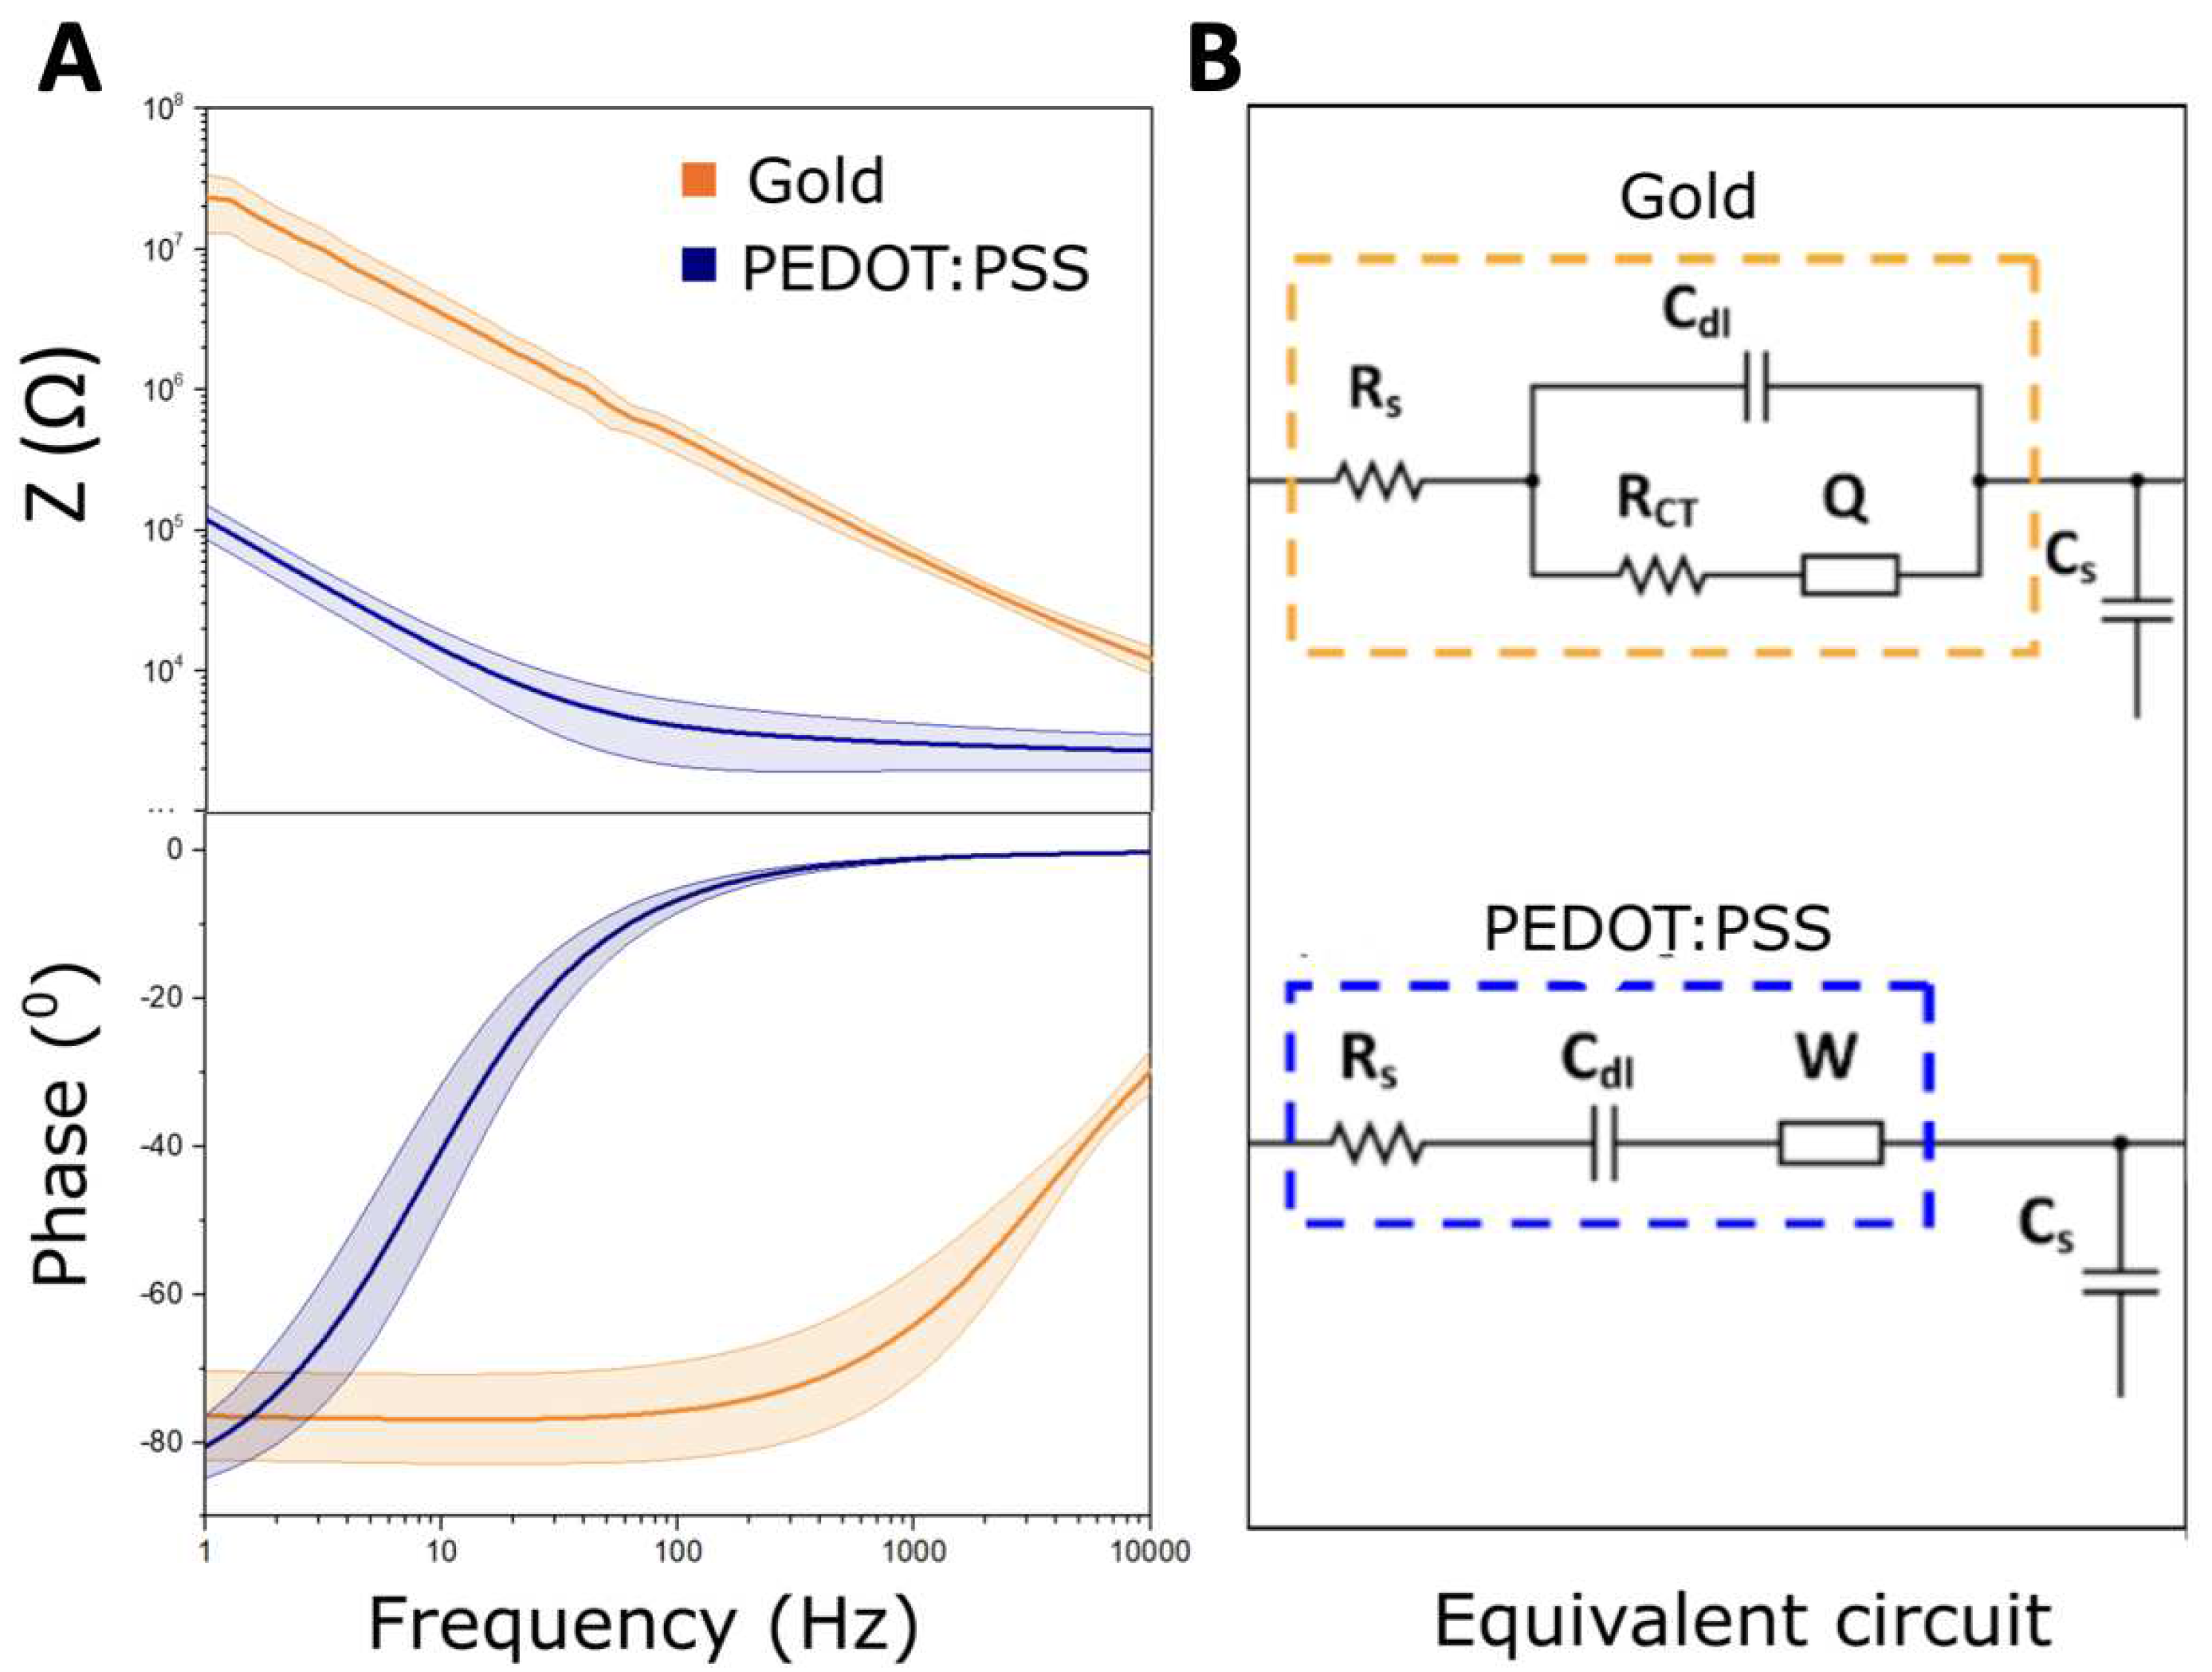
Figure 3.
Experimental protocol steup. A: Schematic diagram of the multisite intracortical electrode implantation positions. In the Right Hippocampus (RH) an Au and an Au/PEDOT:PSS electrodes were inserted at AP=-2.0 mm, ML=-1.5 mm, DV=-1.9 mm. In the Left Hippocampus (LH) two Au/PEDOT:PSS electrodes were inserted at AP=-2.0 mm, ML=+1.5 mm, DV=-1.9 mm. The electrodes placements were determined according to the atlas of the mouse brain [37]. B: An image of the operating field during electrode implantation for one of the mice. The mouse is fixed in a stereotaxic frame. C: Timeline of experimental design indicating recording days. Abbreviations: D: day post-injection, LH: left hippocampus, RH: right hippocampus, KA: kainate acid.
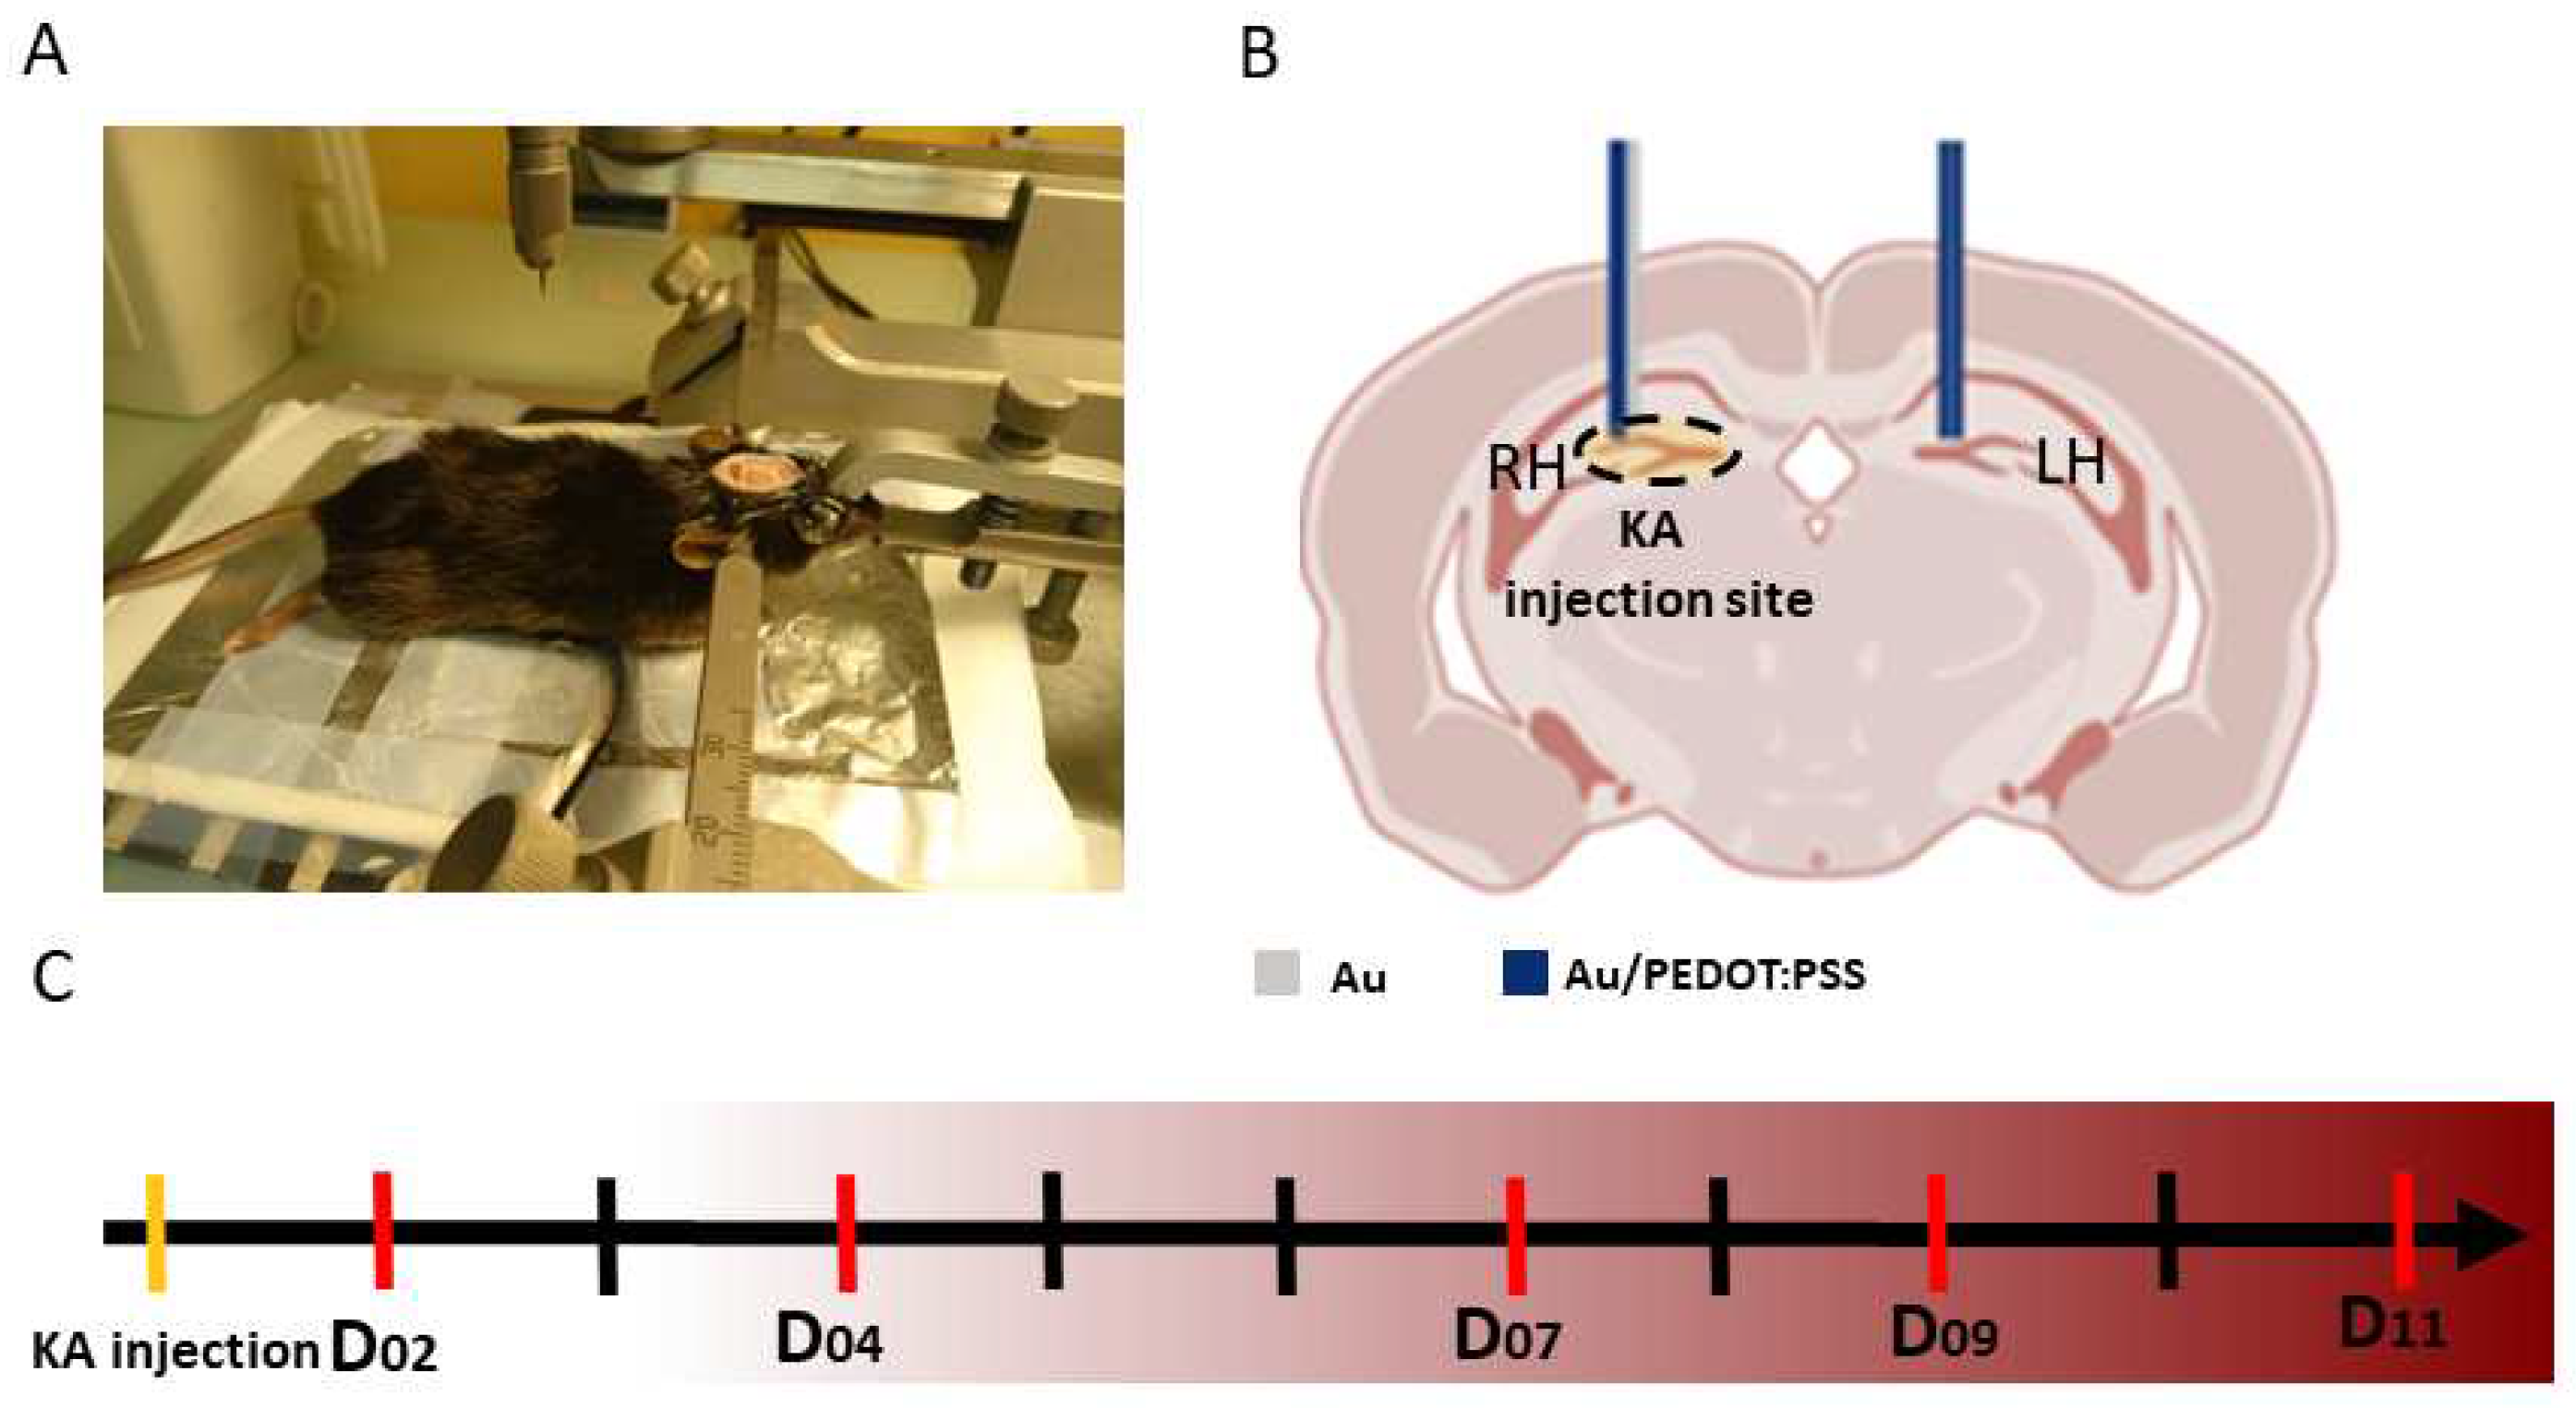
Figure 4.
FRs classification process. A: Bloc diagram detailing the steps of the classification. B: Visual inspection and delineation of the signal. FRs are highlighted in red. C: Spectrogram of the event of interest segmented with the algorithm in [12]. D: An example of FRs segmentation in the time domain. The onset and offset of the FR are marked by red-dotted vertical lines for the unfiltered (top), and filtered (bottom) signal.
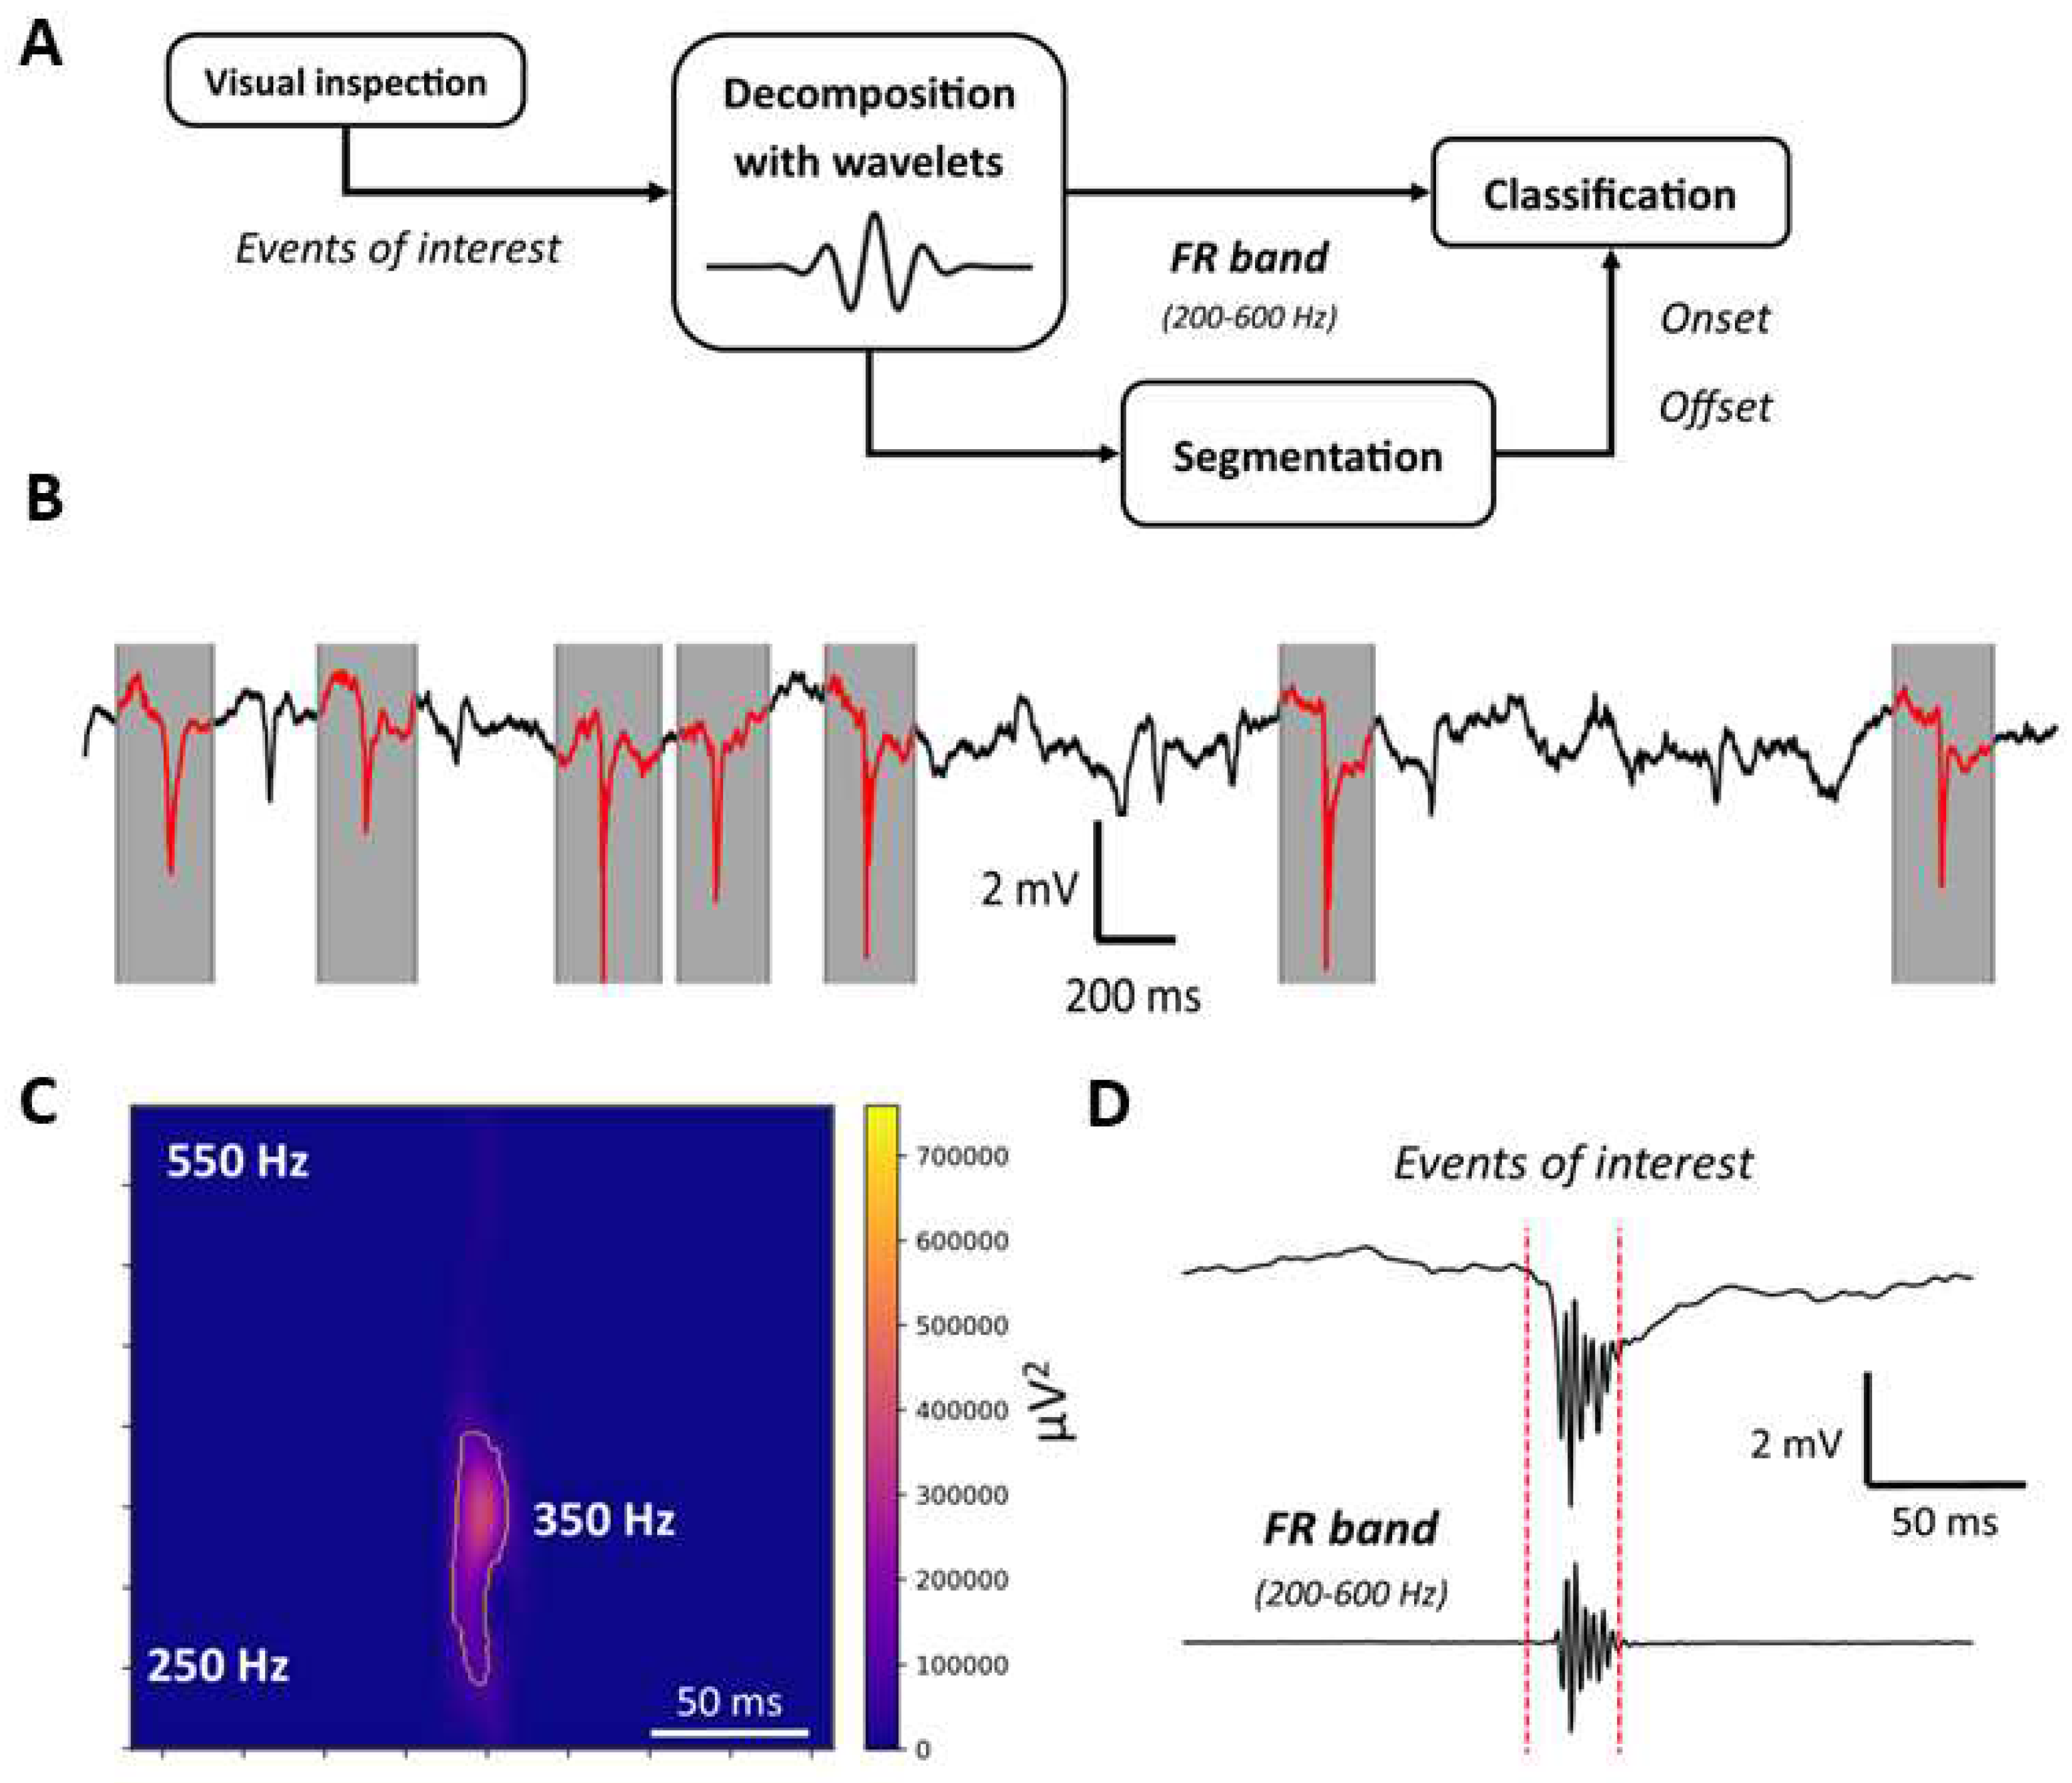
Figure 5.
Coating characterization. A: SEM images of the Au microelectrode surface before (up) and after (bottom) coating with PEDOT:PSS. The images were captured with the secondary electron detector (SE, Carl Zeiss Ultra55) at 5 kVA. B: Electrochemical stability of PEDOT:PSS. Up: Cyclic voltammetry (CV) of Au/PEDOT:PSS microelectrode (100 mV/s, -0.9 to 1 V). Bottom: 1-KHz impedance of Au/PEDOT:PSS variation during 28 days.
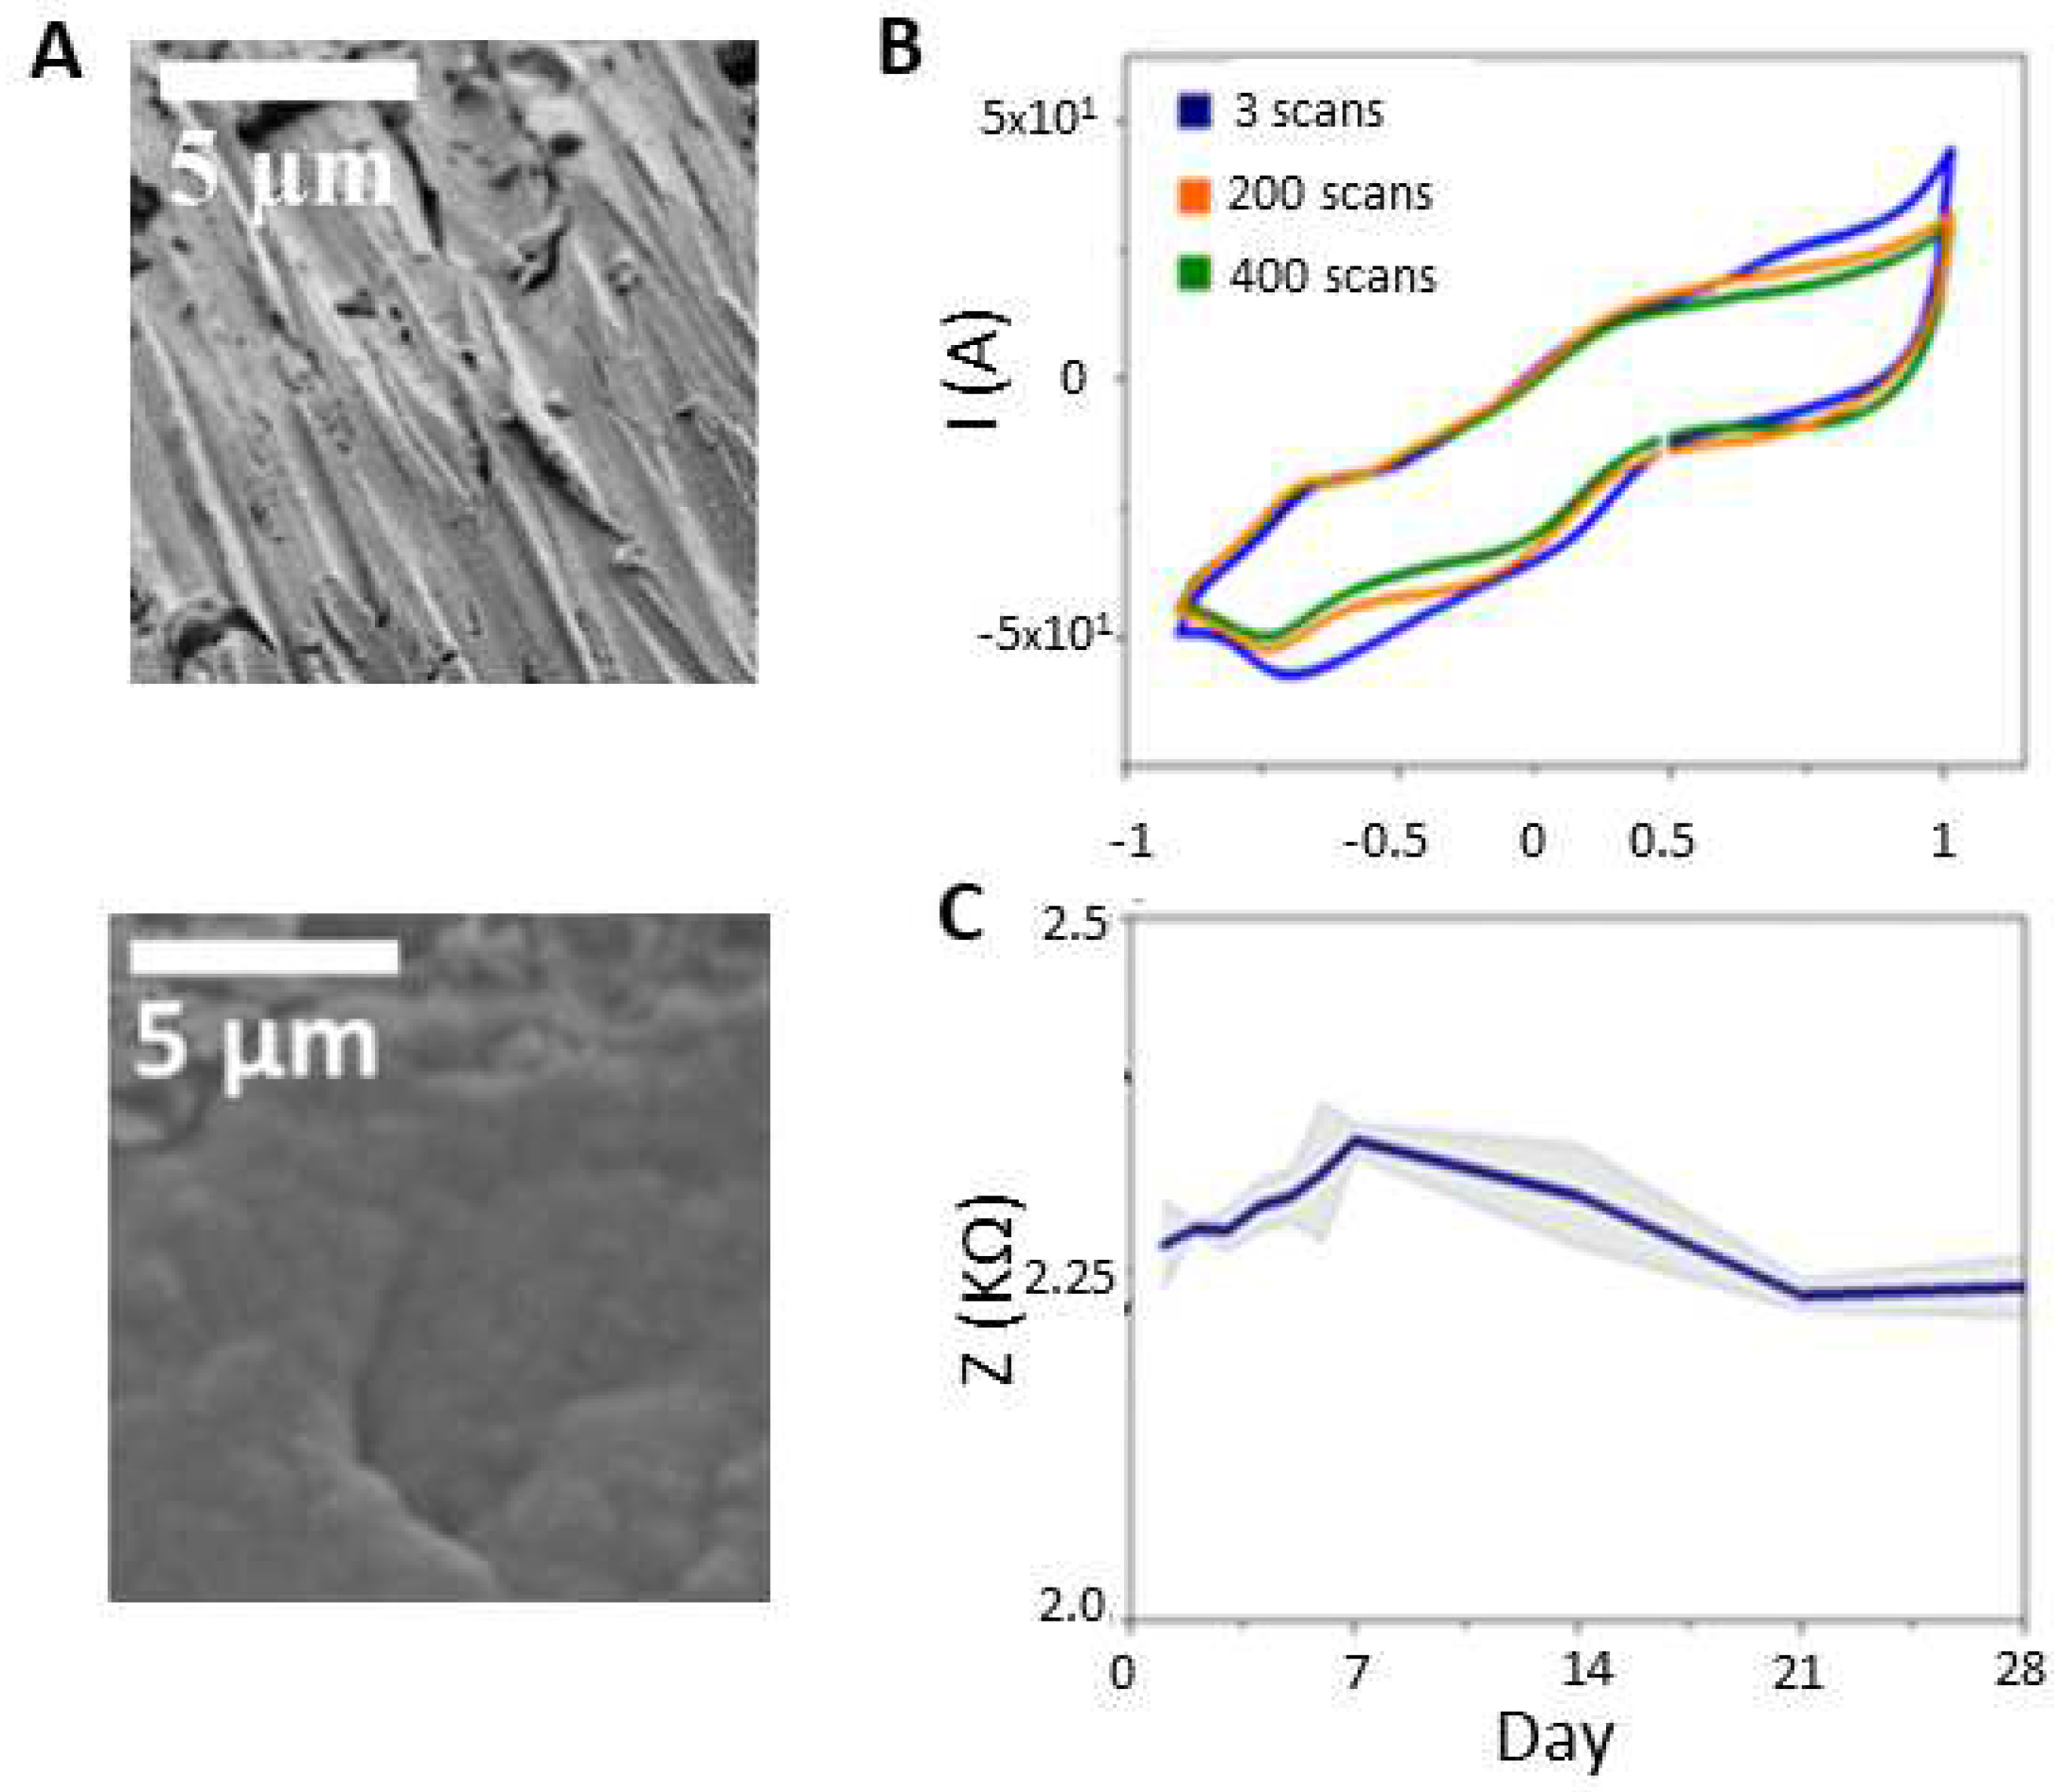
Figure 6.
Bode plot representation of the transfer function (H) containing magnitude (logarithmic) and phase (linear) for Au and Au/PEDOT:PSS electrodes. The FR band is represented by vertical (between 200 and 600 Hz).
Figure 6.
Bode plot representation of the transfer function (H) containing magnitude (logarithmic) and phase (linear) for Au and Au/PEDOT:PSS electrodes. The FR band is represented by vertical (between 200 and 600 Hz).
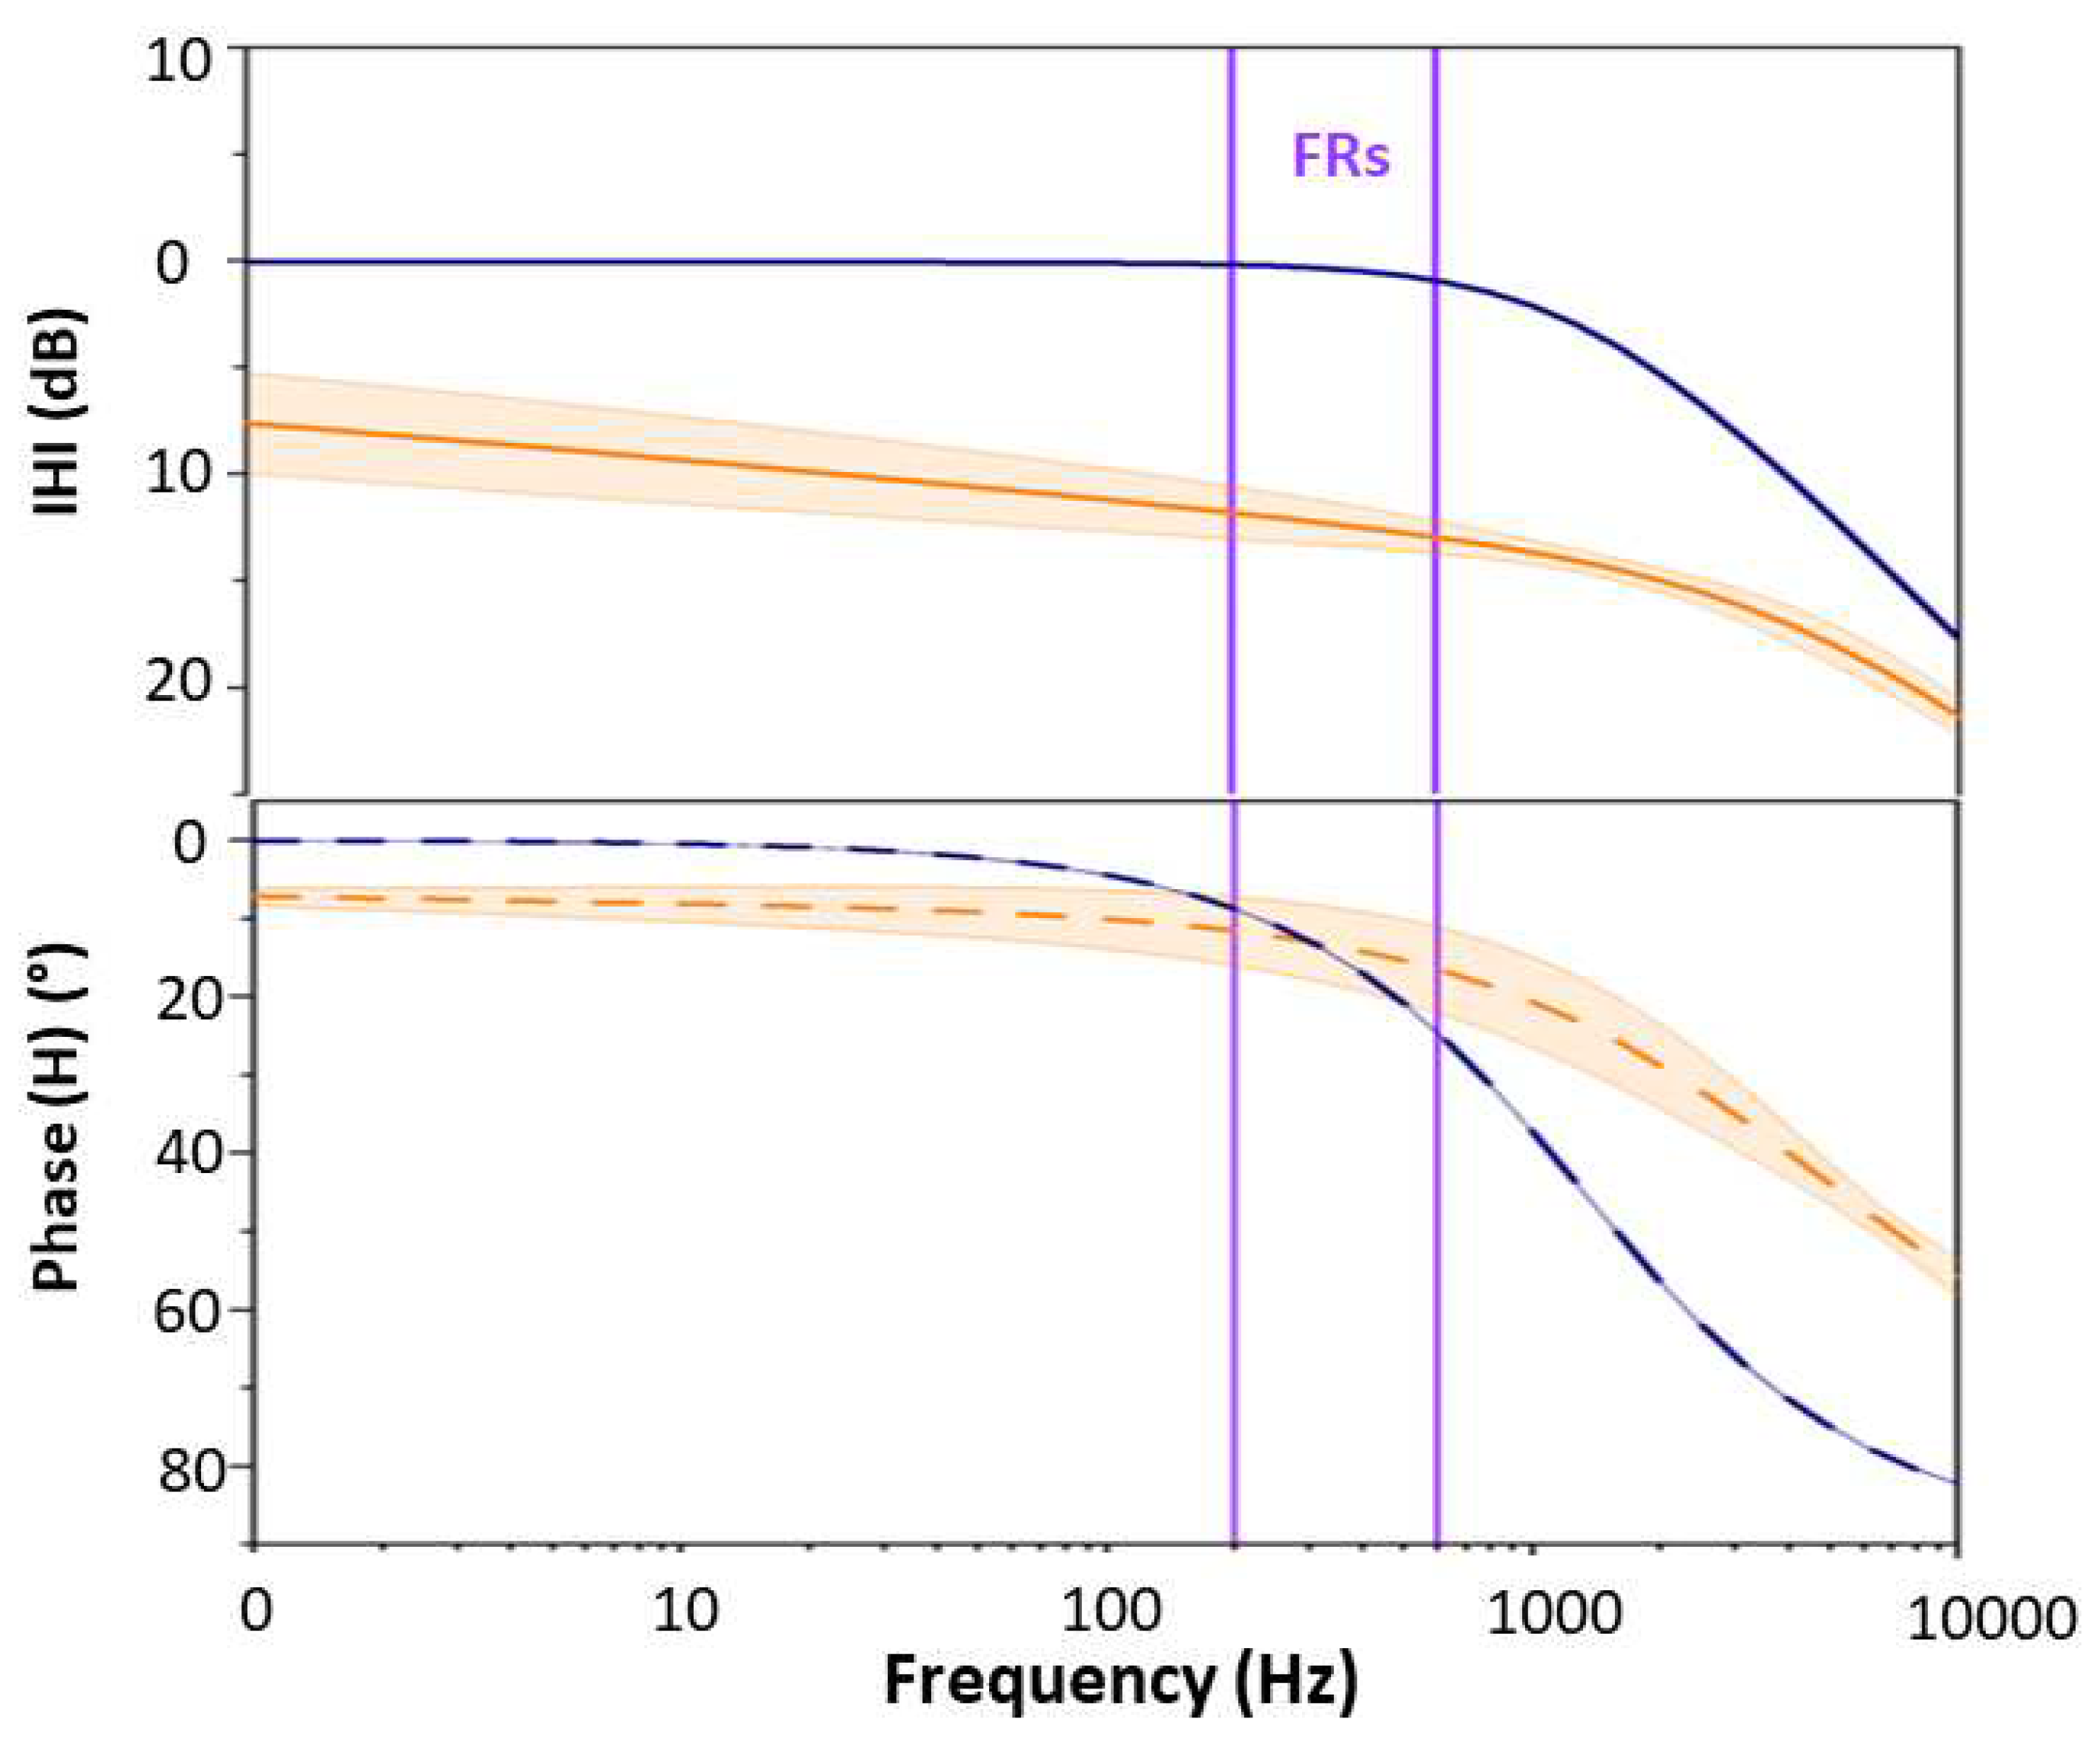
Figure 7.
Comparison between FRs recorded with uncoated and coated Au/PEDOT:PSS. A: An example of FR on recorded from an epileptic mouse in the wide band with Au (top, yellow) and Au/PEDOT:PSS (bottom, blue) electrodes. B: Same signals in the FR band (200-600 Hz). C: Power Spectral Density (PSD) of the segmented FRs. D: Boxplots of the of the energy in the FR band of Au and Au/PEDOT:PSS microelectrodes from day 2 to day 11. E: Boxplots of the of the energy in the Background band (3.5-200 Hz) of Au and Au/PEDOT:PSS microelectrodes from day 2 to day 11./indicates p-value
Disclaimer/Publisher’s Note: The statements, opinions and data contained in all publications are solely those of the individual author(s) and contributor(s) and not of MDPI and/or the editor(s). MDPI and/or the editor(s) disclaim responsibility for any injury to people or property resulting from any ideas, methods, instructions or products referred to in the content. |
© 2023 by the authors. Licensee MDPI, Basel, Switzerland. This article is an open access article distributed under the terms and conditions of the Creative Commons Attribution (CC BY) license (http://creativecommons.org/licenses/by/4.0/).
Copyright: This open access article is published under a Creative Commons CC BY 4.0 license, which permit the free download, distribution, and reuse, provided that the author and preprint are cited in any reuse.


