1. The Problem Statement
1.1. Introduction
The automotive industry faces a critical challenge in managing service parts effectively. Beyond being a logistical puzzle, it stands as a strategic necessity [1]. With vehicles becoming more complex and customer expectations reaching new heights, the seamless flow of service parts from manufacturers to end-users is paramount [2]. This paper meticulously navigates the complexities of service parts management and demand forecasting within the unique context of the Thai automotive industry. It introduces innovative strategies and methodologies aimed at reshaping manufacturers’ approaches to this critical operational facet.
Within the intricate dynamics of the automotive sector, maintaining optimal stock levels for service parts is a multifaceted challenge [3]. Excessive inventory risks bloated holding costs and parts obsolescence, while insufficient stocking may lead to prolonged vehicle downtimes and reputational damage [4]. In the distinctive landscape of the Thai automotive industry, marked by unique market dynamics, consumer preferences, and intricate supply chain nuances, a nuanced and data-driven approach to service parts management becomes imperative [5].
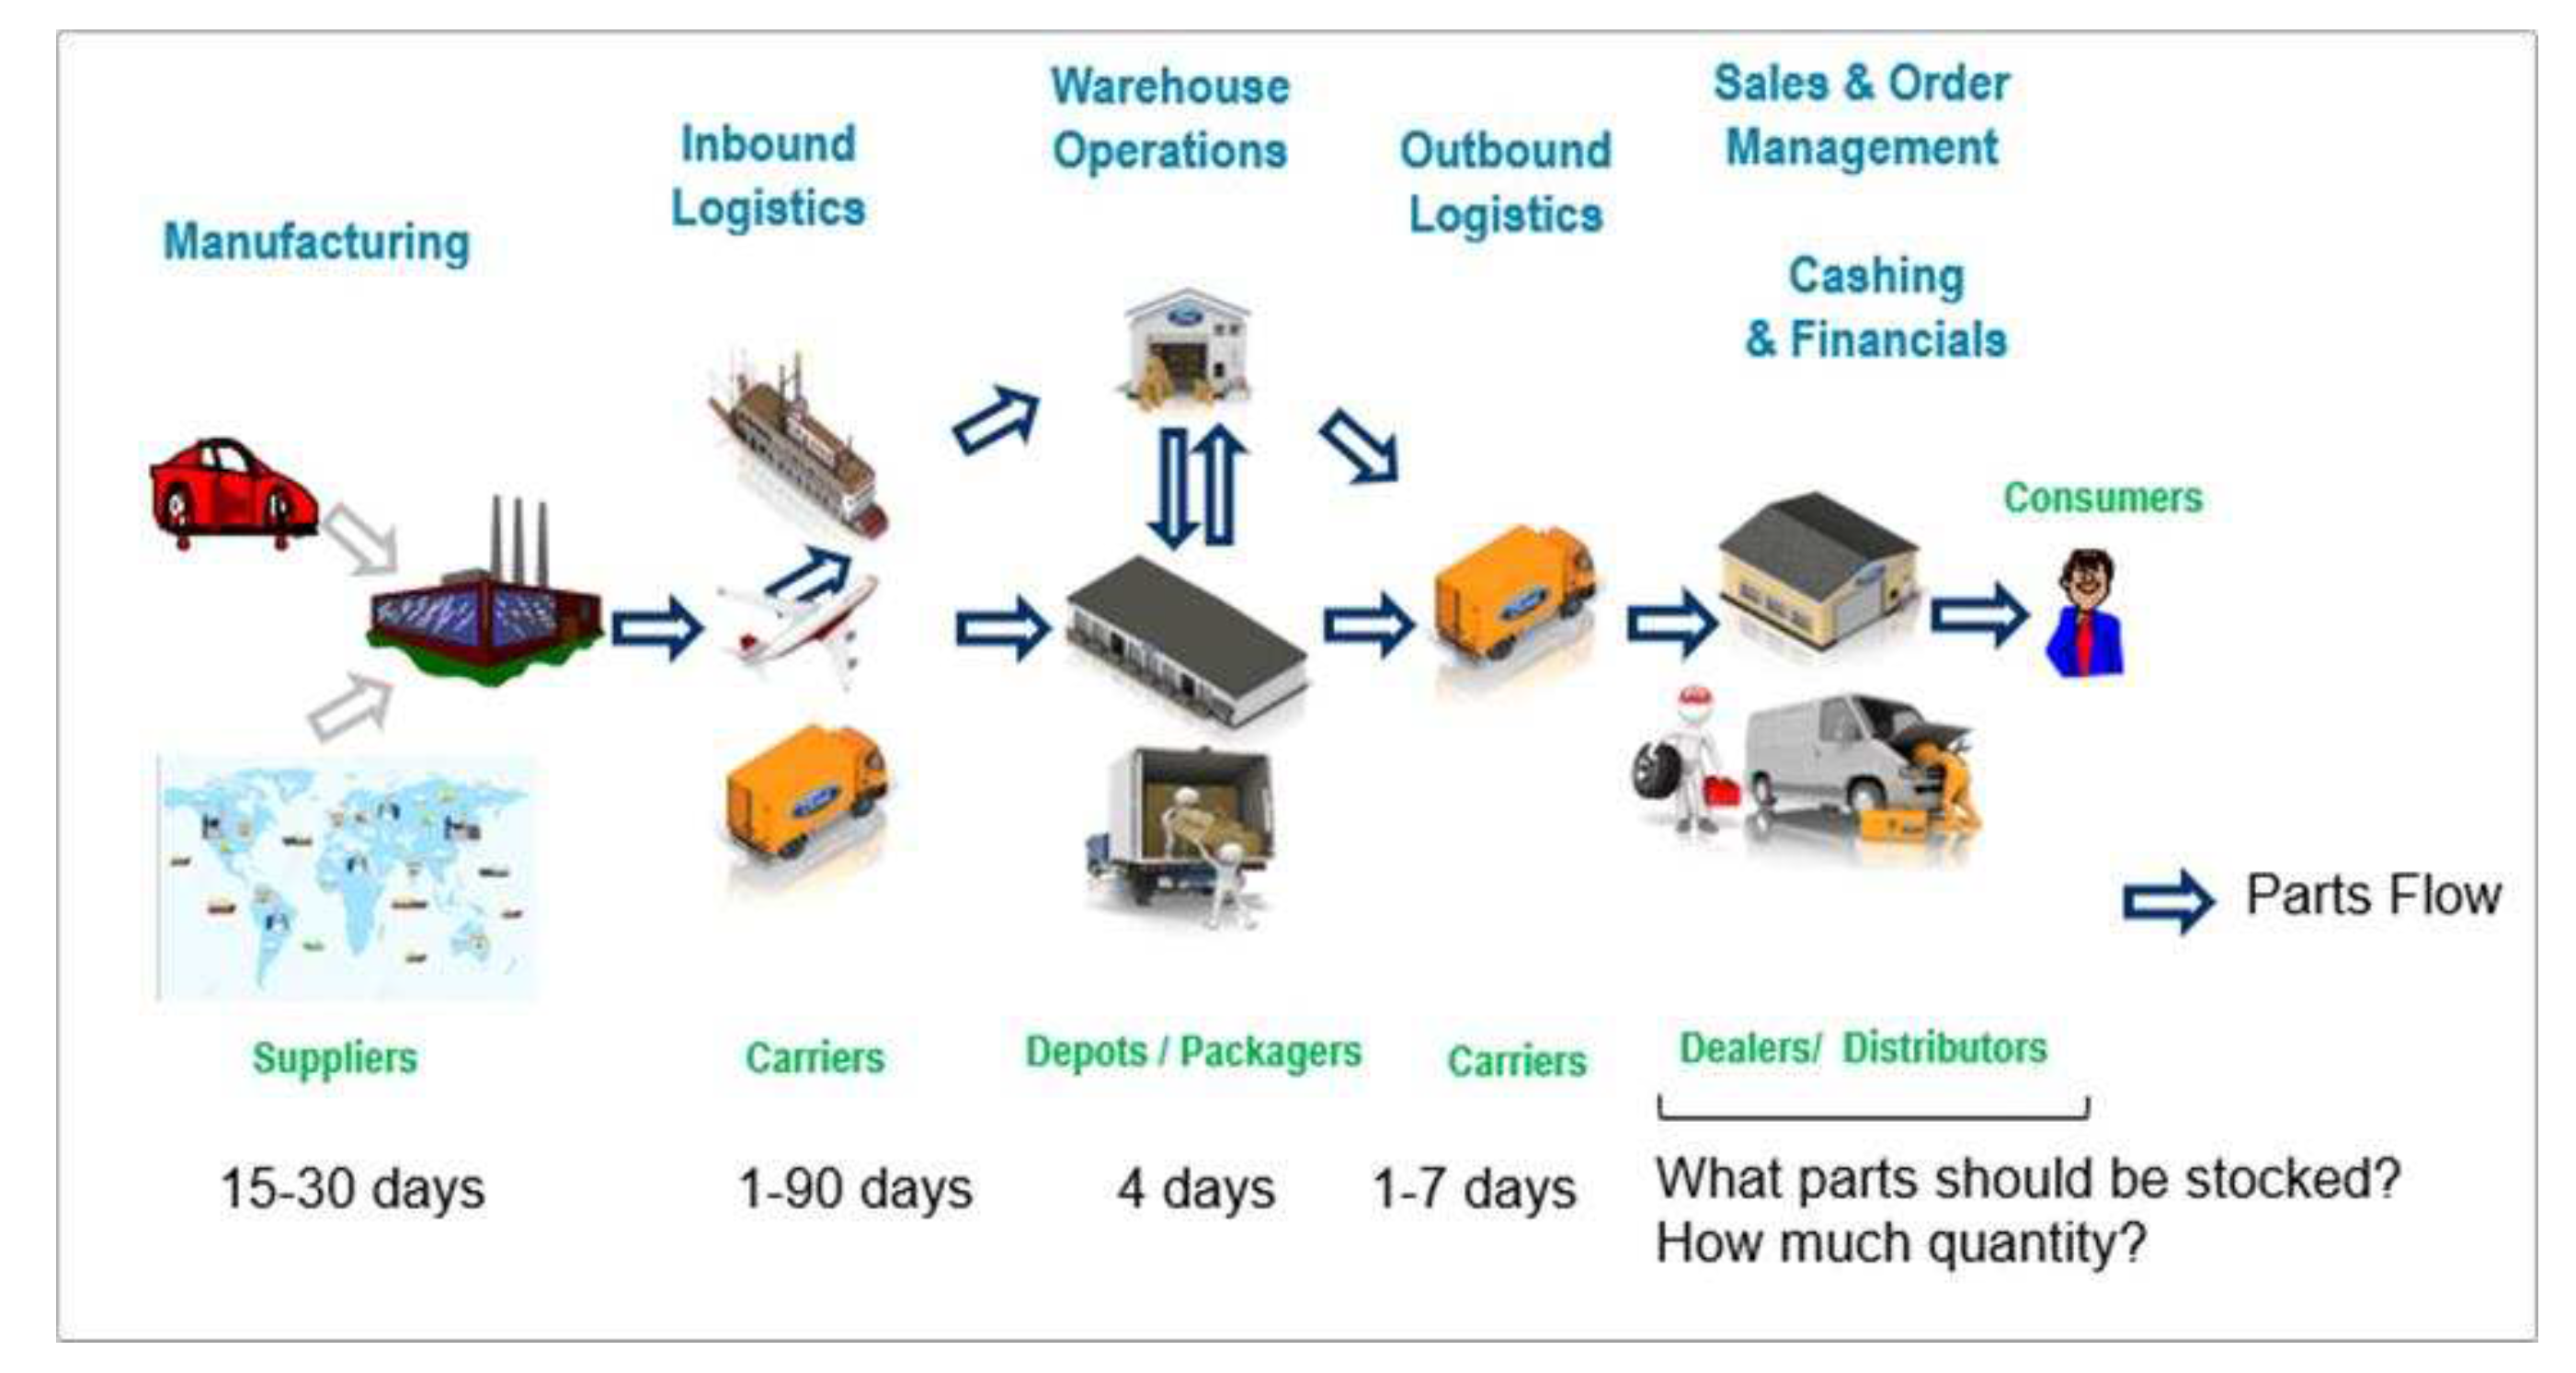
Figure 1 visually encapsulates the intricacies of the automotive supply chain, portraying the diverse stakeholders involved, ranging from manufacturers and suppliers to distributors, retailers, and end customers. This high-level overview underscores the interdependence of these entities, emphasizing the need for a holistic approach to service parts management that encompasses the entire supply chain ecosystem [6]. The figure serves as a prelude to an in-depth exploration of the proposed methodology, highlighting the importance of aligning service parts management strategies with broader supply chain dynamics.
At the heart of this paper lies a systematic methodology, integrating historical sales data, well-defined part classifications, and strategic decision rules. These components collectively forge a framework guiding stocking decisions for service parts. Tailored to address the unique challenges posed by the Thai automotive industry, the methodology furnishes manufacturers with a blueprint to navigate the intricacies of the market.
Traversing the ensuing sections, the paper delves into the intricacies of part classification, the formulation of stocking decision rules, and the application of data analysis techniques. The ultimate objective is to empower automotive manufacturers with insights that not only optimize costs and streamline supply chain operations but also elevate customer service and satisfaction. The findings and recommendations stemming from this methodology aspire to make a substantial contribution to the ongoing narrative of enhancing the efficiency and sustainability of the automotive industry in Thailand.
2. Materials and Methods
2.1. Data Collection and Pre-processing
The data utilized in this study pertains to the automotive service parts sector in Thailand. The dataset encompasses detailed information on part counts, new model parts, sales records, lead times, and vehicle volumes. Specifically, the data encompasses nine months of sales data from January 2022 to September 2022, and forecasts for October 2022 to February 2023. For the purposes of this research, the domestic market sales data, excluding export transactions, were analysed, as these were deemed most pertinent.
Table 1.
Description of the dataset used in the study, including the total counts for different commodity categories.
Table 1.
Description of the dataset used in the study, including the total counts for different commodity categories.
| Commodity |
Total |
| Accessories |
872 |
| Collision |
20426 |
| Light Repair |
3623 |
| Maintenance |
5643 |
| Other |
353 |
| Powertrain |
1912 |
| Grand Total |
32829 |
The initial dataset was subjected to a comprehensive cleansing process to ensure its suitability for analysis. Records reflecting negative stock levels were excluded, and any missing values were replaced with zeros. In addition, parts that could be categorized as Periodic Maintenance Service Parts and Accessories were excluded from the dataset to focus solely on core service parts.
2.2. Data Categorization
In alignment with the newly established demand criteria rules, the parts were categorized. Only parts falling within the top 25%, referred to as “Platinum,” “Diamond,” “Gold,” “Silver,” and “Bronze” categories, were considered for the subsequent analysis. The criteria for categorization were based on demand and order frequency.
In the Table 2, we observe the number of service parts falling within each demand category and their corresponding percentages. It becomes evident that the majority of service parts are distributed across the “Silver” and “Bronze” categories, with 29.3% and 44.7% representation, respectively. Notably, the “Platinum” category contains a comparatively smaller share at 16.2%, while the “Diamond” and “Gold” categories are at 9.1% and 9.7%, respectively. The total number of service parts considered for this analysis is 1806.
Table 2.
Categorization of service parts based on demand criteria, including counts and percentages.
Table 2.
Categorization of service parts based on demand criteria, including counts and percentages.
| Category |
Count |
% |
| Platinum |
128 |
16.2% |
| Diamond |
165 |
9.1% |
| Gold |
176 |
9.7% |
| Silver |
530 |
29.3% |
| Bronze |
807 |
44.7% |
This distribution has significant implications for strategic decision-making. The differentiation between these categories allows for tailored resource allocation and focus. High-demand service parts categorized as “Platinum” and “Diamond” are prime candidates for heightened inventory management efforts, ensuring their availability to minimize service disruptions. On the other hand, the “Bronze” category, comprising low-demand parts, offers opportunities for alternative, cost-effective solutions.
2.3. Decision Rules for Stocking
In the intricate landscape of service parts management, the decision on which parts to stock involves a judicious evaluation of various factors. The criteria for stocking service parts are not arbitrary; instead, they are meticulously derived from key parameters such as purchase cost (CST), annual demand (Q), and backorder cost (B). These factors play a crucial role in the development of a structured and efficient decision-making framework [7].
2.3.1. Decision Rules Formulation
The decision to stock service parts is contingent on a set of indices, each carefully formulated to capture specific aspects of the stocking decision:
Cost Index (CSTi): This index (CSTi) is calculated using the formula CSTi = - log2(CST/3000). It quantifies the cost efficiency of stocking a particular service part, considering the purchase cost.
Demand Index (Qi): The demand index (Qi) is formulated as Qi = - log2(Q/10), where Q represents the annual demand for a service part. This index provides insights into the demand dynamics, emphasizing the significance of considering the annual demand in the decision-making process.
Backorder Index (Bi): The backorder index (Bi) is determined by the formula Bi = log2(B/18000), with B representing the backorder cost. This index focuses on the cost implications associated with potential backorders, contributing a crucial dimension to the decision rules.
The decision rule is framed as: Stock the part if
To provide a comprehensive overview of the decision rules, Table 3 outlines the decision rules applied to determine whether specific service parts should be stocked or not. The formulation of these decision rules involved a meticulous consideration of various factors, including Lead Time (LT), Purchase Cost (CST), Classification Criteria, and Backorder Cost. The objective was to establish a systematic approach that optimally balances the costs associated with stocking and the potential backorder expenses.
Table 3 outlines a few samples where the Sum Index is < 0. Parts with high cost, low to medium demand criteria combined with lower lead time fall under the Do not stock category. The table presents specific decision rules for individual service parts, including information such as Service Part Number (SPN), Commodity, Lead Time (LT), Purchase Cost (CST), criteria, Backorder Cost, and the final decision (Stock or Do Not Stock). The columns provide detailed information on key parameters:
Index: An index assigned to each service part for reference in the decision-making process.
Decision: Indicates whether the service part should be stocked or not based on the decision rules.
LT (Lead Time): The time it takes for the delivery of the service part after placing an order.
CST (Purchase Cost): The cost associated with acquiring the service part.
Criteria: The classification criteria used in the decision-making process, such as “Critical,” “low-high,” or “medium-high.”
Backorder Cost: The cost incurred if the service part is not stocked and needs to be backordered.
Sum: A cumulative value derived from specific calculations, providing an overall assessment of the decision-making criteria.
Table 3.
Decision Rules for Stocking Service Parts.
Table 3.
Decision Rules for Stocking Service Parts.
| SPN |
Commodity |
LT |
CST |
Criteria |
Backorder Cost |
Sum
Index |
Decision |
| SPN_00105 |
LIGHT REPAIR |
78 |
409.829 |
Critical |
93636.88 |
6 |
Stock |
| SPN_00476 |
LIGHT REPAIR |
135 |
371,513 |
medium-high |
162033.44 |
6 |
Stock |
| SPN_00502 |
LIGHT REPAIR |
66 |
110.223 |
medium-high |
79209.92 |
6 |
Stock |
| SPN_00562 |
LIGHT REPAIR |
180 |
445,659 |
medium-high |
216040.11 |
6 |
Stock |
| SPN_00606 |
LIGHT REPAIR |
15 |
7191.13 |
medium-high |
18071.91 |
-1 |
Do Not Stock |
| SPN 00634 |
LIGHT REPAIR |
90 |
227.22 |
medium-high |
108020.45 |
6 |
Stock |
| SPN_00719 |
LIGHT REPAIR |
66 |
10470.75 |
low-high |
80142.37 |
-1 |
Do Not Stock |
The decision rules were derived through a combination of historical data analysis and strategic considerations to ensure the efficient allocation of resources and minimize costs. The “Decision” column reflects the outcome of this comprehensive evaluation, guiding the stocking strategy for each service part. The “Sum” column serves as a consolidated indicator, aggregating relevant criteria for a holistic decision-making perspective. This table serves as a valuable reference for understanding the nuanced decision-making process involved in optimizing service parts management within the automotive industry.
2.3.2. Visualization
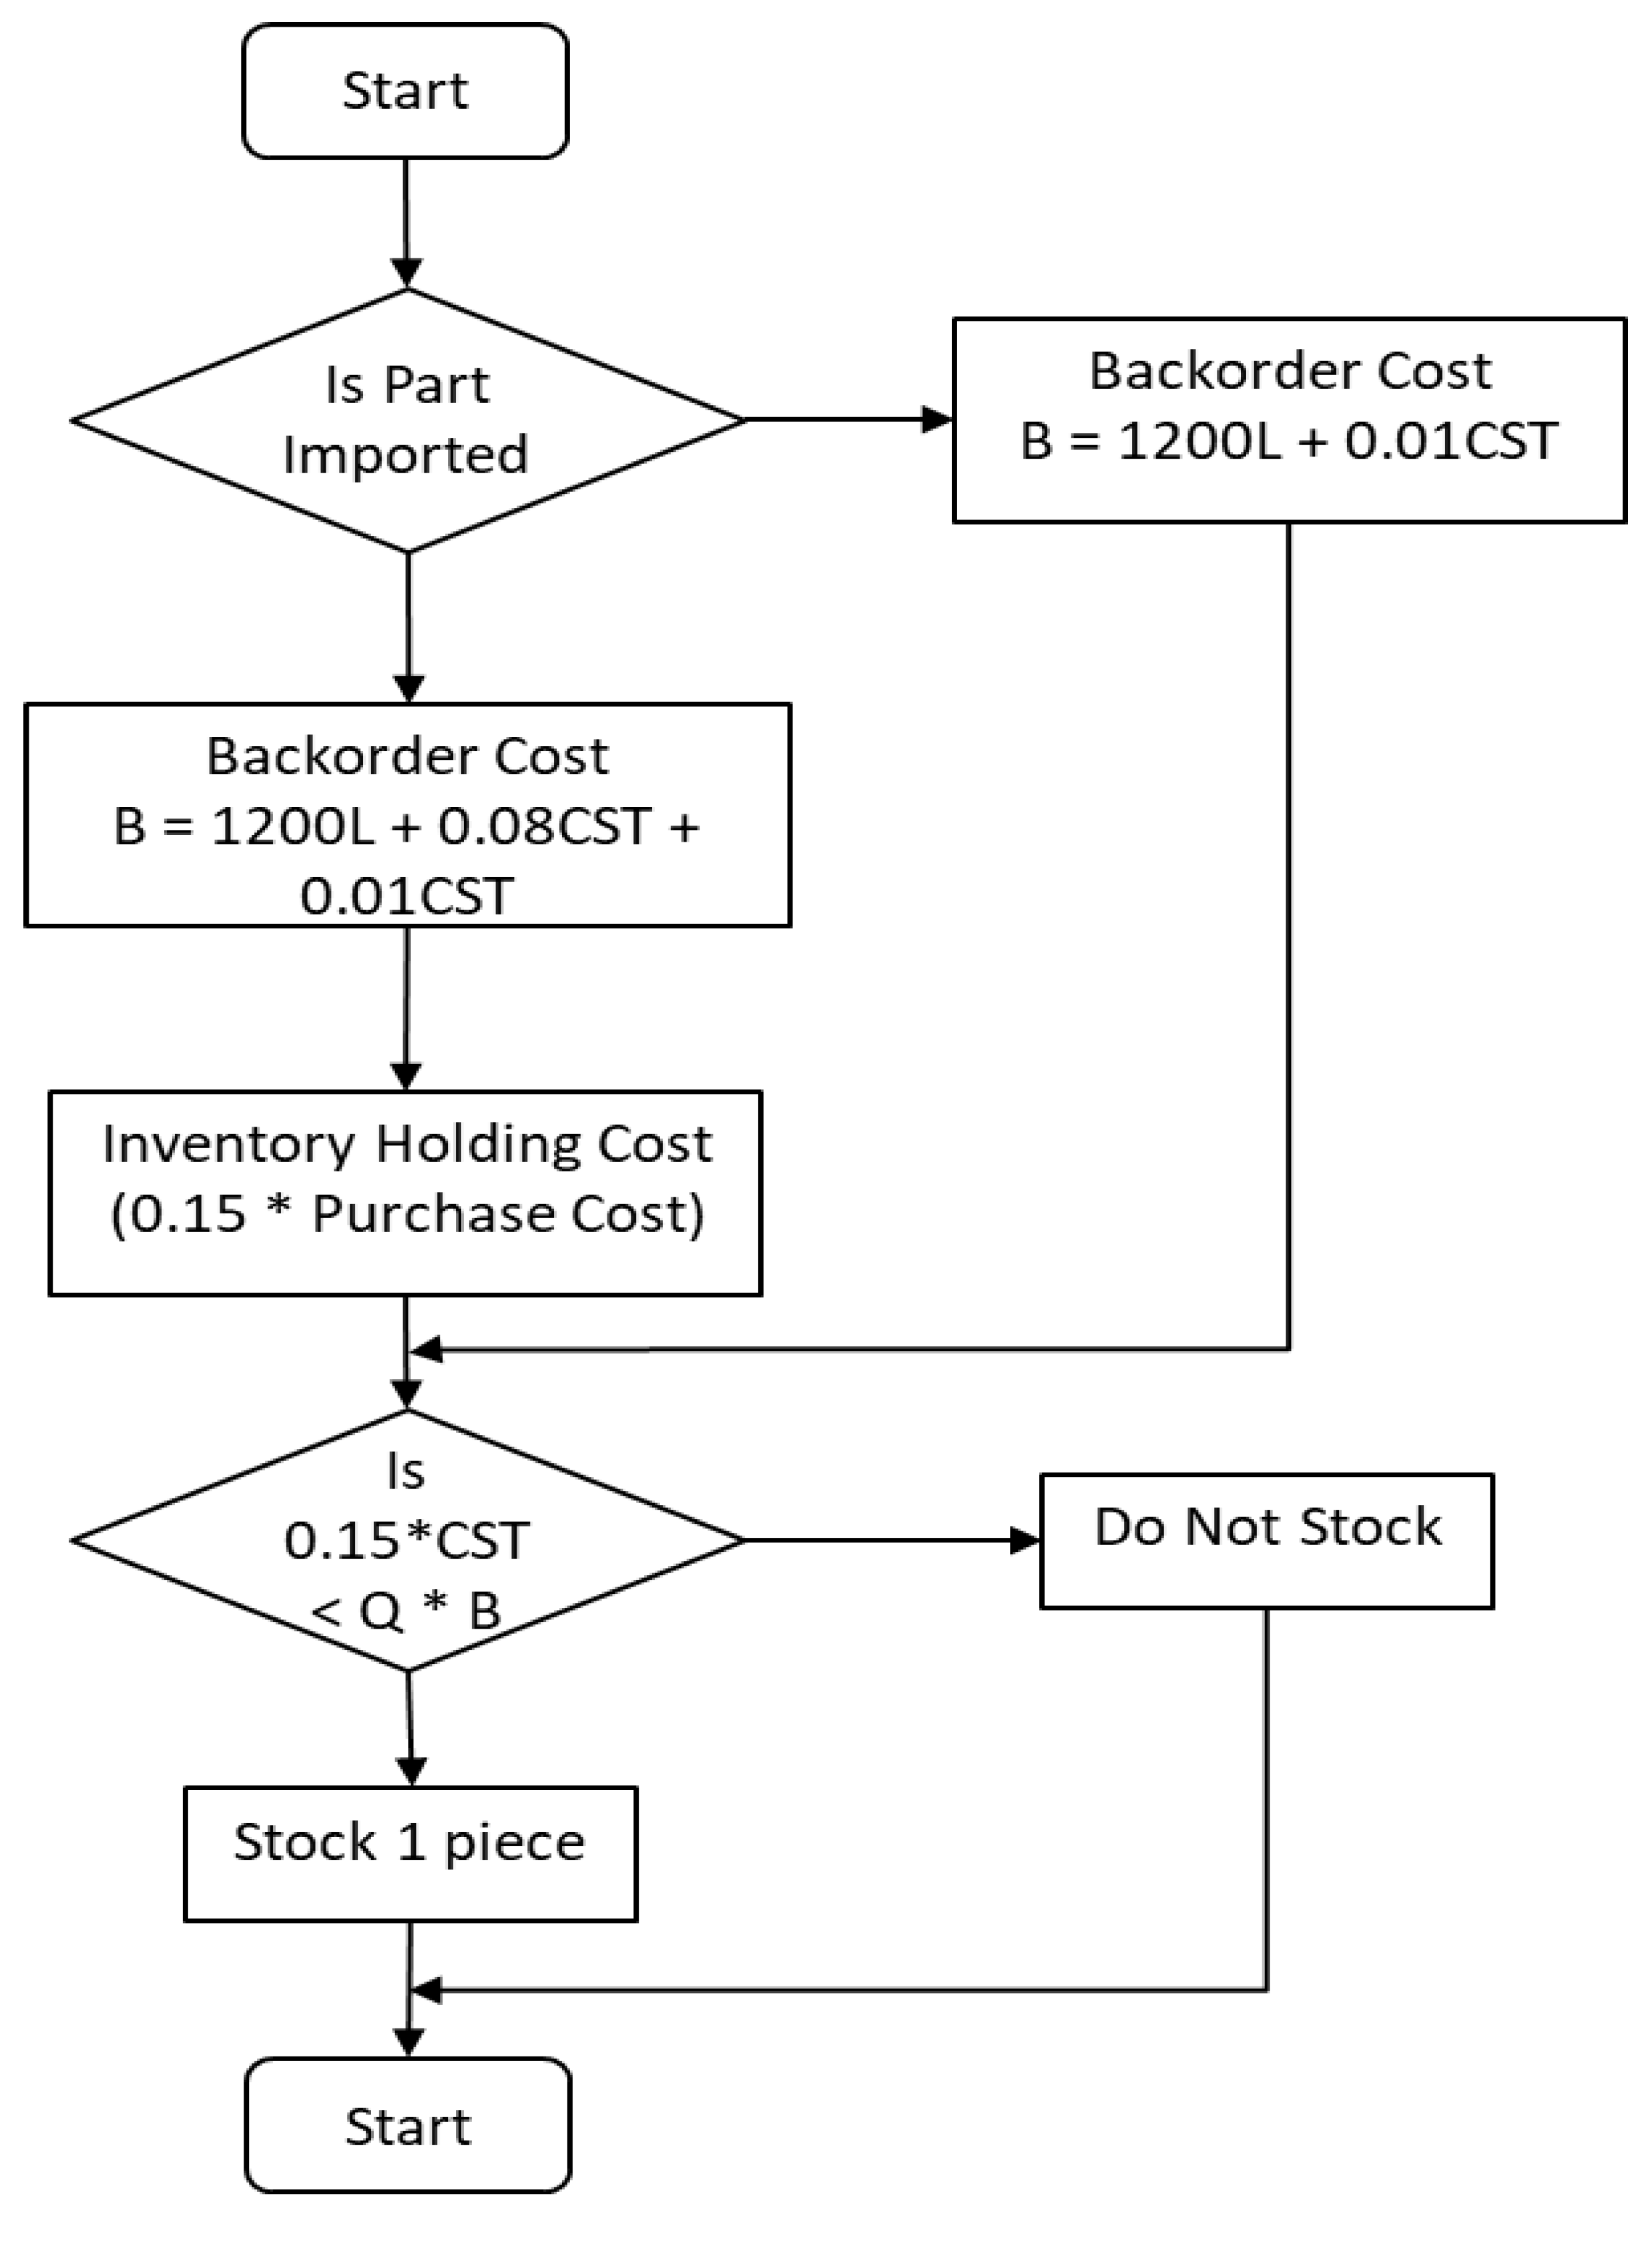
To enhance the clarity of the decision-making process, a visual representation in the form of a diagram or flowchart has been incorporated in
Figure 2. This visualization serves as a guide, illustrating the sequential steps involved in determining whether a service part should be stocked or not. It encapsulates the logic and criteria embedded in the decision rules, providing a comprehensive overview of the stocking process. The flowchart (
Figure 2) visually represents the decision-making process for stocking service parts. It likely outlines the steps involved in evaluating different criteria and making the final decision on whether to stock a particular service part or not.
This visualization not only aids in understanding the intricate decision rules but also serves as a valuable reference for stakeholders involved in service parts management. It streamlines the decision-making process, making it more transparent and accessible for effective implementation [7]. The subsequent sections will delve into the specifics of these decision rules, providing a deeper insight into how each criterion contributes to the overall stocking strategy.
2.4. Forecasting Models
In the pursuit of identifying an effective forecasting model for service parts demand, a diverse set of approaches was explored. This section outlines the application of various models, ranging from classical time series methods to advanced machine learning techniques.
2.4.1. Model Selection and Implementation
The selection of forecasting models involved a comprehensive consideration of different approaches. Classical time series models, including Moving Average (MA), Weighted Moving Average (WMA), and Exponential Smoothing, were among the initial methodologies applied [9]. These traditional models provided a baseline for comparison against more sophisticated techniques [10].
In addition to classical methods, machine learning models were introduced to harness the power of data-driven insights. Support Vector Regressor (SVR) [11] with Long Short-Term Memory (LSTM) [12] networks, known for their ability to capture complex patterns, were employed for demand forecasting. To ensure a comprehensive evaluation, Prophet, Auto ARIMA and Histogram-based Gradient Boosting Regressor models were also incorporated.
2.4.2. Performance Evaluation
Quantifying the performance of each forecasting model is critical for selecting the most reliable approach. The evaluation criteria primarily revolved around the Mean Absolute Percentage Error (MAPE) [13]. This metric provides a measure of the accuracy of each model by assessing the percentage difference between predicted and actual values.
Table 4 summarizes the preliminary results obtained from the application of different forecasting models, presenting their respective Mean Absolute Percentage Error (MAPE). This table serves as a quick reference to compare the performance of each model, with lower MAPE values indicating higher accuracy.
Table 4.
Preliminary results from applying different forecasting models.
Table 4.
Preliminary results from applying different forecasting models.
| Model |
Mean Absolute Percentage Error (MAPE) |
| Moving Average |
44.6% |
| Exponential Smoothing |
36.3% |
| Weighted Moving Average |
40.7% |
| Support Vector Machine (SVM) |
18.1% |
| Prophet |
27.6% |
| Auto ARIMA |
29.9% |
| Histogram-based Gradient Boosting |
29.1% |
The subsequent analysis and decision-making will be guided by these initial insights, aiming to identify the most effective forecasting model for service parts demand.
3. Results and Discussion
3.1. Service Parts Classification Based on Demand Criteria
3.1.1. Demand-Based Categories
In line with the proposed criteria, the service parts were successfully categorized into five distinct groups: “Platinum,” “Diamond,” “Gold,” “Silver,” and “Bronze.” The Distribution of parts across these categories is presented in Table 5. This classification provides a structured foundation for making informed decisions about stocking service parts.
Table 5.
Distribution of Service Parts Based on Demand Categories.
Table 5.
Distribution of Service Parts Based on Demand Categories.
| Demand Category |
Number of Parts |
Percentage (%) |
| Platinum |
128 |
16.2% |
| Diamond |
165 |
9.1% |
| Gold |
176 |
9.7% |
| Silver |
530 |
29.3% |
| Bronze |
807 |
44.7% |
| Total |
1806 |
100.0% |
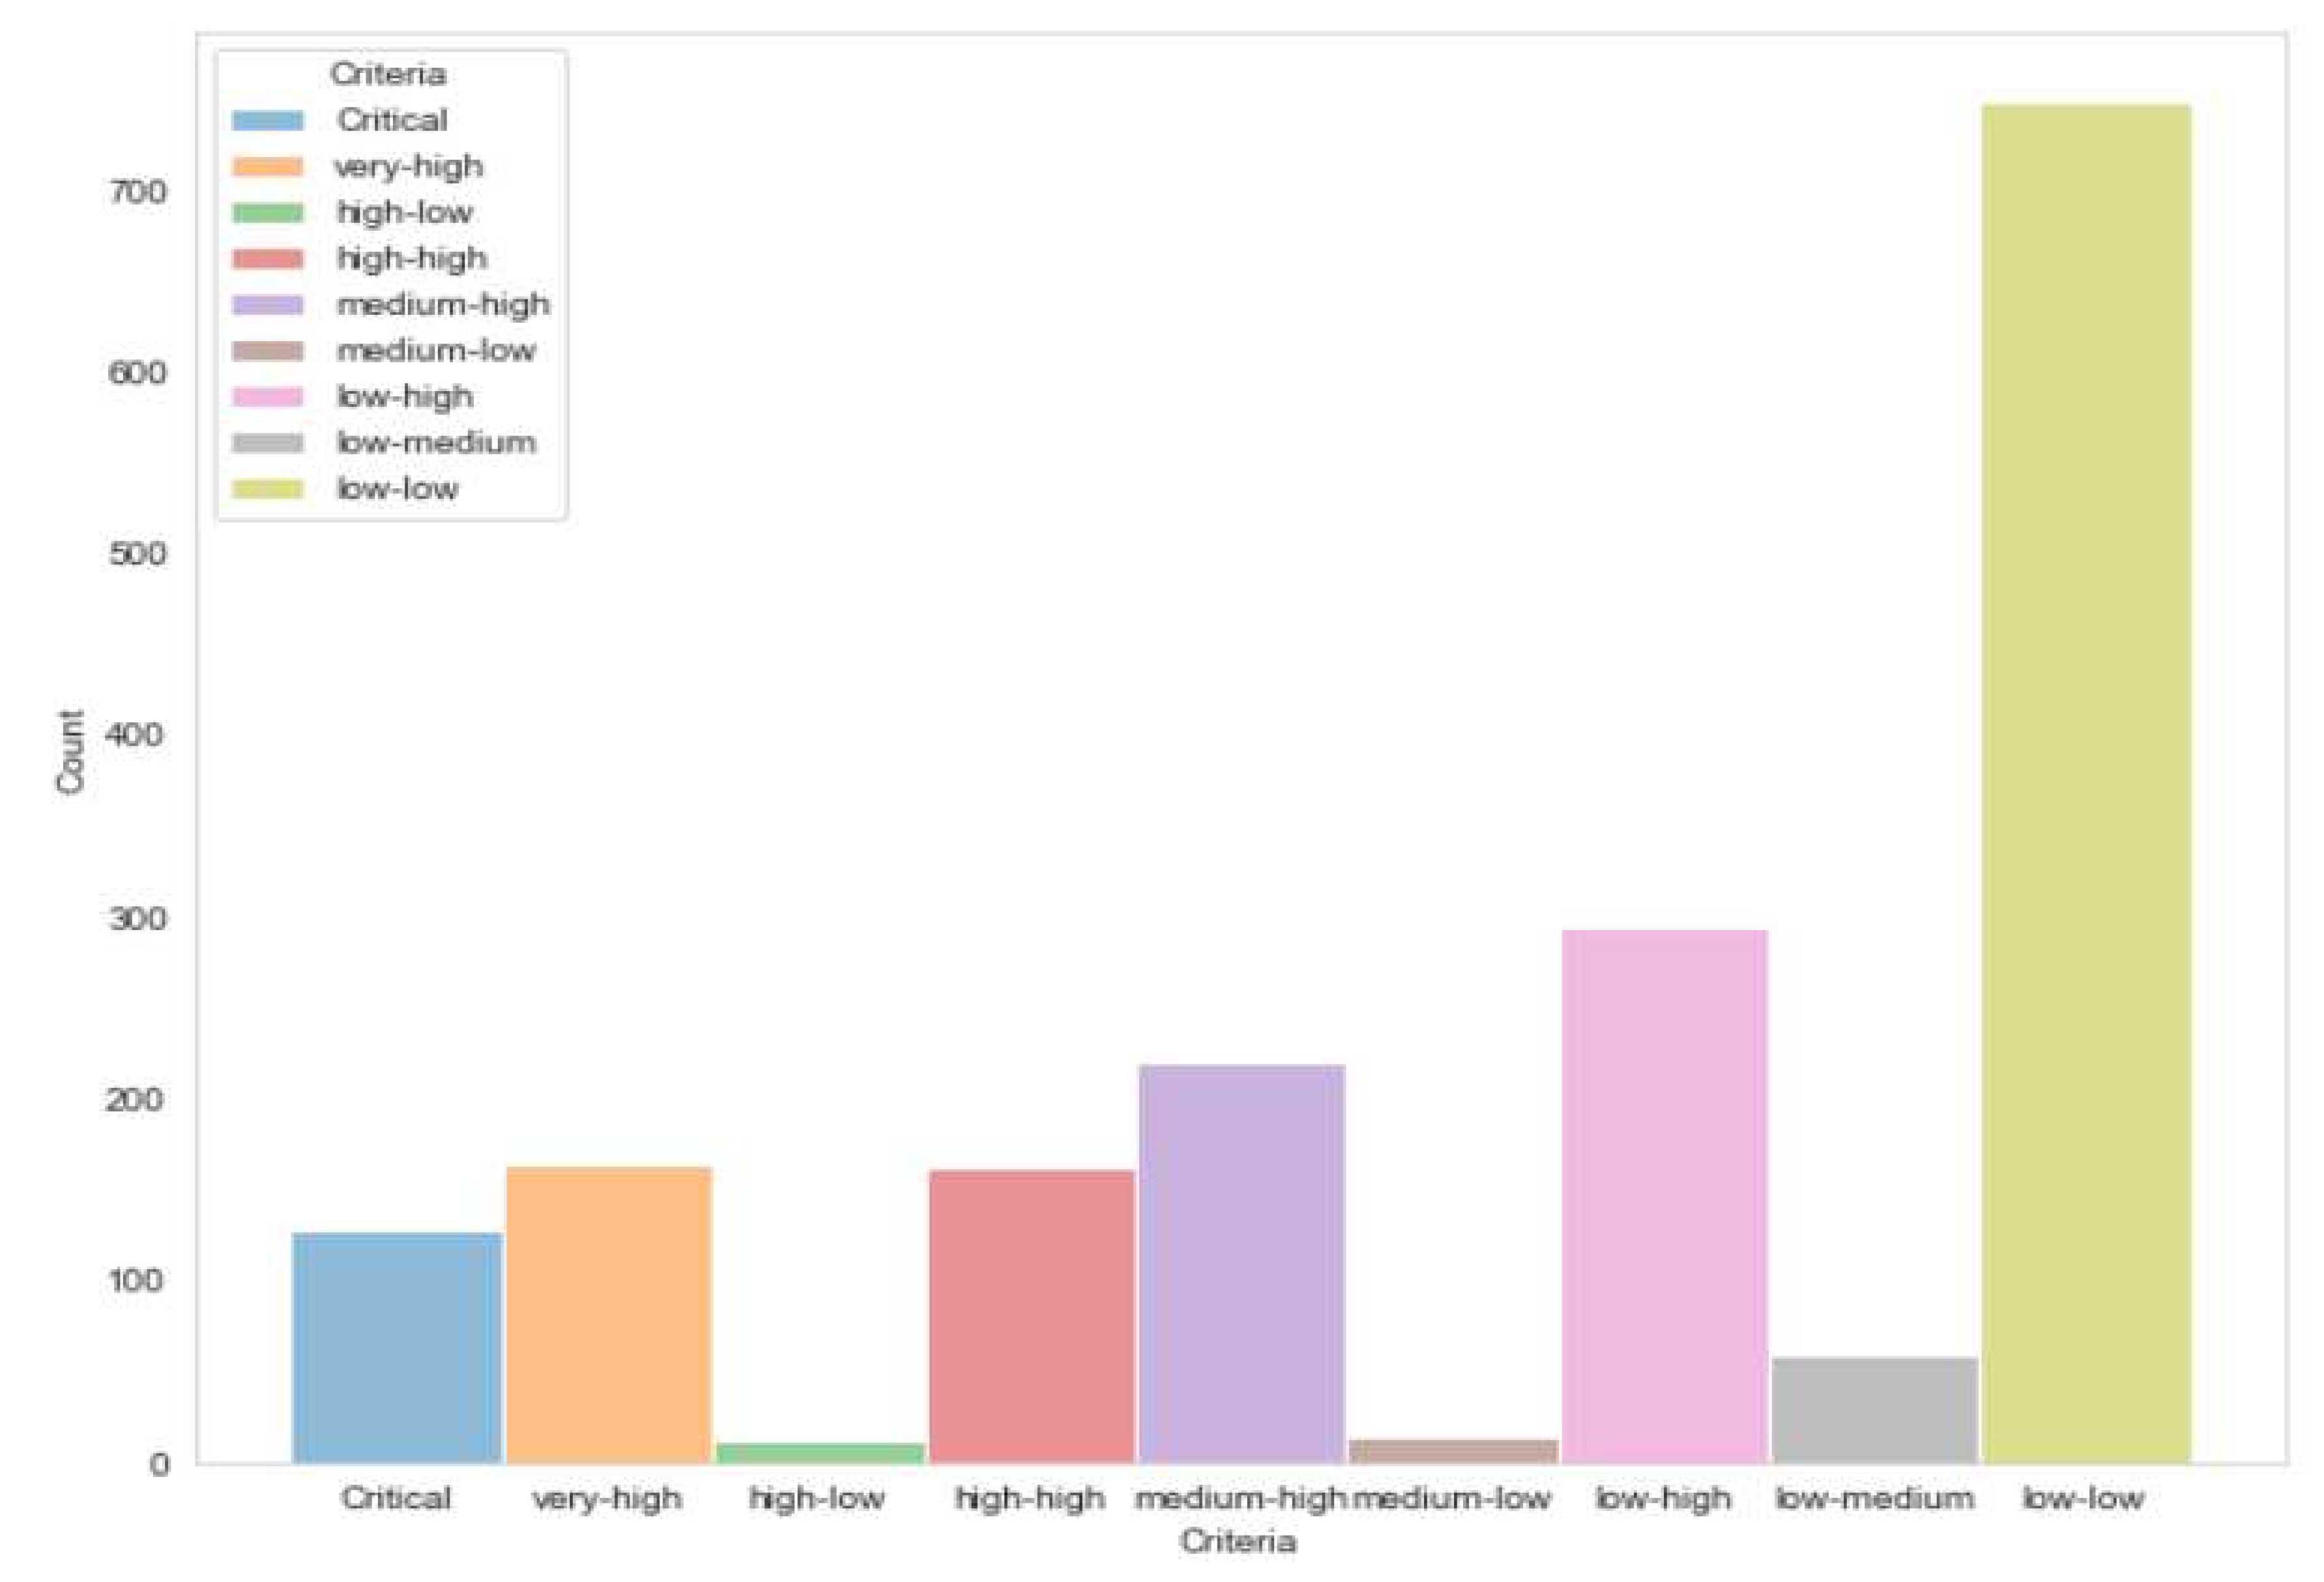
Figure 3 displays a histogram plot that provides valuable insights into the distribution of service parts based on certain criteria. The x-axis represents the criteria, while the y-axis represents the number of service parts. Notably, this plot illustrates a significantly higher number of parts with low demand. Approximately 75% of the service parts recorded sales of fewer than five pieces in the initial eight months post-launch. This observation is particularly crucial for understanding the demand life cycle of service parts, as it highlights the challenges posed by the overestimation of demand in the initial phase. The distribution of demand across various categories becomes apparent in this representation, which is instrumental in devising optimal stocking strategies.
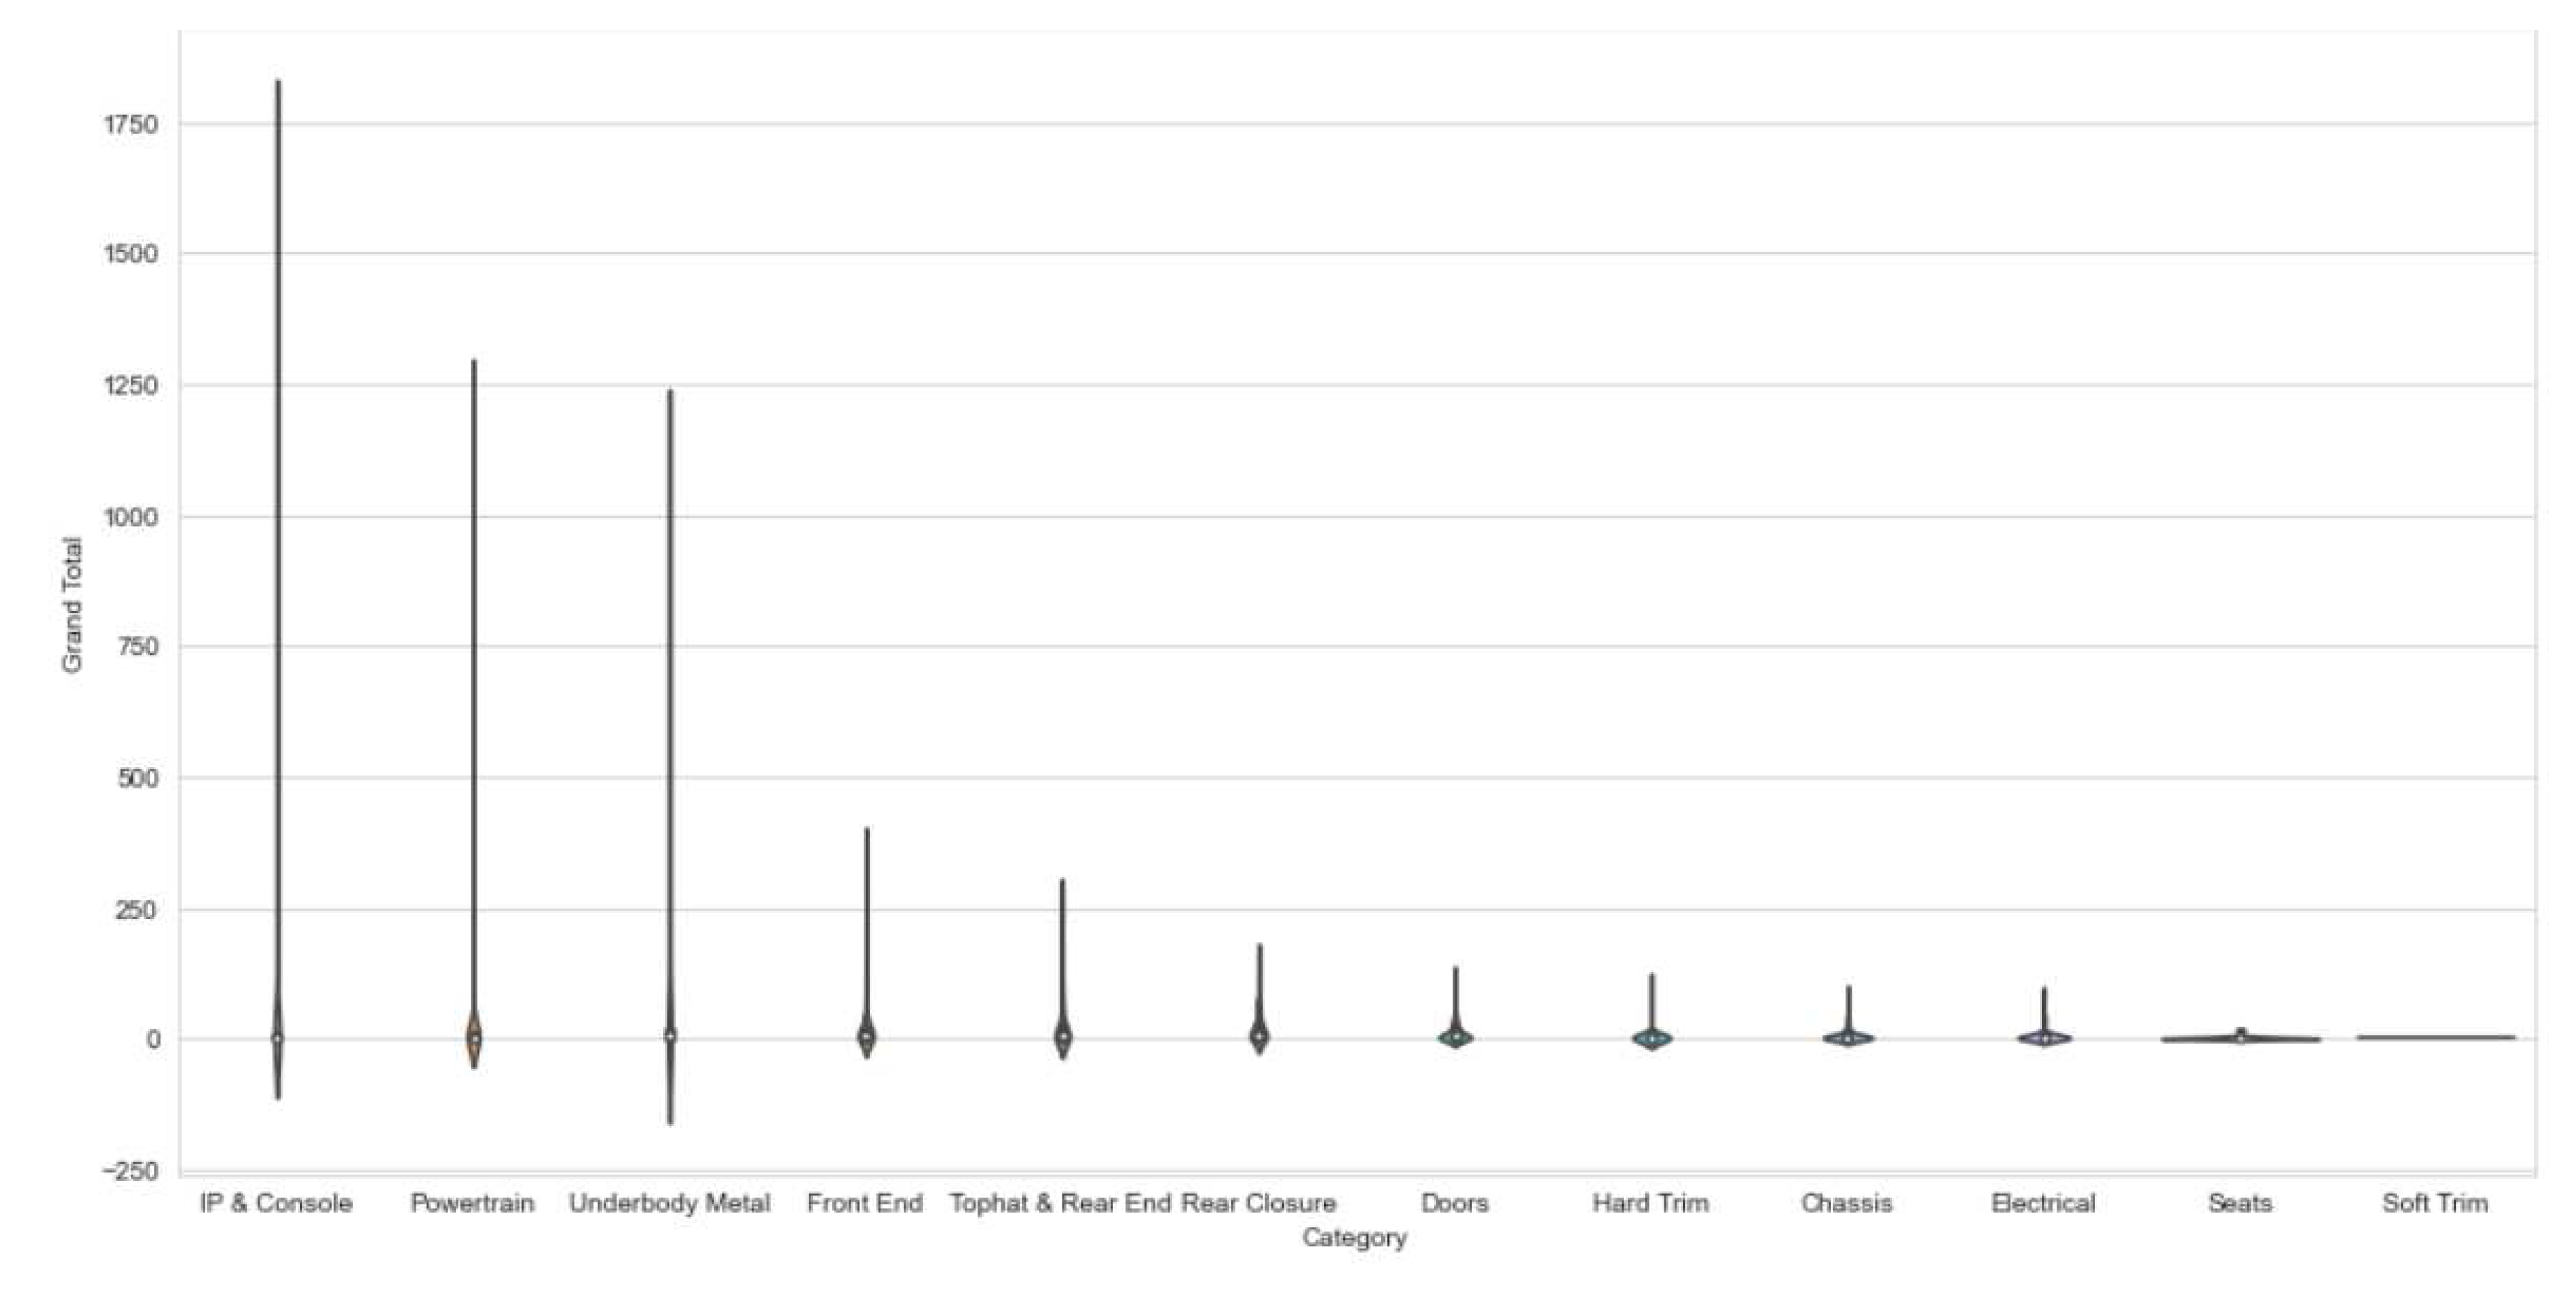
Figure 4 presents a violin plot that focuses on the distribution of service parts across various part systems. The x-axis distinguishes different part systems, while the y-axis indicates the density of parts in each system. Notably, this plot reveals the presence of outliers in three distinct systems, namely Instrument Panel & Console, Powertrain, and Underbody Metal. While Powertrain might suggest the inclusion of Periodic Maintenance Service parts, the implications of outliers in the Instrument Panel & Console and Underbody Metal categories warrant further investigation. The identification of these outliers within part systems is a vital step in optimizing stocking decisions and resource allocation, ensuring that the right parts are stocked efficiently.
3.1.2. Implications of Categorization
The categorization of service parts based on demand criteria has several notable implications [14]. Notably, it allows for a more strategic allocation of resources. The “Platinum” and “Diamond” categories, representing high-demand parts, warrant a more significant focus on inventory management. In contrast, the “Bronze” category, with low-demand parts, opens opportunities for alternative solutions. The strategic implications of this classification are discussed in
Section 3.2.
3.2. Stocking Decision Rules and Outcomes
3.2.1. Decision Rule Application
Applying the decision rules established in
Section 3.1, the study determined whether to stock each service part based on the calculated indices. The outcomes are presented in
Table 6. A significant number of parts were identified as candidates for stocking, aligning with the management’s objective to stock at least one piece of every part [
15]. Notably, this aligns with the aim of minimizing service disruptions. The outcomes are summarized in Table 3.1.
Table 6.
Decision Rule Outcomes.
Table 6.
Decision Rule Outcomes.
| Classification |
Do Not Stock |
Stock |
| low-low |
294 |
454 |
| low-high |
74 |
221 |
| medium-high |
6 |
214 |
| high-high |
3 |
160 |
| low-medium |
2 |
57 |
| high-low |
|
13 |
| medium-low |
|
15 |
| Critical |
|
128 |
| very-high |
|
165 |
| Grand Total |
379 |
1427 |
3.2.2. Exceptions and Contingency Solutions
Intriguingly, a set of exceptions and contingency solutions was introduced. Based on factors such as classification criteria and lead times, exceptions were recommended for certain parts that initially fell into the stocking category. Similarly, contingency solutions focused on minimizing costs by addressing parts with high lead times and low demand. These strategies introduce a level of flexibility into the decision-making process, ensuring the optimal allocation of resources.
3.3. Cost Impact Assessment
A fundamental aspect of this research involved quantifying the economic impact of the proposed stocking strategy [
16]. By comparing the cost of stocking all parts to the cost associated with the newly developed equation, significant cost savings were identified. The results indicate that strategic stocking, as per the decision rules, could potentially save the organization a substantial amount of capital. This cost assessment is elaborated upon in
Section 3.4.
In
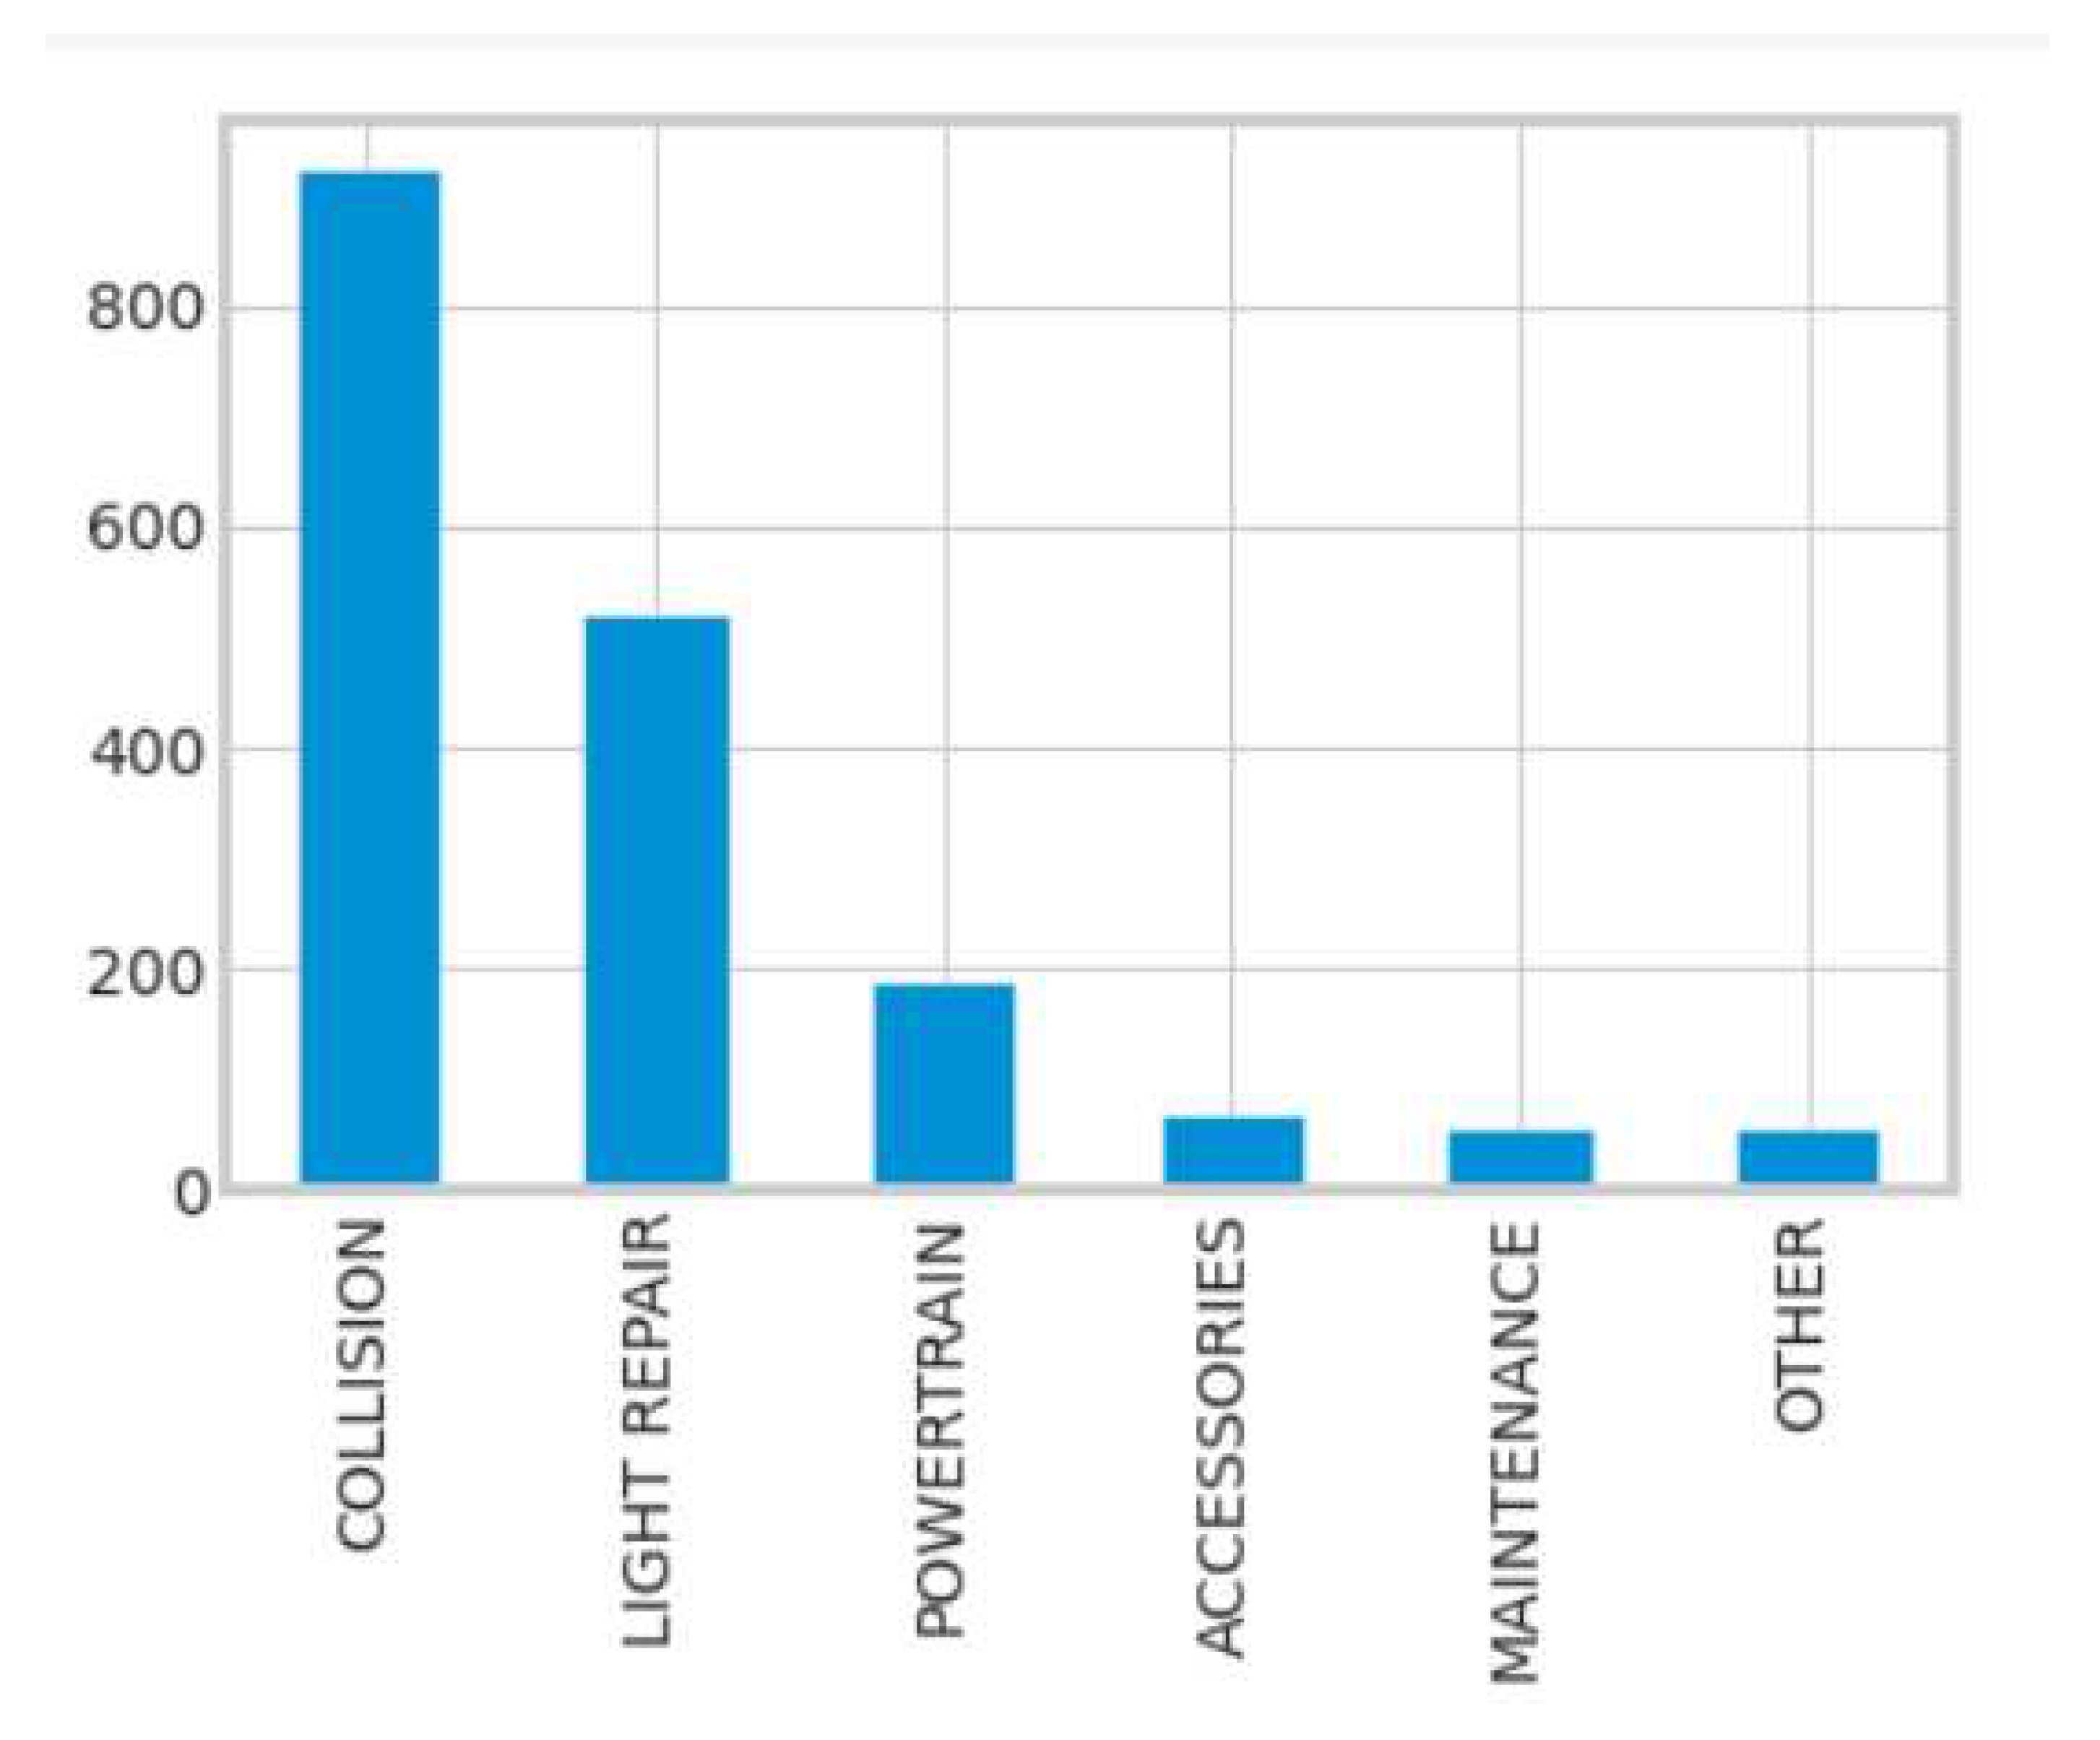
Figure 5, present an insightful depiction of the demand distribution for service parts categorized under “Accident Repair.” This category plays a vital role in the automotive service industry as it encompasses parts required for collision and accident-related repairs. The figure showcases the demand trends for accident repair parts, offering a visual representation of the initial phase of demand, which is often characterized by a surge in requests. This figure highlights the importance of efficient stocking decisions for accident repair parts, ensuring that collision repair shops and service centres have quick access to these critical components during times of increased demand.
3.4. Comparison and Recommendations
In the evaluation of forecasting models, the Mean Absolute Percentage Error (MAPE) served as a crucial metric for assessing performance. Each model’s accuracy was gauged in percentages, offering a clear picture of their effectiveness in capturing the intricate demand patterns of service parts.
MA emerged with a MAPE of 44.6%, indicating its limitations in accurately predicting dynamic demand variations. Exponential Smoothing surpassed MA with a MAPE of 36.3%, showcasing improved adaptability to fluctuating demand. WMA positioned itself as a viable alternative, displaying a performance level between MA and Exponential Smoothing, with a MAPE of 40.7%.
The SVM exhibited a significant leap in performance, achieving a MAPE of 18.1%. This demonstrated SVM’s capacity to comprehend complex demand patterns, offering enhanced forecasting accuracy. Prophet, a classical time series model, delivered a competitive performance with a MAPE of 27.6%, showcasing reliability in capturing predictable demand trends.
Auto ARIMA, with a MAPE of 29.9%, positioned itself as a robust model, particularly when compared to simpler methods like MA and WMA. The Histogram-based Gradient Boosting model demonstrated effectiveness with a MAPE of 29.1%, striking a balance between simplicity and accuracy.
When assessing attenuation, which reflects the reduction in forecasting error achieved by using a more sophisticated model compared to a simpler one, notable trends emerged. SVM exhibited substantial attenuation compared to MA, emphasizing its superiority in capturing complex demand patterns [
17]. Prophet showcased attenuation concerning Exponential Smoothing, highlighting its ability to enhance accuracy in scenarios with more predictable demand. Auto ARIMA displayed attenuation compared to WMA, underscoring its superior performance in forecasting service parts demand. These nuanced insights into model performance allow organizations to make informed decisions based on the specific characteristics of their service parts demand patterns.
The study conducted a comprehensive comparison of different forecasting models, including classical time series models, machine learning techniques, and advanced deep learning models. The results highlighted the supremacy of certain models in specific contexts. Notably, SVR emerged as the best-performing model in terms of accuracy [
18]. This model, however, showed a slight performance drop when applied to erratic demand patterns. Recommendations encompass various aspects, such as parts classification, focus on specific categories (“Platinum,” “Diamond,” “Gold”), and utilization of the best-performing forecasting model for each specific criterion. Moreover, the research suggests a dynamic approach to stocking based on monthly demand increments correlated with vehicle sales volumes.
3.5. Limitations and Future Prospects
While the current study leveraged a dataset spanning a commendable 9-month period, it is important to acknowledge the potential for future enhancements in data availability and historical coverage. The depth of historical data represents a critical factor in refining forecasting accuracy, particularly for parts characterized by sporadic or evolving demand patterns. Expanding the historical scope beyond the current timeframe could yield valuable insights and contribute to a more robust forecasting model. A more extensive dataset, encompassing a more prolonged historical period, holds the potential to enhance the precision and reliability of forecasts, offering a comprehensive understanding of demand dynamics over an extended timeframe. This proactive approach to data expansion could further fortify the research outcomes and provide a more comprehensive foundation for strategic decision-making in service parts management. Additionally, future research could explore ensembling approaches and investigate advanced models not covered in this study, potentially offering enhanced forecasting capabilities.
3.6. Industry-Wide Adoption
The findings of this study hold significance for the broader automotive service industry. The systematic categorization of service parts based on demand criteria and the implementation of efficient stocking rules can be readily applied across the sector, leading to more cost-effective operations and improved service quality.
4. Conclusions
The exploration into service parts management and demand forecasting within the context of the Thai automotive industry has provided valuable insights and strategic recommendations. The following key conclusions encapsulate the findings of this research:
Optimized Service Parts Classification: The demand-based categorization provides a nuanced framework for strategic decision-making, allowing tailored resource allocation based on the demand characteristics of each category.
Robust Stocking Decision Rules: Meticulously derived decision rules achieve a balance between minimizing service disruptions and optimizing costs, with exceptions and contingency solutions introducing flexibility into the decision-making process.
Substantial Cost Savings through Strategic Stocking: The cost impact assessment indicates that strategic stocking, guided by the decision rules, has the potential to yield significant cost savings.
Model Performance and Recommendations: The comparative analysis of forecasting models emphasizes the importance of selecting the right model for specific contexts, with SVR identified as the most accurate model.
Attenuation and Comparison Insights: Attenuation analysis reveals the reduction in forecasting error achieved by using more sophisticated models compared to simpler ones. SVM exhibits substantial attenuation, emphasizing its superiority in capturing complex demand patterns. Recommendations advocate for leveraging the strengths of different models and dynamically adapting stocking strategies based on monthly demand increments.
Implications for the Automotive Service Industry: The study’s implications extend beyond individual organizations to the broader automotive service industry, presenting an industry-wide opportunity for cost-effective operations and heightened service quality.
Overall, this research offers a comprehensive framework for navigating the intricate landscape of service parts management in the Thai automotive industry. The tailored methodology, supported by insightful data analysis and visualization, provides a roadmap for optimizing stocking strategies and enhancing overall operational efficiency. The findings and recommendations presented in this study aim to contribute to the ongoing narrative of improving the efficiency and sustainability of the automotive industry in Thailand.
References
- Kato, A. I., & Manchidi, N. M. (2022). Impact of supply chain management strategies on firms’ sustainable performance: a case of an emerging economy. Entrepreneurship and Sustainability Issues, 10(2), 93. [CrossRef]
- Jiao, R., Commuri, S., Panchal, J., Milisavljevic-Syed, J., Allen, J. K., Mistree, F., & Schaefer, D. (2021). Design engineering in the age of industry 4.0. Journal of Mechanical Design, 143(7), 070801. [CrossRef]
- Cardeal, G., Leite, M., & Ribeiro, I. (2023). Decision-support model to select spare parts suitable for additive manufacturing. Computers in Industry, 144, 103798. [CrossRef]
- Ding, S., & Li, R. (2021). Forecasting the sales and stock of electric vehicles using a novel self-adaptive optimized grey model. Engineering Applications of Artificial Intelligence, 100, 104148. [CrossRef]
- Aunyawong, W., Wararatchai, P., & Hotrawaisaya, C. (2020). The influence of supply chain integration on supply chain performance of auto-parts manufacturers in Thailand: a mediation approach. International Journal of Supply Chain Management, 9(3), 578-590.
- Min, S., Zacharia, Z. G., & Smith, C. D. (2019). Defining supply chain management: in the past, present, and future. Journal of business logistics, 40(1), 44-55. [CrossRef]
- Yang, Ke, Yongjian Wang, Shidong Fan, and Ali Mosleh. 2021. "Multi-Criteria Spare Parts Classification Using the Deep Convolutional Neural Network Method" Applied Sciences 11, no. 15: 7088. [CrossRef]
- Jian, J., Li, B., Zhang, N., & Su, J. (2021). Decision-making and coordination of green closed-loop supply chain with fairness concern. Journal of Cleaner Production, 298, 126779. [CrossRef]
- Alex, M. A. H., & Rahmawati, N. (2023). Application of the Single Moving Average, Weighted Moving Average and Exponential Smoothing Methods For Forecasting Demand At Boy Delivery. Tibuana, 6(1), 32-37. [CrossRef]
- ArunKumar, K. E., Kalaga, D. V., Kumar, C. M. S., Chilkoor, G., Kawaji, M., & Brenza, T. M. (2021). Forecasting the dynamics of cumulative COVID-19 cases (confirmed, recovered and deaths) for top-16 countries using statistical machine learning models: Auto-Regressive Integrated Moving Average (ARIMA) and Seasonal Auto-Regressive Integrated Moving Average (SARIMA). Applied soft computing, 103, 107161. [CrossRef]
- Huang, J., Algahtani, M., & Kaewunruen, S. (2022). Energy forecasting in a public building: a benchmarking analysis on long short-term memory (LSTM), support vector regression (SVR), and extreme gradient boosting (XGBoost) networks. Applied Sciences, 12(19), 9788. [CrossRef]
- Weng, T., Liu, W., & Xiao, J. (2020). Supply chain sales forecasting based on lightGBM and LSTM combination model. Industrial Management & Data Systems, 120(2), 265-279. [CrossRef]
- Kilimci, Z. H., Akyuz, A. O., Uysal, M., Akyokus, S., Uysal, M. O., Atak Bulbul, B., & Ekmis, M. A. (2019). An improved demand forecasting model using deep learning approach and proposed decision integration strategy for supply chain. Complexity, 2019. [CrossRef]
- Chandriah, K. K., & Naraganahalli, R. V. (2021). RNN/LSTM with modified Adam optimizer in deep learning approach for automobile spare parts demand forecasting. Multimedia Tools and Applications, 80(17), 26145-26159. [CrossRef]
- Agrawal, N., & Deshpande, V. (2022). Service Parts Management: Theoretical Foundations, Practice, and Opportunities. Creating Values with Operations and Analytics: A Tribute to the Contributions of Professor Morris Cohen, 133-167. [CrossRef]
- Muniz, L. R., Conceição, S. V., Rodrigues, L. F., de Freitas Almeida, J. F., & Affonso, T. B. (2021). Spare parts inventory management: a new hybrid approach. The International Journal of Logistics Management, 32(1), 40-67. [CrossRef]
- Shahriar, S. A., Kayes, I., Hasan, K., Hasan, M., Islam, R., Awang, N. R., ... & Salam, M. A. (2021). Potential of ARIMA-ANN, ARIMA-SVM, DT and CatBoost for atmospheric PM2. 5 forecasting in Bangladesh. Atmosphere, 12(1), 100. [CrossRef]
- Amirvaresi, A., & Parastar, H. (2021). External parameter orthogonalization-support vector machine for processing of attenuated total reflectance-mid-infrared spectra: A solution for saffron authenticity problem. Analytica Chimica Acta, 1154, 338308. [CrossRef]
|
Disclaimer/Publisher’s Note: The statements, opinions and data contained in all publications are solely those of the individual author(s) and contributor(s) and not of MDPI and/or the editor(s). MDPI and/or the editor(s) disclaim responsibility for any injury to people or property resulting from any ideas, methods, instructions or products referred to in the content. |
© 2023 by the authors. Licensee MDPI, Basel, Switzerland. This article is an open access article distributed under the terms and conditions of the Creative Commons Attribution (CC BY) license (http://creativecommons.org/licenses/by/4.0/).
