1. INTRODUCTION
The impact loading is one of the most severe loading conditions, characterized by a high intensity force within short durations of time. To design the structure to withstand the action low velocity impact load is a major issue, due to the risks associated with natural hazards or accidental or man- made damage (i.e., motor vehicle, ice ship impact, falling of heavy weights on structures, natural threats such as falling rocks in mountain areas, nuclear power plant accidents, chemical plant bursts and other acts related to terrorism). There is still a lot of demand in the improvement of the performance of infrastructures subjected to extreme loads, such as blast loads and impact load (High velocity impact as well as low velocity impact). However, till date the performance of RC structures, subjected to impact loading has not been suitably defined by civil engineers. As a result of this, many low velocity impact tests have been conducted to understand and study the response of concrete beams subjected to impact loading.
Fiber reinforced concrete (FRC) is not only the material to overcome the inherent brittle characteristics of normal concrete when subjected to low-velocity impacts and it has potential against high impact resistance performance. The adding of fibers in the concrete mixture, mainly steel fibers has improved impact resistance, durability, and energy absorption during impact loads. In the present study, steel and polypropylene fibers with aspect ratio of 60 and 231 respectively were used as reinforcing materials in concrete, this results in hybrid fiber reinforced concrete (HFRC). These fibers were chosen because of their advantages; the steel fibers are large compared to PP fibers, as it will arrest the growth of macro cracks thereby improving the fracture energy of concrete, while the PP fibers are short, thin, flexible, and smooth and helps in resisting the development of micro cracks.
Further, PP fibers with low modulus of elasticity are ductile and flexible, it can be effectively improving the toughness and resistance to elongation in the cracking zone. Meanwhile, the steel fiber is stronger, more rigid, has a high modulus of elasticity and can improve the final strength before it is cracked for the first time. Vahid and Togay studied experimentally the durability and mechanical properties of high strength concrete on adding steel and PP fibers. They used hooked end steel fibers of 60 mm length and polypropylene fibers of 12 mm length in various volume fractions by maintaining total fiber volume fraction by 1.0%. Among different combinations of fibers studied they found mixture containing 0.85% steel and 0.15% polypropylene fiber showed better performance in terms of both mechanical and durable properties [
2]. The numerical analysis shows that with constant impact energy, impacts caused by large masses at low velocity led to a lower maximum impact, but a higher maximum beam deflection in the middle of the span and vice versa [
4], and for fixed end boundary conditions the maximum impact load was high and the mid span deflection was low compared to pinned-end boundary conditions. As a result of higher reinforcement ratio, the proposed impact exhibited better deflection recovery. The variation in the reinforcement ratio has a significant impact on the recovery of deflection after impact. It was found that when the percentage of steel reinforcement increased from 0% to 2.28% the maximum deflection in the center of the span decreased by 37% [
10].
2. FINITE ELEMENT MODELING
Commercially available finite element analysis software ABAQUS is used for analysis of fiber reinforced beam.
2.1. Modeling
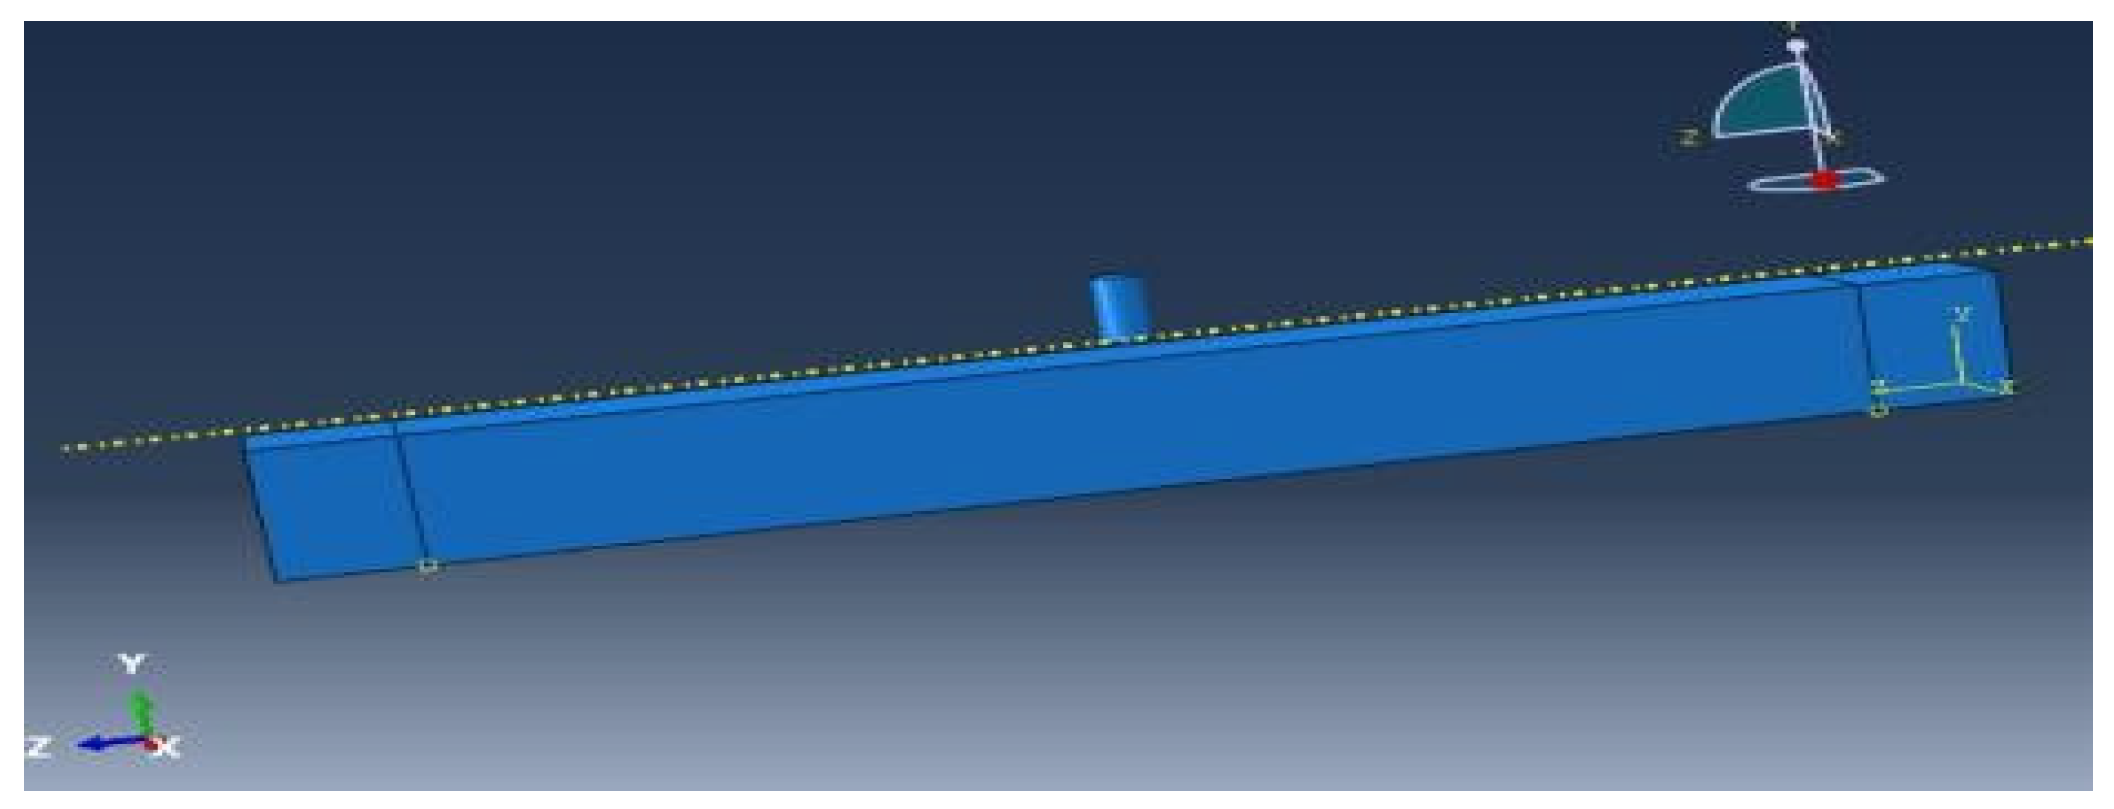
In modeling both components (i.e., beam and hammer) are created separately. For modeling beam component eight-node solid elements (C3D8R) are used. Similarly, the solid elements are also used to model the steel hammer. C3D8R element is formulated based on Lagrangian assumption of the element deforms with material deformation. While modeling the hammer used is of size 51 mm diameter and 100 mm length with cylindrical body which intern connected with hemisphere tip (striking tip) of 16 mm diameter at the bottom. Then both components are assembled as shown in
Figure 1.
2.2. Material Properties
The hybrid fiber used is of two types of fiber: Polypropylene fiber with aspect ratio 231 (length = 3 mm, diameter = 0.013 mm) having elastic modulus = 4.7 GPa similarly steel fibers are of aspect ratio 60 (length = 21 mm and diameter = 0.35 mm) with elastic modulus = 200 GPa. The tensile strength of the PP and MS fibers were 550 and 2800 MPa, respectively. HFRC beams are modeled by using their combined material properties and are tested for impact resistance. While modeling, the fibers are not being considered as a separate modeling entity, but the strength of concrete with different fiber combinations/ proportions are studied separately. The properties of those concrete materials with different fiber combinations/ proportions are directly used. The HFRC materials properties required for the analysis are compressive stress, tensile strength, modulus of elasticity, poisons ratio and concrete damage plasticity.
Table 1. shows the input parameters used for defining concrete [
11].
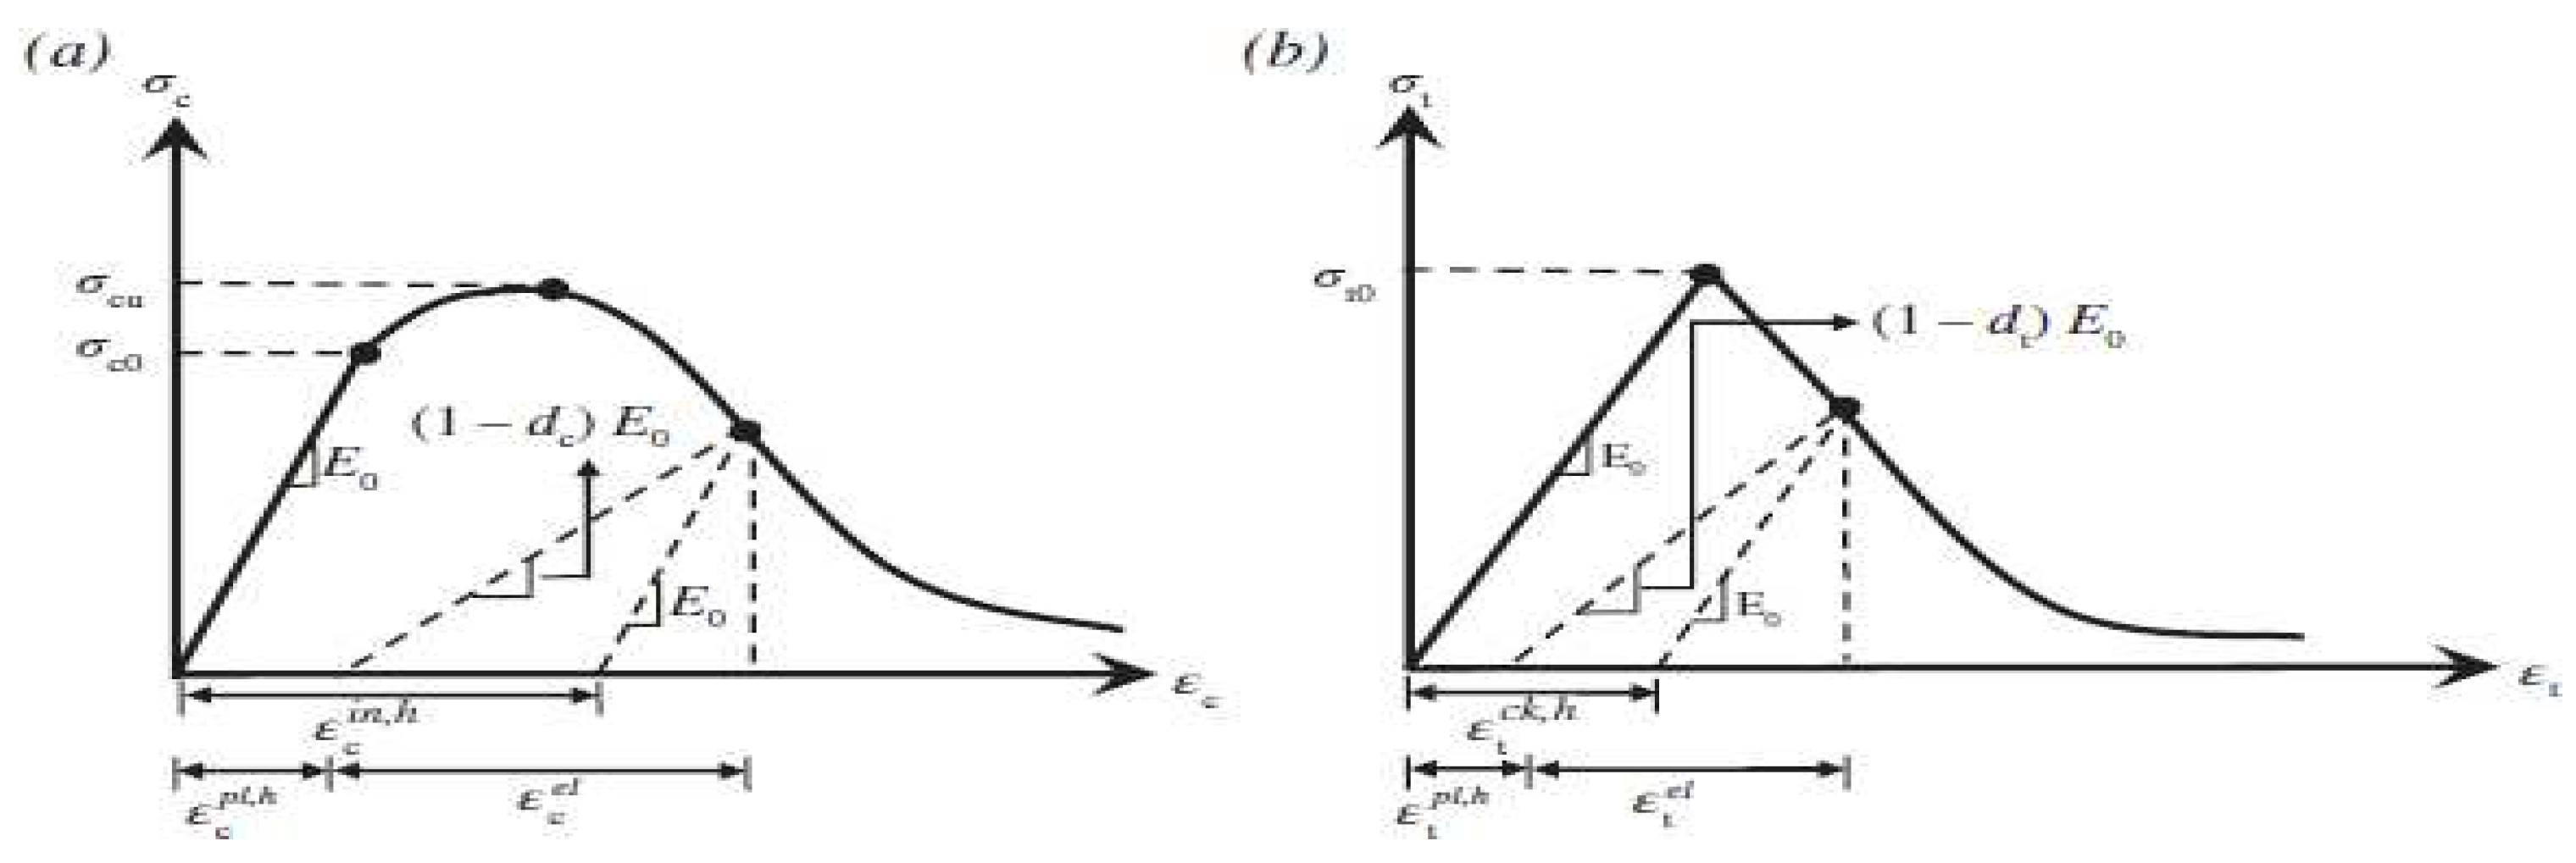
2.2.1. Concrete Damaged Plasticity Model [10]
The values of the hardening and softening variables were used for the determination of the cracking and crushing trends, respectively which responsible for the loss of the elastic stiffness and the development of the yield surface. The damage states in compression and tension were characterized independently by two hardening variables.
In concrete damage plasticity models, the plastic hardening strain in compression ε
pl, hc played a key role in finding the relation between the damage parameters and the compressive strength of concrete
Figure 2a.
In concrete damage plasticity models, the plastic hardening strain in tension ε
pl, ht was derived
Figure 2b.
2.2.2. Properties of steel hammer
Young’s modulus (E): 210 GPa
Poisons ratio : 0.3
Density hammer : 486964 kg/m3 (just to maintain the tip diameter and total mass of hammer as 16 mm and 100 kg respectively)
2.3. Mesh configuration, load and boundary condition
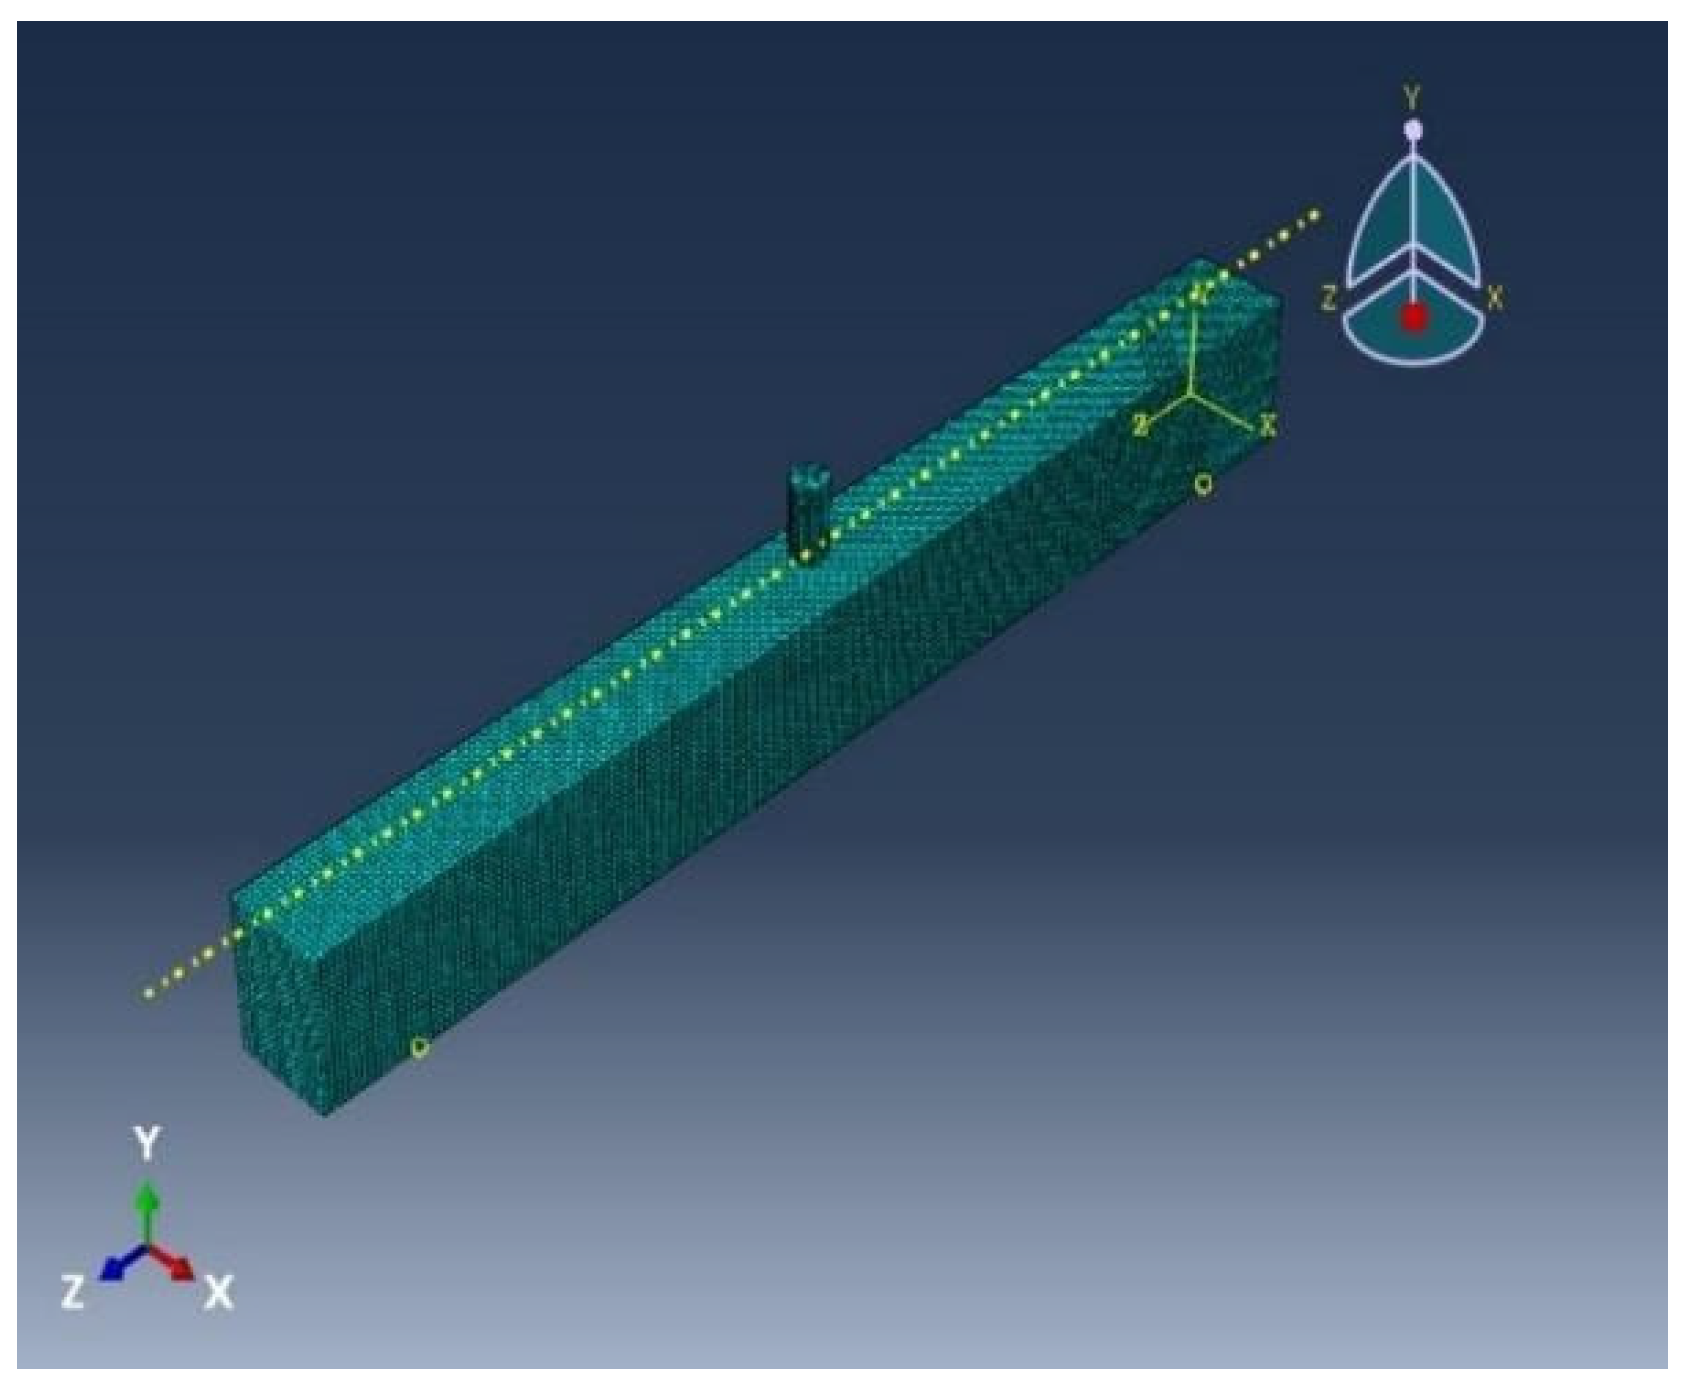
It is important to use a sufficiently refined mesh in order to ensure that, the model produces a nearly accurate mathematical solution and also computational time is minimized. In general, numerical result of FE model tends toward a unique value as the mesh density increased. In this study mesh size of 10 mm is used for beam. The drop-weight is modeled with initial position very close to the specimen surface (5 mm away) and assigned with mass of hammer i.e. 100 kg. Each beam specimen is impacted with four different velocities.
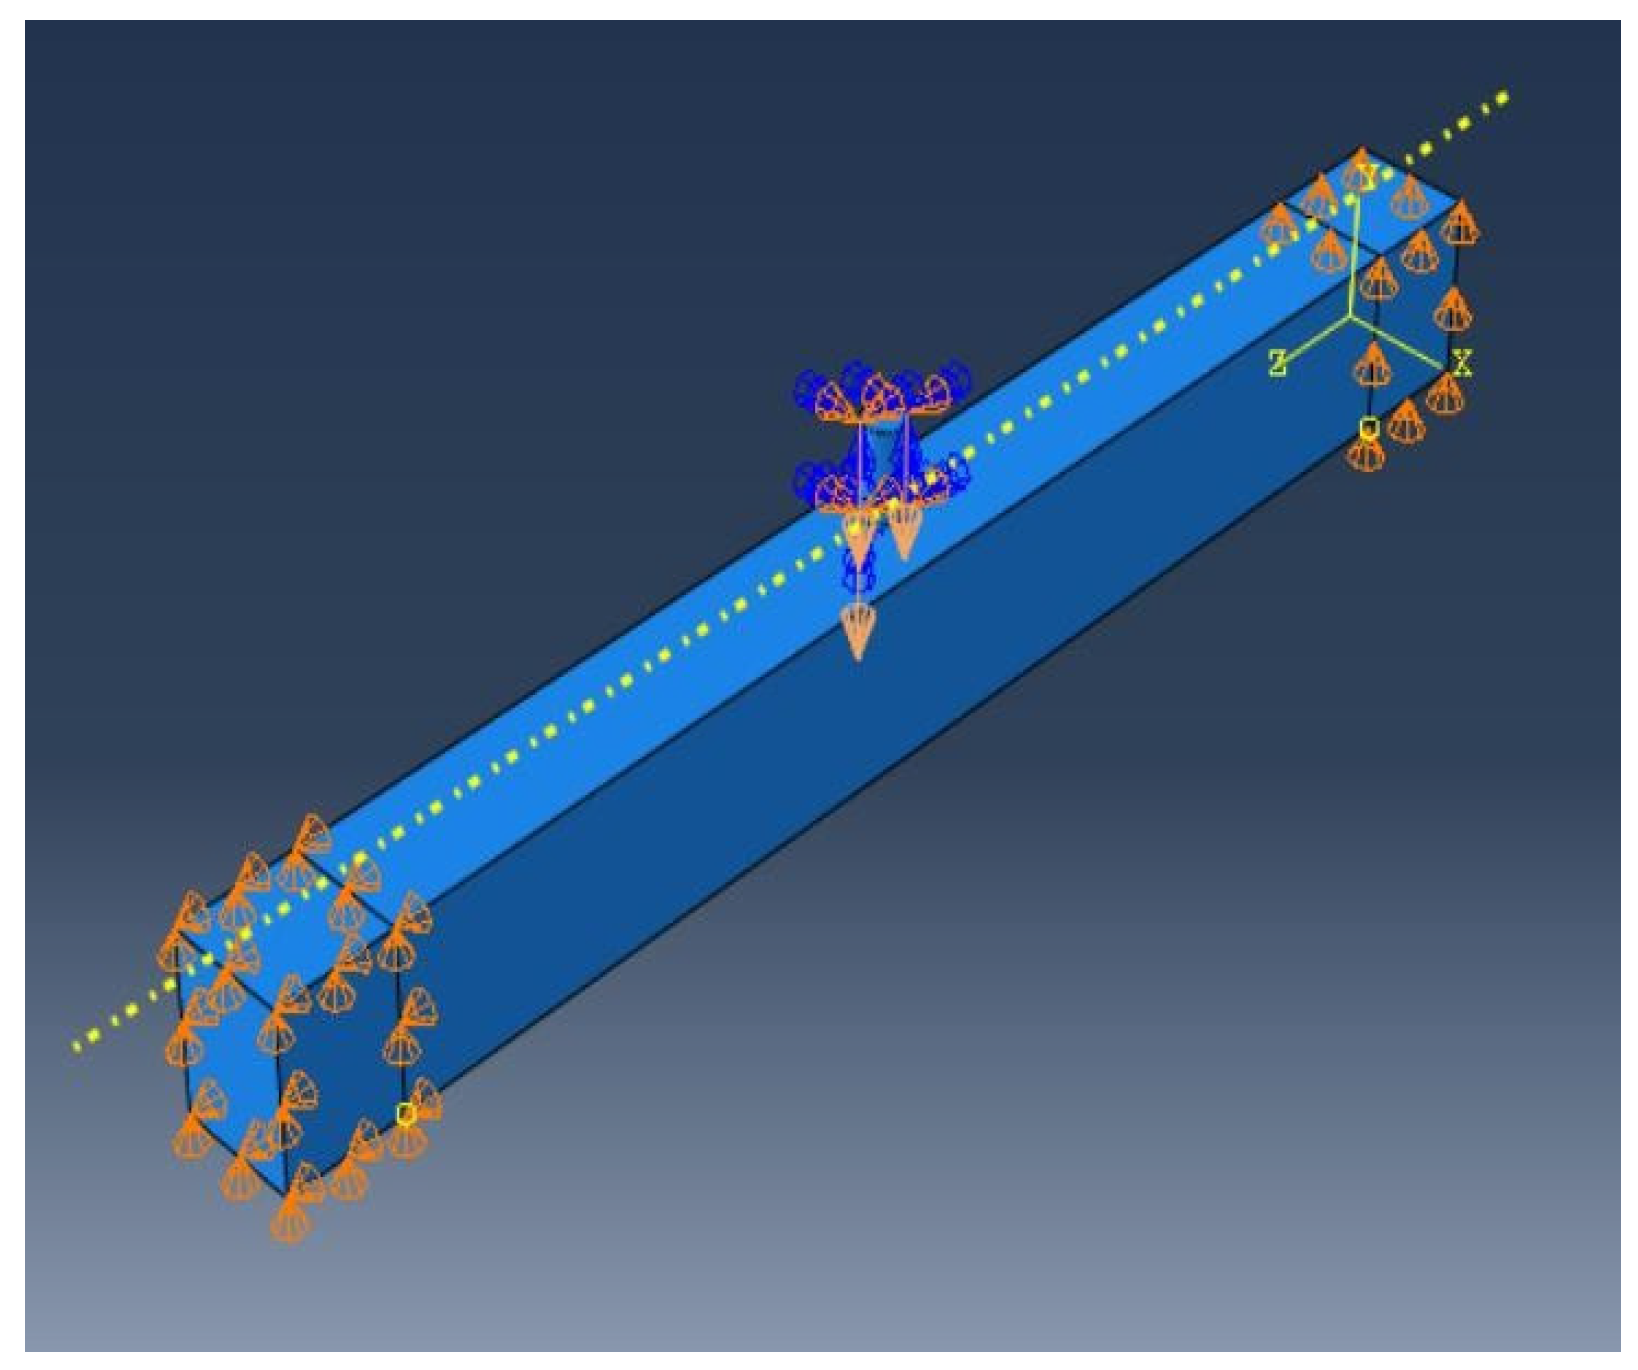
The hammer is assigned with initial impact velocity of 3.43 m/s, 4.43 m/s, 5.42 m/s and 6.11 m/s. for the drop heights of 0.5 m, 1 m, 1.5 m and 1.9 m respectively. The predefined impact velocities are used in the simulations which are obtained from equation V = √(2gh) where, g = 9.81 m/s² and h = height of fall. One end of the beam is restricted to move in y and x directions (hinged support), while other end is restricted to move in y direction (roller support), such that the beam acts as simply supported beam. The loading, boundary condition and mesh configuration are presented in
Figure 3 and
Figure 4.
3. RESULTS AND DISCUSSION
3.1. Deflection of Beam
Twenty-four beams were tested numerically to observe the mid span deflection of beams subjected to low velocity impact.
Table 2. shows the maximum mid span deflection of beams with variation of impact velocities.
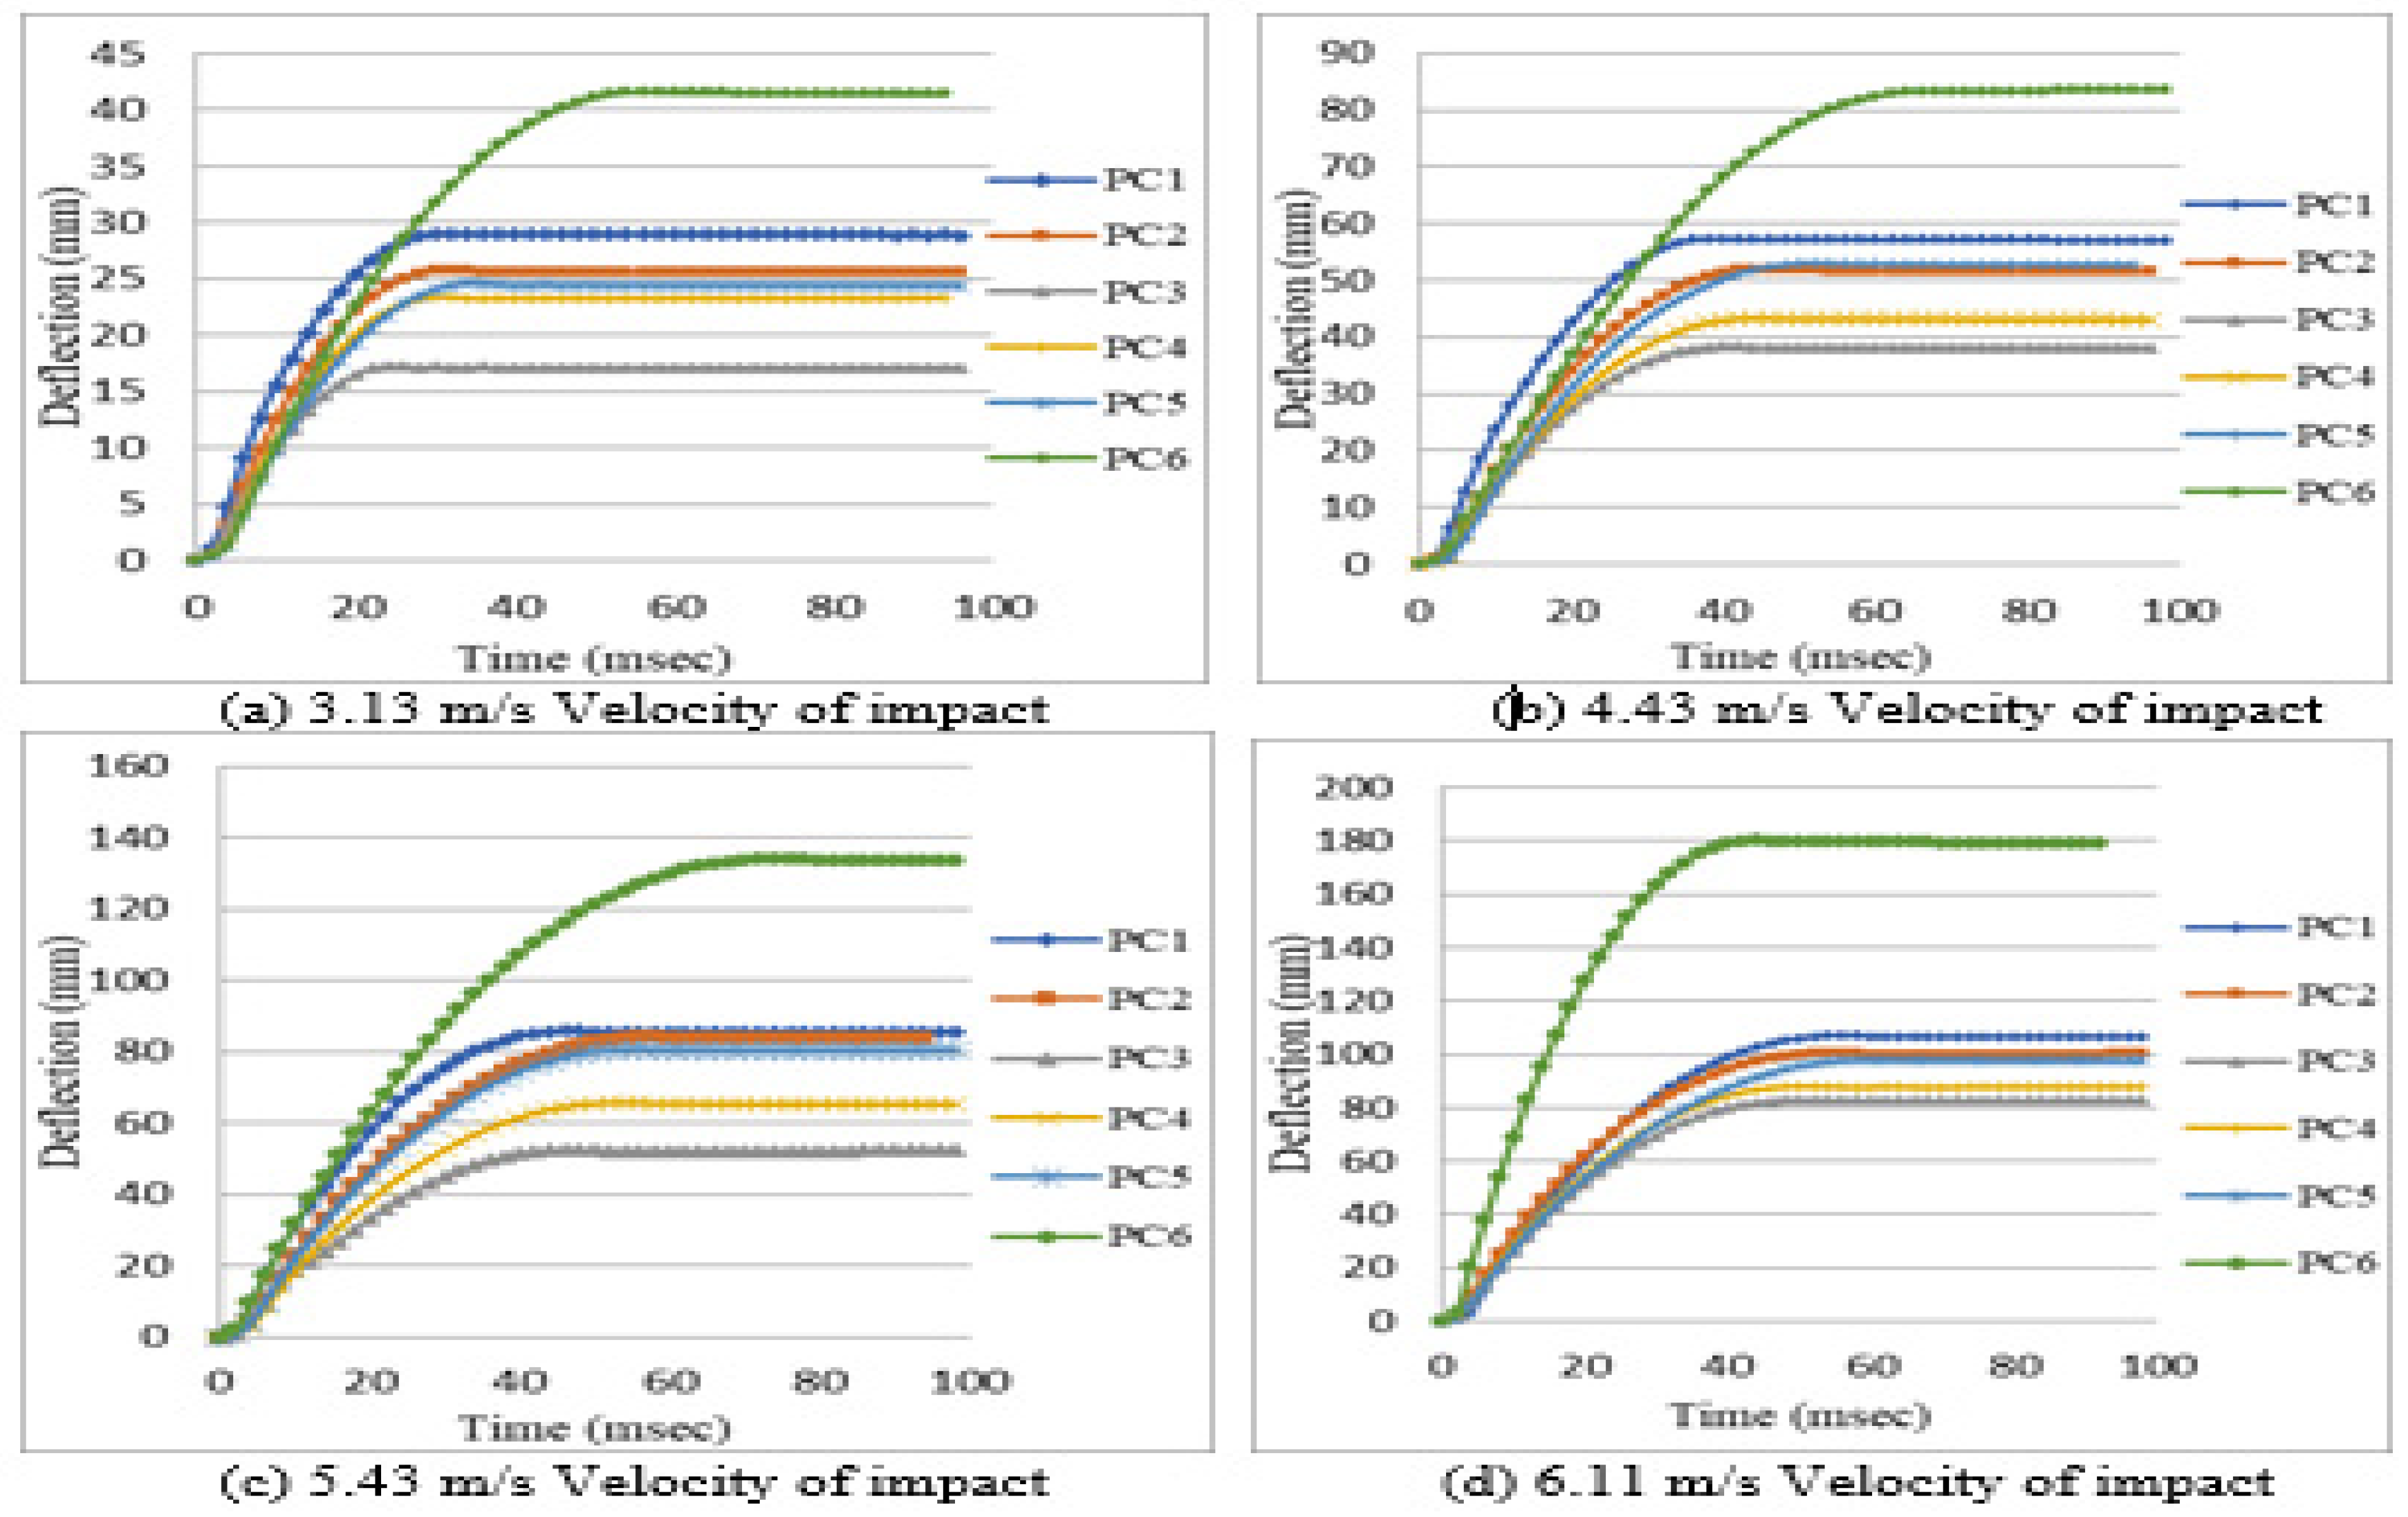
Figure 6. shows the mid span deflection – time histories of all HFRC beams by mid-span impact. All the specimens are exhibited a similar shape of the deflection – time histories. The response of beams subjected to 3.13 m/s velocity of impact shows the linear deflection upto 17 msec then it attains the plastic stage for 33 msec. After that it reaches to maximum deflection and remains constant.
Figure 5.
Displacement of simply supported PC1 beam subjected to mid span impact with velocity 5.43 m/s.
Figure 5.
Displacement of simply supported PC1 beam subjected to mid span impact with velocity 5.43 m/s.
The addition of fibres to concrete, the mid-span deflection in beams is reduced. The maximum mid-span deflection of beam PC2, PC3, PC4 and PC5 is considerably less compared to PC1, whereas the beam PC6 is showing more mid span deflection. The beam PC3 shows less mid span deflection because it is having more tensile strength.
3.2. Impact load
Table 3. shows the maximum load values of all beams subjected to mid span impact with different velocities.
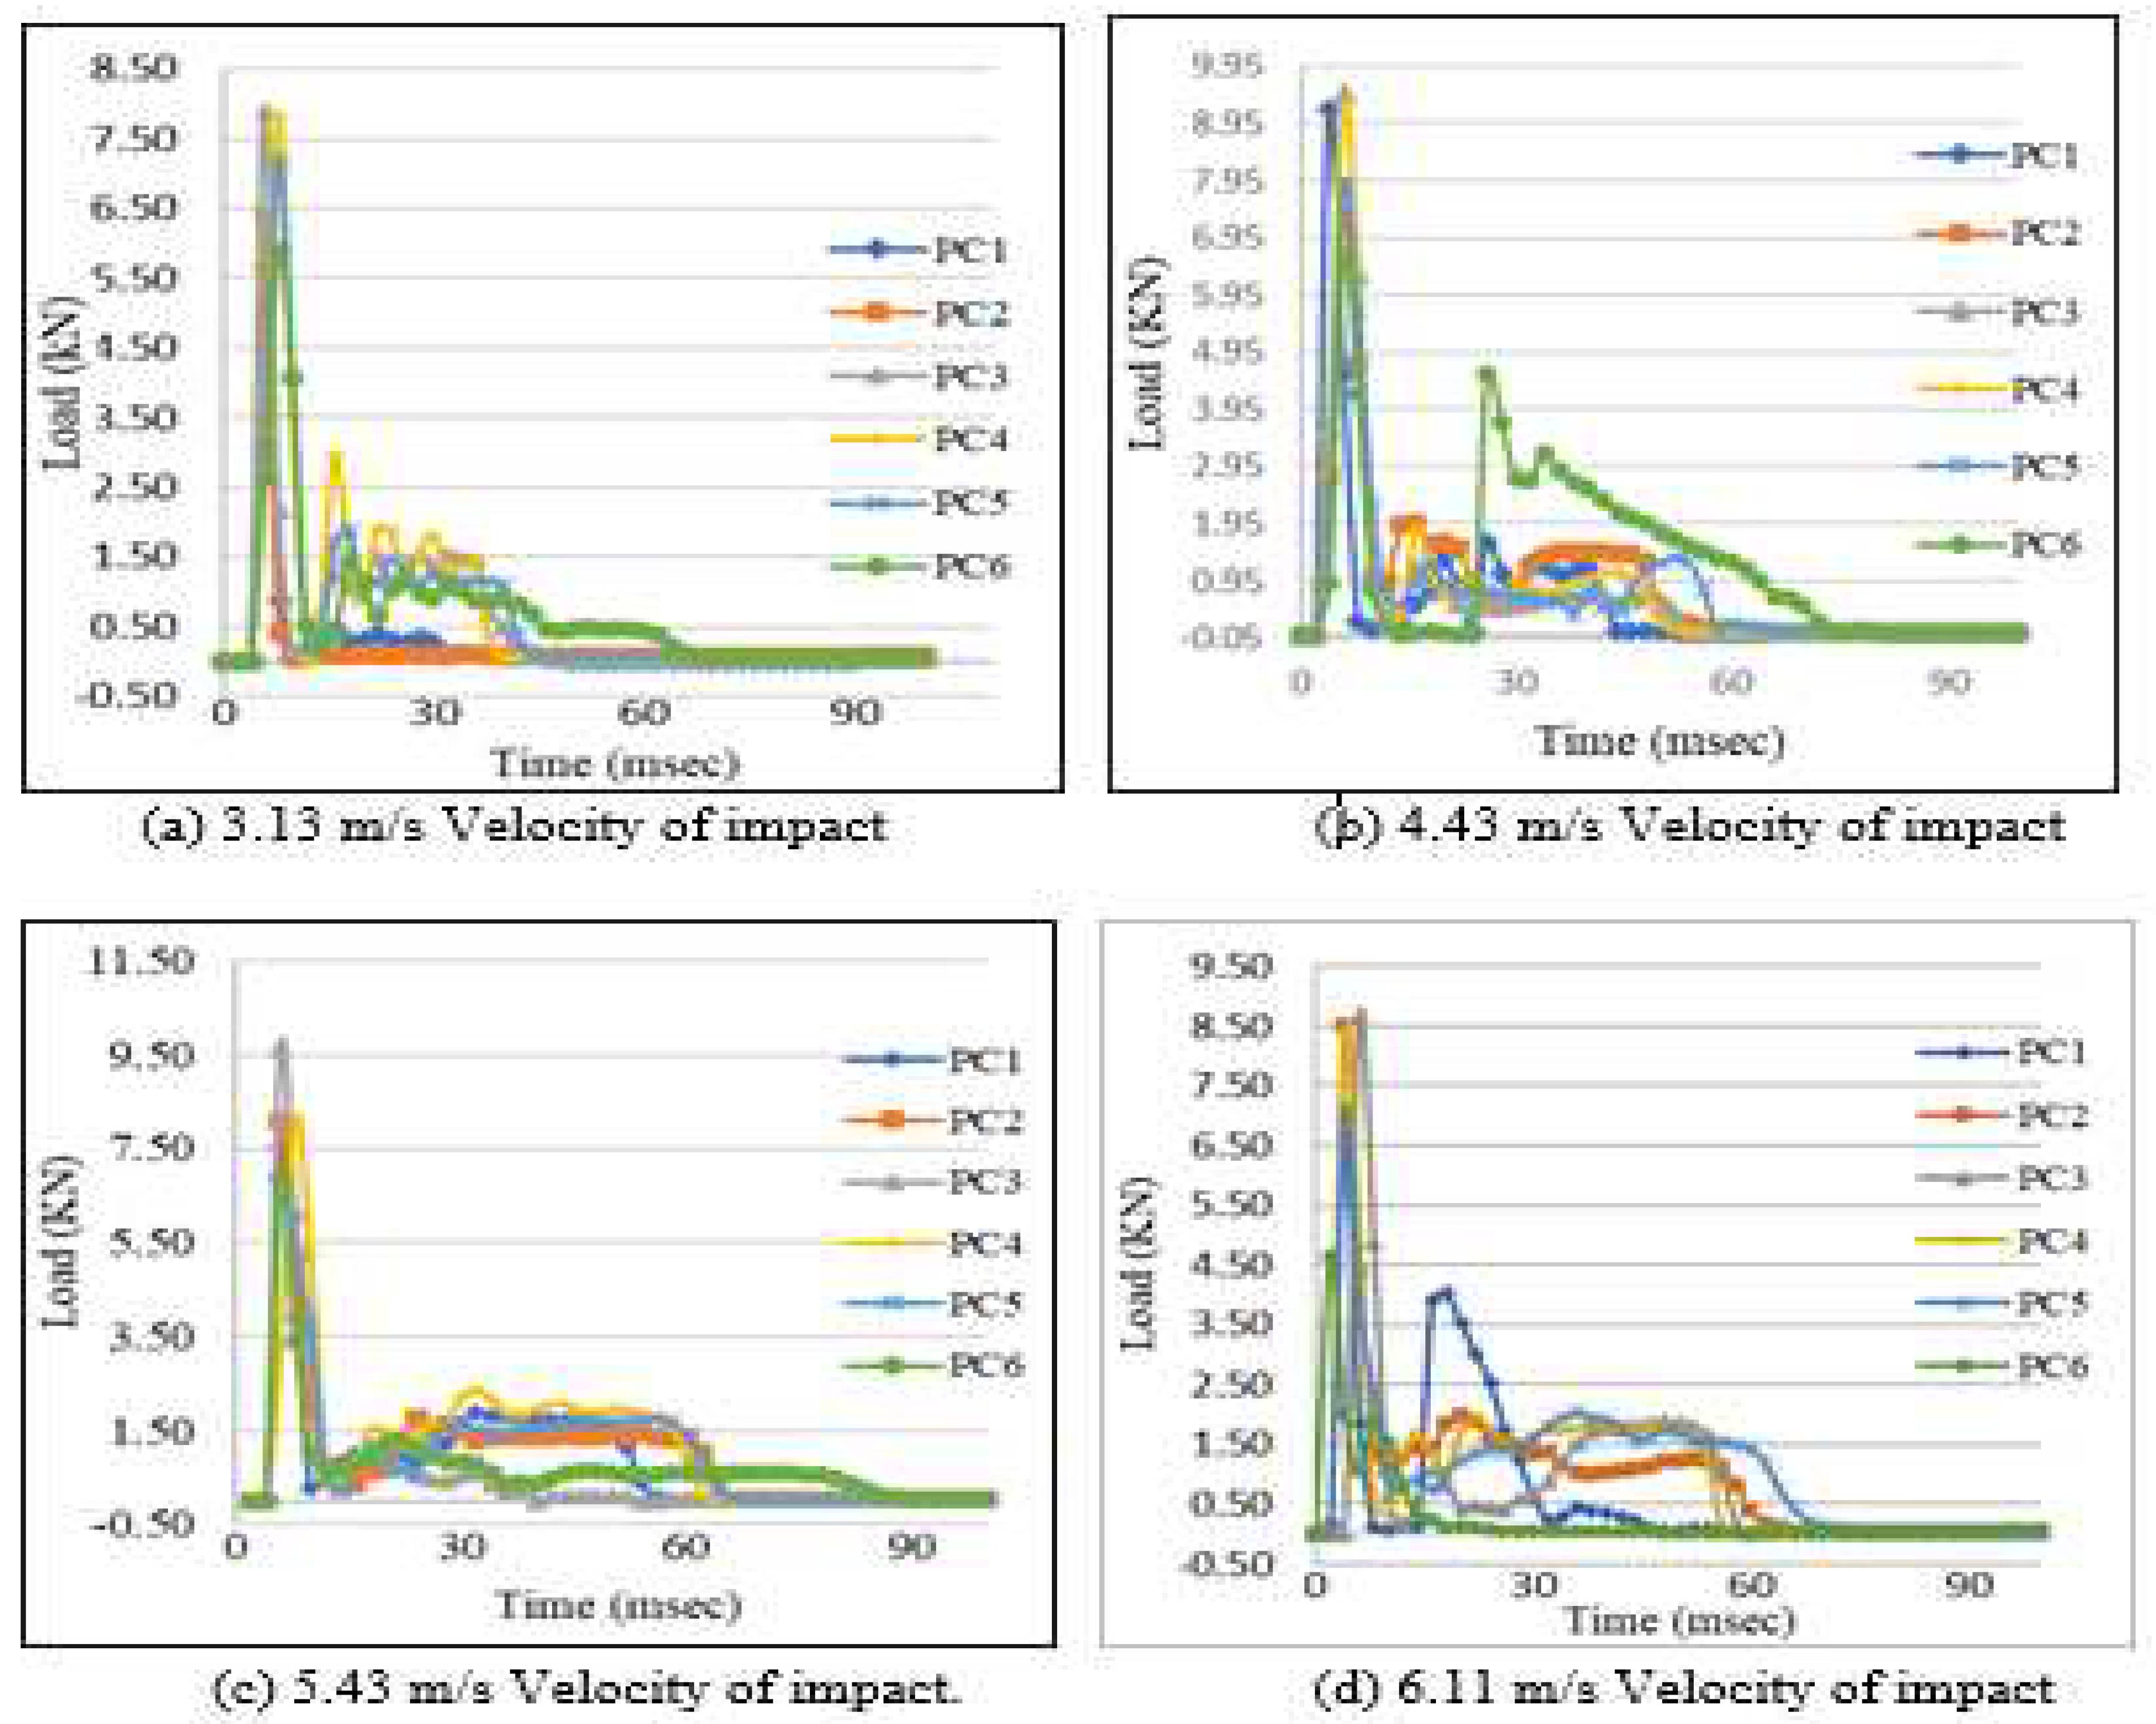
Figure 7. shows the impact load with time relationships of all beams are plotted and it is observed that the applied impact loads affect the specimens in a very small-time interval. The load – time curve is increased rapidly initially due to the hammer hitting on the beam surface then due to the residual energy in the hammer which makes it move further in the direction of fall. After that when hammer starts to move away from the beam, the load is reducing and reaches to zero. The maximum load value of beam PC1, PC2, PC4, PC5 and PC6 is less compared to PC3. The beam PC3 is sustaining high loads, due to its high stiffness.
3.3. Impact Energy
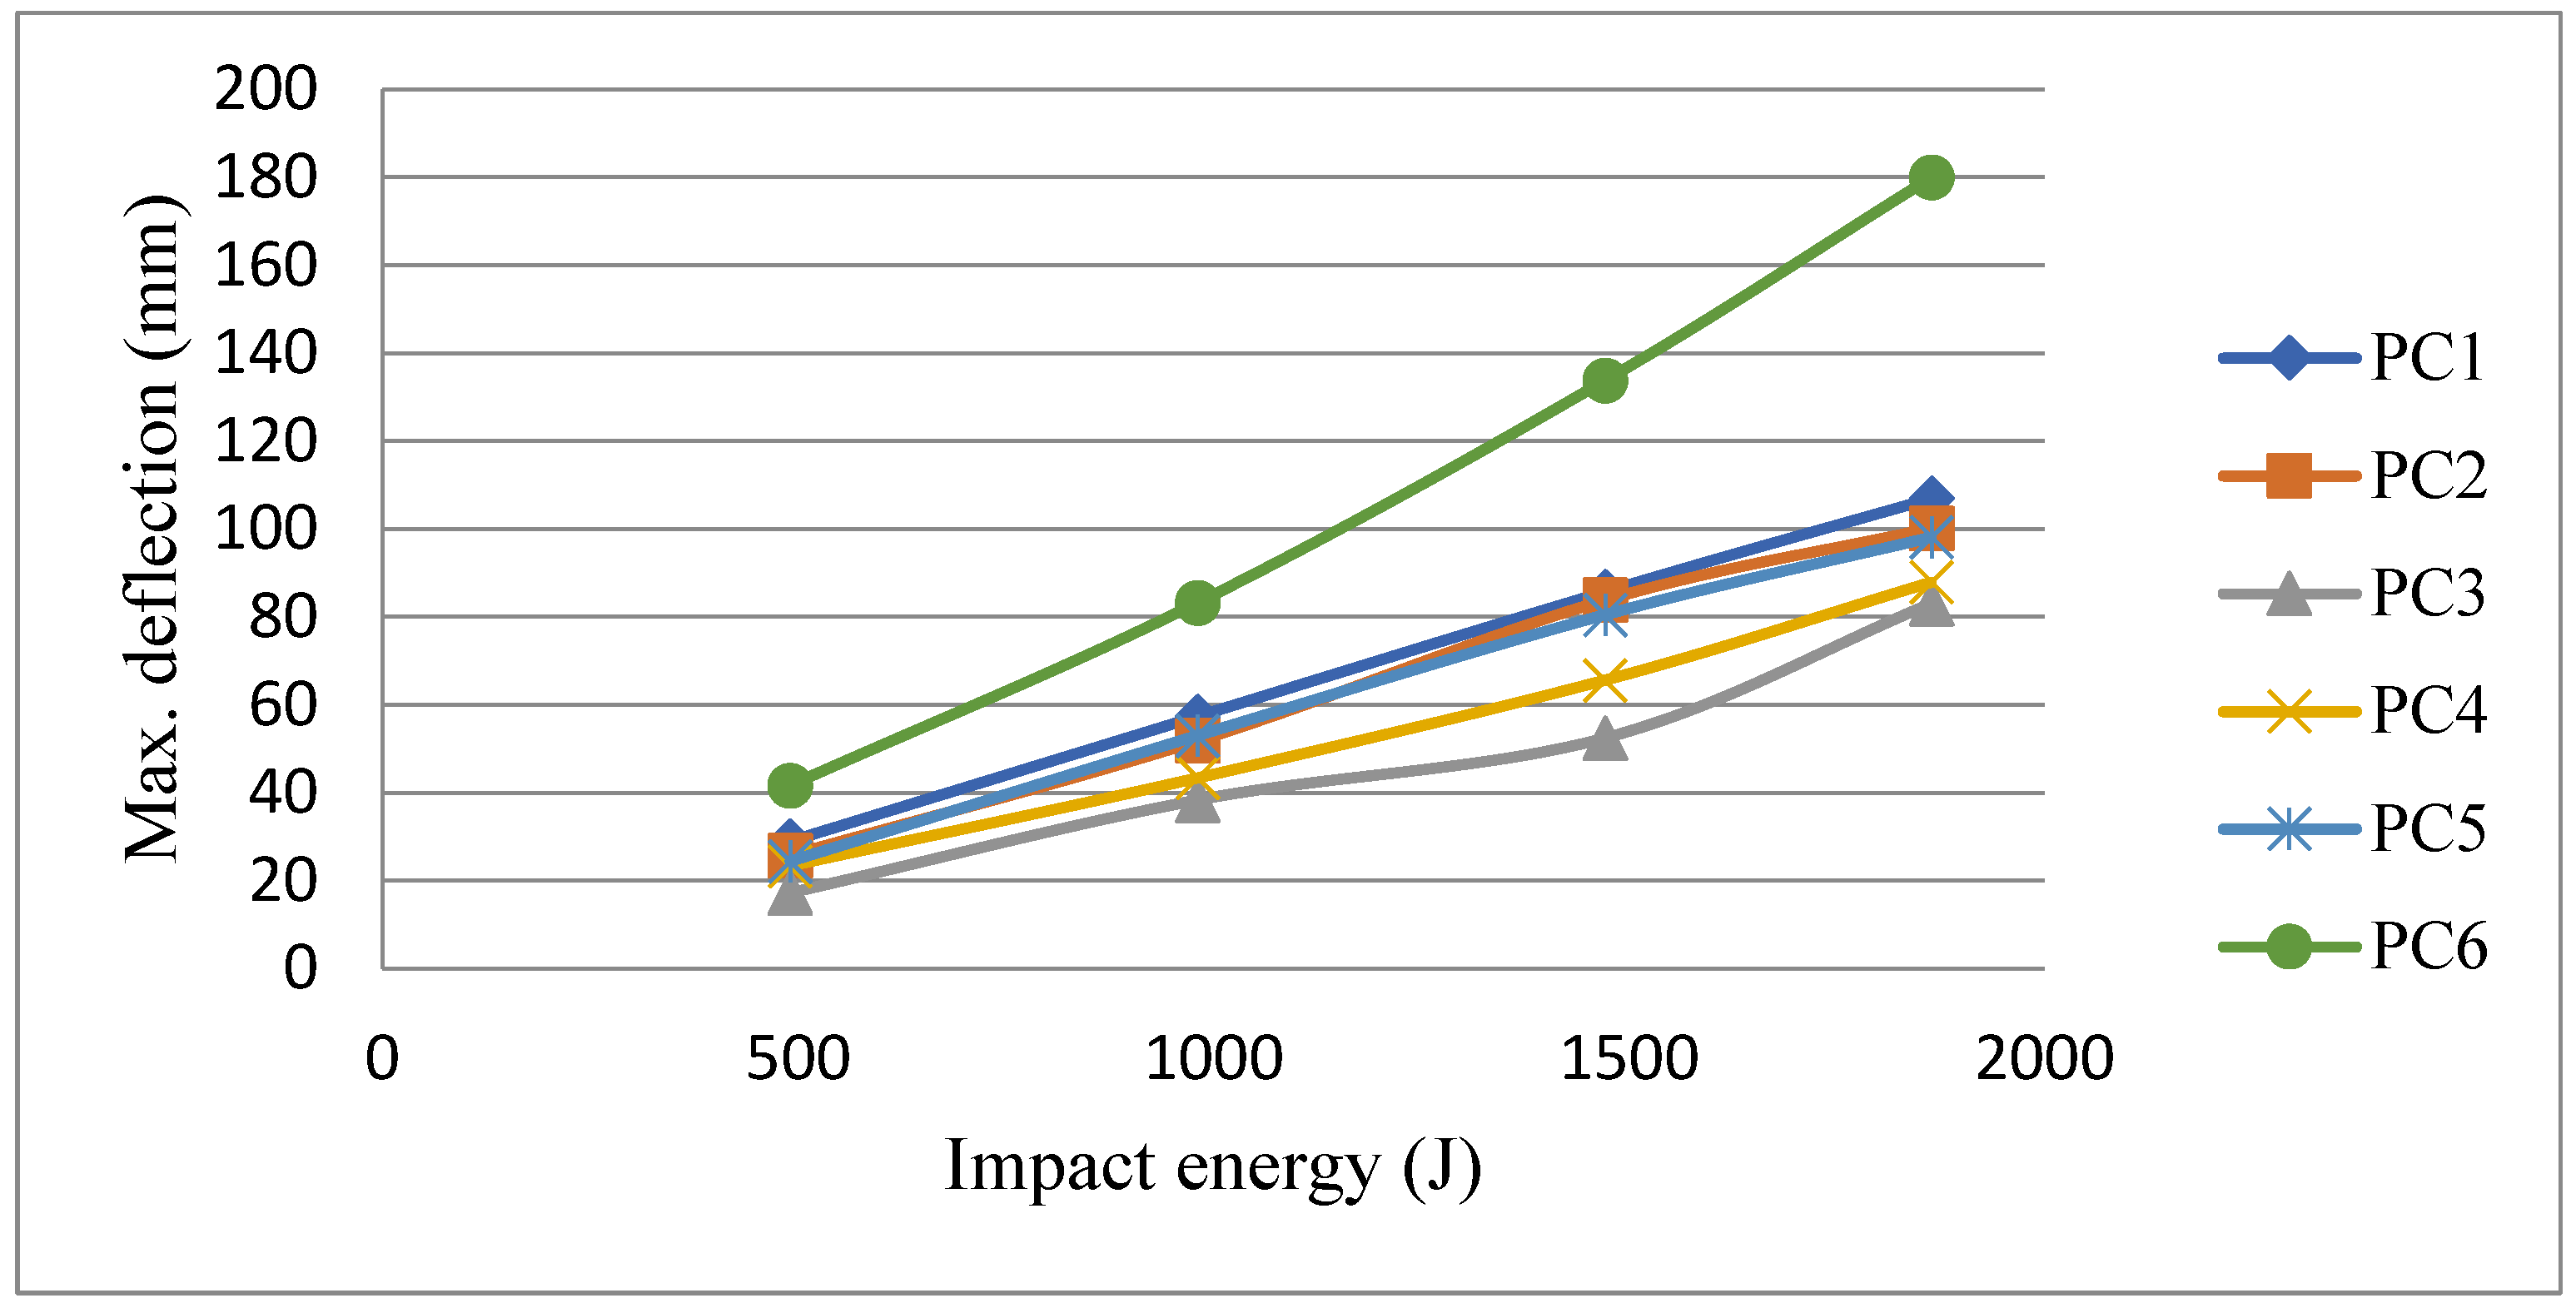
Table 4. shows the values of maximum mid span deflections of all beams subjected to four different impact energies. It was observed that all the beams had a similar response. The
Figure 8. shows the variation of impact energy with deflection. The beam PC3 has the lowest maximum deflection values for all four impact energies.
3.4. Damage
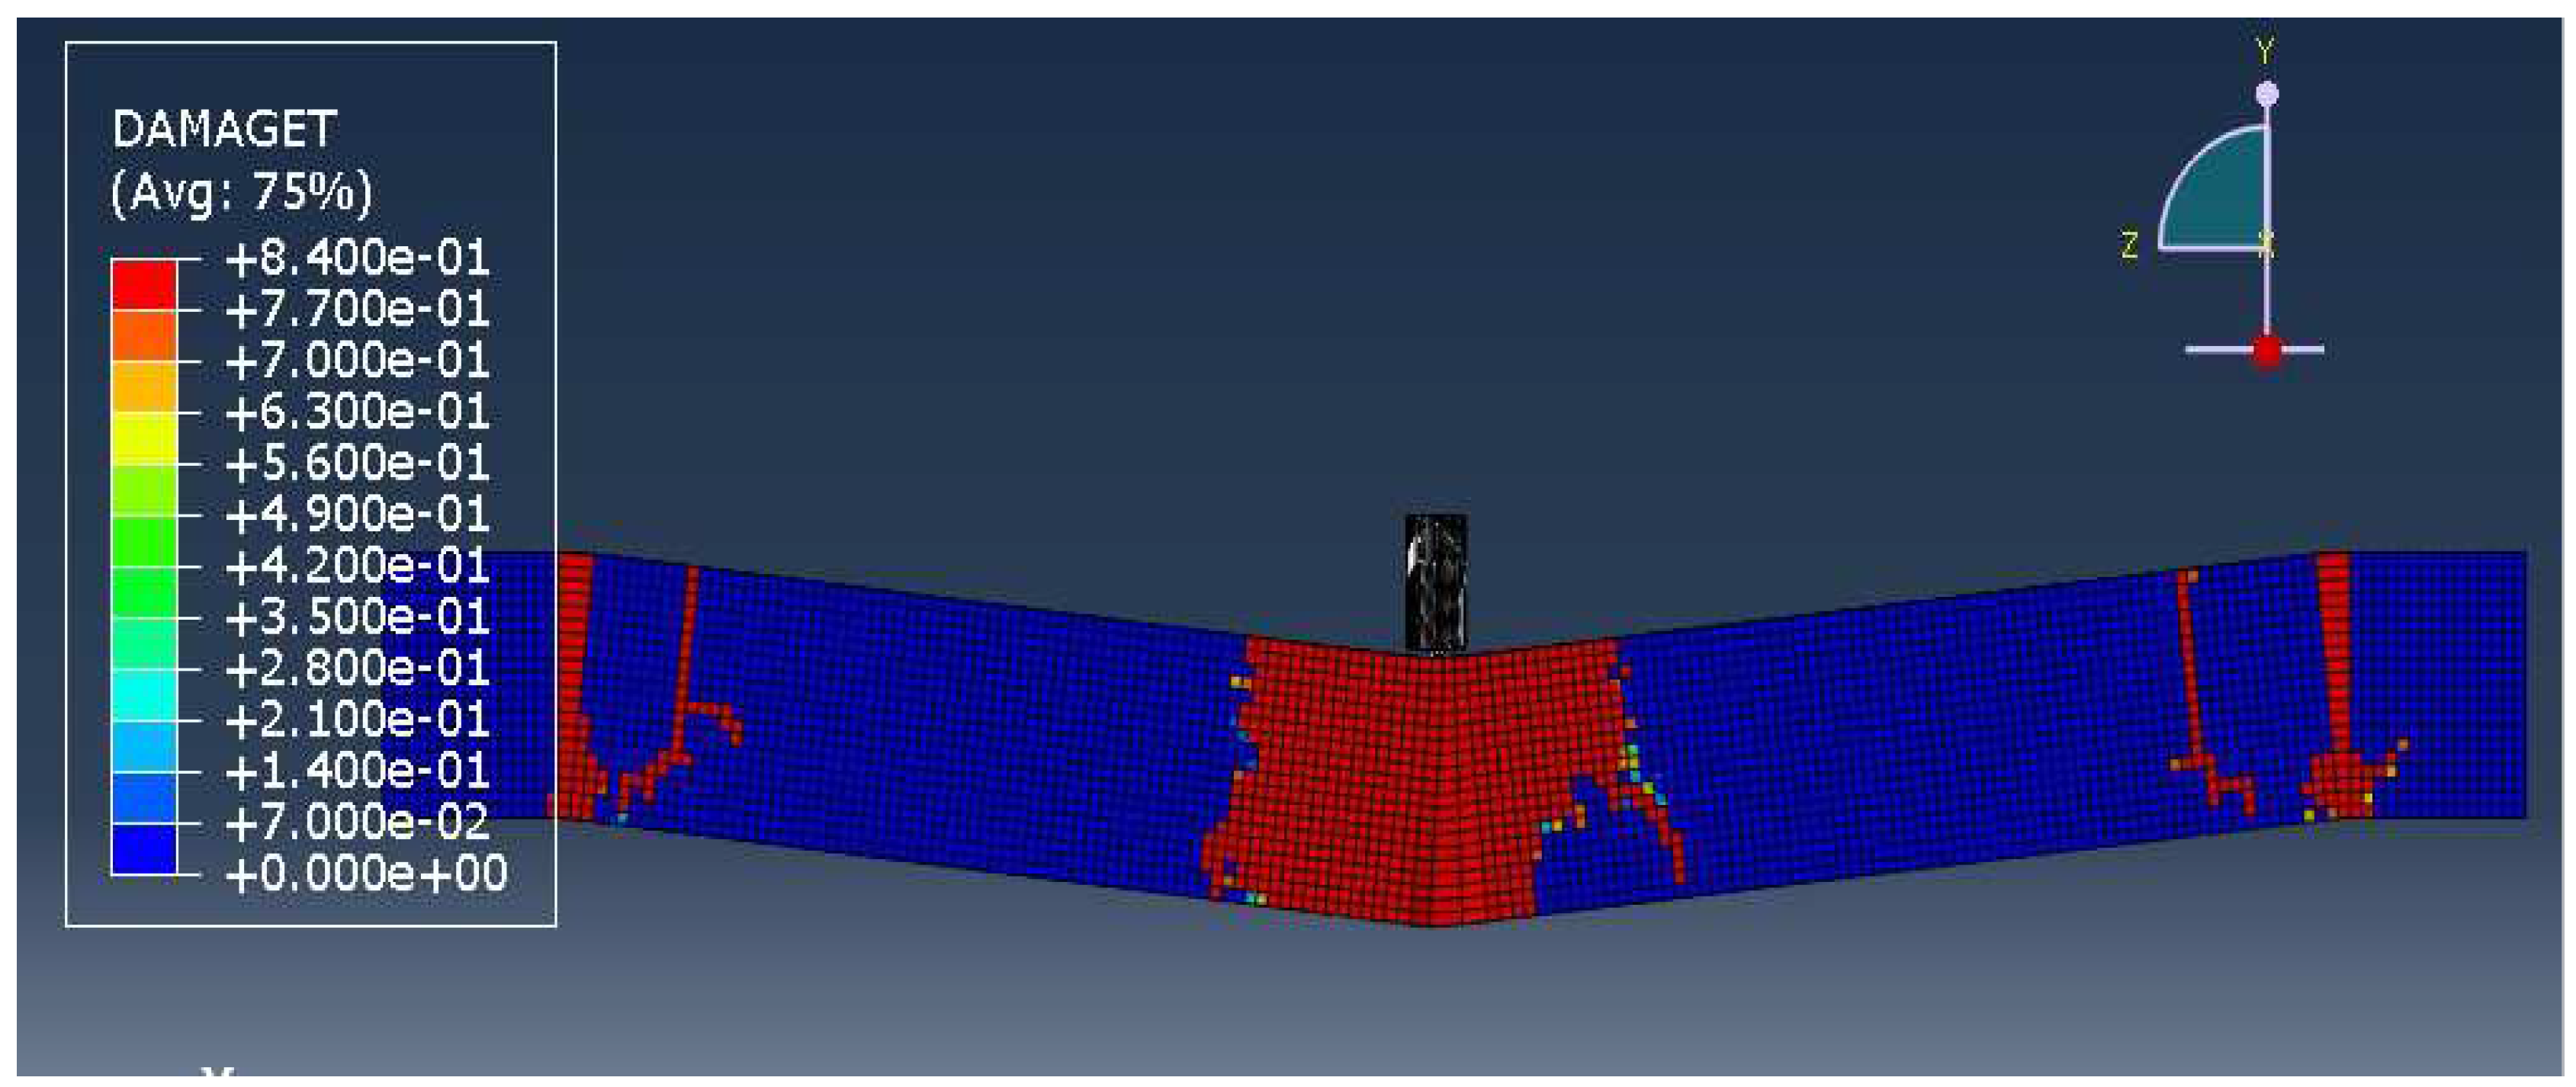
Figure 9 shows the damage of simply supported PC1 beam subjected to mid span impact with velocity 6.11 m/s, elements at the mid span section have suffered maximum distortion. In the figure the failure of beam has occurred at the centre of the beam. Further the neighbouring elements on all sides are less distorted.
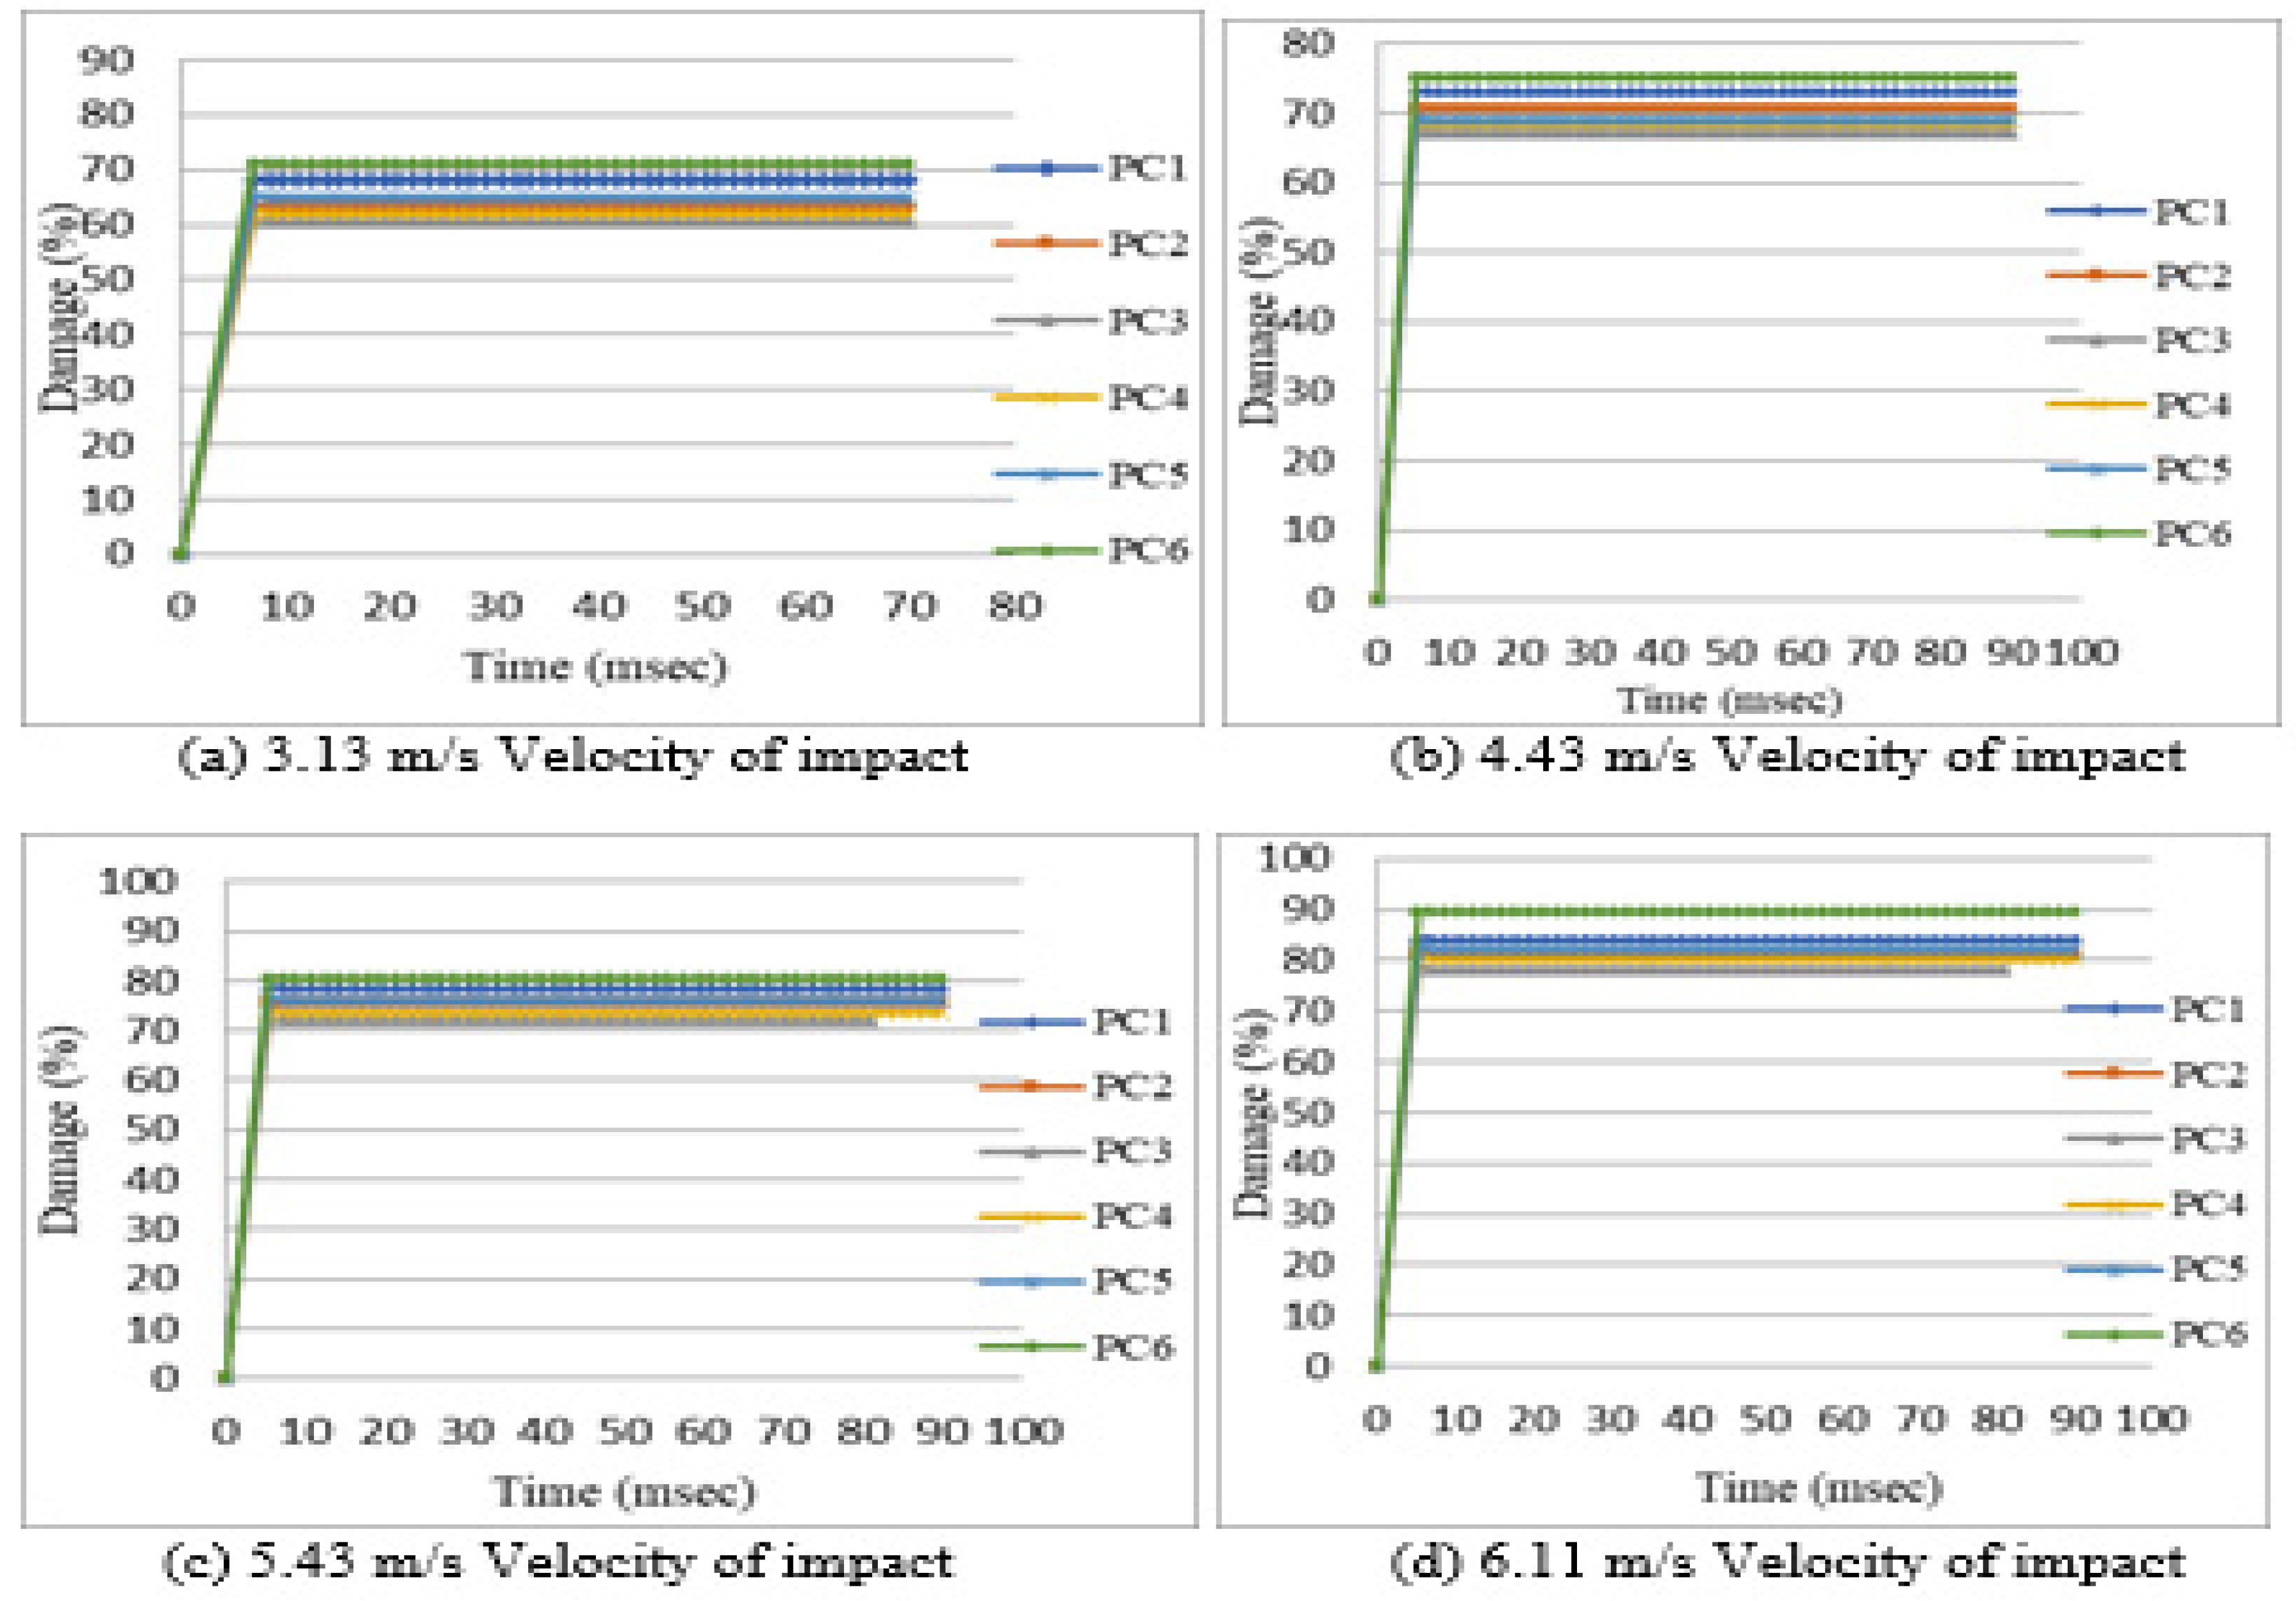
Table 5. shows the damage - time values of beams subjected to mid span impact with different velocities. The damage was zero initially, then increased within small time interval and then reaches to maximum damage.
Figure 10. shows the damage values of beam PC2, PC3, PC4 and PC5 is less compared to PC1 whereas PC6 is more. The beam PC3 shows less damage value when compared to all other beams, due to its high tensile strength.
3.5. Stress
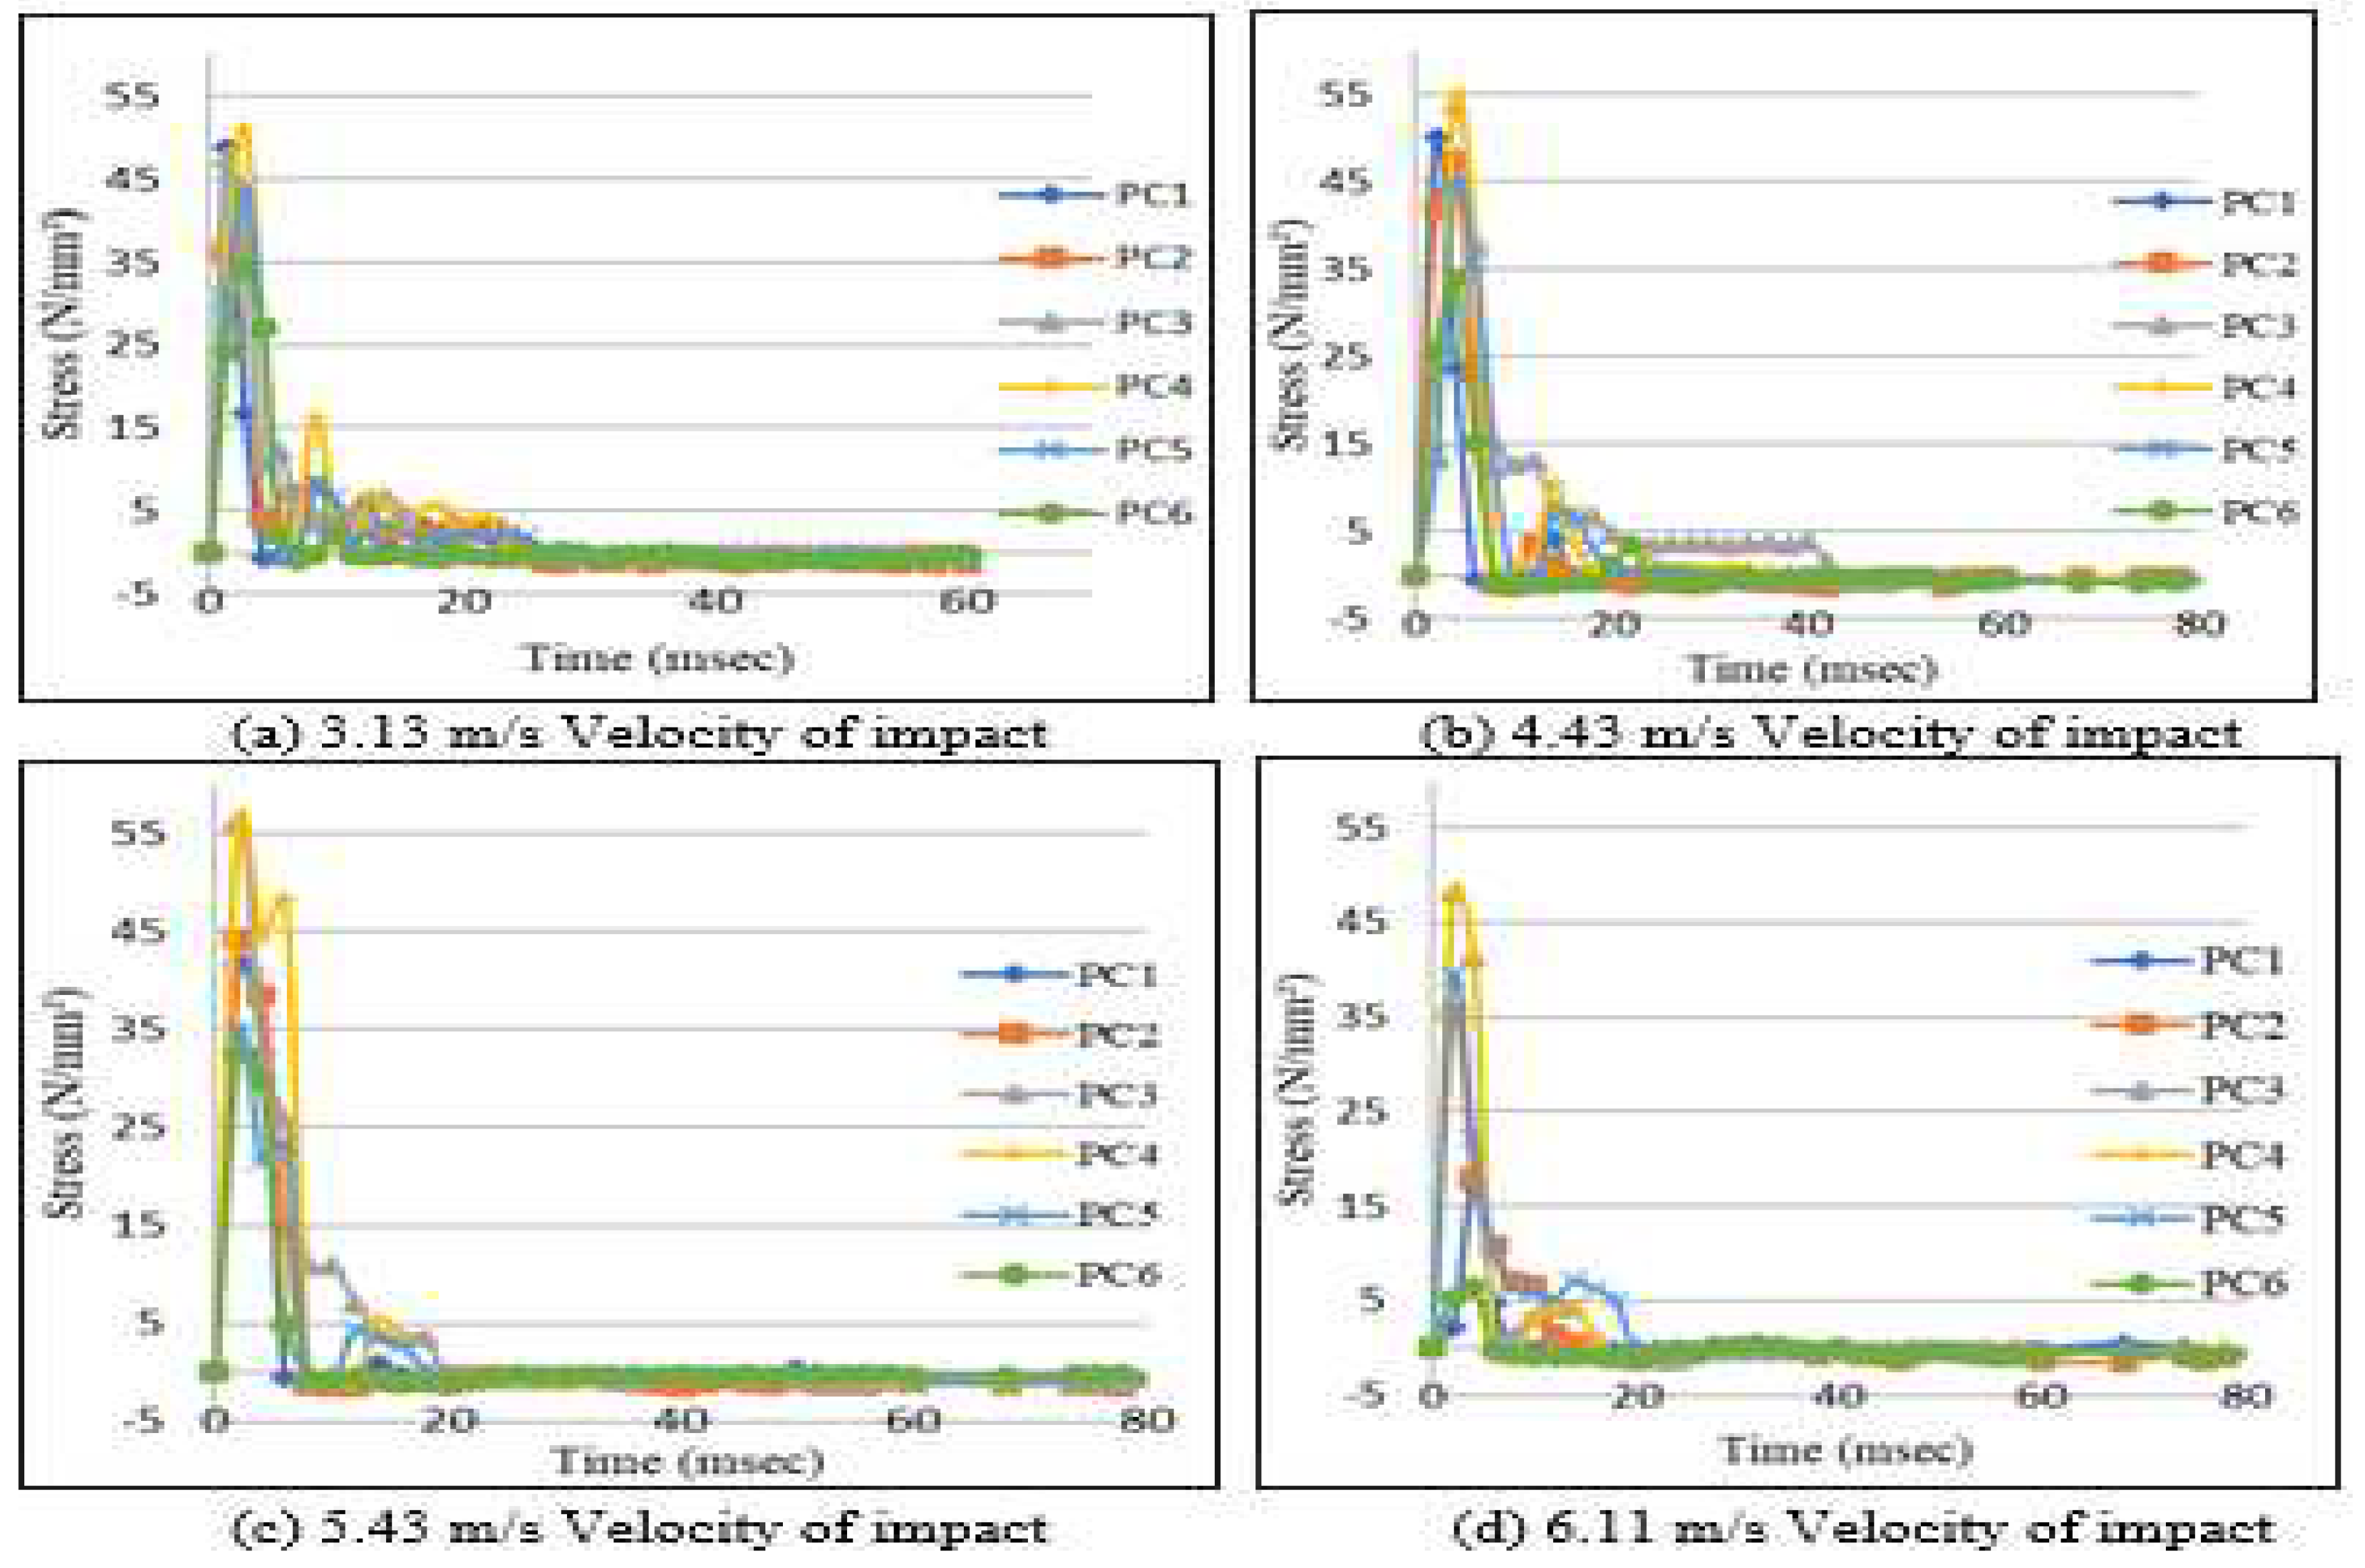
Table 6. shows the maximum stress values of all beams subjected to mid span impact with different velocities. All the specimens are exhibited a similar type of the stresses.
Figure 11.it is observed that the stress is increased rapidly initially due to the hammer strikes the beam surface and within a short time stress is reached maximum level. When hammer starts to move away from the beam, the stresses are reducing and reaches to zero which means the specimens behaves as nonlinear.
3.6. Strain
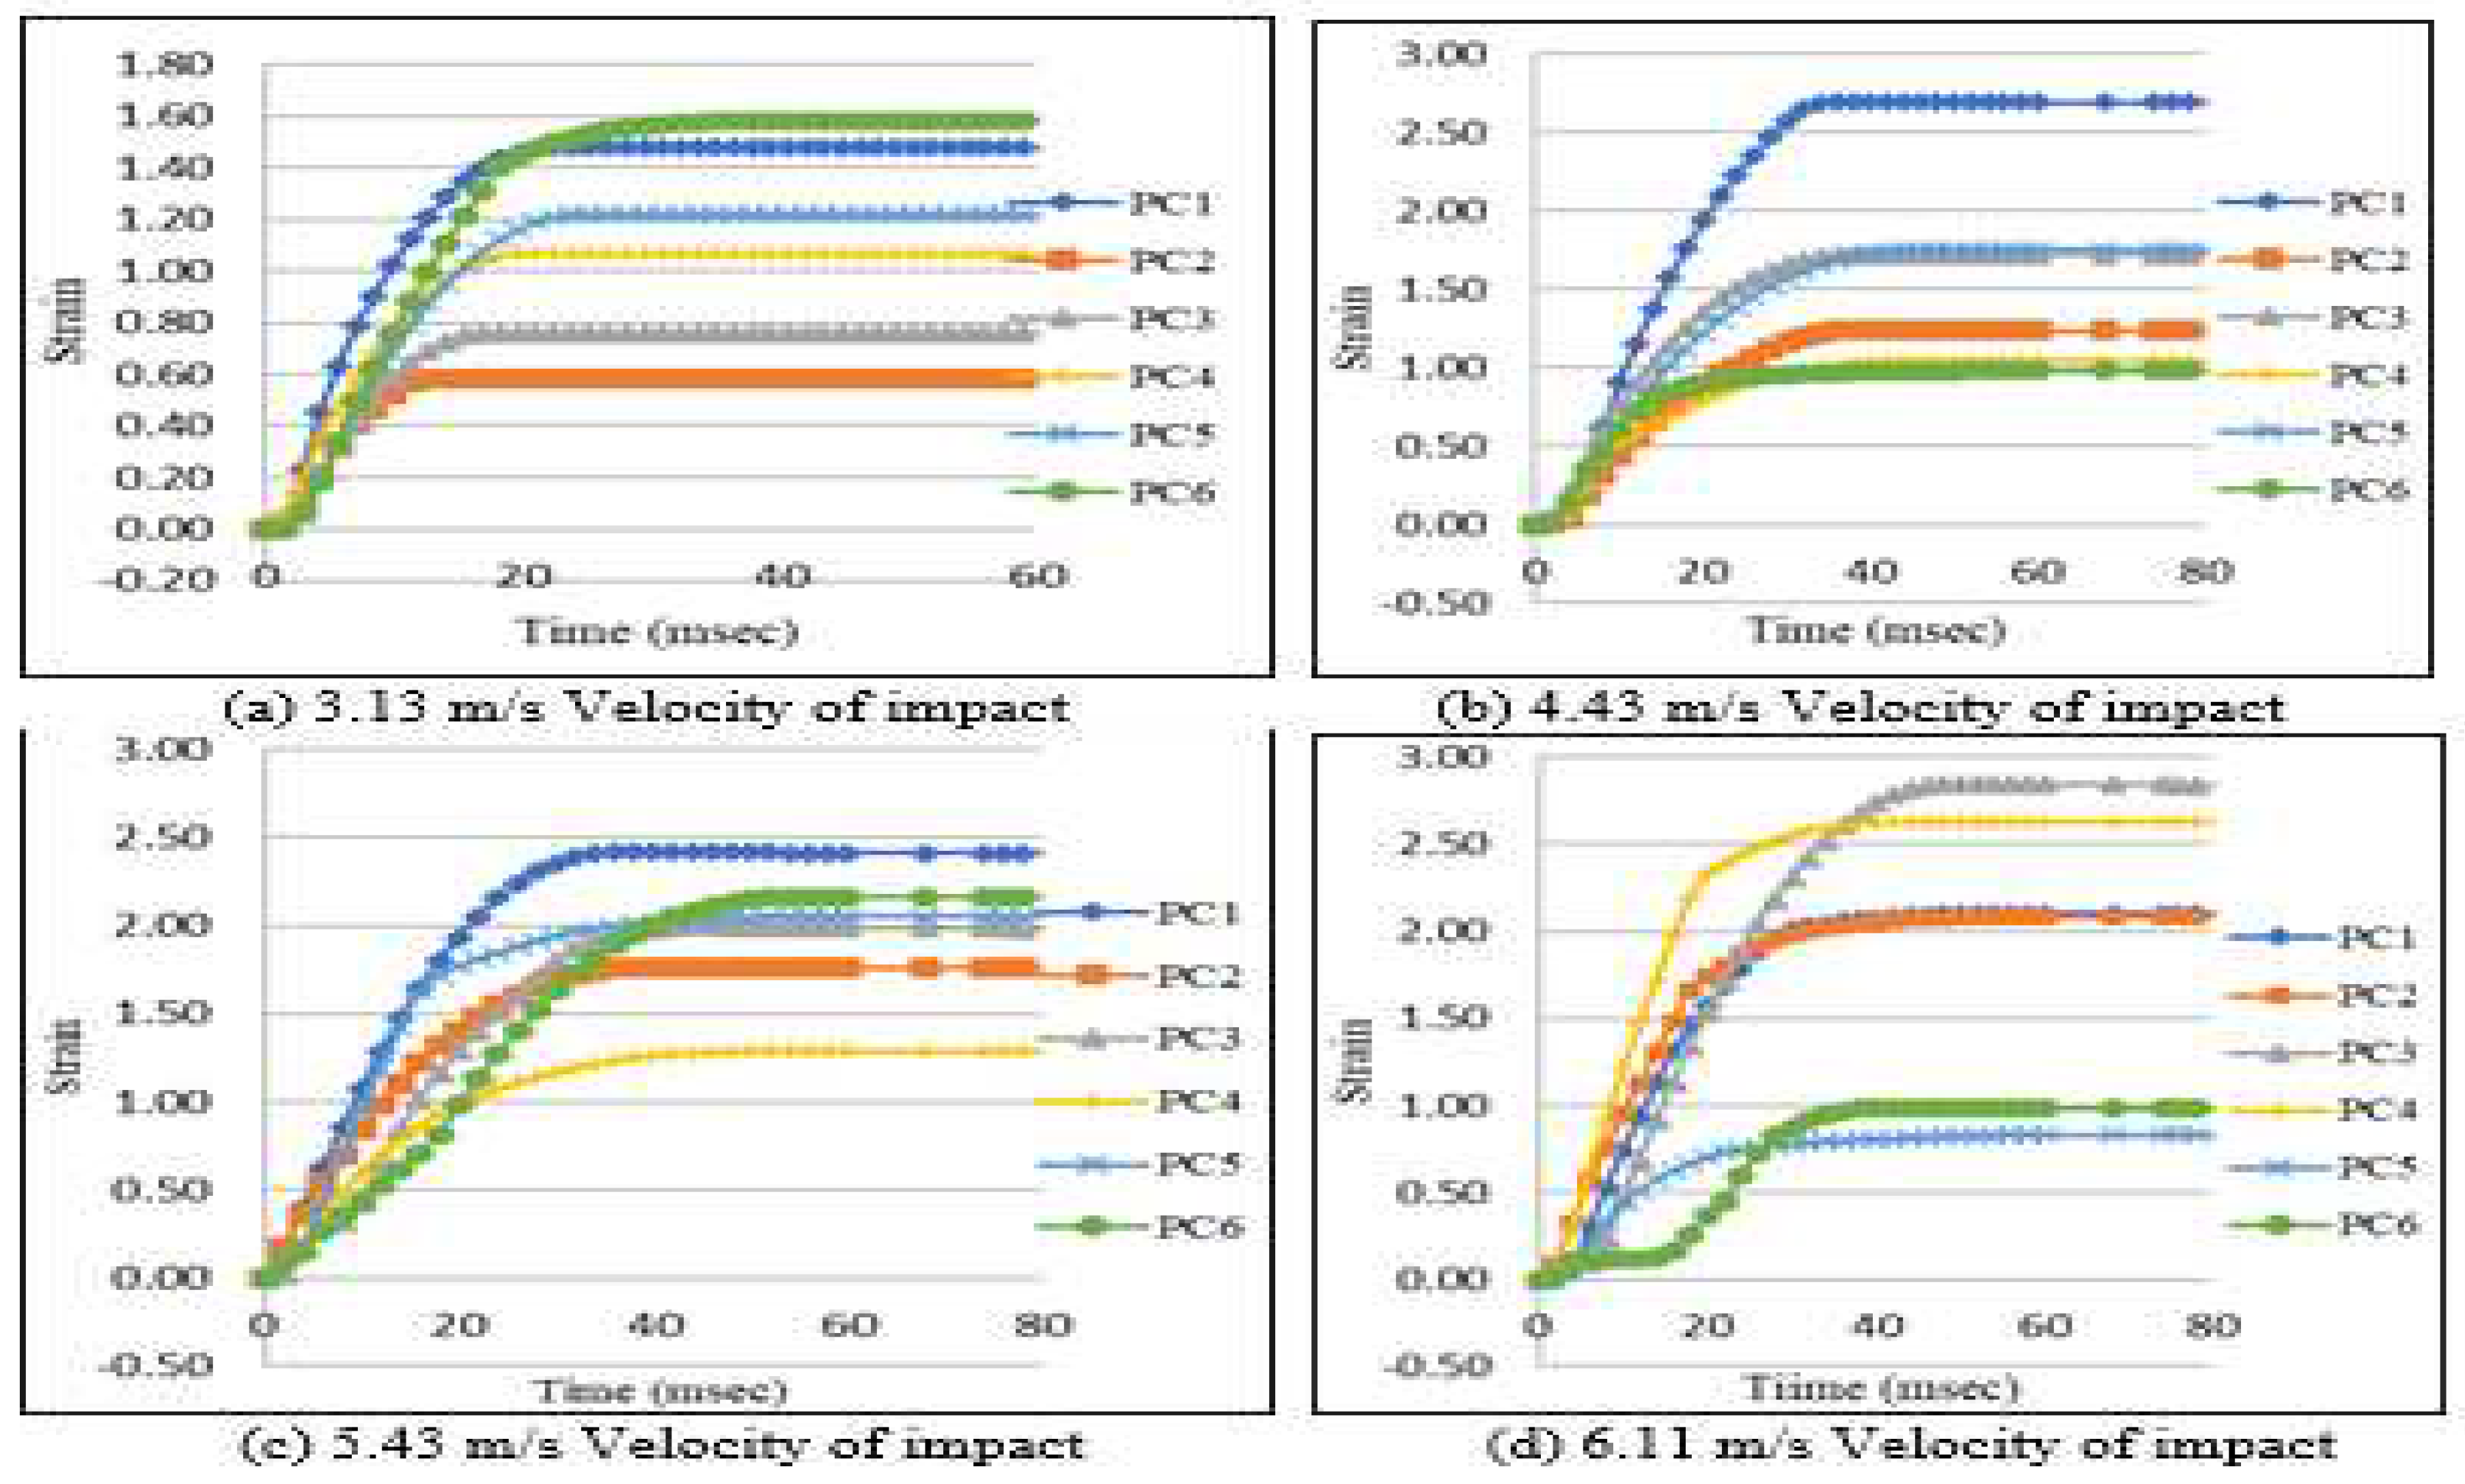
All the test specimens exhibited a similar response in terms of strain–time relation. During impact, the strains show the linear variation in all specimens’ upto failure.
Table 7. shows the maximum strain of beams with variation of impact velocities. The elements which are present in lower portion of the beams (mid span) undergo higher strain.
Figure 12. shows the strain v/s time curve are same as that of deflection v/s time curves i.e. the strain in element node gradually increases till certain time and then remains constant thereafter. The gradual increase in strain was seen until the hammer was in contact with beam.
4. CONCLUSIONS
The numerical results are presented for 24 HFRC beams subjected to low-velocity impact at mid span for simply supported boundary conditions.
- ❖
The variation of deflection during contact period is initially linear as expected subsequently it attains maximum deflection and thereafter it remains constant, indicating that the beam has undergone plastic deformation.
- ❖
The maximum mid span deflection value of beam containing 0.9% steel and 0.1% polypropylene fibers is decreased by 40% compared to plain concrete beam.
- ❖
Amongst all the beams tested, the beams reinforced with 0.9% steel and 0.1 % polypropylene fibers shows the lowest deflection and for 1% PP fiber shows the higher deflection.
- ❖
The maximum Impact loads absorbed were observed in beams containing 0.9% steel and 0.1% polypropylene fibers, indicating that the beam becoming more stiffer with this percentage.
- ❖
With the increase in impact energies the deflection values were seen to be increased. However, the beam containing 0.9% steel and 0.1% polypropylene fibers shows lower deflection values.
- ❖
Damage in beams reinforced with 0.9% steel and 0.1% polypropylene fibers was found to be less compared to all other beams, due to its high tensile strength.
References
- Sidney Mindess and Cheng Yan, “Perforation of plain and fibre reinforced concretes subjected to low-velocity impact loading” Cement and concrete research. Vol. 23, (1993), pp. 83-92. [CrossRef]
- Vahid Afroughsabet and Togay Ozbakkaloglu, “Mechanical and durability properties of high-strength concrete containing steel and polypropylene fibers” Construction and Building Materials 94, (2015), pp. 73–82. [CrossRef]
- Ramesh Kanagavel, Dr. K. Arunachalam “Experimental Investigation on Mechanical Properties of Hybrid Fiber Reinforced Quaternary Cement Concrete” Journal of Engineered Fibers and Fabrics Volume 10, Issue 4, (2015), pp 139-147. [CrossRef]
- Satadru Das Adhikary, Bing Li, Kazunori Fujikake, “Low Velocity Impact Response of Reinforced Concrete Beams: Experimental and Numerical Investigation” International Journal of Protective Structures -Volume 6, Number 1, (2015), pp. 81-111. [CrossRef]
- Milad Hafezolghorani, Farzad Hejazi, Ramin Vaghei, Mohd Saleh Bin Jaafar and Keyhan Karimzade “Simplified Damage Plasticity Model for Concrete” Structural Engineering International Nr. 1/2017, December 17, (2015), pp. 68-78. [CrossRef]
- Özgür Anil, Cengizhan Durucan, R. Tugrul Erdem and M. Arif Yorgancilar, “Experimental and numerical investigation of reinforced concrete beams with variable material properties under impact loading” Construction and Building Materials 125, (2016), pp. 94–104. [CrossRef]
- Gonzalo S.D.U. and Carlos Zanuy “Enhancement of impact performance of reinforced concrete beams without stirrups by adding steel fibers” Construction and Building Materials 145, (2017), pp. 166–182. [CrossRef]
- H. Othman and H. Marzouk “Performance of Ultra-High Performance Fiber Reinforced Concrete Plates under Impact Loads” International Journal of Impact Engineering, 114, (2018), pp. 20–31.
- Srinivasa Rao Naraganti, Rama Mohan Rao Pannem and JagadeeshPutta, “Impact resistance of hybrid fibre reinforced concrete containing sisal fibres” Ain Shams Engineering Journal 10, (2019), pp. 297–305. [CrossRef]
- Sabreena Nasrin and Ahmed Ibrahim “Numerical study on the low-velocity impact response of ultra- highperformance fiber reinforced concrete beams” Structures 20, (2019), pp. 570–580. [CrossRef]
- Emad A. Alwesabi, B.H. Abu Bakar, Ibrahim M.H. Alshaikh and Hazizan Md Akil, “Impact resistance of plain and rubberized concrete containing steel and polypropylene hybrid fiber” Materials Today Communications 25, 8 sep. (2020), 101640, pp. 1-11. [CrossRef]
Figure 1.
Assembled model.
Figure 1.
Assembled model.
Figure 2.
Response of concrete to a uniaxial loading condition: (a) Compression (b) Tension.
Figure 2.
Response of concrete to a uniaxial loading condition: (a) Compression (b) Tension.
Figure 3.
Load & Boundary condition.
Figure 3.
Load & Boundary condition.
Figure 4.
Mesh Configuration.
Figure 4.
Mesh Configuration.
Figure 6.
Variation of mid span deflection with time for simply supported beams subjected to different velocities.
Figure 6.
Variation of mid span deflection with time for simply supported beams subjected to different velocities.
Figure 7.
Variation of mid span load with time for simply supported beams subjected to different velocities.
Figure 7.
Variation of mid span load with time for simply supported beams subjected to different velocities.
Figure 8.
Variation of maximum deflection with impact energy for beams.
Figure 8.
Variation of maximum deflection with impact energy for beams.
Figure 9.
Damage of simply supported PC1 beam subjected to mid span impact with velocity 6.11 m/s.
Figure 9.
Damage of simply supported PC1 beam subjected to mid span impact with velocity 6.11 m/s.
Figure 10.
Variation of damage with time for simply supported beams subjected to mid span impact with different velocities.
Figure 10.
Variation of damage with time for simply supported beams subjected to mid span impact with different velocities.
Figure 11.
Variation of stress with time for simply supported beams subjected to mid span impact with different velocities.
Figure 11.
Variation of stress with time for simply supported beams subjected to mid span impact with different velocities.
Figure 12.
Variation of strain with time for simply supported beams subjected to mid span impact with different velocities.
Figure 12.
Variation of strain with time for simply supported beams subjected to mid span impact with different velocities.
Table 1.
Material properties for different concrete mixes.
Table 1.
Material properties for different concrete mixes.
| Mixture Designation |
Steel fiber (%) |
PP fiber (%) |
Total Volume (%) |
Density (kg/m3) |
Compressive Strength (MPa) |
Tensile Strength (MPa) |
Young’s modulus (E) (MPa) |
| PC1 |
0 |
0 |
0 |
2293.33 |
38.5 |
3.5 |
31024.2 |
| PC2 |
1 |
0 |
1 |
2304.44 |
37.4 |
3.8 |
32372.0 |
| PC3 |
0.9 |
0.1 |
1 |
2337.8 |
48.4 |
5.1 |
36335.2 |
| PC4 |
0.825 |
0.175 |
1 |
2322.73 |
41.8 |
4.6 |
33749.7 |
| PC5 |
0.75 |
0.25 |
1 |
2240.33 |
35.6 |
3.9 |
31129.5 |
| PC6 |
0 |
1 |
1 |
2166.37 |
24.7 |
2.4 |
24681.1 |
Table 2.
The maximum mid span deflection of simply supported beams subjected to different impact velocities.
Table 2.
The maximum mid span deflection of simply supported beams subjected to different impact velocities.
Velocity of impact
(m/s) |
Height of fall (m) |
PC1 |
PC2 |
PC3 |
PC4 |
PC5 |
PC6 |
Max.
Deflection (mm) |
Max.
Deflection (mm) |
Max.
Deflection (mm) |
Max.
Deflection (mm) |
Max.
Deflection (mm) |
Max.
Deflection (mm) |
| 3.13 |
0.5 |
29.03 |
25.76 |
17.28 |
23.41 |
24.44 |
41.67 |
| 4.43 |
1.0 |
57.42 |
51.87 |
38.37 |
43.44 |
53.08 |
83.28 |
| 5.43 |
1.5 |
85.8 |
83.87 |
52.5 |
65.67 |
80.53 |
133.83 |
| 6.11 |
1.9 |
107.02 |
100.25 |
83.1 |
87.94 |
98.18 |
180.03 |
Table 3.
The maximum Load of simply supported beams subjected to mid span impact with different velocity.
Table 3.
The maximum Load of simply supported beams subjected to mid span impact with different velocity.
| Velocity of impact (m/s) |
Height of fall (m) |
PC1 |
PC2 |
PC3 |
PC4 |
PC5 |
PC6 |
Max. Load
(KN) |
Max. Load
(KN) |
Max. Load
(KN) |
Max. Load
(KN) |
Max. Load
(KN) |
Max. Load
(KN) |
| 3.13 |
0.5 |
5.66 |
6.39 |
7.91 |
7.82 |
7.19 |
5.90 |
| 4.43 |
1 |
9.18 |
7.35 |
9.46 |
9.29 |
7.88 |
6.61 |
| 5.43 |
1.5 |
7.52 |
8.07 |
9.66 |
3.25 |
6.66 |
6.87 |
| 6.11 |
1.9 |
6.61 |
8.48 |
8.66 |
8.40 |
7.06 |
4.62 |
Table 4.
Variation of impact energy and deflection of beams.
Table 4.
Variation of impact energy and deflection of beams.
| Impact energy (J) |
Impact velocity (m/s) |
Max. Deflection (mm) |
| PC1 |
PC2 |
PC3 |
PC4 |
PC5 |
PC6 |
| 490.5 |
3.13 |
29.03 |
25.76 |
17.28 |
23.41 |
24.44 |
41.67 |
| 981 |
4.43 |
57.42 |
51.87 |
38.37 |
43.44 |
53.08 |
83.28 |
| 1471.5 |
5.43 |
85.8 |
83.87 |
52.5 |
65.67 |
80.53 |
133.83 |
| 1863.9 |
6.11 |
107.02 |
100.25 |
83.1 |
87.94 |
98.18 |
180.03 |
Table 5.
Damage values of beams subjected to mid span impact with different velocities.
Table 5.
Damage values of beams subjected to mid span impact with different velocities.
| Velocity of impact (m/s) |
Height of fall (m) |
PC1 |
PC2 |
PC3 |
PC4 |
PC5 |
PC6 |
| Damage (%) |
Damage (%) |
Damage (%) |
Damage (%) |
Damage (%) |
Damage (%) |
| 3.13 |
0.5 |
68 |
63 |
60.5 |
62 |
65 |
71 |
| 4.43 |
1 |
73 |
70.7 |
67.3 |
68.5 |
69.1 |
75.1 |
| 5.43 |
1.5 |
78.4 |
75.6 |
72.22 |
73.6 |
76 |
80.3 |
| 6.11 |
1.9 |
84 |
81.2 |
78.4 |
80.3 |
82 |
89.6 |
Table 6.
Maximum stress values of beams subjected to mid span impact with different velocities.
Table 6.
Maximum stress values of beams subjected to mid span impact with different velocities.
Velocity of impact
(m/s) |
Height of fall (m) |
PC1 |
PC2 |
PC3 |
PC4 |
PC5 |
PC6 |
Max. Stress
(N/mm2) |
Max. Stress
(N/mm2) |
Max. Stress
(N/mm2) |
Max. Stress
(N/mm2) |
Max. Stress
(N/mm2) |
Max. Stress
(N/mm2) |
| 3.13 |
0.5 |
48.87 |
37.39 |
47.56 |
51.09 |
44.11 |
34.42 |
| 4.43 |
1.0 |
50.26 |
47.46 |
53.97 |
54.90 |
44.90 |
33.83 |
| 5.43 |
1.5 |
41.63 |
44.26 |
56.22 |
56.07 |
34.77 |
32.59 |
| 6.11 |
1.9 |
17.01 |
35.4 |
48.19 |
48.19 |
39.28 |
5.32 |
Table 7.
Maximum strain values of beams subjected to mid span impact with different velocities.
Table 7.
Maximum strain values of beams subjected to mid span impact with different velocities.
| Velocity of impact (m/s) |
Height of fall (m) |
PC1 |
PC2 |
PC3 |
PC4 |
PC5 |
PC6 |
| Max. Strain |
Max. Strain |
Max. Strain |
Max. Strain |
Max. Strain |
Max. Strain |
| 3.13 |
0.5 |
1.47 |
0.58 |
0.76 |
1.06 |
1.22 |
1.58 |
| 4.43 |
1 |
2.70 |
1.24 |
1.73 |
1.05 |
1.76 |
0.98 |
| 5.43 |
1.5 |
2.40 |
1.76 |
1.98 |
1.29 |
2.05 |
2.16 |
| 6.11 |
1.9 |
2.11 |
2.08 |
2.83 |
2.63 |
0.83 |
0.99 |
|
Disclaimer/Publisher’s Note: The statements, opinions and data contained in all publications are solely those of the individual author(s) and contributor(s) and not of MDPI and/or the editor(s). MDPI and/or the editor(s) disclaim responsibility for any injury to people or property resulting from any ideas, methods, instructions or products referred to in the content. |
© 2023 by the authors. Licensee MDPI, Basel, Switzerland. This article is an open access article distributed under the terms and conditions of the Creative Commons Attribution (CC BY) license (http://creativecommons.org/licenses/by/4.0/).

