Submitted:
12 December 2023
Posted:
12 December 2023
You are already at the latest version
Abstract
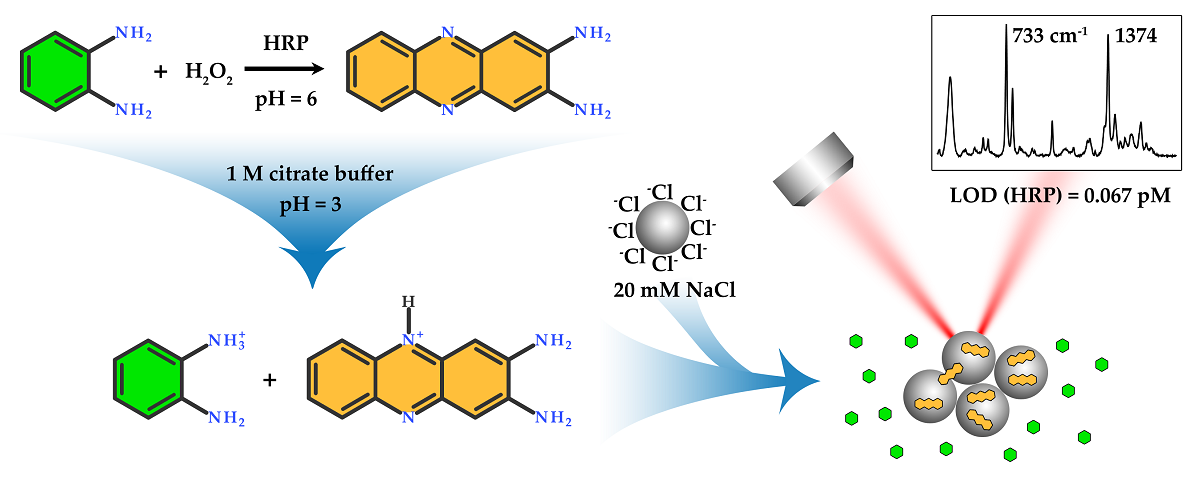
The enzyme-linked immunosorbent assay (ELISA) coupled with surface-enhanced Raman spectroscopy (SERS) detection is a growing area of analytical chemistry emerged as a solution to a problem of sensitivity improvement. SERS-based ELISA with horseradish peroxidase as an enzymatic label, o-phenylenediamine (oPD) substrate, and 2,3-diaminophenazine (DAP) enzymatic product was one of the first examples of such systems. Surprisingly, the full potential of this long-known approach has not been revealed yet. The current study addresses a previously neglected problem of SERS detection stage performance. Using silver nanoparticles and model mixtures of oPD and DAP, the effects of pH, concentration of aggregating agent, and particle surface chloride stabilizer were extensively evaluated. At optimal mildly acidic pH of 3, 0.93 to 1 M citrate buffer, and AgNPs stabilized with 20 mM chloride, at least two orders of magnitude advantages in the detection limits of SERS over colorimetry both for DAP and HRP were demonstrated. We suppose that this improved detection system could become a useful tool for the development of SERS-based ELISA protocols.
Keywords:
Surface-enhanced Raman spectroscopy
; SERS
; horseradish peroxidase
; HRP
; ELISA
; 2
; 3-diaminophenazine
; DAP
; o-phenylenediamine
; 1
; 2-diaminobenzene
; oPD
1. Introduction
The enzyme-linked immunosorbent assay (ELISA) with colorimetric detection is a universal analytical platform used for quantitative measurement of various antigens. Although highly successful and widely used, in some cases it struggles with limited sensitivity as more and more antigens emerge (e.g., clinically relevant ones) that have to be detected in very low concentrations. One of the natural solutions for such instances is a shift from colorimetry to more sensitive detection techniques, like fluorescence [1,2] or chemiluminescence [3]. Surface-enhanced Raman spectroscopy (SERS) is also a promising candidate which fulfills the requirement of high sensitivity. The so-called SERS-based ELISA is a growing scientific field which gradually builds up a range of available approaches as well as the number of successful applications [4,5]. Horseradish peroxidase (HRP) is the most common enzyme label used in ELISA. It is readily available both as a pure enzyme and in conjugates with antibodies. Several strategies are known to amplify peroxidase activity with very little intervention into the immunochemical steps of the assay, for instance, polymeric peroxidase [6] or tyramide signal amplification [7]. To summarize, the HRP label is a good candidate for further improvement of ELISA sensitivity by changing the detection technique.
The idea underlying most of the published SERS-based HRP activity measurements is pretty straightforward: to find a substrate whose corresponding enzymatic product has a much more intense SER spectrum. In other words, this product should have both a high Raman scattering cross-section and a high affinity for the metal surface. Several substrates were tested: o-phenylenediamine (oPD) [8,9,10,11,12], 2,2'-azino-bis(3-ethylbenzo-thiazoline-6-sulfonic acid) (ABTS) [13], 3,3′,5,5′-tetramethylbenzidine (TMB) [14,15,16,17], and leuco dyes [18]. Among these, oPD appears to be the most promising one. First, it results in a well-defined and sufficiently soluble product, 2,3-diaminophenazine (DAP) [19,20]. Second, this reaction is not a simple oxidation but an oxidative dimerization, leading to substantial differences in chemical structures and, hence, in the vibrational spectra of the substrate and the product. Next, both oPD and DAP are commercially available, which is not relevant for the assay but greatly simplifies the research as solutions of both substances and their model mixtures might be easily prepared and studied. Finally, it has been shown previously that all forms of DAP (neutral DAP, protonated DAPH+, and doubly-protonated DAPH22+) exhibit a distinct SER spectrum on silver nanopar-ticles [10,11,21,22].
In general, SERS-based measurement of HRP activity consists of two steps: enzymatic reaction and SERS detection of the resultant product. In order to achieve high sensitivity, conditions for both steps should be optimized. While several examples of enzymatic reaction optimization were described previously for colorimetric [23] and SERS-based measurements [11] of DAP, no studies were dedicated to understanding and refinement of its SERS detection procedure. For the first time, the current paper addresses this issue. Using silver nanoparticles (AgNPs) and model mixtures of oPD and DAP, we successively and rationally evaluated the effects of pH, concentration of aggregating agent, and particle surface chloride stabilizer. As a result, we strongly narrowed the range of optimal detection conditions to a mildly acidic pH of 3-4 using the 0.93 to 1 M citrate buffer and AgNPs stabilized with 20 mM chloride. With these optimal conditions, we have demonstrated at least two orders of magnitude advantage in the detection limits of SERS over colorimetry both for DAP and HRP.
2. Results
2.1. Synthesis and characterization of silver nanoparticles
Silver nanoparticles are known to be slowly oxidized by atmospheric oxygen. In order to obtain repeatable results over the entire study, fresh batches of AgNPs were routinely synthesized. To minimize oxidation, they were stored in the reaction medium, which contains excess hydroxylamine, and used within 36 h after the synthesis. UV-vis spectra were used for the rapid characterization of each batch. To standardize the particle size, samples with a maximum of plasmonic band between 406.6 and 408.6 nm (Figure 1a) were selected for further use. Prior to SERS measurements, the medium and concentration of AgNPs were also standardized by transferring them into NaCl and adjusting their absorption at the plasmonic maximum. For several batches, number-weighted mean hydrodynamic particle diameter and total particle concentration were measured using nanoparticle tracking analysis (NTA) both for AgNPs in reaction medium and AgNPs transferred into 5 or 20 mM NaCl (Figure 1b). During double centrifugation and resuspension, the mean particle size experiences only a minor shift from 39 to 40 nm, which is expected due to the loss of smaller particles to the supernatant. The total particle concentration also does not change within the NTA technique uncertainty.
2.2. Estimation of HRP effective KM for oPD
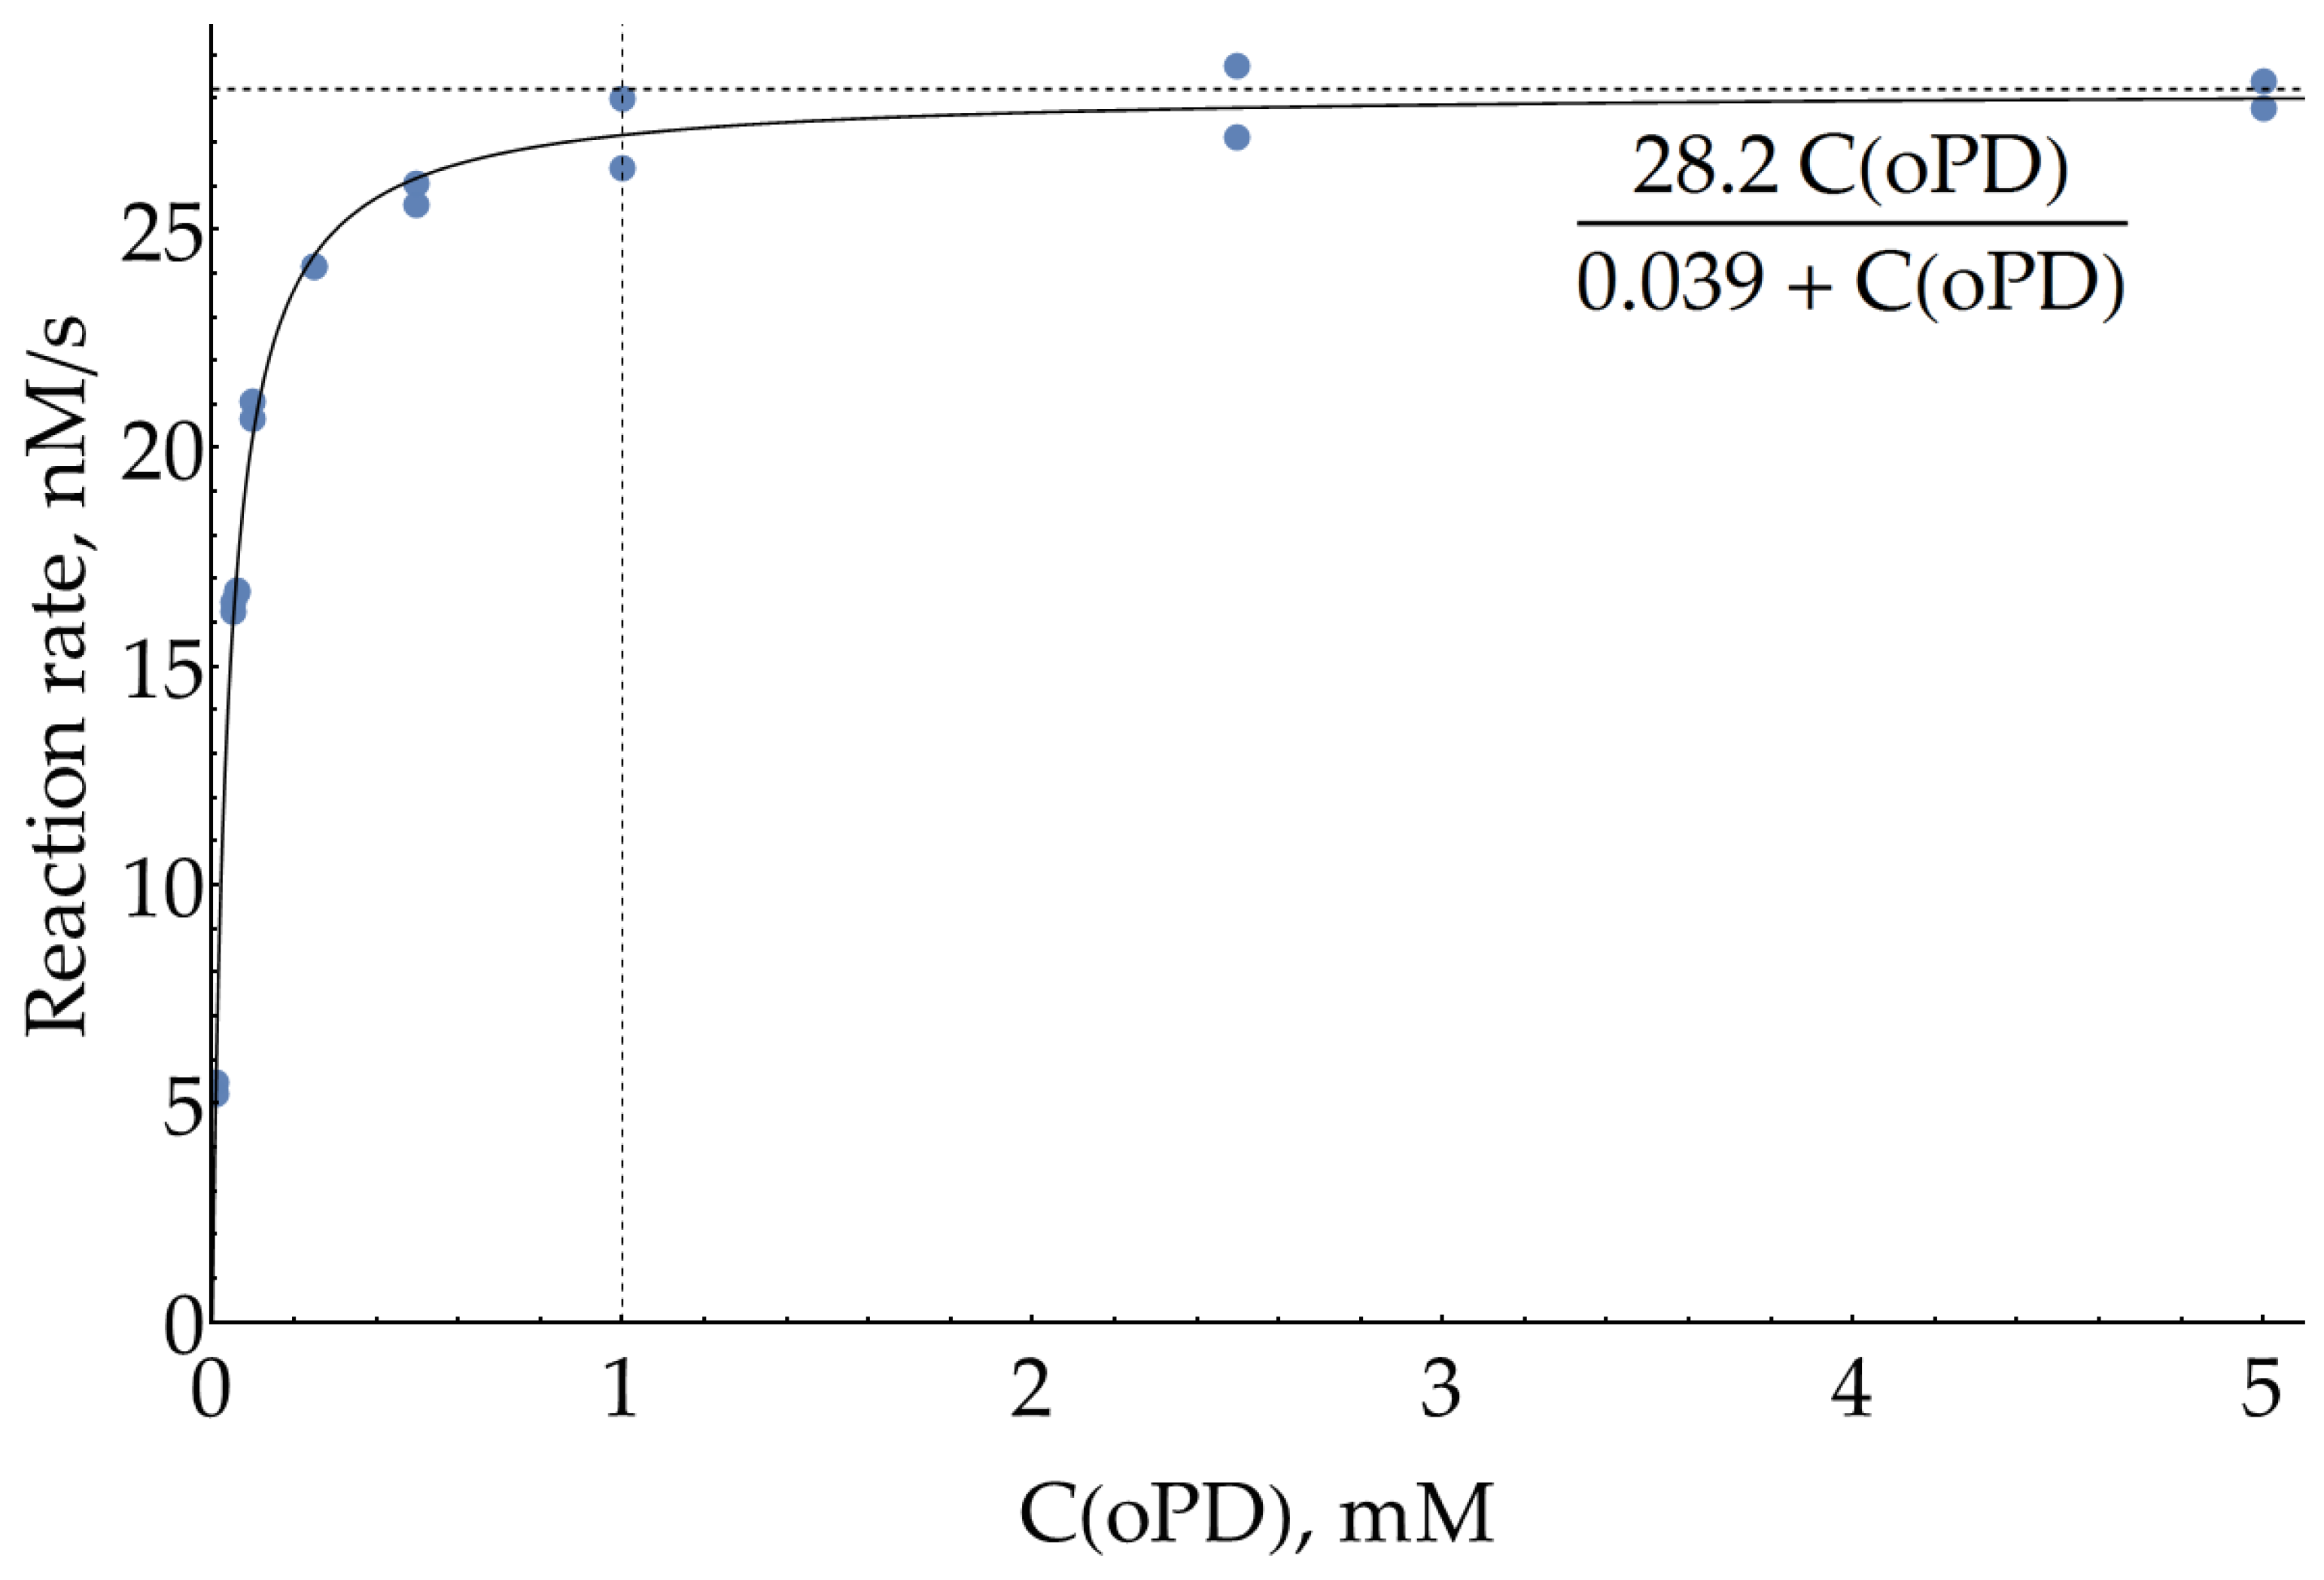
Although we have claimed our main goal as optimization of SERS measurements of DAP, this procedure is dependent on the conditions of the preceding enzymatic reaction. SER spectra were previously reported for both oPD [10,11,24,25,26] and DAP [10,11,21,22], which implies that they both have some affinity for the silver surface, so during the SERS measurements, they compete for binding to the metal. Thus, our goal could be refined as a search for conditions which favor the binding of small quantities of enzymatically formed DAP over the large excess of unreacted oPD. In order to estimate the highest concentration of oPD that could be passed to SERS detection from the enzymatic stage, the effective Michaelis constant for oPD was measured colorimetrically at 421 nm in 100 mM sodium phosphate buffer (pH = 6.0) and H2O2 concentration of 80 μM, which has been previously reported as being optimal [23]. The 95% confidence interval for KM was found to be 37 ± 3 μM. From this value and also visually from the graph (Figure 2 and Appendix A), it could be concluded that oPD concentration of 1 mM (around 27 × KM) is the reasonable maximum. Indeed, the addition of more oPD causes only a minor increase in the enzymatic product formation rate but instead interferes with DAP on a subsequent SERS detection step.
2.3. Selection of pH for SERS detection of DAP
HRP enzymatic reaction is usually performed at pH of 5 to 7. At the same time, sensitive SERS detection of the produced DAP might require a different optimal pH. As long as DAP has a pronounced SER spectrum over a broad range of pHs (see Appendix B), hypothetically several strategies might be considered:
- The enzymatic reaction is stopped by acid or base, and this mixture is further added to AgNPs sol for SERS measurements. The stop-reagent should create the optimal pH for DAP binding to the silver surface and the optimal ionic strength for proper aggregation of AgNPs.
- If the sensitive detection of DAP in its mixtures with oPD is possible at the pH optimum of HRP, the enzymatic reaction mixture after a certain period of time could be directly mixed with AgNPs sol, followed by SERS detection. The advantage of this approach is the absence of dilution by stop-reagent.
In this section and related appendices, we extensively analyze which processes interfere with DAP detection at various pHs for the rational exclusion of unviable strategies.
The first factor is the presence of unreacted H2O2 in reaction mixtures, which could cause the partial dissolution of AgNPs [27,28,29]. Using spectrophotometric measurements of position and absorbance in the plasmonic band maximum, it has been shown (see Appendix C) that at alkaline pH = 9, a measurable dissolution of AgNPs occurs within 10 minutes of incubation with 100 μM H2O2. Thus, stopping the enzymatic reaction by shifting to an alkaline pH is an unfavorable strategy.
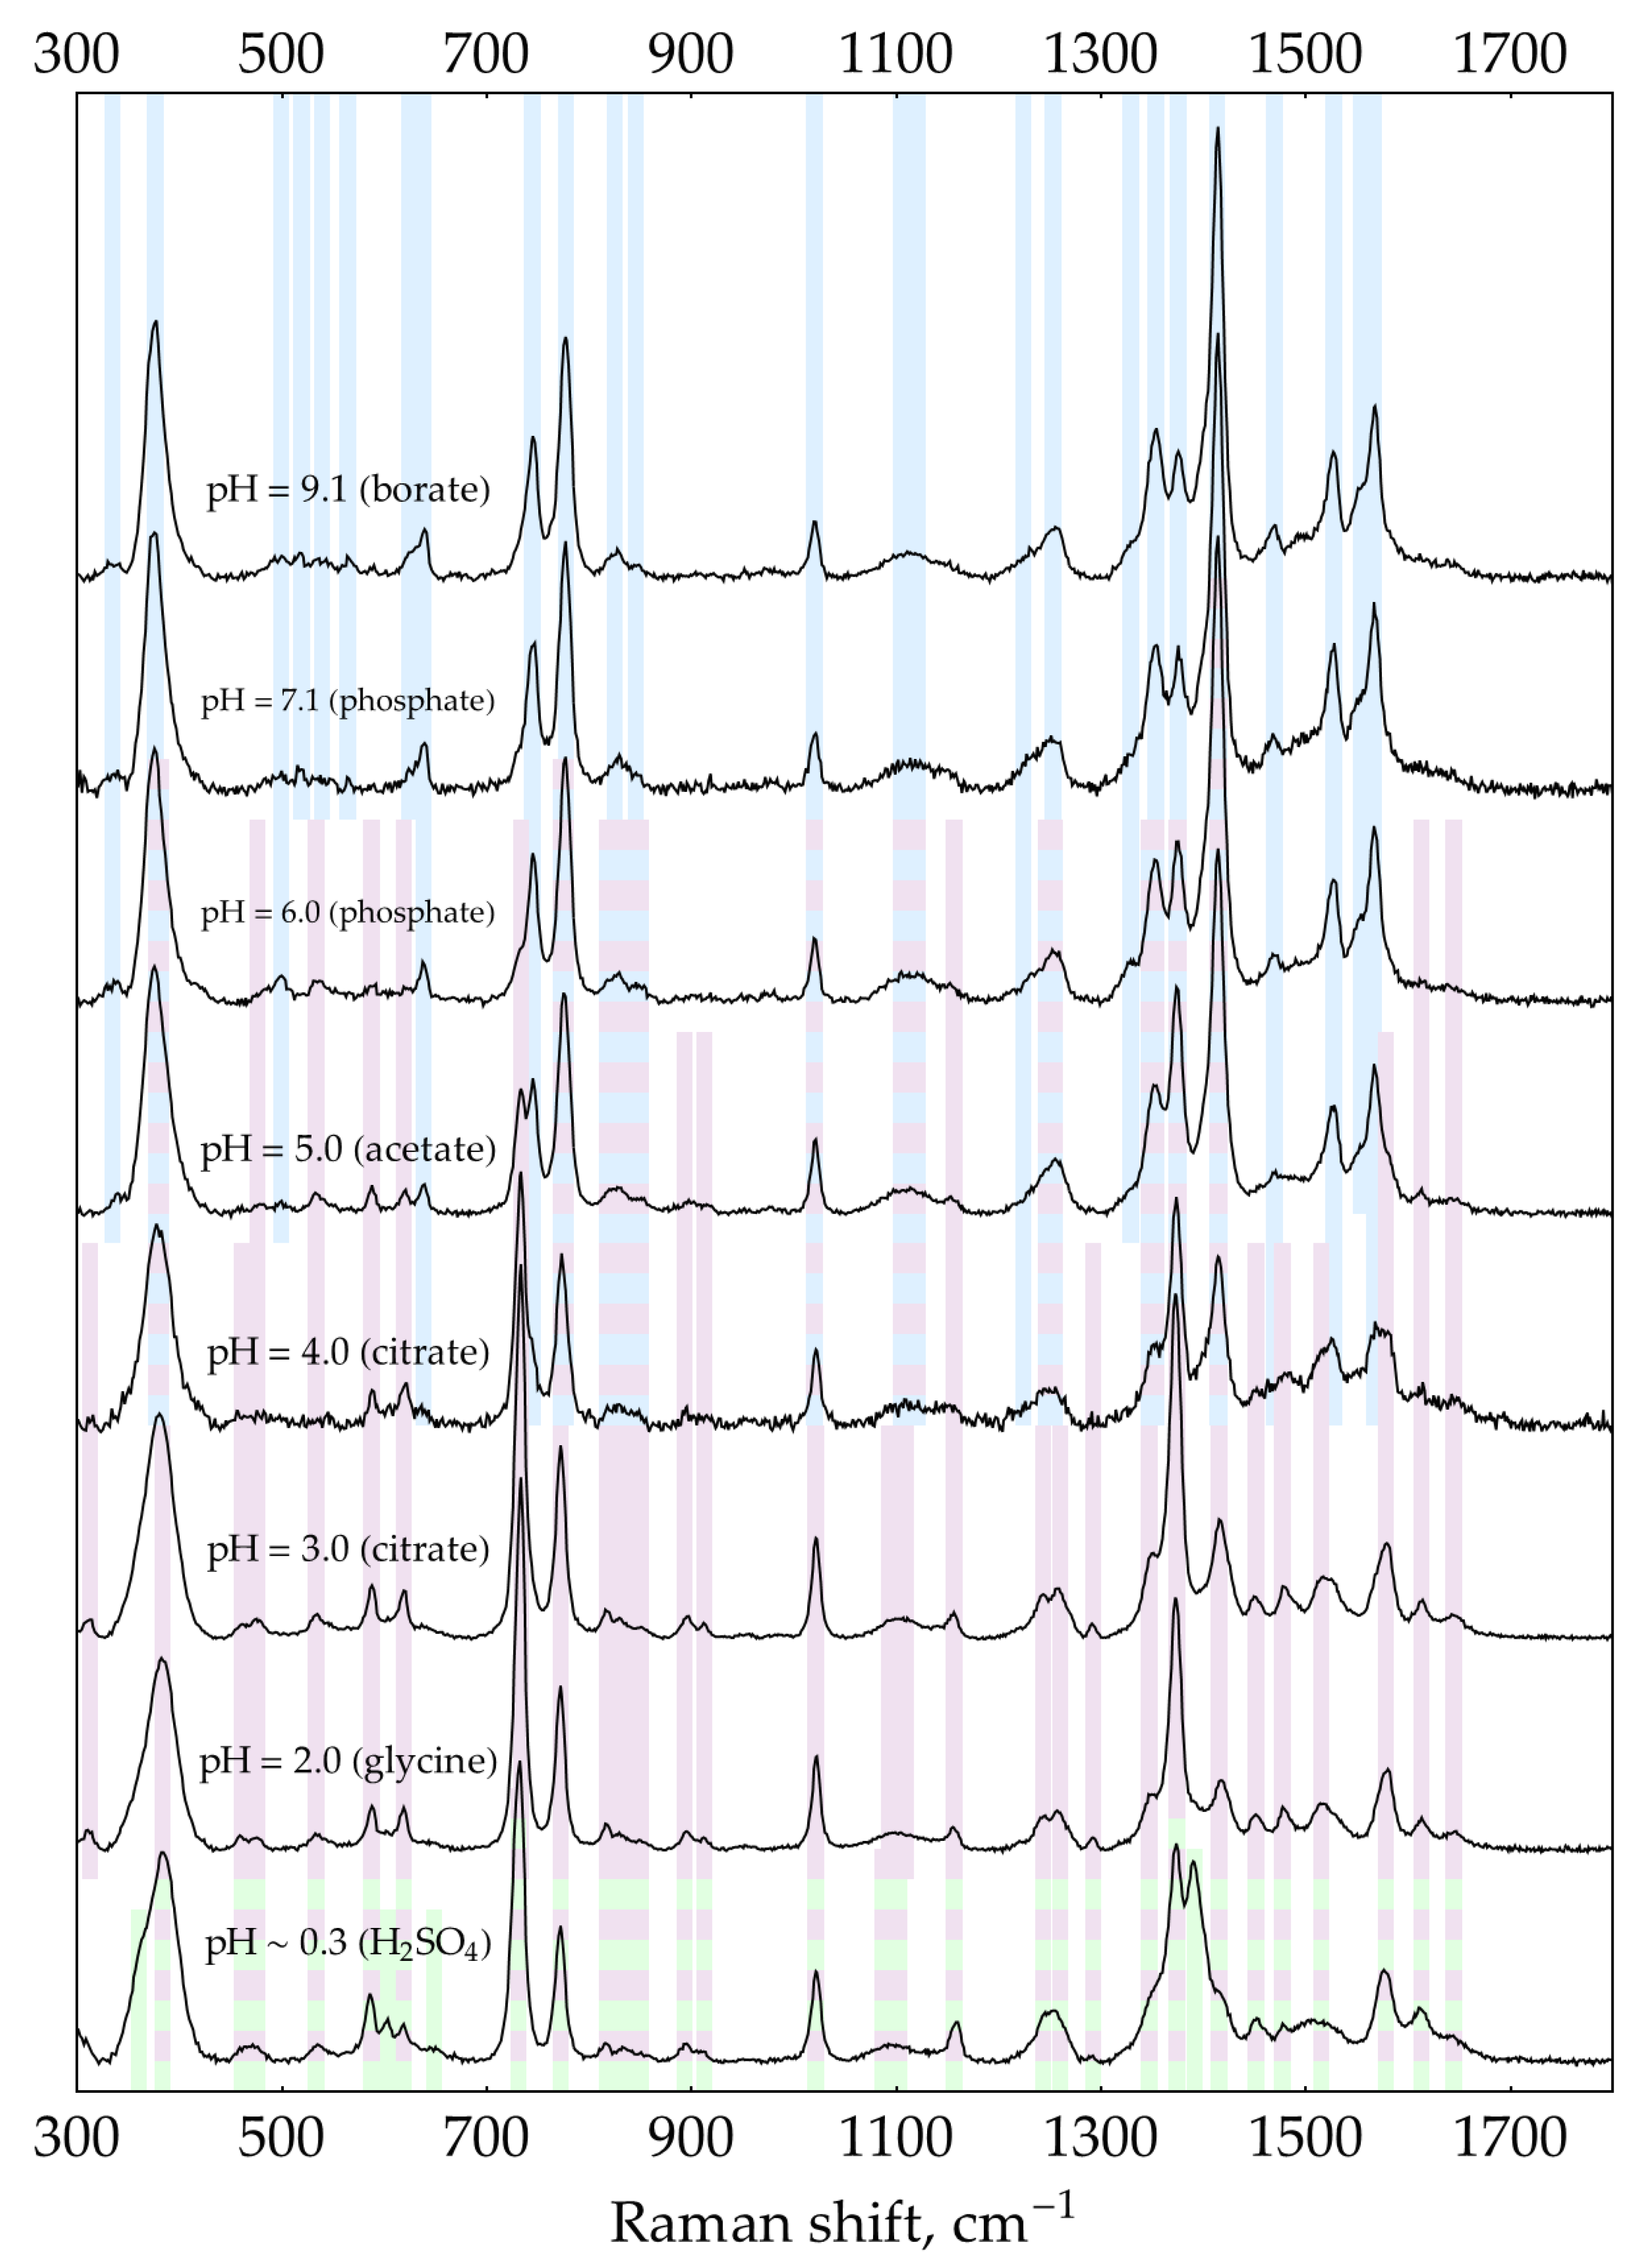
The second factor is the presence of excess oPD. In order to estimate the feasibility of DAP detection in its mixtures with oPD at different pHs, a two-step process was used. First, to narrow the range of pHs, the screening was performed using default concentrations of buffers/media (0.32 М for pH = 9.1 and 0.5 M for the rest of pHs). With C(oPD) = 1 mM, three different DAP concentrations were used: 0, 100, and 500 nM. The pH has been considered perspective if it meets two criteria. First, the most intense DAP bands should be detectable at a moderate DAP concentration of 100 nM. Second, their intensity should be increased at 500 nM DAP. The results are shown in Figure 3. It is clearly visible that at C(oPD) = 1 mM, DAP could be detected at pHs from strongly acidic up to 4. Notably, the sensitivity at this range is high enough to detect weak DAP bands in the absence of added DAP. They originate from minor amounts of DAP present in stock oPD. At higher pHs, oPD dominates the SER spectrum strongly, with no DAP bands detectable. As long as 1 mM of oPD was determined to be the highest reasonable concentration to use in the enzymatic reaction, the same screening was also performed at 0.1 mM of oPD (Figure 4). At this oPD concentration, the qualitative picture is the same, with the perspective range extended up to pH = 7.1 due to the weaker competition of oPD with DAP for binding to the silver surface. Another important feature is that at pH ≥ 5, the oPD spectrum is concentration-dependent and contains some bands with poorly reproducible intensity, hence providing an unsteady background for DAP detection. All the features mentioned in the oPD spectra are discussed in detail in Appendix D.
At the second step of pH selection, perspective candidates from screening (pH from 0.3 to 4) could be directly compared to each other. In order to use the best possible conditions for each pH, the concentrations of buffers/media serving as aggregating agents of AgNPs were optimized (Appendix E). The results of this comparison are shown in Figure 5.
The highest SERS signal for both most intense DAP bands in the presence of 1 mM oPD is observed at a mildly acidic pH = 3. Hence, the general procedure for HRP activity SERS detection should include the enzymatic reaction, stopped by the addition of concentrated citrate buffer with pH = 3 up to the final concentration of 0.93 M for optimal aggregation of AgNPs. This sample might be directly mixed with AgNPs in a 1:1 ratio with SERS measurement 2 minutes later.
2.4. Influence of AgNPs surface chloride concentration
The last factor to consider in the current paper is the impact of AgNPs surface modification on SERS detection of DAP. This topic is truly inexhaustible, so as an example of this approach, only one system was studied. The chloride anion has a strong affinity for the silver surface and provides a negative charge of AgNPs. In all previous experiments, AgNPs stabilized with 5 mM NaCl were used. This concentration could be varied in a narrow range from 2.5 to 20 mM, with AgNPs being unstable outside this range on a timescale of several hours. Below 2.5 mM, there is not enough chloride on the surface to fully stabilize the sol. Above 20 mM, destabilization occurs due to the contraction of the electrical double layer by the increased ionic strength.
The data provided on Figure 6 evidence that SERS intensity for both DAP bands asymptotically increases with saturation of the silver surface by chloride. The highest NaCl concentration of 20 mM, which still results in stable AgNPs, should be used in the assay.
2.5. Comparison of colorimetric and SERS detection of DAP and HRP
In order to evaluate the performance of optimized conditions for DAP measurement, colorimetric and SERS detection were directly compared to each other (Figure 7). Both assays were performed in 0.93 M citrate buffer, pH = 3. oPD concentration was chosen to be 0.33 mM under the following considerations. The maximum concentration of stock citrate buffer is around 1.5 M. At higher concentrations, it starts to precipitate if the room temperature drops below 20°C. This obstacle strongly deteriorates the repeatability if thin and poorly visible white sediment is overlooked. Thus, to stop the enzymatic reaction, it should be diluted around 3 times with stock 1.5 M citrate, which turns 1 mM of oPD from the enzymatic reaction into 0.33 mM on a SERS detection stage. It should be noted that pH = 3 is close to optimal not only for SERS but also for colorimetry. As the molar absorption coefficient of DAPH+ is slightly higher than that of DAP (21 400 versus 17 000 M-1×cm-1 [30]), the comparison of both techniques at these conditions is justified.
The limit of detection (LOD) for colorimetric measurement of DAP (Figure 7b) was estimated to be 478 nM. At high DAP concentrations above 18 μM, the curve deviates from linear dependence. The mean coefficient of variation (CV) for the range above LOD was 6%.
Both concentration curves for SERS measurements of DAP (Figure 7c,d) are strongly non-linear (S-shaped). Saturation at high concentrations is typical for SERS measurements due to the filling of all available binding sites on the silver surface. Negative deviation from linearity at low concentrations is less expected. Two hypotheses could be proposed for this phenomenon. First, the issue might be kinetic: at low concentrations, two minutes are not enough to reach equilibrium for DAPH+ adsorption onto the silver surface. On the other hand, it could be an indication of a cooperative process, namely oligomerization of DAP on the surface, which has been shown for DAP on MoSe2 [31].
In order to describe these datasets with calibration curves, an appropriate function was found. It includes the exponential term to account for the concave shape at low concentrations, together with the hyperbolic term, characteristic of processes with saturation. Estimated LODs for SERS detection of DAP were 2.2 and 4.9 nM for 733 and 1374 cm-1 bands, respectively. These values are around two orders of magnitude lower than the LOD of the colorimetric technique. Mean CVs for the range above LOD were measured to be 24% and 22%, respectively.
Finally, the same comparison was made for HRP (Figure 8). As long as the optimization of the enzymatic reaction stage is beyond the scope of the current study, for this demonstration some typical conditions were used: room temperature, pH = 6, 1 mM oPD, 80 μM H2O2, and reaction time 10 minutes. The reaction was stopped by three-fold dilution with citrate buffer 1.5 M, pH = 3. Chosen conditions equally influence both detection techniques (SERS and colorimetry); hence, the estimate for the ratio of two LODs is unbiased.
The calibration curve for colorimetric HRP measurement (Figure 8a) is non-linear, as reported previously [32]. Instead of limiting ourselves to a narrow linear range, an appropriate non-linear function was found to describe all data points. The estimated LOD for HRP was 6.5 pM, and the mean CV for the range above the LOD was 11%. Calibration curves for SERS detection of HRP have the same S-shape as those for DAP, with estimated LODs of 0.067 and 0.32 pM for 733 and 1374 cm-1 bands, respectively. Hence, as with DAP measurements, SERS detection of HRP at 733 cm-1 is about two orders of magnitude more sensitive compared to colorimetry, which confirms the performance of the proposed SERS-based detection system. The mean CVs for the range above LOD were measured to be 13% and 9% for 733 and 1374 cm-1 bands, respectively. Notably, the SERS signal repeatability in HRP measurements was substantially higher (and comparable to the colorimetry) than in model DAP-oPD mixtures. It could be caused by the low grade of commercially available DAP (>90%) with unavoidable impurity of 2-hydroxy-3-aminophenazine [33]. Retrospectively, we suppose that despite higher uncertainties, model DAP-oPD mixtures were highly useful during optimization as long as key features (calibration curve shape, SERS to colorimetry LODs ratio) were confirmed for enzymatically generated DAP.
3. Discussion
Measurement of HRP activity is the basis of the catalytic enhancement and detection system in ELISA and also in some other analytical protocols. Several published papers describe the usage of oPD substrate together with SERS detection of DAP product [8,9,10,11,12]. While the colorimetric and fluorimetric detection of DAP are somewhat straightforward, and the only thing to tune is the performance of the enzymatic reaction, SERS-based detection of DAP strongly depends on the conditions. The current study addresses this topic, which has been generally neglected previously.
The AgNPs sol used in the current study is typical for SERS applications, with a mean number-weighted hydrodynamic diameter of 39 nm. Previously, we examined it with transmission electron microscopy and showed that the particle shape is slightly prolonged with a mean aspect ratio of 1.13 [21]. Freshly synthesized sols were used during the entire study, leaving the problem of long-term AgNPs stability to later research. We provide here both UV-vis spectral (λmax and Amax) and physical (dh and particle concentration) characteristics of the used nanoparticles for easier reproducibility. When working with AgNPs, special attention should be paid to the problem of their adsorption onto the laboratory plastic, which is covered in Appendix F.
Proper surface modification of AgNPs is also important. As evidenced from Figure 6, a simple saturation of the silver surface with chloride improves the SERS intensity at low DAP concentrations by around two times.
As mentioned previously, SERS measurement of HRP activity consists of two stages: the enzymatic reaction and SERS detection of the resulting DAP. The optimization problem for this system is complicated as these stages require different conditions, but at the same time are coupled as the reaction mixture is passed from the first stage to the second. In order to develop a highly sensitive protocol, our attention was focused primarily on the second stage because its performance changes hugely depending on the conditions, and the basic underlying principles were unknown. For the oPD-DAP system, both substances are commercially available. This occasion strongly simplifies the research, as it could be made with well-controlled model mixtures.
The concentration of oPD has a direct impact on the enzymatic reaction rate. At the same time, during SERS detection, the unreacted oPD interferes with the measurement of small quantities of produced DAP. With this contradiction in mind, first, the highest reasonable oPD concentration for the enzymatic reaction was estimated to be around 1 mM and used for further experiments.
The pH of SERS detection turned out to be the key factor defining the sensitivity. Summarizing all the findings, DAP has a high affinity for the silver surface across the entire pH range from 0.2 up to 9.1 (Appendix B). At pH = 9, AgNPs are prone to dissolution by unreacted H2O2 (Appendix C). The influence of oPD is complex. In neutral form (which exists at pH ≥ 3 according to its pKa = 4.55 [34]), it exerts a moderate affinity for the silver surface (Appendix D). No other form (oPDH+ or oPDH22+) was found in the SER spectra. The neutral oPD competes with DAP for binding with silver, so at 1 mM oPD, even a relatively high DAP concentration of 500 nM is not detectable at pH > 5 (Figure 3). Second, at pH > 4, minor amounts of silver (I) present in AgNPs facilitate oxidation of oPD (Appendix D). The product of this process is not DAP, but most likely some intermediate on a route from oPD to DAP. The bands of this oxidation product (or products) are numerous in the SER spectra and vary in intensity, creating a poor background for DAP detection. Finally, the stock oPD contains minor quantities of DAP, both in a commercial powder and additionally formed due to spontaneous oxidation during oPD solution storage prior to use (Figure A14). This non-enzymatic DAP could deteriorate the sensitivity of the assay.
Taking into account all the listed obstacles, a sensitive SERS detection of DAP in the presence of 1 mM oPD is possible at pH ≤ 4. After optimization of aggregating agent concentration at each pH, direct comparison showed the highest sensitivity at pH = 3 (Figure 5). At higher pHs, DAP experiences competition with oPD for binding to the silver. At lower pHs, DAPH+ is partially converted into DAPH22+, according to its pKa around 1 [30]. The coexistence of two forms of analyte is typically not the best case for SERS detection because the substance is split between two sets of bands. From this point of view, pH = 3, being equidistant from both pKas (~1 and 5.1), is a ‘sweet spot’ maximizing the fraction of a protonated form DAPH+.
The optimized conditions for DAP detection rationally found in the current study are superior to those used by chance previously. In the pioneering work by Dou, et al. [8], the mixture after 20 minutes of enzymatic reaction at pH = 5 was directly added to AgNPs. This study, although very important as the first demonstration of the principle, suffered from poor sensitivity despite the advantage of the resonant regime with 514.5 nm excitation. In two recent works by Fu, et al. [10,11], the enzymatic reaction was stopped by sulfuric acid, and the resulting mixture was added to AgNPs. Our optimized conditions are estimated to be around 10 times more sensitive in terms of DAP detection: > 5× difference between sulfuric acid and pH = 3 (Figure 5) and additional ~2× improvement due to modification of AgNPs with 20 mM chloride (Figure 6).
Cross-study comparison is typically not straightforward due to numerous differences in protocols. To evaluate the performance of the proposed detection system, it has been directly compared to the reference colorimetric technique. First, it has been done for model mixtures of DAP with 1 mM oPD and then repeated with HRP-generated DAP. These experiments revealed an important feature of SERS-based detection system: the calibration curve is strongly non-linear. This is not uncommon for modern commercial assays and analytical devices that automatically perform signal processing. At the same time, further research would be favorable, aimed at improving the curve slope in the low concentration range. Despite these peculiarities, a proposed SERS-based detection system exhibits around two orders of magnitude lower LODs (733 cm-1 band) than traditional colorimetry.
These results place the developed approach for SERS-based HRP activity measurements into a category of highly sensitive techniques, along with fluorimetry [1,2] and chemiluminescence [3]. There is obviously plenty of room for further improvement: optimization of the enzymatic reaction stage (pH, time, temperature, buffer type, etc.), replacement of near-spherical AgNPs with anisotropic objects (rods [35], nanoplates [36], etc.), which were shown to have higher enhancement factors, and so on. The proposed protocol is also compatible with classic HRP activity enhancement procedures like polymeric peroxidase, tyramid signal amplification, and so on. Therefore, we suppose that this HRP-oPD system with SERS detection using AgNPs has great potential for applications in highly sensitive ELISA.
As for the basic research, additional insights into the causes of high DAP affinity for the silver surface would be advantageous for a better understanding of the driving forces of the proposed analytical system. oPD provides some clues about its orientation on the silver surface thanks to non-trivial pH-dependence of SER spectra and the presence of the broad and intense band around 983 cm-1 of NH2-group, covalently bound to silver. On the contrary, the clues for DAP affinity for silver are scarce. It exhibits SER spectra on silver in all three forms: DAP, DAPH+, and DAPH22+. Despite the fact that DAP and oPD both have two adjacent NH2-groups, the affinity of DAP for silver is much higher. See, for instance, Figure 4, pH = 6, where 100 nM DAP is visible in the presence of 100 μM oPD (1000 times the difference in concentrations). The SER spectrum of DAP also lacks the intense band near 983 cm-1 for any of its forms. From these facts, our best guess is that DAP has some other than oPD orientation on the surface. A probable faint hint is given by the concave shape of dependence in the low concentration region (Figure 7c,d), which might indicate a cooperative process of DAP oligomerization during adsorption. This hypothesis agrees with the existence of molecule ribbons in crystals of both DAP and DAPH+ [37,38,39], but it is hard to experimentally confirm it in the case of SERS. To conclude, this problem definitely requires fresh ideas to solve it.
4. Materials and Methods
4.1. Reagents
oPD (# P9029), DAP (# 661376), NH2OH·HCl (# H-9876), AgNO3 (# 209139), highly stabilized salt-free HRP (# P2088), NaCl (# S-9625), bovine serum albumin (BSA, # A7030), trisodium citrate dihydrate (# S4641), anhydrous sodium acetate (# 06268), sodium dihydrogen phosphate (# 71496), and sodium phosphate dibasic (# 1.06586) were purchased from Sigma-Aldrich. Chemically pure NaOH for AgNPs synthesis and extra-pure grade H2SO4 were purchased from Chimmed, Russia. Extra-pure HCl (35-38 weight %), chemically pure glacial acetic acid, extra-pure boric acid, and extra-pure citric acid hydrate were purchased from Component-Reaktiv, Russia. Biotechnology grade glycine (# Am-O167) was purchased from Helicon, Russia. Sodium tetraborate decahydrate (# 31457) was purchased from Fluka. All solutions were prepared using deionized water (18.2 MΩ·cm) from the MilliQ UF Plus system (Millipore, USA).
4.2. Synthesis and standartization of AgNP sols
AgNPs were synthesized using the hydroxylamine method by Leopold and Lendl [40] with modified hydroxylamine hydrochloride (HA) concentration as previously described [21]. Briefly, 1 mL of 10 mM AgNO3 was quickly added to 9 mL of 2.56 mM HA with 3.33 mM NaOH in 15 mL polypropylene test tube (refer to Appendix F for notes) and immediately stirred on a vortex mixer. Typically, five to seven tubes were prepared at once for further selection. The mixture was stored for 1 h to complete the reaction.
Each sol was characterized with UV-vis absorbance spectrum (300-750 nm) in 15-fold dilution with water using a Shimadzu UV-1800 spectrophotometer. To standardize the particle size, samples with a maximum of plasmonic band between 406.6 and 408.6 nm were selected for further use within 36 h. Prior to SERS experiments, 1.5 mL aliquots of sol were centrifuged for 10 minutes at 7000 RPM (Heraeus Sepatech Biofuge A). These conditions were chosen on this particular rotor for the highest AgNP yield as a compromise between sedimentation and resuspension completeness. The sediment was resuspended in 1.5 mL of 5 mM NaCl, followed by intensive vortex mixing. Next, the sol was subjected to the second centrifugation, followed by resuspension in 0.75 mL of the desired NaCl concentration (2.5 to 20 mM). Absorbance at maximum (Amax) was measured for this around two-fold concentrate (using a 30-fold dilution in water) and adjusted by dilution in NaCl up to Amax = 14.25 (0.95×15) to standardize the particle concentration.
4.3. Determination of mean hydrodynamic diameter and total particle concentration of AgNPs
Some of the sols were characterized with nanoparticle tracking analysis (NTA) using the Nanosight LM10 HS instrument in the following configuration: 405 nm, 65 mW laser unit with passive temperature readout, a high-sensitivity camera of EMCCD type, and NTA 2.3 build 33 software. The sample was diluted with 5 mM NaCl 15 000 or 13 000 times to reach the optimal concentration for the NTA technique. Twenty-one videos, 60 s each of particles’ Brownian motion were recorded using the following camera settings in advanced mode: shutter = 450, gain = 180, lower threshold = 455, higher threshold = 16380. All videos were processed in basic mode with a detection threshold = 6 (Multi) and automatic settings for other options. Data from all repeats (at least 3600 tracks) were merged to obtain the particle size distribution, mean number-weighted hydrodynamic diameter, and total particle concentration, corrected for dilution factor.
4.4. Colorimetric estimation of HRP effective KM for oPD
The enzymatic reaction was carried out at room temperature with 80 μM of H2O2 in 100 mM sodium phosphate buffer (pH = 6.0) with 5 μg/ml BSA to prevent HRP losses. The formation of DAP was followed in the kinetic regime by measuring absorbance at 421 nm using a Shimadzu UV-1800 spectrophotometer. After mixing buffer concentrate, H2O, H2O2, and oPD in the single-use 1 cm acrylic cuvette, the reaction was started by the addition of a HRP aliquot, followed by pipetting for 30 s and measurements of absorbance for 350 s, one point per second. During the preliminary experiments, an appropriate concentration of HRP was chosen (8 ng/mL) in such a way that absorbance after 5 minutes at 5 mM oPD does not exceed 0.25, being in a linear range for DAP colorimetric detection. Background oPD oxidation was measured for each oPD concentration the same way as the enzymatic reaction, but with the HRP aliquot replaced by buffer. The resulting pairs of kinetic curves (with HRP and without) were processed to obtain the enzymatic reaction rate (see Appendix A for details). DAP concentration from A421 was calculated using the absorption coefficient of 15 560 М-1×cm-1 at pH = 6. The entire dataset of reaction rate versus oPD concentration was fitted by the Michaelis-Menten equation in Mathematica 10.2 (Wolfram Research) using a built-in NonlinearModelFit function with weight equal to inversed data variance at each oPD concentration.
4.5. Preparation of standard DAP solitions
DAP is hardly soluble in water (70 to 100 μM depending on a temperature), so its exact solution cannot be prepared by dissolving the weighted sample. Instead, an excess amount (around 20-30 mg) of DAP was added to 12 mL of water, stirred on a vortex mixer, and sonicated for 30 minutes in 40 W ultrasonic bath to create a saturated solution. After cooling to room temperature, the suspension was filtered through 0.22 μm PES syringe filter, with the first one mL being withdrawn. DAP concentration was measured colorimetrically at a five-fold dilution in water (to be in a linear range) at 421 nm, using the absorption coefficient of 15 560 М-1×cm-1. The resulting solution was stored in a dark place due to the light sensitivity of DAP and used the same day.
4.6. Procedure for SERS measurements
As long as the developed analytical procedure is proposed for broad usage, all the data provided in the paper were collected using the portable spectrometer i-Raman Pro BWS475-785H (BWTek, USA) with 785 nm excitation and 20× objective. For validation purposes during qualitative comparison of Raman or SER spectra, the second spectrometer, N’tegra Spectra (NT-MDT, Russia) with 785 nm excitation and 100× objective was used.
Twenty μL of sample was added to 20 μL of AgNPs (with the aggregation timer being started) and mixed by pipetting. A droplet of mixture (20 μL) was placed on the surface of thick Al foil. The focus of the spectrometer was positioned at the top of the droplet and then shifted 300 μm into the liquid. Two minutes after aggregation was started, the SER spectrum was acquired. To avoid detector saturation on samples with strongly different SERS intensities, spectrometer setups were chosen to be 0.5 s collection time with 30 automatically averaged repeats (15 s total collection time) at 135 mW power on the sample.
Buffers and media for different pHs were prepared from the following components: H2SO4 was diluted from concentrated acid; pH = 2 buffer was prepared from glycine and H2SO4 instead of more common HCl to avoid the influence of chloride on the SER signal; pH = 3 and 4 buffers were prepared from citric acid and trisodium citrate; pH = 5 buffer was prepared from acetic acid and sodium acetate; pH = 6 and 7 buffers were prepared from monosodium and disodium phosphates; pH = 9 buffer was prepared from boric acid and sodium tetraborate.
4.7. Colorimetric and SERS measurements of DAP at pH = 3
In order to minimize the amount of DAP formed in oPD solution due to spontaneous oxidation, only freshly dissolved oPD stocks were used. Samples containing DAP in 1 M citrate buffer (pH = 3) with 0.33 mM oPD were placed into 96-well polystyrene plate (Greiner, # 655080) in triple technical replicates (200 μL), mixed for 10 seconds for proper meniscus settling, and measured at 454 nm with a BioRad xMark plate reader. Alternatively, similar samples with lower DAP concentrations were used for SERS measurements. Each curve was independently repeated with another DAP stock, polystyrene plate, or AgNPs batch to obtain a realistic estimate of the data variance. Data was fitted in Mathematica 10.2 using the built-in LinearModelFit or NonlinearModelFit functions with weight equal to inversed data variance at each DAP concentration.
4.8. Colorimetric and SERS measurements of HRP
The substrate mixtures (1 mM oPD and 80 μM H2O2 in 100 mM citrate buffer, pH = 6 with 5 μg/mL of BSA to prevent HRP losses at low concentrations) were prepared in test tubes with the same precaution for oPD stock as for DAP measurement. The reaction was initiated by the addition of HRP aliquots. After ten minutes, the reaction was stopped by the addition of twice the volume of citrate buffer 1.5 M (pH = 3) and either placed into 96-well polystyrene plate in four technical replicates (200 μL), followed by measurement with the xMark plate reader, or used for SERS. Each curve was independently repeated with another oPD stock, HRP dilutions, polystyrene plate, or AgNPs batch to obtain a realistic estimate of the data variance. Data was fitted in Mathematica 10.2 the same way as for DAP.
4.9. Processing of Raman and SER spectra
For the presentation purposes, the polynomial background was subtracted from each spectrum using OPUS 7.0 software (Bruker Optik GmbH) ‘Baseline correction’ built-in function.
To extract quantitative information about band intensities from the SER spectra, two procedures were used in the current study (see Appendix G for additional figures).
The first one contains background correction only. It has been applied to spectra obtained under varying conditions (aggregating agent concentration optimization, pH selection, surface chloride optimization). First, two pieces were cut from each spectrum: 670-805 cm-1 for 733 cm-1 band and 1174-1740 cm-1 for 1374 cm-1 band (Figure A21a). Next, for each piece, two ranges for background estimation to the left and right from the desired band were chosen: 683-700, 794-805 cm-1 for 733 cm-1 and 1174-1214, 1695-1720 cm-1 for 1374 cm-1 (Figure A21b,c). A linear fit of the background was made for these ranges and subtracted from the cut pieces (Figure A21d,e). Finally, the intensities of the desired bands were taken at single pixels, corresponding to 733.28 and 1373.65 cm-1. For the curves obtained in H2SO4, the maximum intensity between 729.95 and 734.95 cm-1 was used because the position of the band experienced some shifts due to varying ratio of DAPH+ to DAPH22+.
The second procedure is more rigorous and was applied to the spectra obtained in optimized conditions only (DAP and HRP calibration curves). In this case, all the bands in the spectra have the same shape but vary in intensity. So an approach similar to quantitative Rietveld analysis of XRD diffractograms could be exploited to reduce the noise and extract weak signals. On a preliminary stage, using several spectra at a high DAP concentration (high signal-to-noise ratio), the desired and a few neighboring bands were fitted with either a general Pearson IV peak shape or a Gaussian for weak peaks. After that, these peak shapes were fixed and normalized to have unity intensity at their maximums (see equations in Appendix G). The non-negative linear superposition of these found peak shapes, together with the quadratic polynomial background, could be used to describe any spectrum obtained in optimized conditions. On the main stage, the same pieces of spectra as for the first procedure were fit with this superposition using a built-in NonlinearModelFit function in Mathematica 10.2 (Figure A22).
4.10. Statistical analysis
All calculations of statistical parameters were performed using the built-in functions of the Mathematica 10.2 package. Confidence intervals for mean values in replicate NTA measurements were estimated using Student t-distribution (MeanCI function) with a confidence level of 95%. A Mann-Whitney test (MannWhitneyTest function) was used for sample comparison. Differences were considered significant at p < 0.05.
Author Contributions
Conceptualization, E.G.E. and I.N.K.; methodology, E.G.E. and A.D.V.; validation, E.S.G., A.D.V., and L.V.Y.; formal analysis, E.G.E. and A.D.V.; investigation, E.G.E., E.S.G., A.D.V., and L.V.Y.; resources, I.N.K.; data curation, E.G.E., E.S.G., A.D.V., and L.V.Y.; writing—original draft preparation, E.G.E.; writing—review and editing, E.G.E., A.D.V., and I.N.K.; visualization, E.G.E.; supervision, I.N.K.; project administration, I.N.K.; funding acquisition, I.N.K. All authors have read and agreed to the published version of the manuscript.
Funding
This research was funded by the Russian Science Foundation, the project No. 22-14-00213.
Institutional Review Board Statement
Not applicable.
Informed Consent Statement
Not applicable.
Data Availability Statement
All the relevant data are provided in the main text or appendices.
Acknowledgments
The study was performed using equipment purchased under the M.V. Lomonosov Moscow State University development program.
Conflicts of Interest
The authors declare no conflict of interest.
Sample Availability
Not applicable.
Appendix A
This appendix contains additional information about the measurement of the HRP effective Michaelis constant for oPD. The colorimetric kinetic curves of DAP formation showed deviation from linearity both at short times (below 150 s) and after 300 s (Figure A1). We attribute deviations at the beginning of the curve to the formation of intermediates, which have been previously reported for this reaction [20,41].
Figure A1.
A pair of colorimetric kinetic curves with 8 ng/mL HRP, 80 μM H2O2, and 1 mM oPD in 100 mM sodium phosphate buffer (pH = 6.0). The segments 150 s – 300 s used for slope calculation are plotted with darker markers. End points at 350 s used for alternative rate estimation are plotted as large circle markers.
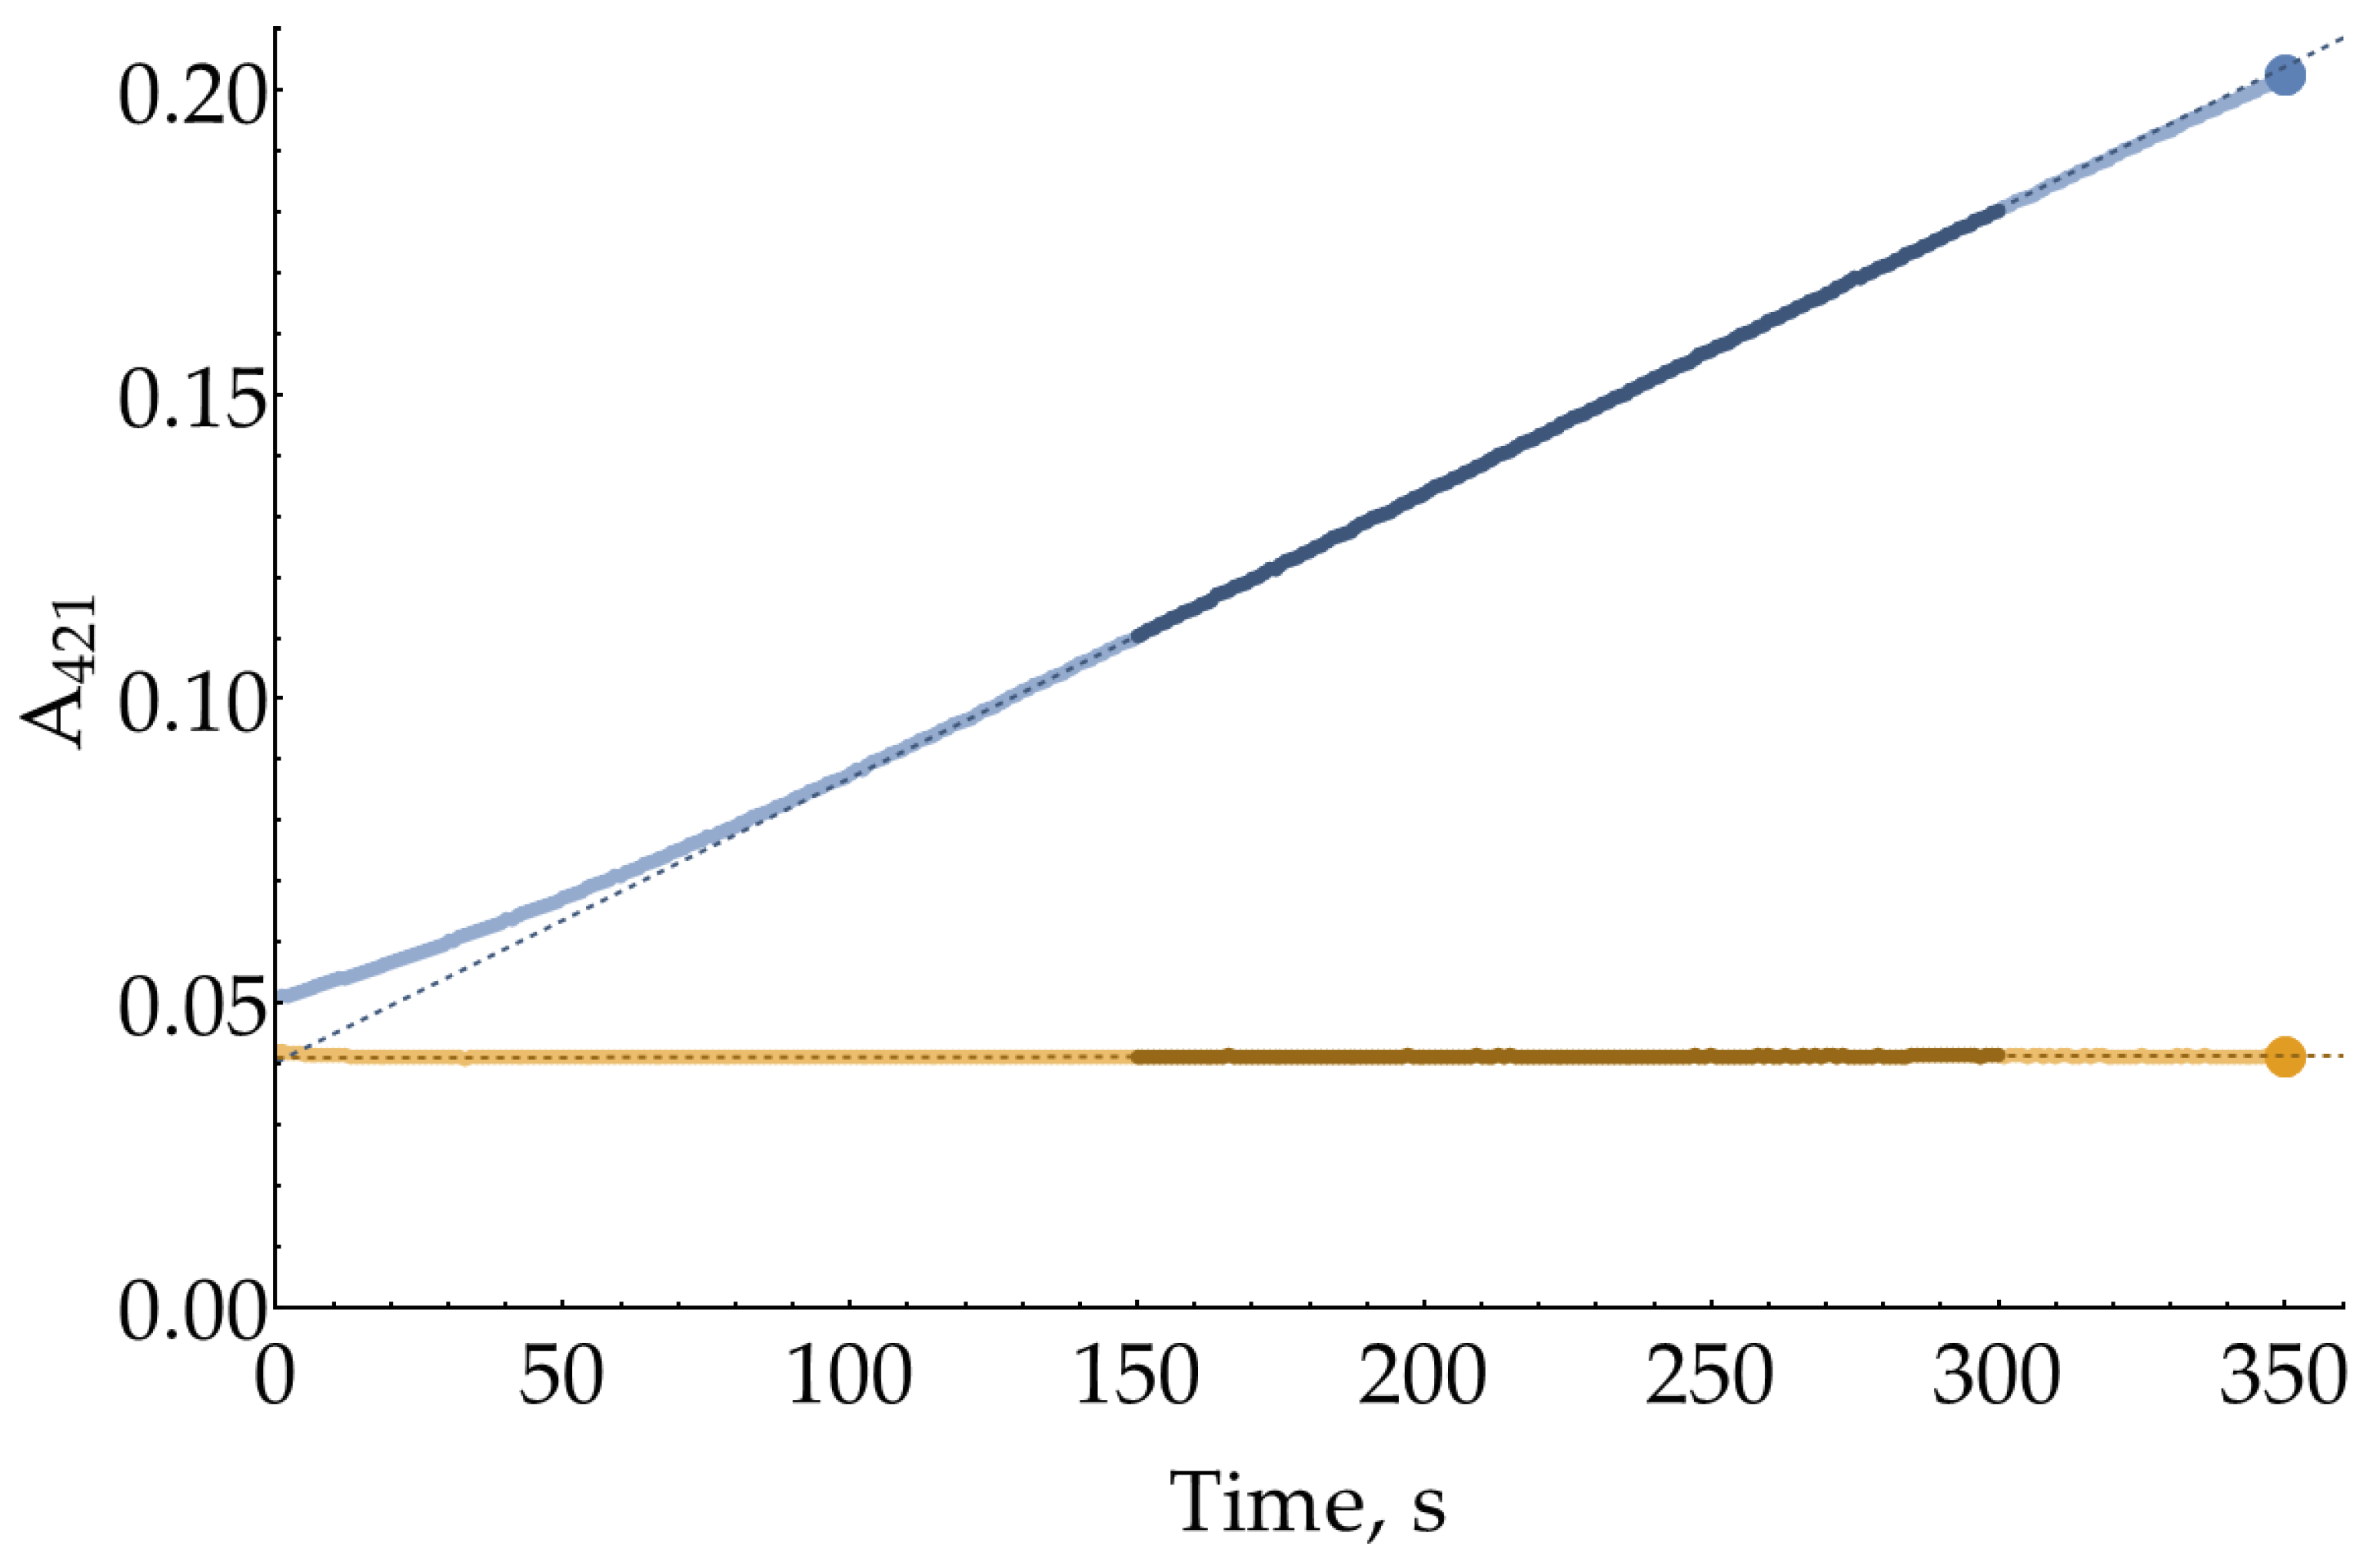
For Figure 1 and the estimation of effective KM for oPD in Section 2.2, the enzymatic reaction rate was calculated as difference between the slopes for enzymatic and non-enzymatic reactions using the linear segments between 150 and 300 s. Alternatively, the enzymatic reaction rate might be calculated using a difference between end points of the curves (350 s). This type of processing (Figure A2) results in 95% confidence interval for KM of 39 ± 3 μM, which is very close to the value calculated from slopes.
Figure A2.
The same curve as Figure 2, but reaction rates were calculated from the end points (350 s) of the kinetic curves. A solid line represents the best fit.
Figure A2.
The same curve as Figure 2, but reaction rates were calculated from the end points (350 s) of the kinetic curves. A solid line represents the best fit.
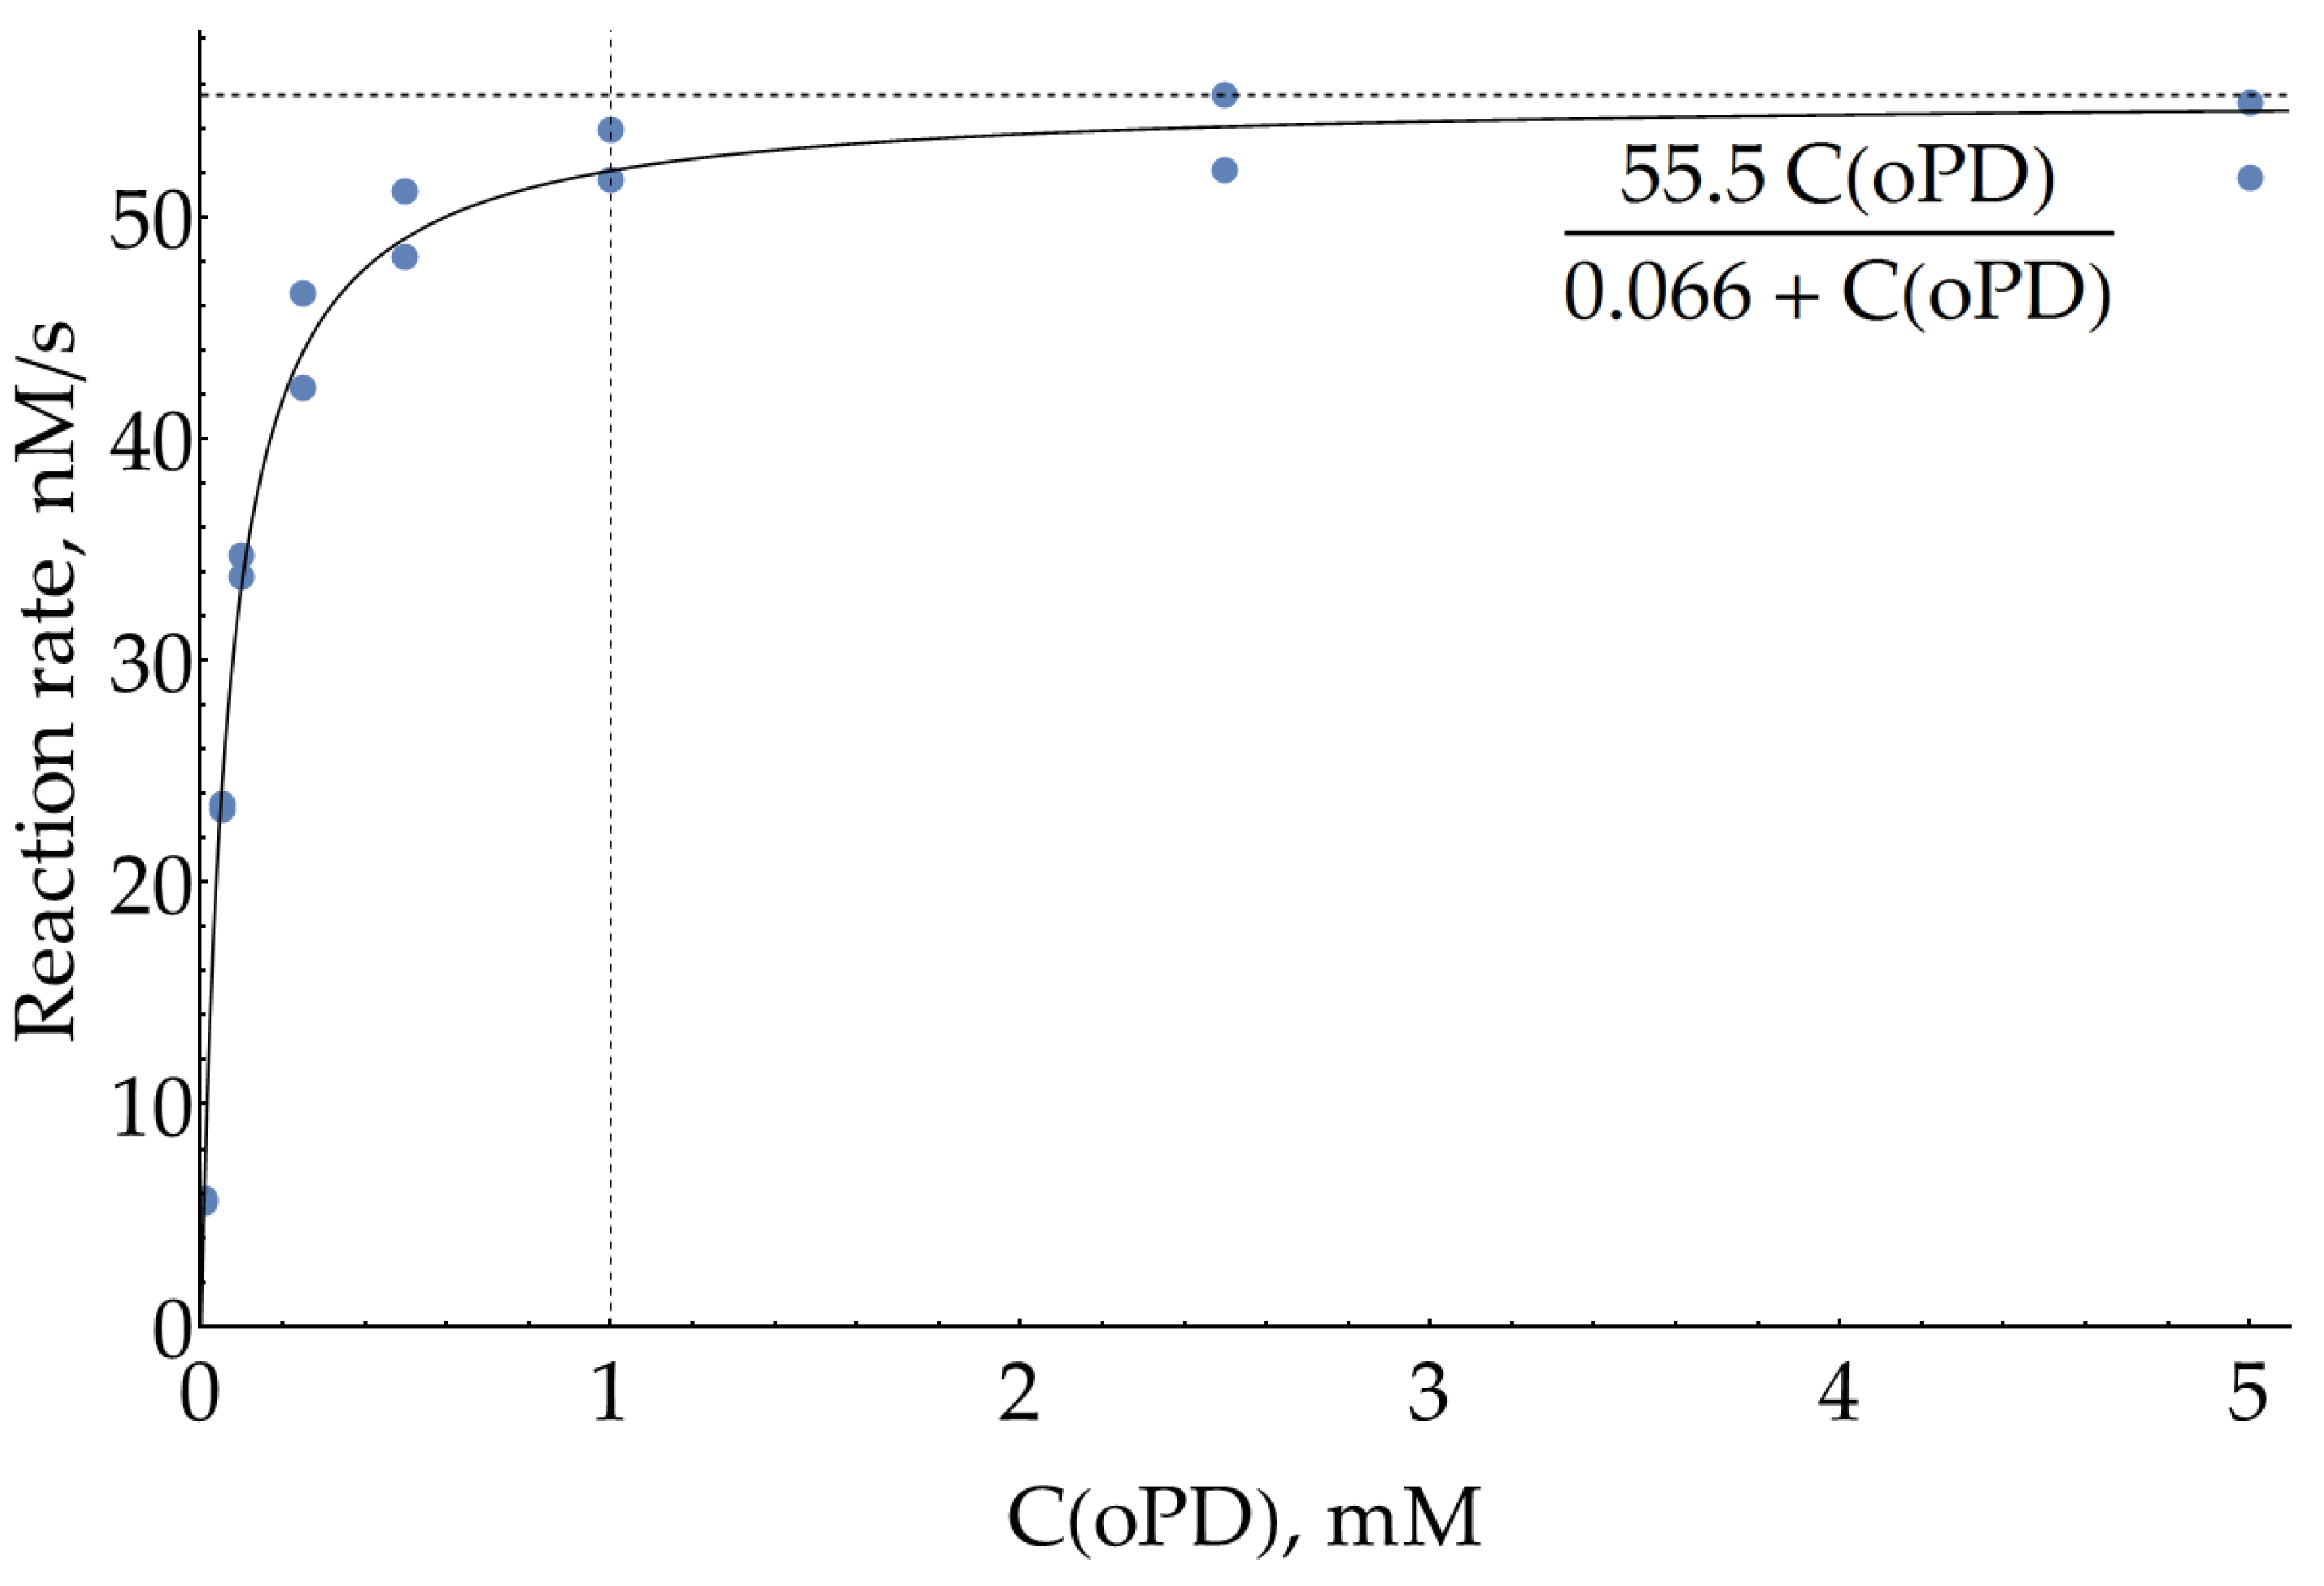
It is also worth mentioning that 80 μM of H2O2 is quite a low concentration, used in [23] to minimize the background oxidation of oPD. In case a slightly higher peroxide concentration would be required to increase the enzymatic reaction rate, the effective Michaelis constant was also measured at 150 μM of H2O2 (Figure A3). As expected from the Ping-pong Bi-Bi mechanism for HRP, effective KM for oPD increased up to 66 ±10 μM. But 1 mM of oPD is still around 15 × KM and may be considered a reasonable upper limit.
Figure A3.
Dependence of HRP enzymatic reaction rate on oPD concentration measured colorimetrically at 421 nm in 100 mM sodium phosphate buffer (pH = 6.0) with 8 ng/mL HRP and 150 μM H2O2. Reaction rates were calculated from the slopes of kinetic curves. A solid line represents the best fit.
Figure A3.
Dependence of HRP enzymatic reaction rate on oPD concentration measured colorimetrically at 421 nm in 100 mM sodium phosphate buffer (pH = 6.0) with 8 ng/mL HRP and 150 μM H2O2. Reaction rates were calculated from the slopes of kinetic curves. A solid line represents the best fit.
Appendix B
Previously, we reported that DAP has intense SER spectra with hydroxylamine silver sols in a broad range of pHs from 2 to 9 [21]. In this appendix, we confirm our previous findings and extend the range of pHs down to strongly acidic conditions. We provide all the DAP SER spectra (Figure A4) to serve as a reference for comparison throughout the paper. All spectra were recorded at a buffer concentration of 0.5 M except for borate at pH = 9.1, used at a concentration of 0.32 M due to the limited solubility of borax.
- ∗
- ∗
- ∗
- At pHs from 2 to 3, a dominant DAP form is DAPH+, with ring nitrogen being protonated as evidenced by XRD [38,39] instead of NH2- group as proposed by Brown and co-authors [30]. The SER spectrum of DAPH+ corresponds well with the normal Raman spectrum of crystalline DAP×HCl [21]. Notably, bands 733 and 773 cm-1 are strongly enhanced in the SER spectrum compared to normal Raman. DAPH+ is shaded light purple in Figure A4. The table of shifts is provided in [21].
- ∗
- At pHs from 0.3 to 2, the second protonation occurs in agreement with DAPH22+ pKa of around 1 [30]. According to the law of acid-base equilibrium, a relatively pure (>99%) acidic form appears at pH = pKa – 2 ≈ -1. Thus, the pure spectrum of DAPH22+ might be acquired in a concentrated acid only, which is not friendly to AgNPs. As a result, most of the bands present in the spectrum at pH ~ 0.3 may correspond to either DAPH+ or DAPH22+. However, two unique bands at 603 and 1389 cm-1 as well as the shoulder at around 439 cm-1 could be univocally assigned to DAPH22+. They are shaded light green in Figure A4.
Figure A4.
SER spectra (135 mW, 785 nm, 15 s total accumulation time) of 500 nM DAP with AgNPs in 5 mM NaCl at different pHs. In case any weak buffer bands (with a relative intensity of a few percent) were present in the control spectrum, they have been subtracted. The polynomial baseline was also subtracted from each spectrum. Shading: blue – DAP, purple – DAPH+, green – DAPH22+.
Appendix C
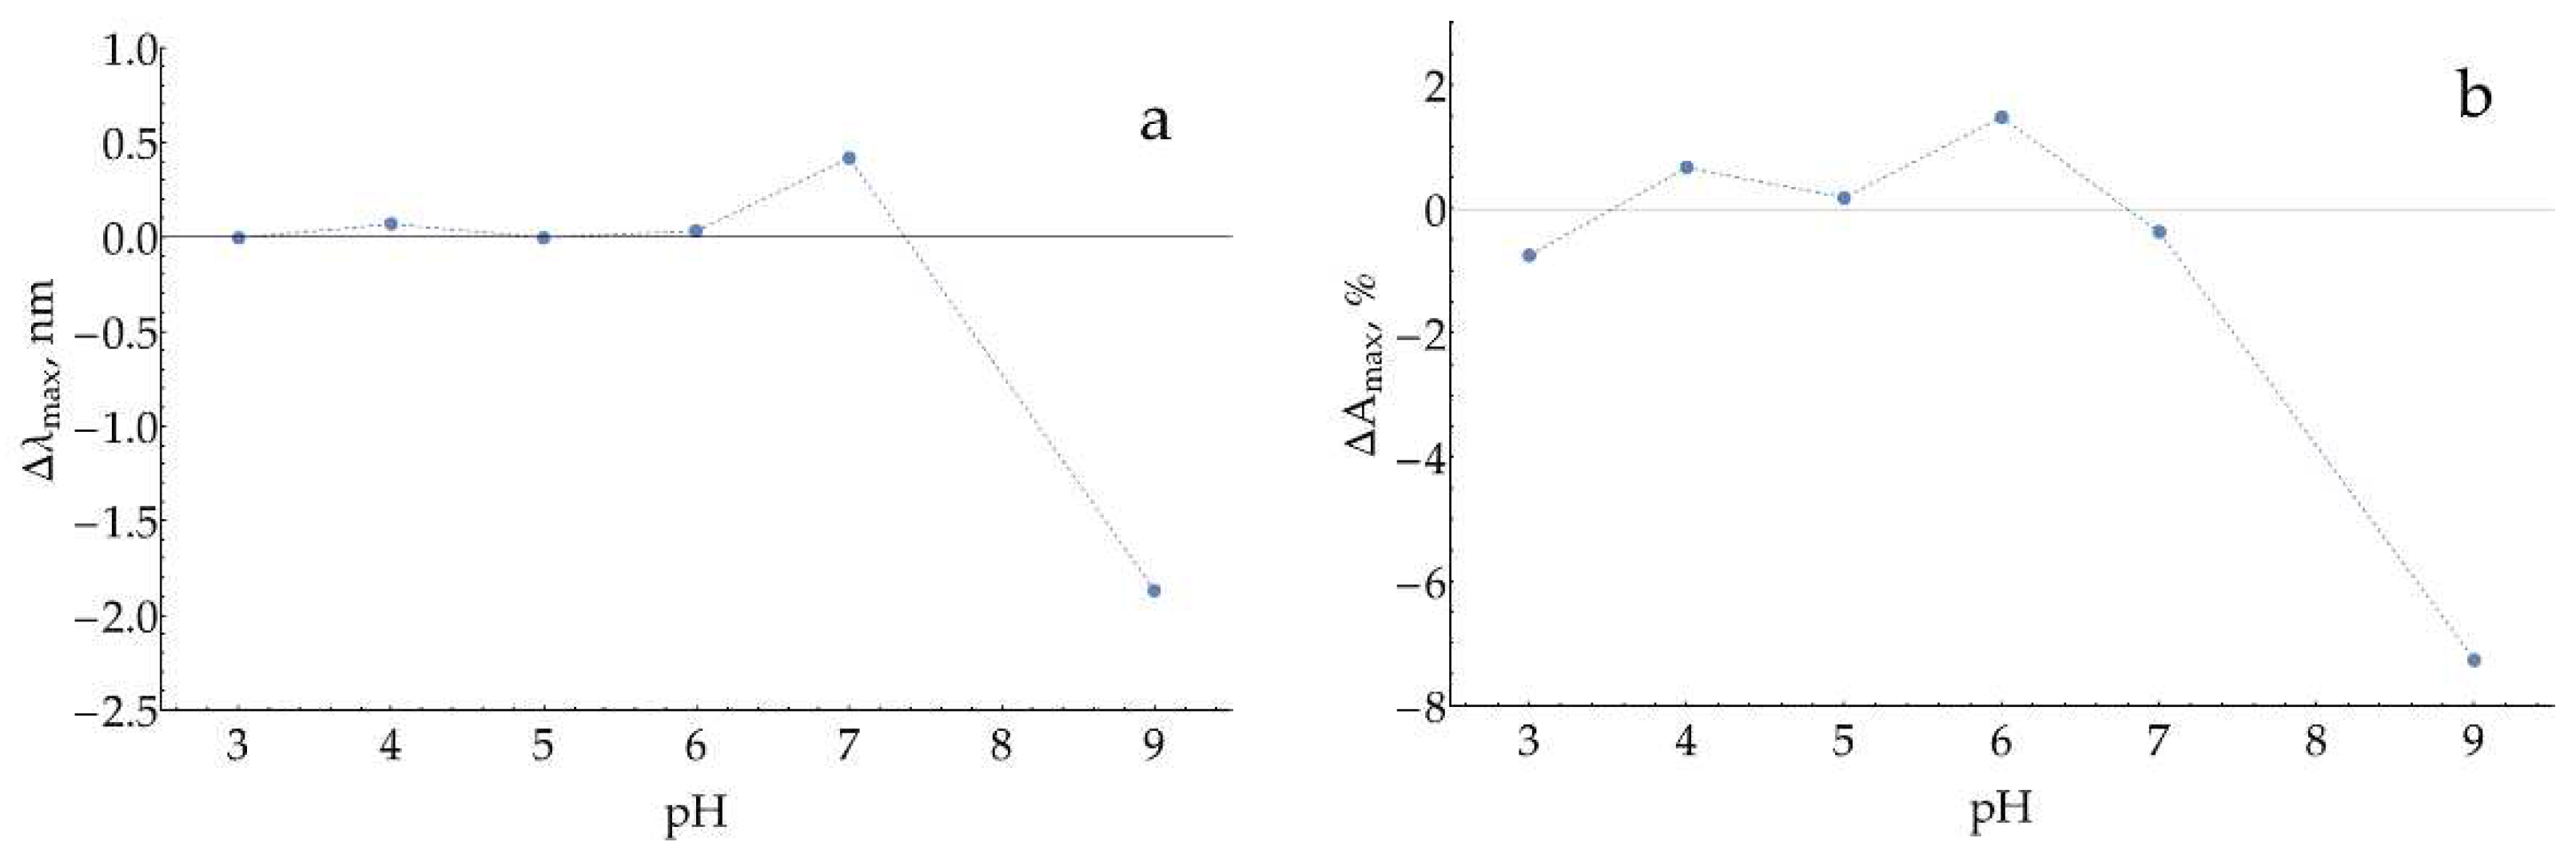
This appendix is devoted to the issue of potential AgNPs dissolution with unreacted H2O2 present in mixtures after the enzymatic reaction stage. This process was followed spectrophotometrically by measuring the parameters of AgNPs plasmonic absorption band. The position of maximum (λmax) is a measure of the mean particle size, and the absorption at maximum (Amax) is related to particle concentration.
First, for each buffer in our pH range, the maximum buffer concentration that did not cause AgNPs aggregation was estimated using the absence of changes in Amax and long-wavelength absorption (A500 and A600) as criteria. In all further experiments, lower buffer concentrations (see Table A1) were used to ensure that no particle aggregation occurred.

Table A1.
Buffers used to test the AgNPs dissolution with H2O2.
| pH | Buffer type and concentration |
|---|---|
| 3 | citrate 30 mM |
| 4 | acetate 30 mM |
| 5 | acetate 20 mM |
| 6 | MES 30 mM |
| 7 | HEPES 10 mM |
| 9 | borate 50 mM |
Next, for each pH, pairs of samples were compared after 10 minutes of incubation: (1) AgNPs in the buffer versus (2) AgNPs in the buffer with 100 μM of H2O2 (Figure A5). At pH = 9, a considerable decrease in both λmax and Amax were observed, which indicates the dissolution of nanoparticles.
Figure A5.
Changes in (a) the position of maximum and (b) the relative absorption at maximum for AgNPs (stabilized with 5 mM of NaCl) during 10 minutes of incubation with 100 μM H2O2 at different pHs.
Figure A5.
Changes in (a) the position of maximum and (b) the relative absorption at maximum for AgNPs (stabilized with 5 mM of NaCl) during 10 minutes of incubation with 100 μM H2O2 at different pHs.
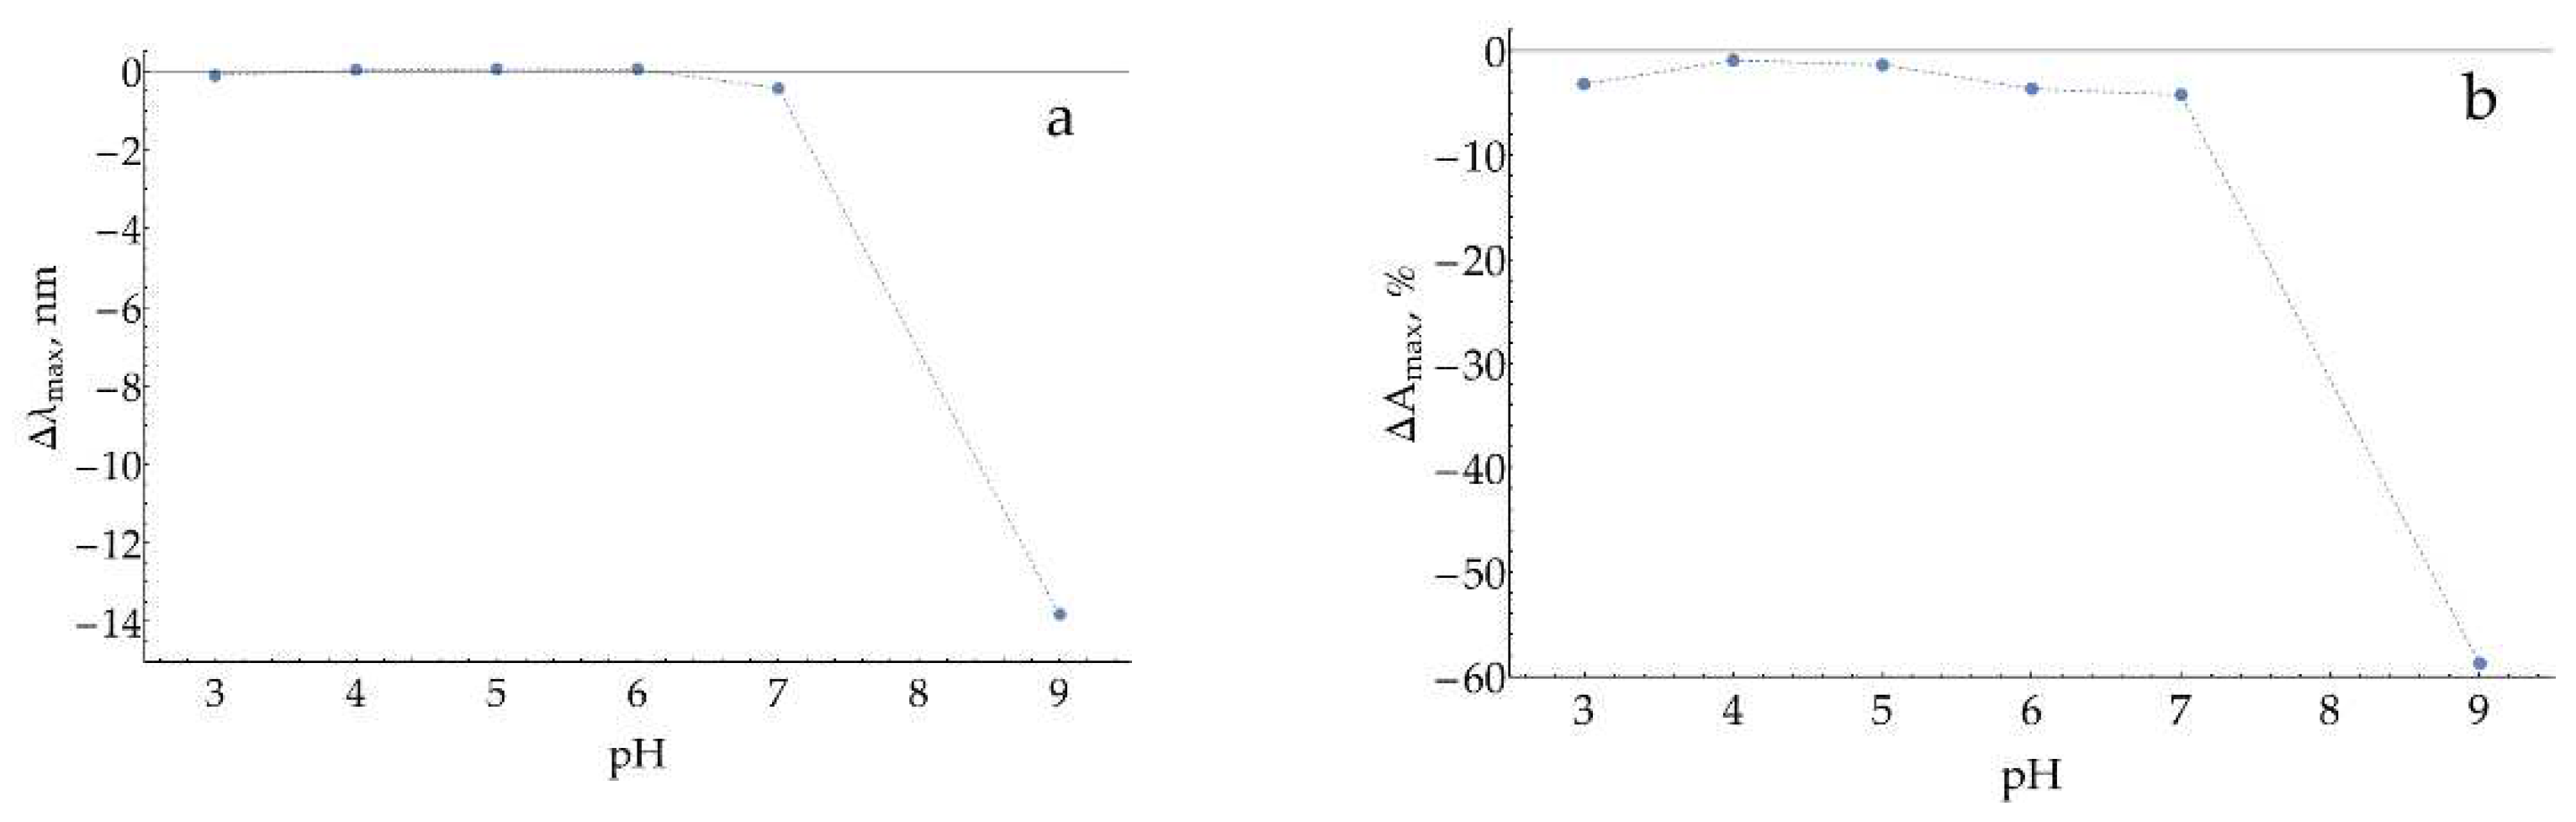
To verify our findings, the experiment was repeated with 1 mM of H2O2 (Figure A6). The observed effect was found to be dose-dependent, as expected for H2O2-caused AgNPs dissolution.
Figure A6.
Changes in (a) the position of maximum and (b) the relative absorption at maximum for AgNPs (stabilized with 5 mM of NaCl) during 10 minutes of incubation with 1 mM H2O2 at different pHs.
Figure A6.
Changes in (a) the position of maximum and (b) the relative absorption at maximum for AgNPs (stabilized with 5 mM of NaCl) during 10 minutes of incubation with 1 mM H2O2 at different pHs.
Thus, we may conclude that a considerable dissolution of AgNPs may occur at pH = 9 with the assay relevant H2O2 concentration of 100 μM, which might interfere with enzymatic product SERS detection.
Appendix D
o-Phenylenediamine is a substrate of the peroxidase reaction, which resulted in the formation of DAP, the key molecule of the present study. Thus, mixtures to be analyzed by SERS always contain small amounts of DAP and excess of oPD. Both molecules compete for binding with the surface of silver nanoparticles. Deep understanding of oPD SERS behavior facilitates rational improvements in DAP detection procedures in such mixtures. Here we discuss our findings together with published data to create a holistic picture of this behavior.
D.1. Normal Raman spectra of oPD
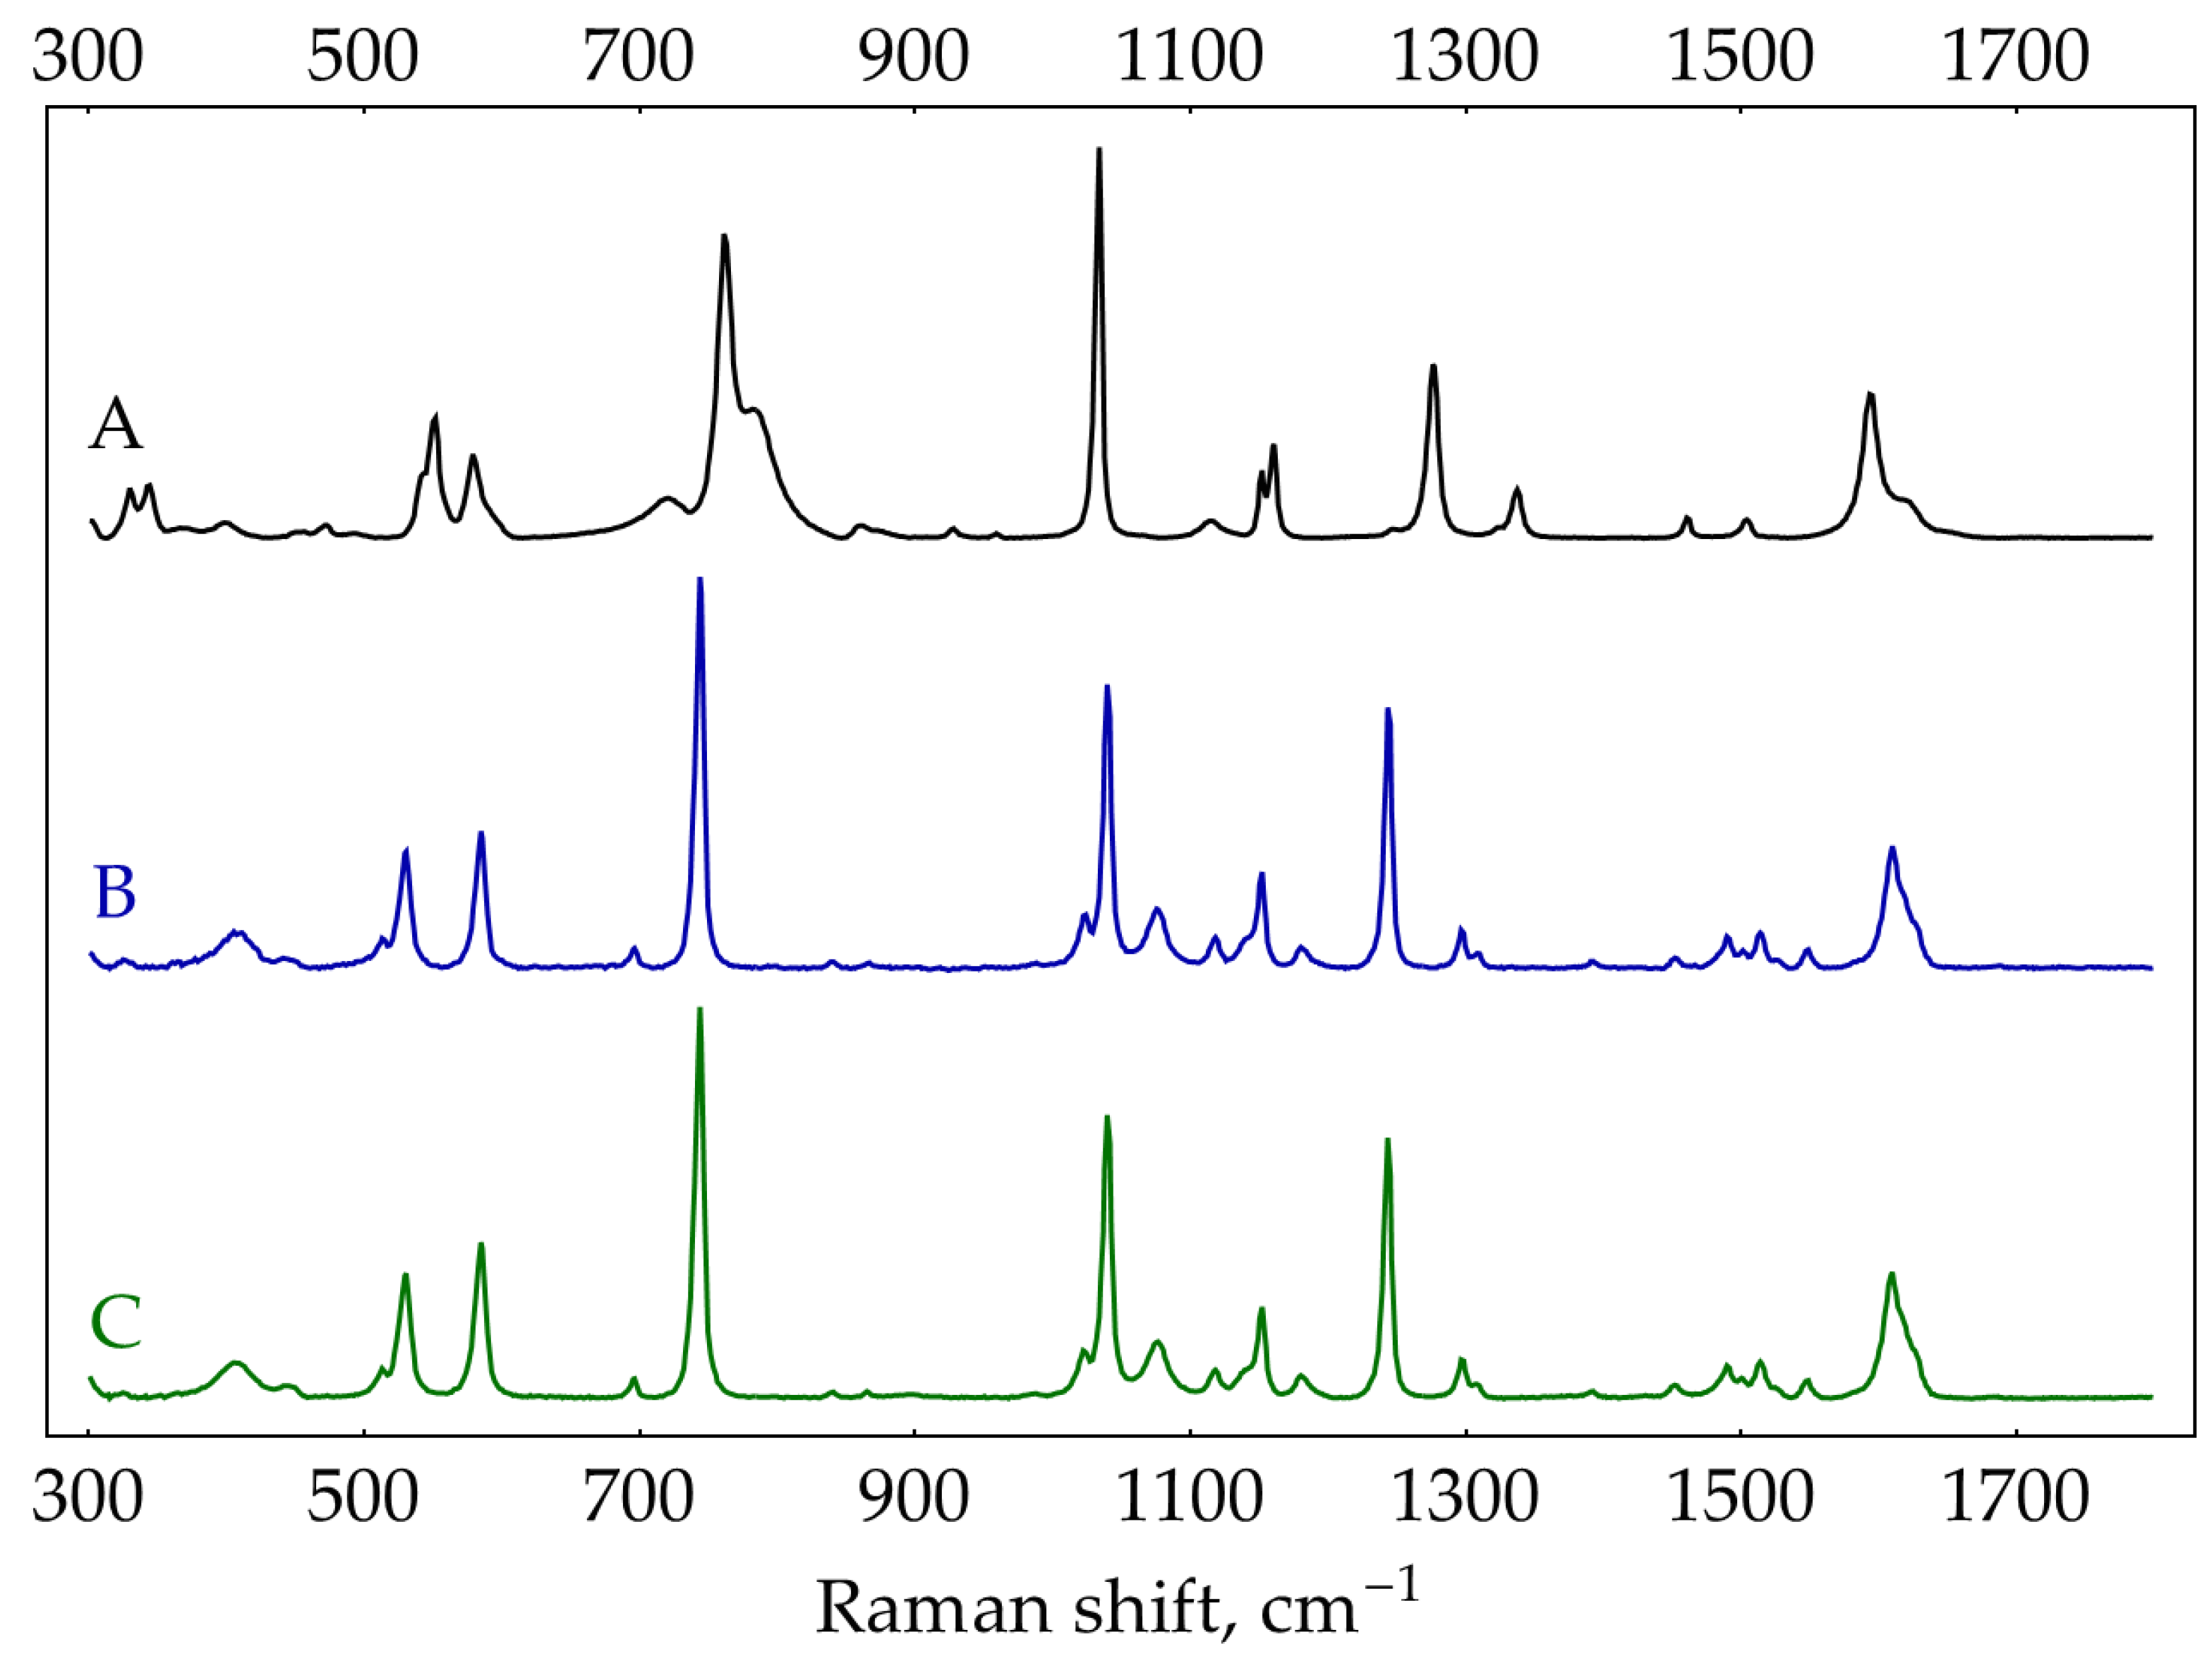
First, normal Raman spectra were recorded for the crystalline oPD (Sigma P-9029) and oPD dihydrochloride (oPD∙2HCl, 98%+, Alfa Aesar J60354) with 785 nm excitation (Figure A7). The spectrum of oPD agrees well with previously reported data obtained with 514.5 or 647.1 nm excitation [24], 976 nm FT-Raman [42], and 532 nm excitation [43]. Our spectrum of commercial oPD∙2HCl substantially differs from the one synthesized by Koh, et al. [24]. To clarify this discrepancy, we have synthesized oPD∙2HCl from oPD according to [44]. Briefly, excess oPD was added to concentrated HCl (density 1.19 g/cm3) and heated to 95˚C for at least 30 minutes. Undissolved oPD was separated by short centrifugation (1 minute, 3000 rpm). A slightly pink-colored supernatant was cooled to +4˚C. White crystals were separated, washed with cold concentrated HCl, and dried under vacuum (< 1 mTorr) for 1.5 hours. The normal Raman spectrum of this oPD∙2HCl was identical to the commercial Alfa Aesar reagent (Figure A7). Thus, there must be some issue with the spectrum of solid oPD∙2HCl reported in [24]. Most likely, it corresponds to hydrochloride oPD∙HCl rather than dihydrochloride oPD∙2HCl.
Figure A7.
Normal Raman spectra from solids: (A) oPD Sigma P-9029 (75 mW, 785 nm, 15 s accumulation time); (B) oPD∙2HCl Alfa Aesar J60354 (240 mW, 785 nm, 15 s accumulation time); (C) synthesized oPD∙2HCl (same acquisition conditions as B).
Figure A7.
Normal Raman spectra from solids: (A) oPD Sigma P-9029 (75 mW, 785 nm, 15 s accumulation time); (B) oPD∙2HCl Alfa Aesar J60354 (240 mW, 785 nm, 15 s accumulation time); (C) synthesized oPD∙2HCl (same acquisition conditions as B).
Providing trustworthy information about the vibrational bands of particular molecules, Raman spectra from solid substances may not be straightforward to compare to SER spectra due to several complications:
- Raman spectra from solids may contain lattice modes;
- Some shifts in band positions and intensities may occur due to interactions between molecules in the crystal;
- For anisotropic crystals, slight shifts in band positions and possibly large changes in relative intensities may occur due to preferred crystal orientation [45].
The Raman spectrum from water solution, typically with a lower signal-to-noise ratio compared to one from solid, nevertheless provides additional insights into the vibrational bands of the molecule in the well-separated and surrounded by solvent state. On the other hand, interpretation of solution Raman spectra should be made under consideration of equilibriums between various forms of the target molecule (e.g., acid-base equilibrium).
Thus, prior to the assignment of solution spectra, we have theoretically estimated which forms of oPD preferably exist in different water solutions. According to [34], oPDH22+ has an apparent pKa,1 = 1.70 and an apparent pKa,2 = 4.55. Under the simplest model, which assigns all activity coefficients to 1, we calculated the fraction of each oPD form in solution at different pHs (Figure A8) as well as pHs for oPD∙HCl and oPD∙2HCl solutions (Table A2). The pH of oPD in water is assumed to be around 6 due to atmospheric CO2.
Figure A8.
Theoretical fractions of oPD forms at different pHs, assuming unity activity coefficients.
Figure A8.
Theoretical fractions of oPD forms at different pHs, assuming unity activity coefficients.
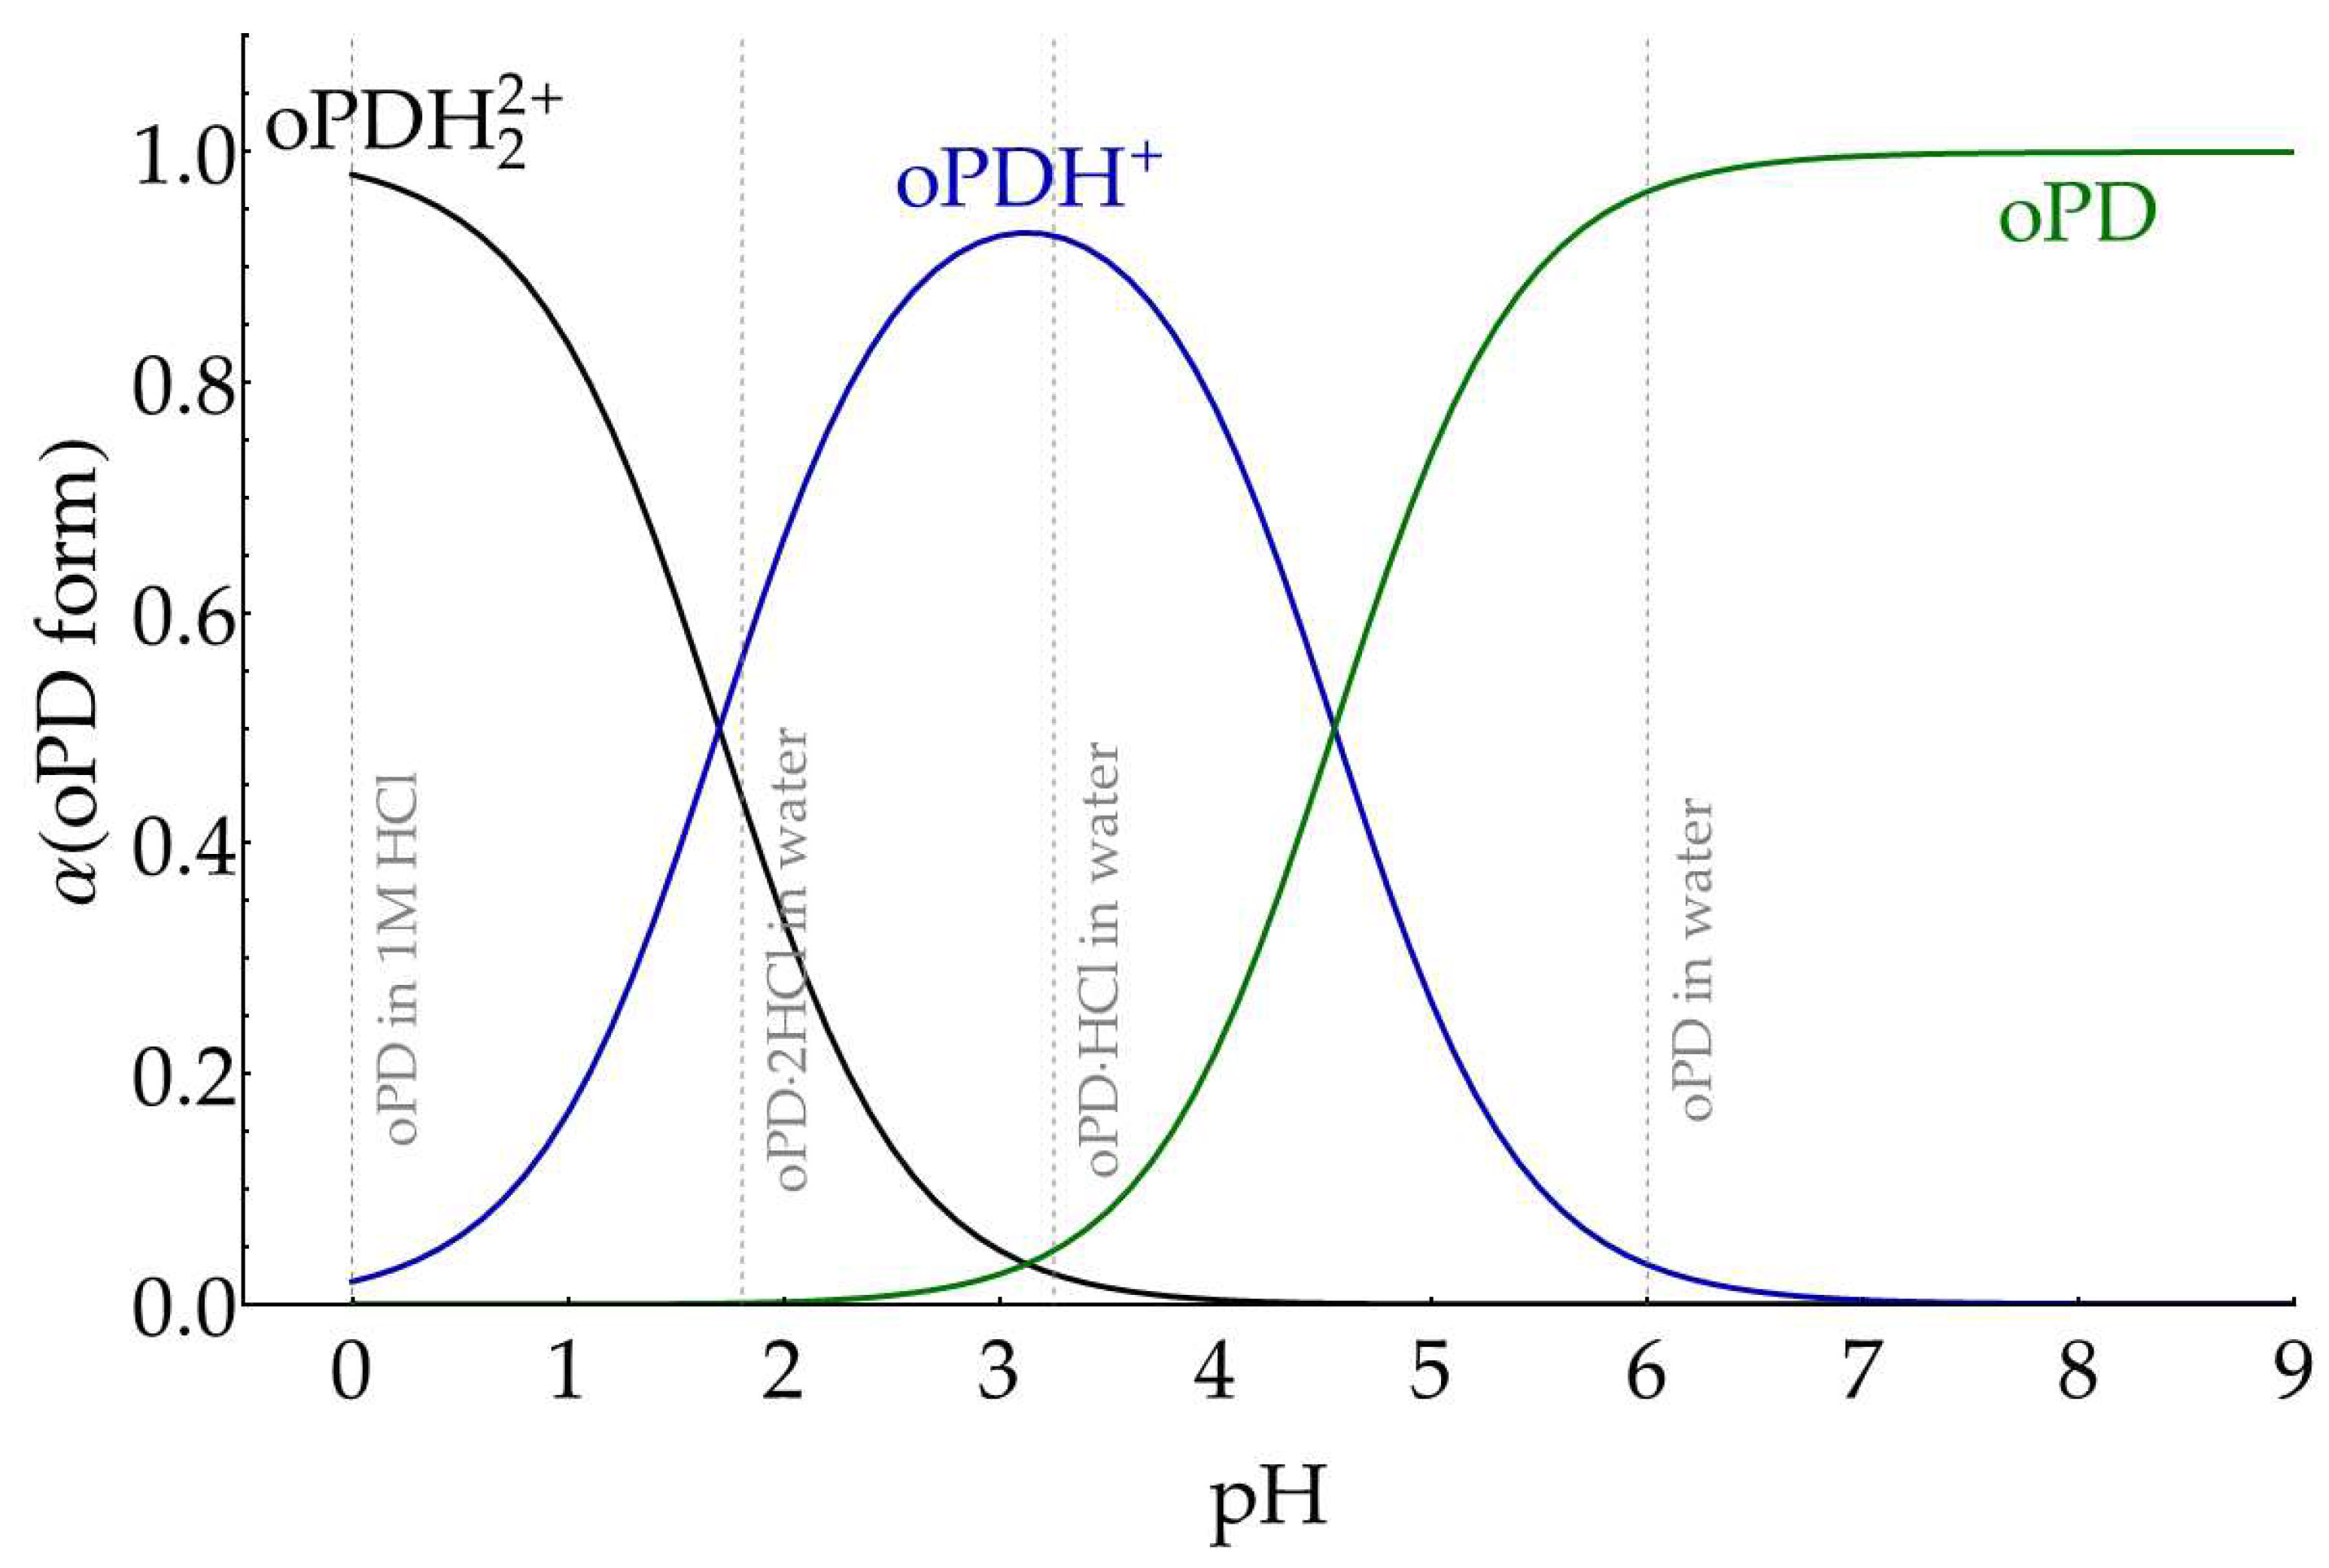
Table A2.
Calculated pHs and fractions of oPD forms in different solutions at total oPD concentration of 27.7 mM.
Table A2.
Calculated pHs and fractions of oPD forms in different solutions at total oPD concentration of 27.7 mM.
| System | pH | α (oPDH22+), % | α (oPDH+), % | α (oPD), % |
|---|---|---|---|---|
| oPD in 1 M HCl | 0 | 98 | 2 | 0 |
| oPD∙2HCl in water | 1.8 | 44 | 56 | 0 |
| oPD∙HCl in water | 3.3 | 2.5 | 93 | 4.5 |
| oPD in water | ≈6 | 0 | 3 | 97 |
According to the provided estimations, we expect that the spectrum of oPD in water is dominated by neutral form, oPD∙HCl in water – mostly oPDH+, oPD∙2HCl in water – the mixture of both oPDH22+ and oPDH+, oPD in 1 M HCl – mostly oPDH22+.
These four solutions were prepared: (1) 27.7 mM of oPD in water, (2) 27.7 mM of oPD + 27.7 mM HCl, (3) 27.7 mM of oPD + 55.4 mM HCl, (4) 27.7 mM of oPD in 1 M HCl. Ten Raman spectra with a 30 s collection time each were acquired at 785 nm and 300 mW. Each set of spectra was averaged and subtracted by averaged blanks (water, 27.7 mM HCl, 55.4 mM HCl, and 1 M HCl, respectively). The resulting spectra are shown in Figure A9.
Figure A9.
Normal Raman spectra (300 mW, 785 nm, 300 s total accumulation time, solvent background subtracted) of 27.7 mM water solutions of: (A) oPD; (B) oPD∙HCl; (C) oPD∙2HCl; (D) oPD in 1 M HCl.
Figure A9.
Normal Raman spectra (300 mW, 785 nm, 300 s total accumulation time, solvent background subtracted) of 27.7 mM water solutions of: (A) oPD; (B) oPD∙HCl; (C) oPD∙2HCl; (D) oPD in 1 M HCl.
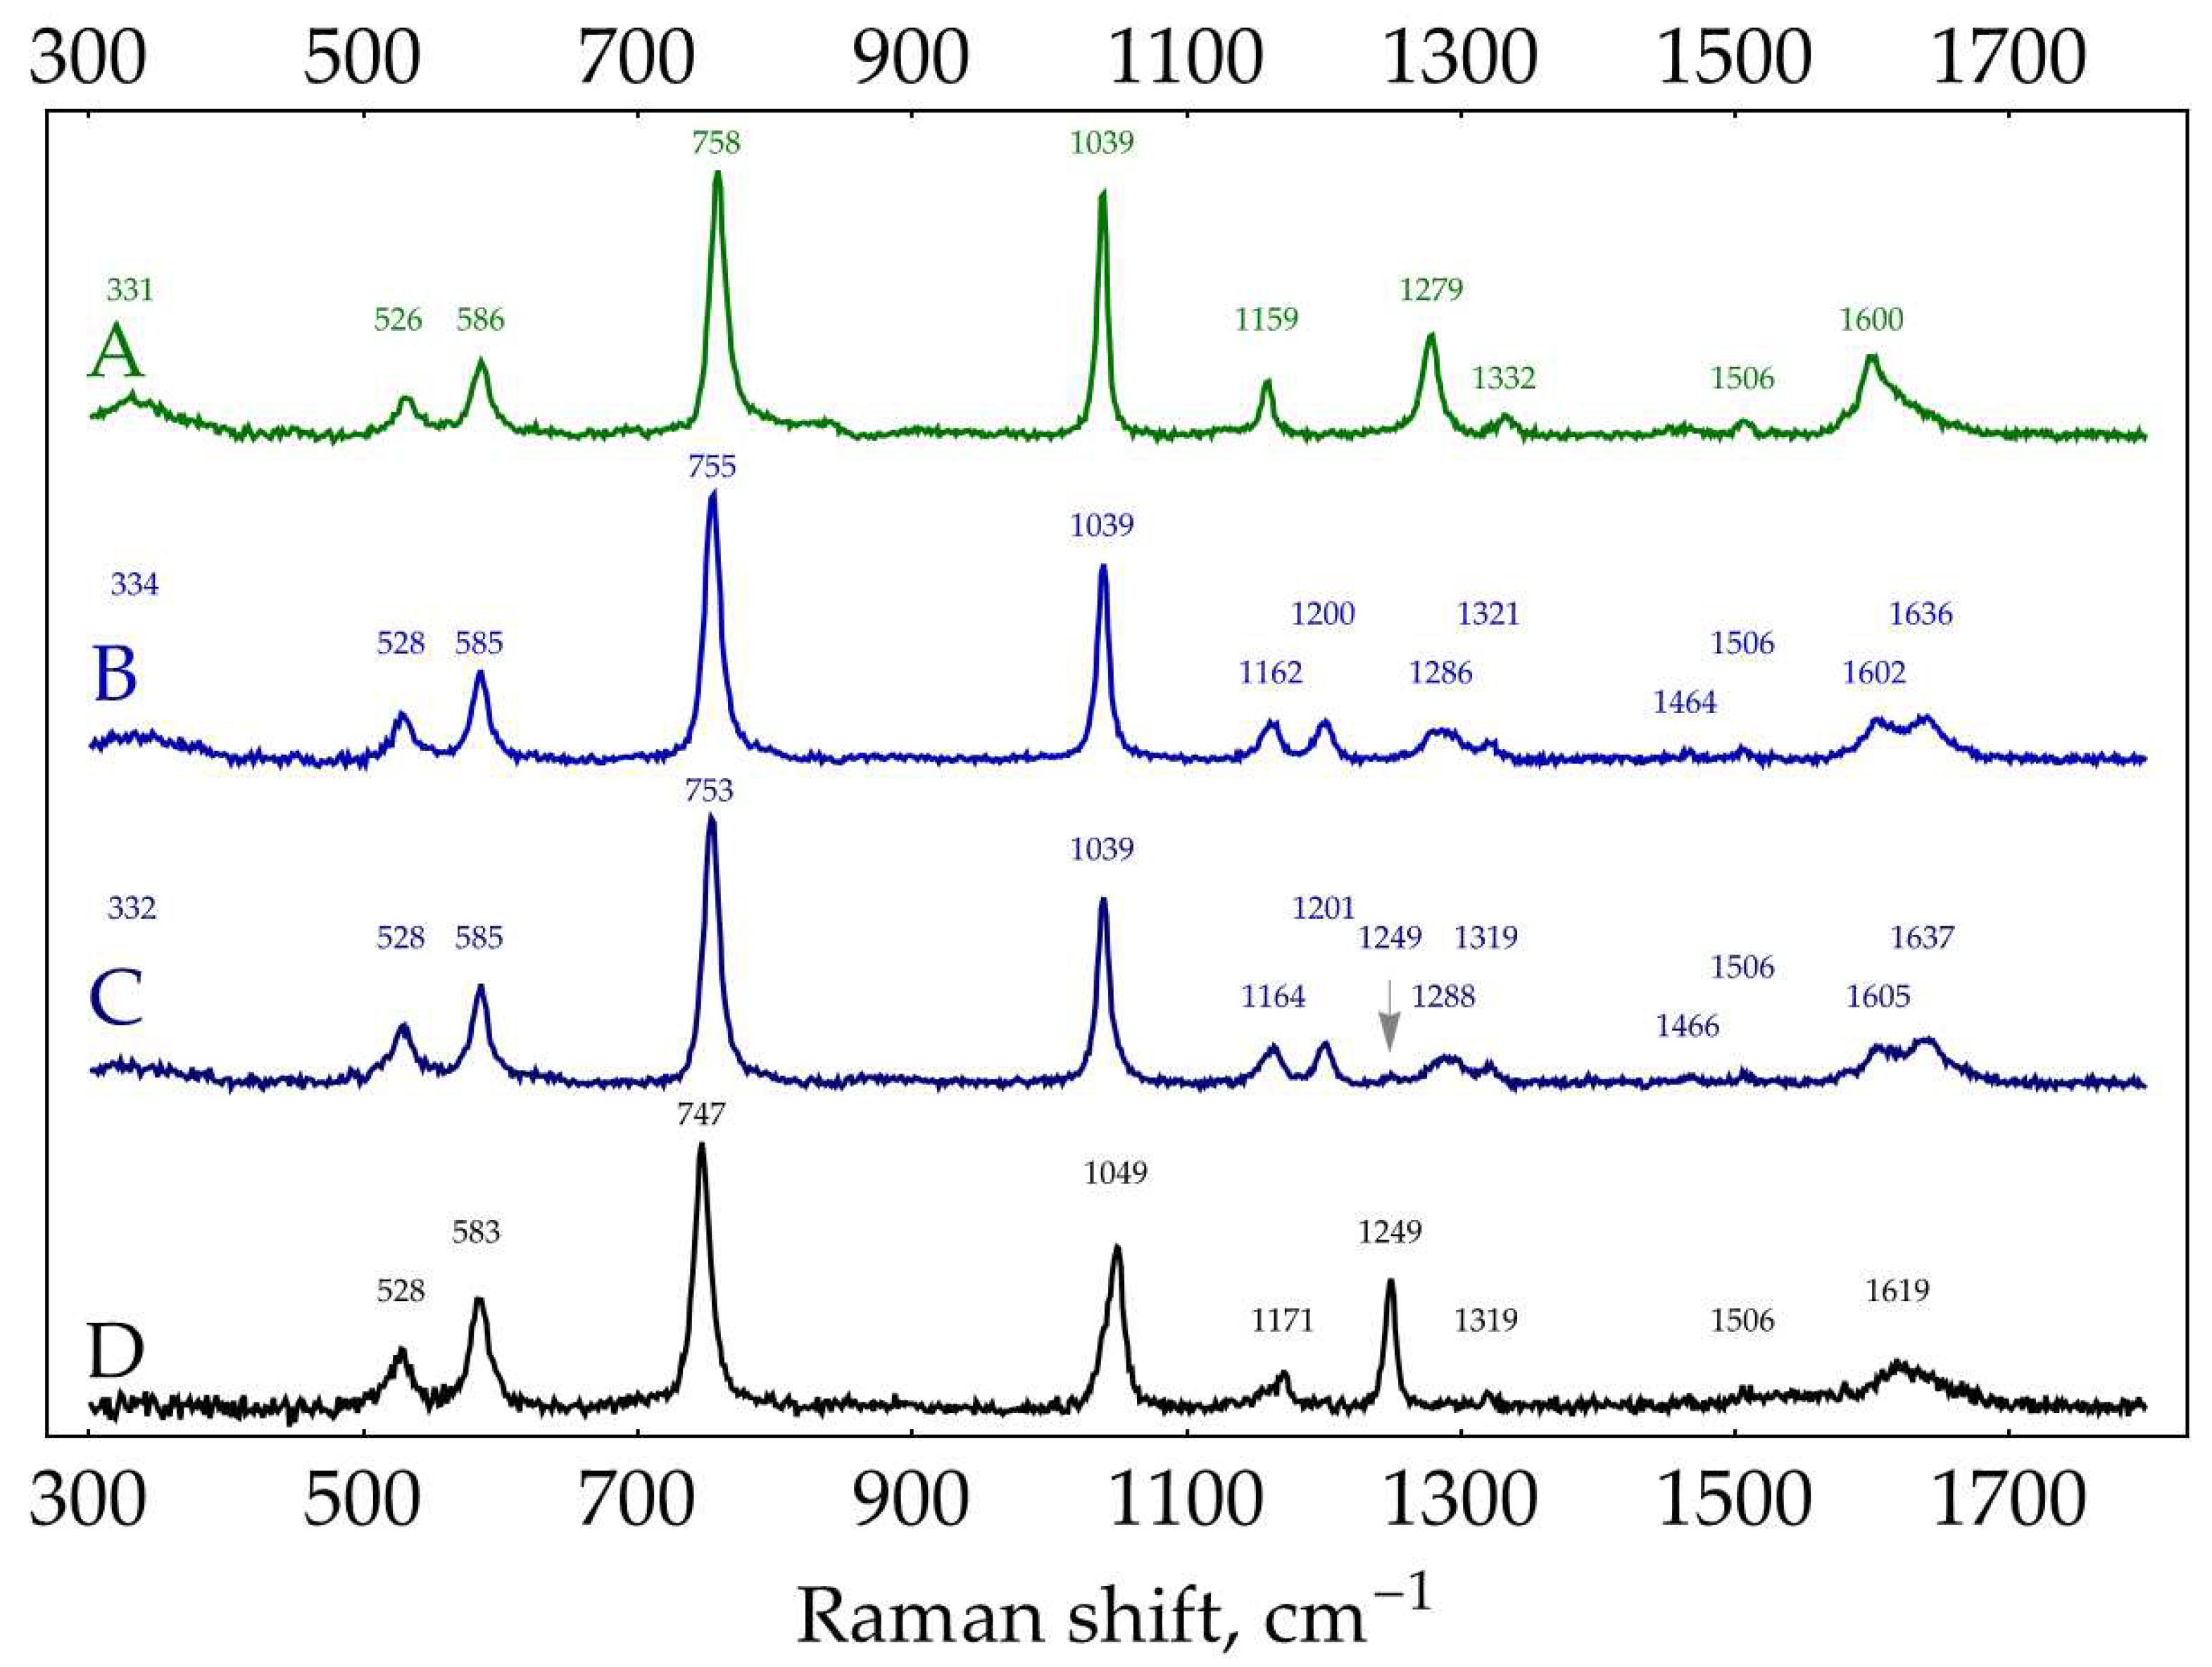
Normal Raman spectra of solid oPD and oPD solution show adequate correspondence (neutral oPD) as well as solid oPD∙2HCl and oPD solution in 1 M HCl (oPDH22+). The water solution spectra of both oPD∙HCl and oPD∙2HCl at 27.7 mM closely resemble each other, as does the spectrum of solid ‘oPD∙2HCl’ reported by Koh, et al. [24]. Although the oPD∙2HCl solution spectrum should be a mixture of two forms, oPDH22+ seemingly has around 30% lower Raman cross-section compared to oPDH+ (the absolute intensity of 755 cm-1 band of oPDH+ was 312 counts versus 209 counts for 747 cm-1 band of oPDH22+ at identical concentrations and spectrometer setups). Thus, the presence of oPDH22+ in the water solution spectrum of oPD∙2HCl resulted in a weak band at 1249 cm-1 (marked with an arrow in Figure A9) and a slight shift of the 755 cm-1 band to 753 cm-1.
Conclusions on the Raman spectra of oPD:
- The Raman spectrum of oPD∙HCl water solution (spectrum B in Figure A9) could be used as a reference for oPDH+ form.
D.2. SER spectra of oPD on AgNPs
SER spectra of oPD on AgNPs are quite complicated and probably deserve a dedicated paper. However, in this subsection, we will try to understand them just enough for rational analytical applications of oPD and DAP SERS. These data might also be used as a starting point for further fundamental research on oPD SERS.
First, oPD SER spectra were acquired at pH range from 0.3 to 9.1 and three different oPD concentrations: 0.1, 1, and 10 mM. AgNPs stabilized by 5 mM NaCl were used as a SERS substrate. Concentrations of all buffers/media were 0.5 M, except for the 0.32 M borate with pH = 9.1 due to the limited solubility of borax. Silver sol was mixed with oPD in a buffer in a 1:1 ratio and incubated for 2 minutes for particle aggregation, followed by the acquisition of SER spectra from a 20 μL droplet. For oPD concentrations of 1 and 10 mM, bands of buffers/media were negligible; for 0.1 mM, a very weak spectrum of buffer/medium was subtracted from the oPD one for clarity. Acquired SER spectra of oPD are provided in Figure A10, Figure A11 and Figure A12. This set of spectra is complicated, showing both pH- and concentration dependence with multiple species involved.
In order to rationalize all these spectra, two more pieces of data are required. The first is a set of spectra for DAP at different pHs (Figure A4). The second piece is the set of SER spectra of 0.1 mM oPD, similar to Figure A12 but obtained with AgNPs in the media, containing 3 mM NaCl, 2 mM oNH2OH∙HCl, and 3 mM NaOH (Figure A13). Total Cl- concentration is 5 mM (3 from NaCl and 2 from NH2OH∙HCl). Hydroxylamine is added as a strong reducing agent. In order to be the one, pH should be alkaline. Two mM of NaOH out of three is used to neutralize the HCl from hydroxylamine hydrochloride, and 1 mM remains, creating a pH > 10. Thus, under these conditions, all the silver is reduced to metal, even in the presence of air oxygen. Unfortunately, hydroxylamine is unstable and slowly decomposes. These ‘reduced sols’ were used not more than 1.5 hours after the preparation. It should also be mentioned that 1 mM of NaOH is negligible compared to 0.5/0.32 M of buffer/medium used for aggregation and does not affect the pH upon SER spectra acquisition.
Figure A10.
SER spectra (135 mW, 785 nm, 15 s total accumulation time) of 10 mM oPD on AgNPs in 5 mM NaCl at different pHs. The polynomial baseline was subtracted from each spectrum. Black lines represent original spectra, red lines – multiplied ones for visual clarity. Shading: grey – neutral oPD, orange and yellow – oxidation products of oPD, purple – DAPH+, green – DAPH22+.
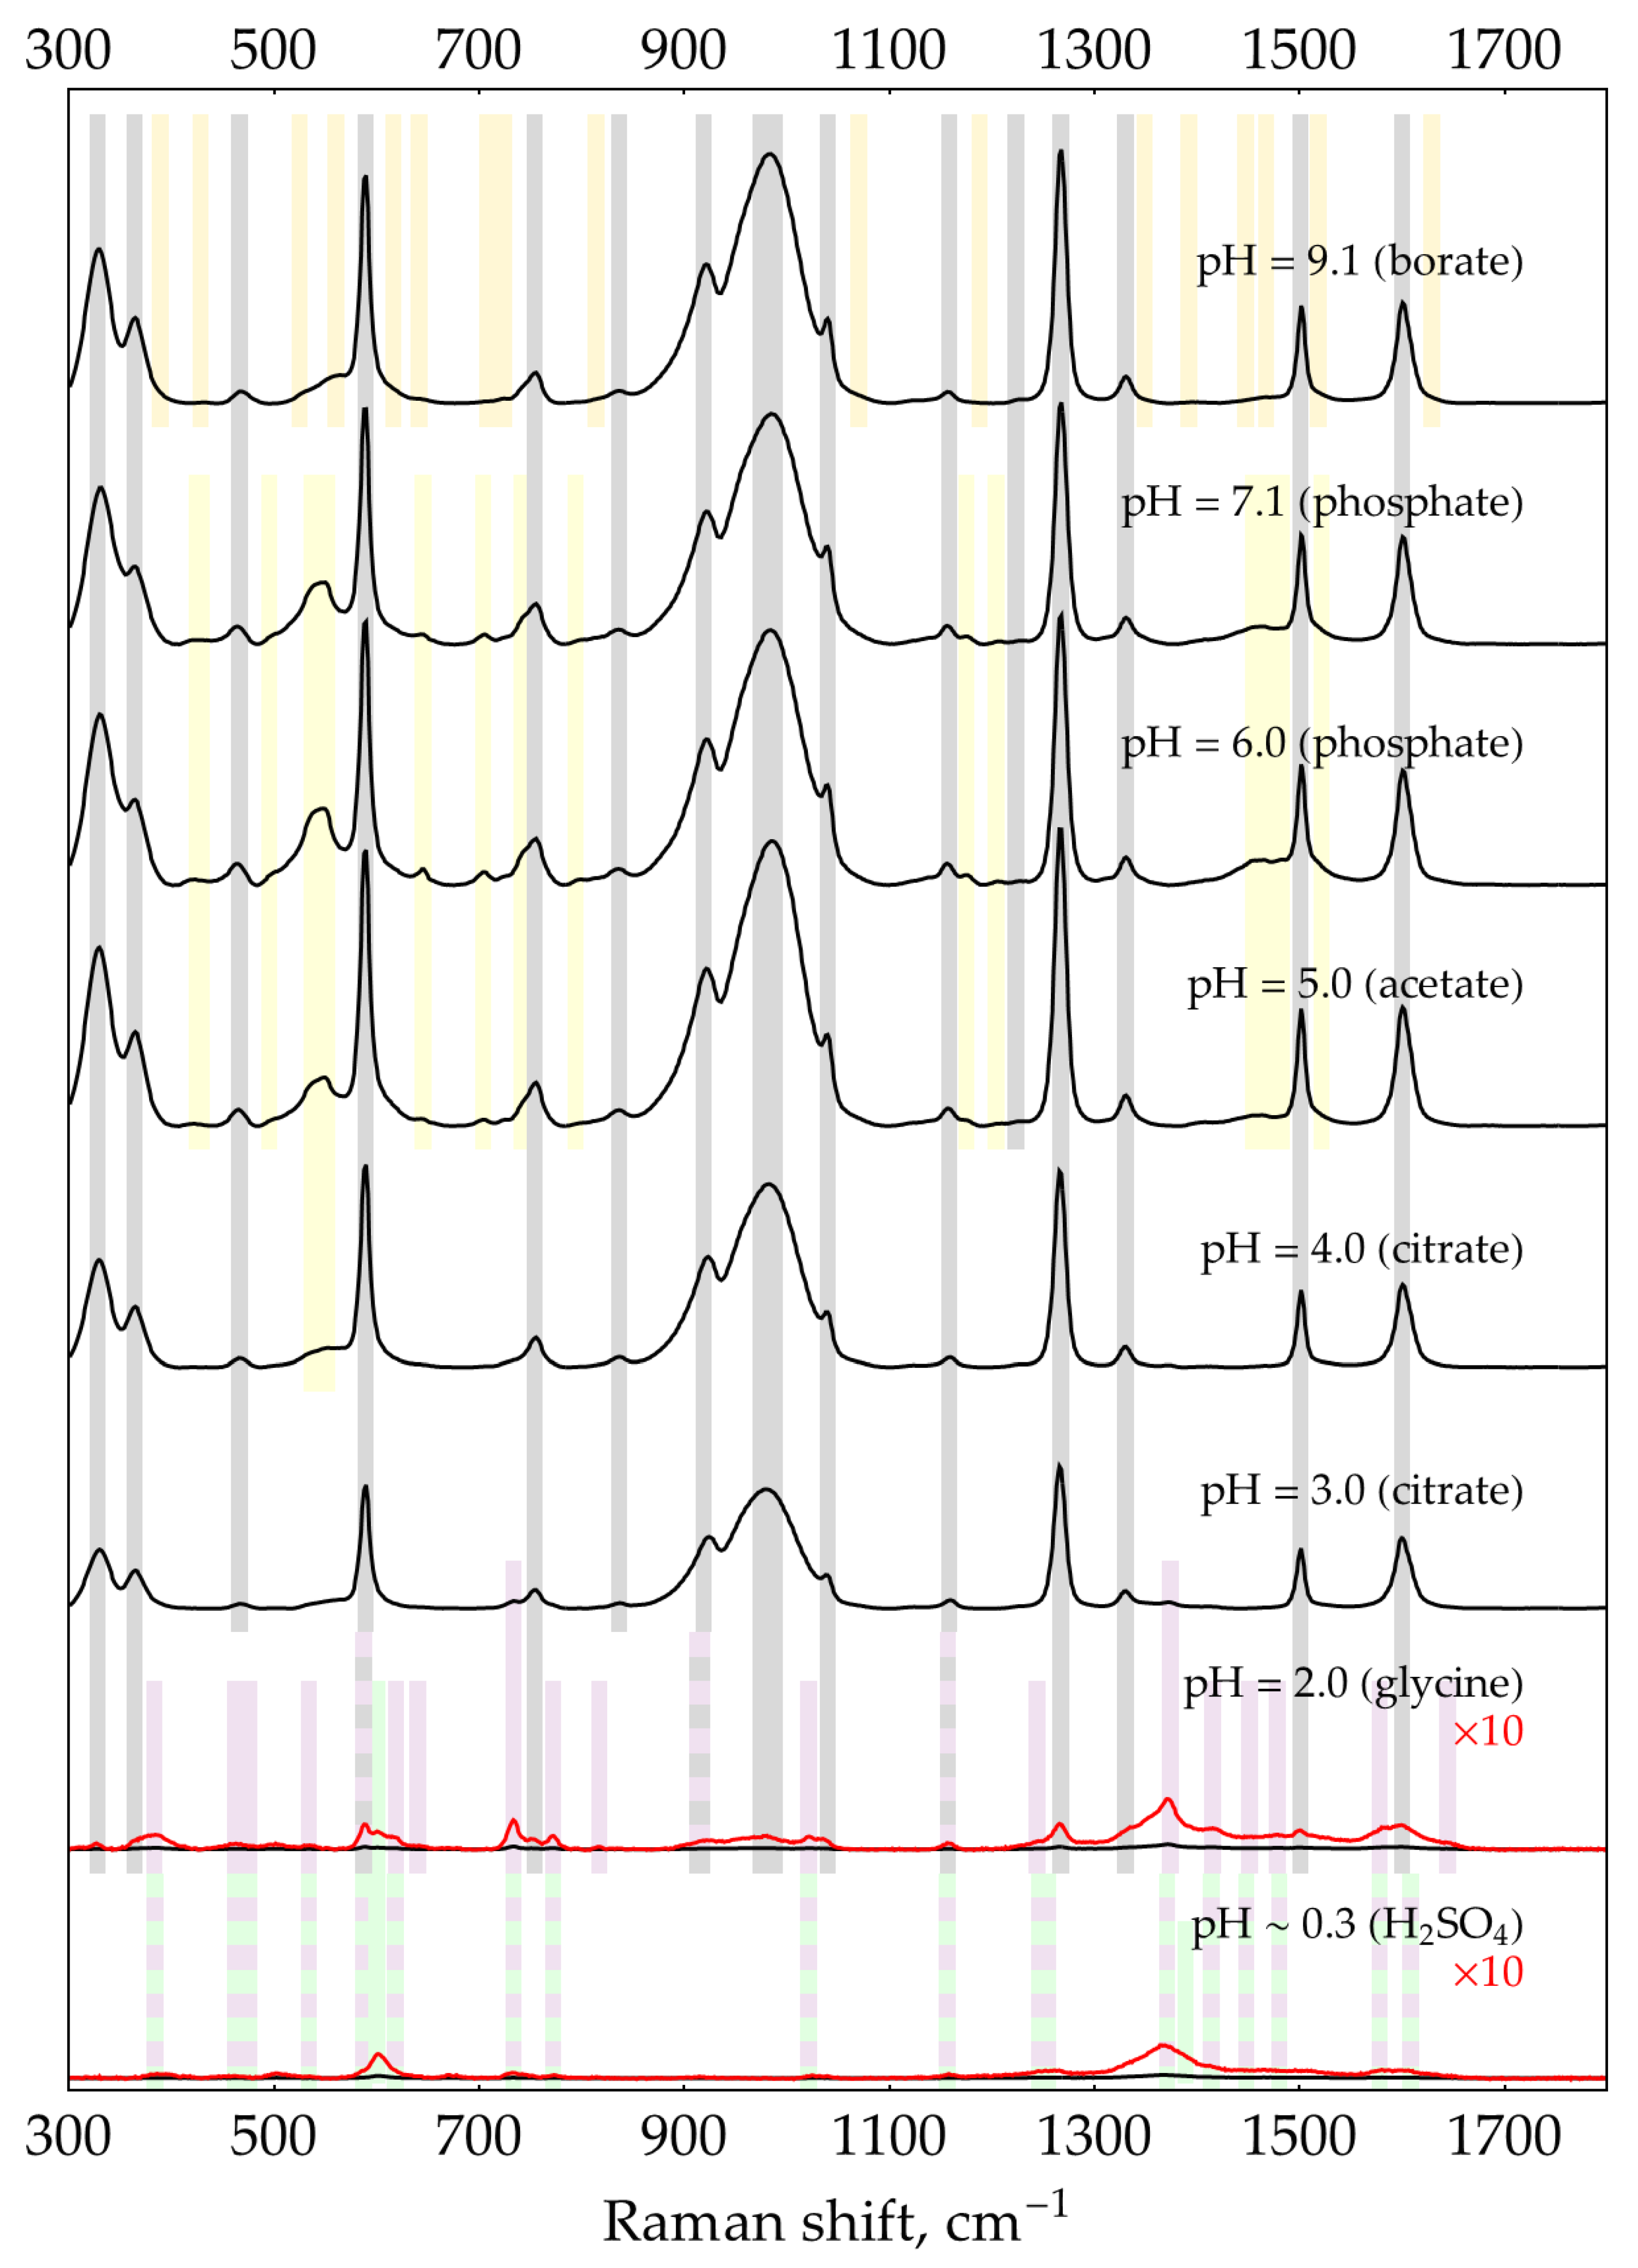
Figure A11.
SER spectra (135 mW, 785 nm, 15 s total accumulation time) of 1 mM oPD on AgNPs in 5 mM NaCl at different pHs. The polynomial baseline was subtracted from each spectrum. Black lines represent original spectra, red lines – multiplied ones for visual clarity. Shading: grey – neutral oPD, orange and yellow – oxidation products of oPD, blue – DAP, purple – DAPH+, green – DAPH22+.
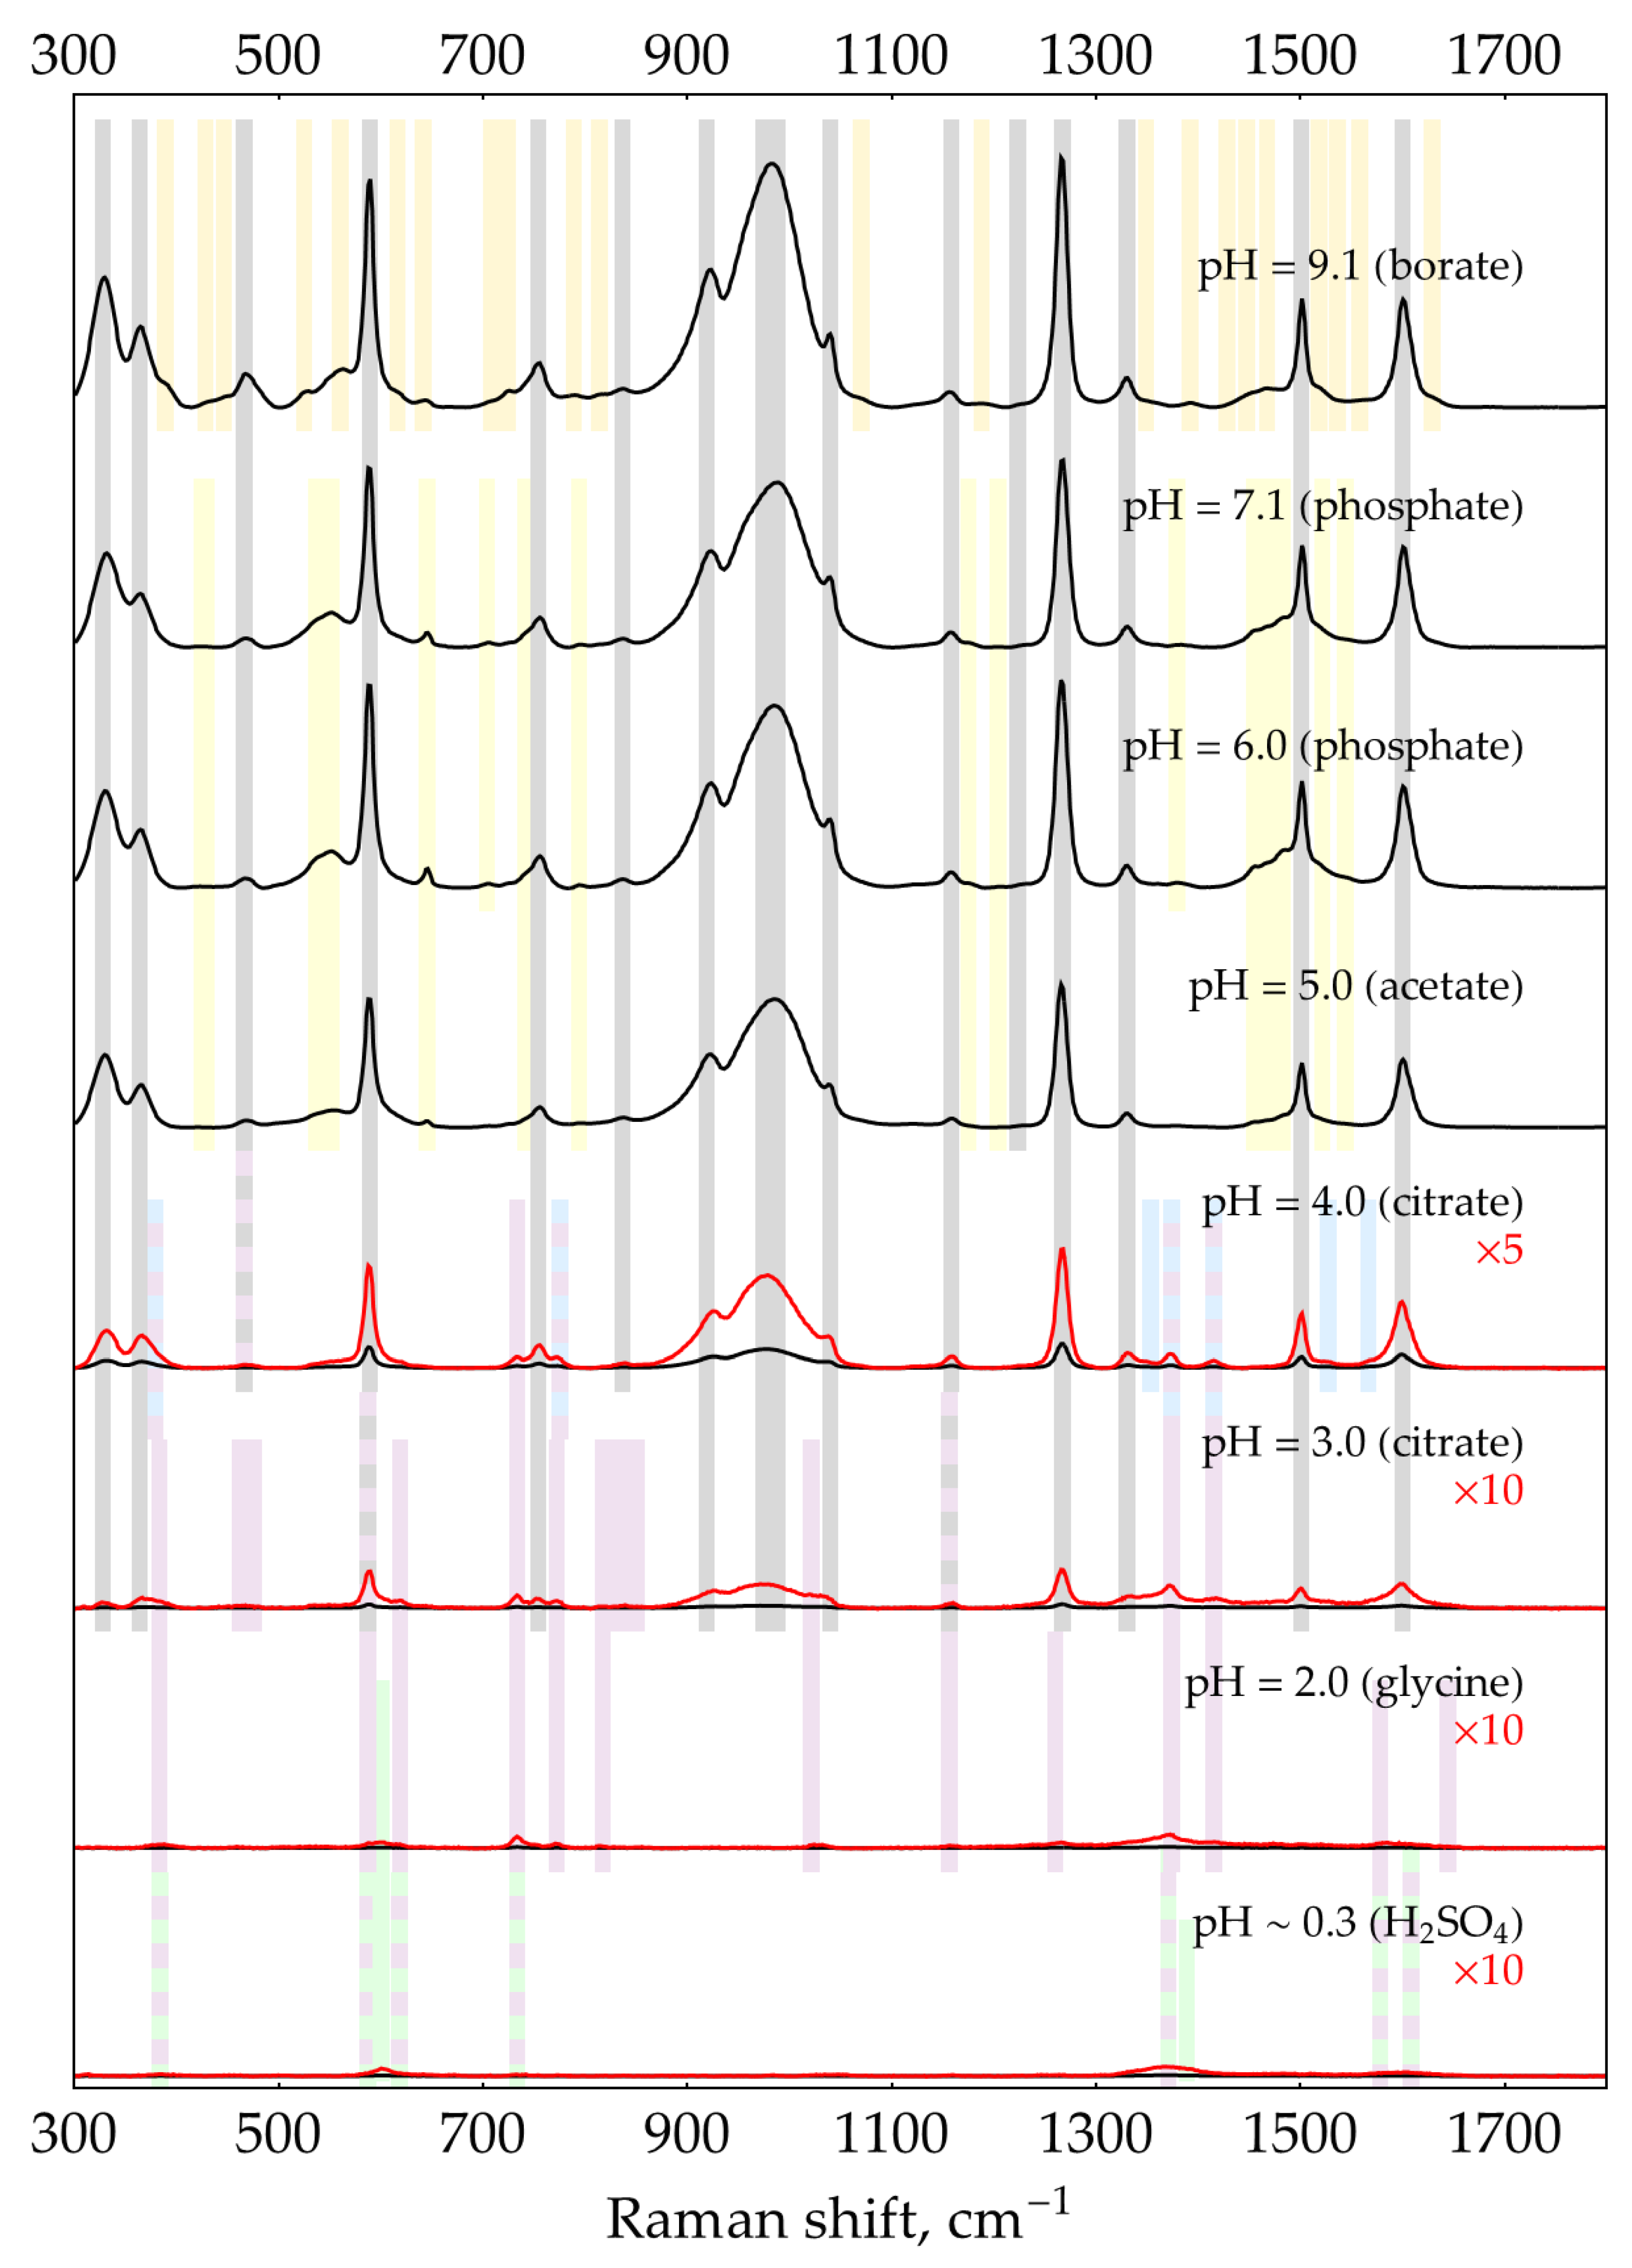
Figure A12.
SER spectra (135 mW, 785 nm, 15 s total accumulation time) of 0.1 mM oPD on AgNPs in 5 mM NaCl at different pHs. The polynomial baseline was subtracted from each spectrum. Black lines represent original spectra, red lines – multiplied ones for visual clarity. Shading: grey – neutral oPD, orange and yellow – oxidation products of oPD, blue – DAP, purple – DAPH+, green – DAPH22+.
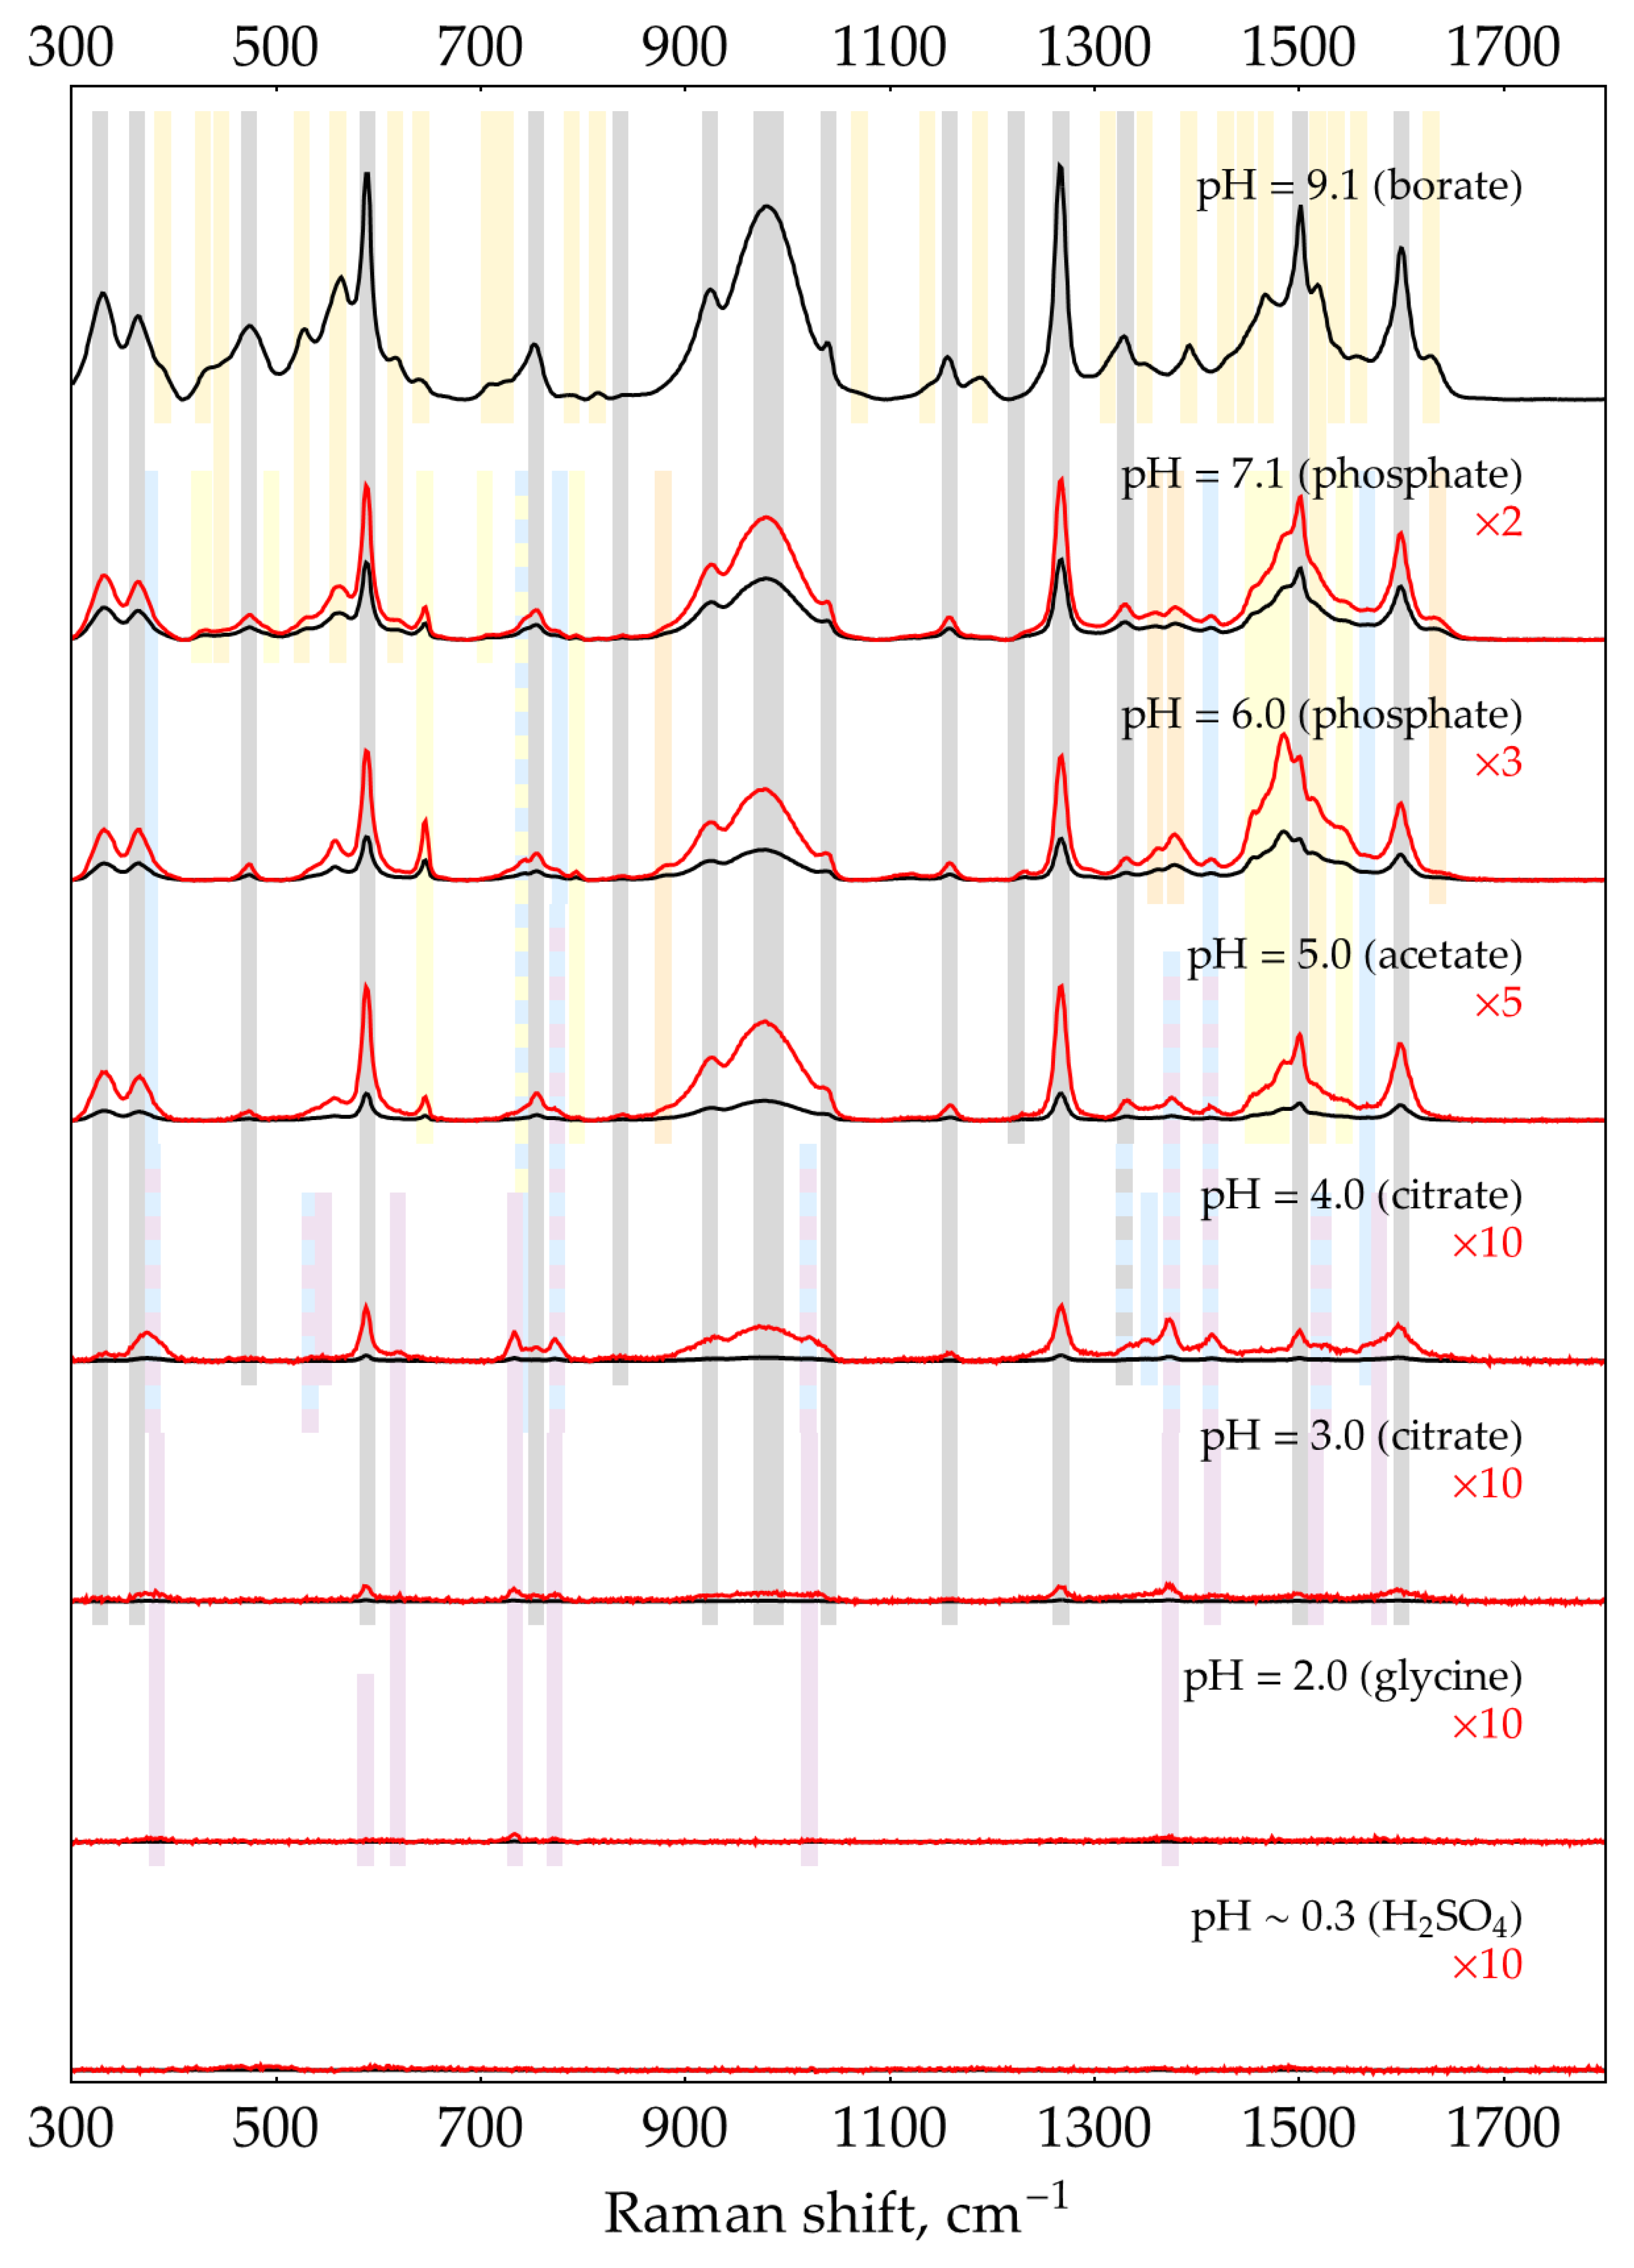
Figure A13.
SER spectra (135 mW, 785 nm, 15 s total accumulation time) of 0.1 mM oPD on reduced AgNPs (5 mM Cl-, 2 mM NH2OH, 1 mM NaOH) at different pHs. The polynomial baseline was subtracted from each spectrum. Black lines represent original spectra, red lines – multiplied ones for visual clarity. Shading: grey – neutral oPD, blue – DAP, purple – DAPH+, green – DAPH22+, dashed edge – product(s) of reaction of DAP with NH2OH.
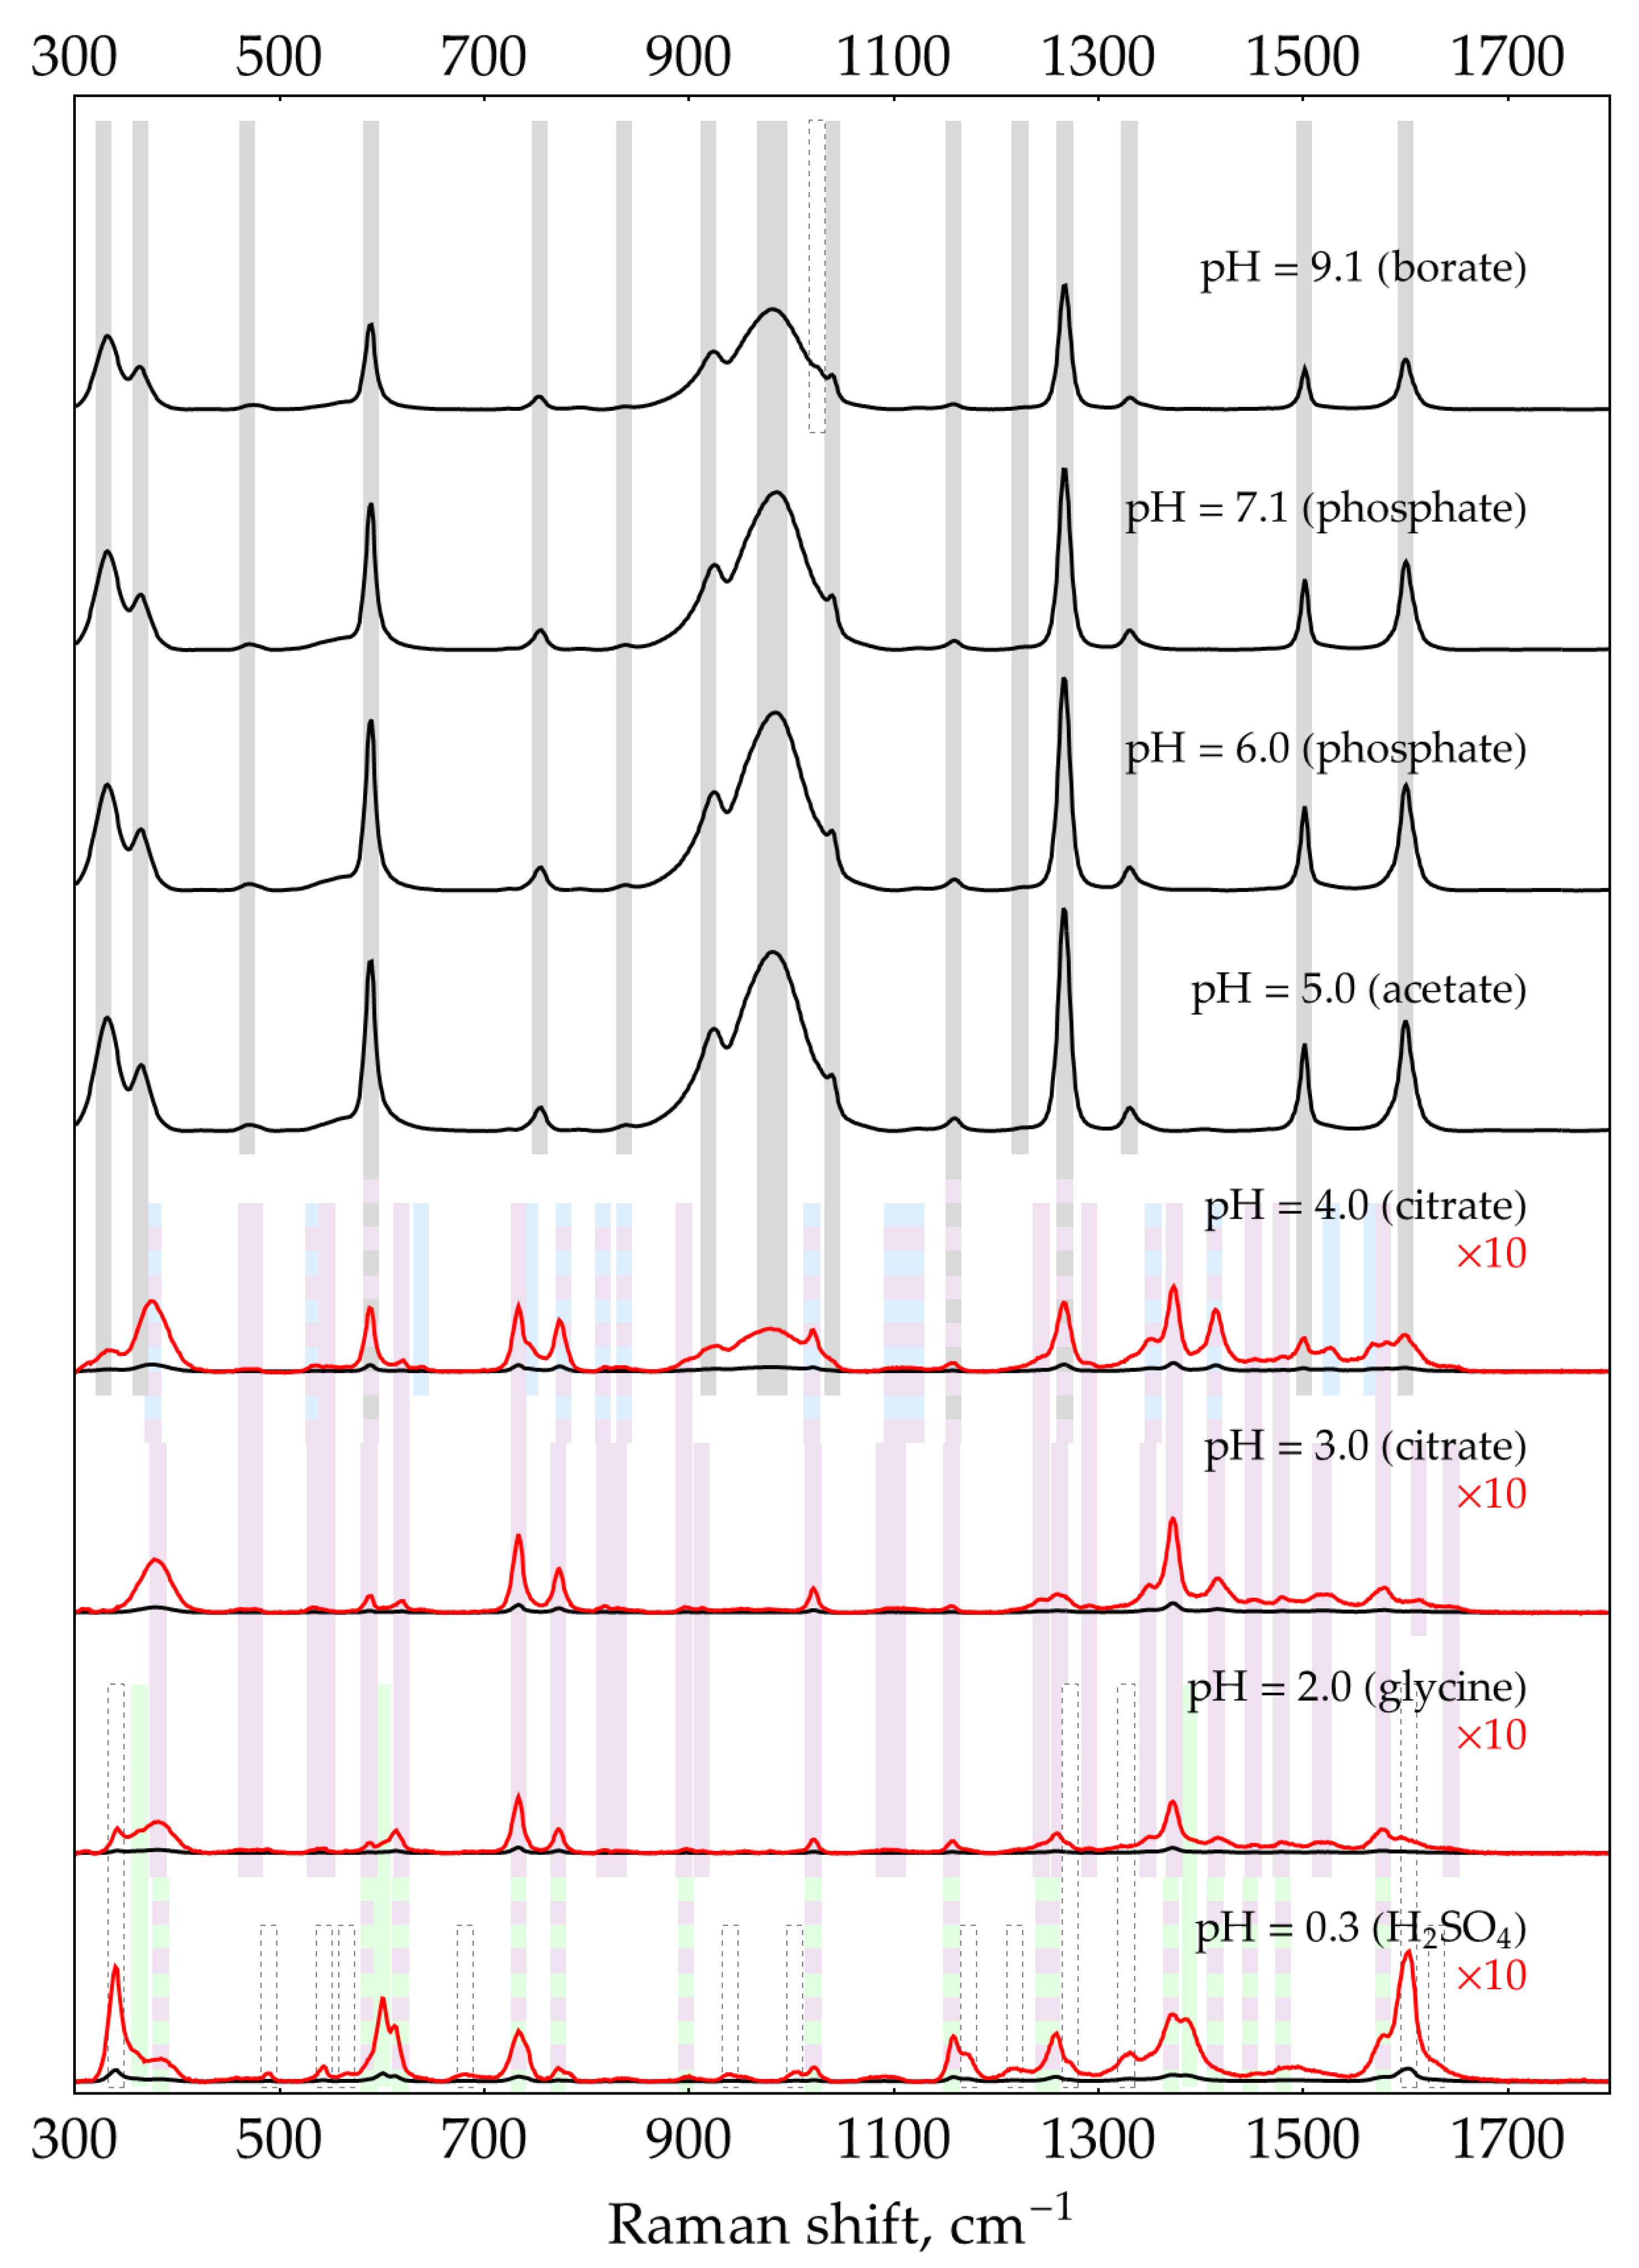
Table A3.
Band positions in cm-1 and relative intensities (%) of SER and normal Raman spectra of neutral oPD.
Table A3.
Band positions in cm-1 and relative intensities (%) of SER and normal Raman spectra of neutral oPD.
| Raman 785 nm, solid oPD | Raman 785 nm, 27.7 mM oPD in water |
SERS 785 nm of oPD on AgNPs, present work |
SERS 647 nm of oPD on a gold sol at pH = 5 [24] | SERS 647 nm of oPD on a silver sol at pH = 5 [24]* | |||
|---|---|---|---|---|---|---|---|
| 329 | (13) | 331b | (16) | 329 | (61) | 350 | 330 |
| 343 | (13) | ||||||
| 369 | (2) | shoulder of 331 | 364 | (34) | 382 | 362 | |
| 398 | (4) | ||||||
| 453 | (2) | 449 | (2) | ||||
| 472 | (3) | 467 | (4) | 480 | 476 | ||
| 492 | (1) | ||||||
| 543 | (16) | 526 | (14) | shoulder of 589 | |||
| 551 | (31) | ||||||
| 579 | (21) | 586 | (28) | 589 | (90) | 586 | 588 |
| 718b | (10) | ||||||
| 761 | (78) | 758 | (100) | 753 | (12) | 752 | 756 |
| 783b | (33) | shoulder of 758 | |||||
| 835 | (5) | 836 | (5) | ||||
| 861 | (3) | ||||||
| 928 | (2) | 908b | (2) | 921 | (55) | 924 | 922 |
| 959 | (1) | ||||||
| 983b | (98) | 1020b | 988b | ||||
| 1034 | (100) | 1039 | (91) | 1039 | (33) | 1040 | 1040 |
| 1115 | (4) | ||||||
| 1152 | (17) | 1159 | (20) | 1157 | (4) | 1160 | 1156 |
| 1161 | (24) | ||||||
| 1246 | (2) | 1236 | (2) | 1225 | (2) | ||
| 1276 | (44) | 1279 | (38) | 1267 | (100) | 1262 | 1268 |
| 1324 | (3) | 1332 | (8) | 1330 | (11) | 1324 | |
| 1337 | (12) | 1340 | 1348 | ||||
| 1460 | (5) | 1461b | (3) | ||||
| 1504 | (5) | 1506 | (6) | 1501 | (38) | 1500 | 1498 |
| 1594 | (37) | 1600 | (30) | 1600 | (40) | 1596 | 1598 |
| 1618 | (10) | shoulder of 1600 | 1628 | ||||
| 1652 | (1) | ||||||
* Only the bands of oPD provided, but not its oxidation products. b means broad band.
Band set A corresponds to neutral oPD. It is shaded gray in Figure A10, Figure A11, Figure A12 and Figure A13 and spans from pH = 9 down to 2-3, depending on oPD concentration. It is the only spectrum present on ‘reduced silver sol’ at a neutral pH of 5-7 (Figure A13). It fully corresponds to the normal Raman spectrum of neutral oPD (Table A3) and previously reported SER spectrum of 100 or 10 μM oPD on gold nanoparticles [24], except for the broad and intense band at 983 cm-1. This band is attributed to the formation of a covalent bond between a nitrogen atom of a neutral amino group and the silver atom [24] via the free electron pair of nitrogen. The most convincing evidence of this assignment is that this band is strongly shifted upon deuteration [24]. On gold nanoparticles, this band is located at 1020 cm-1 [24]. It should be noted that this pattern (a broad SERS band on silver around 950-985 cm-1 absent in normal Raman) also holds for some other amino-substituted benzenes: o- and p-aminobenzoic acids [46,47,48], aniline, and all three isomers (2-, 3-, and 4-) of aminobiphenyl [49]. The debate exists as to whether this band should be assigned to -NH2 rocking mode based on the characteristic Raman shift for this mode [24] or to the wagging mode, which is shifted due to strong interaction with metal [50,51]. Nevertheless, this open theoretical question is not important for our analytical purposes, as both sides agree that this SERS band occurs due to the covalent binding of NH2-group to the metal surface.
Unlike DAP (see Appendix B), whose SER spectrum changes from neutral to protonated form between pH = 4 and 6 in full agreement with its pKa = 5.1, SERS band positions of oPD do not change from pH = 9 down to at least pH = 3 (at low concentrations) or even 2 (at 1 and 10 mM), despite its pKa = 4.55 [34]. The overall intensity of the bands, however, strongly decreases in acidic conditions. This finding implies that only a neutral form of oPD has some affinity for the silver surface, most likely because both NH2-groups bind to Ag. We haven’t performed any molecular modeling as it is far beyond the analytical scope of the present paper, but general geometric considerations do not contradict this hypothesis. The calculated distance between two nitrogen atoms in oPD is 2.82 or 2.76 Å based on optimized geometry reported in [52] or [43], while the doubled atomic radius of silver is 2.88 Å. Thus, when the first NH2-group binds to the surface silver atom, the second nitrogen ends up right above the adjacent silver atom.
Band set B (marked with 3 types of yellowish and orange shading in Figure A10, Figure A11 and Figure A12) is present at pHs from 5 to 9. As these bands are totally absent with reduced silver sols (Figure A13) and also in oPD SER spectra on gold nanoparticles [24], they should be attributed to some products of oPD oxidation by Ag(I), which exists in some amounts in silver sols as a result of their oxidation by air oxygen. The presence of these bands in the oPD spectrum on silver was reported earlier [11,24]. It should be noted that Koh, et al. [24] specifically added 1.6 mM of ascorbic acid to silver sol as an antioxidant, but it acts as a reducing agent in alkaline conditions only. If ascorbic acid was added without pH adjustment (as we did for hydroxylamine), it would not prevent nanoparticle oxidation.
The relative intensity of these bands (compared to set A considered above) increases at lower oPD concentrations. At a fixed amount of oxidized silver, a fixed amount of oPD oxidation products will form. At high oPD concentrations (10 mM), there is still plenty of oPD left to successfully compete with oPD oxidation products for binding with the silver surface, resulting in their weak spectrum. At a lower oPD concentration (0.1 mM), a noticeable fraction of oPD is oxidized, thus the relative spectrum of oxidized oPD goes stronger.
It is known that both ions of silver (I) [53,54] and silver nanoparticles [55,56] facilitate the oxidation of oPD to DAP. However, band positions of set B have very little in common with the SER spectrum of neutral or protonated DAP (Figure A4). We suppose that set B might represent some previously reported intermediate(s) on a route from oPD to DAP [20,41].
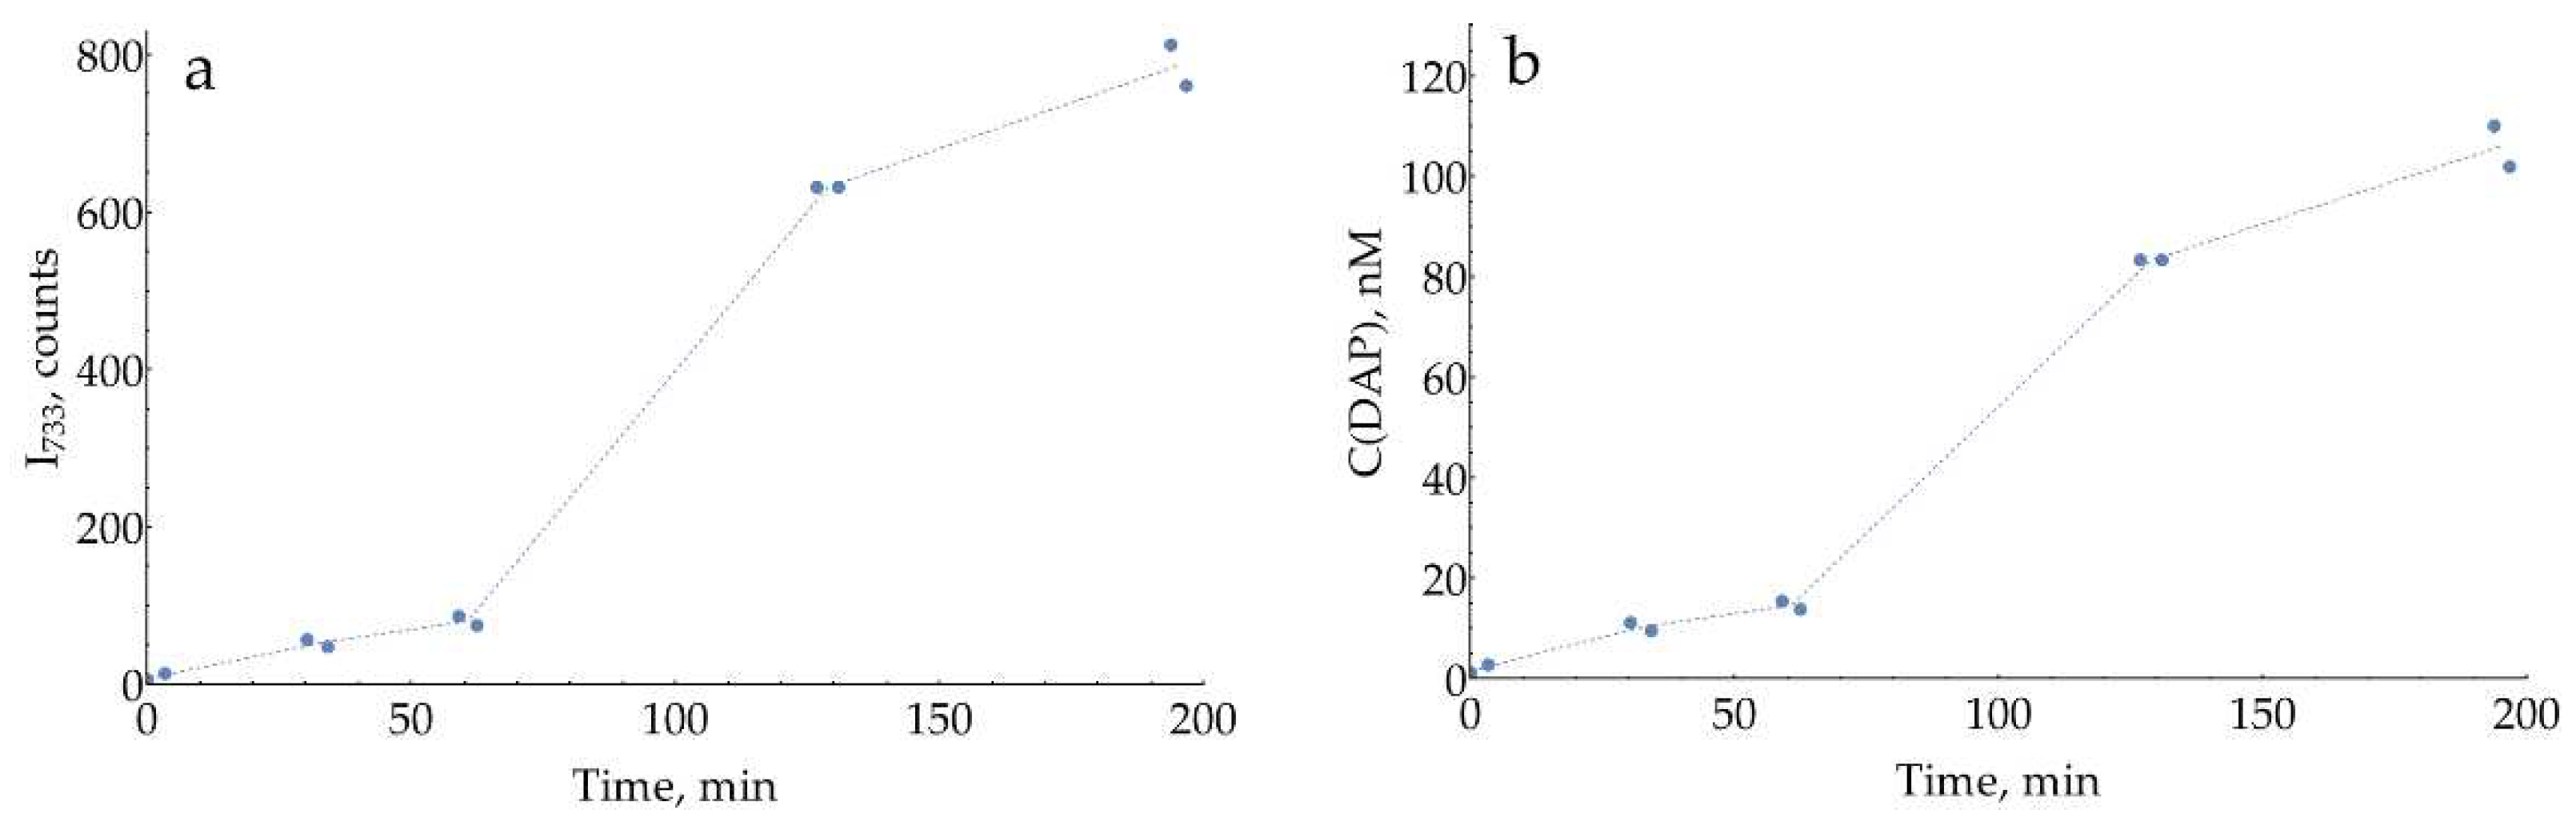
Band set C appears in acidic conditions and at lower oPD concentrations. These bands fully correspond to neutral DAP (shadowed blue), DAPH+ (purple), or DAPH22+ (green). As DAP bands present both with normal and reduced silver sols, this DAP is not a result of oPD oxidation by silver (I), but rather a minor impurity in stock oPD and the product of spontaneous oPD oxidation upon storage in the solution prior to measurement. Indeed, for freshly prepared oPD stock, the intensity of these DAP bands is more-or-less constant at any given conditions but gradually increases upon storage of the oPD solution (Figure A14).
Figure A14.
Spontaneous oPD oxidation in its 28 mM water stock stored at room temperature, measured with SERS at pH = 3, 0.93 M citrate buffer at 1 mM (28-fold dilution). (a) Intensity of the 733 cm-1 band of DAP over time; (b) Calculated DAP concentrations according to the calibration curve from Figure 7c.
The appearance of DAP bands at acidic pH agrees with our previous statement that only a neutral oPD (with both NH2-groups unprotonated) has some affinity for silver. At any conditions when the concentration of this neutral oPD is low (either if the total oPD concentration is low, e.g., at 0.1 mM, or in acidic conditions below its pKa = 4.55 due to protonation), tiny concentrations of DAP appear in the SER spectrum due to its much higher affinity for silver.
Band set D (marked with a dashed edge in Figure A13) represents products(s) of the reaction between DAP and NH2OH (note B and C on Figure A15 are almost identical). They appear in ‘reduced sols’ at pH = 2 and below, and one band appears at pH = 9.
Figure A15.
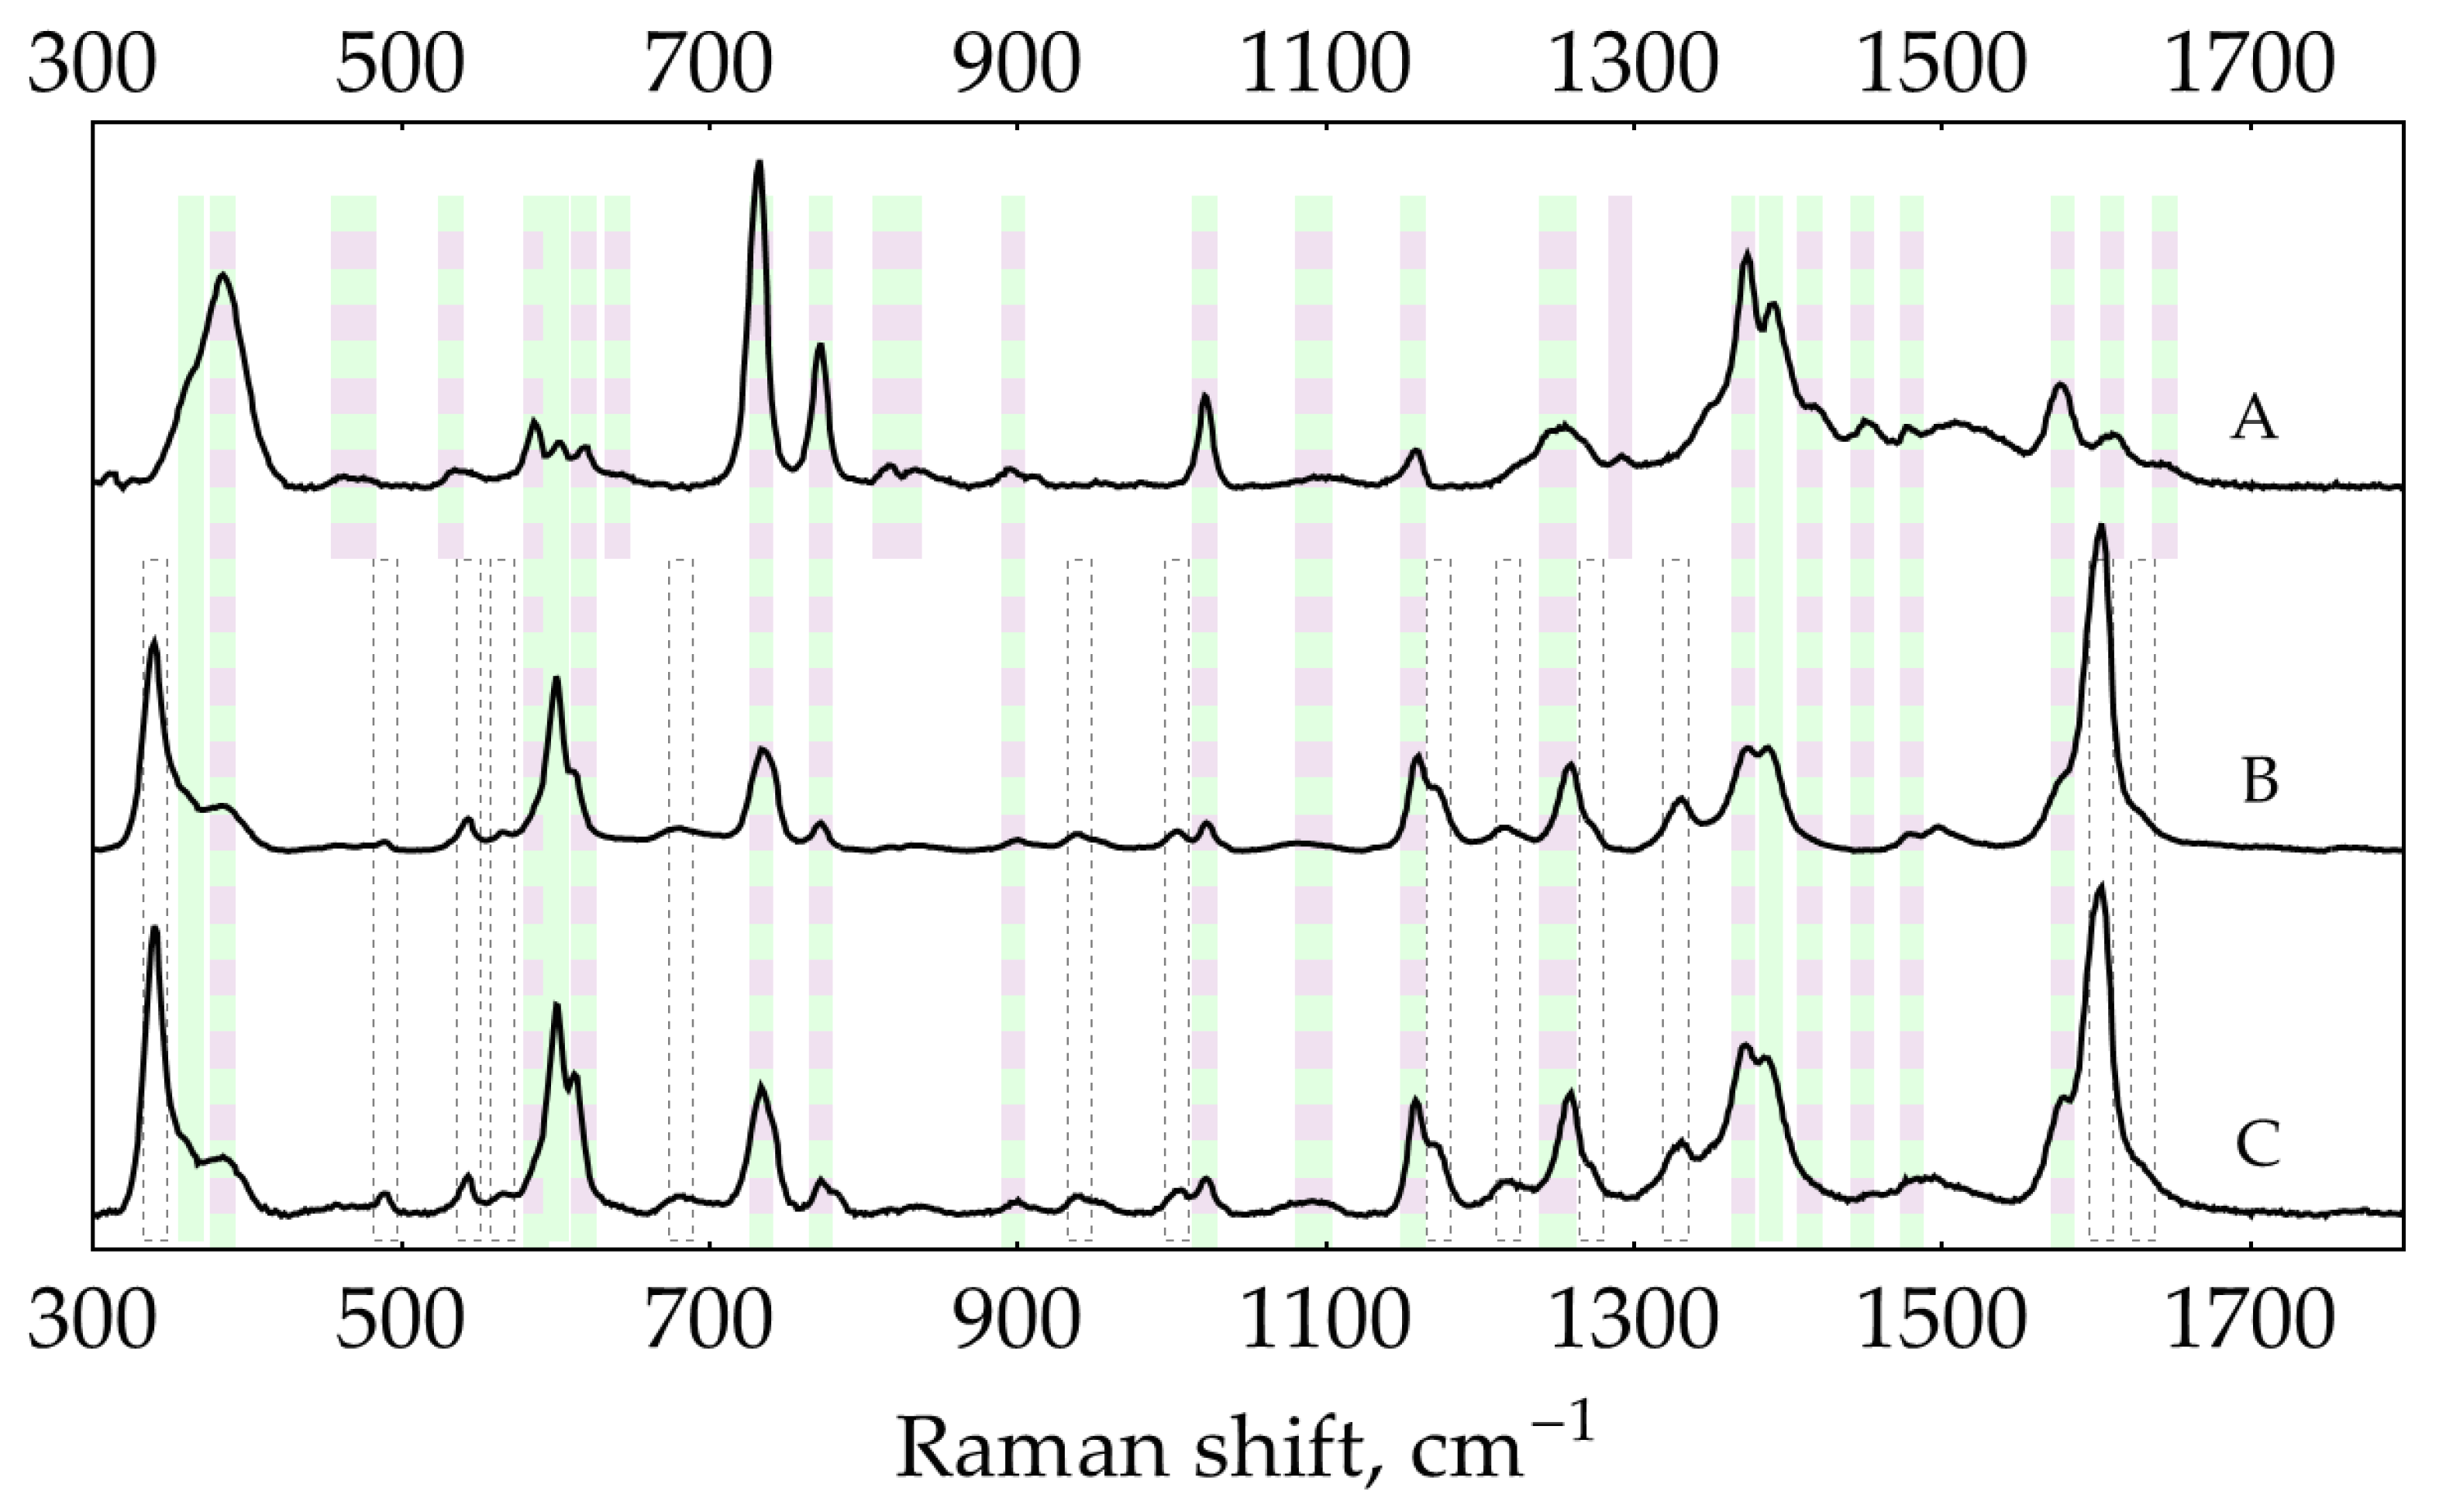
SER spectra (135 mW, 785 nm, 15 s total accumulation time) at pH ≈ 0.3 (0.5 M H2SO4): (A) 500 nM DAP, AgNPs in 5 mM NaCl; (B) 500 nM DAP on reduced AgNPs (5 mM Cl-, 2 mM NH2OH, 1 mM NaOH); (C) 0.1 mM oPD on reduced AgNPs. The polynomial baseline was subtracted from each spectrum. Spectra were normalized for clarity. Shading: purple – DAPH+, green – DAPH22+, dashed edge – product(s) of reaction of DAP with NH2OH.
Figure A15.
SER spectra (135 mW, 785 nm, 15 s total accumulation time) at pH ≈ 0.3 (0.5 M H2SO4): (A) 500 nM DAP, AgNPs in 5 mM NaCl; (B) 500 nM DAP on reduced AgNPs (5 mM Cl-, 2 mM NH2OH, 1 mM NaOH); (C) 0.1 mM oPD on reduced AgNPs. The polynomial baseline was subtracted from each spectrum. Spectra were normalized for clarity. Shading: purple – DAPH+, green – DAPH22+, dashed edge – product(s) of reaction of DAP with NH2OH.
Conclusions on the SER spectra of oPD on AgNPs:
- “Pure” SER spectra of oPD with AgNPs may be obtained only in reducing conditions if the oxidation of metal silver to silver (I) by air oxygen is suppressed. Under these conditions, the SER spectrum of oPD corresponds well to a normal Raman spectrum of neutral oPD and the SER spectrum of oPD on gold (Table A3).
- If oxidized silver is allowed to form, multiple additional bands appear in the pH range of 5 to 9. They correspond to some oxidation product of oPD other than DAP. Most likely, this is some kind of intermediate(s) on a route from oPD to DAP.
- Only the neutral form of oPD has some affinity for silver. Binding occurs via at least one NH2-group (resulting in an intense broad band at around 983 cm-1). It is likely that both NH2-groups are involved in oPD binding to the silver surface.
- In acidic conditions and at low concentrations of oPD, its spectrum contains (or even replaced with) the bands of DAP in neutral, DAPH+, or DAPH22+ forms, depending on pH. This DAP is not a result of oPD oxidation by silver but rather a minor impurity in stock oPD and the product of spontaneous oPD oxidation upon storage in the solution.
Appendix E
Proper aggregation of metal nanoparticles is vital for signal development via ‘hot spots’ formation if electrostatically stabilized Ag or Au sols are used for SERS [57,58]. The easiest way to do so is to vary the concentration of the aggregating agent while keeping the aggregation duration constant. For the purposes of the preceding pH screening, the non-optimal aggregation state of AgNPs was not relevant as the relative intensity of DAP versus oPD was followed. Hence, any reasonable concentration of aggregating agent that causes visible particle aggregation was suitable. By contrast, at the current stage of choosing the best pH out of several candidates, the optimal aggregation of AgNPs becomes vital. The second factor, which has already been mentioned, is that at this stage the detection system is already sensitive enough to measure minor quantities of DAP in stock oPD, so during the optimization of aggregating agent concentration, a blank (the sample without added DAP) should be measured right before or after the sample with DAP, and its signal should be subtracted. The last factor is the selection of the DAP concentration to use during the procedure. This concentration should be low enough not to cause any aggregation on its own without an added aggregating agent. On the other hand, it should be high enough to result in a reliably measured SERS signal. During our preliminary experiments, 100 nM of DAP was chosen to fulfill both of these requirements.
Two series of solutions containing the desired concentration of aggregating agent, 1 mM of oPD with or without 100 nM DAP were prepared. Each solution was mixed 1:1 with AgNPs in 5 mM NaCl, and exactly 2 minutes later, the SERS spectrum was acquired. The resulting curves for two most intense bands for each pH are present in Figure A16, Figure A17, Figure A18 and Figure A19.
Figure A16.
Optimization of H2SO4 concentration as an aggregating agent for AgNPs: (a) Intensity of the band located at 730-733 cm-1; (b) Intensity of the band 1374 cm-1. The vertical dashed line represents the chosen optimal concentration. All measured intensities were normalized by the mean intensity for this concentration. The horizontal dashed line represents 1 (100%) for visual comparison. Error bars denote SD for each concentration.
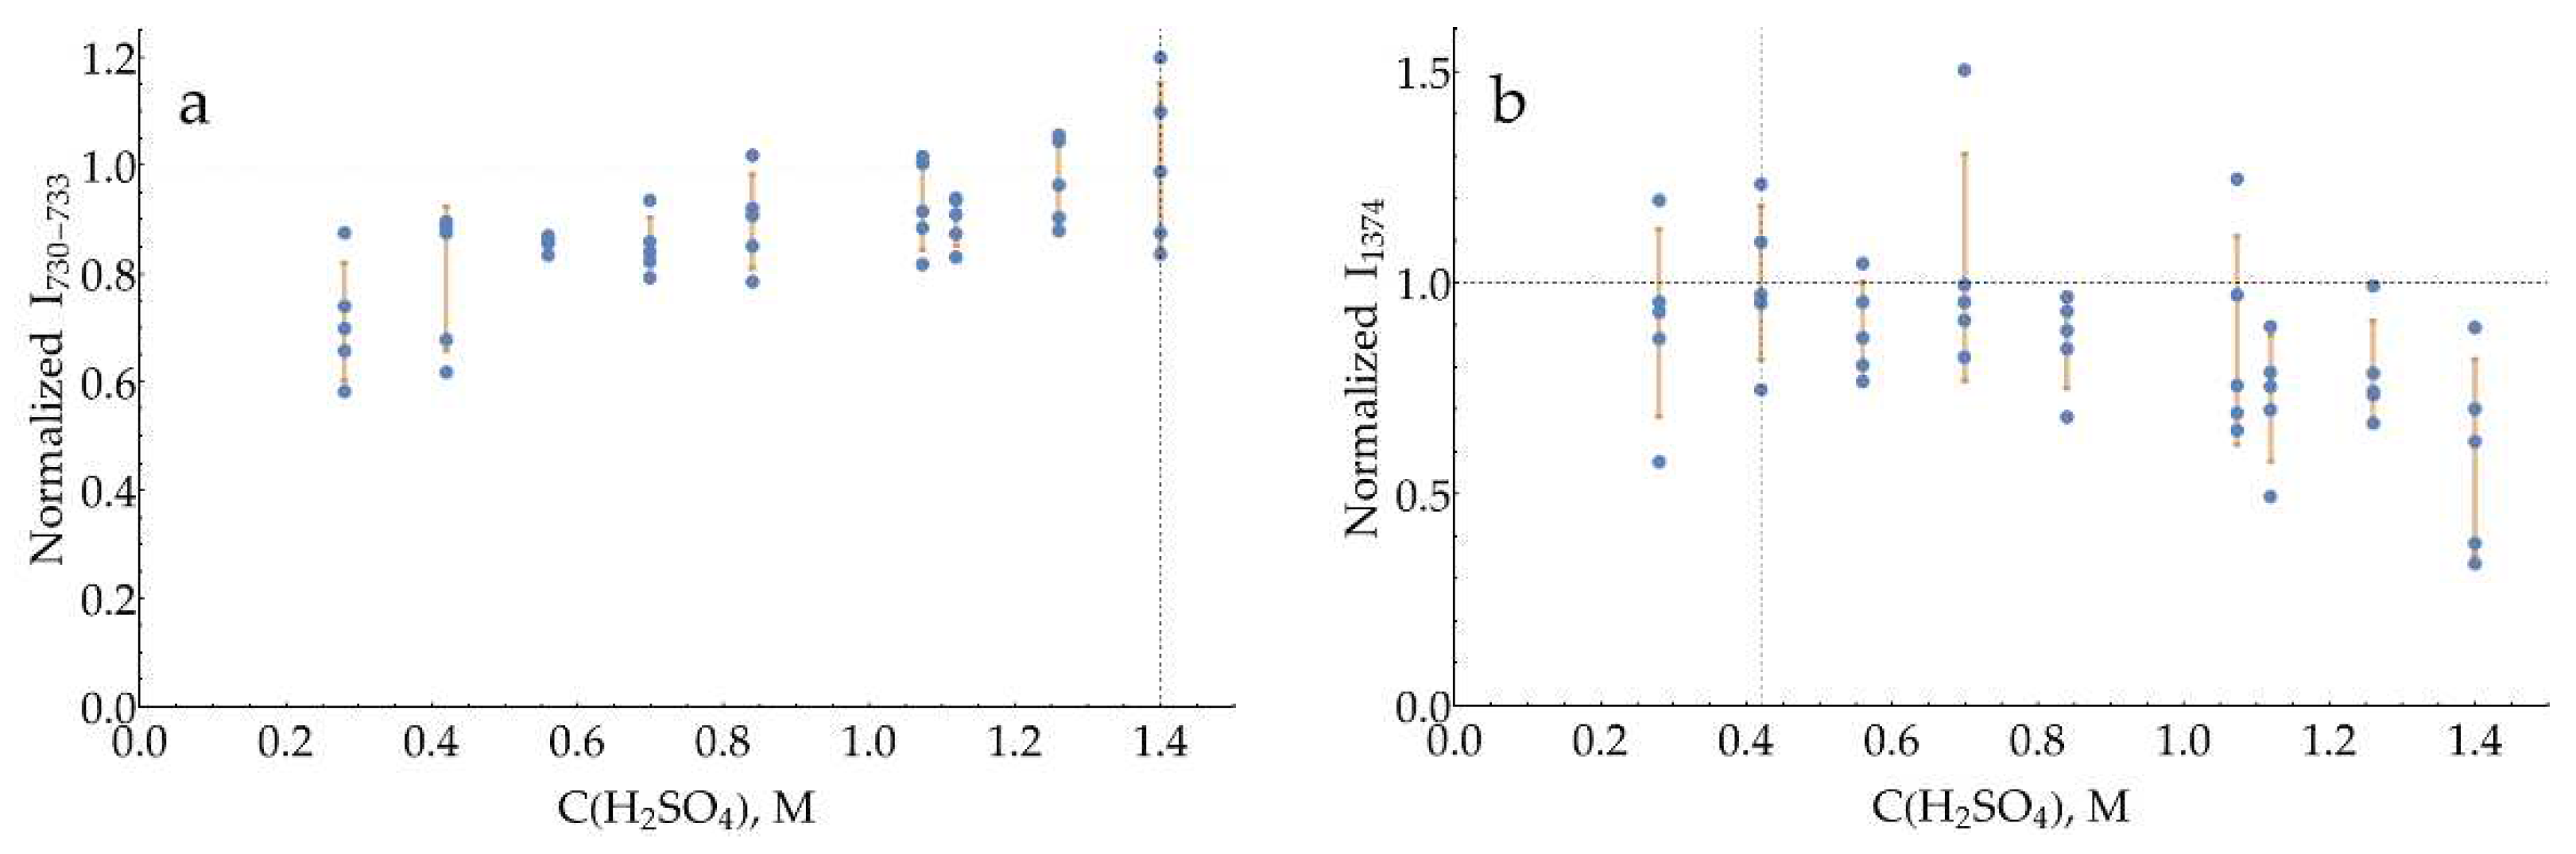
Figure A17.
Optimization of Gly buffer (pH = 2) concentration as an aggregating agent for AgNPs: (A) Intensity of the band 733 cm-1; (B) Intensity of the band 1374 cm-1. The vertical dashed line represents the chosen optimal concentration. All measured intensities were normalized by the mean intensity for this concentration. The horizontal dashed line represents 1 (100%) for visual comparison. Error bars denote SD for each concentration.
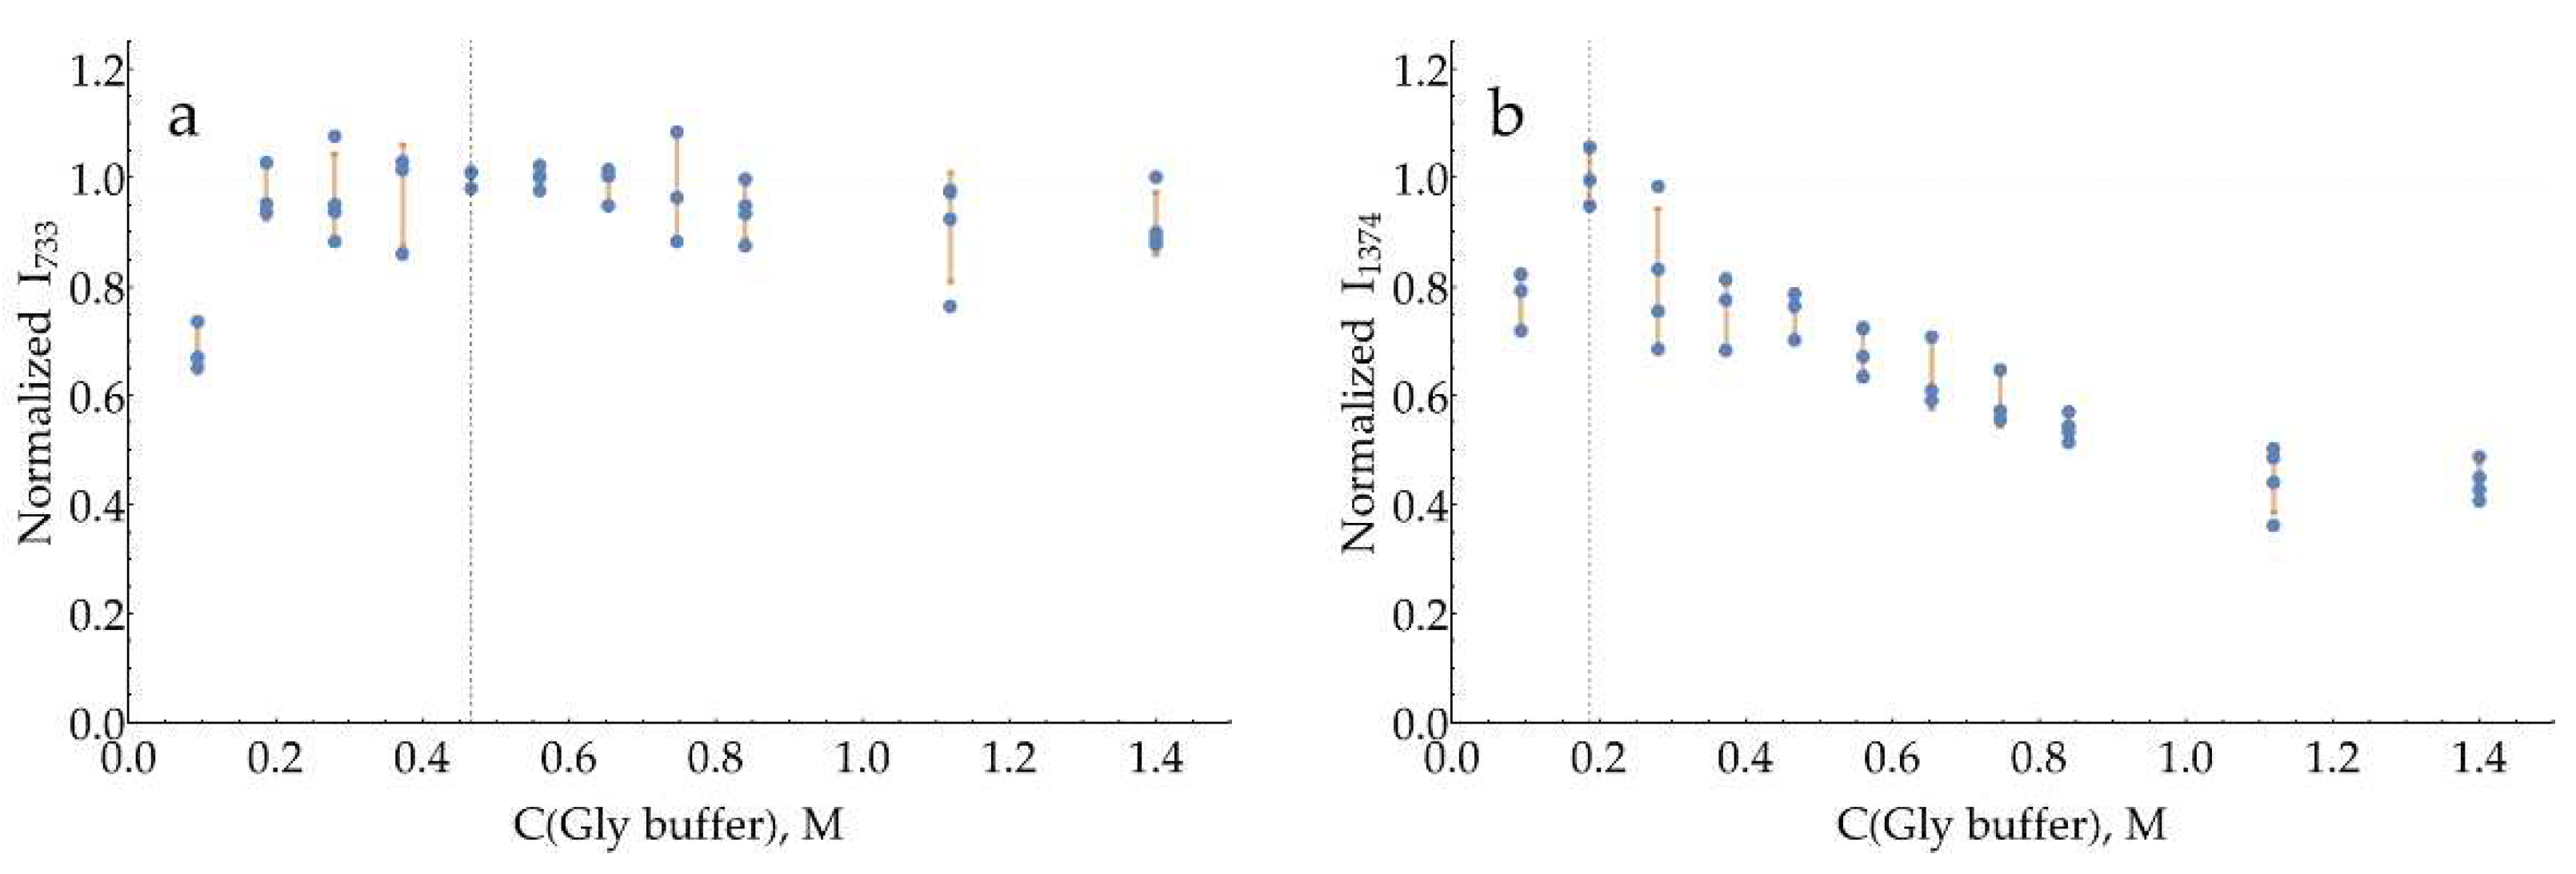
Figure A18.
Optimization of citrate buffer (pH = 3) concentration as an aggregating agent for AgNPs: (a) Intensity of the band 733 cm-1; (b) Intensity of the band 1374 cm-1. The vertical dashed line represents the chosen optimal concentration. All measured intensities were normalized by the mean intensity for this concentration. The horizontal dashed line represents 1 (100%) for visual comparison. Error bars denote SD for each concentration.
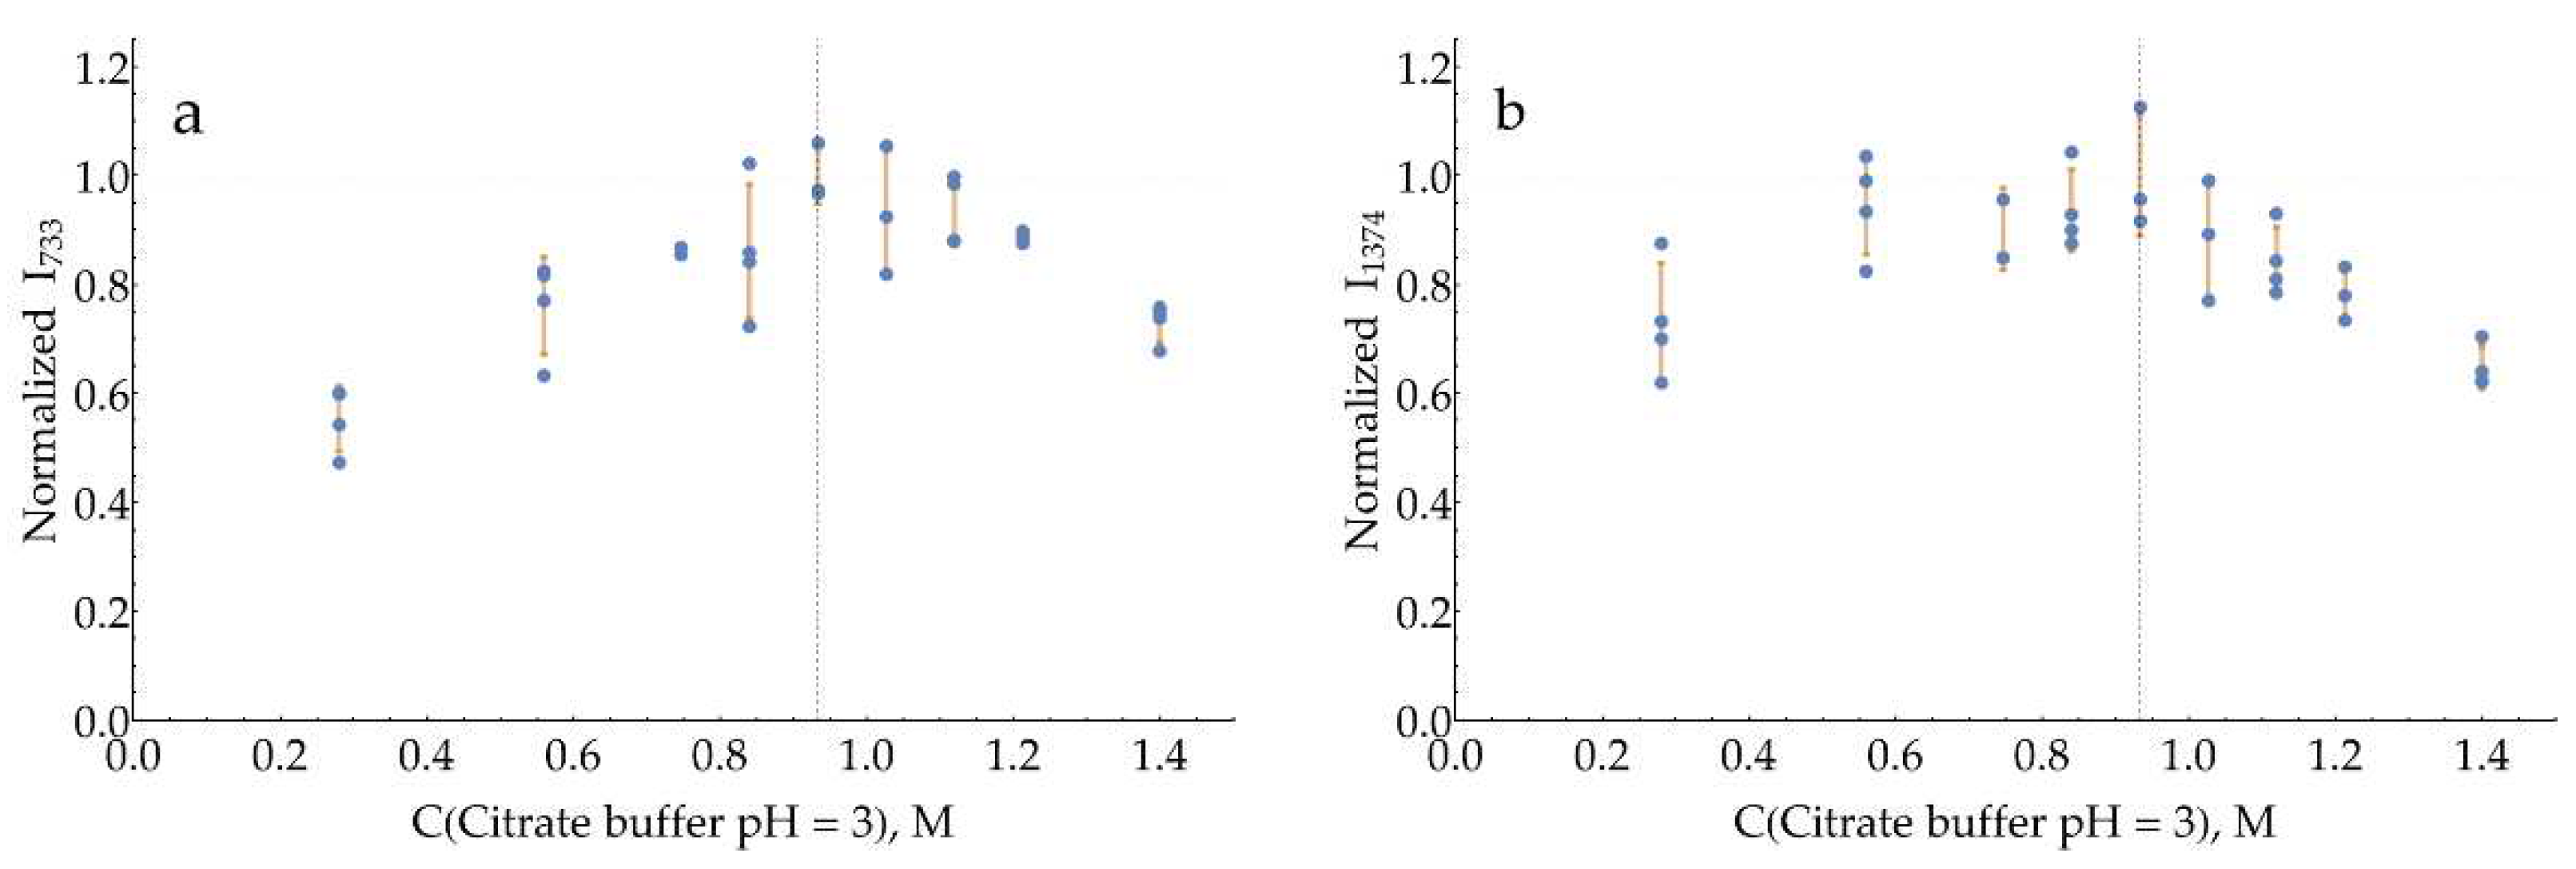
Figure A19.
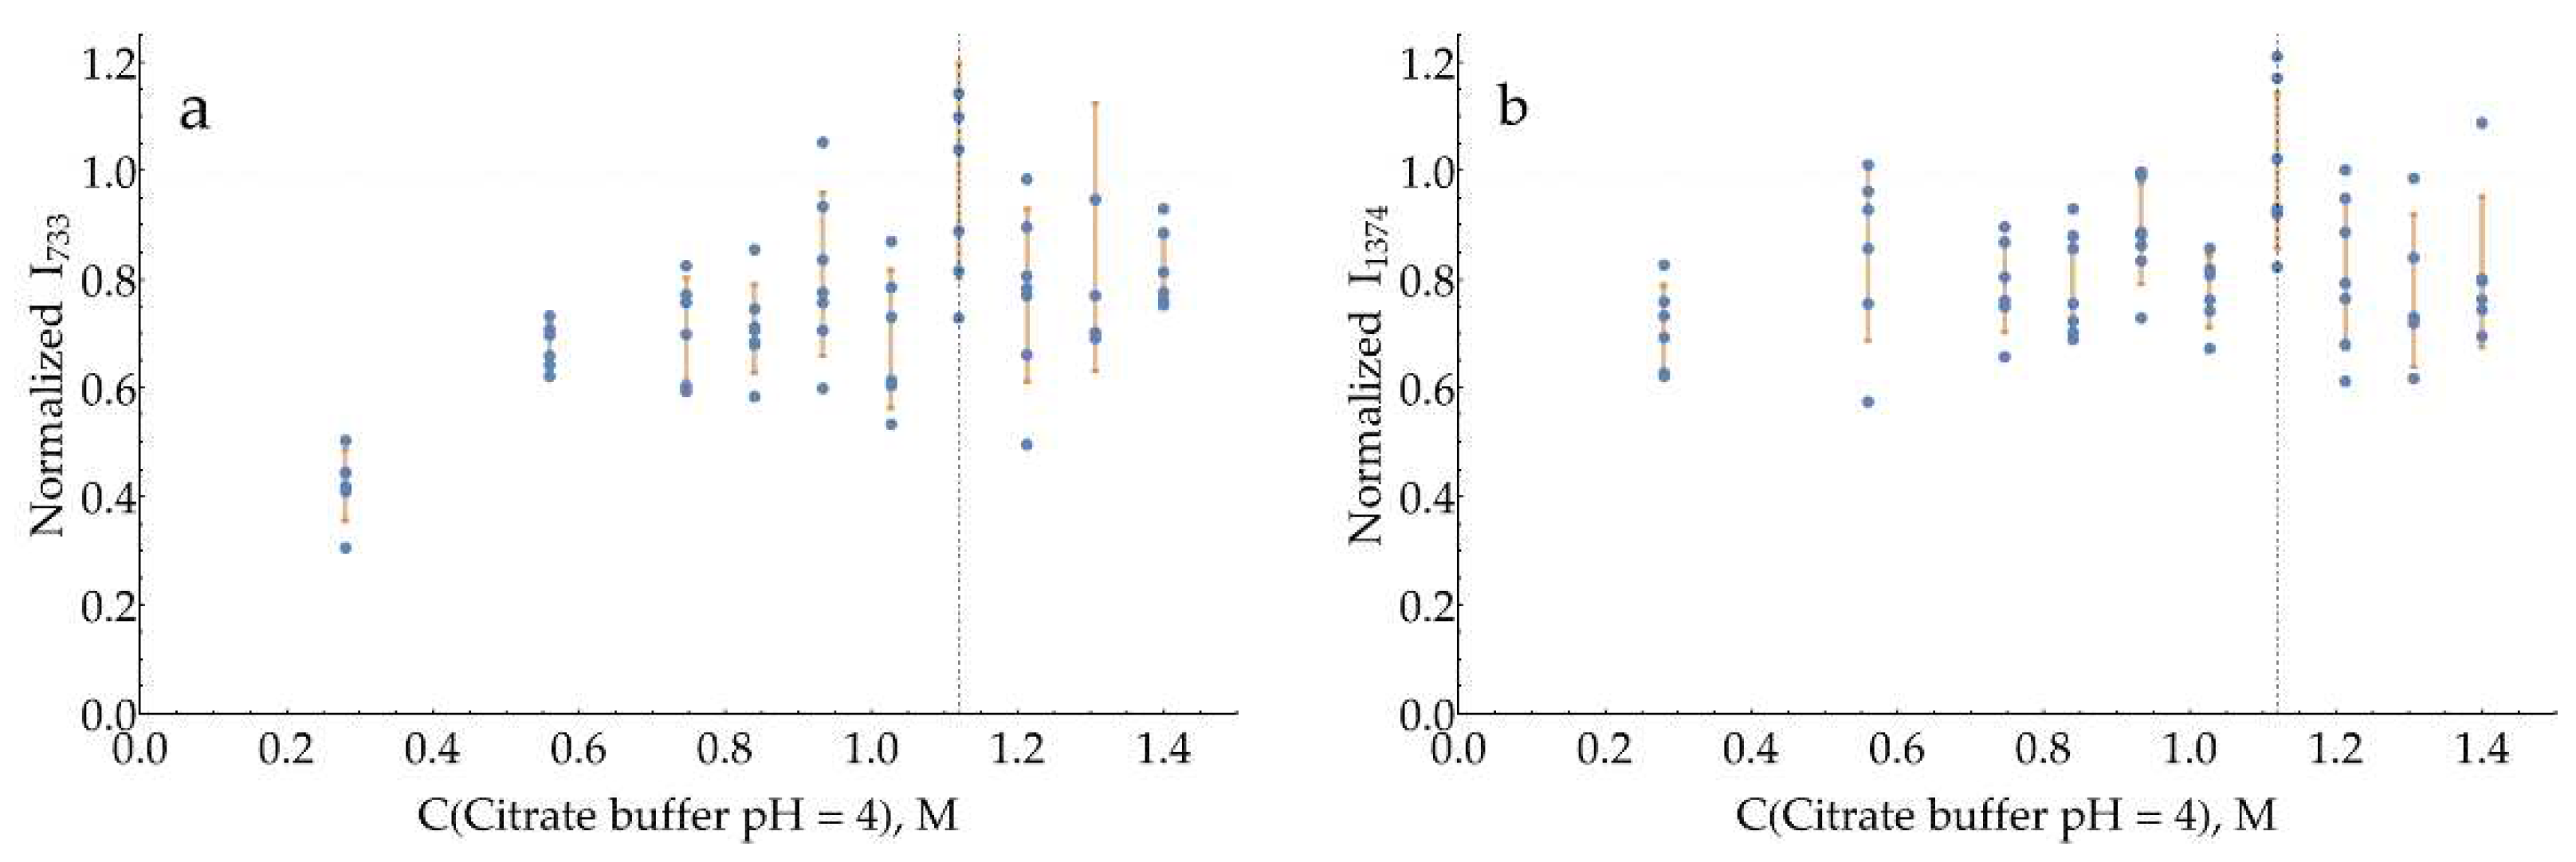
Optimization of citrate buffer (pH = 4) concentration as an aggregating agent for AgNPs: (a) Intensity of the band 733 cm-1; (b) Intensity of the band 1374 cm-1. The vertical dashed line represents the chosen optimal concentration. All measured intensities were normalized by the mean intensity for this concentration. The horizontal dashed line represents 1 (100%) for visual comparison. Error bars denote SD for each concentration.
Figure A19.
Optimization of citrate buffer (pH = 4) concentration as an aggregating agent for AgNPs: (a) Intensity of the band 733 cm-1; (b) Intensity of the band 1374 cm-1. The vertical dashed line represents the chosen optimal concentration. All measured intensities were normalized by the mean intensity for this concentration. The horizontal dashed line represents 1 (100%) for visual comparison. Error bars denote SD for each concentration.
First, it should be noted that all the data have high variability. This is caused by the low concentration of DAP used and also by the fact that each data point represents the difference between two measurements (with DAP and without), which additionally increases the uncertainty. Nevertheless, due to the high total number of points, these curves might be used to choose at least some near-optimal conditions.
With H2SO4 as an aggregating agent (Figure A16), the position of the band around 730 cm-1 monotonously shifts from 733 to 730 cm-1 with increasing acid concentration due to the transition from DAPH+ to DAPH22+. Its intensity rises with added H2SO4, and we stopped at 1.4 M as the mixture became too corrosive. The curve for the band 1374 cm-1 has a broad maximum from 0.28 to 0.7 M; 0.42 M has been chosen for further work.
With pH = 2 glycine buffer (Figure A17) the curve for the band 733 cm-1 is essentially constant between 0.2 and 0.7 M, and 0.47 M has been chosen. The curve for the band 1374 cm-1, on the other hand, has a pronounced maximum at 0.27 M.
The curves for both bands with a pH = 3 citrate buffer (Figure A18) have a broad maximum around 0.93 M. The same is true for pH = 4 citrate buffer (Figure A19), with the optimum for both bands around 1.12 M.
Appendix F
This appendix demonstrates a very important issue related to quantitative SERS using AgNPs: the loss of nanoparticles due to their adsorption onto laboratory plastic. The production of polypropylene (PP) test tubes, PP tips, and polyethylene (PE) caps via injection molding inevitably requires the addition of some amounts of so-called ‘slip agent’, ‘slip additive’, ‘mold release additive’ into the plastic. Generally, these substances could be divided into low-molecular-weight (LMW) additives (e.g., erucamide and oleamide, fatty acids, LMW esters, hydrocarbon waxes) and polymeric ones. LMW additives partially migrate to the surface of the product during injection molding. Different test tubes / tips manufacturers use different additives with no disclosure of their nature or amount added. As a result, two identical-looking tubes from different manufacturers, both claimed to be made of PP, might hugely differ in their surface properties. Some tubes or tips, in fact, have patches of thin hydrophobic film on their surface. Metallic nanoparticles are known to concentrate on such interfaces [59,60]. This process leads to losses of AgNPs, especially at elevated ionic strengths, which weaken nanoparticle repulsion. Figure A20 demonstrates some examples of this phenomenon. Under stirring, this process might be very fast (Figure A20c,d) with a rate of 0.5% per minute. Solutions to this problem are not numerous so far. First, we carefully check every type (sometimes even particular lots/batches) of plasticware used for AgNPs manipulation. Second, in some cases 10-15 minutes sonication of new tubes in 10 mM NaOH with subsequent rinse with water has shown good results.
Figure A20.
Demonstration of AgNPs losses due to adsorption on polypropylene plastic. (a) SSI 5 ml tips: new one (top) and used once to dose AgNPs in 5 mM NaCl (bottom). Note the black patches on the inner surface of the bottom tip. (b) Two different lots of Greiner 15 ml test tubes used for overnight storage of AgNPs in reaction medium. The tube from the bottom lot is not appropriate for AgNPs synthesis or manipulation. (c) UV-vis absorbance of AgNPs in 20 mM NaCl in a test tube from a bad lot with constant mixing. In 41 minutes, 23% of particles were lost. (d) The same data as (c), normalized by Amax. Note that all four spectra are identical. Nothing is happening to AgNPs except losses to adsorption.
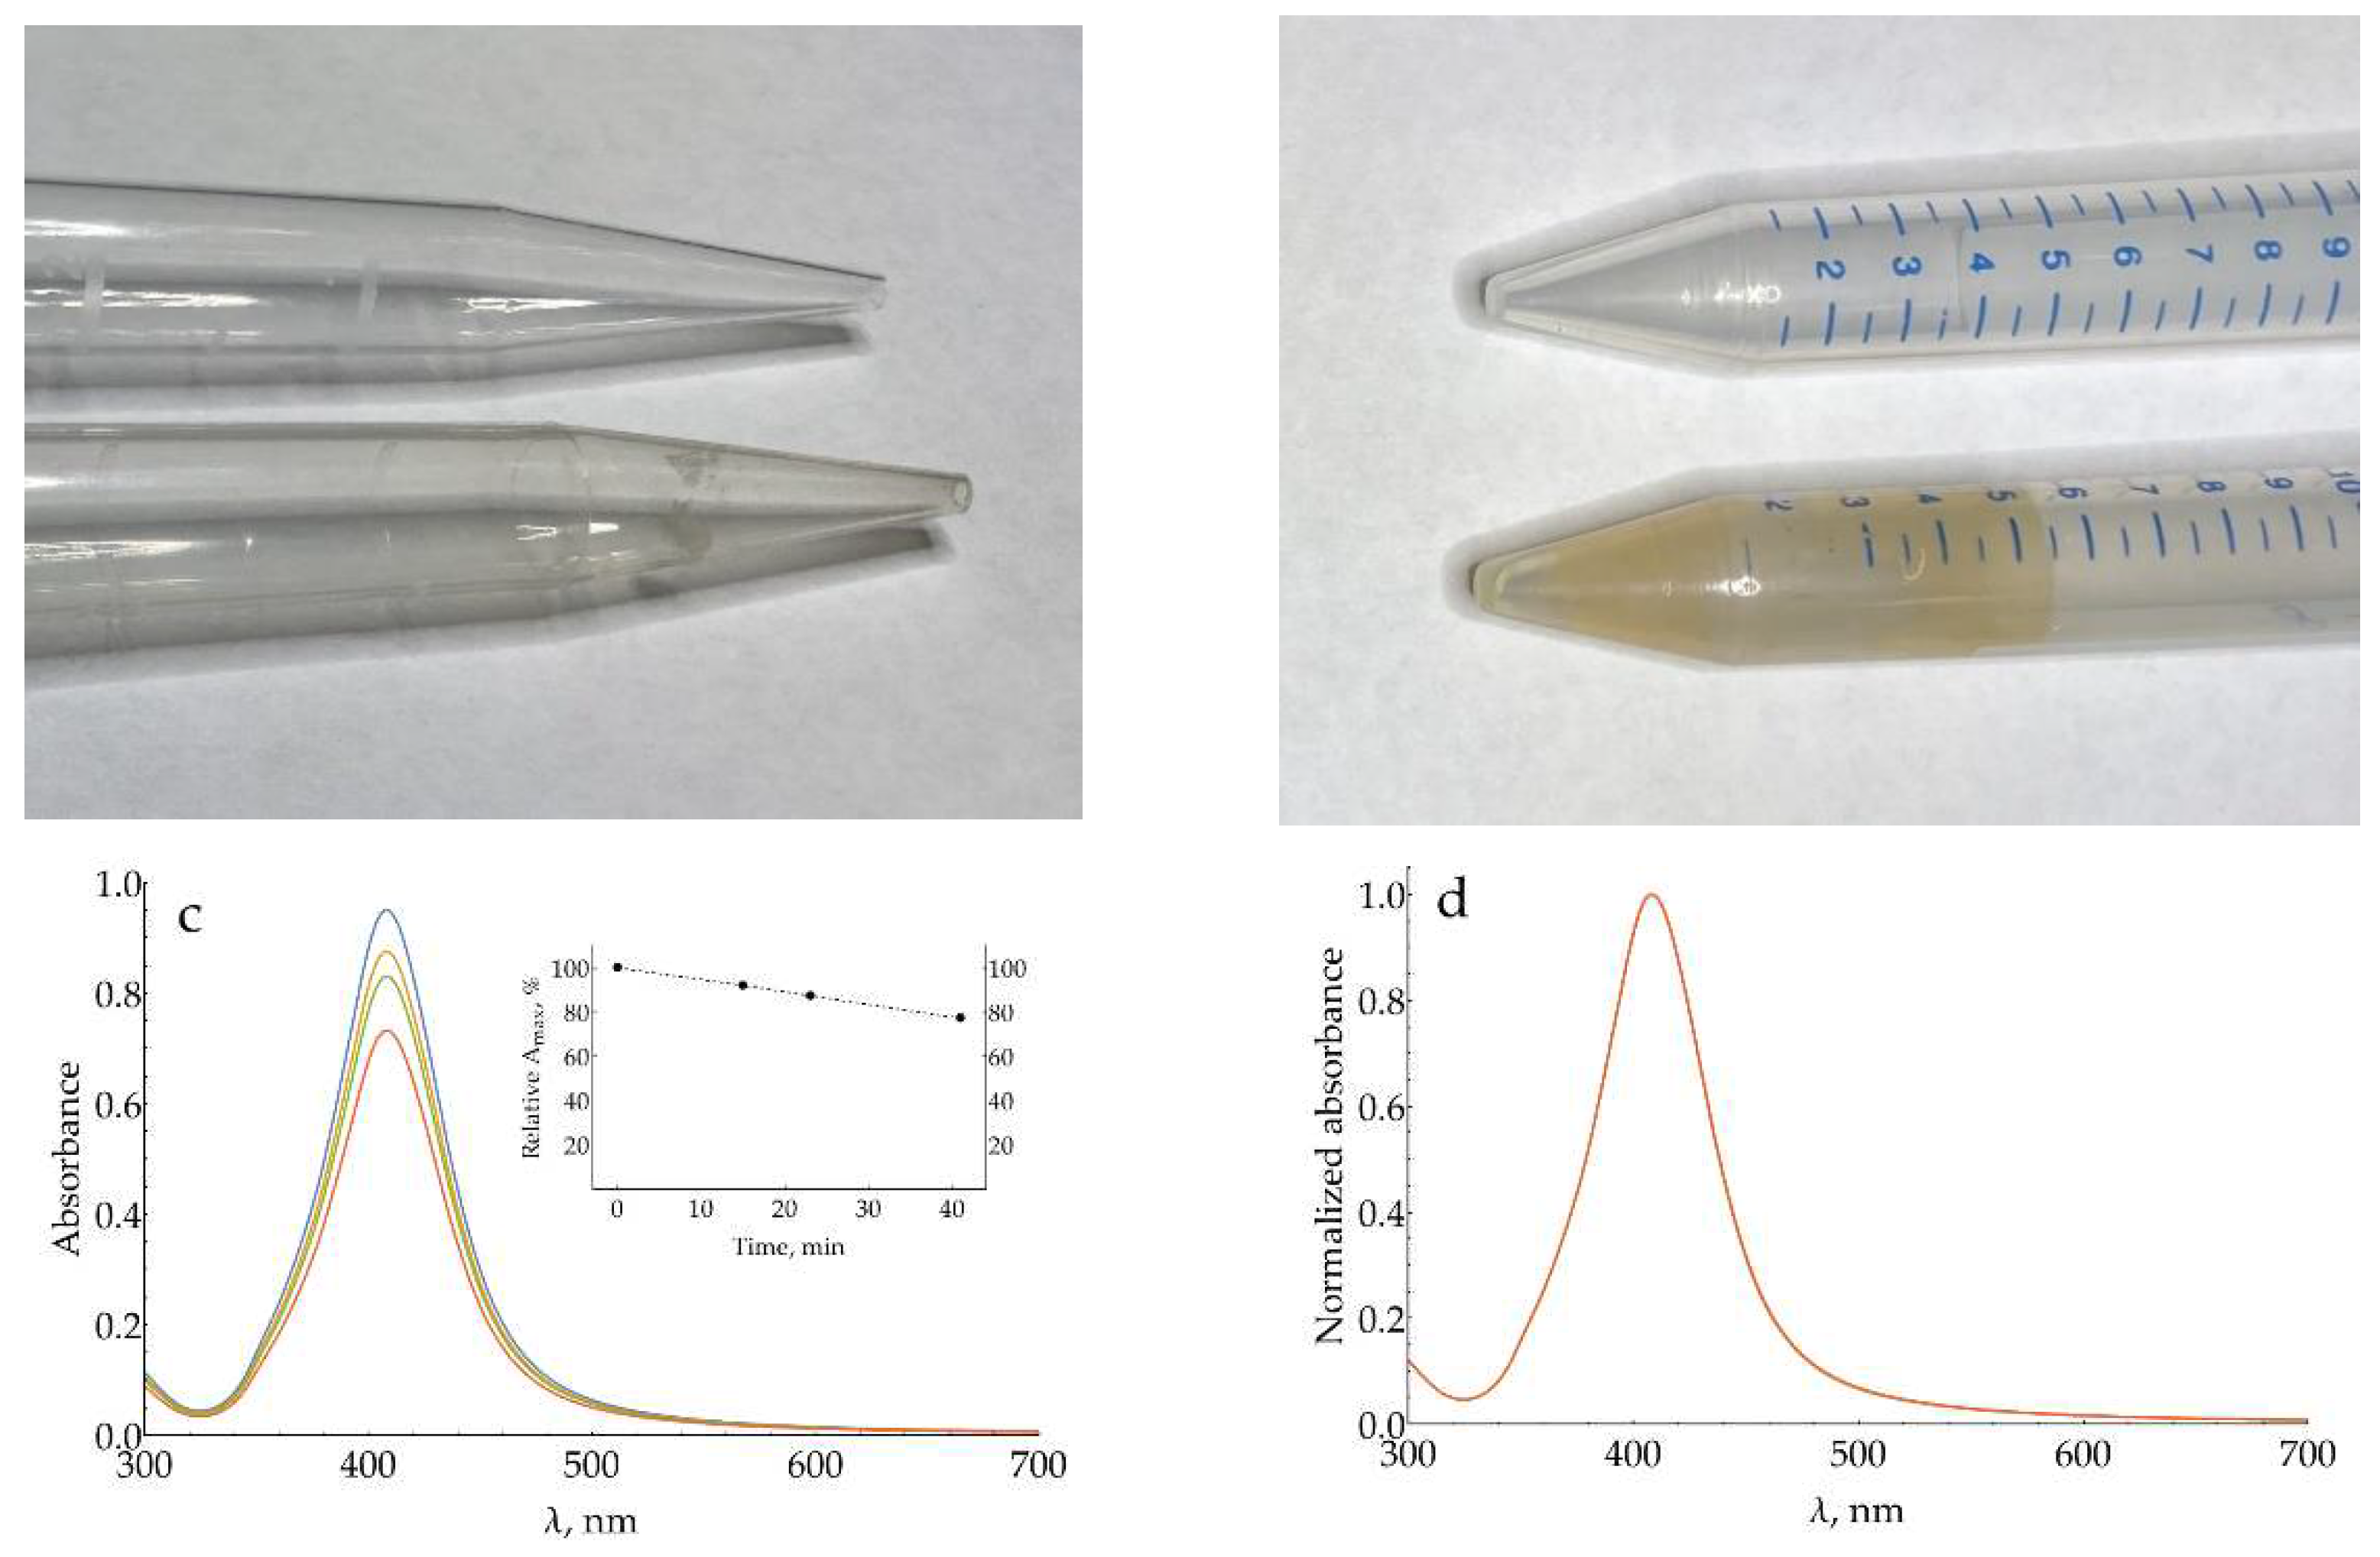
Appendix G
This appendix contains additional information and illustrations about quantitative processing of the SER spectra. A simpler procedure was applied to spectra obtained under varying conditions (aggregating agent concentration optimization, pH selection, surface chloride optimization). Its step-by-step application to the spectra is shown in Figure A21 using a dataset from the first repeat of 0 or 500 nM DAP at different pHs (Figure 5b,d).
Figure A21.
Demonstration of the first processing procedure applied to the spectra obtained under varying conditions using a dataset from various pHs, 0 or 500 nM DAP as an example. Blue curves: pH = 4; black curves: pH = 3; green curves: pH = 2; red curves: H2SO4. (a) Raw spectra, gray shading depicts two pieces used for further analysis; (b) The piece around the band 733 cm-1, blue shading shows the ranges used for linear approximation of the baseline; (c) The piece around the band 1374 cm-1, blue shading shows the ranges used for linear approximation of the baseline. (d) The same data as ‘b’ with baseline subtracted; (e) The same data as ‘c’ with baseline subtracted.
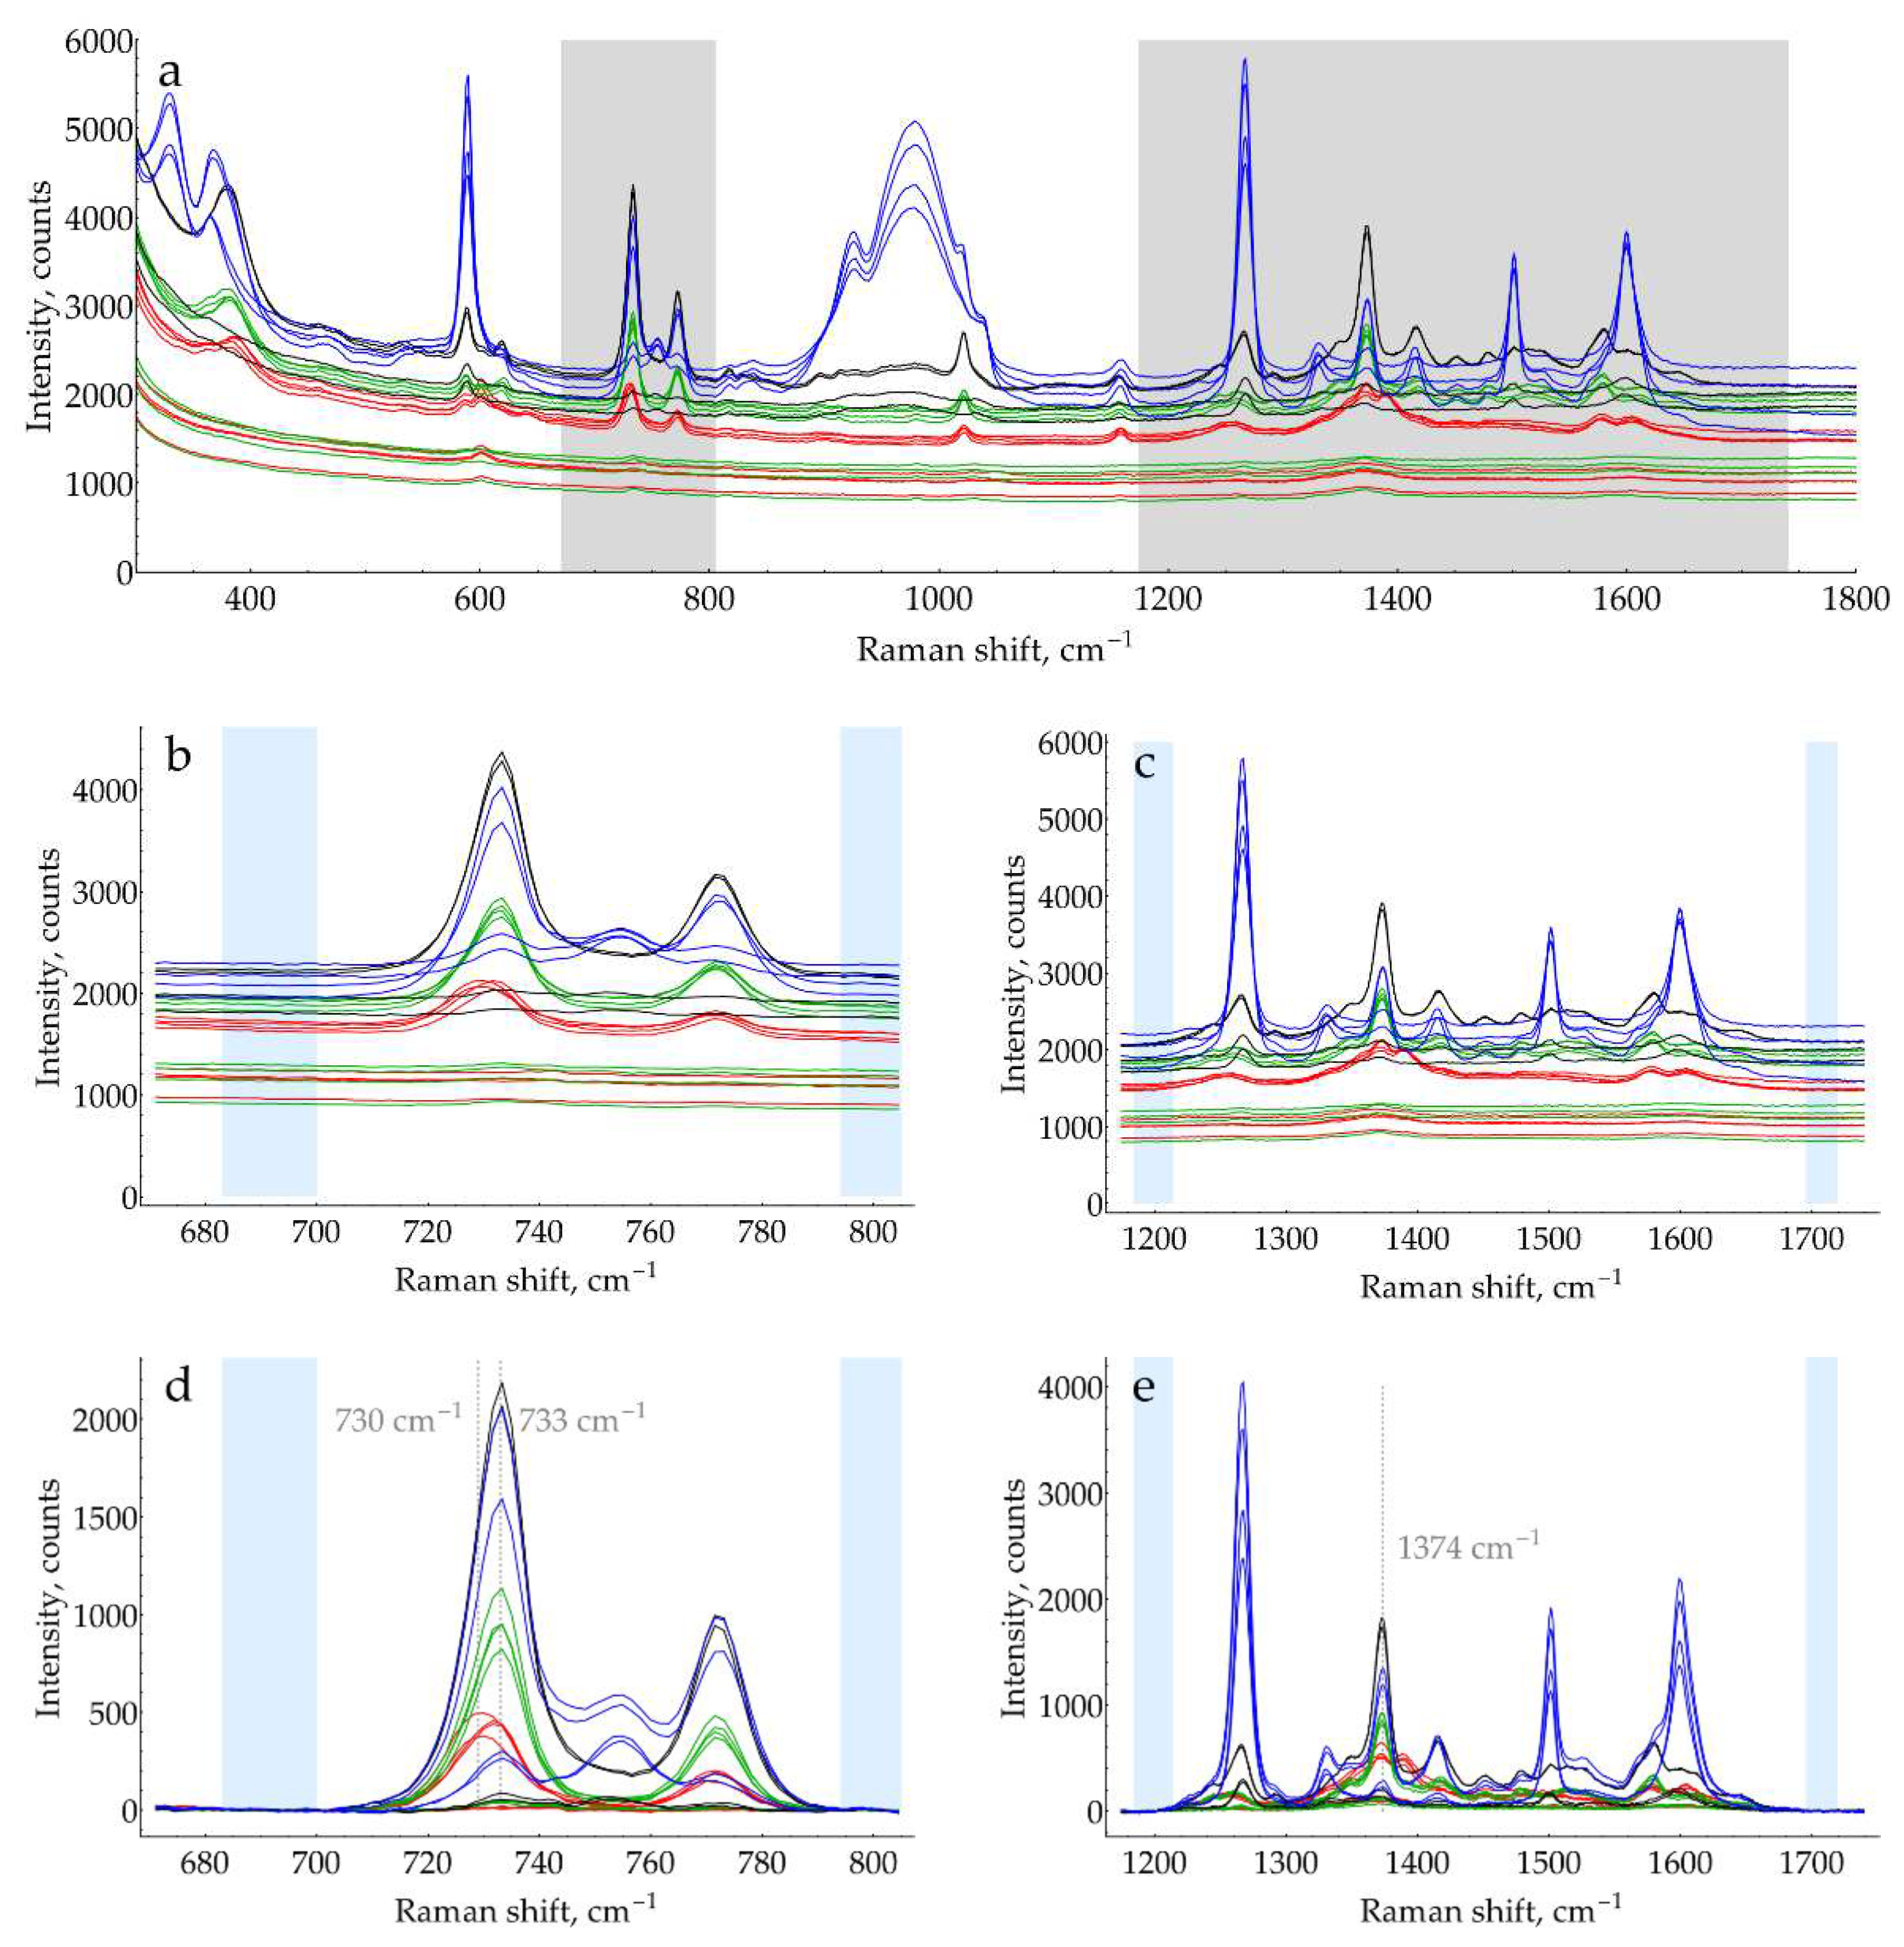
The second procedure of fitting the spectra with a non-negative linear superposition of known peak shapes was applied to the data obtained in optimized conditions (DAP and HRP calibration curves). Figure A22 illustrates this procedure.
Figure A22.
Demonstration of the second processing procedure applied to the spectra obtained at optimized conditions. (a) The plot of peak shapes around 733 cm-1; (b) The plot of peak shapes around 1374 cm-1; (c, e) Examples of fitting curves around 733 cm-1 at high and low DAP concentrations; (d, f) Examples of fitting curves around 1374 cm-1 at high and low DAP concentrations. Blue points represent experimental spectrum, red line – total fit, dashed black curve – quadratic polynomial background, colored dashed lines – fitted peak shapes.
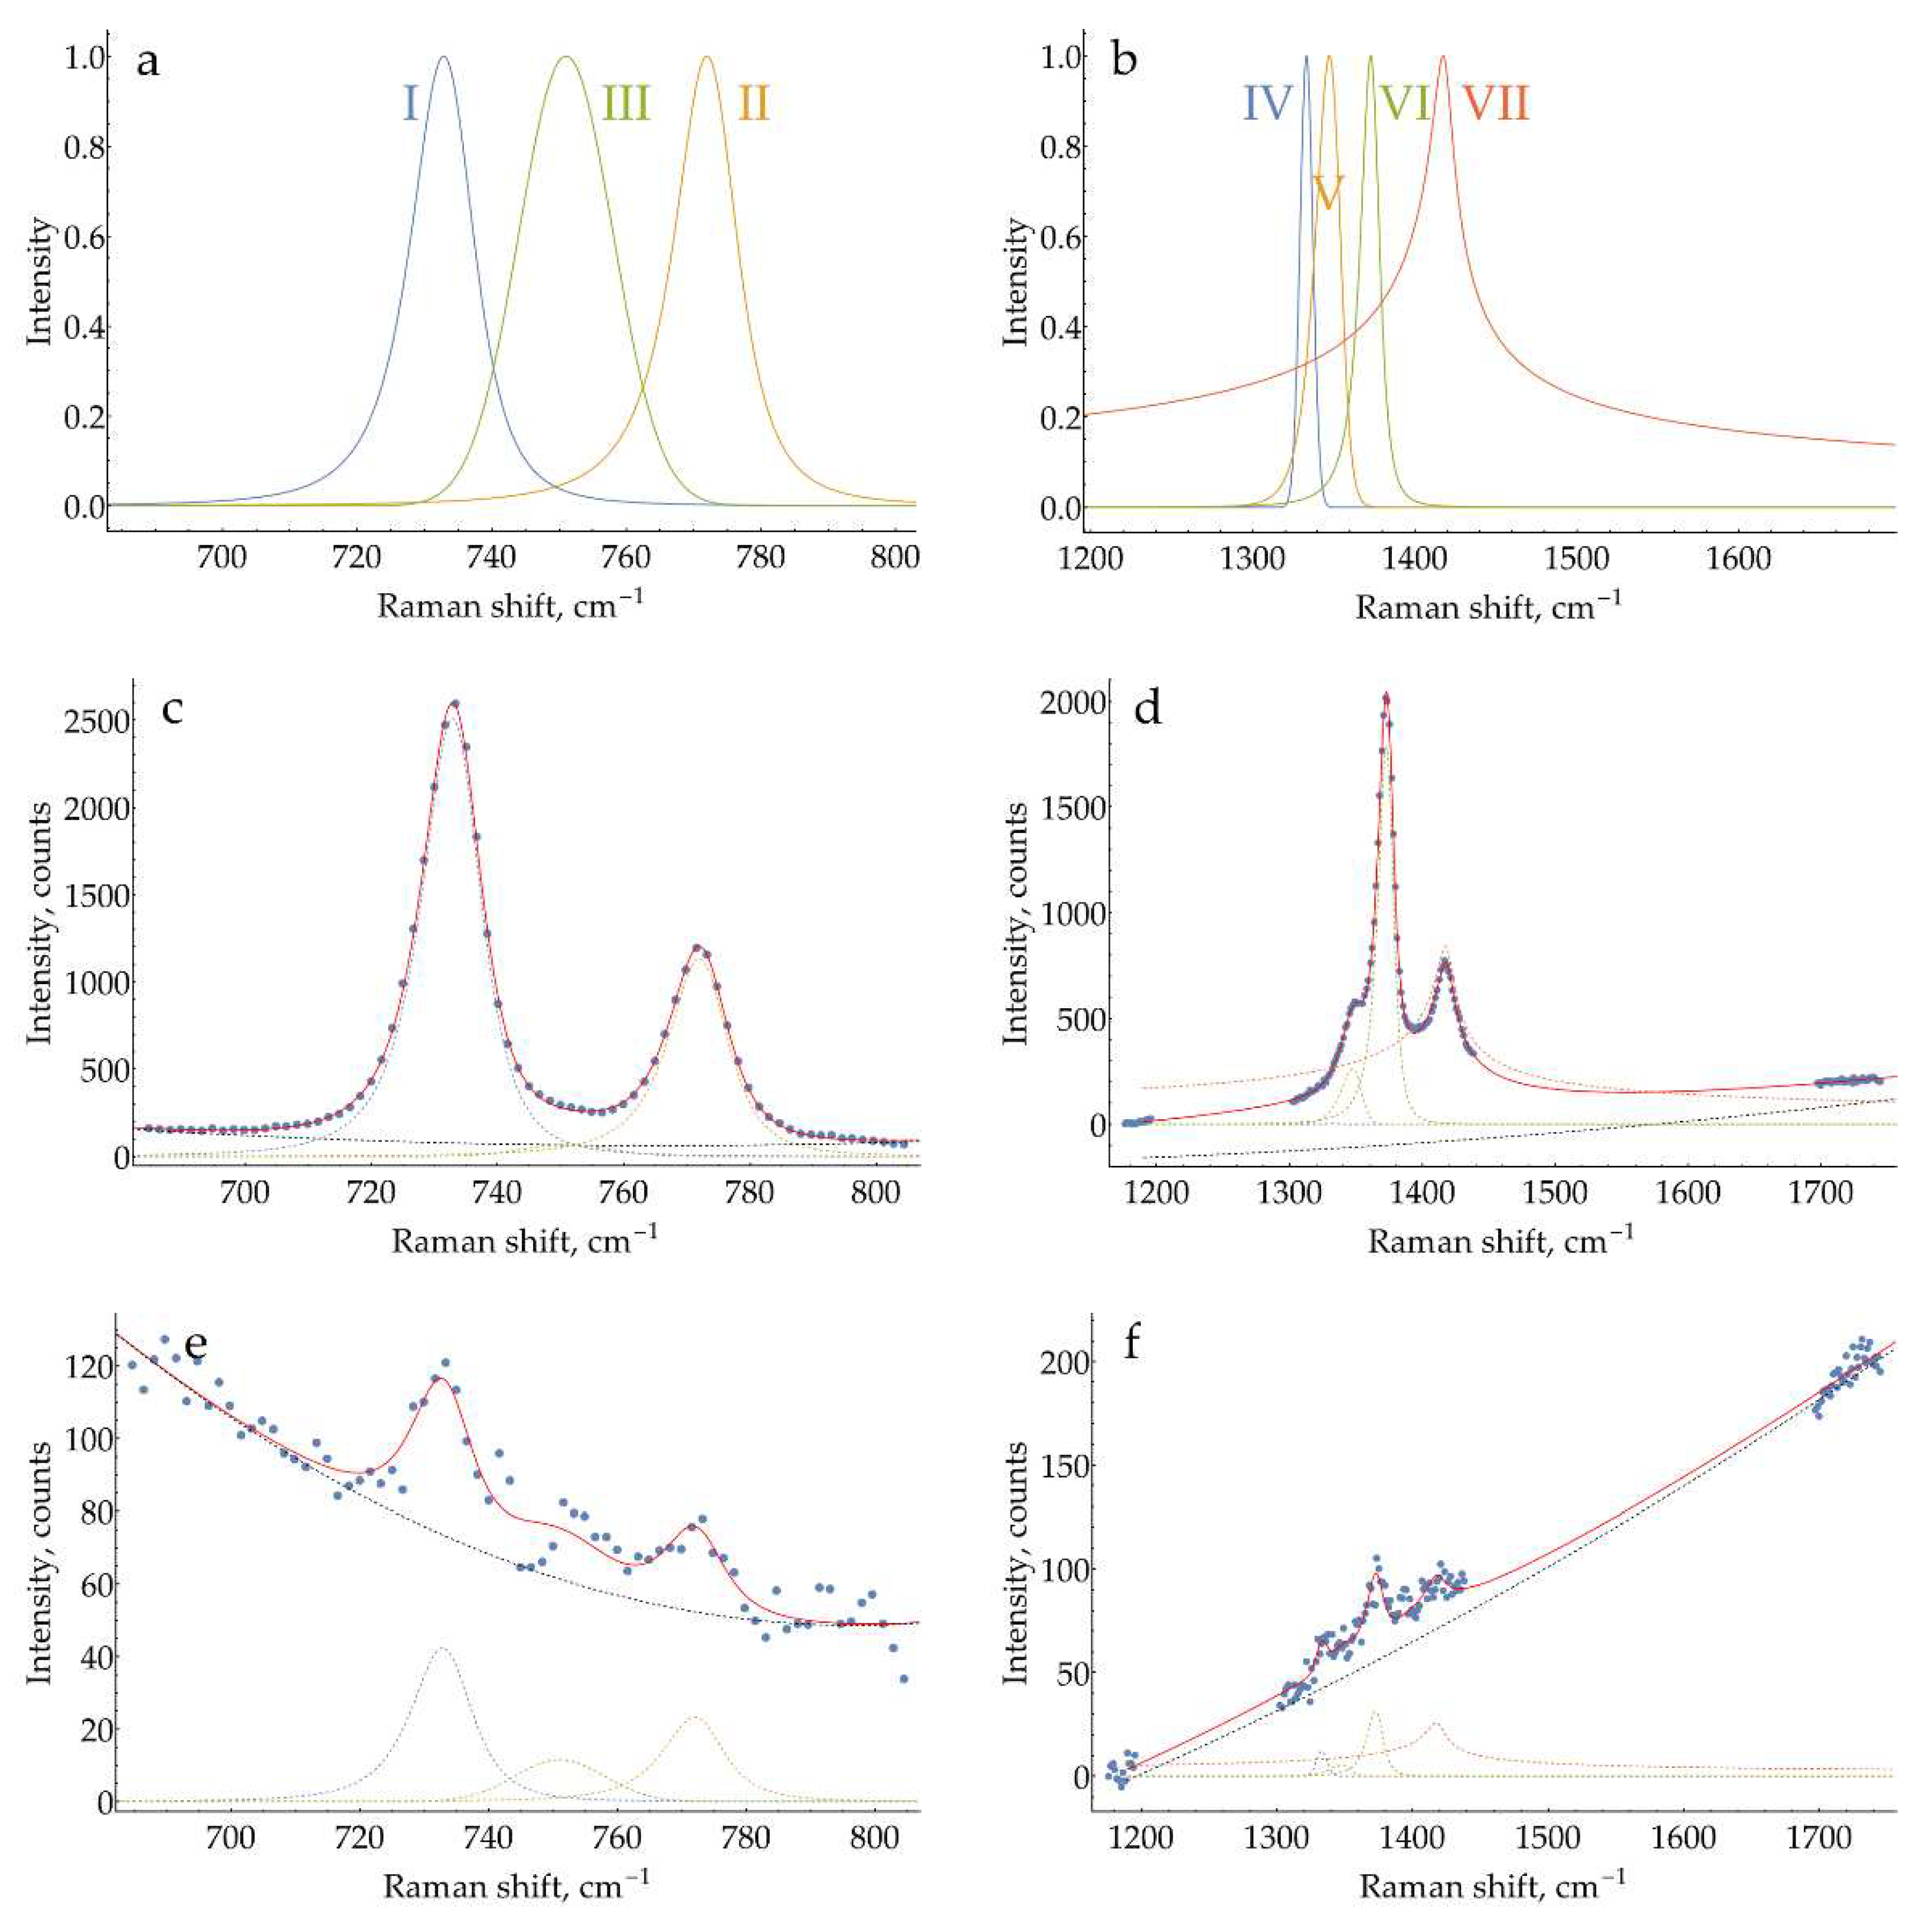
Equations of used peak shapes:
Peak VII turned out to be very broad, but it is compensated by the polynomial baseline, so the total background for the desired 1374 cm-1 band is adequate. At high and moderate concentrations, both procedures result in very close intensities, while in a low concentration range, the second procedure exhibits much less variance for repeated data points. As a result, it is preferred for the developed analytical protocol.
References
- Mekler, V.M.; Bystryak, S.M. Application of O-Phenylenediamine as a Fluorogenic Substrate in Peroxidase-Mediated Enzyme-Linked Immunosorbent Assay. Anal. Chim. Acta 1992, 264, 359–363. [Google Scholar] [CrossRef]
- Acharya, A.P.; Nafisi, P.M.; Gardner, A.; MacKay, J.L.; Kundu, K.; Kumar, S.; Murthy, N. A Fluorescent Peroxidase Probe Increases the Sensitivity of Commercial ELISAs by Two Orders of Magnitude. Chem. Commun. 2013, 49, 10379–10381. [Google Scholar] [CrossRef] [PubMed]
- Zhang, Z.; Lai, J.; Wu, K.; Huang, X.; Guo, S.; Zhang, L.; Liu, J. Peroxidase-Catalyzed Chemiluminescence System and Its Application in Immunoassay. Talanta 2018, 180, 260–270. [Google Scholar] [CrossRef] [PubMed]
- Larmour, I.A.; Faulds, K.; Graham, D. The Past, Present and Future of Enzyme Measurements Using Surface Enhanced Raman Spectroscopy. Chem. Sci. 2010, 1, 151–160. [Google Scholar] [CrossRef]
- Kurochkin, I.N.; Vasilyeva, A.D.; Evtushenko, E.G.; Eremenko, A. V; Pergushov, D. V; Sigolaeva, L. V Enzymes in the Development of Physico-Chemical Methods for Biomedical Research. Moscow Univ. Chem. Bull. 2023, 78, 201–219. [Google Scholar] [CrossRef]
- Plaksin, D.Y.; E.G., G. Poly-HRP Conjugates: Novel Reagents for Ultrasensitive Detection in Immunoassays, Nucleic Acid Hybridization and Ligand-Receptor Assay Systems. J. NIH Res. 1994, 6, 98.
- Bobrow, M.N.; Harris, T.D.; Shaughnessy, K.J.; Litt, G.J. Catalyzed Reporter Deposition, a Novel Method of Signal Amplification Application to Immunoassays. J. Immunol. Methods 1989, 125, 279–285. [Google Scholar] [CrossRef]
- Dou, X.; Takama, T.; Yamaguchi, Y.; Yamamoto, H.; Ozaki, Y. Enzyme Immunoassay Utilizing Surface-Enhanced Raman Scattering of the Enzyme Reaction Product. Anal. Chem. 1997, 69, 1492–1495. [Google Scholar] [CrossRef]
- Wu, Z.-S.; Zhou, G.-Z.; Jiang, J.-H.; Shen, G.-L.; Yu, R.-Q. Gold Colloid-Bienzyme Conjugates for Glucose Detection Utilizing Surface-Enhanced Raman Scattering. Talanta 2006, 70, 533–539. [Google Scholar] [CrossRef]
- Fu, C.; Wang, Y.; Tian, X.; Wu, Y.; Cao, H.; Li, Y.; Jung, Y.M. Horseradish Peroxidase-Repeat Assay Based on Tyramine Signal Amplification for Highly Sensitive H2O2 Detection by Surface-Enhanced Raman Scattering. Analyst 2021, 146, 7320–7326. [Google Scholar] [CrossRef]
- Fu, C.; Zhang, L.; Bao, M.; Zhang, Y.; Li, Y.; Wu, Y.; Jung, Y.M. Signal Amplification Surface-Enhanced Raman Scattering Immunosorbent Assay of Human Chorionic Gonadotrophin Based on Repeated Enzyme Biocatalytic Precipitation. Analyst 2022, 147, 5718–5724. [Google Scholar] [CrossRef] [PubMed]
- Song, Y.; Wang, D.; Li, Z.; Wang, L.; Fan, C.; He, X.; Xu, T.; Zhang, X. Jigsaw-like Mini-Pillar Platform for Multi-Mode Biosensing. Chinese Chem. Lett. 2022, 33, 3879–3882. [Google Scholar] [CrossRef]
- Stevenson, R.; Ingram, A.; Leung, H.; McMillan, D.C.; Graham, D. Quantitative SERRS Immunoassay for the Detection of Human PSA. Analyst 2009, 134, 842–844. [Google Scholar] [CrossRef] [PubMed]
- Yu, Z.; Chen, L.; Wang, Y.; Wang, X.; Song, W.; Ruan, W.; Zhao, B.; Cong, Q. A SERS-Active Enzymatic Product Used for the Quantification of Disease-Related Molecules. J. Raman Spectrosc. 2014, 45, 75–81. [Google Scholar] [CrossRef]
- Perumal, J.; Balasundaram, G.; Mahyuddin, A.P.; Choolani, M.; Olivo, M. SERS-Based Quantitative Detection of Ovarian Cancer Prognostic Factor Haptoglobin. Int. J. Nanomedicine 2015, 10, 1831–1840. [Google Scholar] [CrossRef]
- Zhan, L.; Zhen, S.J.; Wan, X.Y.; Gao, P.F.; Huang, C.Z. A Sensitive Surface-Enhanced Raman Scattering Enzyme-Catalyzed Immunoassay of Respiratory Syncytial Virus. Talanta 2016, 148, 308–312. [Google Scholar] [CrossRef]
- Kudryashova, A.M.; Galstian, A.G.; Faizuloev, E.B.; Olenin, A.Y.; Lisichkin, G.V.; Zverev, V.V.; Borisova, O.V. Detection of adenovirus antigen by a surface-enhanced Raman scattering enzyme-linked immunosorbent assay. J. Microbiol. Epidemiol. Immunobiol. 2018, 95, 25–31. [Google Scholar] [CrossRef]
- Guo, W.; Hu, Y.; Wei, H. Enzymatically Activated Reduction-Caged SERS Reporters for Versatile Bioassays. Analyst 2017, 142, 2322–2326. [Google Scholar] [CrossRef]
- Tarcha, P.J.; Chu, V.P.; Whittern, D. 2,3-Diaminophenazine Is the Product from the Horseradish Peroxidase-Catalyzed Oxidation of o-Phenylenediamine. Anal. Biochem. 1987, 165, 230–233. [Google Scholar] [CrossRef]
- Hempen, C.; van Leeuwen, S.M.; Luftmann, H.; Karst, U. Liquid Chromatographic/Mass Spectrometric Investigation on the Reaction Products in the Peroxidase-Catalyzed Oxidation of o-Phenylenediamine by Hydrogen Peroxide. Anal. Bioanal. Chem. 2005, 382, 234–238. [Google Scholar] [CrossRef]
- Evtushenko, E.G.; Gavrilina, E.S.; Gusarova, D.Y.; Vasil’eva, A.D.; Yurina, L. V; Kurochkin, I.N. Application of Hydroxylamine Sols of Silver Nanoparticles to Obtain Reference SERS Spectra. Bull. Lebedev Phys. Inst. 2023, 50, S547–S551. [Google Scholar] [CrossRef]
- Qi, G.; Fu, C.; Chen, G.; Xu, S.; Xu, W. Highly Sensitive SERS Sensor for Mercury Ions Based on the Catalytic Reaction of Mercury Ion Decorated Ag Nanoparticles. RSC Adv. 2015, 5, 49759–49764. [Google Scholar] [CrossRef]
- Fornera, S.; Walde, P. Spectrophotometric Quantification of Horseradish Peroxidase with O-Phenylenediamine. Anal. Biochem. 2010, 407, 293–295. [Google Scholar] [CrossRef] [PubMed]
- Koh, T.Y.; Greaves, S.J.; Griffith, W.P. Vibrational Spectra of 1,2-Diaminobenzene, 4,5-Dimethyl-1,2-Diaminobenzene and Catechol and Their SER Spectra. Spectrochim. Acta Part A Mol. Spectrosc. 1994, 50, 857–873. [Google Scholar] [CrossRef]
- Ouyang, L.; Li, D.; Zhu, L.; Yang, W.; Tang, H. A New Plasmonic Pickering Emulsion Based SERS Sensor for in Situ Reaction Monitoring and Kinetic Study. J. Mater. Chem. C 2016, 4, 736–744. [Google Scholar] [CrossRef]
- Yu, R.-J.; Sun, J.-J.; Song, H.; Tian, J.-Z.; Li, D.-W.; Long, Y.-T. Real-Time Sensing of O-Phenylenediamine Oxidation on Gold Nanoparticles. Sensors 2017, 17, 530. [Google Scholar] [CrossRef] [PubMed]
- He, D.; Jones, A.M.; Garg, S.; Pham, A.N.; Waite, T.D. Silver Nanoparticle−Reactive Oxygen Species Interactions: Application of a Charging−Discharging Model. J. Phys. Chem. C 2011, 115, 5461–5468. [Google Scholar] [CrossRef]
- Liang, J.; Liu, H.; Huang, C.; Yao, C.; Fu, Q.; Li, X.; Cao, D.; Luo, Z.; Tang, Y. Aggregated Silver Nanoparticles Based Surface-Enhanced Raman Scattering Enzyme-Linked Immunosorbent Assay for Ultrasensitive Detection of Protein Biomarkers and Small Molecules. Anal. Chem. 2015, 87, 5790–5796. [Google Scholar] [CrossRef]
- Sigg, L.; Lindauer, U. Silver Nanoparticle Dissolution in the Presence of Ligands and of Hydrogen Peroxide. Environ. Pollut. 2015, 206, 582–587. [Google Scholar] [CrossRef]
- Brown, K.C.; Corbett, J.F.; Loveless, N.P. Spectrophotometric Studies on the Protonation of Hydroxy and Aminophenazines in Aqueous Solution. Spectrochim. Acta Part A Mol. Spectrosc. 1979, 35, 421–423. [Google Scholar] [CrossRef]
- He, X.; Zhang, L.; Chua, R.; Wong, P.K.J.; Arramel, A.; Feng, Y.P.; Wang, S.J.; Chi, D.; Yang, M.; Huang, Y.L.; et al. Selective Self-Assembly of 2,3-Diaminophenazine Molecules on MoSe2 Mirror Twin Boundaries. Nat. Commun. 2019, 10, 2847. [Google Scholar] [CrossRef] [PubMed]
- Bovaird, J.H.; Ngo, T.T.; Lenhoff, H.M. Optimizing the O-Phenylenediamine Assay for Horseradish Peroxidase: Effects of Phosphate and PH, Substrate and Enzyme Concentrations, and Stopping Reagents. Clin. Chem. 1982, 28, 2423–2426. [Google Scholar] [CrossRef] [PubMed]
- Iseminger, P.W.; Gregory, M.; Weakley, T.J.R.; Caple, G.; Sykes, A.G. Characterization of 3-Aminophenazin-2-Ol Isolated from the Chemical Oxidation of o-Phenylenediamine. J. Org. Chem. 1997, 62, 2643–2645. [Google Scholar] [CrossRef] [PubMed]
- Lin, C.-E.; Chen, Y.-T. Migration Behavior and Separation of Benzenediamines, Aminophenols and Benzenediols by Capillary Zone Electrophoresis. J. Chromatogr. A 2000, 871, 357–366. [Google Scholar] [CrossRef]
- Orendorff, C.J.; Gearheart, L.; Jana, N.R.; Murphy, C.J. Aspect Ratio Dependence on Surface Enhanced Raman Scattering Using Silver and Gold Nanorod Substrates. Phys. Chem. Chem. Phys. 2006, 8, 165–170. [Google Scholar] [CrossRef] [PubMed]
- Zannotti, M.; Rossi, A.; Giovannetti, R. SERS Activity of Silver Nanosphere, Triangular Nanoplates, Hexagonal Nanoplates and Quasi-Spherical Nanoparticles: Effect of Shape and Morphology. Coatings 2020, 10. [Google Scholar] [CrossRef]
- Doyle, R.P.; Kruger, P.E.; Mackie, P.R.; Nieuwenhuyzen, M. Phenazine-2,3-Diamine. Acta Crystallogr. Sect. C 2001, C57, 104–105. [Google Scholar] [CrossRef]
- Mei, L.; Tai, L.S.; Tao, F.H.; Jie, S.; Rong, L.Q. A Novel Synthesis of 2,3-Diaminophenazine. Res. Chem. Intermed. 2012, 38, 499–505. [Google Scholar] [CrossRef]
- Mahato, R.K.; Mahanty, A.K.; Kotakonda, M.; Prasad, S.; Bhattacharyya, S.; Biswas, B. A Hydrated 2,3-Diaminophenazinium Chloride as a Promising Building Block against SARS-CoV-2. Sci. Rep. 2021, 11, 23122. [Google Scholar] [CrossRef]
- Leopold, N.; Lendl, B. A New Method for Fast Preparation of Highly Surface-Enhanced Raman Scattering (SERS) Active Silver Colloids at Room Temperature by Reduction of Silver Nitrate with Hydroxylamine Hydrochloride. J. Phys. Chem. B 2003, 107, 5723–5727. [Google Scholar] [CrossRef]
- Li, D.-J.; Li, X.-W.; Xie, Y.-X.; Cai, X.-Q.; Zou, G.-L. Identification of Intermediate and Product from Methemoglobin-Catalyzed Oxidation of o-Phenylenediamine in Two-Phase Aqueous—Organic System. Biochem. 2005, 70, 92–99. [Google Scholar] [CrossRef]
- Badawi, H.M.; Förner, W.; Ali, S.A. A Comparative Study of the Infrared and Raman Spectra of Aniline and O-, m-, p-Phenylenediamine Isomers. Spectrochim. Acta Part A Mol. Biomol. Spectrosc. 2013, 112, 388–396. [Google Scholar] [CrossRef] [PubMed]
- Kaya Kınaytürk, N.; Kalaycı, T.; Tunalı, B. Experimental and Computational Investigations on the Molecular Structure, Vibrational Spectra, Electronic Properties, and Molecular Electrostatic Potential Analysis of Phenylenediamine Isomers. Spectrosc. Lett. 2021, 54, 693–706. [Google Scholar] [CrossRef]
- Martin, E.L. O-Phenylenediamine. Org. Synth. 1939, 19, 70. [Google Scholar] [CrossRef]
- Zhong, X.; Loges, A.; Roddatis, V.; John, T. Measurement of Crystallographic Orientation of Quartz Crystal Using Raman Spectroscopy: Application to Entrapped Inclusions. Contrib. to Mineral. Petrol. 2021, 176, 89. [Google Scholar] [CrossRef]
- Wu, D.; Fang, Y. Study of Adsorptive Behavior of a Series of N-Aminobenzoic Acids on Silver Nanoparticles by SERS. Sci. Access 2004, 2, 286–287. [Google Scholar] [CrossRef]
- Yan, B.; Fang, Y.; Zhao, X.; Liang, L. A Comparative Study on the Adsorption Behaviors of PABA in the Silver Nano-Particles. J. Mol. Struct. 2014, 1074, 660–665. [Google Scholar] [CrossRef]
- Akbali, B.; Yagmurcukardes, M.; Peeters, F.M.; Lin, H.-Y.; Lin, T.-Y.; Chen, W.-H.; Maher, S.; Chen, T.-Y.; Huang, C.-H. Determining the Molecular Orientation on the Metal Nanoparticle Surface through Surface-Enhanced Raman Spectroscopy and Density Functional Theory Simulations. J. Phys. Chem. C 2021, 125, 16289–16295. [Google Scholar] [CrossRef]
- Chong, N.S.; Donthula, K.; Davies, R.A.; Ilsley, W.H.; Ooi, B.G. Significance of Chemical Enhancement Effects in Surface-Enhanced Raman Scattering (SERS) Signals of Aniline and Aminobiphenyl Isomers. Vib. Spectrosc. 2015, 81, 22–31. [Google Scholar] [CrossRef]
- Zhao, L.-B.; Huang, R.; Bai, M.-X.; Wu, D.-Y.; Tian, Z.-Q. Effect of Aromatic Amine−Metal Interaction on Surface Vibrational Raman Spectroscopy of Adsorbed Molecules Investigated by Density Functional Theory. J. Phys. Chem. C 2011, 115, 4174–4183. [Google Scholar] [CrossRef]
- Tao, S.; Yu, L.-J.; Pang, R.; Huang, Y.-F.; Wu, D.-Y.; Tian, Z.-Q. Binding Interaction and Raman Spectra of P−π Conjugated Molecules Containing CH2/NH2 Groups Adsorbed on Silver Surfaces: A DFT Study of Wagging Modes. J. Phys. Chem. C 2013, 117, 18891–18903. [Google Scholar] [CrossRef]
- Noto, R.; Leone, M.; La Manna, G.; Brugè, F.; Fornili, S.L. Ab Initio Calculations and Vibrational Spectroscopy on the Phenylenediamine Isomers. J. Mol. Struct. THEOCHEM 1998, 422, 35–48. [Google Scholar] [CrossRef]
- Li, F.; Liu, J.; Hu, Y.; Deng, N.; He, J. An Ultrasensitive Label-Free Colorimetric Assay for Glutathione Based on Ag+ Regulated Autocatalytic Oxidation of o-Phenylenediamine. Talanta 2018, 186, 330–336. [Google Scholar] [CrossRef] [PubMed]
- Wang, D.; Lian, F.; Yao, S.; Ge, L.; Wang, Y.; Zhao, Y.; Zhao, J.; Song, X.; Zhao, C.; Xu, K. Detection of Formaldehyde (HCHO) in Solution Based on the Autocatalytic Oxidation Reaction of o-Phenylenediamine (OPD) Induced by Silver Ions (Ag+). J. Iran. Chem. Soc. 2021, 18, 3387–3397. [Google Scholar] [CrossRef]
- Al-Onazi, W.A.; Abdel-Lateef, M.A. Catalytic Oxidation of O-Phenylenediamine by Silver Nanoparticles for Resonance Rayleigh Scattering Detection of Mercury (II) in Water Samples. Spectrochim. Acta Part A Mol. Biomol. Spectrosc. 2022, 264, 120258. [Google Scholar] [CrossRef]
- Abdel-Lateef, M.A. Utilization of the Peroxidase-like Activity of Silver Nanoparticles Nanozyme on O-Phenylenediamine/H2O2 System for Fluorescence Detection of Mercury (II) Ions. Sci. Rep. 2022, 12, 6953. [Google Scholar] [CrossRef]
- Kleinman, S.L.; Frontiera, R.R.; Henry, A.-I.; Dieringer, J.A.; Van Duyne, R.P. Creating, Characterizing, and Controlling Chemistry with SERS Hot Spots. Phys. Chem. Chem. Phys. 2013, 15, 21–36. [Google Scholar] [CrossRef] [PubMed]
- Pazos-Perez, N.; Wagner, C.S.; Romo-Herrera, J.M.; Liz-Marzán, L.M.; García de Abajo, F.J.; Wittemann, A.; Fery, A.; Alvarez-Puebla, R.A. Organized Plasmonic Clusters with High Coordination Number and Extraordinary Enhancement in Surface-Enhanced Raman Scattering (SERS). Angew. Chemie Int. Ed. 2012, 51, 12688–12693. [Google Scholar] [CrossRef]
- Edel, J.B.; Kornyshev, A.A.; Urbakh, M. Self-Assembly of Nanoparticle Arrays for Use as Mirrors, Sensors, and Antennas. ACS Nano 2013, 7, 9526–9532. [Google Scholar] [CrossRef]
- Velleman, L.; Sikdar, D.; Turek, V.A.; Kucernak, A.R.; Roser, S.J.; Kornyshev, A.A.; Edel, J.B. Tuneable 2D Self-Assembly of Plasmonic Nanoparticles at Liquid|liquid Interfaces. Nanoscale 2016, 8, 19229–19241. [Google Scholar] [CrossRef]
Figure 1.
Typical UV-visible absorption spectra (a), hydrodynamic diameter, and particle concentration (b) of silver nanoparticle sols. Data is provided for both ‘as synthesized’ particles and those transferred into 5 or 20 mM NaCl. Numeric data in the inset table is presented as 95% confidence interval.
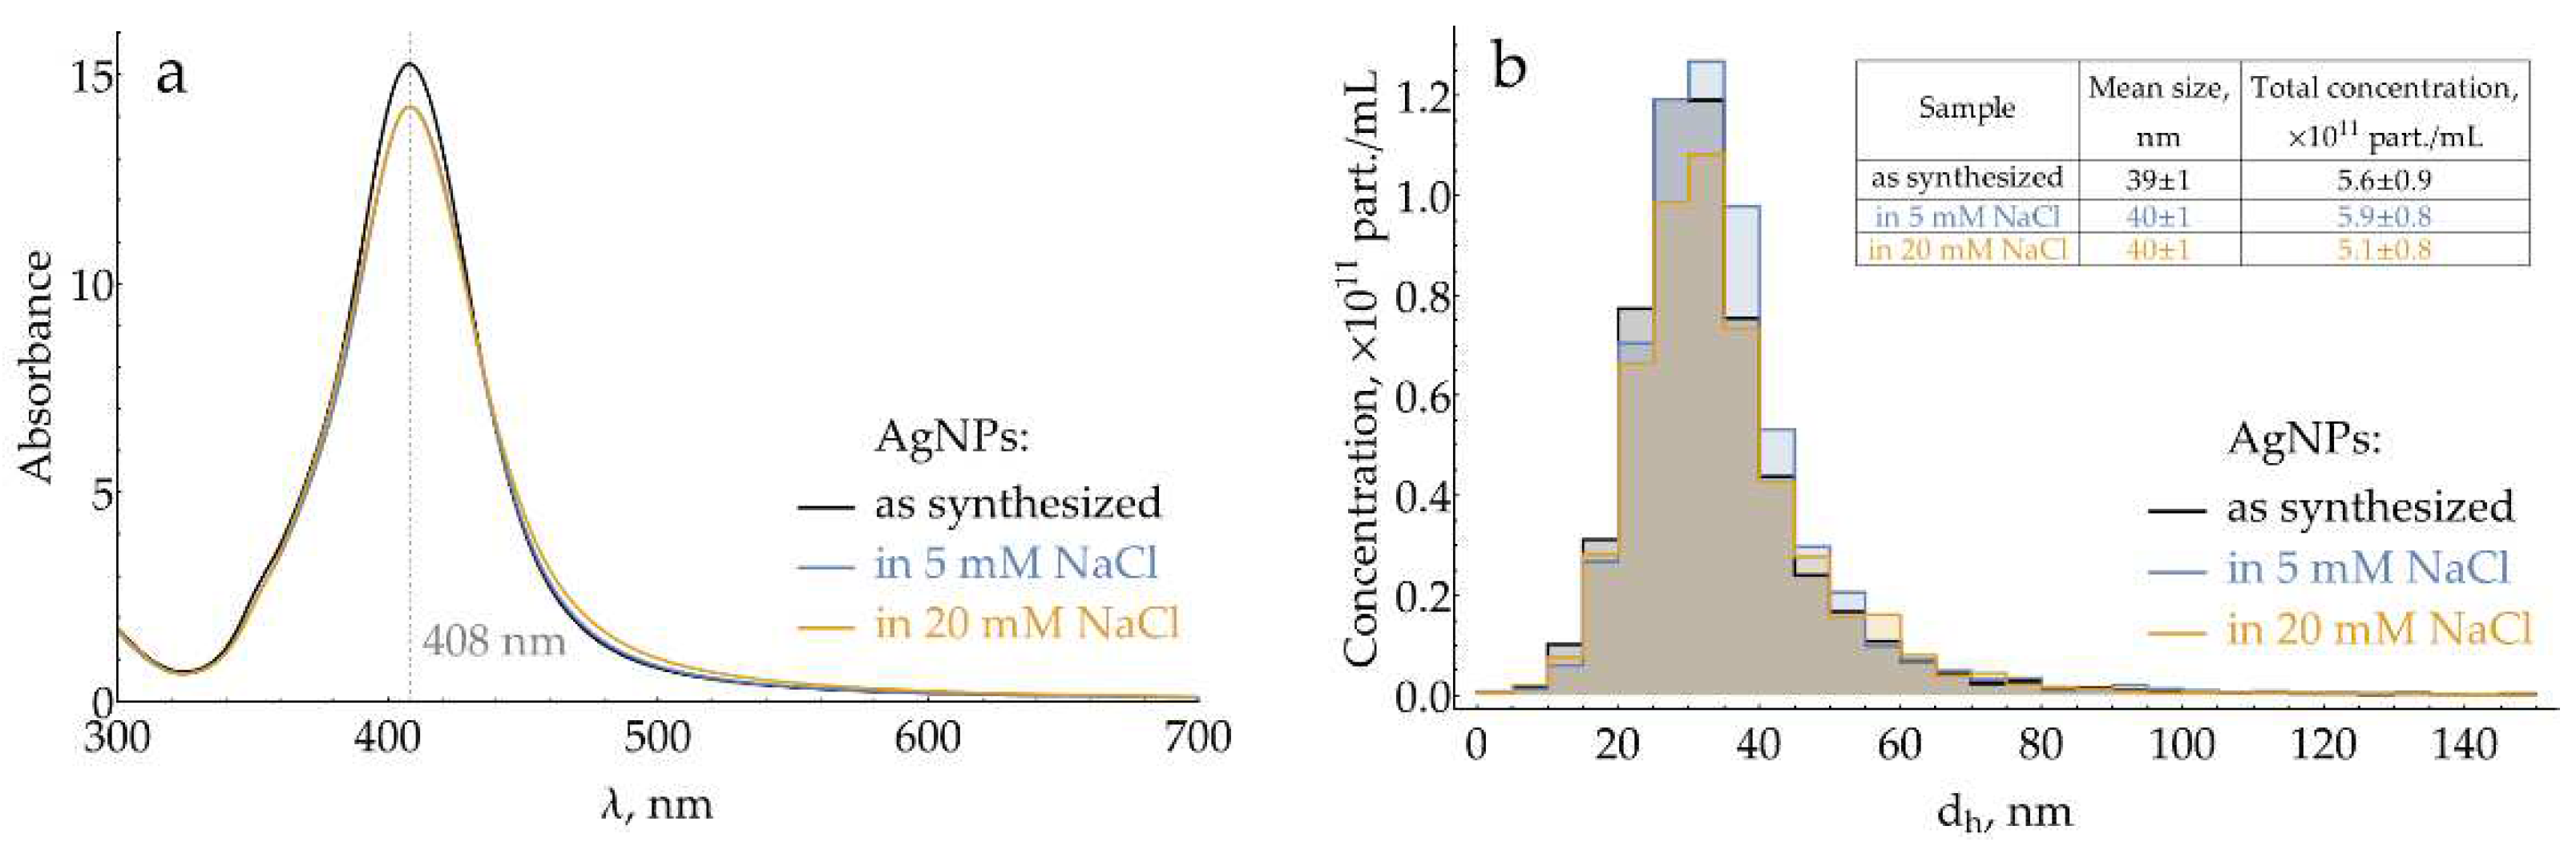
Figure 2.
Dependence of HRP enzymatic reaction rate on oPD concentration measured colorimetrically at 421 nm in 100 mM sodium phosphate buffer (pH = 6.0) with 8 ng/mL HRP and 80 μM H2O2. A solid line represents the best fit.
Figure 2.
Dependence of HRP enzymatic reaction rate on oPD concentration measured colorimetrically at 421 nm in 100 mM sodium phosphate buffer (pH = 6.0) with 8 ng/mL HRP and 80 μM H2O2. A solid line represents the best fit.
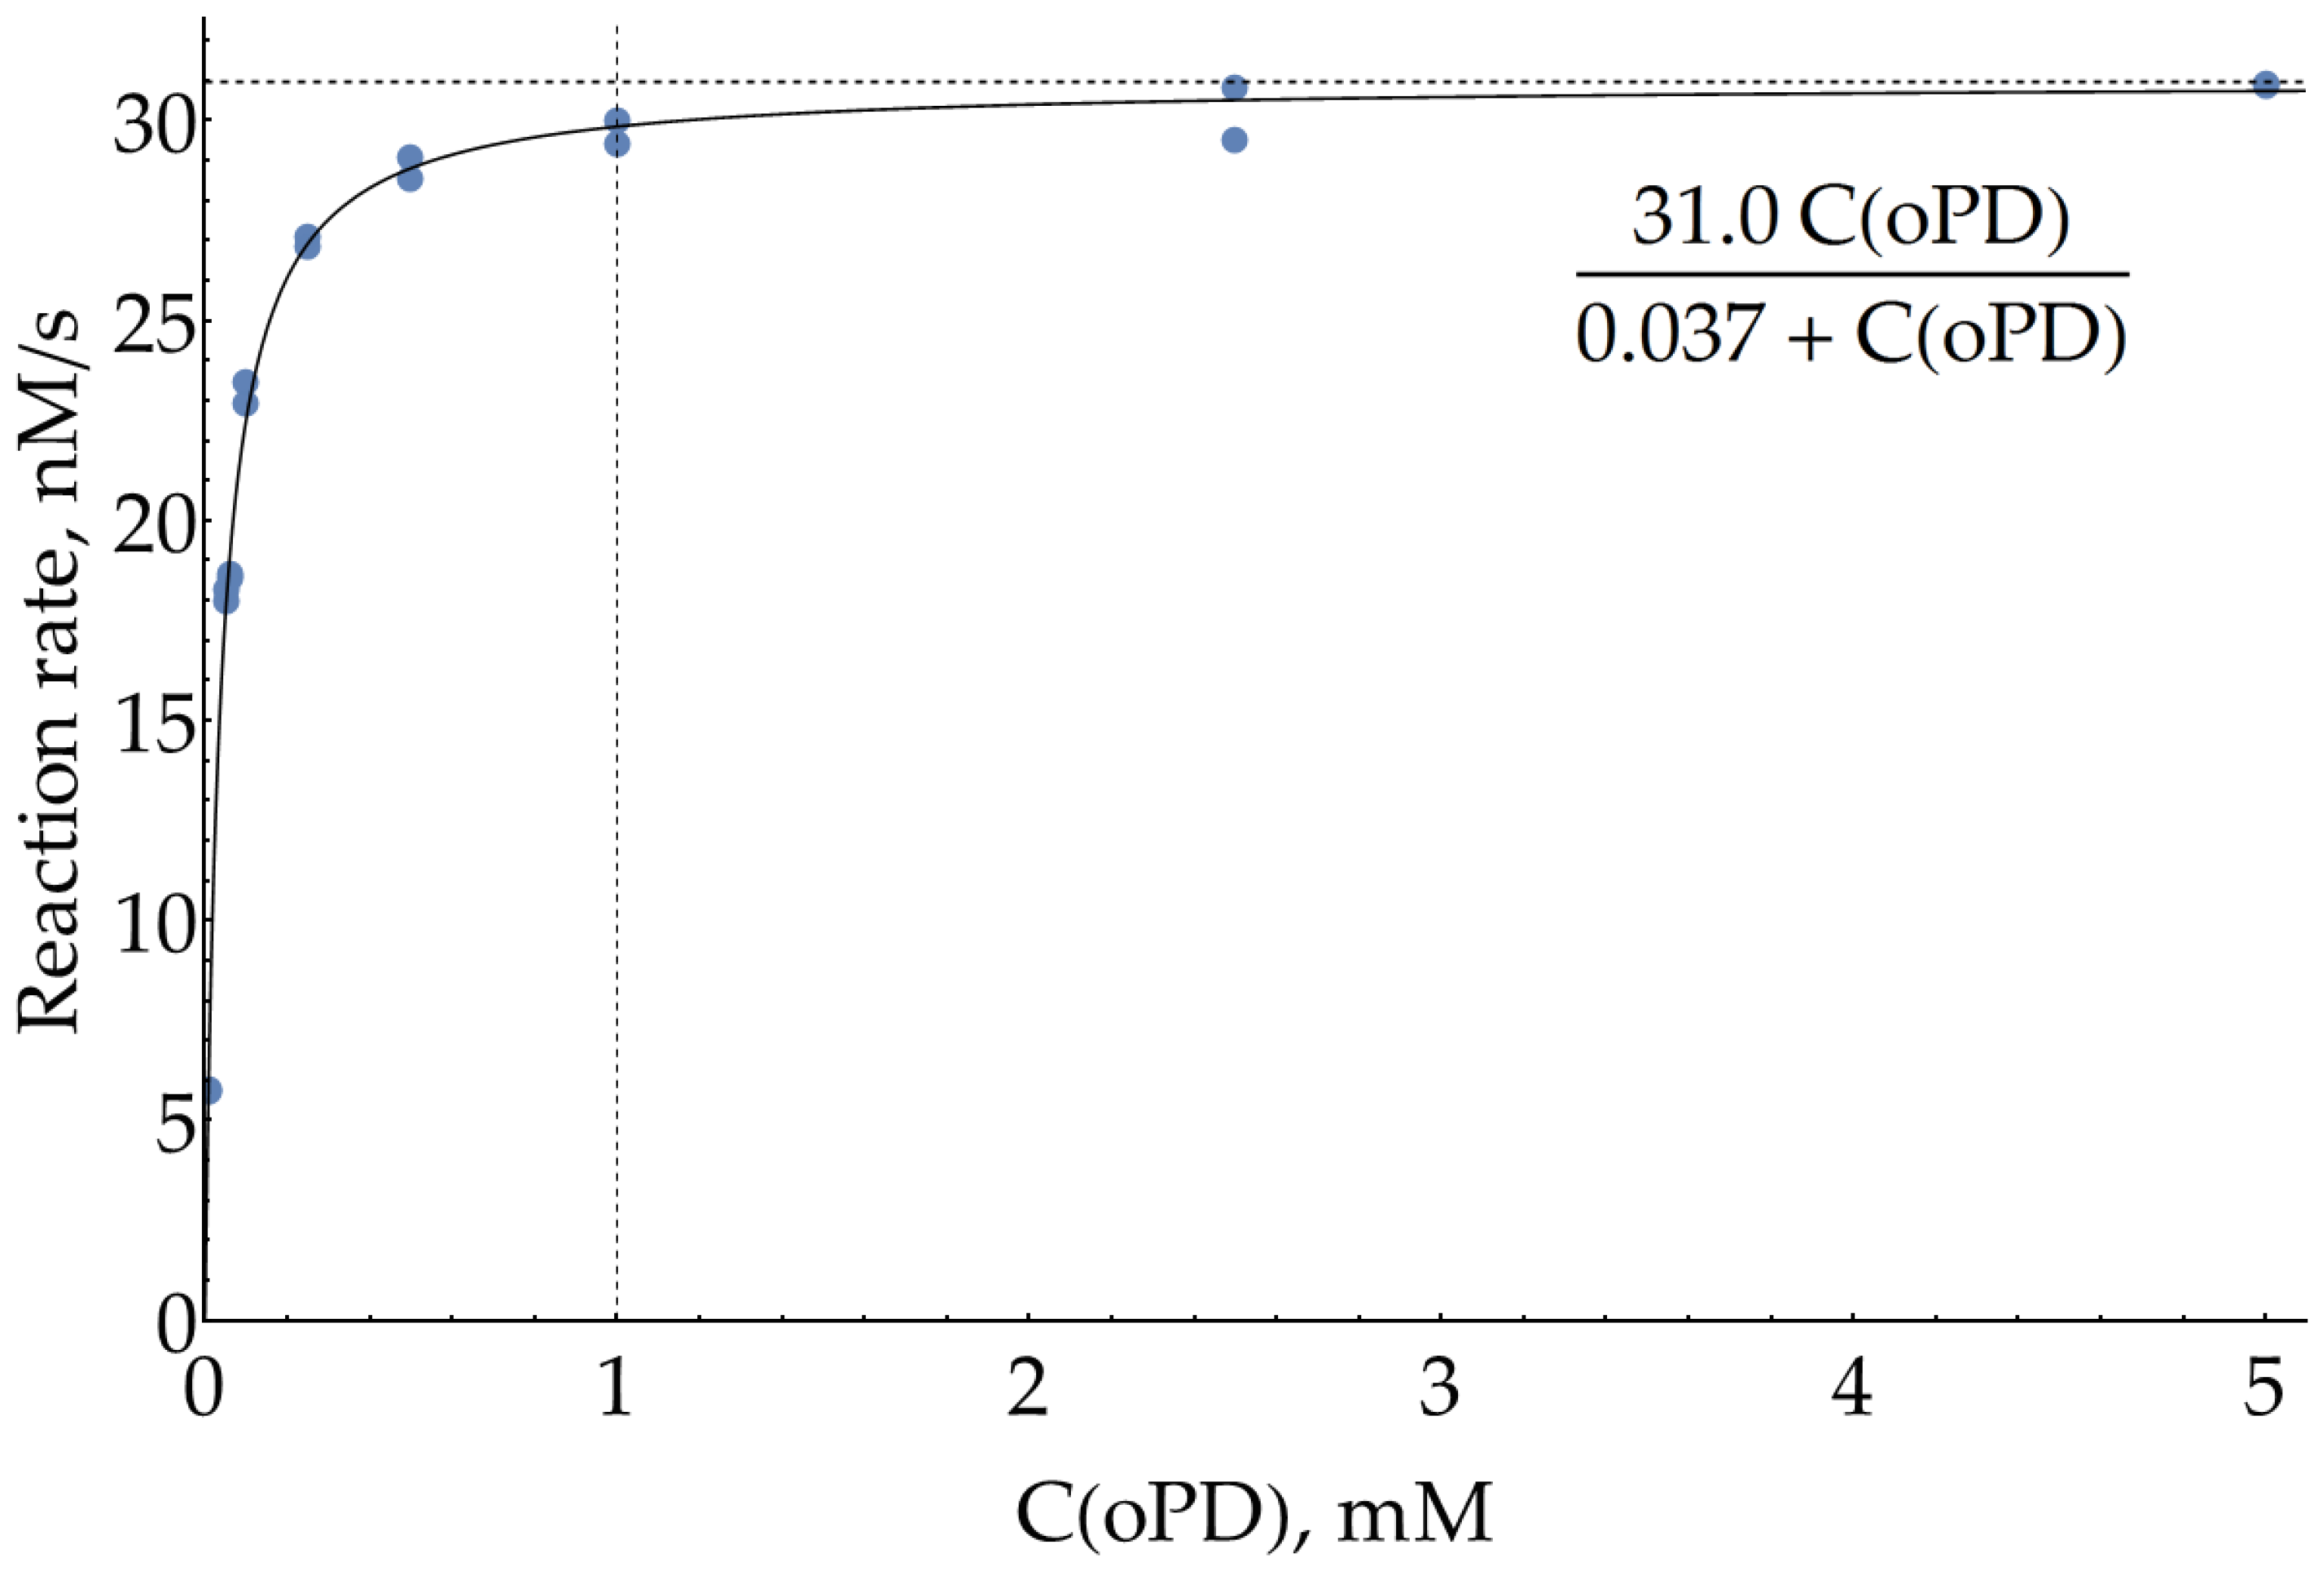
Figure 3.
SER spectra of 0, 100, and 500 nM DAP in the presence of 1 mM oPD with AgNPs in 5 mM NaCl at different pHs. The polynomial baseline was subtracted from each spectrum. All three spectra at each pH were normalized to the most intense band of all DAP concentrations at this pH. Shading represents the most intense bands of different forms of DAP: blue – DAP, purple – DAPH+, green – DAPH22+.
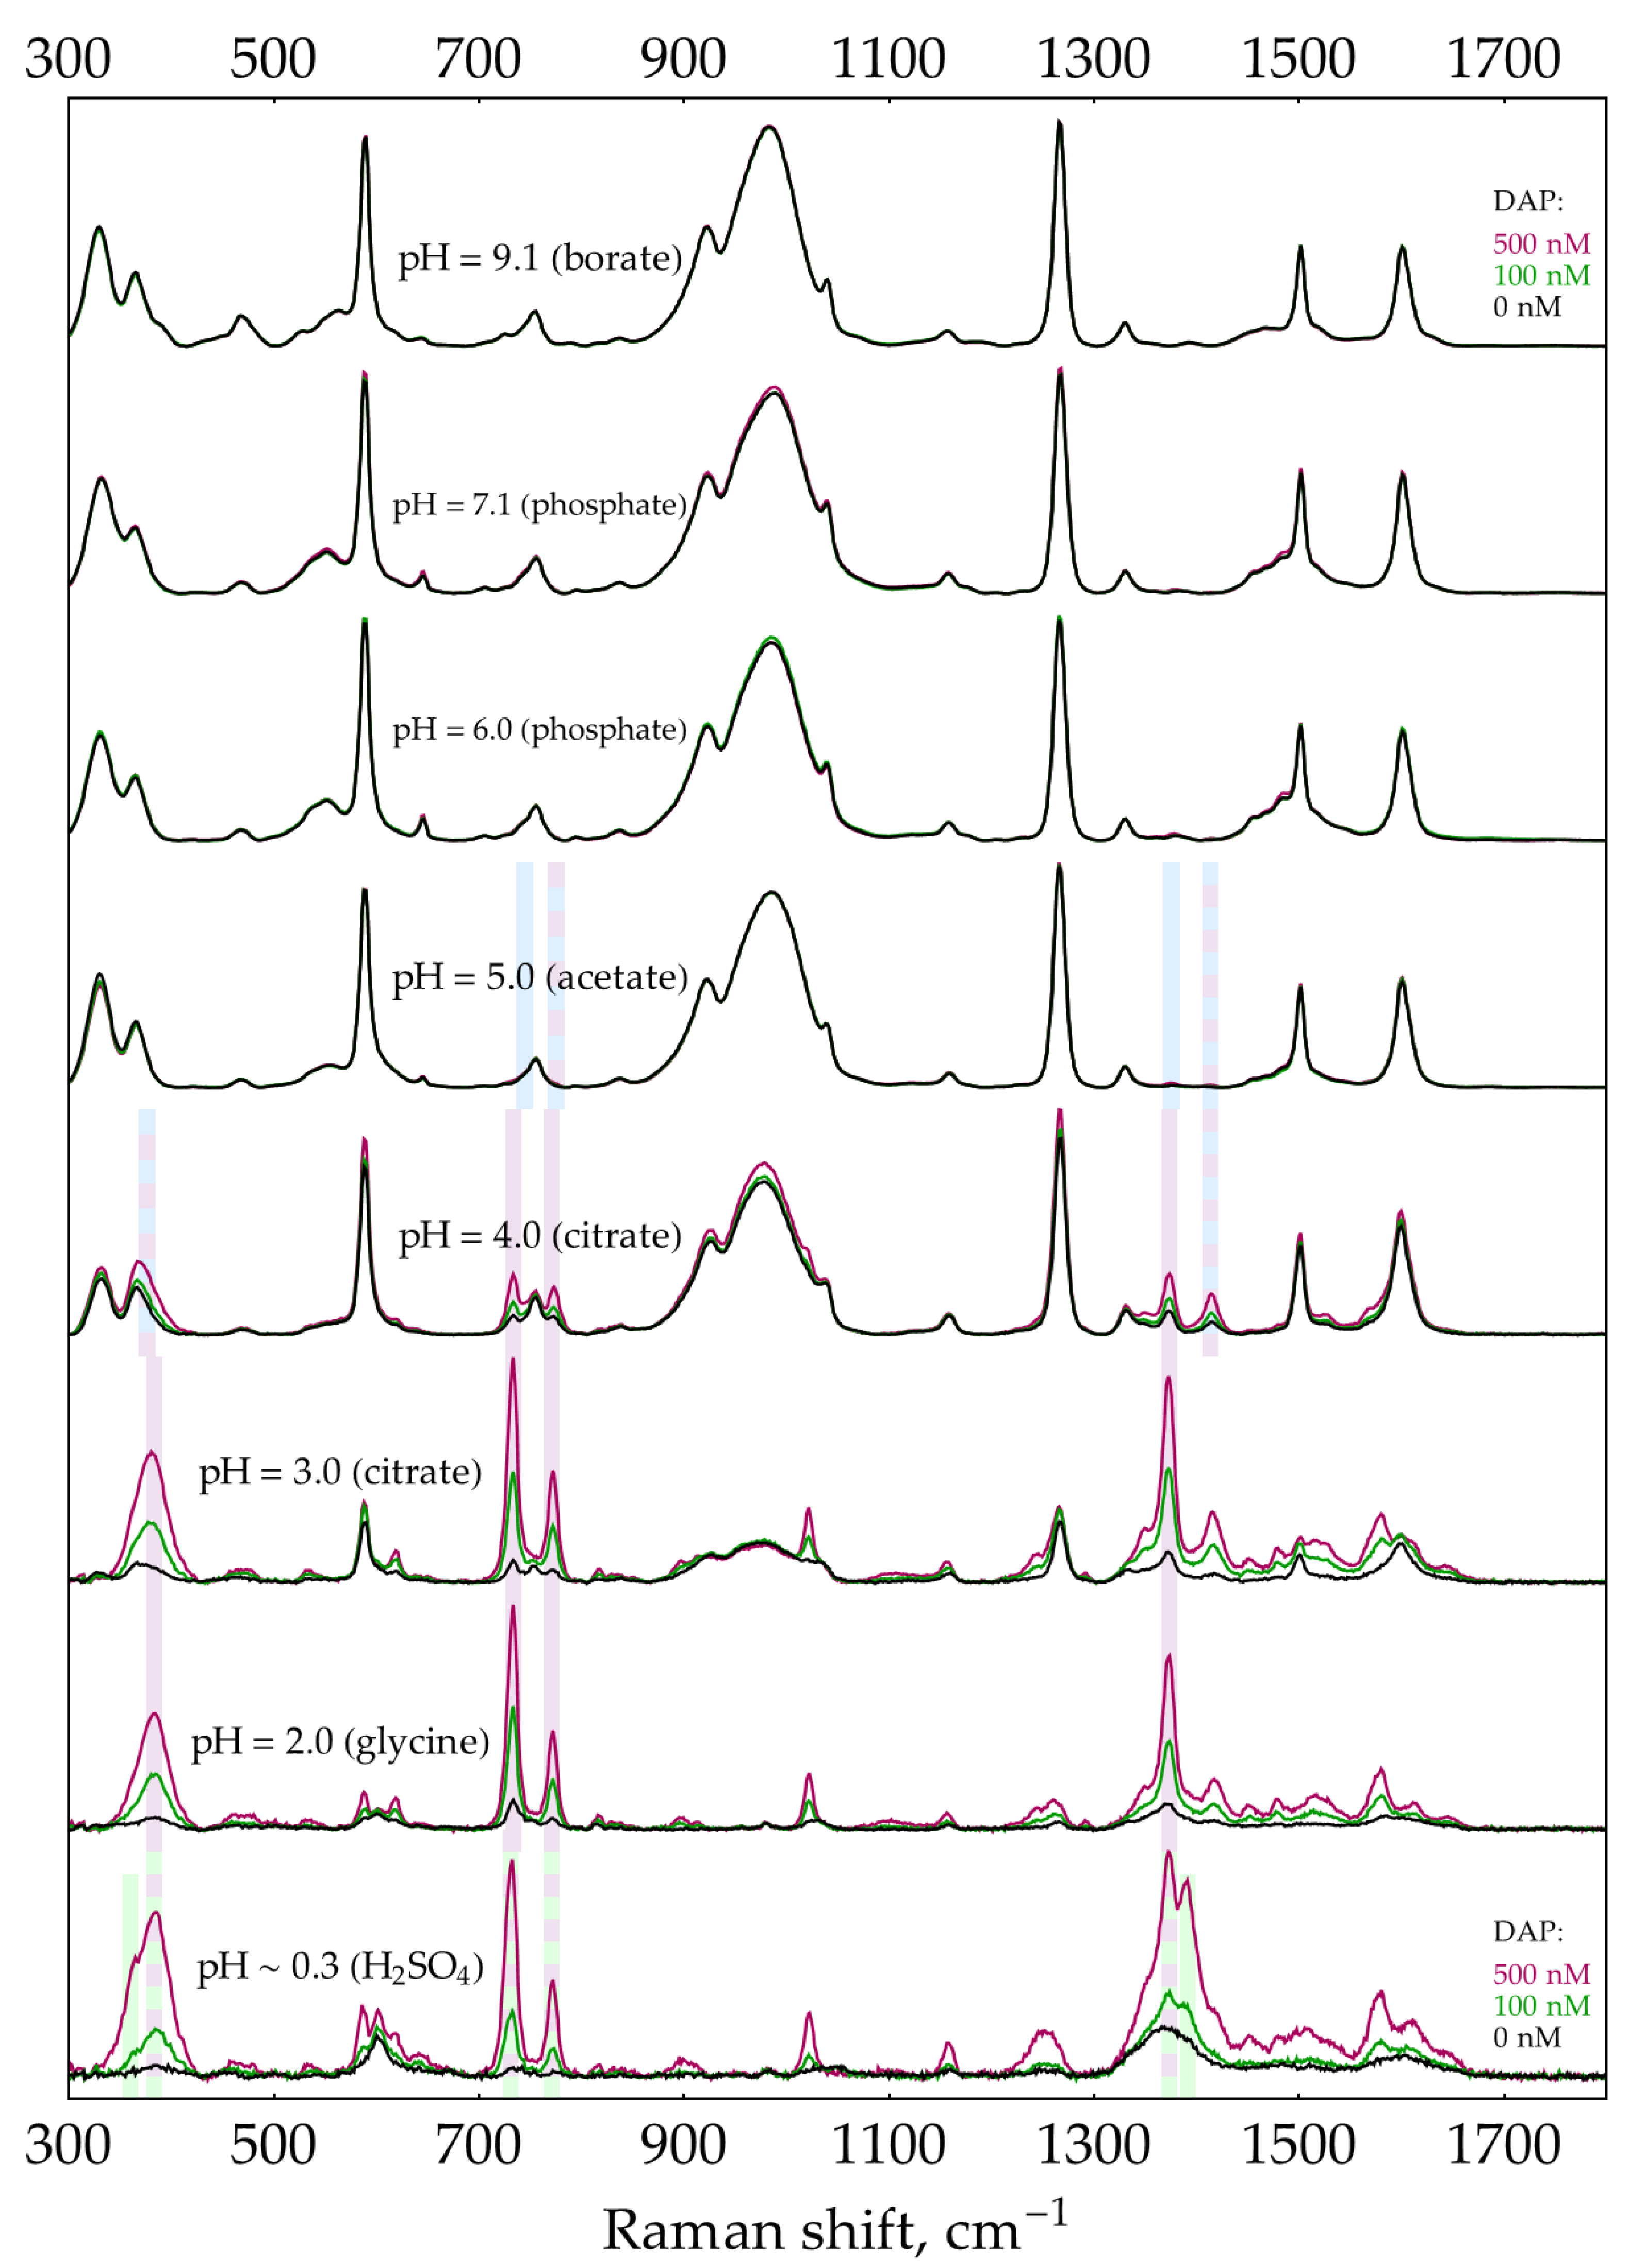
Figure 4.
SER spectra of 0, 100, and 500 nM DAP in the presence of 0.1 mM oPD with AgNPs in 5 mM NaCl at different pHs. The polynomial baseline was subtracted from each spectrum. All three spectra at each pH were normalized to the most intense band of all DAP concentrations at this pH. Shading represents the most intense bands of different forms of DAP: blue – DAP, purple – DAPH+, green – DAPH22+.
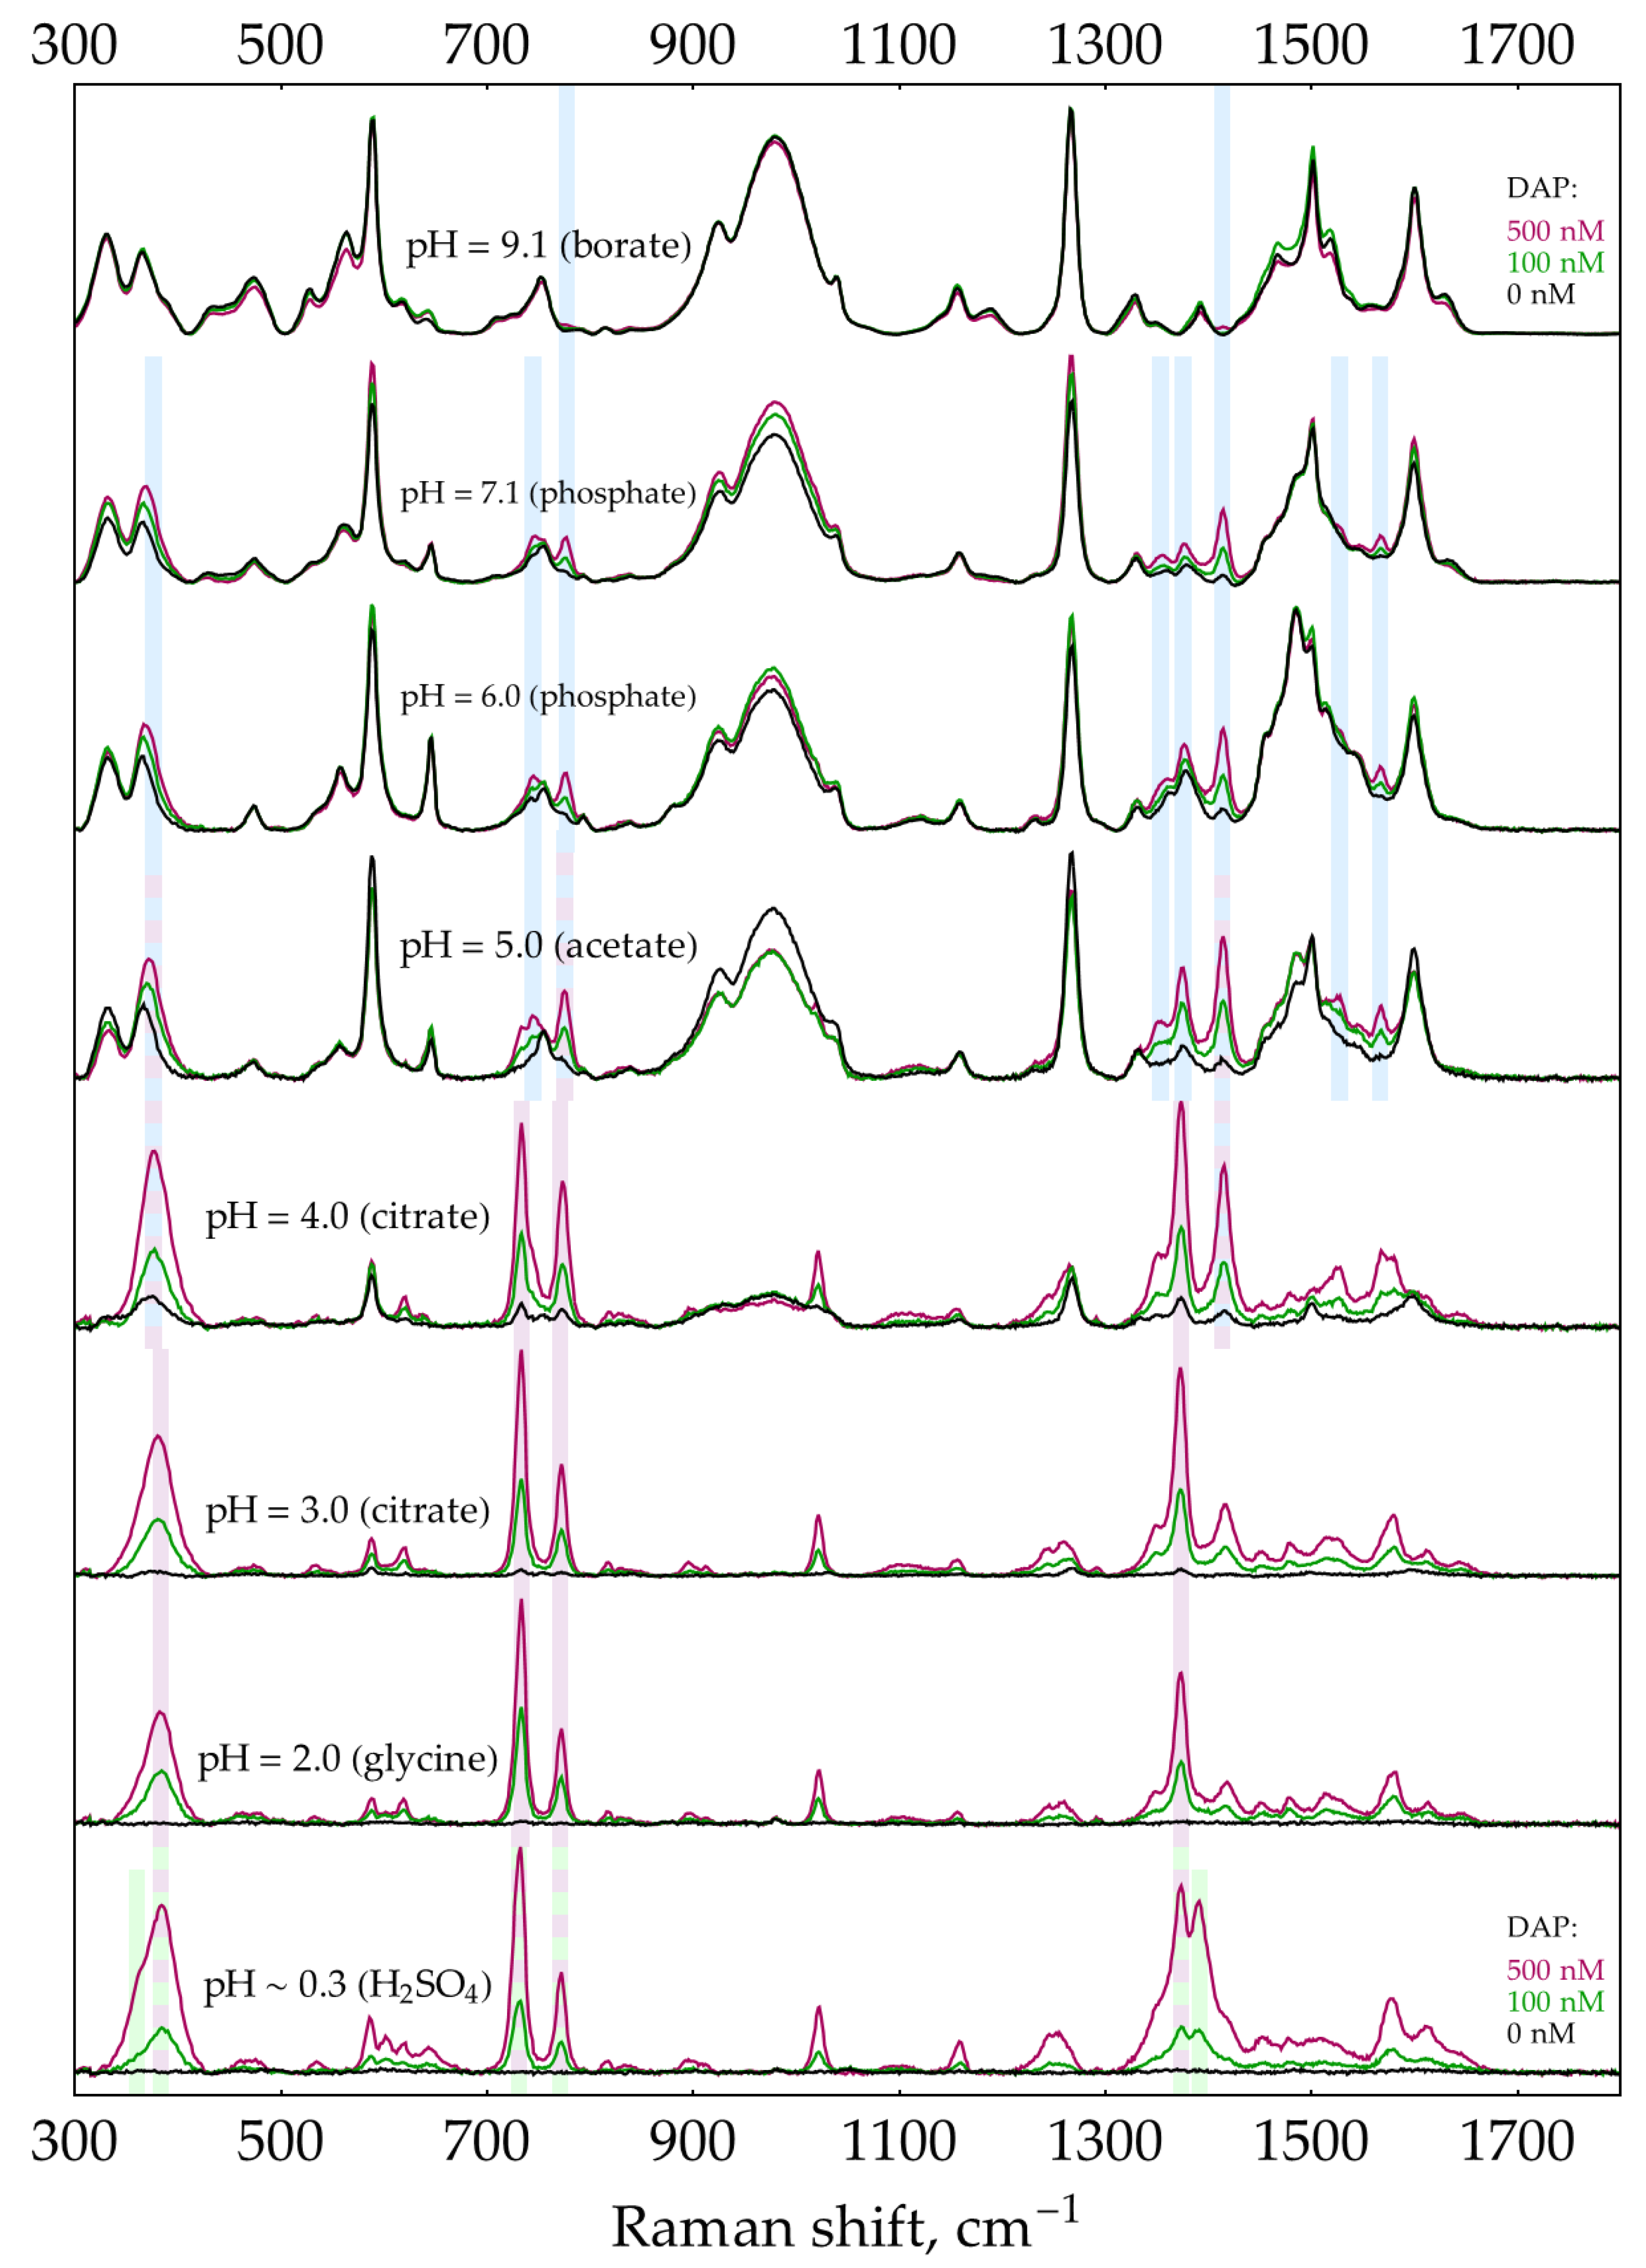
Figure 5.
Comparison of SERS intensity of DAP bands in its mixtures with 1 mM oPD at different pHs. The concentrations of buffers/media used for AgNPs aggregation are listed in Appendix E. For each data point, a signal from a corresponding blank sample without added DAP was subtracted. (a, b) SERS intensity at 733 cm-1 with 100 or 500 nM DAP correspondingly; (c, d) SERS intensity at 1374 cm-1 with 100 or 500 nM DAP correspondingly. N = 6 for each data point. Reported p-values result from the Mann–Whitney test. Dashed lines connect means for visual clarity.
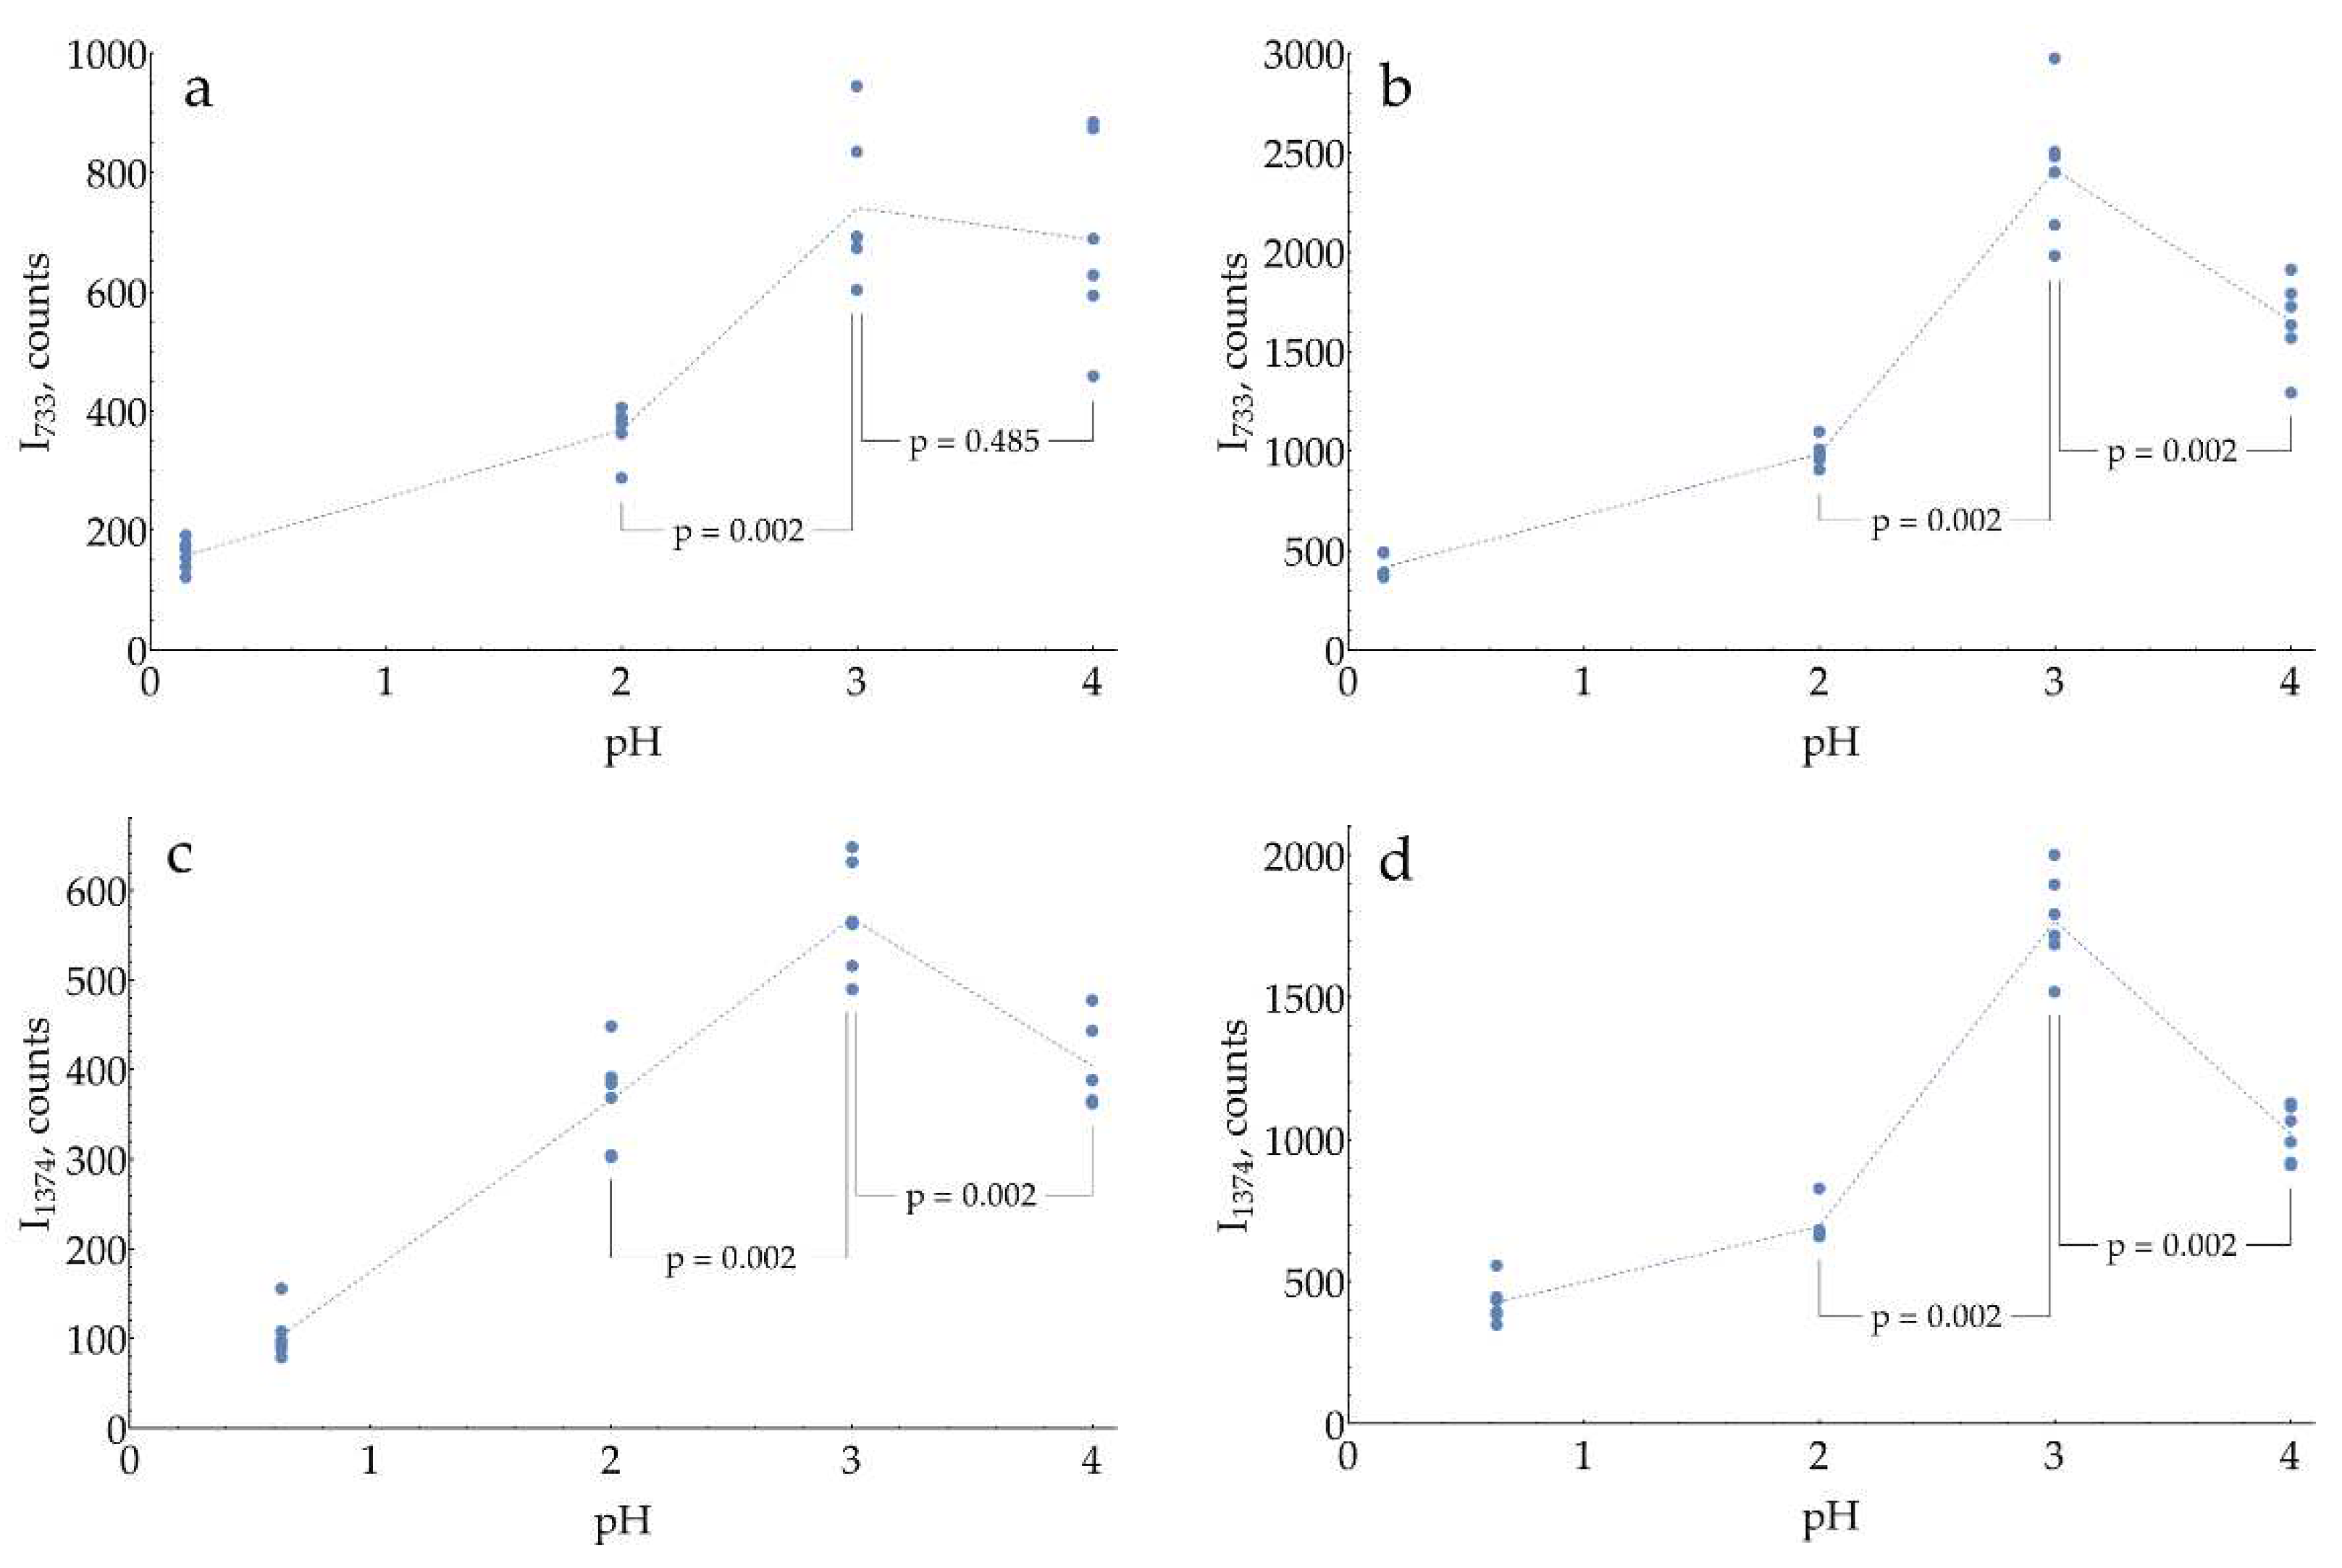
Figure 6.
SERS intensity of DAP bands in its mixtures with 1 mM oPD measured with AgNPs stabilized by varying NaCl concentrations and aggregated by 0.93 M of citrate buffer pH = 3. For each data point, a signal from a corresponding blank sample without added DAP was subtracted. (a, b) SERS intensity at 733 cm-1 with 100 or 500 nM DAP correspondingly; (c, d) SERS intensity at 1374 cm-1 with 100 or 500 nM DAP correspondingly. N = 6 for each data point. Reported p-values result from the Mann–Whitney test. Dashed lines connect means for visual clarity.
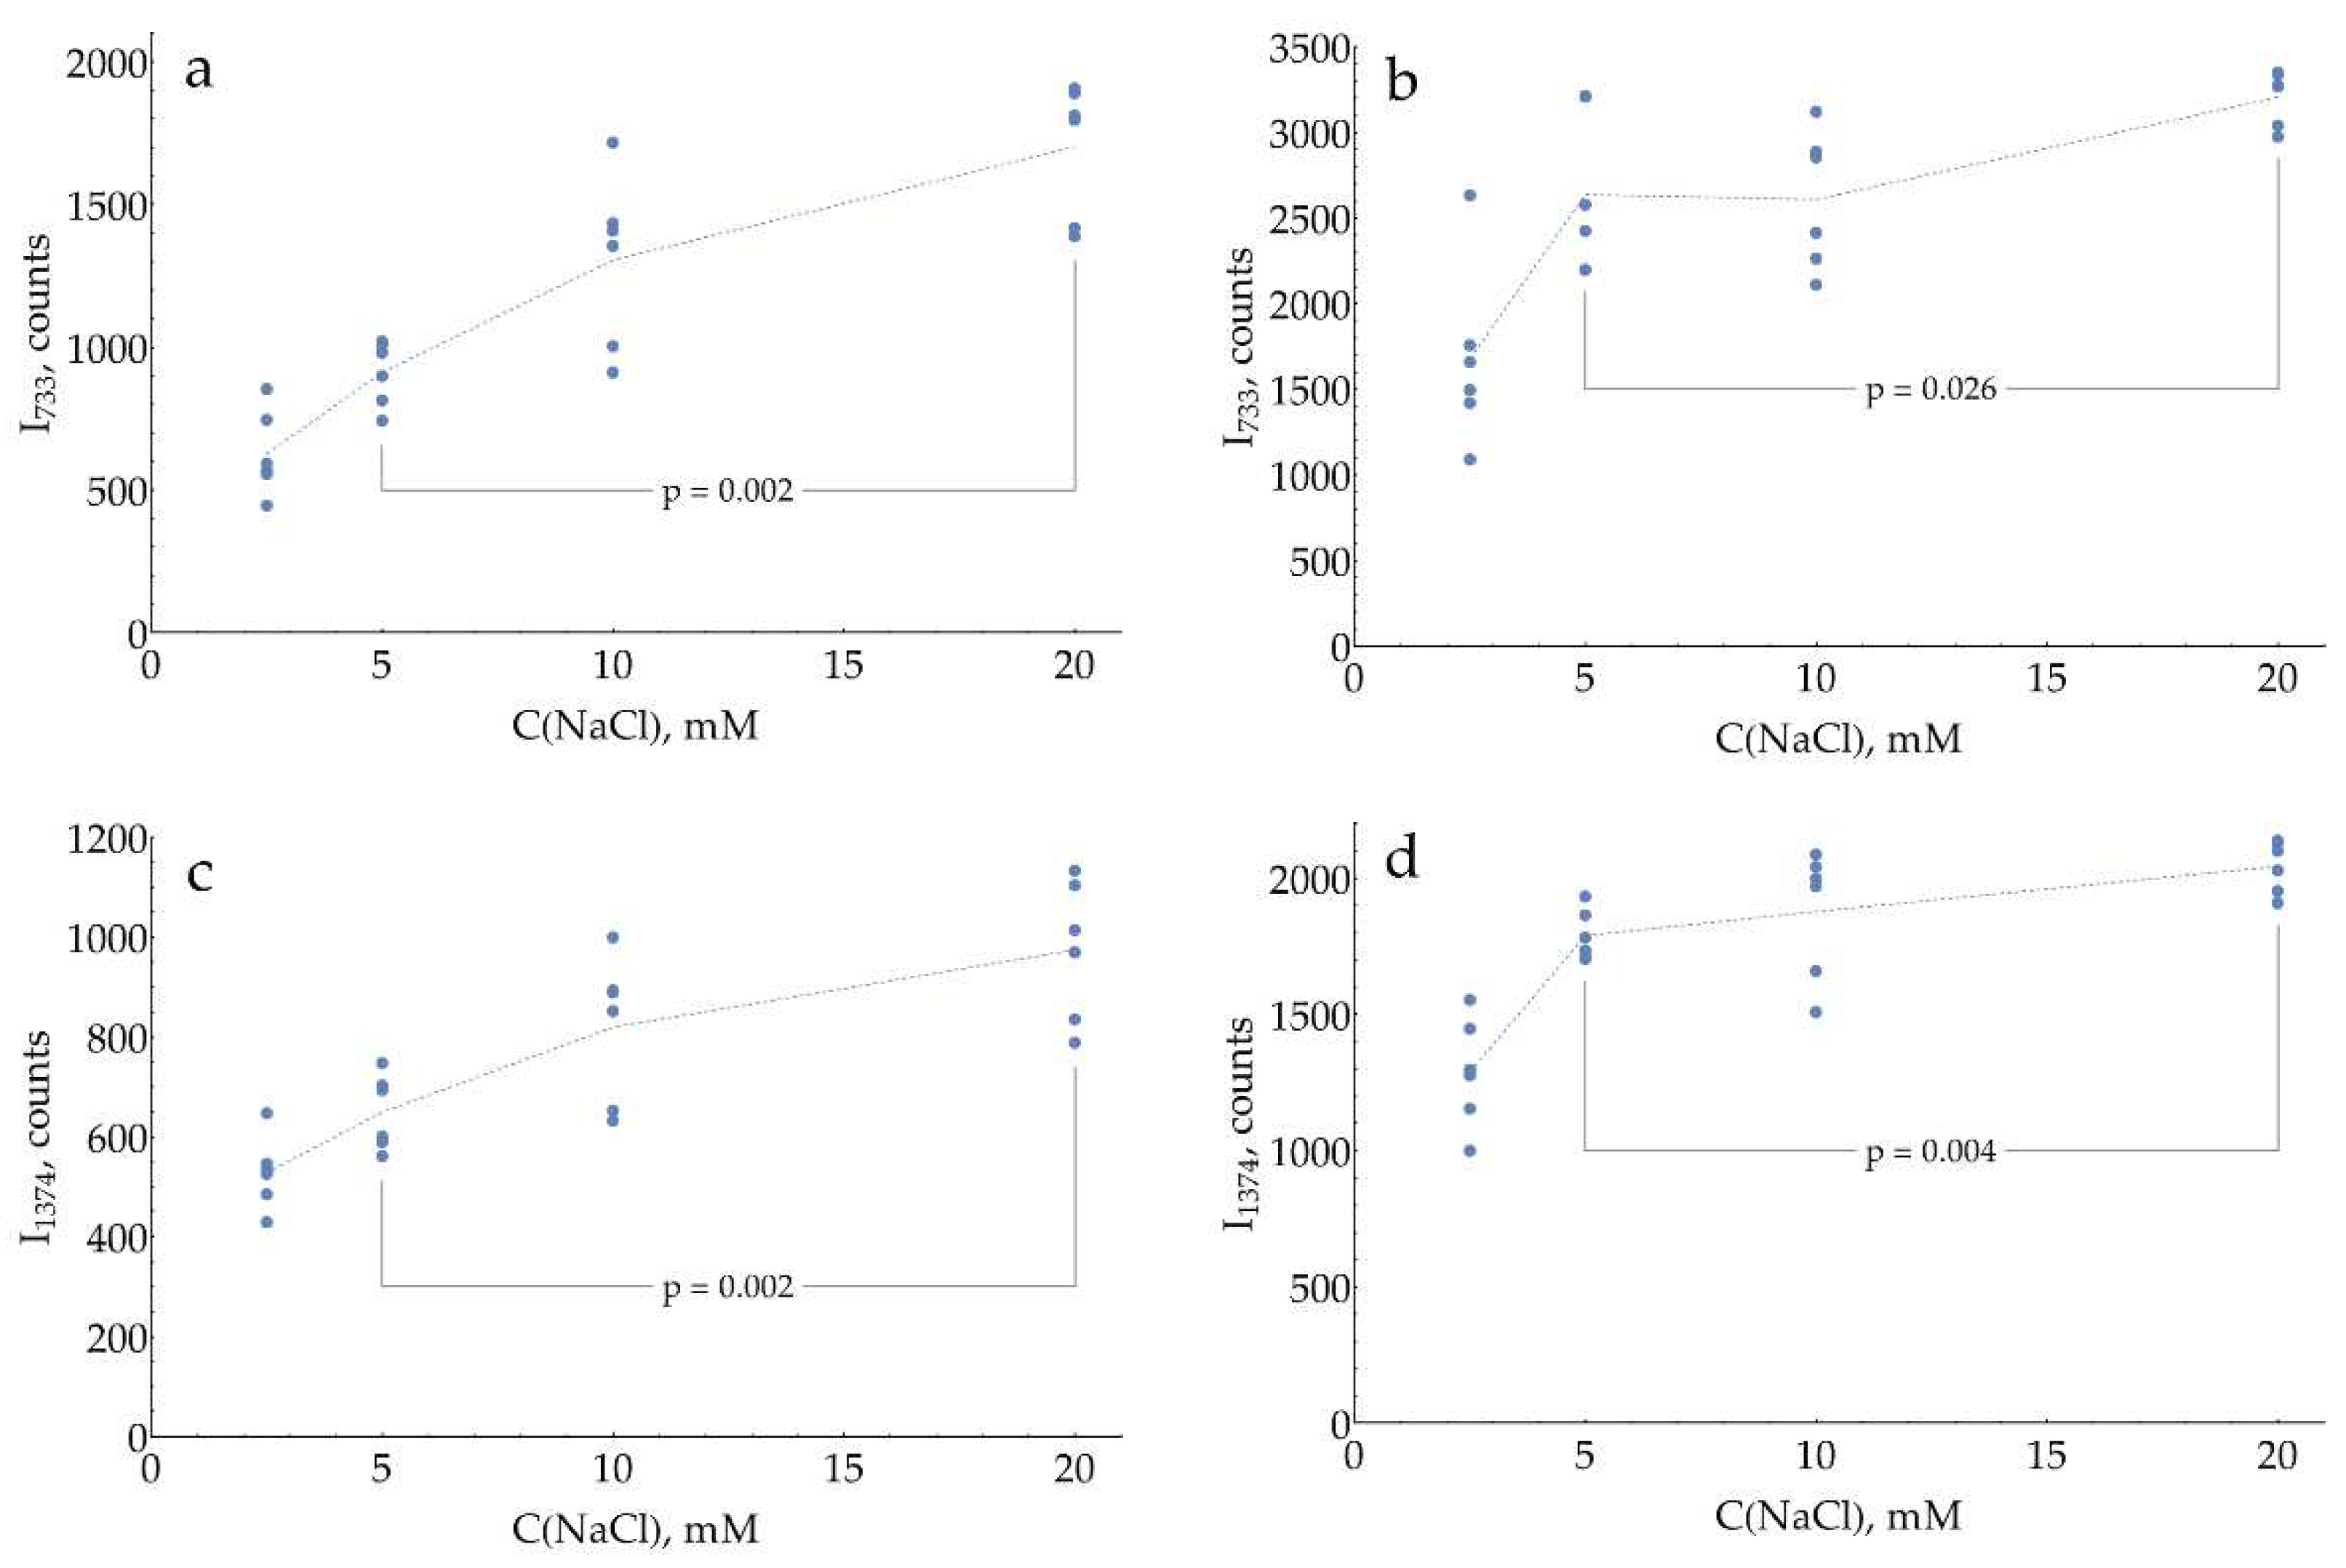
Figure 7.
Measured absorbance and SERS intensity for different DAP concentrations in its mixtures with 0.33 mM oPD in 0.93 M citrate buffer, pH = 3. (a) Absorption spectrum of 18 μM DAP; (b) Absorption at 454 nm measured with a plate reader, sample volume 200 μL (N = 6); (c) SERS intensity at 733 cm-1 (N = 5); (d) SERS intensity at 1374 cm-1 (N = 5). Insets represent the regions of low concentrations, with LOD marked with a red diamond. Dashed lines represent best fits.
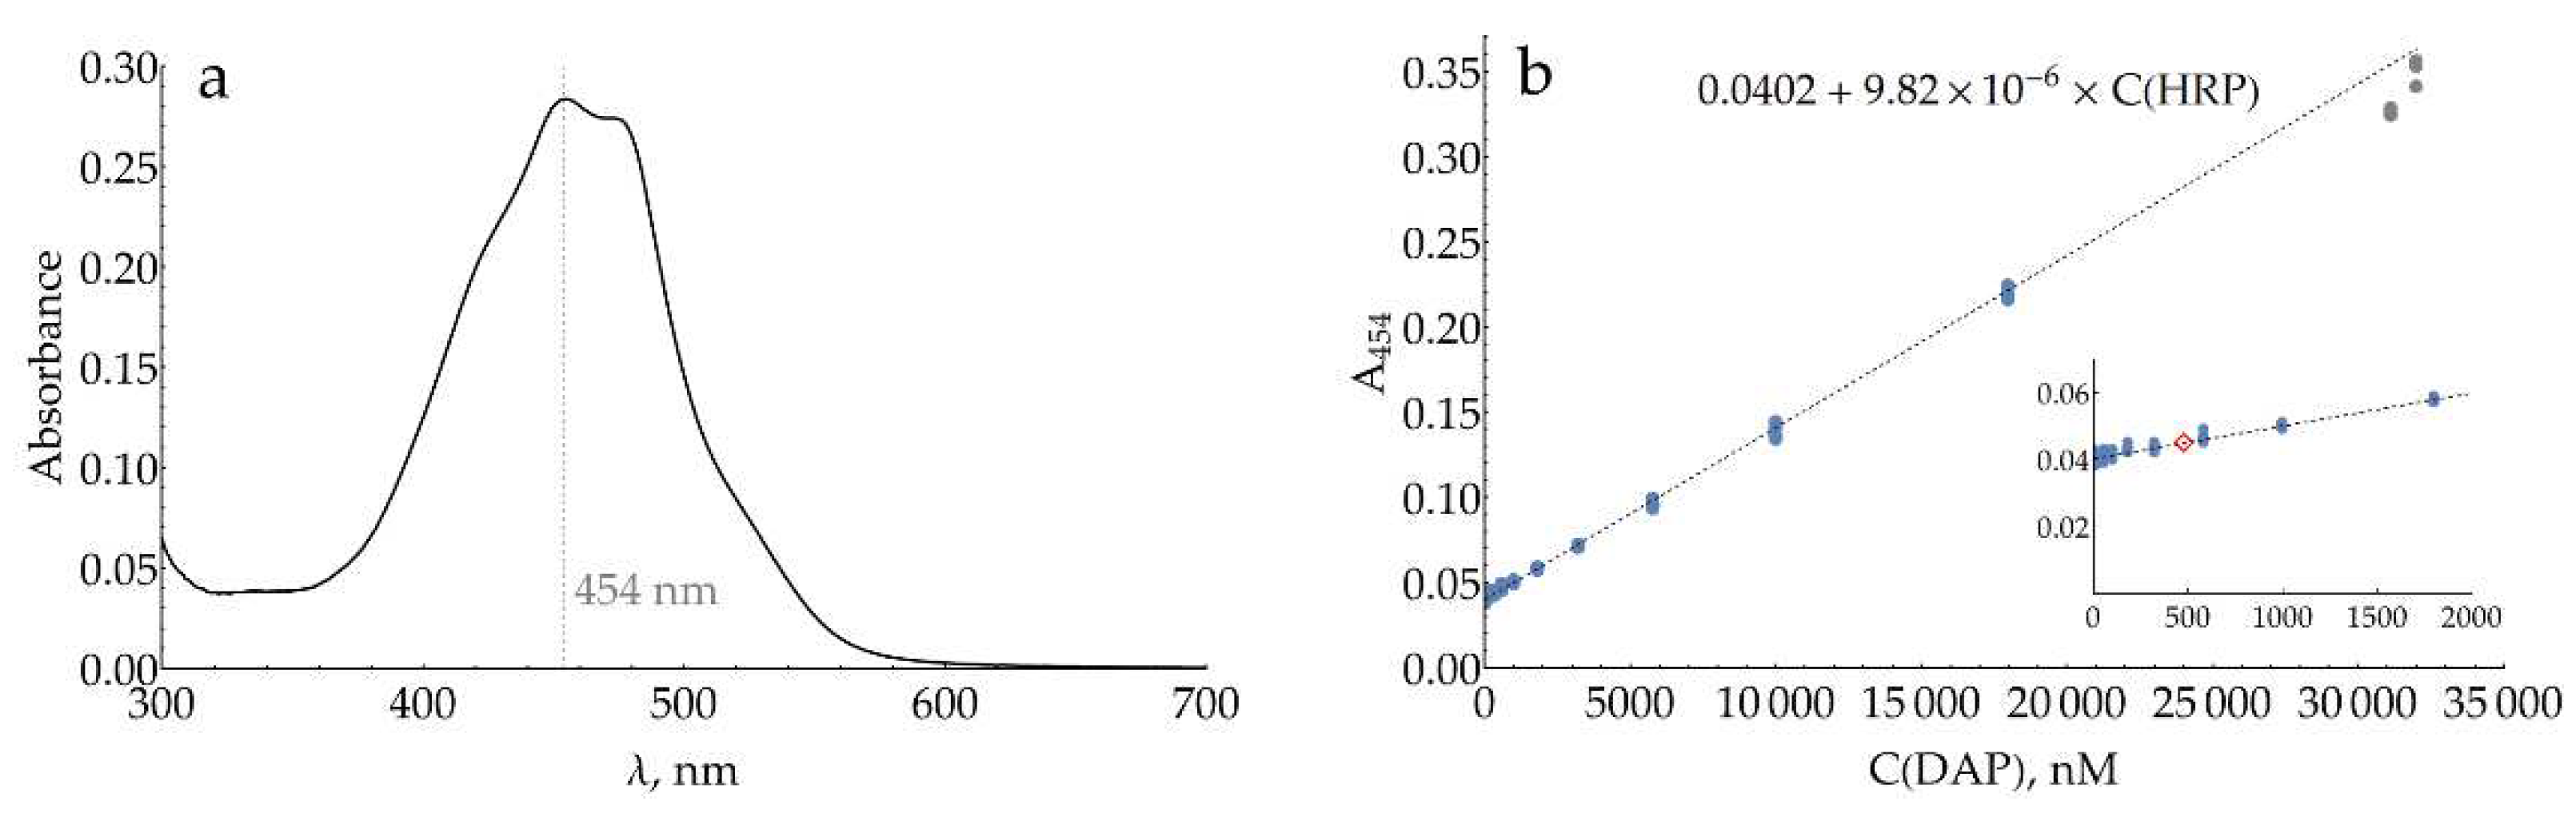
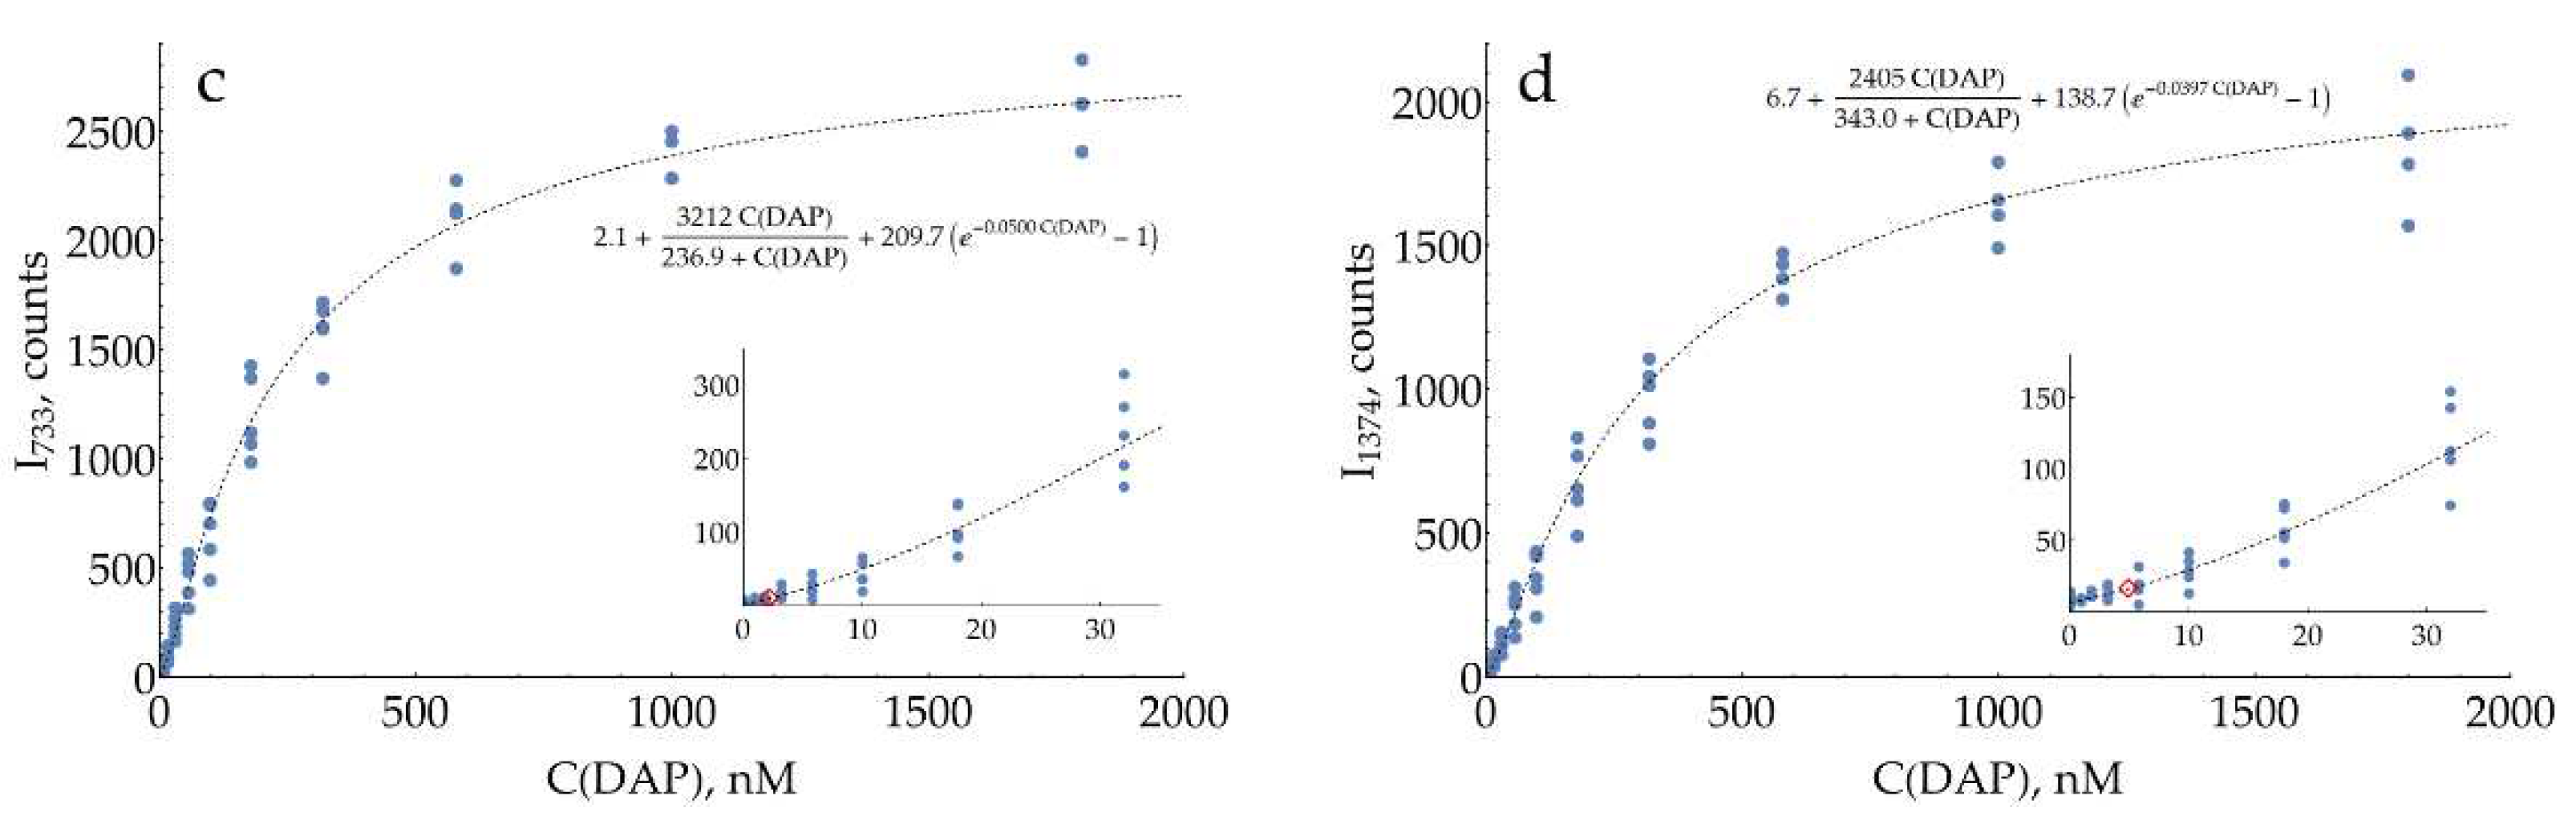
Figure 8.
Absorbance and SERS intensity for different HRP concentrations, measured after 10 minutes of enzymatic reaction at pH = 6, 1 mM oPD, 80 μM H2O2, and stopped by three times dilution with citrate buffer 1.5 M, pH = 3. (a) Colorimetric detection at 454 nm measured with a plate reader, total sample volume 200 μL (N = 8); (b) SERS intensity at 733 cm-1 (N = 4); (c) SERS intensity at 1374 cm-1 (N = 4). Insets represent the regions of low concentrations, with LOD marked with a red diamond. Dashed lines represent best fits.
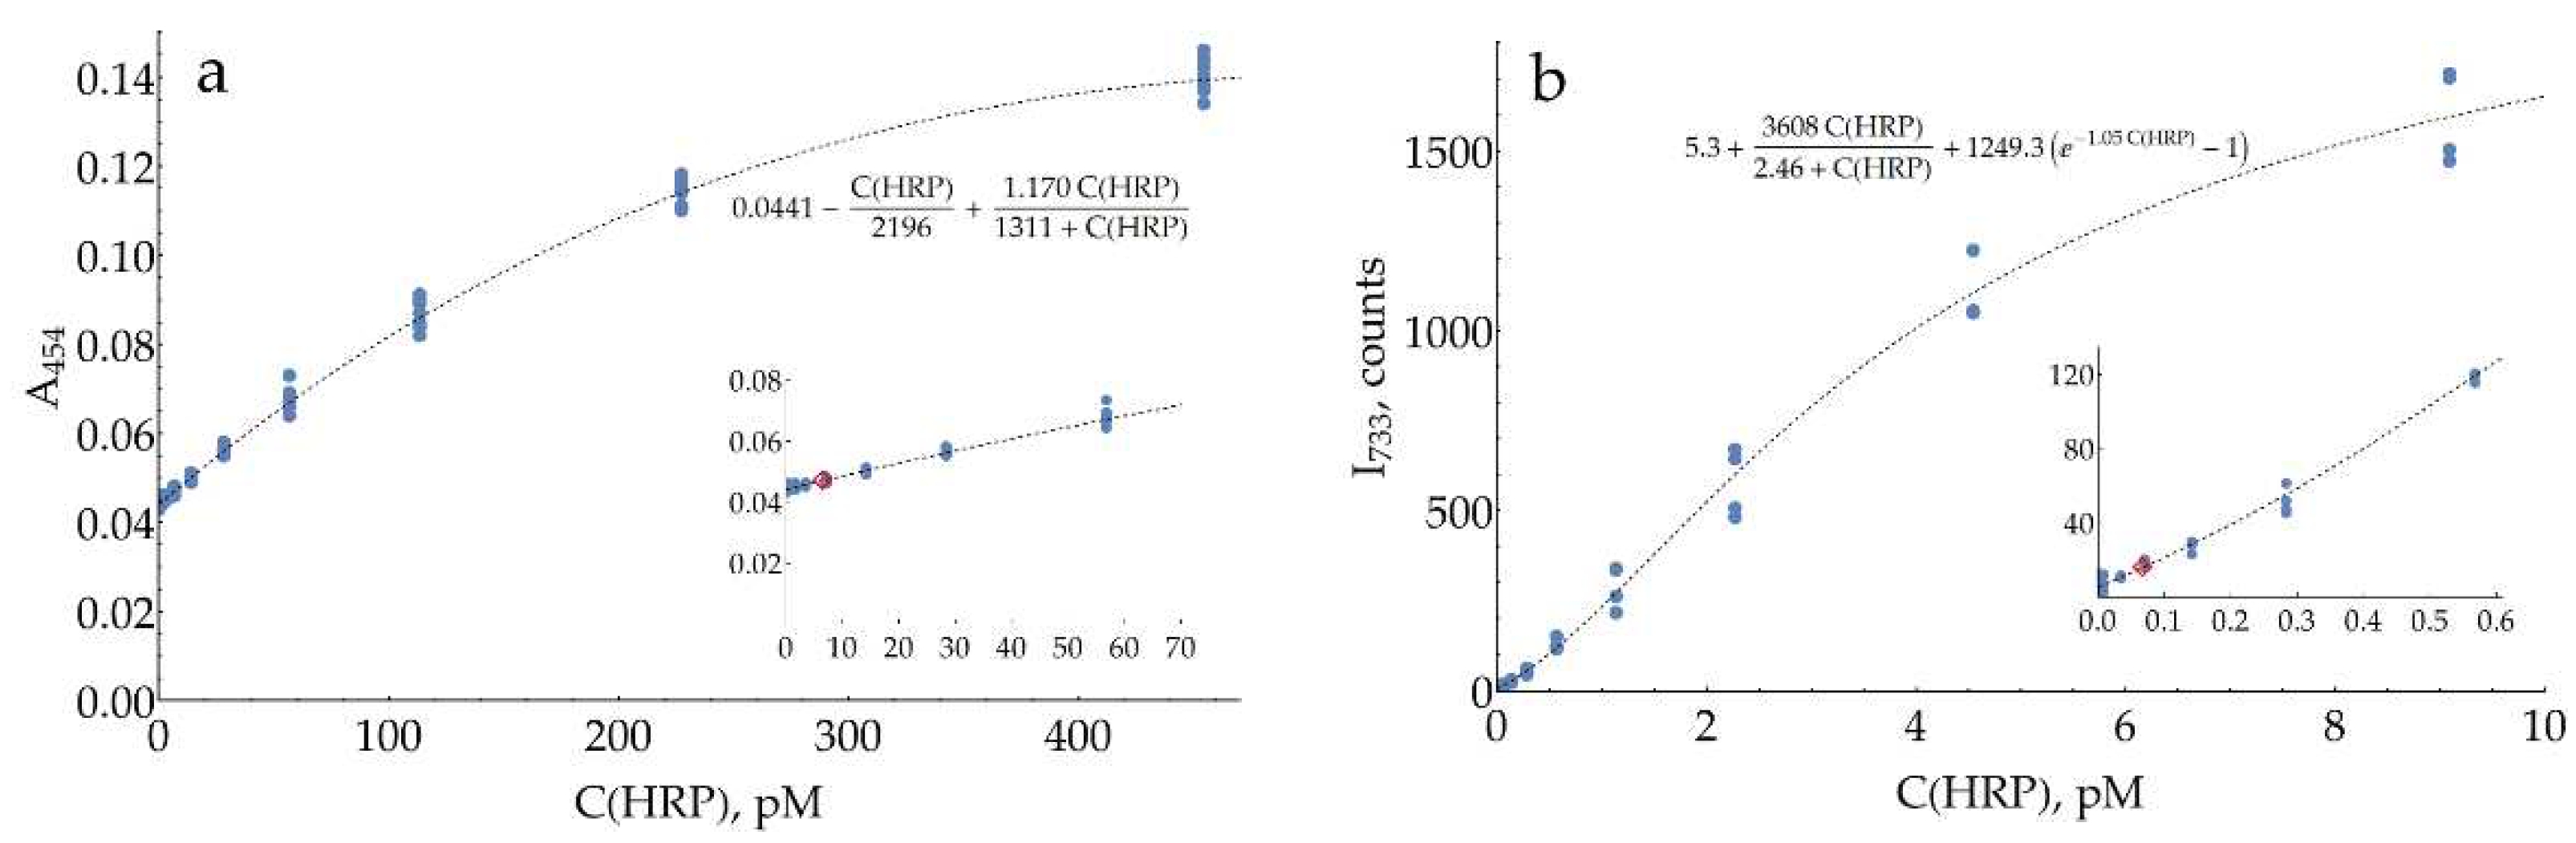
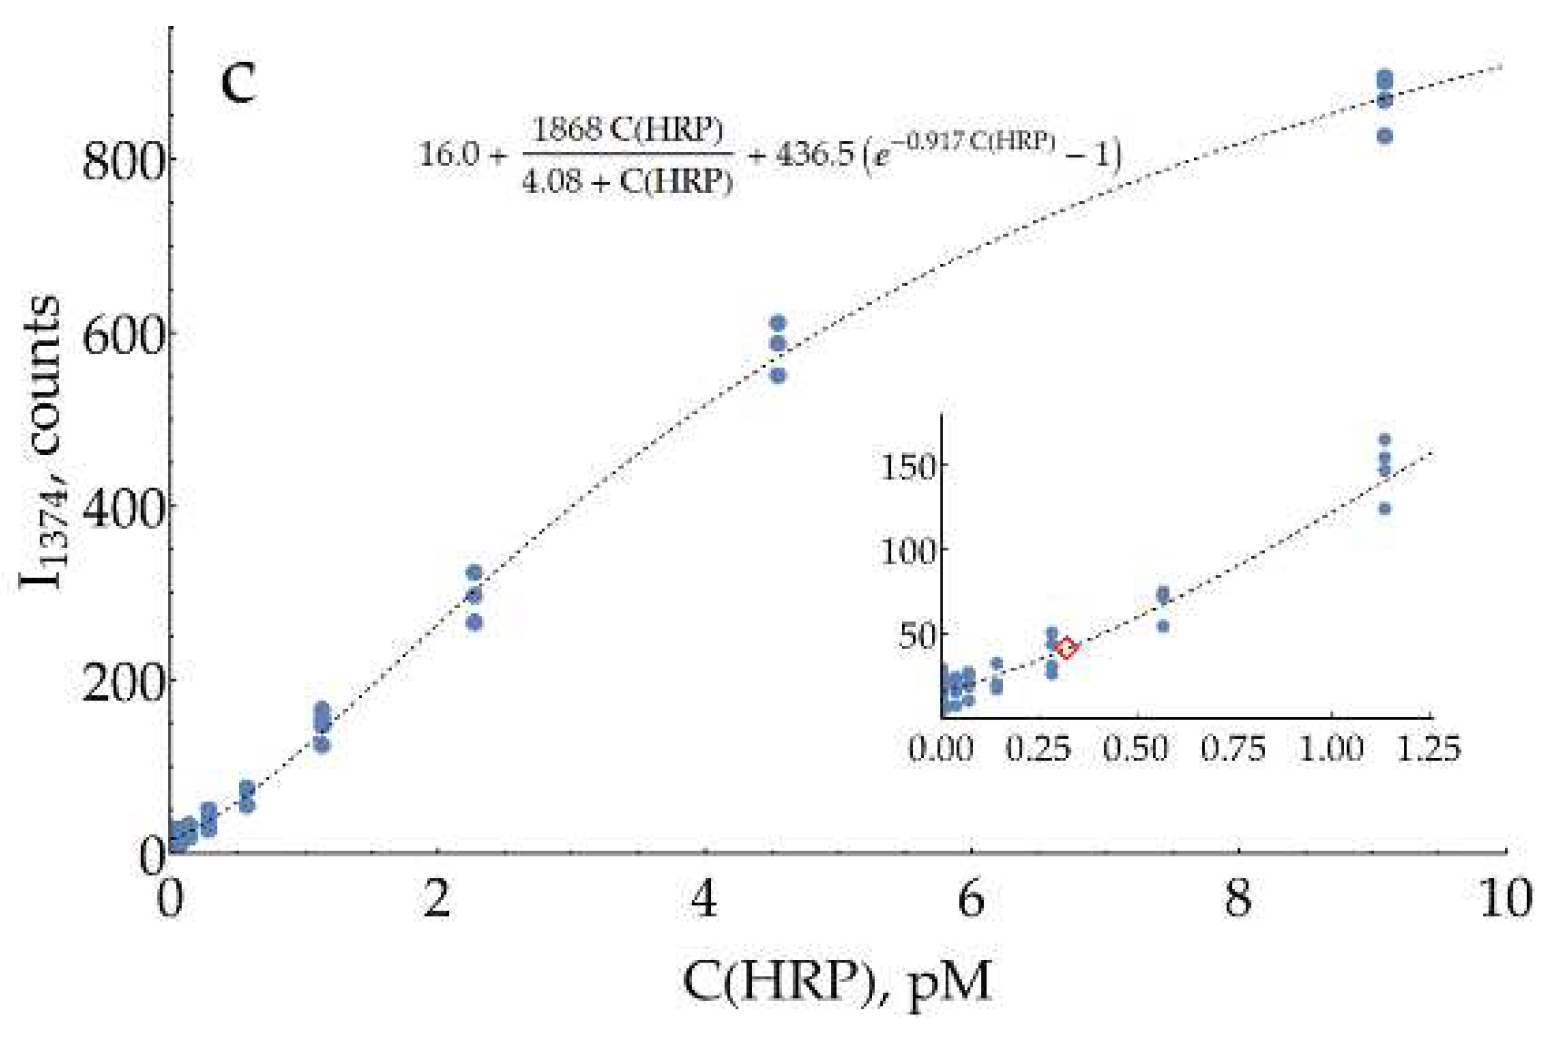
Disclaimer/Publisher’s Note: The statements, opinions and data contained in all publications are solely those of the individual author(s) and contributor(s) and not of MDPI and/or the editor(s). MDPI and/or the editor(s) disclaim responsibility for any injury to people or property resulting from any ideas, methods, instructions or products referred to in the content. |
© 2023 by the authors. Licensee MDPI, Basel, Switzerland. This article is an open access article distributed under the terms and conditions of the Creative Commons Attribution (CC BY) license (http://creativecommons.org/licenses/by/4.0/).
Copyright: This open access article is published under a Creative Commons CC BY 4.0 license, which permit the free download, distribution, and reuse, provided that the author and preprint are cited in any reuse.


