1. Introduction
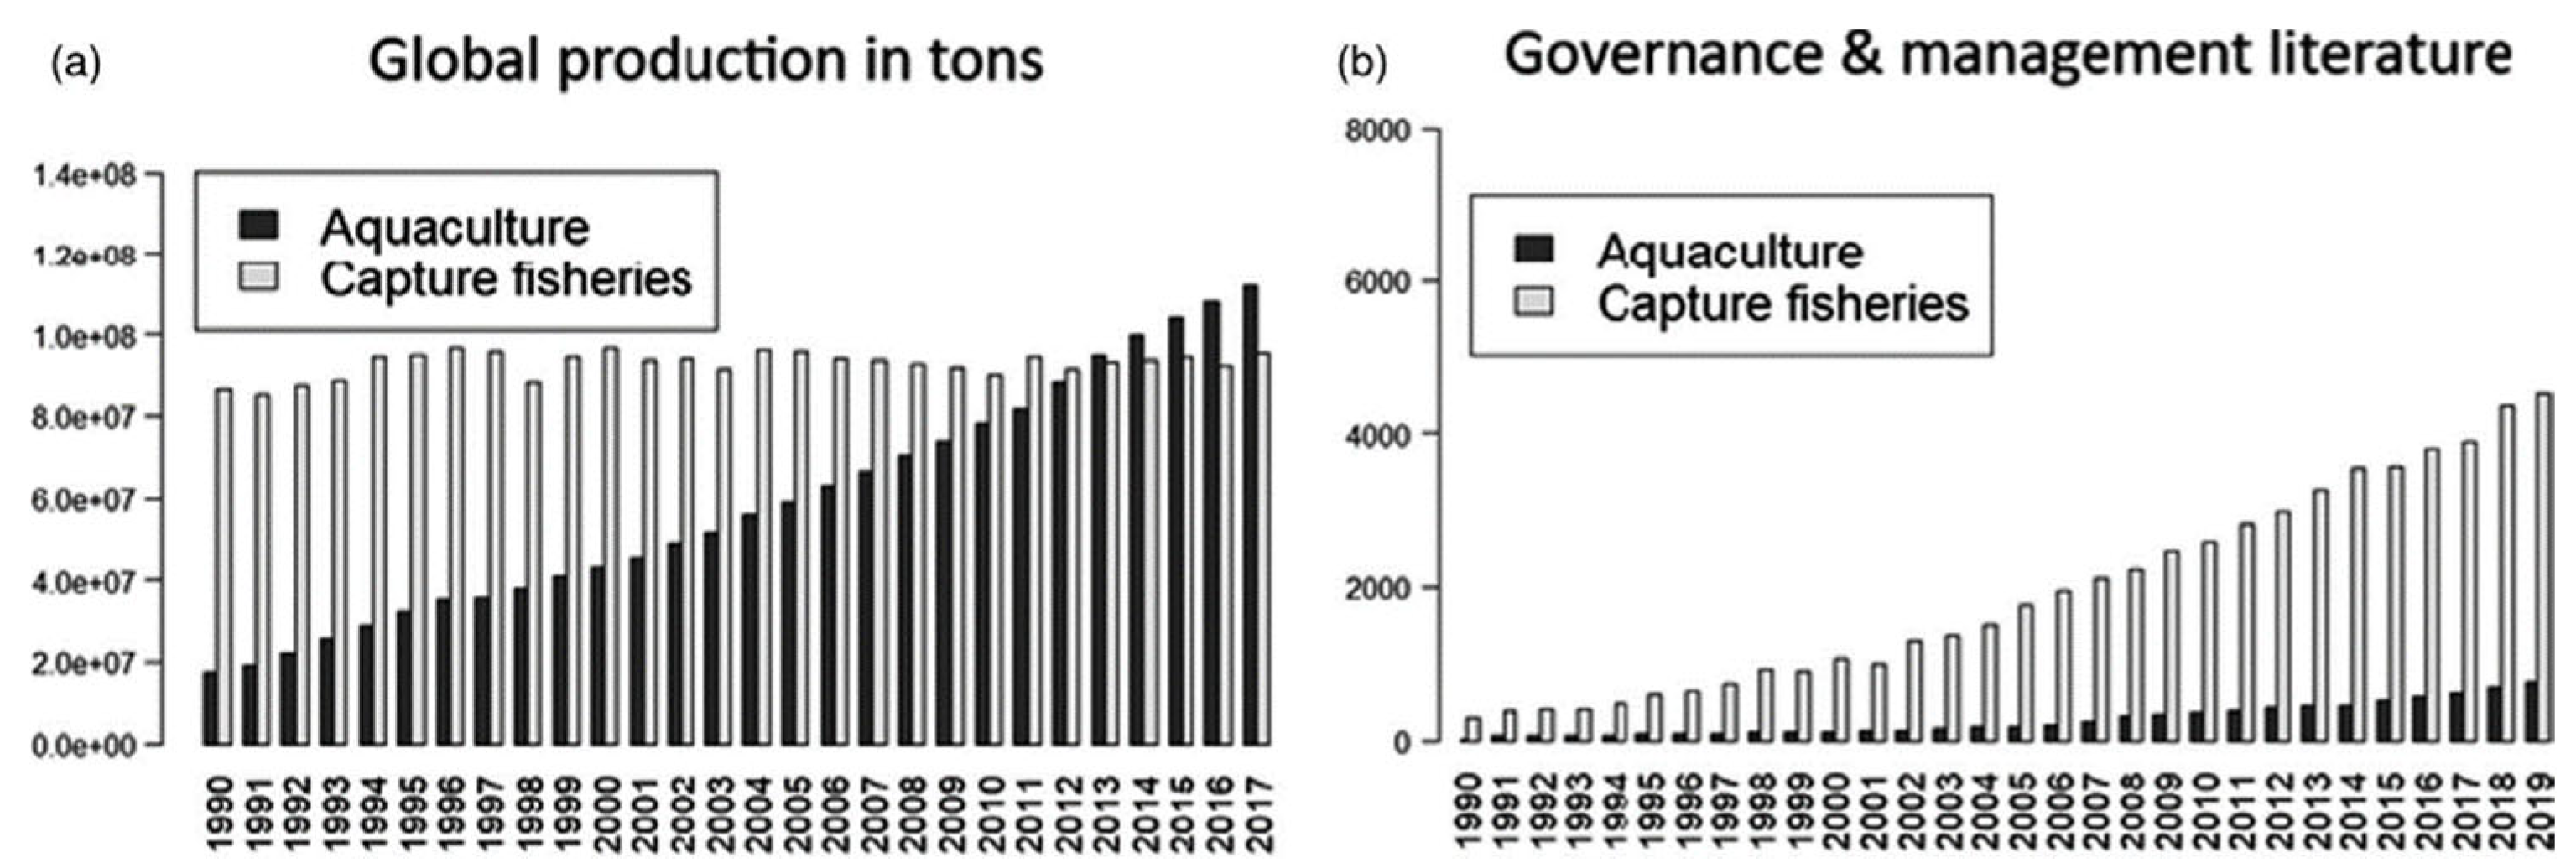
Over the past few decades, freshwater fisheries aquaculture has also grown to be one of the fastest-growing industries worldwide. Global fish production has increased from 101 million to 178.5 million tonnes, and the FAO (Food and Agriculture Organization of the United Nations) estimates that aquaculture alone contributes 114.5 million tonnes, including 82.1 million tonnes of aquaculture animals in 2018(FAO 2020).
Figure 1.
Production from catch fisheries versus aquaculture since 1990(FAO).
Figure 1.
Production from catch fisheries versus aquaculture since 1990(FAO).
The integration of more existing technological solutions through advancements in mechanical engineering, as well as the vertical and horizontal expansion of aquaculture practises, have made China the largest aquaculture nation in the world and one of the few where aquaculture production surpasses fishery capture [
1,
2]. The partitioned aquaculture system (PAS) of Clemson University evolved from the high density, high production, and intensification that have become the main modes of pond aquaculture in recent years [
3]. Among these modes is the IPA, which is derived from an in-pond raceway system (IPRS) invented by Chappell in 2005. The PAS consists of aquaculture raceways and decontamination zones where fish excretions are aggregated at the downstream decontamination zones through pumps and faecal matter collection equipment, facilitating their collection and treatment. Zhou, a former employee of the United States Soybean Association, brought IPRS to China in 2013 and encouraged its usage in Jiangsu and Shanghai. Over time, it evolved into a new aquacultural model that is now implemented in 18 Chinese provinces and cities and has a culture space of more than 200,000 square metres [
4]. However, due to the blind pursuit of high yield and the lack of supporting technology and management of intensive aquaculture, the water quality of pond aquaculture is rapidly declining, diseases are frequent, and pollution discharges are increasing, and these have led to a decline in the quality of the output of many IPA systems, so that the assurance of good water quality conditions is a key factor concerning high aquaculture yields. Water quality conditions here include characteristics such as water temperature, acidity and alkalinity, and DO concentration, of which DO concentration is one of the most important factors of water quality, which directly affects the feed coefficient and operating costs of the aquaculture process, thus leading to large differences in economic benefits under the same aquaculture model. Currently, the two main aeration techniques used to raise the level of DO in the water column are artificial and natural [
5]
. For example, in the case of natural aeration, where DO concentration decreases during the night, when the DO concentration in the water column falls below 5 mg, fish become sluggish and exhibit a behaviour known as "floating head", and may even suffocate, resulting in significant economic losses [
6]. In pond culture practice, the biological productivity of ponds is limited by the effectiveness of DO and the daily dynamics of DO in the pond, which can only reach 0.4-1 kg of fish/m
3, whereas additional aeration can increase fish productivity up to 4 kg/m
3 [
7]. Therefore, artificial aerator devices are widely used in aquaculture operations in order to improve the economic efficiency of IPA.
Aquaculture facilities frequently utilise artificial aerator devices to reduce these issues and increase fish production output. China's first 7.5-kilowatt impeller aerator was successfully developed in 1972 by the Chinese Academy of Fisheries Research Institute of Fisheries Machinery and Instrumentation Research Institute. On this basis, domestic enterprises have designed and produced a variety of specifications and types of push-water aerator equipment, which is now widely used in all areas of freshwater and saltwater aquaculture. Currently, The majority of paddlewheel aerators used globally, including in China, are mostly surface aerators [
8], such as impeller-type, micro-or nano-bubble aeration, and surge-type aerator equipment—are the most widely used artificial aerator method of pushing water aerator devices. Paddlewheel aerators are the best aerators in terms of performance [
9]. Another widely used technique is pressurised dissolution, which is based on Henry's law. In short, at higher pressures, the partial pressure and the amount of dissolved gases increase, and once the ambient pressure drops dramatically, a large number of micro- or nanobubbles are released into the water column by aerators such as porous membranes or aerators. For instance, by dissolving oxygen in water at a pressure of 300 kPa and ejecting the water through a nozzle, Hamamoto et al. [
10] generated nanobubbles (2.5×10⁵/mL, diameter 140-400nm); Oh et al. [
11] used a gas compressor in conjunction with a membrane module (composed of a hollow cylindrical porous material) to generate nanobubbles (11.3±2.8× 10⁸ /mL, with an average diameter of 159.0±31.9 nm).
With the increasing breeding density of pond engineered aquaculture system (IPA), the performance of its supporting push-water aerator devices is unable to meet the actual demand, resulting in high production cost, low yield, water quality deterioration and other problems, therefore, this study takes IPA as a carrier, designs a new type of push-water aerator device (NPWAD), clarifies the factors affecting the performance of the device and the optimal combination of operating parameters, with a view to providing a reference for the design of the push-water aerator device and the application of the research.
2. Materials and Methods
2.1. General Structure and Working Principle of the NPWAD
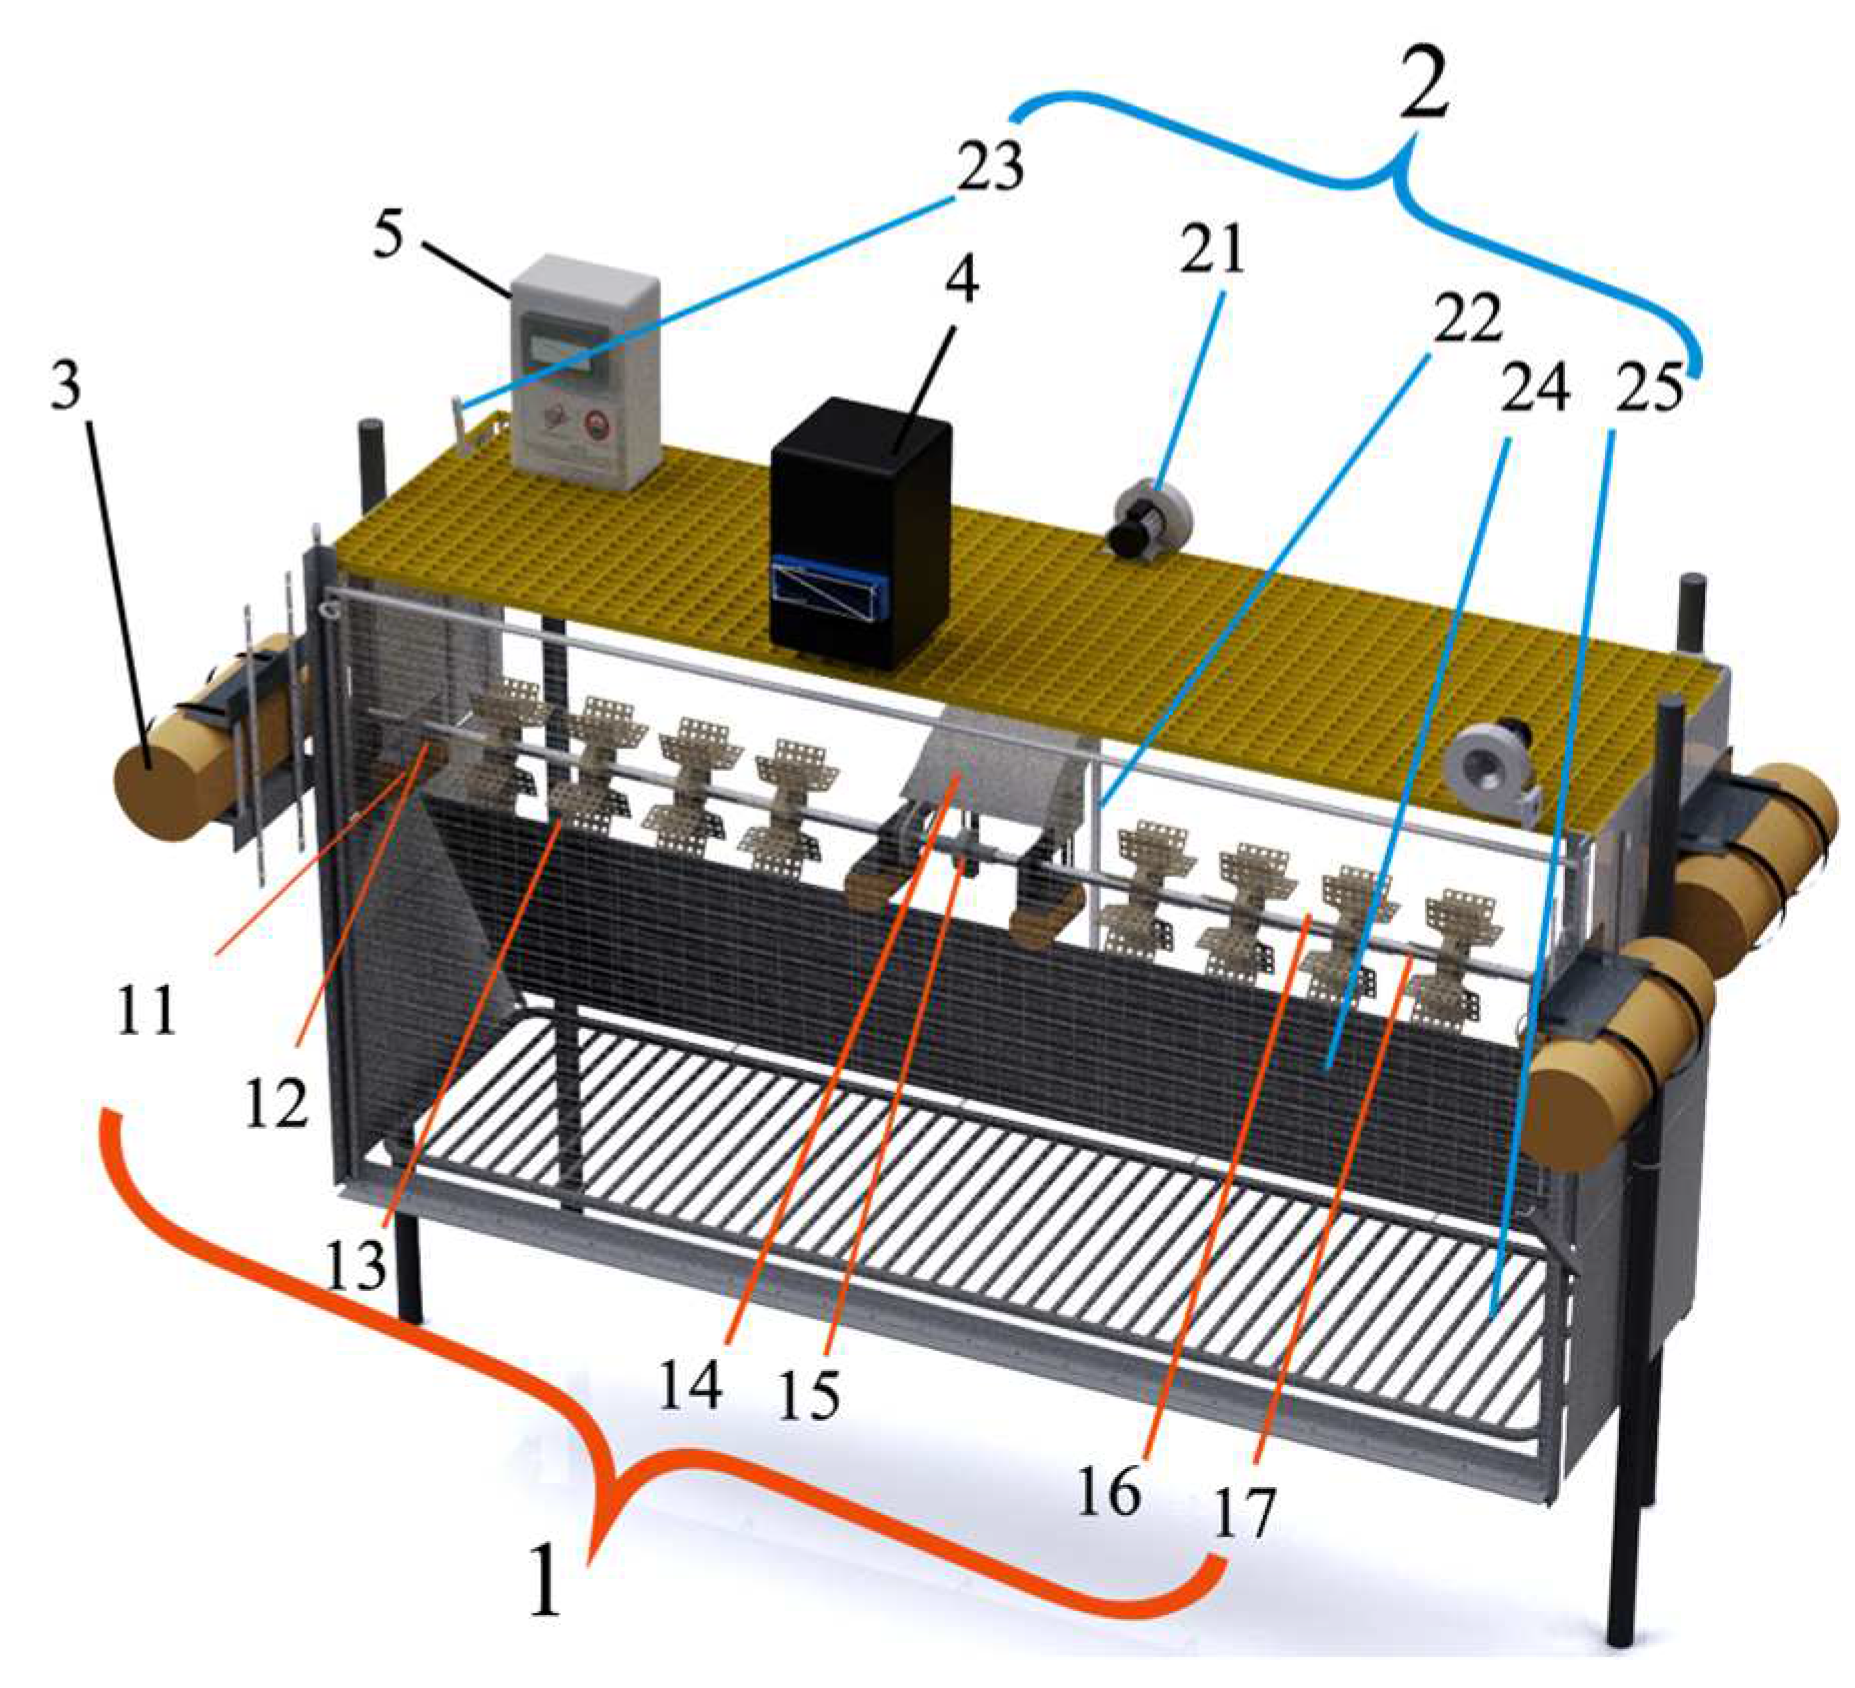
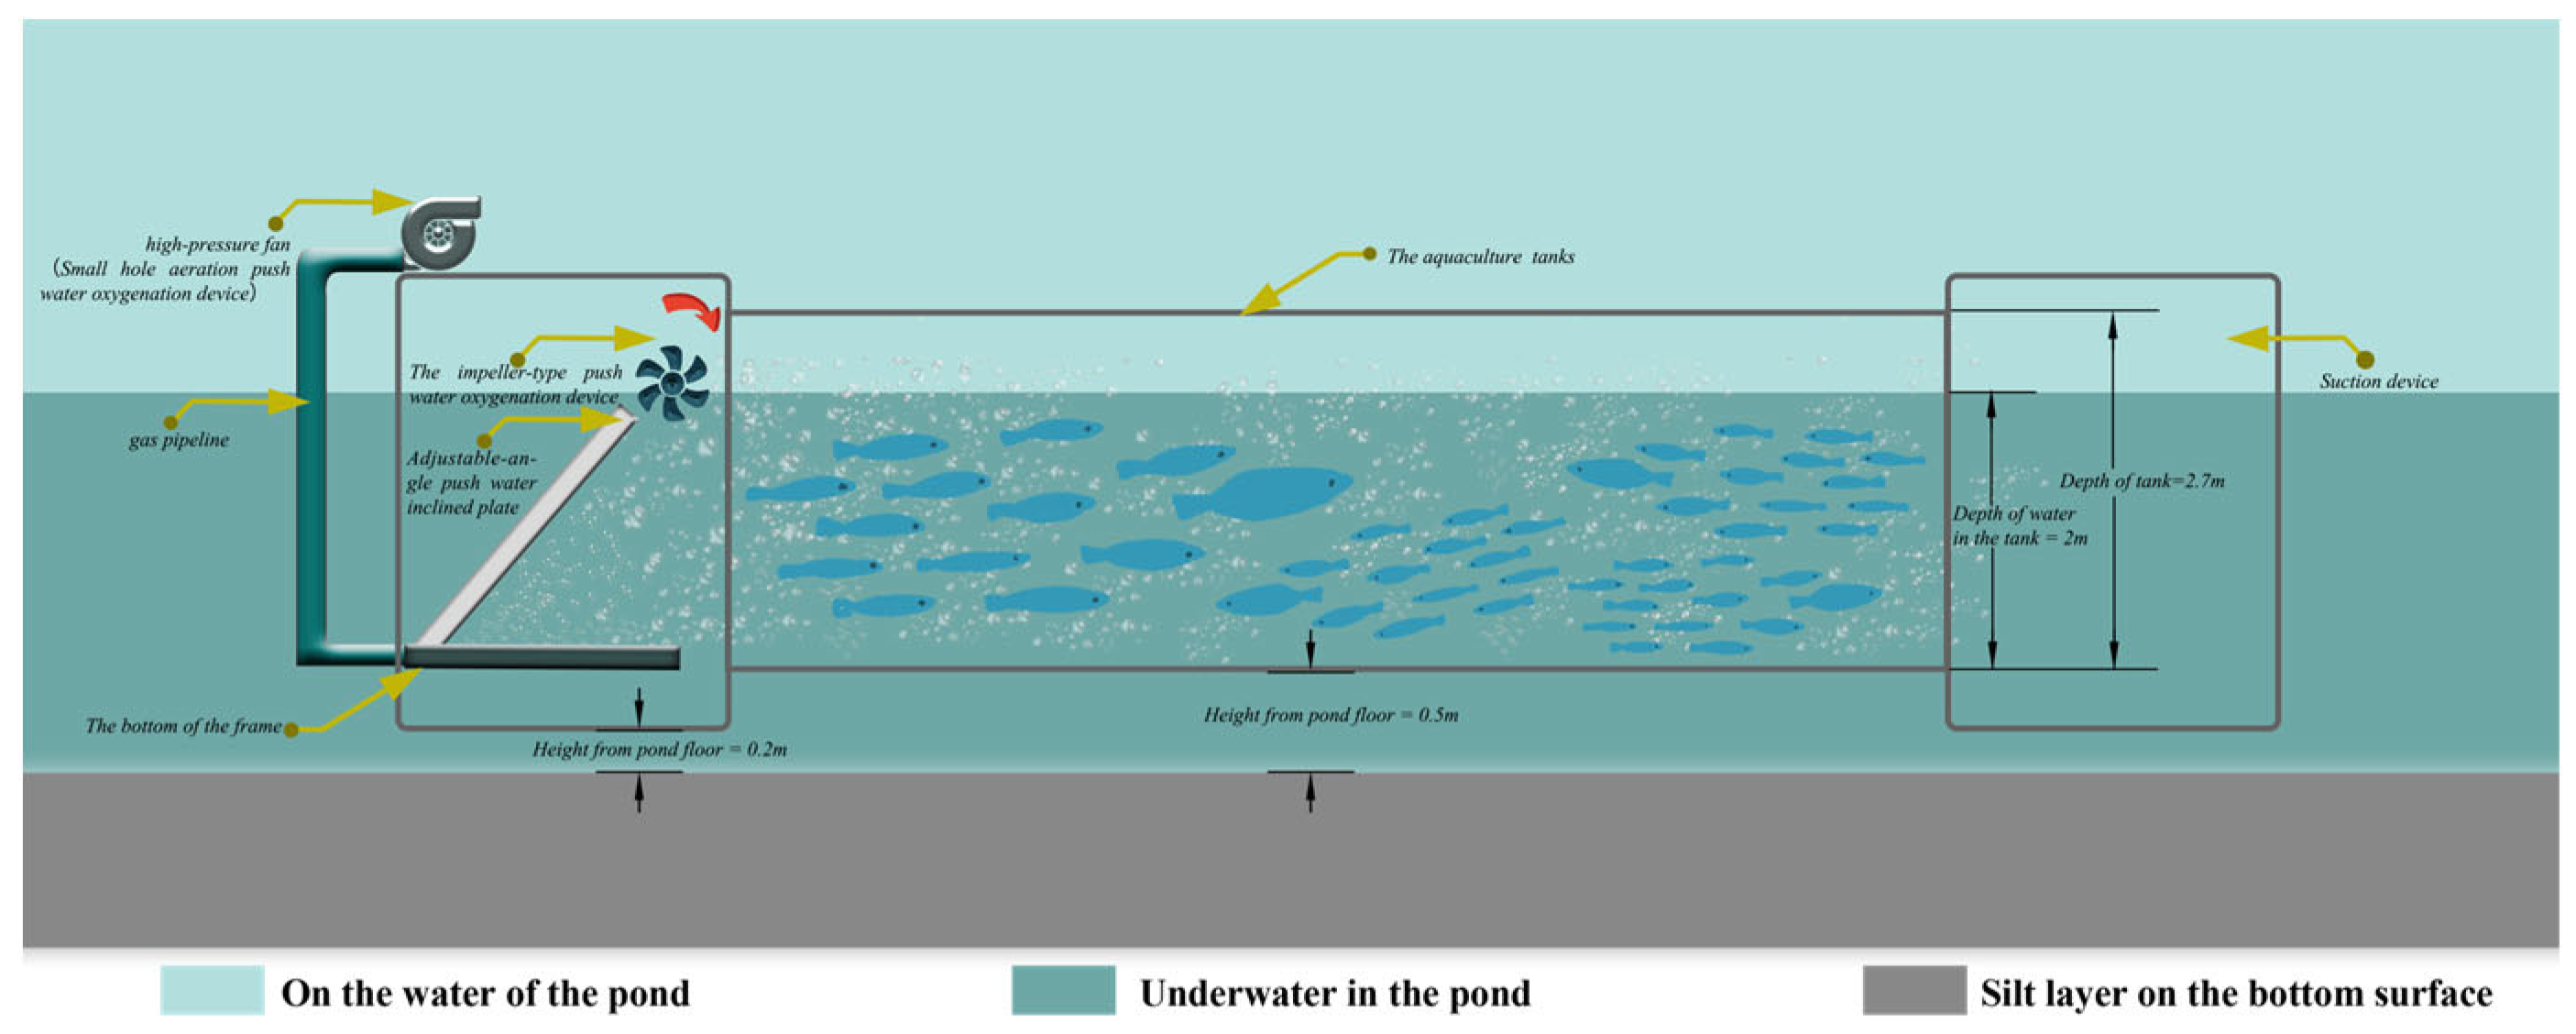
A small-hole aeration component and an impeller water lifting component make up the main structure of the NPWAD of the IPA, which is depicted in
Figure 2. The remaining assembled parts are made of galvanised steel.
Specifically, the main components of the small-hole aeration component include a centrifugal fan, an aeration disc set at the bottom of the frame, a main pipeline connecting the fan and the aeration disc, and an adjustable angle of the push-water slant plate. The fan with the aeration pipeline arranged at the bottom of the inclined plate will be high-pressure gas in the form of microbubbles into the water of the breeding tank, to achieve the effect of pushing water and increasing oxygen with aeration. Among them, the angle of the inclined plate can be changed by an adjusting lever to adapt to the matching of the water depth of different ponds with the water velocity of the water push, involving a structure of a three-link rotating mechanism including a control lever, a crank, a fixed rod connected to the main frame, a guide rod connected to the inclined plate of the water push, and a sliding slide. The other part is an impeller water lifting component, which consists of a vertical gear motor fixed to the main frame and an impeller rotating shaft driven by a chain of stainless steel, while the rotating shaft is connected by a flange to the side plate of the frame by bolts. The rotor shaft is uniformly set with 8 impellers of the same size, 4 bearing seats that can be connected to the float, and the frame side plate is reserved for an oblong hole to adjust the height of the rotor shaft centre line, the structure achieves the adaptation to a certain range of different depths of the pond water. The main technical parameters of the NPWAD are shown in
Table 1 and
Table 2.
When the two component synchronously open, centrifugal fan inhalation air compression, and then through the pipeline delivery of high-pressure gas to the bottom of water in the aeration disc, the aeration disc will produce micro-bubbles upward shot, bubbles to obtain the initial kinetic energy and drive the lower layer of water constantly upward impact ramps, which makes the micro-bubbles in the upward movement of the process is not only mixed with the surface layer of water, but also these micro-bubbles in the impact of the pushing water ramp, the ramp, the reaction force makes the micro-bubbles have the kinetic energy of forward propulsion. The reaction force of the ramps makes the microbubbles have the kinetic energy to push forward. At the same time, impeller water lifting component of the eight impeller high-speed rotation of the bubble shear refinement, and squeeze more gas into the water, enhance the water directed to the propulsion of kinetic energy, so that the movement with the continuous renewal of the surface layer of water, and the surface layer of water and due to the effect of gravity gradually supplemented to the lower layer, and guide the water in the tank in the same direction, so that the tank of the fish excrement into the suction device, the pond The water in the tank is continuously flowing into the breeding tank, which realising a complete process of water renewal and oxygenation.
2.2. Critical Structure Design and Selection
2.2.1. Centrifugal Fan
The centrifugal fan is the core component of the small-hole aeration component pushing water oxygenator and two main aspects are considered in the calculation of its selection, one aspect is that the rated boost pressure of the fan should be greater than the sum of the actual outlet pressure aeration loss pressure and the water depth pressure, i.e., ; on the other hand, the fan's outlet air flow rate should satisfy the sum of the oxygen demand for the fish culture and the organisms in the water, i.e., . However, in the actual use condition, the outlet air flow is affected by a variety of external conditions, including temperature T, relative humidity d, air pressure, etc., and the external conditions in the experiments would be determined first when calculating the outlet air flow.
The aquaculture experiments in this work were conducted in an environment with a maximum temperature of
=20℃ and an average relative humidity of
=80%. The IPA had
=110 m
2 tanks' area, a maximum fish load of 80 kg/m
2, and average hourly oxygen consumption
=0.00039 kg·(h · kW)
-1 kand hourly ammonia discharge
=57×10
-4 kg·(h · kW)
-1 of the farmed fish in the tanks. Based on the work of Hu J.C. et al. [
1], the necessary theoretical air supply
= 293.7 m³/h was computed, and
equation (1) displays the actual output air volume of the aquaculture tank under typical conditions.
where
denotes the theoretical volume of gas required for the aquaculture tank;
denotes the absolute temperature of the gas under the standard condition, K;
denotes the absolute temperature of the gas under the actual condition, K;
denotes the inlet pressure of the blower under the standard condition, kPa;
denotes the inlet pressure of the blower under the actual condition, kPa;
denotes the humidity content of the air under the actual use of the state, dimensionless.
The same kind of aeration diffuser as in the study by Xu Z.M. et al. [
12] was used for the loss (
) in the fan distribution pipe in order to simplify the calculation. The pressure loss in the main pipe (
) and branch pipe (
) was estimated using the pressure loss calculation in that literature. The parameters of the pipeline losses include the following: the main pipe's flow rate,
=120m³/h; the branch pipe's flow rate,
=240m³/h; the branch pipe's length,
=2m; the diameter of
=50mm; the air flow rate in the pipe
=13.4 m/s; and the arrangement of eleven branch pipes. All pipelines use tee-type pipelines. Simultaneously, take the aeration diffuser pressure loss
=1.5kPa and compute the overall loss of the aeration pipeline, as indicated by
equation (2), taking into account the resistance loss due to diffuser clogging.
where
denotes the total loss of the aeration pipeline, kPa;
denotes the pressure loss of the bottom aerators, kPa;
denotes the pressure loss of the main pipeline, kPa;
denotes the pressure loss of the branch pipeline and along the course, kPa.
Equation (3) indicates that the total pipe loss
and the water pressure
add up to the minimum lift of the fan under real-world operating circumstances.
where
denotes the minimum fan lift required for the water of the aquaculture tank, kPa;
denotes the pressure at the water depth of the water where the aerators is located, kPa.
2.2.2. Checking the Stiffness and Size of the Impeller
The impeller size determination and rigid strength calibration calculation are the primary design elements of the impeller water lifting component. The evaluation index comprises the device's total power and average water flow rate, with intermediate parameters like drag coefficient, blade rotational speed, blade submerged depth, diameter, and number of blades being involved. First, the resistance created by the water is reduced to a concentrated force operating on the middle of the submerged blade, which simplifies the combined resistance of the water to the blade. Then, geometrical data like the blade's radius and angle with regard to the vertical are used to determine the moments. Lastly, by combining the instantaneous power, the average power that will be used by the blades overall is obtained. The impeller shaft may also be thought of as a spinning shaft. The stiffness is calibrated based on the torsional stiffness circumstances of the shaft, and the strength is based on the bending and torsion synthetic strength criteria of the shaft.
The following are the primary specifications for the impeller design of an impeller-type aerator, according Li Z.N. et al. [
13]
: The dimensions of the impeller are 0.5 m, the shaft is 0.05 m, the blade rotation speed is 100 r/min, the maximum depth of the blade submergence is 0.125 m, the blade width is 0.1 m, and there are 64 blades in total. This leads to the calculation of
, the minimal total power needed by the impeller-type push-water aerator system.
where
denotes the projected area of the blade in the vertical direction of the flow velocity, m
2;
denotes the width of the blade, m;
denotes the depth of the blade into the water, m;
denotes single blade movement in the water resistance, which consists of differential pressure resistance and friction resistance, N;
denotes the drag coefficient associated with the shape of the blade, take = 1.5*, dimensionless;
denotes the relative velocity of the blade and the water, m/s;
denotes the density of water, kg/m
3;
denotes the radius of the blade wheel rotation week maximum depth of entry, m;
denotes the blade rotation week, m;
denotes the angle between the blade and the vertical direction at a certain point in time, °;
denotes when the blade into the water at a certain point in time or out of the water at a certain point in time, the blade is located in the plane of the angle between the vertical direction and the vertical direction, °;
denotes the arm of the blade in the water by the resistance
, m;
denotes a certain moment of the impeller consumes instantaneous power consumed by the impeller at a certain moment, kW;
denotes single blade by the water resistance moment, N·mm;
denotes for the angular velocity of the impeller, rad/s;
impeller speed, r / min;
denotes single blade from the water to the average consumption of power during the water, kW;
denotes the impeller needs to consume the total power, kW.
* denotes related to the shape of the submerged, and when the Reynolds number of the fluid >104 can be estimated according to the constant, when the waterwheel type aerator works, ≈3×10⁶, denotes generally taken as 1.4~1.5 for blade operation, and =1.5 in this paper.
2.3. Pond Integrated Aquaculture Systems (IPA)
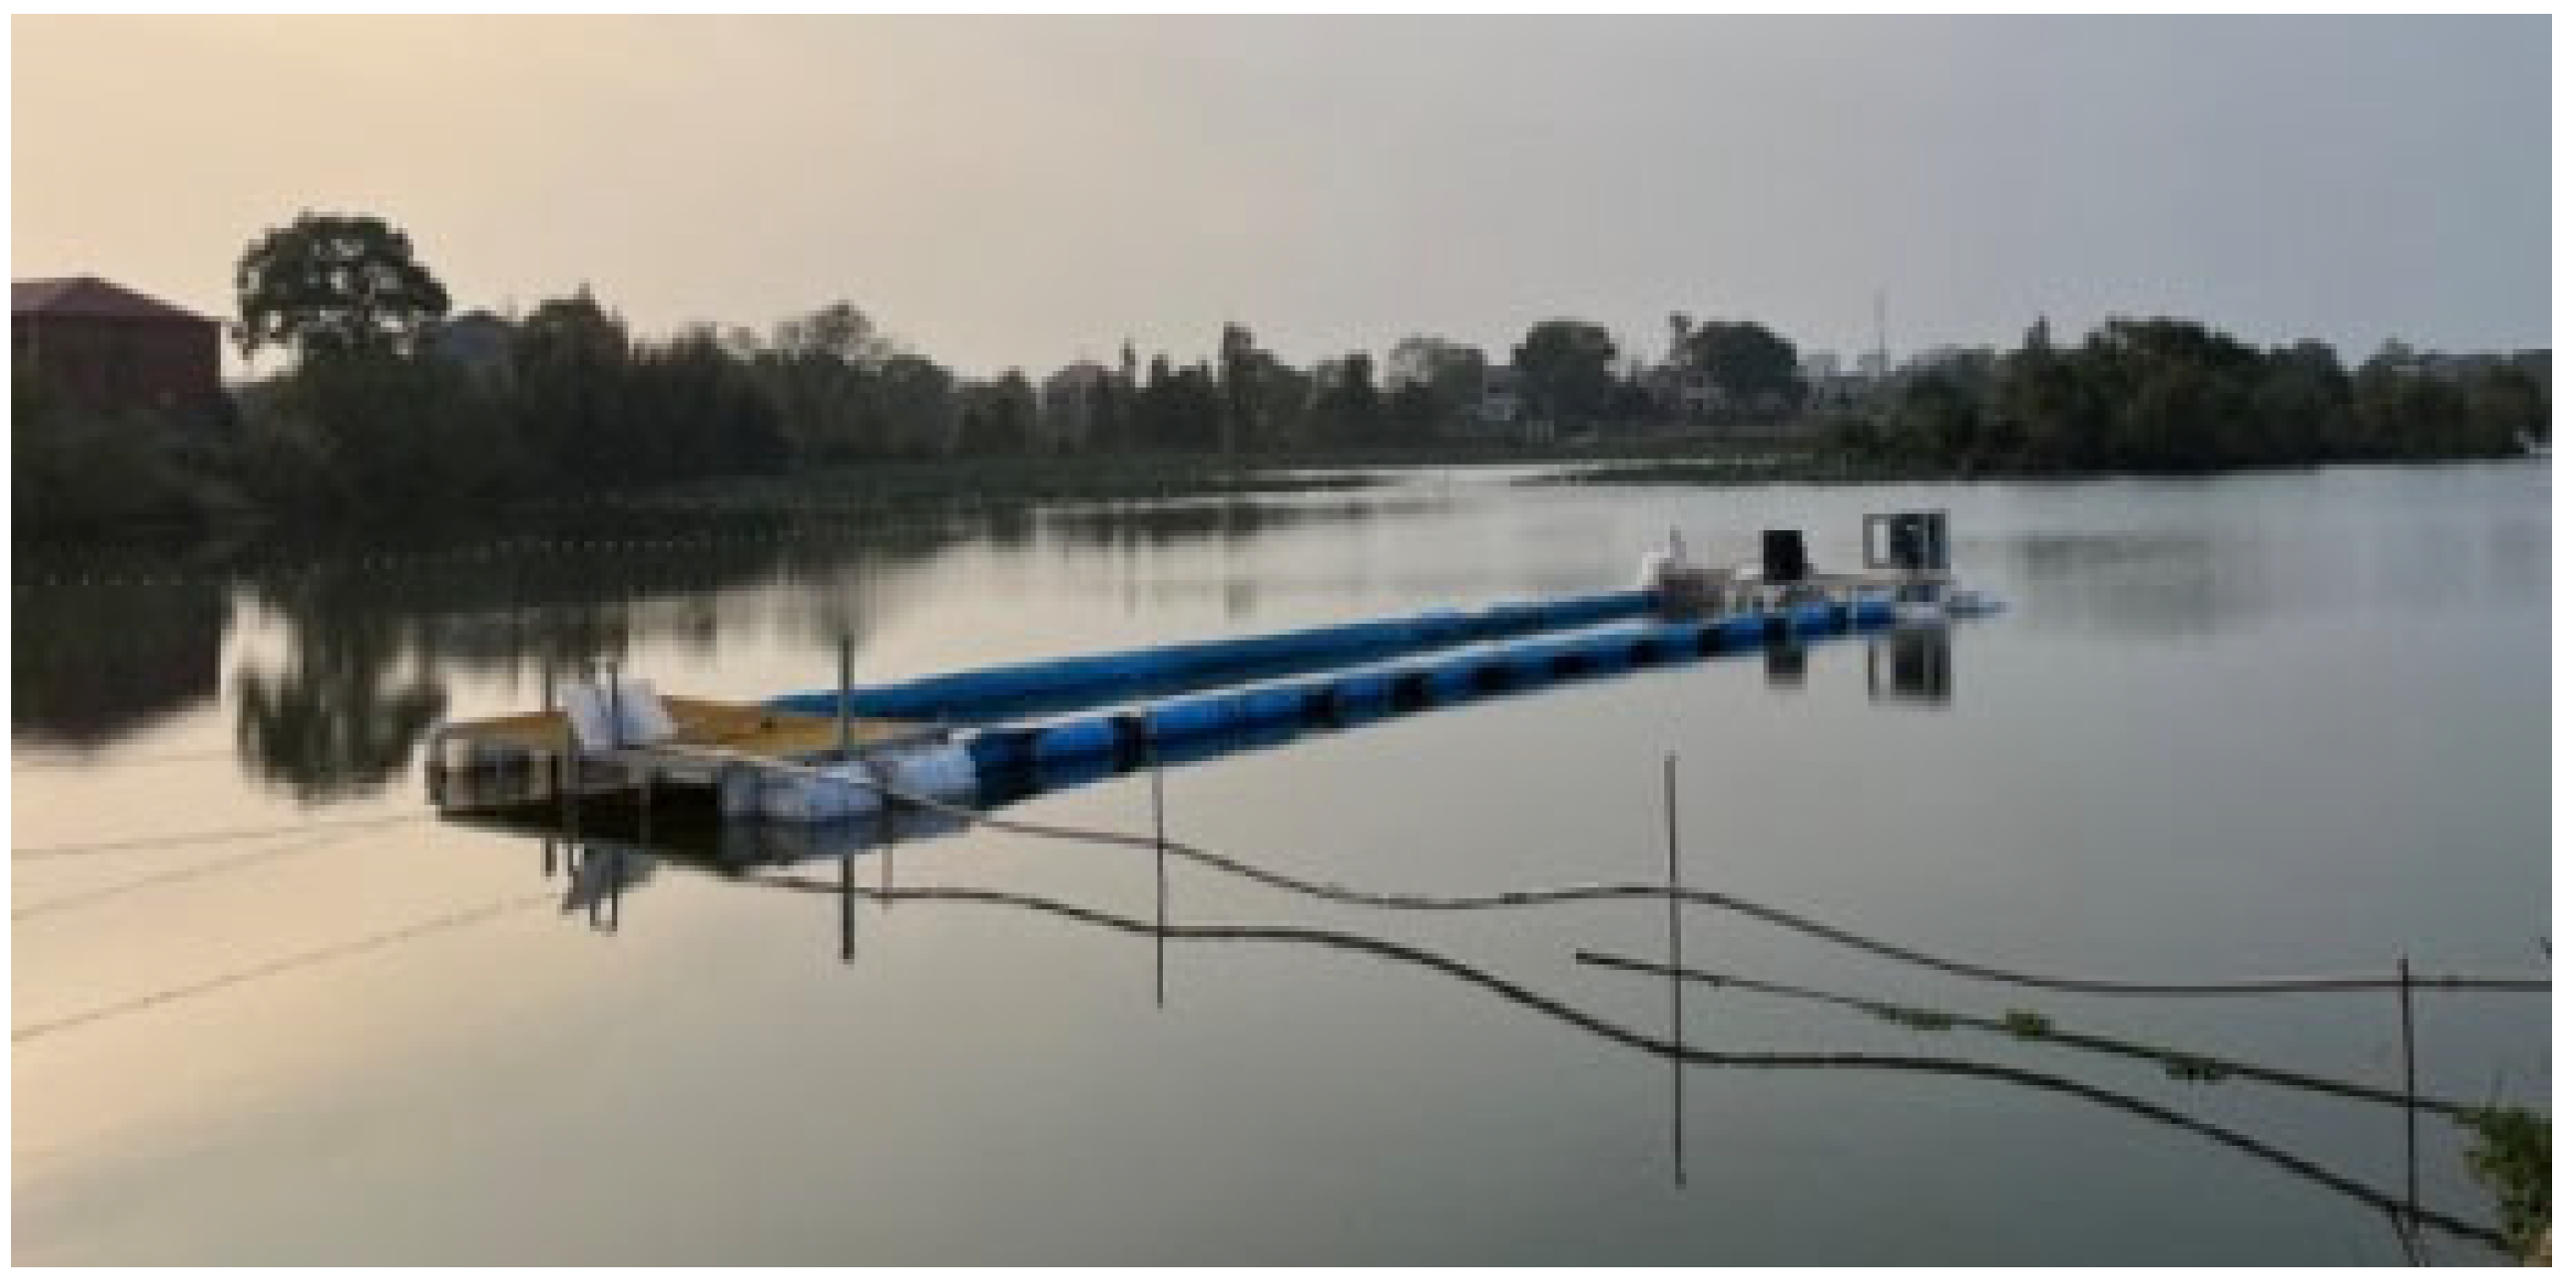
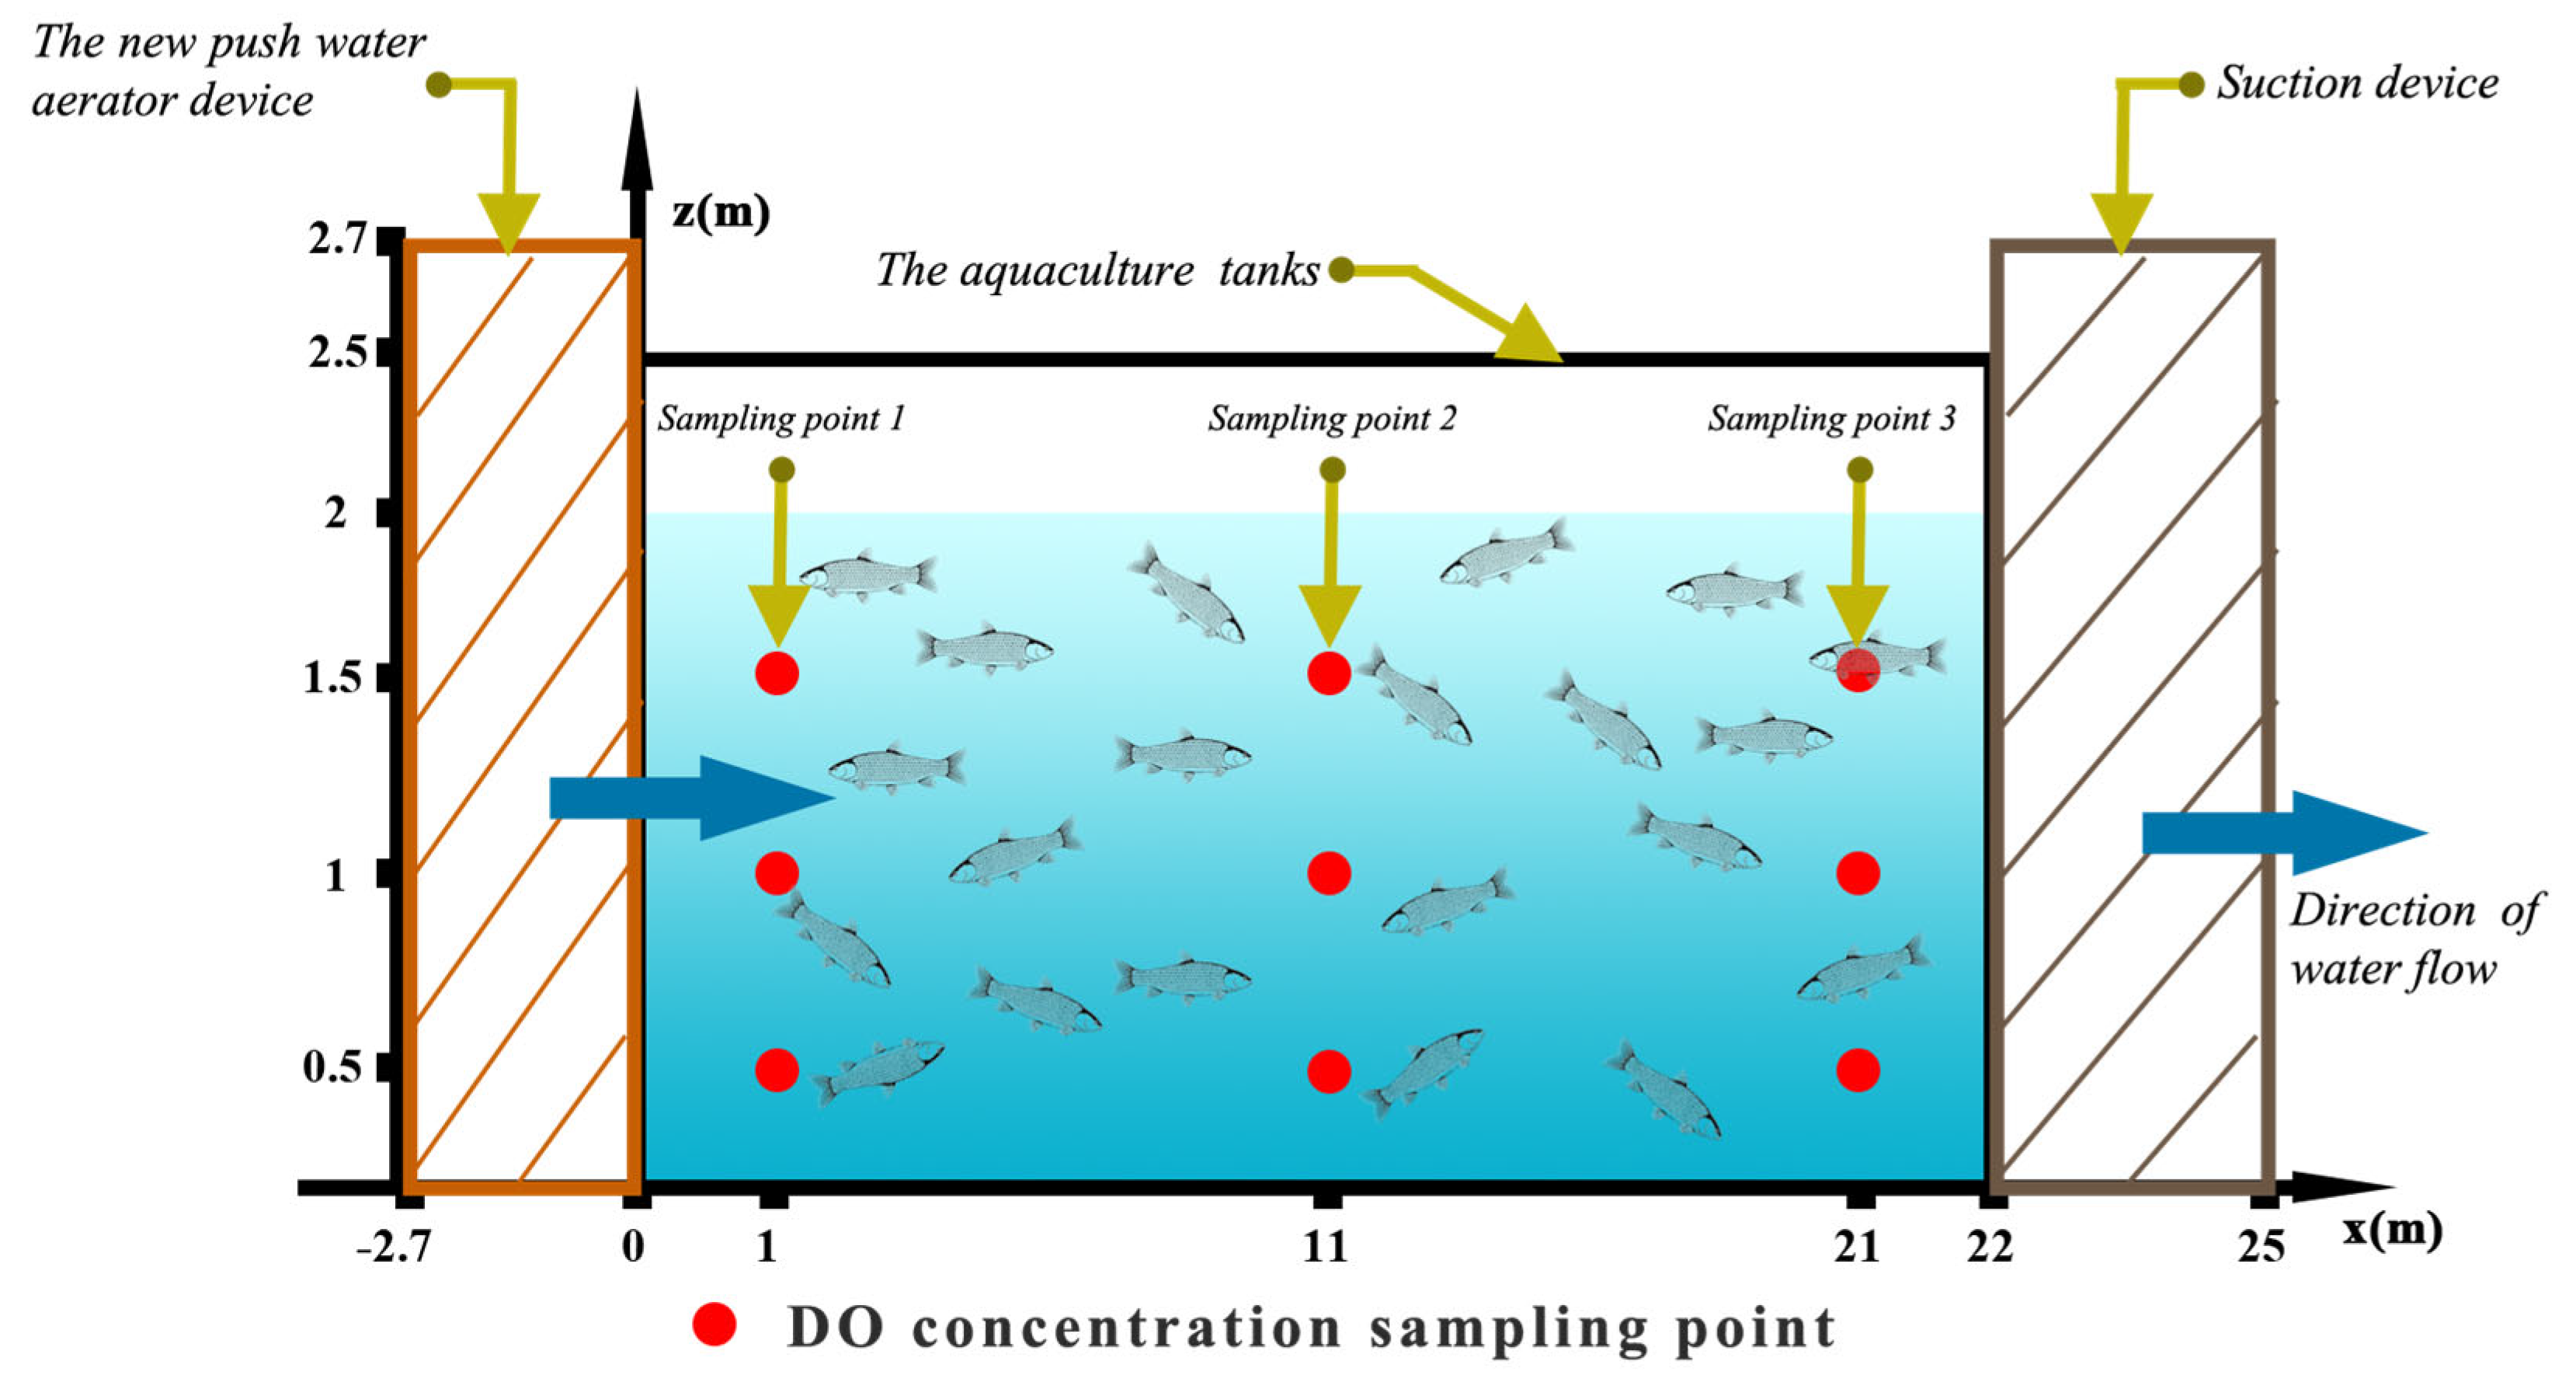
In Changsha City, China, Kaitian Fishing Village, an outdoor freshwater pond with an experimental pond pool measuring 33 acres and an average water depth of 2.5 metres was used to build up the pond integrated aquaculture system described in this work. The apparatus comprises a novel push-water aerator mechanism, aquaculture tanks, a suction device, and a floatation, among other components, all of which are secured to float in the centre of the pond by galvanised columns. The aquaculture tanks' overall dimensions are 22m×5m×2.7m (length × width × height), with the average water depth of the tank's water being 2 m. The design of the above-mentioned NPWAD is installed in the front end of the system, and the tank is closely connected to the tank to achieve the rapid enhancement of the water's DO concentration in the aquaculture tank. This arrangement is illustrated in
Figure 3 and 4. The height of the aquaculture tanks is greater than the water level of the pond to ensure that the cultured fish will not escape. Additionally, the front and rear ends of the system are set up to load-bearing walkways, to facilitate the experimental operation process measurement.
2.4. Rationale and Calculation Methods
2.4.1. Oxygen Enhancement and Oxygen Enhancement Power Efficiency
The experiments in this paper are based on the double membrane theory proposed by Whitman in 1926, according to which the theory reveals that the aerator process of the aerator equipment is essentially the penetration of oxygen molecules from the gas phase to the liquid phase through the gas-liquid interface in turn, and in such a system containing two or more compositions, due to the existence of a concentration gradient, there exists a tendency for substances to diffuse to the lower concentration, and the process of diffusion of substances from the higher to the lower concentration direction becomes a mass transfer process, referred to as mass transfer [
14]
. The process of dissolving oxygen molecules into water is referred to as oxygen mass transfer, and oxygen mass transfer is shown in equation (11).
where:
denotes the DO concentration in the water column, mg/L;
denotes the saturated DO concentration at a water temperature of 20°C, mg/L;
denotes the initial DO concentration, which is generally 0.
denotes the aeration time, h;
denotes the oxygen volumetric mass transfer coefficient, h
-1.
Non-linear regression analysis by Gaussian-Newton method was used to fit the measured data to derive the values of
and
. The oxygenating capacity,
, of the NPWAD refers to the amount of oxygen transferred by the device to the water column per unit of time at any water temperature and atmospheric pressure, as shown in equation (12).
where
denotes the amount of oxygen increase, kg/h;
denotes the volume of aeration pool water, m
3;
denotes generally the temperature of the water, ℃;
denotes the oxygen volume transfer coefficient at 20℃, h
-1;
denotes the saturated DO concentration corrected for the actual temperature, mg/L.
The saturated DO concentration
is affected by the partial pressure of oxygen or barometric pressure, and the value of
decreases when the barometric pressure decreases; conversely, it increases. Therefore,
generally needs to be multiplied by a pressure correction factor
, as shown in equation (16).
where
denotes the atmospheric pressure at the time of the experiment, kPa;
denotes the pressure of the water at the sampling point, kPa;
denotes the acceleration of gravity, 9.8 m
2/s; and
denotes the distance from the measurement point to the water surface, m.
Aerator power efficiency
denotes the amount of oxygen entering the water column through mass transfer as a proportion of the total oxygen supply, as shown in equation (17).
where
denotes the aerator power efficiency, kg·(h · kW)
-1;
denotes the actual power of the NPWAD, kW.
Through the above equation, the values of and were obtained by using equation (11) and combining with non-linear regression to fit the measured data, and then combined with equations (12)-(17) to obtain the aerator amount and the aerator power efficiency , which were used to evaluate the aerator effect of the device.
2.4.2. DO Uniformity
To determine the water's DO homogeneity, the DO data from each measurement point in water measured above were analysed for standard deviation [
15]
.
where
denotes standard deviation of DO;
denotes number of measurement points;
DO concentration at measurement points, mg/L;
denotes average of DO quality concentration at
measurement points, mg/L;
denotes uniformity of DO concentration in water, %.
2.5. Design and Analysis of Experiments
2.5.1. Experimental Outside Conditions
The experiments on the effects of the operating parameters of the NPWAD on oxygenation and push water were carried out in the IPA of Figs. 3 and 4. Since pH, water temperature and air pressure are the main factors affecting the DO concentration in the water, in order to avoid the influence of the above factors on the experimental results, the experiment was chosen to be carried out in 15 d under basically the same external conditions, with the following specific values: air pressure of 1010±5 kPa, pH value of 8.5±0.5, and water temperature of 15±2 ℃, and the daily measurement time period was from 7:00~9:00 a.m. Before the start of each group of experiments, it is necessary to debug the operating parameters of the NPWAD to the preset value, and to achieve a stable state of operation after the beginning of the measurement and recording of data, and then finally the measured data will be plotted as a graph of the changes in the DO concentration of the water in the tanks with the start-up time.
2.5.2. Setting of Measurement Points
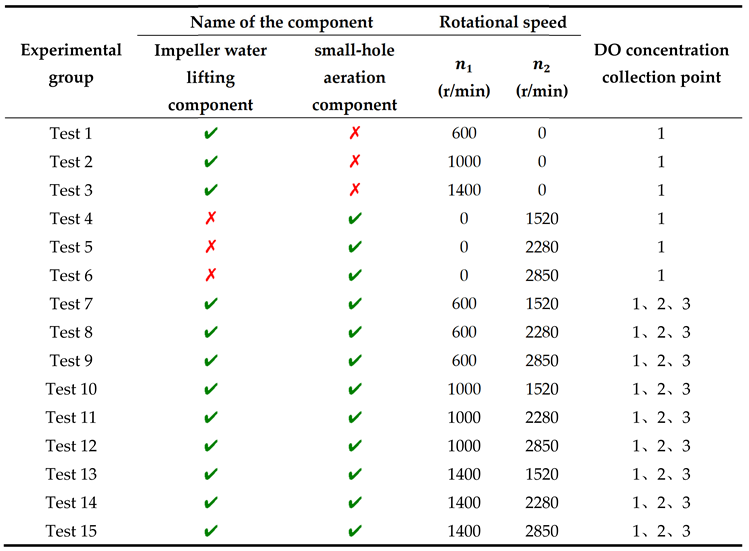
During the experiment, the data sampling points in the IPA were set up at three places, which were evenly arranged along the x-axis in the positive direction, 1m, 11m and 21m away from the connection between the culture tanks and the NPWAD, named as point 1, point 2 and point 3, and meanwhile, in order to comprehensively determine the changes of DO in the water body, three sampling points were set up along the y-axis in the positive direction for each sampling point, i.e., the locations of the water depths of 1/4, 2 /4 and 3/4 of the position. Therefore, a total of 9 sampling points were set up for the experiment, as shown in
Figure 5. In order to achieve data collection at the 9 sampling points, the DO probe was connected to a retractable rod, which can achieve the adjustment of the probe submerged water depth. The measurement frequency of each sampling point was 5 min, and each group of experiments was carried out for a total of 30 min, and the selection of sampling points for the specific experimental grouping is shown in
Table 3. At the same time, in the course of each group of experiments, it was also necessary to measure the surface flow velocity (
) of the water body at the three sampling locations described in
Figure 5, and take the average value of it to be recorded.
2.5.3. Experimental Instruments
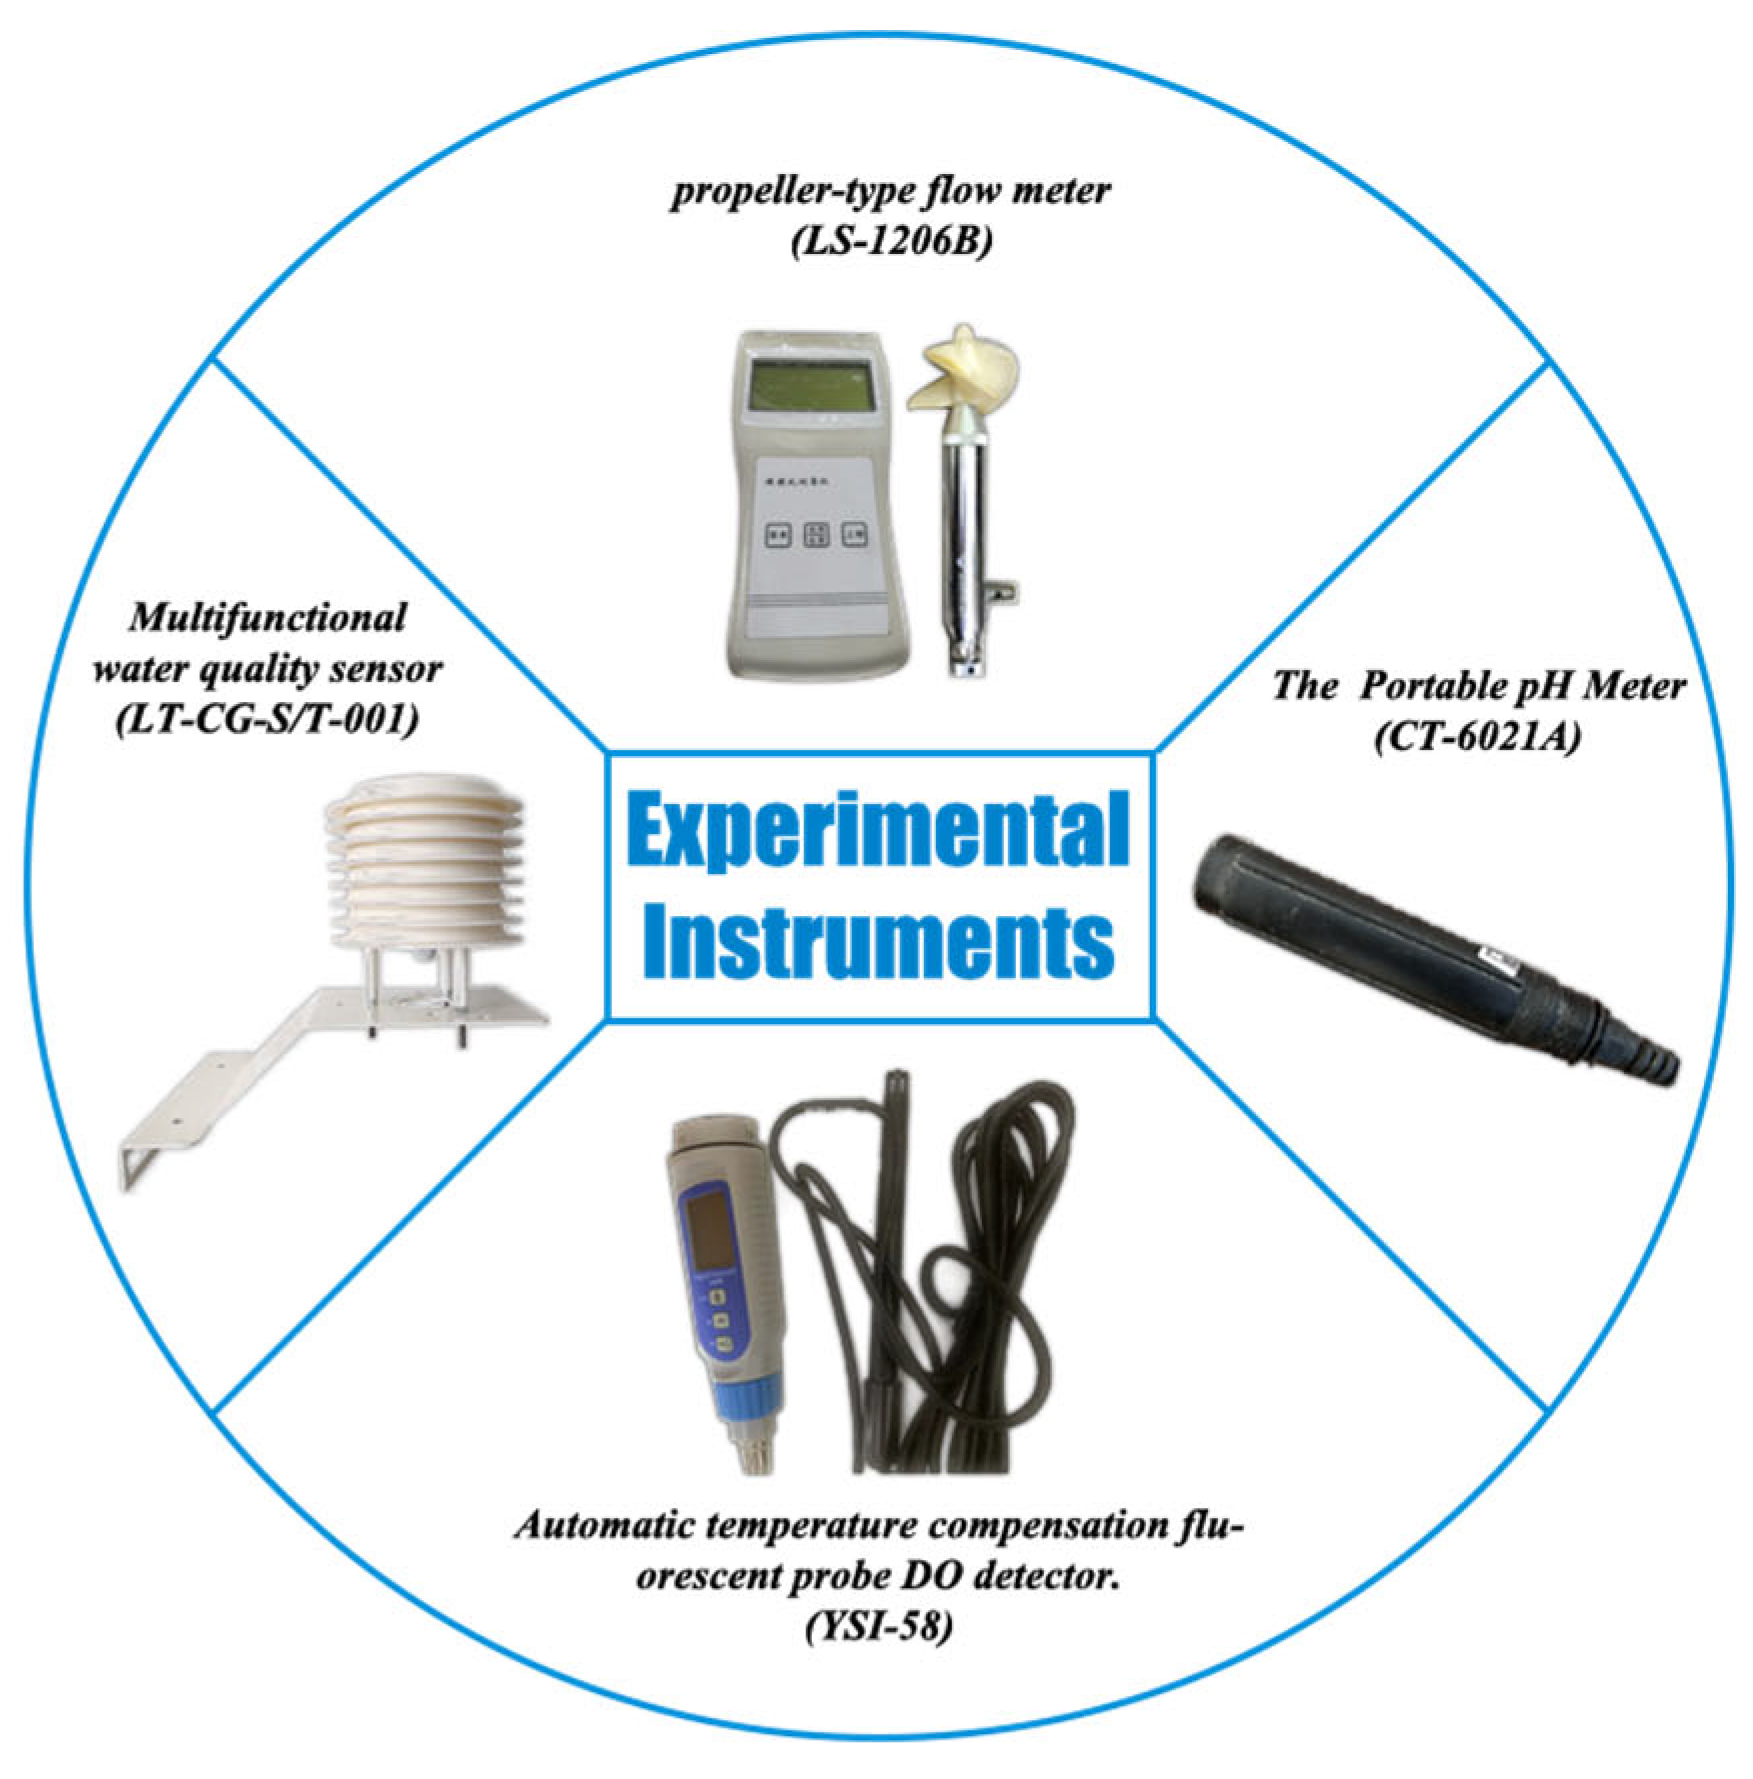
As shown in
Figure 6, the main experimental measurement instruments in this study include DO concentration meter (model YSI-58 fluorescent probe DO meter with automatic temperature compensation, the measurement error of full scale is ±2%F.S), multi-functional water quality sensor (model LT-CG-S/T-001 is used to take the parameters of water temperature, turbidity, ammonia nitrogen, etc.), portable pH meter (Model CT-6021A is used to determine the pH value of the water in the aquaculture tanks), propeller-type flow rate meter (Model LS-1206B is used to determine the average water flow rate in the aquaculture tanks).
2.5.4. Design of the Experimental Group
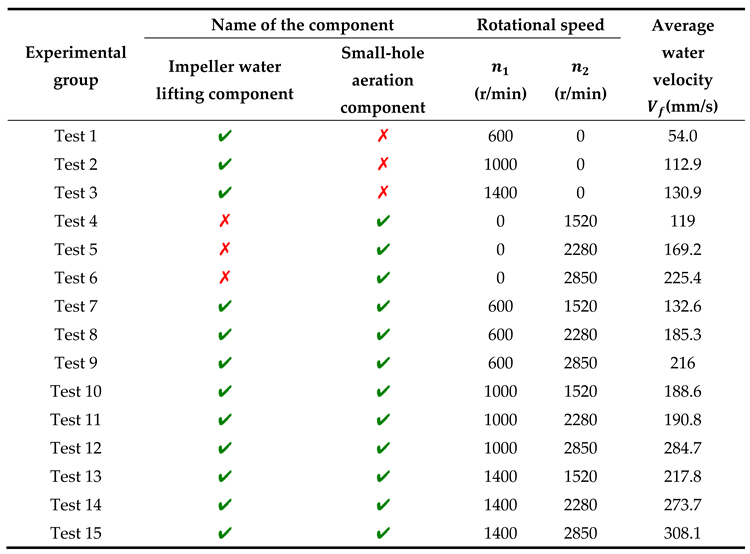
The one-factor (rotational speed) independent push-water aerator experiments and the one-factor (rotational speed) orthogonal push-water aerator experiments were conducted respectively, in order to investigate the pushing and aerator efficiency of the NPWAD in the IPA and its optimal operating parameters. The specific experimental design is shown in
Table 3, along with the oxygen transfer coefficients of the pond water,
, the aerator capacity,
, the aerator efficiency,
, and the surface layer mean flow rate
, as well as the uniformity of DO concentration in the pond water.
2.5. Data Filtering and Processing
The accuracy of the measurement data is greatly impacted by human error in the measurement procedure and the heavy effort associated with the experiment including numerous measurement data. We conducted a least-squares linear regression on the observed values of DO concentration from the experimental findings in order to increase the confidence of the results since there is a linear relationship between the measured DO increment and time in the aforementioned experimental procedure.
Let the slope
be the reverse of the oxygen mass transfer coefficient
at any water temperature. Equation (20) displays the linear equation.
where
;
denotes the DO concentration in the water at time 0.
The linear regression equation for the least squares method is shown in equation (21).
where
denotes the number of all experimental data;
denotes the average elapsed time of the experiment;
denotes the average value of DO concentration.
The standard deviation
, or the degree of deviation of the data, is found by comparing the regression results with the observed values.
where
denotes the measured DO concentration at a given moment;
denotes the regression prediction of DO concentration at a given moment.
According to the criterion in the regression equation, when the difference between the measured data and the regression value is greater than , it can be regarded as too large deviation, and the corresponding value of the DO concentration at its corresponding moment is deleted, in order to ensure the accuracy of the experimental data and to reduce the anthropogenic error, and the following experimental data are obtained.
3. Results
3.1. One-Factor Experiment and Analysis of Effect
The aerator capacity and power efficiency of the two components have been calculated theoretically in order to examine the independent aerator effect of the impeller water lifting component and the small-hole aeration component. Data from three sampling points of the DO concentration were intercepted.
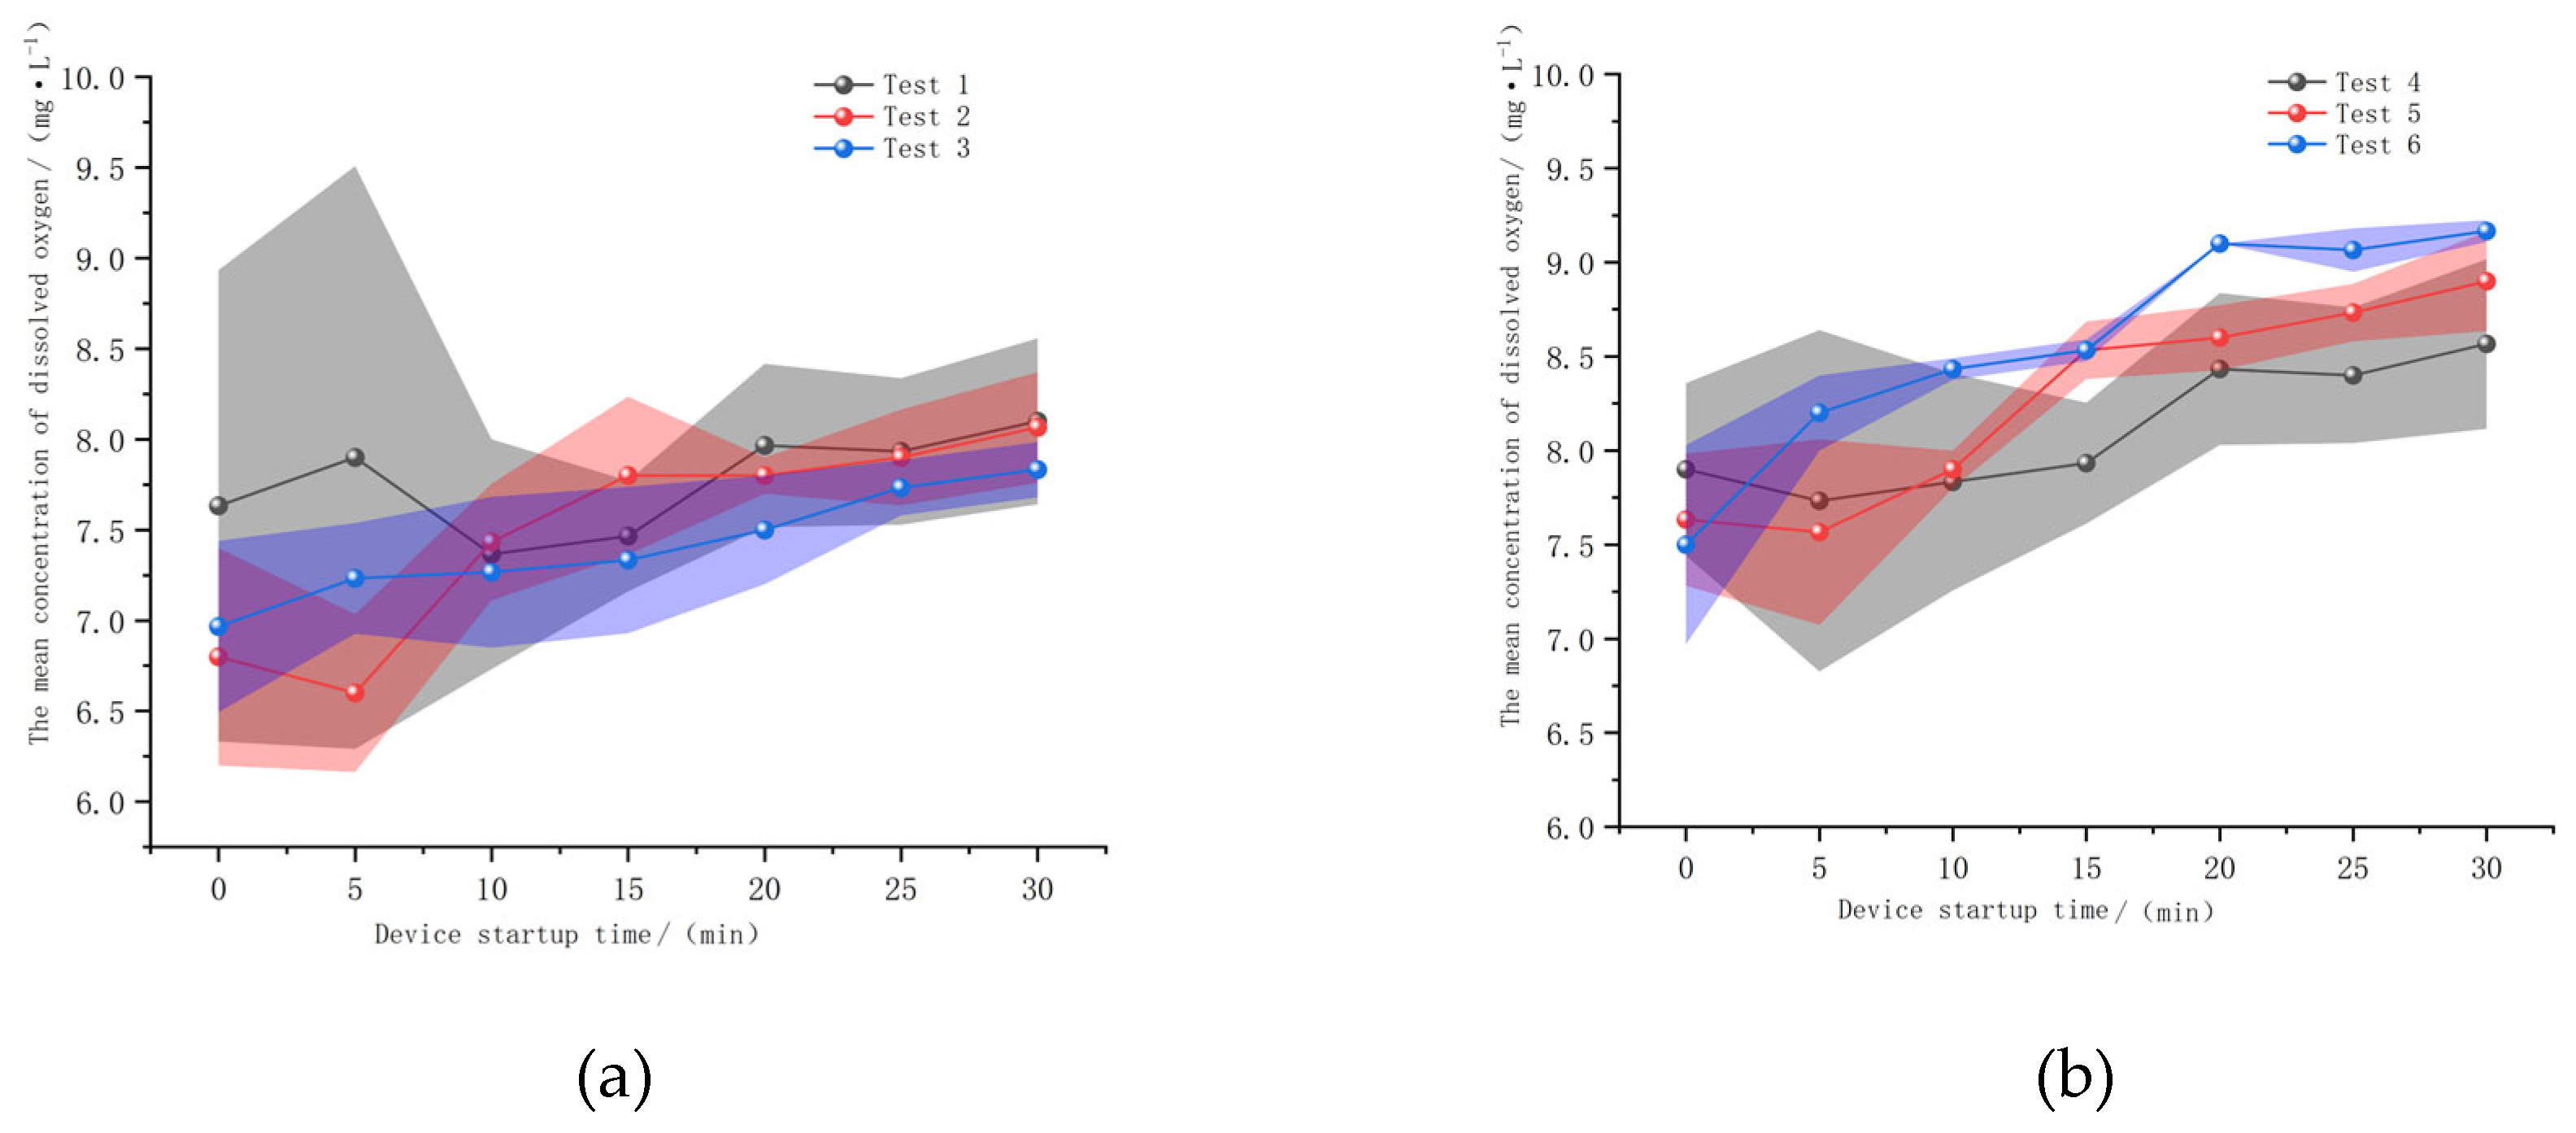
Firstly, we conducted experiments 1,2 and 3 for the oxygenation effect of the small-hole aeration component turned on alone for 30 min. Based on the mass transfer principle described in the text, we calculated that the average oxygenation capacity
of the component was increased by 0.56 mg/L, 1.36 mg/L, and 1.76 mg/L, respectively, and the average oxygenation power efficiencies
were 1.31 kg·(h · kW)
-1, 2.20 kg·(h · kW)
-1, and 2.51 kg·(h · kW)
-1, respectively, as shown in
Figure 7b.
Then we conducted experiments 4, 5 and 6 under the same experimental conditions, during which the initial value of the DO concentration of the pond water had a large difference, and when the impeller water lifting component was activated, the difference of the DO concentration was gradually reduced, which means that the component has a strong water exchange capacity, and it can effectively mix the middle and lower layers of the water with the surface layer of the water, so as to make it a better water homogeneity. In addition, during the experiment in
Figure 7a, according to the mass transfer principle described in the text, the average oxygenation capacity
of the component was calculated to be 0.43 mg/L, 0.81 mg/L, and 0.77 mg/L, respectively, and the average oxygenation power efficiency
was calculated to be 0.88 kg·(h · kW)
-1, 1.33 kg·(h · kW)
-1, and 1.26 kg·(h · kW)
-1, and the above analyses indicate that the average oxygenation power efficiency of the component is slightly higher than that of other similar device.
Based on such experimental data, it can be seen that the overall oxygenation efficiency of the small-hole aeration component is significantly higher than that of the impeller water lifting component, and in particular, the oxygenation effect of the former on the lower water is more obvious. At the same time, when the DO concentration of the water is 9mg/L, at this time, the change curve of the DO concentration with the start-up time of the equipment tends to stabilise, i.e., the power efficiency of the oxygen enhancement decreases significantly. It is worth noting that the oxygenation effect of the two components were obvious when other external conditions did not change significantly and the DO concentration was low. However, the slope of the curve gradually decreased when the DO concentration of the pond water was close to 8 mg/L, which indicated that the mass transfer coefficient of them decreased significantly when the DO concentration reached a certain value, indicating that it was almost impossible to oxygenate the water.
3.2. Orthogonal Test and Analysis of the Aerator Effect of the NPWAD
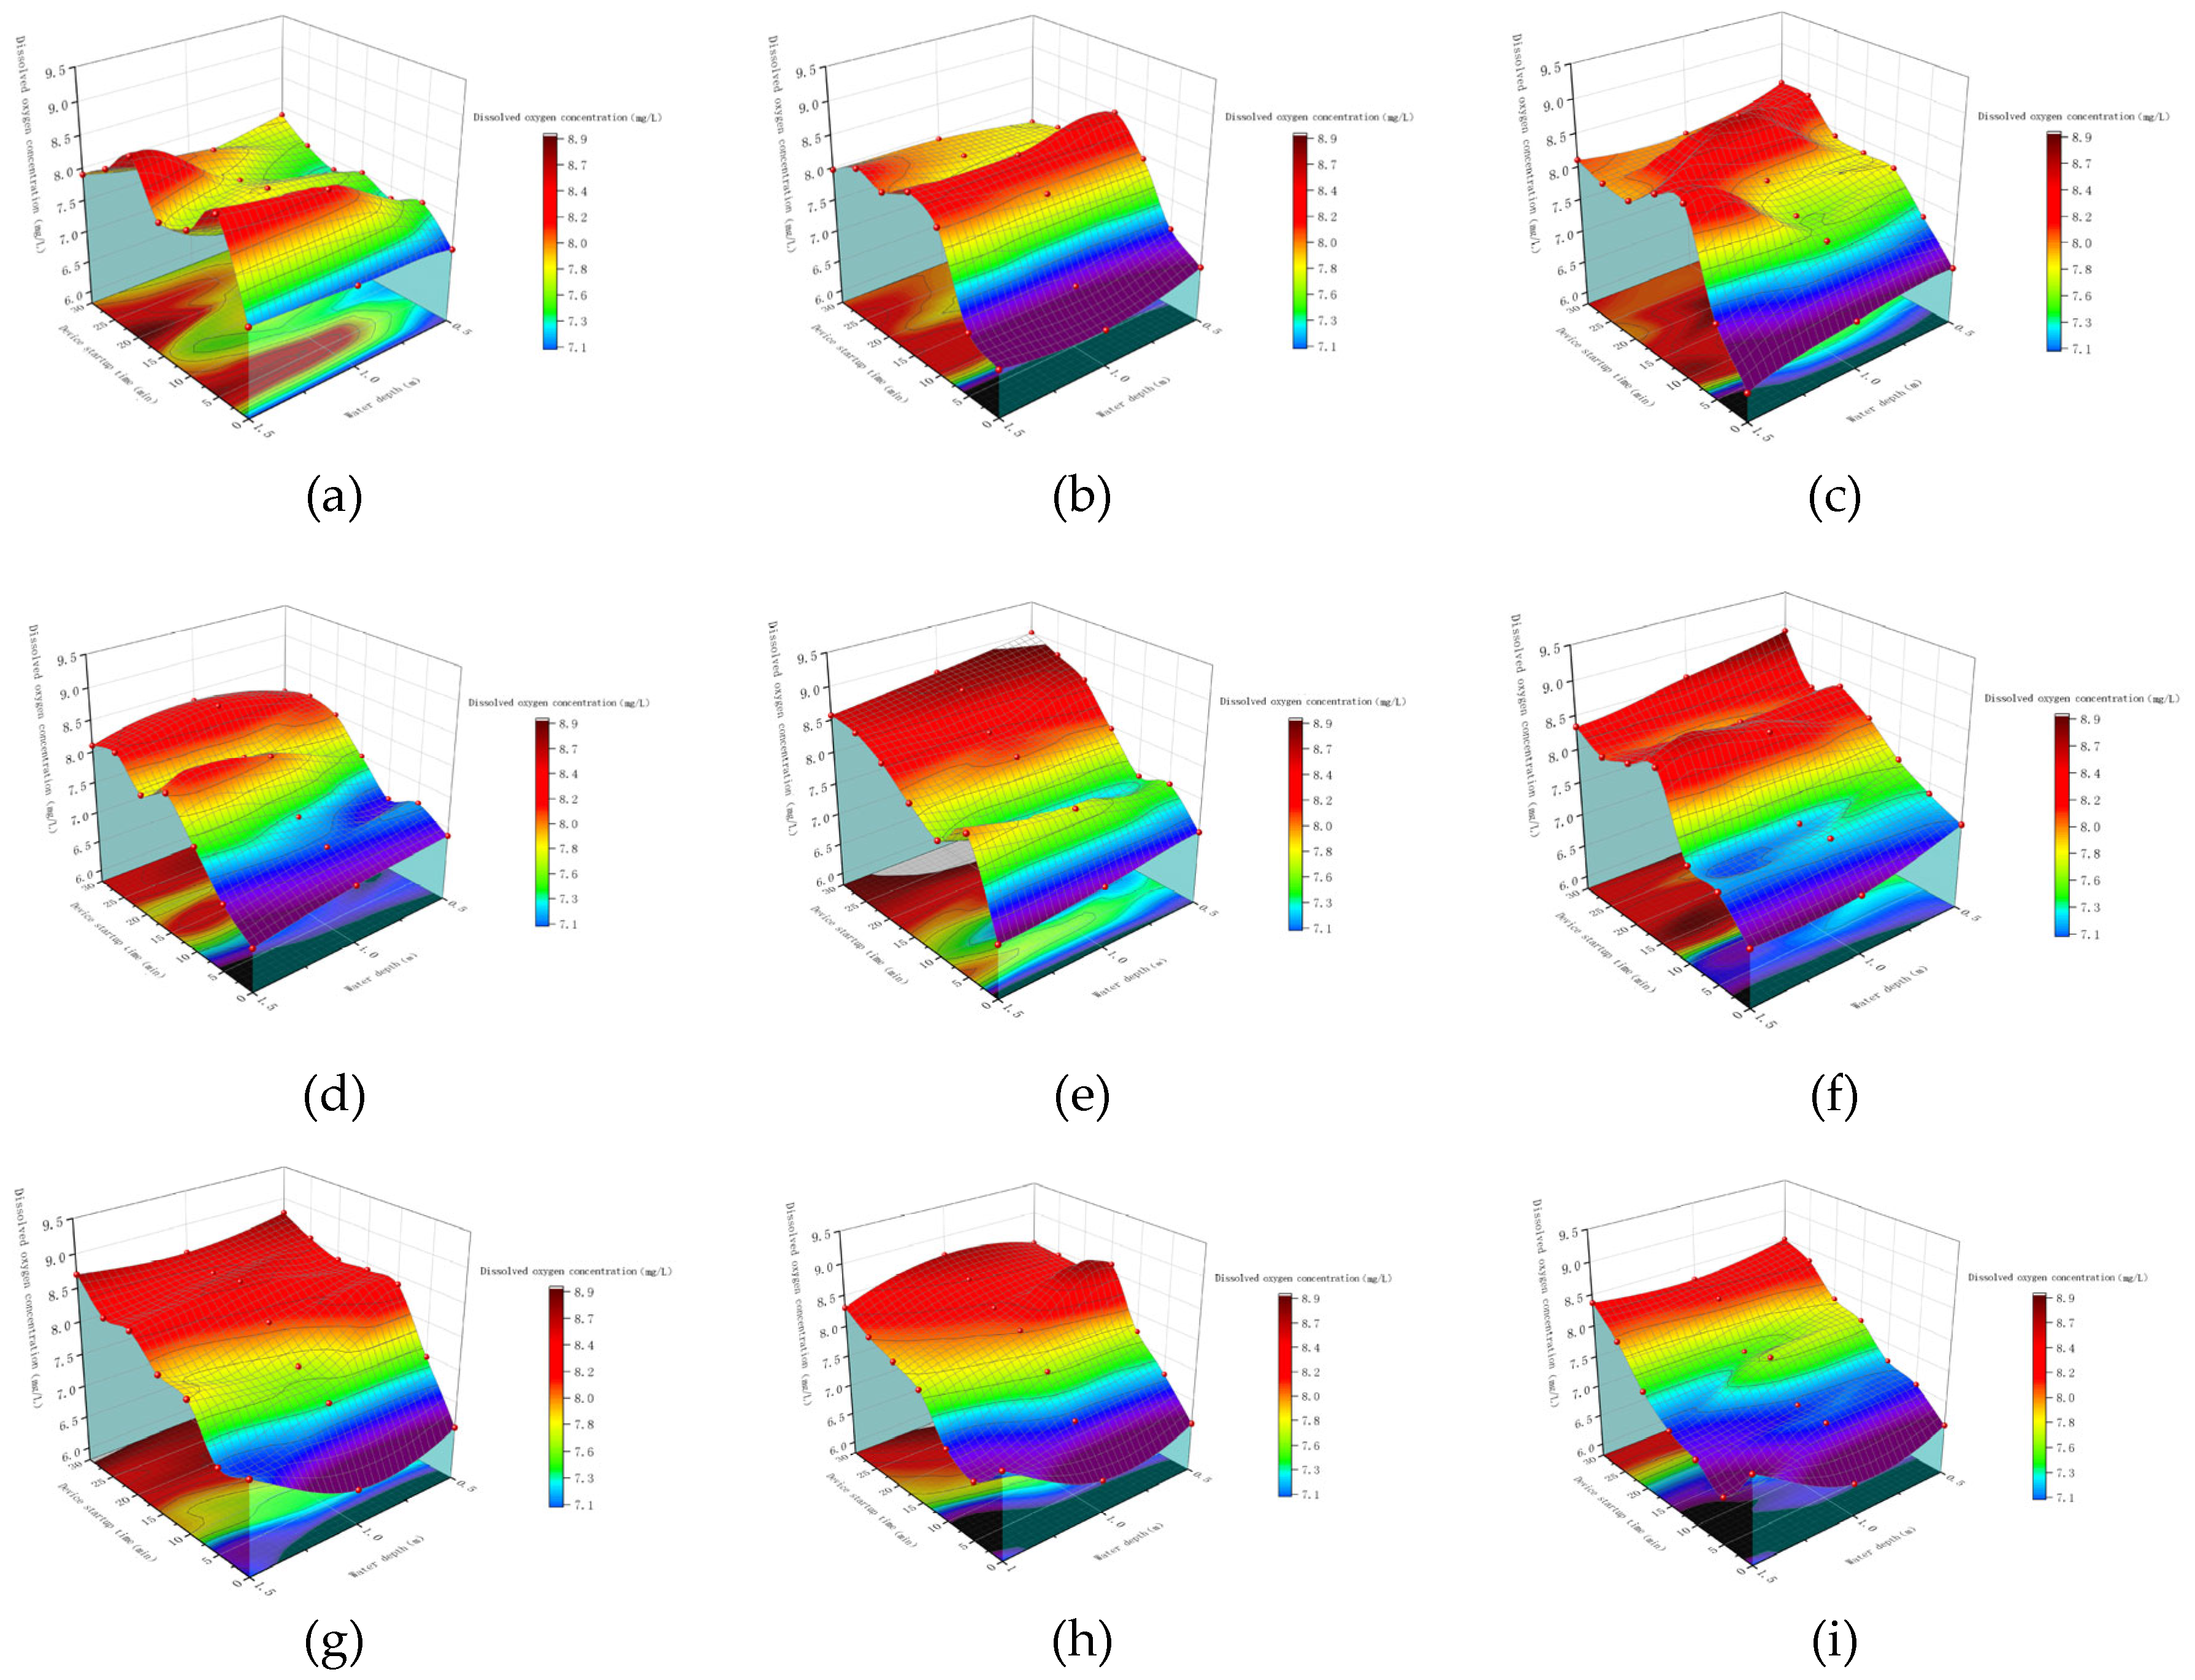
The raw data from each group's nine DO concentration measurement sites were averaged for convenience of comparison. That is, the water's DO concentration of the measured value of the results in the
-axis positive direction of the averaging process was plotted at 0.5m, 1m, and 1.5m, respectively, the change of DO concentration graph, as shown in
Figure 8. This is because the
-axis positive direction is 1m, 11m, and 21m from the front end of the measurement value to take the average.
As shown in
Figure 8, the oxygen increment (
) of DO concentration is positively connected to the operational parameters (
) of the NPWAD, i.e., with the rise of rotating speed, the oxygen increment
of the device gradually increases. In the meantime, the experimental results at the impeller water lifting component's rotational speed,
=600, or Figures a–c, demonstrate that when the device is turned on for 15 minutes, there is a significant range of fluctuation in the values. In particular, the water in the centre (point 2) exhibits the largest range of variation. The DO concentration at each oxygen measurement site in the water varied during the course of 30 minutes after the device was engaged, exceeding the value at the initial zero hour. On the other hand, the aforesaid discrepancy steadily reduces when the impeller water lifting component's rotating speed,
, increases. This suggests that the component can improve the homogeneity of the water and its DO content.
According to
Figure 8a, the new push-water aerators under the combination of rotational speeds could only maintain the depletion of DO concentration in the water and did not contribute more to the effect of aerator. The range of change of DO in the water was narrow, the effect of aerator was poor, and the phenomenon of stratification of DO concentration in the upper, middle, and lower water bodies did not disappear.
Figure 8b–d show that, in the meanwhile, the device may raise the water's DO content very quickly in a short amount of time (15 min), but that it will subsequently swiftly decrease to a specific level and maintain dynamic equilibrium. This could be because the concentration of DO in the water is getting closer to saturation, which strengthens the respiration of cultured fish, aquatic plants, and animals. Alternatively, it could be because the mass transfer capacity of the oxygen molecules in the water has been compromised.
As can be seen from the experiment's findings, under the operating conditions represented by (e), (f), (g), (h), and (i) in
Figure 8, the new push-water aerator has a better aerator effect and clearly improves the water uniformity. The identical operating parameters for (e) and (i) were
=1000r/min,
=2280r/min and
=1400r/min,
=2850r/min, respectively. The average oxygen enhancement for the former was
=1.92 mg/L, the average oxygen enhancement power efficiency was
=3.83 kg·(h · kW)
-1, and the DO uniformity
=95.3%; for the latter, it was
=2.10 mg/L,
=3.13 kg·(h · kW)
-1, and
=98.1%. Thus, when the unit was switched on with the operating parameters in Test 11(i.e.,
=1000r/min,
=2280r/min), it had better DO uniformity and the highest average aeration power efficiency, which was the optimal operating parameters for the unit.
3.3. Testing and Analysing the Pushing Effect of the NPWAD
In order to investigate the push-water performance of this aerators and whether it makes its pond water flow directionally for the purpose of water circulation. This test used when the average flow rate ≥60mm/s is considered that the water is with directional mobility.
Under the operating parameters in Test 1, the average flow velocity is less than or equal to 60 mm/s of the water, i.e. the water does not have directional mobility, so it is not appropriate to use this operating parameter in the actual production process.
According to Peng Y.F. [
16]
, as fish move for a long period of time, they change their preferred flow rate, and the exercise-trained fish are able to quickly recognise the flow rate and swim towards the low flow rate area while saving energy. Meanwhile, the preferred swimming speed of grass carp showed a tendency to decrease with increasing length. Specifically, the preferred swimming speeds of grass carp in the length range of 10~20 cm, specifically in the untrained group L
1(10~13 cm), L
2(13~16 cm), L
3(16~20 cm) were 250mm/s-320mm/s, <320mm/s, <320mm/s, and the preferred swim- ming speeds of the trained groups in each length group were 250~320mm/s, <250mm/s, <250mm/s. However, under the operating parameters set in Tests 12, 13, 14, and 15 of the NPWAD push-water effect test, the average flow velocity
in the surface layer of the water was >250mm/s. The above study suggests that it is important to avoid switching on the above four types of operating parameters as much as possible in the actual production process, so as to avoid the excessive flow velocity of the water which may lead to the development of digestive problems in the ground fish. To avoid the occurrence of indigestion, slow growth, excessive fish activity and other undesirable phenomena in the aquaculture fish.
The above verification test shows that when the NPWAD is turned on with the operating parameters =1000r/min and =2280r/min in test 11, the average velocity of the surface of the water <250mm/s, which can be better adapted to the growth characteristics of the cultured grass carp, and the combined value of the operating parameters is the optimal combination of the operating parameters of the equipment in actual production.
Table 4.
Experimental results of different operating parameters of a new push water aerator device (NPWAD) on push water performance.
Table 4.
Experimental results of different operating parameters of a new push water aerator device (NPWAD) on push water performance.
3.4. Cost/Benefit Analysis
The NPWAD of the components in the separate opening, the impeller water lifting component of the aerator power efficiency
=0.88~1.31 kg·(h · kW)
-1, and the small-hole aeration component of the aerator power efficiency
=1.31~2.51 kg·(h · kW)
-1 meet the aerator device's selection requirements, as indicated by the multi-group experimental results in the text. The aerator performance of the aerator device is within the normal range of the same type of aeration. It is noteworthy that the aeration power efficiency of the NPWAD ranges from 1.3 to 3.8 kg·(h · kW)
-1. The aeration power efficiency reaches its maximum value when the device's operating parameters are
= 1000r/min and
= 2280r/min. At these times, the aeration power efficiency surpasses that of the impeller-type aerator device and the microporous aeration aerator device by 35% and 153%, respectively, and also exceeds the average value of the current aerator (52%), as
Table 5 illustrates. This demonstrates that, in keeping with the design of the anticipated aims, the novel push water aerator device described in this work has robust aerator performance , and it has the power to move water.
4. Discussion
Since the experimental site was outdoor in a freshwater aquaculture pond, the DO concentration of outdoor water was affected by many factors, including physical, chemical, biological and anthropogenic factors [
25,
26]. In order to minimise the measurement error of external conditions on the values of DO and other indicators of the water in the aquaculture tanks, 15 days of the experimental process were selected for the experiment when the factors affecting the DO concentration (pH value, water temperature and air pressure) were similar.
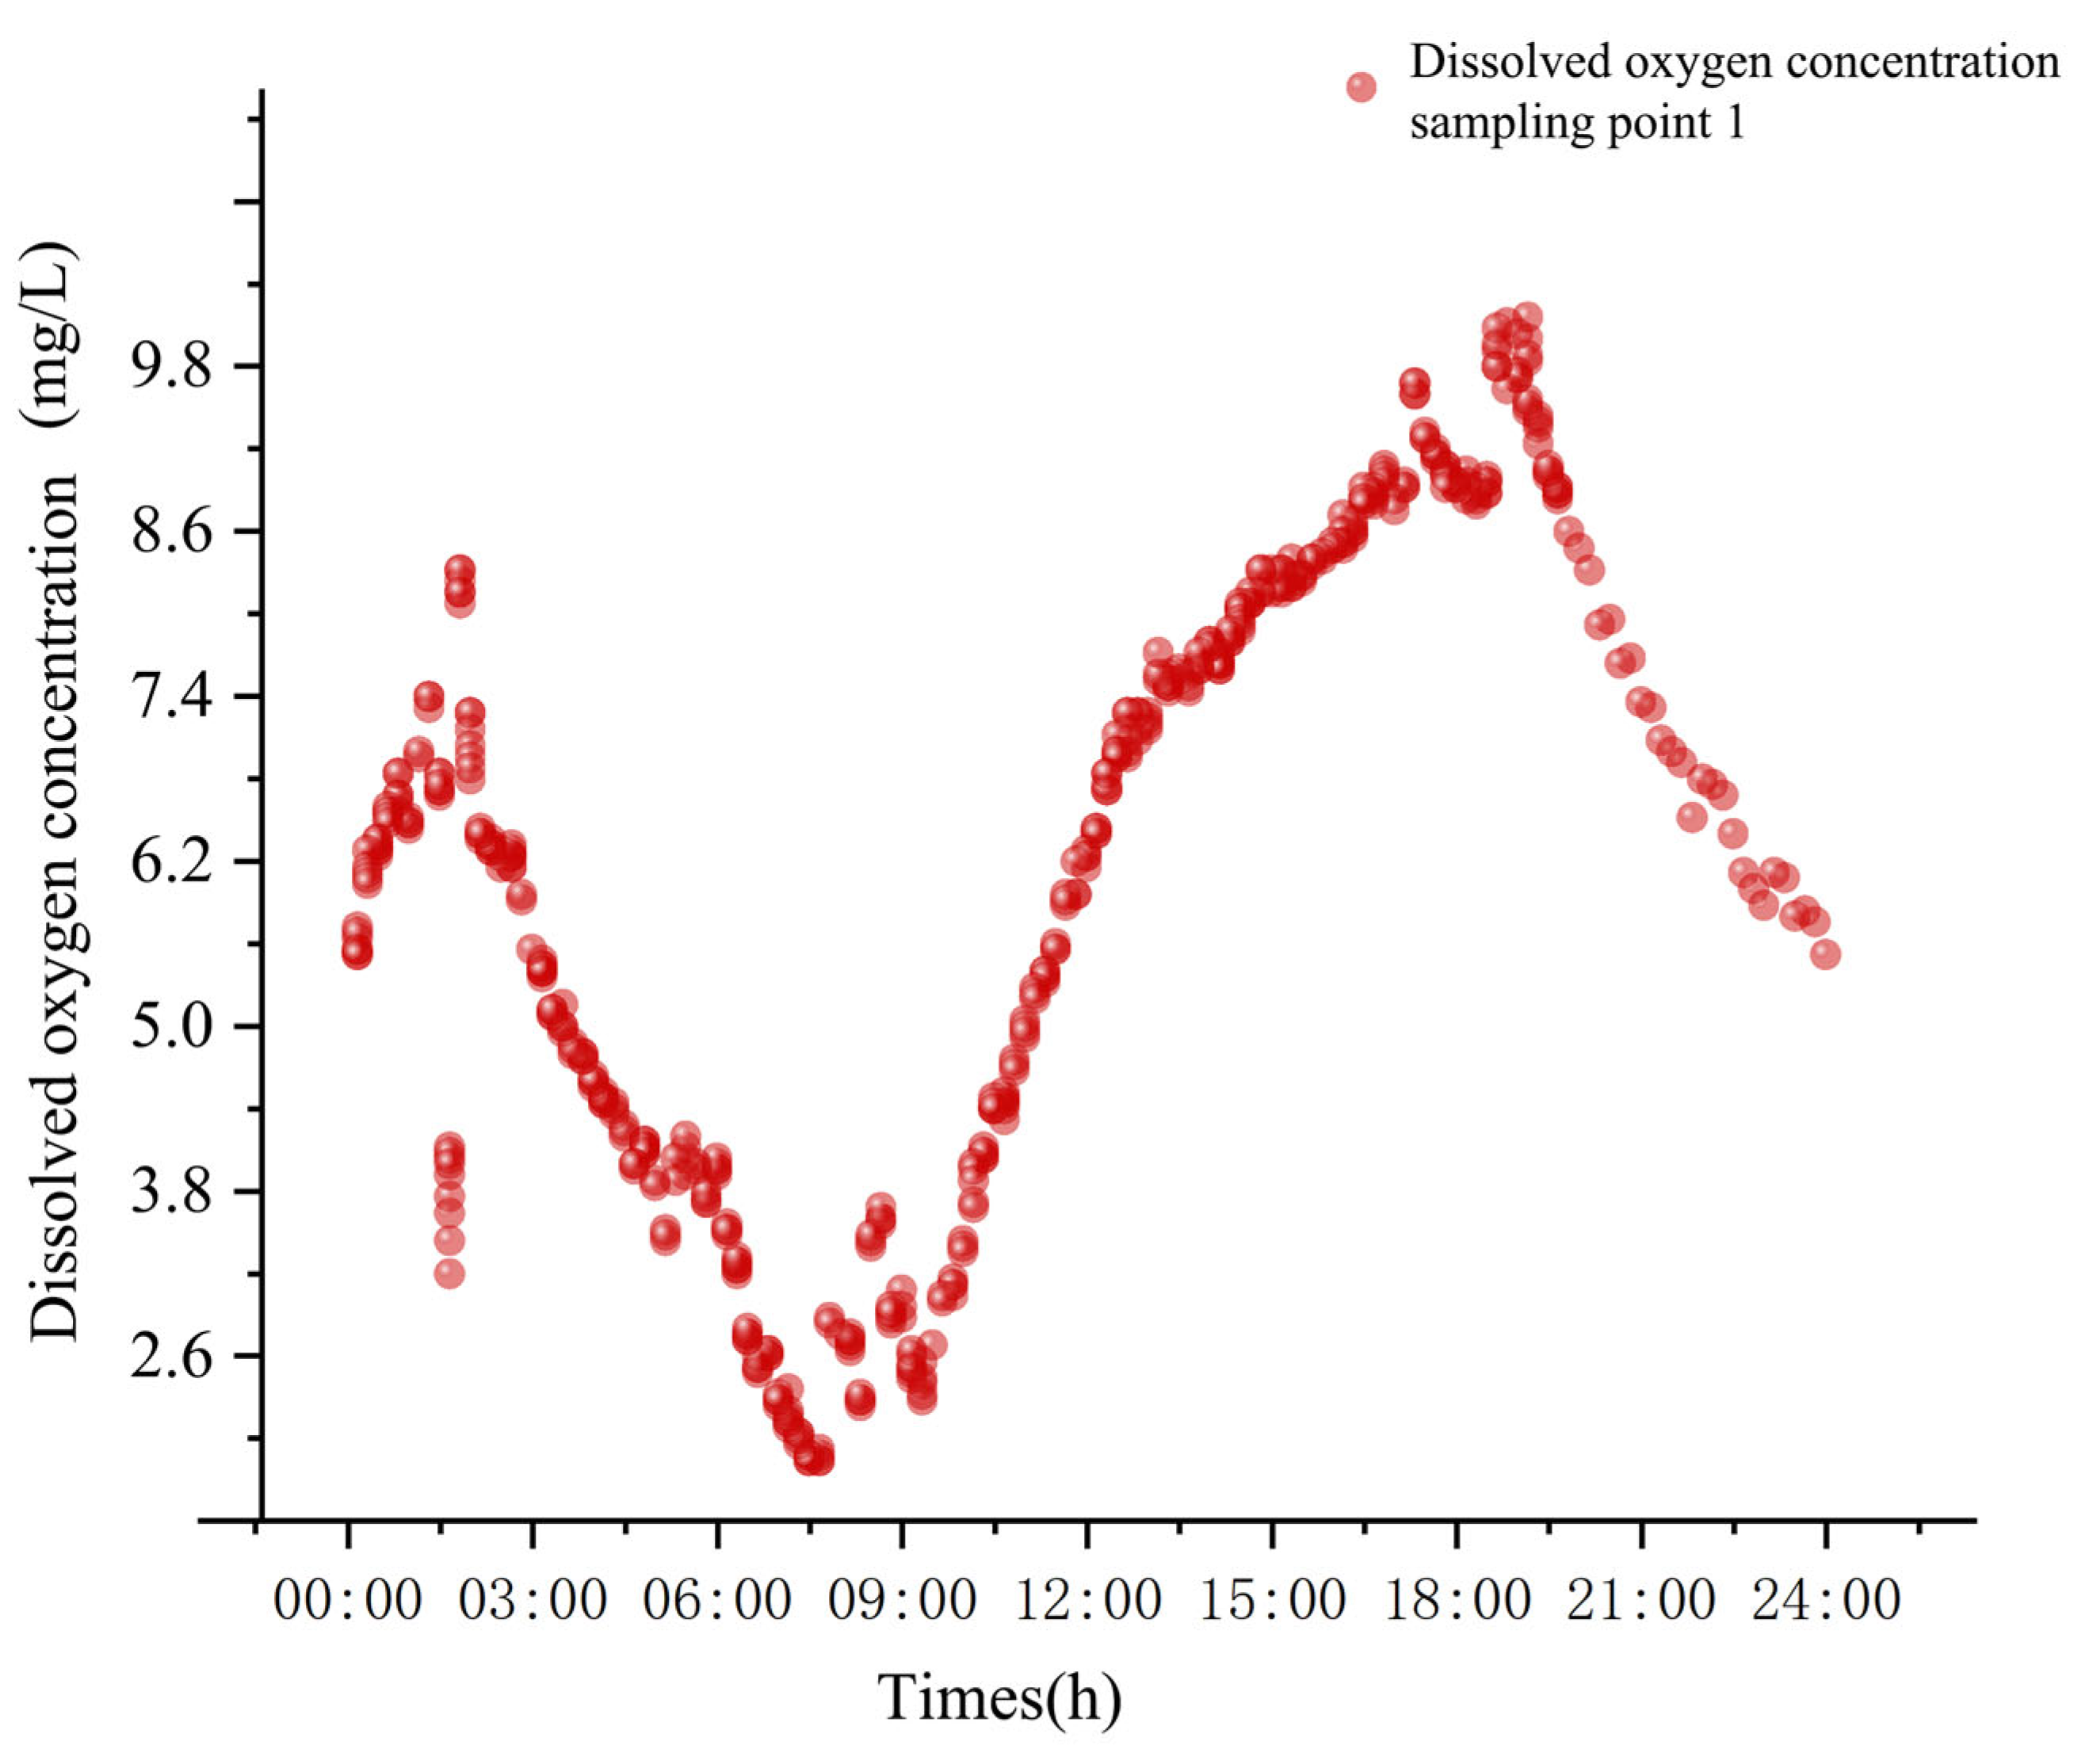
Figure 9 shows the changes in the natural DO concentration in this experimental pond for 24h. It can be found that in the daily 6:00-10:00 for the water body DO concentration of the lowest time period [
27], and the pond water DO concentration in the 24h changes in the magnitude of the more obvious, and the main reason for this change is the light intensity. Therefore, in all the experiments of this study, the opening time of the device is concentrated in the range 7:00-10:00, which can effectively reduce the interference of light intensity on the experimental results, although the experimental process does not completely ensure that all the external conditions are completely consistent, but they are controlled in a similar range, in order to be able to better validate the performance of the NPWAD.
5. Conclusions
In this study, based on the theory of oxygen mass transfer, a new type of push water aerator device (NPWAD) applicable to IPA was designed, and the oxygenation effect of the device in actual breeding ponds was experimentally demonstrated, as well as the effect of pond water mixing and the effect of directional push water was demonstrated, and the specific conclusions are as follows:
(1) The method of standard centrifugal fan selection calculation was explored, and the theoretical minimum boost () and outlet flow rate () of the fan were deduced from the actual data of the established aeration basin, and the model selection was completed based on the performance curve of the fan. Meanwhile, it is verified that the performance of the small-hole aeration component is slightly better than the average level of existing products in terms of push-water and oxygenation.
(2) The geometrical parameters of the impeller were designed empirically, the theoretical power and jet speed of the impeller water lifting component were calculated by a number of intermediate parameters, and the rigidity of the shaft was calibrated. At the same time, it was experimentally demonstrated that the power of the device is less than 1.5kW and the jet velocity meets the directional flow of the experimental pond water.
(3) The experimental results shown in
Figure 7 and
Figure 8 indicate that the small-hole aeration component can sustain the daily DO consumption of this aquaculture pond at an operating parameter of
=1520r/min, but it is unable to enhance the directional flow of the pond's water. At 1.5 metres below the surface, the aerator impact of an impeller water lifting component is minimal, but it can be more effective in the interchange of water column layers.
(4) In the orthogonal experiment of the NPWAD, the optimal operating parameters are: =1000r/min, =2280r/min, the experimental effect of the device under this parameter is as follows: DO increase =1.92mg/L, DO uniformity =95.3%, oxygen increase power efficiency =3.8 kg·(h · kW)-1, and the average surface flow rate is =190.8mm/s. Under this operating parameter, not only the DO concentration of the water was rapidly increased to maintain the growth demand of cultured fish, but also the uniformity of the water was improved more quickly in a short period of time. Therefore, it is desirable to use the combination of this operating parameter more often in the actual production, which can achieve better economic benefits.
(5) The DO concentration of the water body in the tank gradually converges with the start-up time of the device, the stratification phenomenon disappears, the DO concentration increases rapidly, the uniformity of DO or temperature of the water body in the tank increases, and the water body achieves the directional flow, which makes the water body fully mixed, which fully verifies the performance of its water pushing and oxygenation, and it can satisfy the actual aquaculture demand of the adaptive IPA system. At the same time, the new water pushing and oxygenation device has been put into field production, and the obvious improvement of the production efficiency needs to be verified by the maturity of the final fish culture.
Author Contributions
Conceptualization, K.H.(Kang He); methodology, K.H.(Kang He); software, K.H. (Kang He); validation, K.H. (Kang He) and L.H.(Lvhang He); investigation, K.H. (Kang He)and C.T. (Chengbiao Tong); resources, C.T. (Haoyu Hu); data curation, K.H. (Kang He)and L.H.(Lvhang He); writing—original draft preparation, K.H. (Kang He); writing—review and editing, C.T. (Chengbiao Tong) and L.H.(Lvhang He); visualization, K.H. (Kang He)and H.L. (Haoyu Liu); supervision, C.T. (Chengbiao Tong); project administration, C.T. (Chengbiao Tong); funding acquisition, C.T. (Chengbiao Tong). All authors have read and agreed to the published version of the manuscript.
Funding
This research was funded by the Hunan Provincial Natural Science Foundation (2020JJ4045), and the Hunan Provincial Key R&D Programme (2022NK2028).
Acknowledgments
The authors gratefully acknowledge the financial support provided by the Hunan Provincial Natural Science Foundation (2020JJ4045), and the Hunan Provincial Key R&D Programme (2022NK2028). We also appreciate the work of the editors and the reviewers of the paper. (e.g., materials used for experiments).
Conflicts of Interest
The authors declare no conflict of interest.
References
- Hu, J.C. Influence of design and operation of aeration push device on recirculating aquaculture system [D]. South China University of Technology,2018.
- Ecological engineering in pond aquaculture: a review from the whole-process perspective in China. Reviews in Aquaculture 2021, 13, 1060–1076. [CrossRef]
- Brune DE, Schwartz G, Eversole AG, Collier JA, Schwedler TE. 2003 Intensification of pond aquaculture and high rate photosynthetic systems. Aquacultural Engineering.2003.28, Pages 65-86. [CrossRef]
- Li W, Cheng X, Xie J, Wang Z, Yu D. 2019 Hydrodynamics of an in-pond raceway system with an aeration plug-flow device for application in aquaculture: an experimental study. R. Soc. open sci.6:182061. [CrossRef]
- Tien NN, Matsuhashi R, Vo, T.T.B.C. A design on sustainable hybrid energy systems by multi-objective optimization for aquaculture industry. Renewable Energy 2020. [CrossRef]
- Buentello JA, Gatlin III DM, Neill WH. Effects of water temperature and DO on daily feed consumption, feed utilization and growth of channel catfish (Ictalurus punctatus). Aquaculture, 2000. 182:339–352. [CrossRef]
- Rajesh, M., Kamalam, B.S., Sarma, D. Recirculating Aquaculture System for Intensive Fish Farming in Indian Himalayan Region: An Overview. Fisheries and Aquaculture of the Temperate Himalayas 2023.173–204. [CrossRef]
- Tanveer M, Roy SM, Vikneswaran M, Renganathan P, Balasubramanian S.Surface aeration systems for application in aquaculture: a review. International Journal of Fisheries and Aquatic Studies ,2018. 6(5):342–347.
- Roy SM, Moulick S, Mukherjee CK, Mal BC. Efect of rotational speeds of paddle wheel aerators on aeration cost. Journal of American Research Thoughts 2015. 2(1):3069–3087.
- Shoichiro Hamamoto, Takato Takemura, Kenichiro Suzuki, Taku Nishimura. Effects of pH on nano-bubble stability and transport in saturated porous media, Journal of Contaminant Hydrology, 2018. 208, Pages 61-67. [CrossRef]
- Seung Hoon Oh, Jung Guen Han, Jong-Min Kim. Long-term stability of hydrogen nanobubble fuel. Fuel, 2015. 158:399-404. [CrossRef]
- Xu, Z.M. Calculation of aeration tank air piping and blower selection[J]. Construction Technology Newsletter (Water Supply and Drainage), 1979. (01): 4-10. [CrossRef]
- Li, Z.A. Research and design of triangular blade waterwheel aerators[J]. Journal of Beijing Agricultural Engineering University,1992. 12(02):54-59.
- He, Y.P. Study on the optimal allocation of pond oxygenators [D]. Shanghai Jiao Tong University,2019.
- Ding, X.W.; Zhang, S.G.; Sun, X.C. et al. Application of water tiller to culture South American white shrimp[J]. Journal of Agricultural Engineering, 2010. 26(08):130-135.
- Peng, Y.F. Research on the effects of exercise training on swimming ability and behaviour of grass carp[D]. Chongqing Jiao tong University, 2022. [CrossRef]
- Hu, Q.S.; Liu, C., Yang, S.K. et al. Development and test of pond swinging hydrodynamic device[J]. Journal of Dalian Ocean University, 2017.32(02):224- 230. [CrossRef]
- Gu, J.; Xu, H.; Ding, J.L. et al. Comparison of aerator performance between microporous aeration and impeller aerators in ponds[J]. Journal of Agricultural Engineering,2013.29(22):212-217.
- Tchobanoglus, George; Burton, Franklin. et al. Wastewater engineering: treatment and reuse. American Water Works Association. 2003.95(5):201. Available online: https://proquest.com/scholarly-journals/wastewater-engineering-treatment-reuse/docview/221643574/se-2.
- Ryan P (2013). Novel venturi technology for the purpose of gas-liquid mass transfer (Doctoral dissertation, Cardif University).
- Cumby TR. A review of slurry aeration 3. Performance of aerators. J Agric Eng Res, 1987. 36(3):175–206. [CrossRef]
- Gourich B, El Azher N, Vial C, Soulami MB, Ziyad M, Zoulalian A. Infuence of operating conditions and design parameters on hydrodynamics and mass transfer in an emulsion loop–venturi reactor. Chem Eng Process 2007. 46(2):139–149. [CrossRef]
- Ohkawa A, Kusabiraki D, Shiokawa Y, Sakai N, Fujii M. Flow and oxygen transfer in a plunging water jet system using inclined short nozzles and performance characteristics of its system in aerobic treatment of wastewater. Biotechnol Bioeng 1986. 28(12):1845–1856. [CrossRef]
- Rosso D, Larson LE, Stenstrom MK. Aeration of large-scale municipal wastewater treatment plants: state of the art. Water Sci Technol, 2008. 57(7):973–978. [CrossRef]
- Chen, W.B.; Liu, W.C. Artificial neural network modeling of DO in reservoir. Environ Monit Assess 2014.186, 1203–1217. [CrossRef]
- Antanasijević, D.; Pocajt, V.; Povrenović, D. et al. Modelling of DO content using artificial neural networks: Danube River, North Serbia, case study. Environ Sci Pollut Res 20, 2013. 9006–9013. [CrossRef]
- Zhao S.Q.; Zhao S.Q., Gu J.B. et al. Pond aquaculture for feeding zone DO stability analysis research [J]. Journal of Chinese agricultural mechanization, 2023.44 (6):74-81. [CrossRef]
|
Disclaimer/Publisher’s Note: The statements, opinions and data contained in all publications are solely those of the individual author(s) and contributor(s) and not of MDPI and/or the editor(s). MDPI and/or the editor(s) disclaim responsibility for any injury to people or property resulting from any ideas, methods, instructions or products referred to in the content. |
© 2023 by the authors. Licensee MDPI, Basel, Switzerland. This article is an open access article distributed under the terms and conditions of the Creative Commons Attribution (CC BY) license (http://creativecommons.org/licenses/by/4.0/).
