Submitted:
04 December 2023
Posted:
05 December 2023
You are already at the latest version
Abstract
The utilization of titanium dioxide (TiO2) as a photocatalyst for the treatment of wastewater has attracted significant attention in the environmental field. Herein, we have prepared a NH2-MIL-125-derived TiO2@N-doped C Visible Light Catalyst through an in-situ calcination method. The nitrogen element in the organic connector is released through calcination, simul-taneously doping into the sample, thereby enhancing its spectral response to cover the visible region. The as-prepared TiO2@N-doped C catalyst exhibited preserved cage structure even after calcination, thereby alleviating the optical shielding effect and further augmenting its photo-catalytic performance by increasing the reaction sites between the catalyst and pollutants. The calcination time of the TiO2@N-doped C-450 °C catalyst was optimized to achieve a balance be-tween the TiO2 content and nitrogen doping level, ensuring efficient degradation rates for basic fuchsin (99.7%), Rhodamine B (89.9%), and tetracycline hydrochloride (93%) within 90 minutes.
Keywords:
Titanium dioxide
; NH2-MIL-125
; N/TiO2@C
; Visible light photocatalysis
; Wastewater Pollutants
1. Introduction
The 21st century is all about global economic development, but there are some problems that we cannot ignore. One of the common concerns is how to maintain or even improve the quality of water. According to the reports of United Nations Educational, Scientific and Cultural Organization in the World 2021 Water Resources Development Report, as our society continues to grow, we are using more and more fresh water in industry, agriculture, and urban life. Since 1980, its usage has been increasing by approximately 1% every year, which exacerbates the issue of water pollution [1]. Around 80% of wastewater is being discharged into the environment without any treatment. This leads to water pollution that causes approximately 2 million deaths worldwide annually and leaves many others suffering from chronic diseases [2]. Therefore, it is crucial for us to consider how we can upgrade our existing methods of treating water in order to meet the growing demand for wastewater disposal.
The composition of wastewater usually includes organic dye pollution and antibiotic pollution, which are typical troublemakers [3]. Organic dye pollution is mainly caused by industries such as textiles, cosmetics, food, and paper. It has a strong color, high toxicity to living things, exhibits excellent resistance to oxidation, and is tough to break down naturally. All these factors make it a big threat to our ecosystem [4,5]. Basic fuchsin and Rhodamine B are representative organic dyes. The molecular formula of basic fuchsin is C20H20ClN3. Long-term exposure to basic fuchsin can cause skin cells to become cancerous because its carcinogenic triphenylmethane structure makes it a cationic dye, which is more toxic than anionic dyes. Rhodamine B, with a molecular formula of C28H31ClN2O3, is an alkaline industrial dye that poses direct harm to human health. It belongs to the third class of carcinogens in the list published by the International Agency for Research on Cancer of the World Health Organization (WHO). Antibiotic contamination usually originates from livestock and pharmaceutical industries [6]. It is difficult for animals and humans to fully absorb or transform tetracycline hydrochloride, resulting in over 50% of it being excreted through feces and urine into the environment. As a result, tetracycline hydrochloride can be detected in surface water, groundwater, sediment, soil, and even drinking water. This is the main reason for the increase in bacterial resistance among humans. The growing drug resistance will lead to higher healthcare costs and make diseases more challenging to treat. Therefore, the degradation of basic fuchsin, Rhodamine B, and tetracycline hydrochloride will be studied in the following experiments.
Currently, various technologies are being widely studied to address the challenge of water pollution, including biological methods, adsorption methods, membrane separation, and photocatalysis. The biological method decomposes pollutants through the adsorption capacity and metabolic processes of bacteria, fungi, yeast, actinomycetes, algae, and other microorganisms. This degradation process is simple and stable but requires strict environmental conditions. If researchers operate improperly or without cautionary measures in place, it can easily lead to secondary pollution; therefore, implementing this method on a large scale is not practical [7]. The adsorption method involves the use of physicochemical interactions between the adsorbent material and the pollutant, resulting in the adsorption of pollutants onto the material. Hani et al. reported the processing of MOF via three-dimensional (3D) printing of cellulose-MOFs as adsorbents and catalysts for water treatment, and the materials offered complete (>99%) removal of organic dyes within 10 min toward anionic dyes e.g., methyl blue (MeB). The reaction conditions are mild, fast and the adsorbent materials can be reused. However, changes in reaction conditions make it easier for them to be released again [8]. Membrane separation is a novel technology that utilizes selective permeation of membranes to separate pollutants from wastewater, including reverse osmosis, microfiltration, ultrafiltration, nanofiltration, and other specific methods. It offers simple and pollution-free operation. However, when the membrane becomes blocked by pollutants, restoring it to its original state using existing cleaning technologies can be challenging. As a result, the treatment efficiency of the membrane continuously decreases and reusing it becomes difficult. In practical applications, membrane separation is often combined with other techniques to enhance utilization[9]. Therefore, photocatalysis, which uses solar excitation to produce strong oxidizing substances, is an effective and promising means for purifying phenolic water. The photocatalytic performance of TiO2 is affected by the large band gap (3.2eV of anatase), which can only absorb ultraviolet light accounting for about 5% of the solar spectrum [10,11,12]. In addition, the rapid recombination of photogenerated electron-hole pairs in the catalytic process also reduces the photoutilization rate of TiO2, resulting in a decrease in the degradation efficiency of organic pollutants [7].
Anatase TiO2 belongs to the tetragonal system. The octahedral unit TiO62- has four edges. The band gap of anatase TiO2 is 3.2 eV, which is higher than that of rutile TiO2 (3.0 eV). Although this means that anatase TiO2 has a narrower range of light absorption, the difference in conduction band and valence band positions gives the electron-hole pair of anatase TiO2 a greater positive or negative potential, thus possessing stronger oxidation capacity. After performing theoretical calculations, Georg et al. [13] demonstrated that the surface of anatase TiO2 demonstrates a high adsorption capacity for H2O, O2 and OH-, leading to increased production of active free radicals during catalytic reactions and enhanced photocatalytic activity. During the crystallization process, anatase TiO2 tends to form small-sized particles with a large specific surface area[14], which is also beneficial for the photocatalytic reaction [15].
MOF is materials that consist of a self-assembled metal-organic skeleton formed by clusters of metal ions and organic ligands [16]. NH2-MIL-125 is a type of MOF, which has a large specific surface area and pore volume, and it can facilitate transmission and diffusion and expose as many active sites as possible [17]. The porous structure of NH2-MIL-125 allows for a shorter distance for charge-carrier transfer, effectively separating photogenerated electron pairs [18]. Furthermore, the large interconnected 3D open cavities in NH2-MIL-125 facilitate easy penetration of light, effectively reducing light shielding [19]. The catalyst prepared using NH2-MIL-125 as the template combines TiO2 with a carbon matrix, which not only maintains the morphological advantage of MOF but also limits the aggregation of TiO2 nanocrystals and improves the electrical conductivity of the TiO2@C composite [20,21,22,23,24].
In this work, NH2-MIL-125 was used as a template to synthesize TiO2@N-doped C composite catalyst with high photocatalytic efficiency by calcination. TiO2 grew in situ with titanium elements in NH2-MIL-125 as the core, while the carbon skeleton of NH2-MIL-125 as a template still existed after calcination. The structure of N/ TiO2@C catalytic materials was characterized by XRD, SEM, TEM, XPS and other testing methods. Meanwhile, the natural and photocatalytic properties of TiO2@N-doped C composites were evaluated.
2. Materials and Methods
2.1. Materials
2-amino-terephthalic acid (99%) was bought from Beijing Bailingwei Technology Co. LTD. Dimethylformamide (99.9%) was bought from Aladdin Chemical Co. LTD. Methanol (99.9%) was bought from Jinan Century Tongda Co. LTD. Isopropyl titanate (95%) were obtained from Syntechem Co., Ltd.
2.2. Preparation of NH2-MIL-125
NH2-MIL-125 was prepared through hydrothermal reaction. 1 g 2-amino-terephthalic acid was added to a mixture of 18 mL dimethylformamide and 2 mL methanol. The mixture was stirred and subjected to ultrasonication for 5 minutes, followed by the addition of 1.2 mL isopropyl titanate. After stirring and ultrasonication for 5 minutes, it was transferred to a Teflon autoclave with a volume capacity of 50 mL for heat treatment at 150 °C for 15 hours. The resulting yellow powder was collected, centrifuged, washed three times each with dimethylformamide/ethanol, and subsequently dried under vacuum conditions at 50 °C for 20 hours.
2.3. Preparation of TiO2@N-Doped C Nanomaterials
Nitrogen doped TiO2@C was prepared by one step pyrolysis method. A porcelain boat contained 500 mg NH2-MIL-125 powder was positioned at the center of a high temperature tubular furnace for air-based heat treatment. The tubular furnace operated with a heating rate set to 2 °C·min−1 within a target temperature range spanning from 200 °C -550 °C, while maintaining the desired temperature for two hours. Following completion of the reaction, we retrieved the resulting powder.
2.4. Characterization
Chemical groups within samples were investigated by Nicolet IS 20 FTIR spectrometer (Thermo Fisher, USA) in the range of 4000-500 cm-1. The X-ray diffraction (XRD) of samples were conducted with an X-ray diffractometer (D8 Advance Bruker, Germany). The morphology structure of cryogels were observed by a JSM-IT500HR scanning electron microscope (SEM) and a transmission electron microscope (TEM) (JEM-2100, JEOL). The Brunauer-Emmett-Teller (BET) surface area and pore size were tested by nitrogen adsorption and desorption at 77K by an ASAP automated micromeritics system. Elemental composition of samples was measured by X-ray photoelectron spectroscopy (PHI QUANTERA II, Ulvac-Phi, Japan). Thermogravimetric analysis (TGA, METTLER TOLEDO TGA/SDTA851) was carried out at a constant heating rate of 10 °C min−1 from 50 °C to 700 °C under nitrogen atmosphere. The optical performance of the samples was conducted on a UV-3600 spectrophotometer (Shimadzu). The electrochemical tests including the electrochemical impedance (EIS), transient photocurrent, and Mott-Schottky (M-S) were pictured by an electrochemical workstation (RST5200F, Restile). The response of hydroxyl radicals was tested by an electron paramagnetic resonance (EPR) spectrometer (EMXPLUS, Bruker). The electrochemical tests including the electrochemical impedance (EIS), transient photocurrent, and Mott-Schottky (M-S) were pictured by an electrochemical workstation (RST5200F, Restile). The response of hydroxyl radicals was tested by an electron paramagnetic resonance (EPR) spectrometer (EMXPLUS, Bruker). The content of C, N, H in the resultant cellulose samples were determined by a Eurovector EA 3000 elemental analyzer in CHN mode.
2.5. Photocatalytic Performance Measurements
Visible light irradiation (more than 400 nm) degraded the basic fuchsin, Rhodamine B and tetracycline hydrochloride, and the photocatalytic properties of various catalysts were studied. All photocatalytic experiments were repeated three times. A 300 W xenon lamp with a filter was used to simulate AM 1.5G lighting (100 mW/cm2) as a light source. The circulating water flow in the reactor ensures that the photocatalytic reaction takes place at room temperature. During the degradation process, each photocatalyst was separately dispersed into 30 mL of basic fuchsin, Rhodamine B, and tetracycline hydrochloride at a concentration of 15 mg/L. The mixture was subsequently stirred in darkness for 60 minutes to achieve adsorption-desorption equilibrium. During irradiation, the samples were regularly extracted and filtered using a 0.45 μm PTFE needle filter. The resulting solution was measured for absorbance at wavelengths of 546 nm, 554 nm, and 370 nm utilizing an ultraviolet-visible spectrophotometer. After degradation, the catalyst underwent recovery through filtration before being washed with deionized water and ethanol. Subsequently, it was dried under vacuum conditions at a temperature of 60 °C for twenty hours. Finally, the treated catalyst could undergo multiple tests to evaluate its stability.
3. Results
3.1. Synthesis and Characterization of TiO2@N-Doped C
The overall fabrication of the TiO2@N-doped C composite is schematically illustrated in Figure 1a. In order to explore the crystal structure of the sample prepared in the experiment, X-ray Diffraction (XRD) tests were first conducted. NH2-MIL-125 samples show typical diffraction peaks at 6.67°, 9.62°, 11.48°, 14.90°, 16.50°, 17.89° and 19.42°. The outcomes indicated that the synthesis of NH2-MIL-125 was successful and that the produced MOF exhibited acceptable crystallinity. TiO2@N-doped C-450°C was obtained by calcination of NH2-MIL-125, and the characteristic peak of NH2-MIL-125 totally vanished during the process. The XRD pattern of TiO2@N-doped C-450 °C was compared with the standard diffraction card of acanite TiO2 (JCPDSNo.21−1272). It was found that peaks of 25.06°, 38.10°, 47.89°, 53.70° and 61.46° correspond to the (101), (004), (200), (105) and (204) planes of anatase, respectively. The results show that pyrolysis of NH2-MIL-125 to produce anatase TiO2 is successful. In addition, XRD characterization of TiO2@N-doped C is significantly different with different calcination temperatures (Figure 1b,c). The calcination temperature of TiO2@N-doped C-250 °C is too low, which causes insufficient pyrolysis. The characteristic peaks of NH2-MIL-125 can still be seen at 6.63°, 9.65° and 11.64°, but the peak intensity is reduced significantly. This may be due to the partial disintegration and recombination of the NH2-MIL-125 structure. When the temperature of the calcination reaches 350 °C, only a carbon sheath peak at 13.19° and no TiO2 related peak pattern are visible, indicating that the NH2-MIL-125 structure is totally broken down. TiO2 has not yet formed crystals, and the carbon element that was liberated during the calcination has been doped into the compound. The distinctive peak of anatase TiO2 is clearly seen when the temperature hits 450 °C. Following that, the intensity of the anatase TiO2 characteristic peak no longer varies considerably with the rise in calcination temperature, but the crystallinity of TiO2 is more excellent.
From SEM images, the prepared NH2-MIL-125 showed circular flake shape with an average diameter of about 422 nm (Figure 1d). In TiO2@N-doped C-450 °C, the thickness of TiO2 like circular tablets is about 50 nm and the diameter is about 140 nm. The sample has a thickness of around 60 nm and a diameter of about 370 nm at TiO2@N-doped C-350 °C. The sample has a thickness of around 70 nm and a diameter of about 450 nm at TiO2@N-doped C-250 °C. It follows that it is evident that as the calcination temperature rises, the average particle size of the sample particles shrinks to some extent while maintaining its round pill shape. This might be because as the calcination temperature rises, the network structure of NH2-MIL-125 gradually loses its capacity to crystallize and the organic molecules in the skeleton break down.
The shape and crystal structure of TiO2@N-doped C-450 °C composites were obtained by TEM. The observation of amorphous carbon shows that a large amount of TiO2 is distributed in the carbon matrix, and finally forms TiO2@C composite. The sample obtained after calcination still maintains a porous structure, as seen by the presence of TiO2 nanoparticles and pores (Figure 1e,f). This porous construction can increase the photocatalytic efficiency by exposing as many active sites as feasible while also facilitating the transmission and diffusion of electrons during catalysis. In the adsorption experiment, more investigation into porous structure will be done at N/ TiO2@C-450 °C, on which a lattice spacing of 0.351 nm was found, compatible with the lattice spacing of the crystal planes of anatase TiO2 (101) (Figure 1g). From TEM observation, the diameter of the TiO2@N-doped C-450 °C is approximately 289 nm (Figure 1g). At TiO2@N-doped C-450 °C, a lattice spacing of 0.351 nm was found, which was compatible with the lattice spacing of the crystal planes of anatase TiO2 (101) (Figure 1h). Titanium, oxygen, carbon, and nitrogen are all further confirmed by the element mapping (Figure 2i,j). It is evident that at TiO2@N-doped C-450 °C, the distribution of element titanium, oxygen, carbon, and nitrogen is quite uniform. It can be argued that during calcination, the nitrogen element contained in the organic ligand 2-amino-terephtharic acid is released and then doped into the sample, while the titanium element in NH2-MIL-125 is grown in situ to form TiO2, which is uniformly dispersed in the porous carbon skeleton, and ultimately the nitrogen-doped TiO2@C is successfully formed.
Figure 1.
Schematic diagram and characterization of the TiO2@N-doped C composite. (a) Fabrication of TiO2@N-doped C composite. (b,c) NH2-MIL-125 and TiO2@N-doped C composites with calcination temperature of 250 °C,350 °C,450 °C and 550 °C. (d) SEM images of NH2-MIL-125 and TiO2@N-doped C composites with calcination temperature of 250 °C,350 °C,450 °C and 550 °C. (e,f) and (g) TEM images of TiO2@N-doped C-450 °C. (h) Electron diffraction image of TiO2@N-doped C-450 °C. (i,j) The element mapping of TiO2@N-doped C-450 °C.
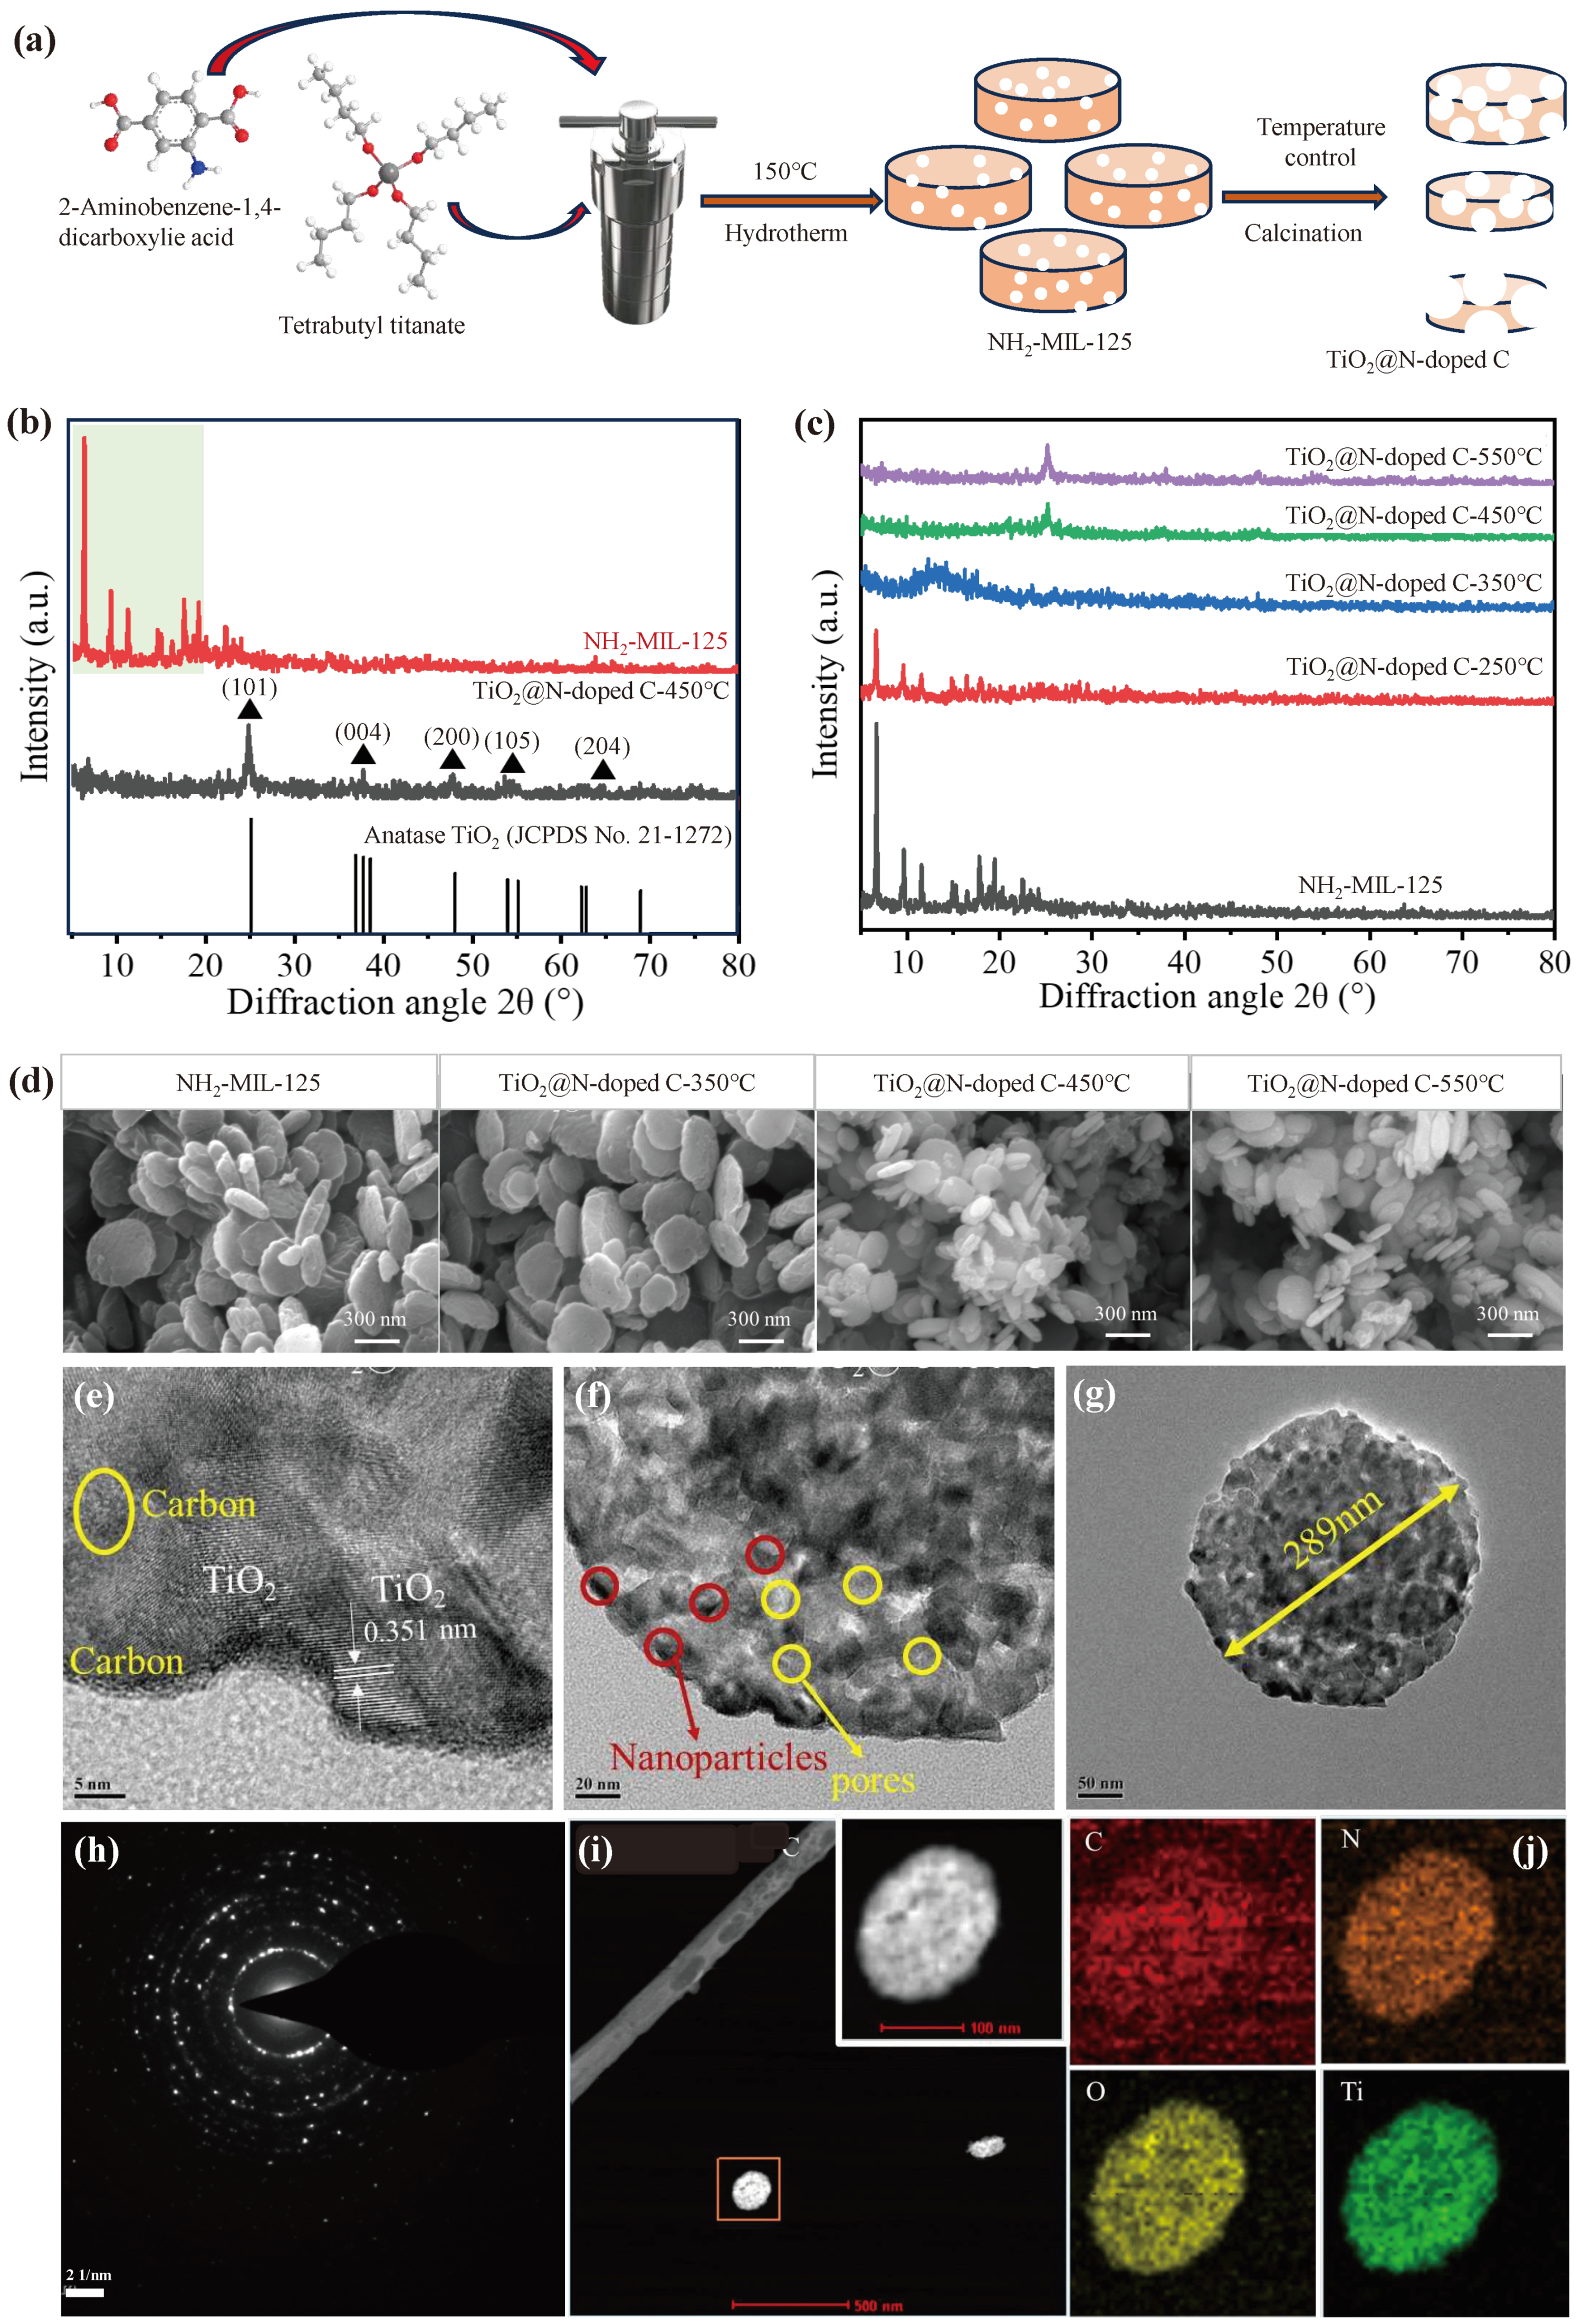
Figure 2.
Chemical characterization of the TiO2@N-doped C composites. (a,b) The survey XPS spectra of NH2-MIL-125, TiO2@N-doped C-250 °C, TiO2@N-doped C-350 °C, TiO2@N-doped C-450 °C and TiO2@N-doped C-550 °C. The high-resolution XPS spectra of (c) O 1s, (d) N 1s, (e) C 1s and (f) Ti 2p of TiO2@N-doped C-450 °C. (g) N2 adsorption-desorption isotherms of TiO2@N-doped C-450 °C. (h) pore size distributions of TiO2@N-doped C-450 °C. (i) Thermogravimetric curve of NH2-MIL-125.
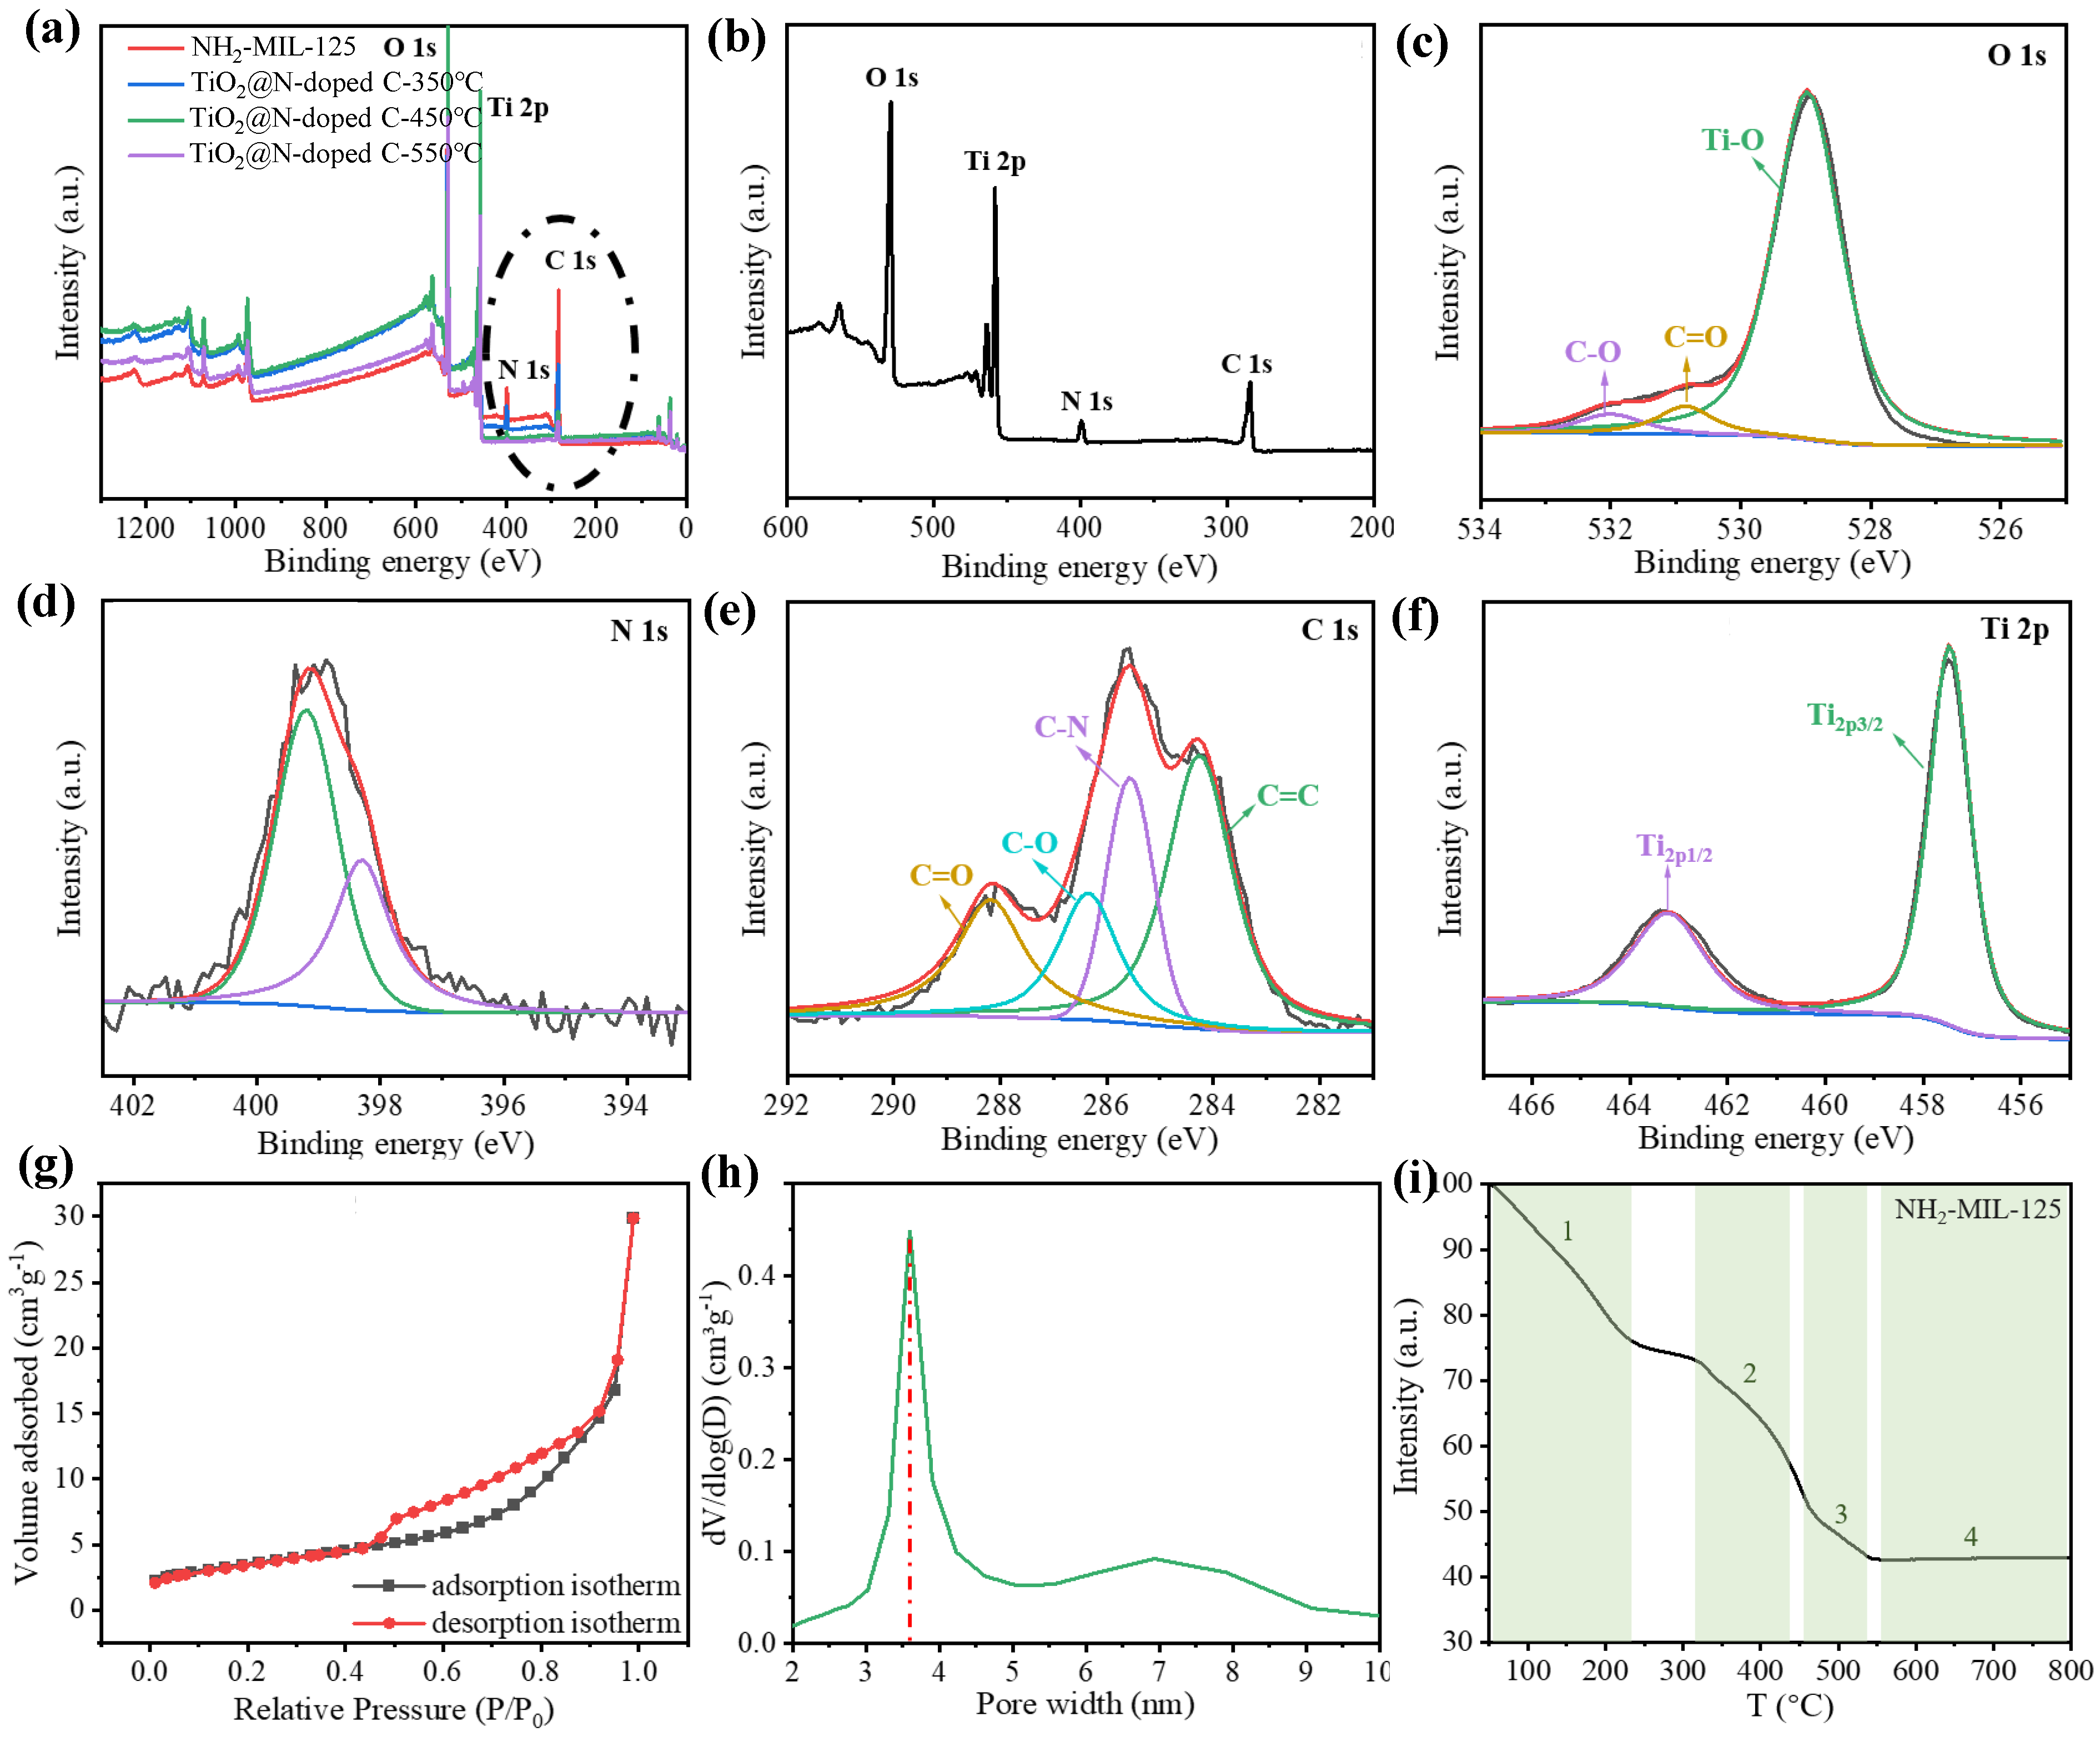
The elemental composition and valence information of TiO2@N-doped C were subsequently examined using X-ray photoelectron spectroscopy (XPS), which was utilized to test the material composition (Figure 2a,b). When the temperature is too high, all the nitrogen will be released and no longer doped into the TiO2@C composite, and the peaks value of carbon and nitrogen will decrease with the increase of calcination temperature. When the temperature reaches 550 °C, the peak of nitrogen is close to zero. However, the proper calcination temperature is crucial, as XRD pattern analysis has shown that anatase TiO2 is difficult to produce or has poor crystallinity at too low temperatures. The calcination temperature of 450 °C can be used as the equilibrium temperature between nitrogen doping and TiO2 crystallinity. Three peaks at 532.0 eV, 530.9 eV, and 528.9 eV, which are associated with the C-O bond, C=O bond, and Ti-O bond, respectively, can be seen in the XPS spectra of O 1s (Figure 2c). The surface hydroxyl oxygen, which is essential for the photodegradation of contaminants, is responsible for the development of the C-O bond. To fight contaminants, the hydroxyl radical OH• can be created when it interacts with photogenic holes. N 1s (Figure 2d) displayed a broad peak between 398.4 and 399.4 eV. It is consistent with other results and typical Ti-N structures in nitrogen-doped TiO2 [25]. And the C=C peak (Figure 2e) at 288.2 eV, 286.4 eV, 285.6 eV, and 284.2 eV correspond to C=O, C-O, C-N, and C=C, respectively. For pure anatase TiO2, Ti-O peaks is located at 458.5 eV, 464.5 eV. The Ti 2p peak at N/TiO2@C-450 °C is 457.5 eV, 463.5 eV, which is a 6.0 eV energy splitting. The peaks of Ti 2p showed in Fig. 2f centered at about 463.2 eV and 457.5 eV belonged to Ti 2p3/2 and Ti 2p1/2, respectively, which confirmed the Ti4+ species in the form of TiO2 nanoparticles. The Ti 2p peak at TiO2@N-doped C-450 °C is slightly moved to a lower binding energy when compared to pure anatase TiO2, which is brought on by nitrogen doping altering the local chemical environment of titanium ions. The successful doping of nitrogen into TiO2@C, as shown by the test findings from XPS, has positive implications for reducing the band gap width of TiO2 and increasing its visible light activity. We also test the relative amount of C, N in the sample by elemental analyzer. The content of nitrogen decreases with the increase of heat treatment temperature. A as high as 0.12% N/C ratio is obtained under heat treatment of 450 °C.
The nitrogen adsorption-desorption isotherm samples at TiO2@N-doped C-450 °C (Figure 2g) exhibit the conventional type IV isotherm and type H3 hysteresis loop. The pore size distribution was calculated using the nonlocal density function model (NLDFT) based on data from N2 adsorption (Figure 2h). TiO2@N-doped C-450 °C has a specific surface area of 63 m2/g, which is significantly less than that of NH2-MIL-125 but still significantly larger than that of other TiO2 catalysts. Therefore, basic fuchsin, rhodamine B, and tetracycline hydrochloride can be degraded at more active sites thanks to the large specific surface area of TiO2@N-doped C-450 °C.
BET data need to be interpreted in combination with thermogravimetric curves (Figure 2g,h). The specific surface area of the samples decreases and the average pore size increases with increasing roasting temperature, but for different reasons. The sample changes at about 200 °C as a result of the elimination of any remaining solvent. When the temperature reaches 350 °C, the porous structure collapses and the crystal skeleton begins to disintegrate, greatly reducing the specific surface area. The decomposition of the crystal skeleton and the collapse of the porous structure make the specific surface area decrease sharply. When the calcination temperature was further increased to 450 °C, the BET data changed due to the recrystallization of TiO2 and the formation of pyrolytic carbon substrates. However, the skeleton shrank significantly once more at 550 °C, and the specific surface area dropped to 13 m2/g, making it difficult for contaminants and the catalyst to make contact. Therefore, by adjusting the calcination temperature, the TiO2@N-doped C catalyst with the best photocatalytic effect was created at 450 °C.

Table 1.
Textural Characteristics of NH2-MIL-125, TiO2@N-doped C-200°C, TiO2@N-doped C-350°C, TiO2@N-doped C-450°C and TiO2@N-doped C-550°C.
Table 1.
Textural Characteristics of NH2-MIL-125, TiO2@N-doped C-200°C, TiO2@N-doped C-350°C, TiO2@N-doped C-450°C and TiO2@N-doped C-550°C.
| Sample | SBET (m2g-1) |
Vtotal (cm3g-1) |
Average Pore Diameter (nm) |
|---|---|---|---|
| NH2-MIL-125 | 539 | 0.087 | 5.32 |
| TiO2@N-doped C-200 °C | 763 | 0.168 | 6.54 |
| TiO2@N-doped C-350 °C | 89 | 0.157 | 9.30 |
| TiO2@N-doped C-450 °C | 63 | 0.141 | 10.89 |
| TiO2@N-doped C-550 °C | 13 | 0.046 | 12.26 |
3.2. Photocatalytic Degradation of TiO2@N-Doped C
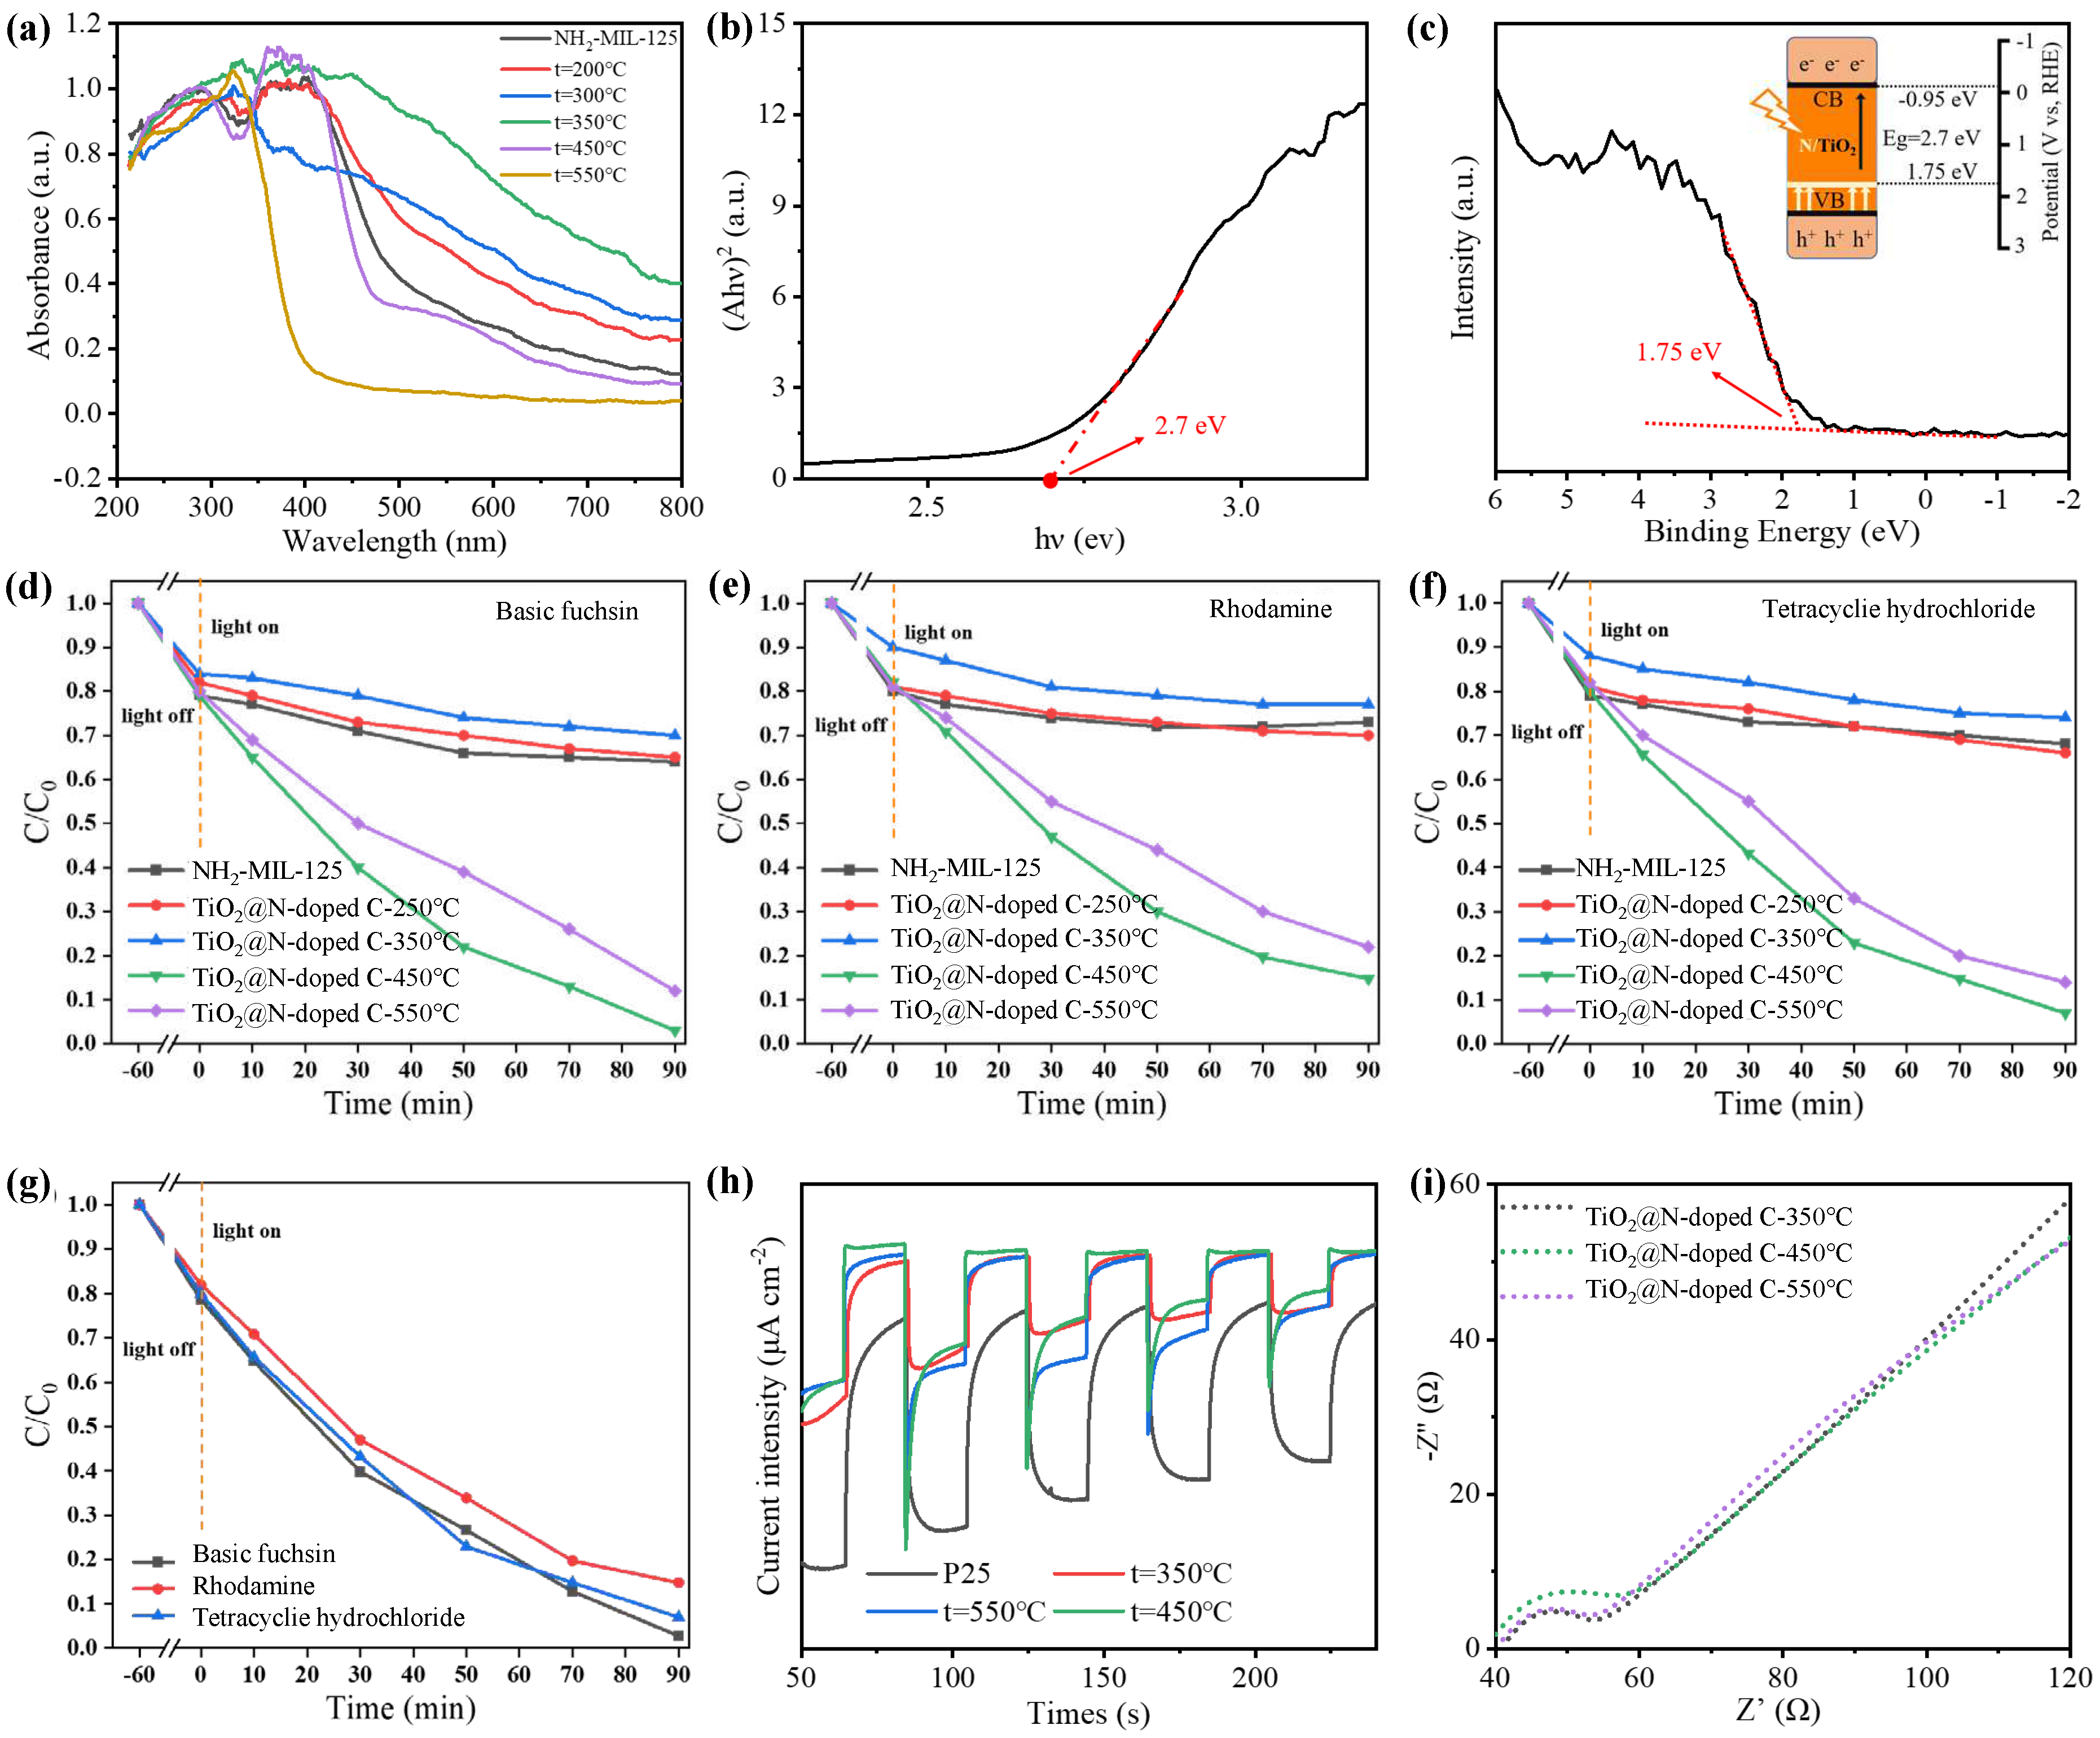
The light absorption capacity of TiO2@N-doped C composites was investigated by UV-Vis absorption test (Figure 3a). NH2-MIL-125 is yellow, as was already described. The sample's color continues to deepen as the calcination temperature rises due to the breakdown of the crystal skeleton and collapse of the porous structure. The sample's hue changes to brown at 350 °C, when it exhibits the best ability to absorb visible light. As the calcination temperature increases after 350 °C, TiO2 crystals start to form and the sample's color lightens. The sample is nearly white at 550 °C, and visible light can no longer be absorbed. We know that P25, the white commercial grade TiO2, has poor absorption capabilities for visible light. The optimal catalyst for the best visible light absorption performance at 400-800 nm should be TiO2@N-doped C-350 °C. However, the photocatalytic activity of TiO2@N-doped C-350 °C is subpar due to the absence of TiO2 crystal. The most acceptable visible light catalyst, according to a thorough comparison between the sample's photoabsorption capacity and TiO2 content, is TiO2@N-doped C-450 °C.
Compared with P25, the as-prepared TiO2@N-doped C-450 °C sample has a wider absorption range, which is because nitrogen in the organic connector is released and doped into the sample during calcination, which reduces the wide band gap of TiO2, and causes the light absorption range to shift to the visible region. The prohibited band spectra (Figure 3b) and valence band spectra (Figure 3c) of TiO2@N-doped C-450 °C can be used to compute the energies of the valence band, conduction band, and band gap, which are -0.95 eV, 1.75 eV, and 2.7 eV, respectively. The TiO2@N-doped C0-450 °C band gap created in this work is narrower than that of anatase TiO2, which has a band gap energy of 3.22 eV, making it more suitable for light absorption and photocatalytic processes.
Under xenon lamp illumination, the photocatalytic activity of TiO2@N-doped C composites were assessed using dealkalized fuchsin, Rhodamine B, and tetracycline hydrochloride. These three contaminants all degrade in a very similar way. Only NH2-MIL-125 is capable of decomposing basic fuchsin (Figure 3d), lowering the pollutant concentration to 65%. This is because NH2-MIL-125 can carry out a certain amount of physical adsorption due to its large specific surface area and micropore structure. The capability for deterioration varies significantly amongst TiO2@N-doped C samples. At 350 °C, TiO2@N-doped C exhibited the lowest degradation ability compared to other catalysts. TiO2@N-doped C-350 °C showed the worst degradation ability, and 70% of basic fuchsin remained in the solution after degradation, even less than NH2-MIL-125 adsorption effect. This is mainly due to two reasons: firstly, TiO2 does not form at this temperature and prevents photocatalytic reactions; secondly, at 350 °C NH2-MIL-125 undergoes significant pyrolysis that rapidly changes its skeletal structure and reduces specific surface area sharply. Moreover, there is an overall increase in pore size resulting in mesoporous pores and causing a decline in its adsorption effectiveness. The degradation of 99.7% of basic fuchsin at TiO2@N-doped C-450 °C was the highest among all samples within 90 minutes. Although the anatase TiO2 obtained by heat treatment at 550°C has the highest content and the best crystal form, implying the most superior photocatalytic effect. While, the above characterization results indicated that reducing nitrogen content at TiO2@N-doped C-550 °C decreases the utilization efficiency of visible light. Consequently, the degradation efficiency of basic fuchsin is not as good as that achieved with TiO2@N-doped C-450 °C.
The degradation of Rhodamine B and tetracycline hydrochloride exhibited similar trends in the above samples (Figure 3e,f). NH2-MIL-125 achieved a 73% reduction in the content of Rhodamine B through physical adsorption. Among the tested catalysts, TiO2@N-doped C-350 °C demonstrated the lowest degradation efficiency with only 23% of pollutants being degraded, while TiO2@N-doped C-450 °C exhibited the highest degradation effect by degrading 89.9% of Rhodamine B within 90 minutes. Physical adsorption by NH2-MIL-125 resulted in a decrease in the content of tetracycline hydrochloride to 68%. Similarly, TiO2@N-doped C-350 °C showed inferior performance with only a 26% degradation rate for pollutants, whereas TiO2@N-doped C-450 °C displayed superior degradation capability by achieving a remarkable removal rate of 93% for tetracycline hydrochloride within the same time frame (Figure 3g). In Table 2, we summarize the recent works on the degradation performance of TiO2 composites against tetracycline. In comparison, our materials show an outstanding catalytic property.
Under xenon lamp irradiation, we use photocurrent test to investigate the phenomenon of photogenerated carrier transport in samples. The photocurrent intensity of all TiO2@N-doped C samples is relatively high, indicating a slow photogenerated carrier recombination rate (Figure 3h). This is mainly because titanium dioxide is combined with the carbon matrix, the porous structure of the carbon skeleton shorters the carrier transfer distance, so that the photogenerated electron pairs can be effectively separated. In addition, the large specific surface area of the carbon skeleton exposes more active sites, making the carrier transmission and diffusion more convenient. In short, the combination of carbon skeleton and TiO2 enhances the photocurrent intensity of the composite compared with commercial grade titanium dioxide P25. It is well known that the higher the photocurrent density, the better the ability to separate photogenerated electrons and holes. Therefore, compared with P25, TiO2@N-doped C improves the carrier separation efficiency and inhibits the photogenerated carrier recombination. To confirm this, we further studied the resistance of interfacial charge conversion by electrochemical impedance spectroscopy. As shown in Figure 3i, the radii of all TiO2@N-doped C composites are small, indicating that the TiO2@N-doped C catalyst has higher interfacial charge separation efficiency and better electrical conductivity, which is similar to the trend of photocurrent response test results
In summary, the optimal balance between anatase TiO2 formation and nitrogen doping is achieved when the calcination temperature reaches 450 °C, and TiO2@N-doped C-450 °C exhibits the highest photocatalytic capacity.
Figure 3.
(a) DRS spectra of TiO2@N-doped C with calcination temperature for 200 °C, 300 °C, 350 °C, 450 °C, 550 °C and NH2-MIL-125. (b) Band gap and (c) Valence band spectra of TiO2@N-doped C-450 °C (with Energy level diagram of TiO2@N-doped C -450 °C). Photocatalytic degradation efficiencies of (d) basic fuchsins, (e) Rhodamine B, and (f) tetracycline hydrochloride over NH2-MIL-125,TiO2@N-doped C-200 °C,TiO2@N-doped C-350 °C, TiO2@N-doped C-450 °C and TiO2@N-doped C-550 °C under the xenon lamp irradiation. (g) Degradation plots of TiO2@N-doped C-450 °C. (h) Transient photocurrent responses of TiO2@N-doped C with calcination temperature for 350°C, 450°C, 550°C and NH2-MIL-125. (i) EIS Nyquist plots of TiO2@N-doped C with calcination temperature for 350°C, 450°C, and 550°C.
Tetracycline hydrochloride was used as an example to investigate the stability and reusability of the TiO2@N-doped C-450 °C catalyst. The same sample was employed for five consecutive degradation cycles under identical conditions (Figure 4a). No significant changes were observed after five cycles, although the degradation capacity decreased from 93% to 81%. This decrease in degradation capacity is primarily attributed to the blockage of mesoporous channels in TiO2@N-doped C-450 °C by pollutants over prolonged reaction times, making it challenging to effectively clean and negatively impacting the recyclability of the catalyst Additionally, the inevitable loss of the photocatalyst during repeated use will also result in a decrease in degradation efficiency. Moreover, a comparison of SEM images, XRD spectra, and XPS spectra (Figure 4b–d) before and after the reaction reveals that there is no significant change in the structure, morphology characteristics, and chemical composition of TiO2@N-doped C-450 °C before and after testing. TiO2@N-doped C-450 °C exhibits excellent photocatalytic ability, stability, and reusability; it has great potential as a visible photocatalyst for various types of pollutants.
3.3. Photocatalytic Mechanism
The photocatalytic mechanism of TiO2@N-doped C-450 °C nanomaterials during visible light degradation was investigated by conducting multiple trapping experiments using tetracycline hydrochloride as an example. Three additional trapping reagents were added to the reaction solution, among which ammonium oxalate (AO) was used to trap e-, benzoquinone (BQ) was used to trap O2•, and isopropyl alcohol (IPA) was used to trap OH• (Figure 5a). The addition of each trapping agent will affect the degradation rate of tetracycline hydrochloride, among which isopropyl alcohol has the most prominent inhibitory effect among all trapping agents. The degradation efficiency of TiO2@N-doped C-450 °C was reduced significantly to 71% after the addition of isopropyl alcohol, indicating that OH• plays a leading role in the degradation reaction of tetracycline hydrochloride under visible light irradiation. In addition, the addition of ammonium oxalate and benzoquinone (BQ) also had a certain effect on the degradation rate, suggesting that e- and O2•- were also involved in the process, but did not play a major role. In conclusion, OH• was produced by the TiO2@N-doped C-450 °C catalyst during the photocatalysis process, which enhanced the oxidation capacity of the active substance and improved its ability to degrade tetracycline hydrochloride greatly.
DMPO trapping agent was added to the photocatalytic reaction system to detect active free radicals by EPR. Therefore, electron paramagnetic resonance spectroscopy was used to detect the signals of OH• radicals generated by TiO2@N-doped C-350 °C, TiO2@N-doped C-450 °C and TiO2@N-doped C-550 °C under visible light irradiation (Figure 5b). Obviously, regardless of dark or light conditions, TiO2@N-doped C-350 °C OH, almost no occurrence of free radicals, this is due to the TiO2 of TiO2@N-doped C-350 °C has not formed. At TiO2@N-doped C-450 °C and TiO2@N-doped C -550 °C, almost no OH• free radicals increased. This indicates that the photogenerated electrons on anatase TiO2 were transferred rapidly through the carbon skeleton, resulting in the production of a large amount of OH• free radicals. TiO2@N-doped C-450 °C exhibits the highest number of OH• free radicals due to nitrogen doping, which enhances the sample's utilization rate of visible light. This phenomenon further confirms the excellent photocatalytic effect of nitrogen-doped TiO2 supported by a carbon skeleton.
Figure 5.
(a) The photocatalytic ability of TiO2@N-doped C-450 °C for the degradation of tetracycline with or without adding IPA, BQ, and AO under visible light. (b) EPR spectra of the OH• on the TiO2@N-doped C-350 °C, TiO2@N-doped C-450 °C, and TiO2@N-doped C-550 °C catalysts. (c) The probable photocatalytic mechanism of tetracycline degradation by TiO2@N-doped C-450 °C under visible light irradiation.
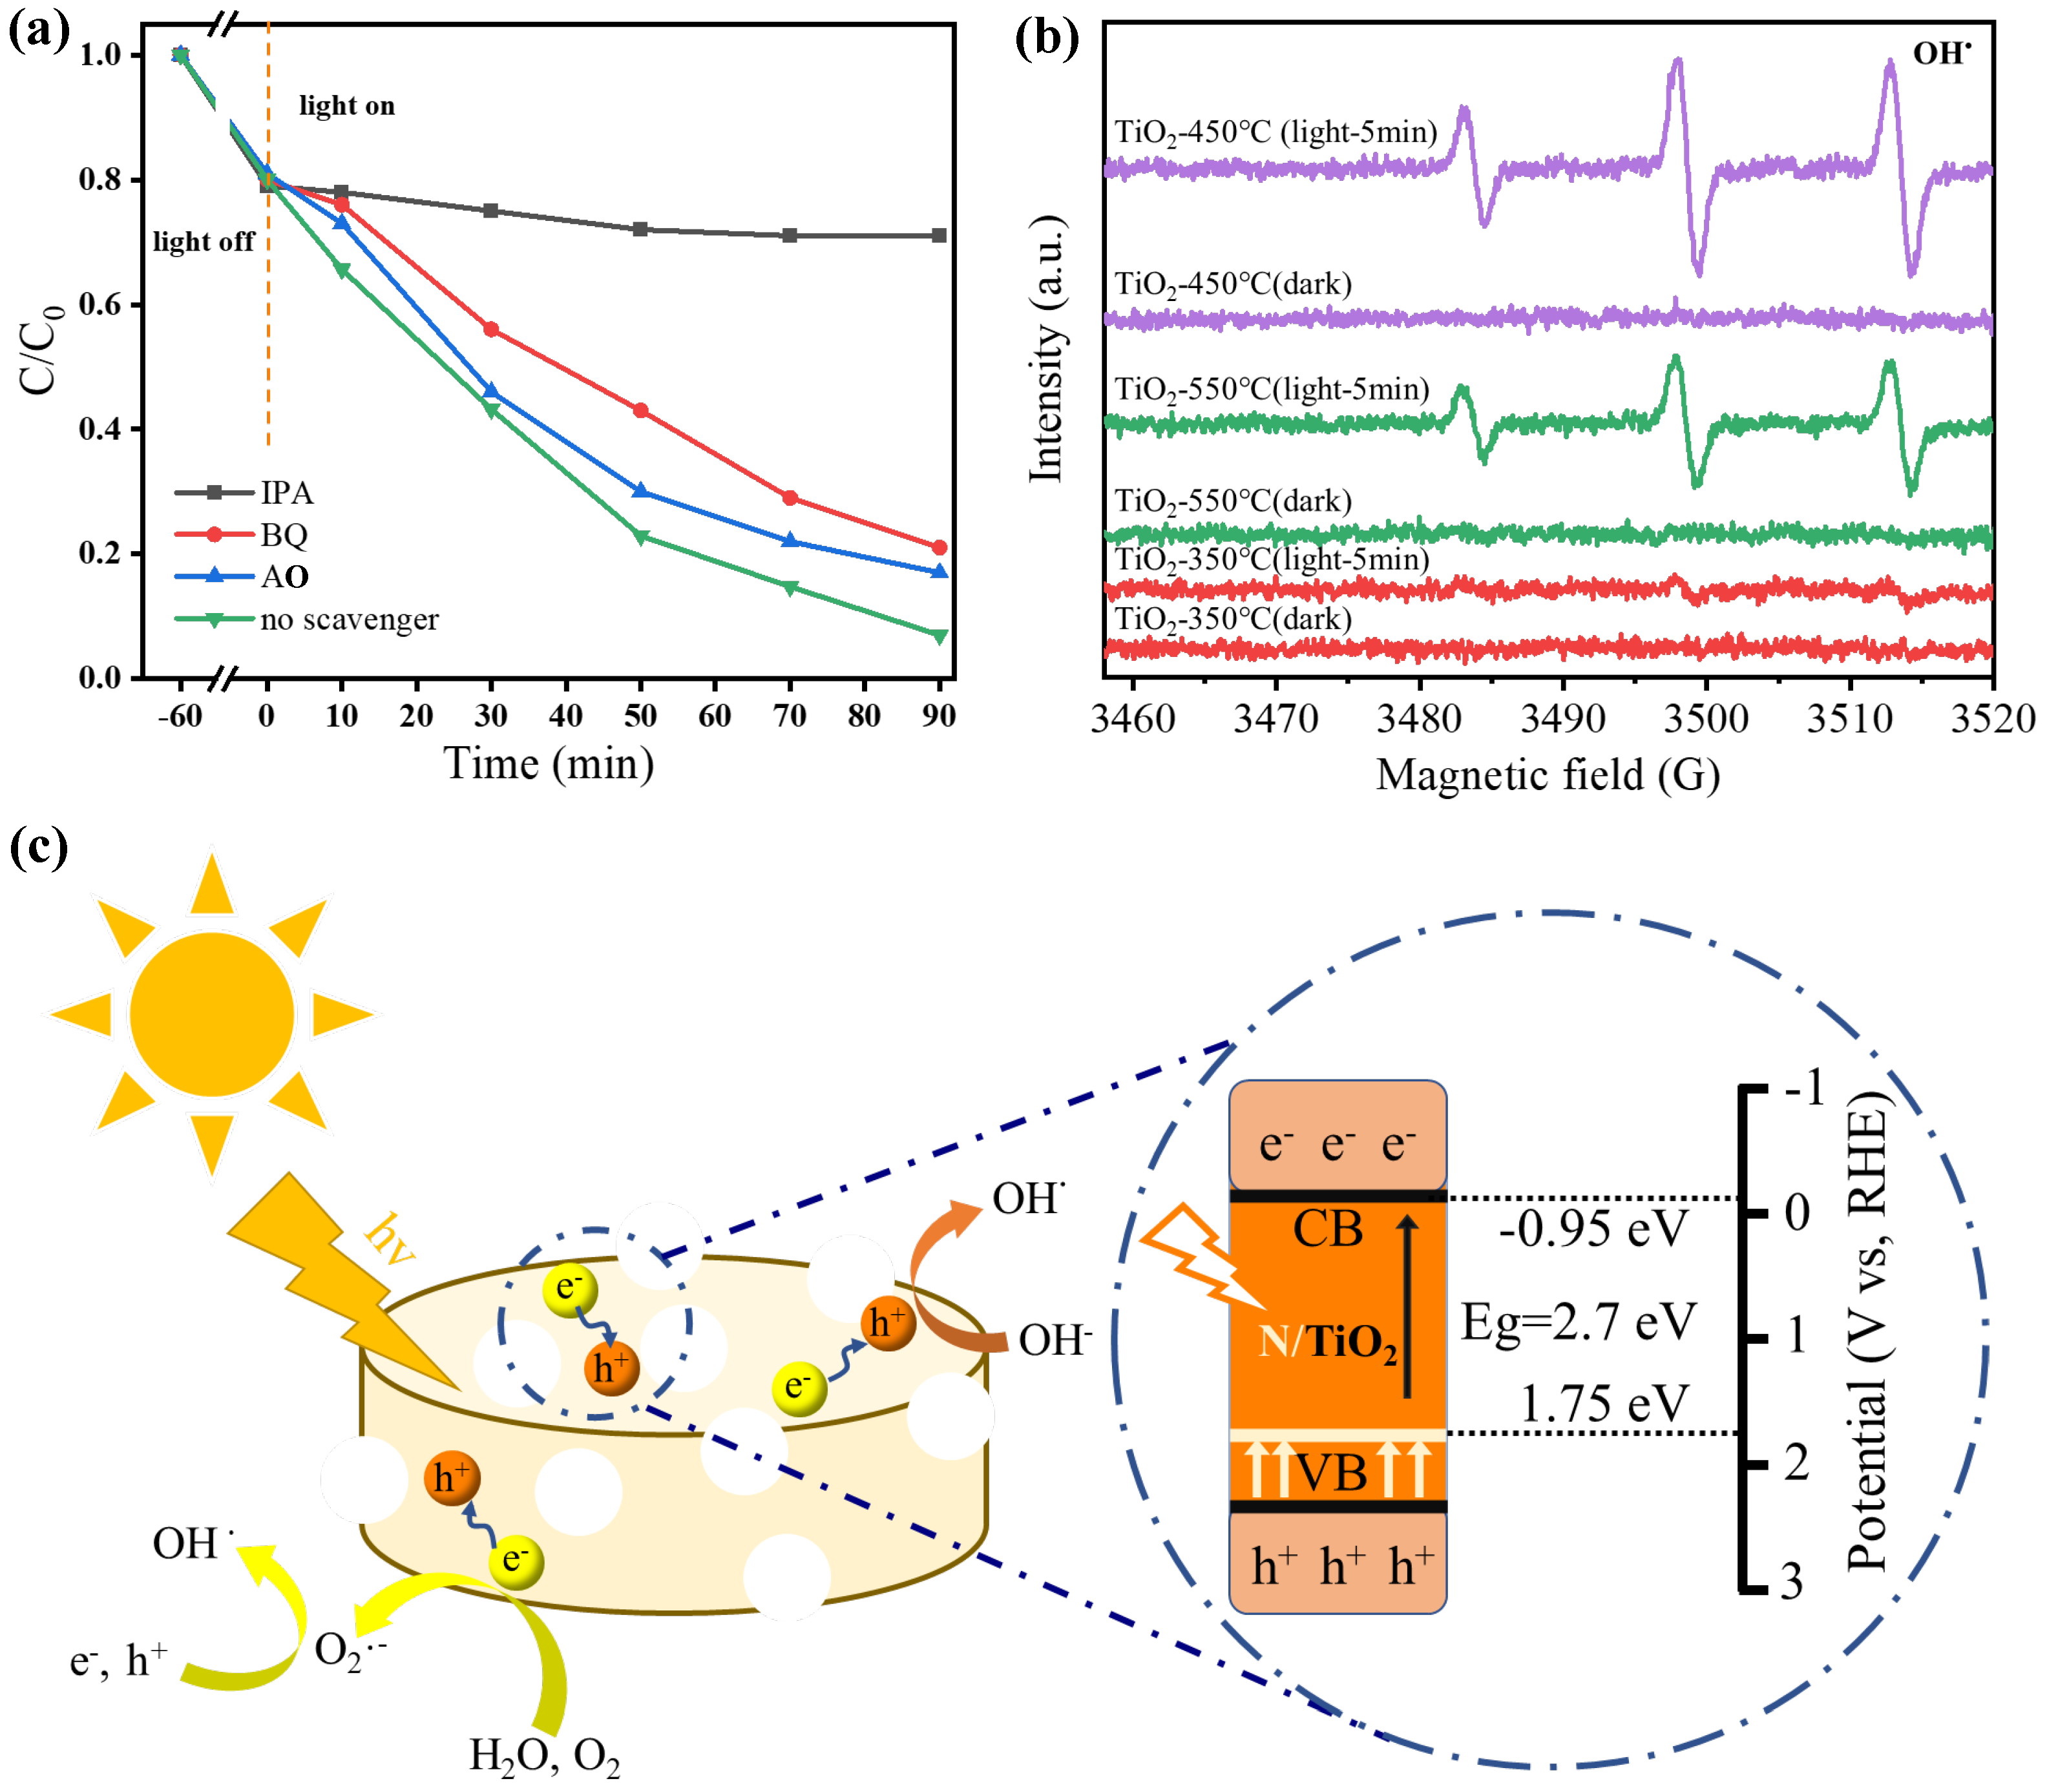
Based on the test results and analysis mentioned above, a possible photocatalytic reaction mechanism of TiO2@N-doped C-450 °C can be proposed (Figure 5c). Under visible light irradiation, nitrogen-doped TiO2 nanoparticles can efficiently produce charge carriers. At this stage, the unique porous structure of TiO2@N-doped C-450 °C provides additional pathways for the movement of charge carriers, facilitating easy transfer of electrons to the carbon framework and effectively separating photogenerated electrons and holes. During the degradation process, O2•- free radicals are generated through reactions between electrons enriched on the carbon framework with H2O and O2. The electrons generate from N/TiO2@C-450 °C under visible light irradiation is 2.7 eV, which have a much lower work function than pure TiO2 (3.2 eV). Meanwhile, due to the lower valence band (VB) of nitrogen-doped TiO2 compared to the REDOX potential of O2/•O2ˉ• (-0.13 eV), the oxidation of H2O by holes on TiO2 leads to the generation of superoxide anion radical species (O2ˉ•), which actively contribute to the degradation process, ultimately resulting in the degradation of organic pollutants such as basic fuchsin.
4. Conclusions
In summary, we have successfully synthesized a TiO2@N-doped C composite material through NH2-MIL-125 template-assisted calcination. Supported by the NH2-MIL-125 carbon framework, the catalyst exhibits a significantly enhanced specific surface area of 63 m2/g, thereby facilitating an increased number of active sites for both the catalyst and reactant. The mesoporous structure (3.5 nm) of NH2-MIL-125 facilitates enhanced light penetration, thereby reducing the occurrence of light shielding. The element mapping confirmed the presence of nitrogen, indicating that nitrogen was released from the organic ligand 2-amino-terephthalic acid and doped into the sample during calcination. Nitrogen doping in anatase shortened its wide band gap of 3.22 eV to 2.7 eV, resulting in a shift of the optical absorption range towards the visible region. As a result, the TiO2@N-doped C catalyst exhibited extended optical absorption capabilities beyond just ultraviolet wavelengths. By carefully controlling the calcination temperature, we successfully synthesized various TiO2@N-doped C composites. When calcined at 450 °C, the TiO2@N-doped C catalyst achieves a balance between anatase content and nitrogen doping. The resulting TiO2@N-doped C-450°C composite exhibits outstanding performance in photocatalytic degradation. Under visible light for 90 minutes, basic fuchsin, Rhodamine B, and tetracycline hydrochloride are degraded by 99.7%, 89.9%, and 93% respectively. Moreover, the TiO2@N-doped C-450 °C composite demonstrates excellent stability as evidenced by negligible changes in SEM, XRD, and XPS characteristics after five cycles of use; only a slight decrease in tetracycline hydrochloride degradation efficiency from 93% to 81% is observed. Lastly, we proposed the mechanism of photocatalytic degradation. This study presents a viable strategy for efficient pollution degradation under visible light.
Acknowledgments
The authors acknowledge financial support from the National Natural Science Foundation of China (51803092, 51873087).
References
- Hannah D M, Abbott B W, Khamis K; et al. Illuminating the ‘invisible water crisis’ to address global water pollution challenges[J]. Hydrological Processes, 2022, 36(3): e14525.
- Sehar S, Rasool T, Syed H M; et al. Recent advances in biodecolorization and biodegradation of environmental threatening textile finishing dyes[J]. 3 Biotech, 2022, 12(9): 186.
- Park J, Lee T H, Kim C; et al. Hydrothermally obtained type- Ⅱ heterojunction nanostructures of In2S3 / TiO2 for remarkably enhanced photoelectrochemical water splitting[J]. Applied Catalysis B: Environmental, 2021, 295: 120276.
- Lu Y, Zang Y, Zhang H; et al. Meaningful comparison of photocatalytic properties of {001} and {101} faceted anatase TiO2 nanocrystals[J]. Science Bulletin, 2016, 61(13): 1003-1012.
- Tian J, Zhao Z, Kumar A; et al. Recent progress in design, synthesis, and applications of one-dimensional TiO2 nanostructured surface heterostructures: A review[J]. Chemical Society Reviews, 2014, 43: 6920-6937.
- Wang J, Wang G, Wang X; et al. 3D/2D direct Z-scheme heterojunctions of hierarchical TiO2 microflowers/g-C3N4 nanosheets with enhanced charge carrier separation for photocatalytic H2 evolution[J]. Carbon, 2019, 149: 618-626.
- Lin L, Yang H, Xu X. Effects of water pollution on human health and disease heterogeneity: A review[J]. Surfaces and Interfaces, 2022, 10: 1088.
- Hani Nasser Abdelhamid, Sahar Sultan, Aji P. Mathew. Binder-free Three-dimensional (3D) printing of Cellulose-ZIF8 (CelloZIF-8) for water treatment and carbon dioxide (CO2) adsorption[J]. Chemical Engineering Journal, 2023, 468: 143567.
- Wang Z, Li Y, Cheng Q; et al. Sb-based photocatalysts for degradation of organic pollutants: A review[J]. Journal of Cleaner Production, 2022, 367: 133060.
- Tobaldi D M, Lajaunie L, Rozman N; et al. Impact of the absolute rutile fraction on TiO2 visible-light absorption and visible-light-promoted photocatalytic activity[J]. Journal of Photochemistry and Photobiology A: Chemistry, 2019, 382: 111940.
- Sun H, Lu W, Zhao J. Structure and reactivity of aanatase TiO2(001)-(1 × 4) surface[J]. The Journal of Physical Chemistry C, 2018, 122(26): 14528-14536.
- Wei C, Lin W Y, Zainal Z; et al. Bactericidal Activity of TiO2 Photocatalyst in Aqueous Media: Toward a Solar-Assisted Water Disinfection System[J]. Environmental Science & Technology, 1994, 28(5): 934-938.
- Playford H, Y. Variations in the local structure of nano-sized anatase TiO2[J]. Journal of Solid State Chemistry, 2020, 288: 121414.
- Kong X, Li J, Yang C; et al. Fabrication of Fe2O3/g-C3N4@N-TiO2 photocatalyst nanotube arrays that promote bisphenol A photodegradation under simulated sunlight irradiation[J]. Separation and Purification Technology, 2020, 248: 116924.
- Chen L, Zhou X, Jin B; et al. Heterojunctions in g-C3N4/B-TiO2 nanosheets with exposed {001} plane and enhanced visible-light photocatalytic activities[J]. International Journal of Hydrogen Energy, 2016, 41(18): 7292-7300.
- Akbari M, Ghasemzadeh M A, Fadaeian M. Synthesis, and application of ZIF-8 MOF incorporated in a TiO2@Chitosan nanocomposite as a strong nanocarrier for the drug delivery of acyclovir[J]. ChemistrySelect, 2020, 5(46): 14564-14571.
- Yang X, Wang Y, Hu Y; et al. Interior supported hierarchical TiO2@Co3O4 derived from MOF-on-MOF architecture with enhanced electrochemical properties for lithium storage[J]. ChemElectroChem, 2019, 6(14): 3657-3666.
- Chen K, Guo H-N, Li W-Q; et al. MOF-derived core-shell CoP@NC@TiO2 composite as a high-performance anode material for Li-ion batteries[J]. Chemistry – An Asian Journal, 2021, 16(4): 322-328.
- Wang Y, Yu W, Geng F; et al. TiO2@MOF photocatalyst for the synergetic oxidation of microcystin-LR and reduction of Cr(VI) in a media[J]. Catalysts, 2021, 11(10): 5966.
- He X, Fang H, Gosztola D J; et al. Mechanistic insight into photocatalytic pathways of MIL-100(Fe)/TiO2 composites[J]. ACS Applied Materials & Interfaces, 2019, 11(13): 12516-12524.
- Lee D T, Zhao J, Oldham C J; et al. UiO-66-NH2 Metal–Organic Framework (MOF) nucleation on TiO2, ZnO, and Al2O3 atomic layer deposition-treated polymer fibers: Role of metal oxide on MOF growth and catalytic hydrolysis of chemical warfare agent simulants[J]. ACS Applied Materials & Interfaces, 2017, 9(51): 44847-44855.
- He K, Wen Q, Wang C; et al. Porous TiO2 nanoparticles derived from titanium Metal– Organic Framework and its improved electrorheological performance[J]. Industrial & Engineering Chemistry Research, 2018, 57(20): 6888-6896.
- Sheng H, Chen D, Li N; et al. Urchin-inspired TiO2@MIL-101 double-shell hollow particles: Adsorption and highly efficient photocatalytic degradation of hydrogen sulfide[J]. Chemistry of Materials, 2017, 29(13): 5612-5616.
- Zhou S, Guo J, Dai Z; et al. Engineering homochiral MOFs in TiO2 nanotubes as enantioselective photoelectrochemical electrode for chiral recognition[J]. Analytical Chemistry, 2021, 93(35): 12067-12074.
- Fu N, Ren X-C. Synthesis of double-shell hollow TiO2@ZIF-8 nanoparticles with enhanced photocatalytic activities[J]. Frontiers in Chemistry, 2020, 8: 578847.
- Singh A K, Kaur R, Verma S; et al. Antimicrobials and antibiotic resistance genes in water bodies: Pollution, risk, and control[J]. Chemical Engineering Journal, 2022, 10: 15.
- Zhao J, Wang B, Zhao Y; et al. High-performance visible-light photocatalysis induced by dye-sensitized Ti3+-TiO2 microspheres[J]. Journal of Physics and Chemistry of Solids, 2023, 179: 111374.
- Bi, R., Liu, J., Zhou, C. et al. In situ synthesis of g-C3N4/TiO2 heterojunction by a concentrated absorption process for efficient photocatalytic degradation of tetracycline hydrochloride[J]. Environmental Science & Pollution Research, 2023, 30: 55044–55056.
- Solmaz Feizpoor, Aziz Habibi-Yangjeh, Rafael Luque. Preparation of TiO2/Fe-MOF n‒n heterojunction photocatalysts for visible-light degradation of tetracycline hydrochloride[J]. Chemosphere, 2023, 336: 139101.
- Yueyao Li, Huayang Liu, Chentao Hou, Yuke Xie, Liping Wang, Mingyuan Zhang. Transformation of titanium-based photocatalyst and its degradation of tetracycline hydrochloride[J]. Journal of Alloys and Compounds, 2024, 970: 172644.
- Yu Wang, Hua Fan, Po Keung Wong, Yonghong Wu, Bruce Rittmann. Biodegradation of tetracycline using hybrid material (UCPs-TiO2) coupled with biofilms under visible light[J]. Bioresource Technology, 323, 2021: 124638.
- Suqing Wu, Xueyan Li, Yanqin Tian, Yan Lin, Yun Hang Hu. Excellent photocatalytic degradation of tetracycline over black anatase-TiO2 under visible light[J]. Chemical Engineering Journal, 2021, 406: 126747.
- Yingying Shi, Zhuan Yan, Yingtao Xu, Tian Tian, Jing Zhang, Jianfeng Pang, Xihua Peng, Qianghua Zhang, Mingli Shao, Wenyi Tan, Hailun Li. Qingping Xiong Visible-light-driven AgBreTiO2-Palygorskite photocatalyst with excellent photocatalytic activity for tetracycline hydrochloride[J]. Journal of Cleaner Production, 2020, 277: 124021.
- Ning P, Chen H, Pan J, Liang J, Qin L, Chen D, Huang Y. Surface defect-rich g-C3N4/TiO2 Z-scheme heterojunction for efficient photocatalytic antibiotic removal: Rational regulation of free radicals and photocatalytic mechanism. Catalysis Science & Technology, 2020, 10: 8295–8304.
- Wang Y, Lei RB, Pw A, Zs A, Lz A. Photocatalytic activity of N-TiO2/O-doped N vacancy g-C3N4 and the intermediates toxicity evaluation under tetracycline hydrochloride and Cr(VI) coexistence environment[J]. Applied Catalysis B: Environmental, 2020, 262:118308.
- Shaoyu Zhou, Longbo Jiang, Hui Wang, Jinjuan Yang, Xingzhong Yuan, Hou Wang, Jie Liang, Xiaodong Li, Hui Li, and Yuanqing Bu. Oxygen Vacancies Modified TiO2/O-Terminated Ti3C2 Composites: Unravelling the Dual Effects between Oxygen Vacancy and High-Work-Function Titanium Carbide[J]. Advanced Functional Materials, 2023, 33: 2307702.
- Lijarani Biswal, Bhagyashree Priyadarshini Mishra, Sarmistha Das, Lopamudra Acharya, Susanginee Nayak, and Kulamani Parida. Nanoarchitecture of a Ti3C2@TiO2 Hybrid for Photocatalytic Antibiotic Degradation and Hydrogen Evolution: Stability, Kinetics, and Mechanistic Insights[J]. Inorganic Chemistry, 2023, 62: 7584-7597.
Figure 4.
(a) Repeated experiments of tetracycline photodegradation over TiO2@N-doped C-450 °C. (b) SEM images, (c) XRD patterns, and (d) XPS spectra of TiO2/Ti3C2-24 h before and after the photocatalytic reaction.
Figure 4.
(a) Repeated experiments of tetracycline photodegradation over TiO2@N-doped C-450 °C. (b) SEM images, (c) XRD patterns, and (d) XPS spectra of TiO2/Ti3C2-24 h before and after the photocatalytic reaction.
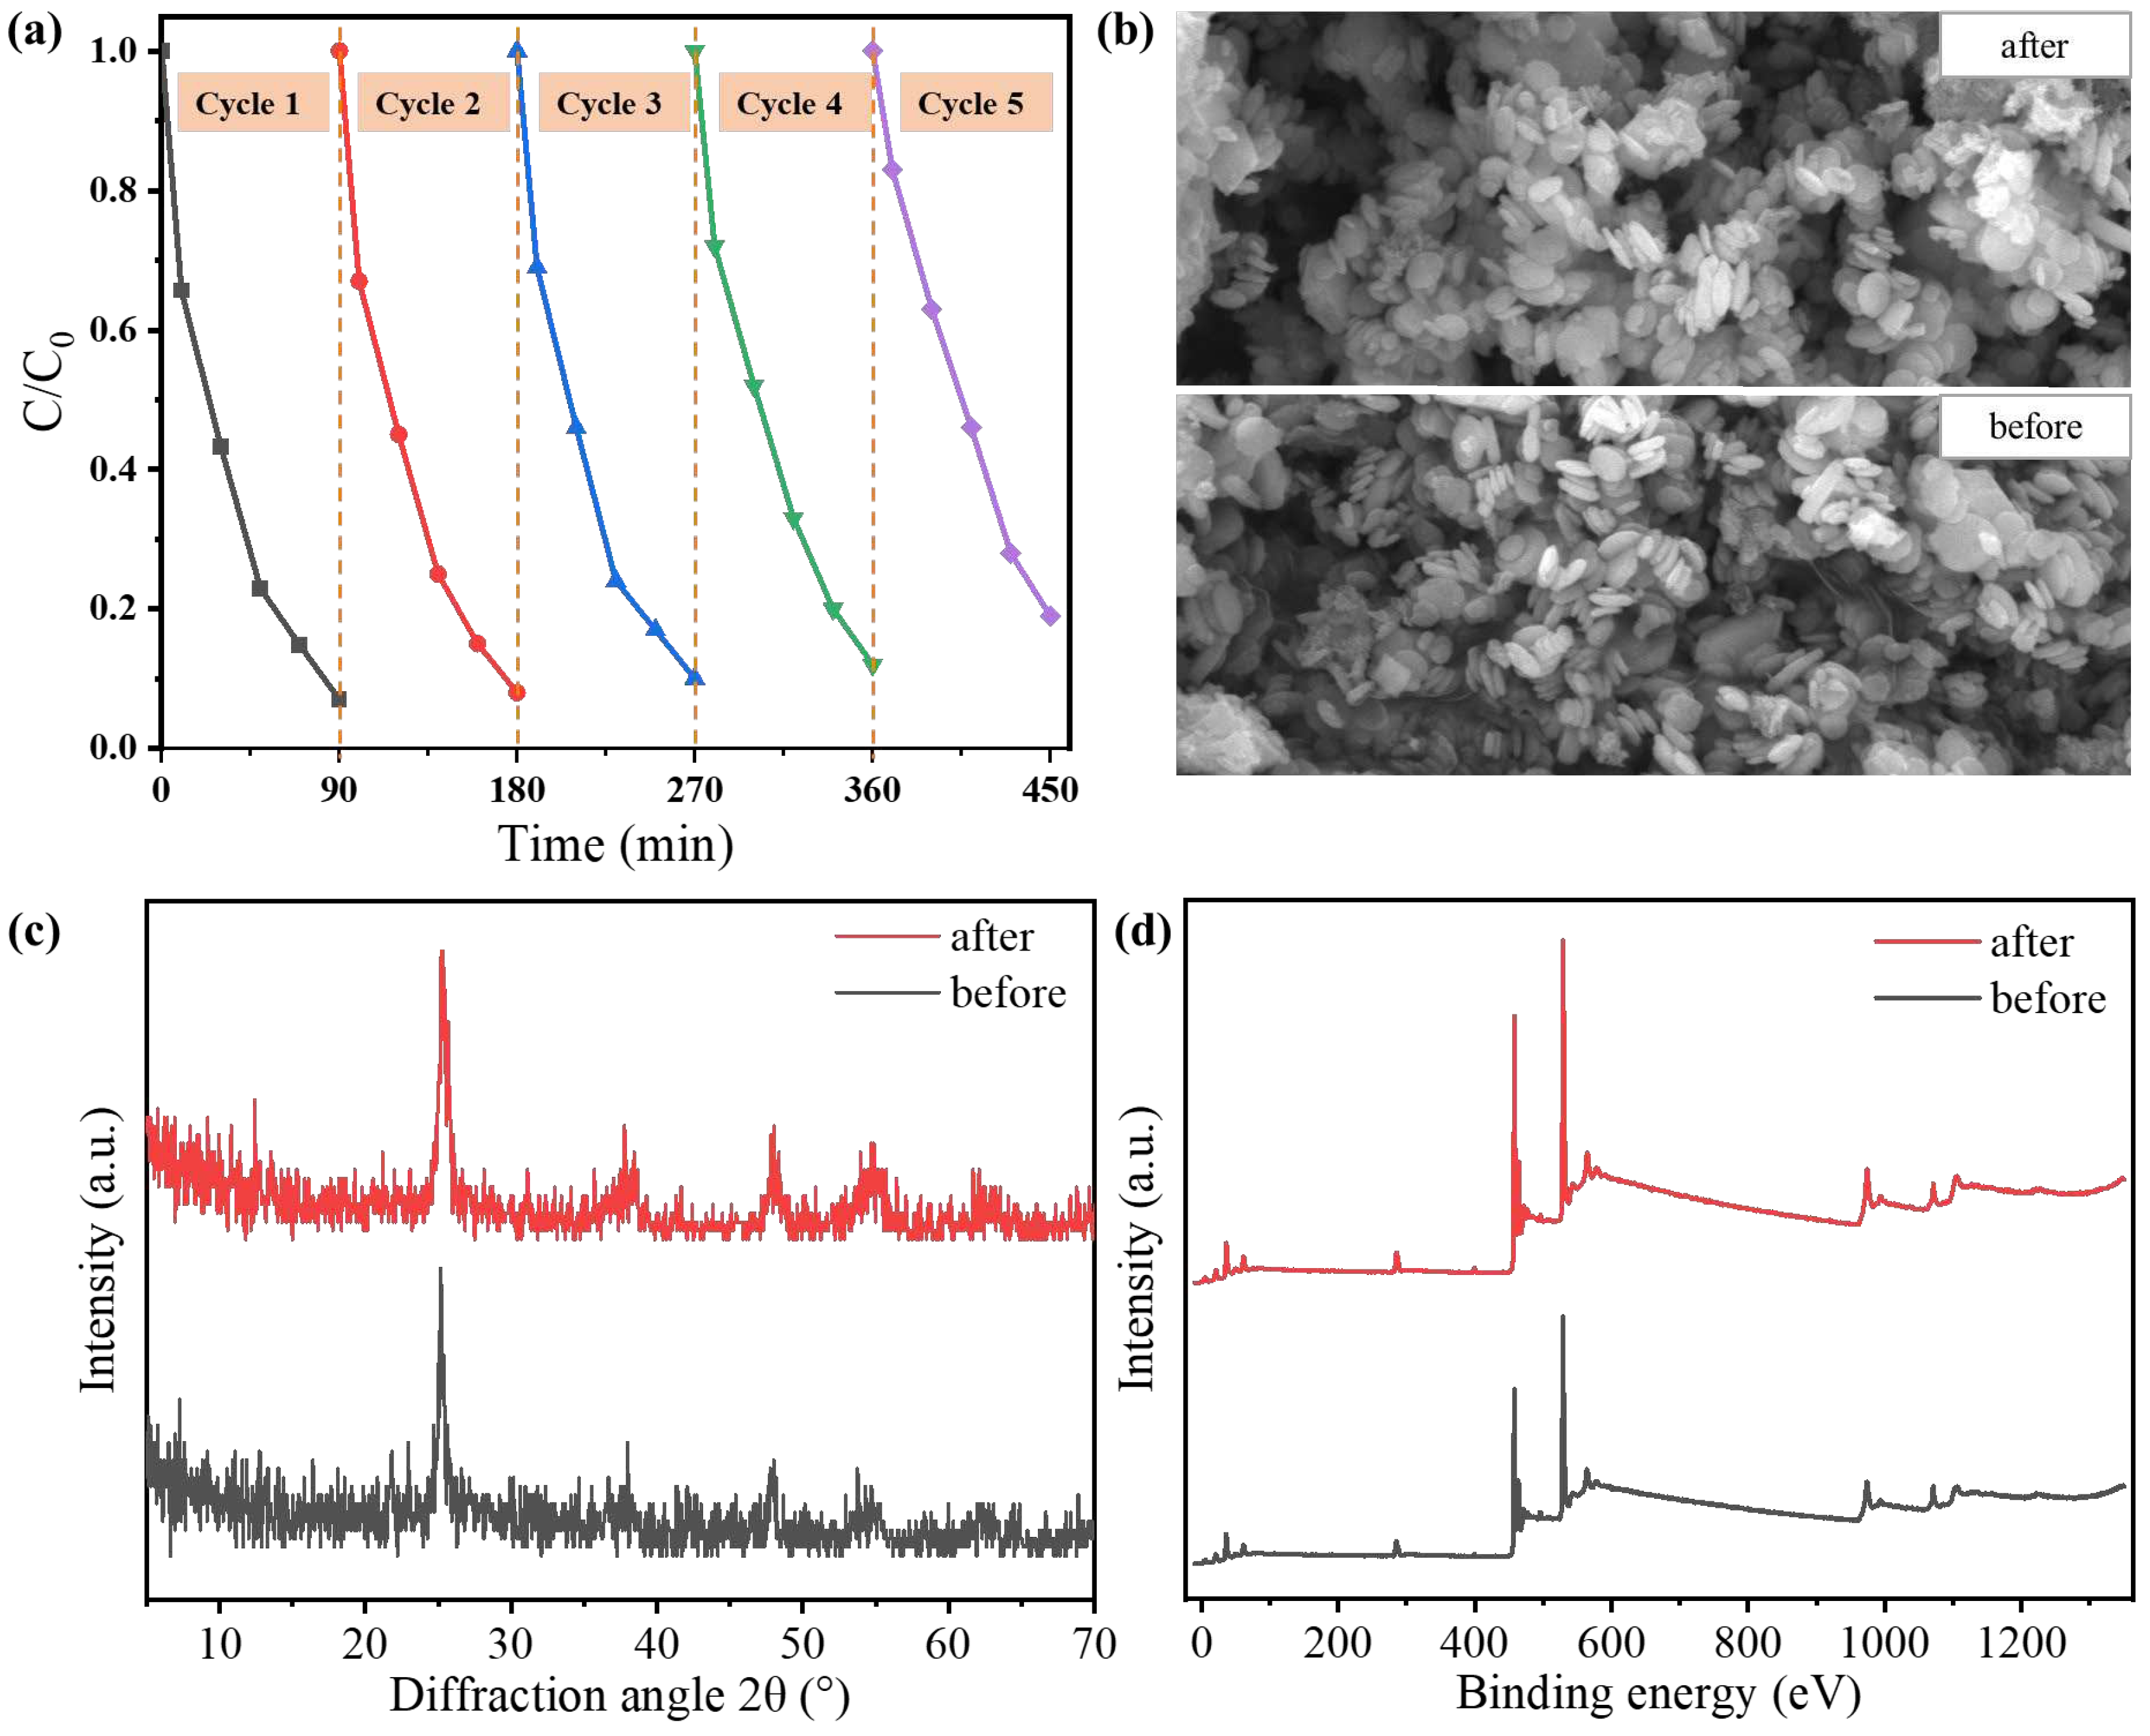
Table 2.
Summary of works on the degradation performance of TiO2 composites against tetracycline.
| Order | Catalyst | Light Source | Degradation Efficiency | Time (h) | Reference |
|---|---|---|---|---|---|
| 1 | g-C3N4/TiO2 | Vis (300 W) |
90.1% | 1.0 | [27] |
| 2 | TiO2/Fe-MOF(15%) | Vis | 97% | 4 | [28] |
| 3 | TiO2, H2Ti3O7 | xenon lamp | 89%, 94% | 1 | [29] |
| 4 | Biofilm-UCPs-TiO2 | Vis (20 W) |
82.1% | 24 | [30] |
| 5 | Black-TiO2 | Vis | 66.2% | 4.5 | [31] |
| 6 | AgBreTiO2-Pal(50%) | Vis (300 W) |
89.6% | 1.5 | [32] |
| 7 | Defect-rich hydrogenated g-C3N4/TiO2 | Vis (300 W) |
60% | 1.5 | [33] |
| 8 | N-TiO2/Ov carbon nitride doped with oxygen |
Vis (300 W) |
79.9% | 1.0 | [34] |
| 9 | Oxygen Vacancies Modified TiO2/O-Terminated Ti3C2 Composites | Vis (300 W) |
88.5% | 1.5 | [35] |
| 10 | Ti3C2@TiO2 | Vis (300 W) |
90% | 1.5 | [36] |
| 11 | TiO2@N-doped C | Vis (300 W) |
93% | 1.5 | This work |
Disclaimer/Publisher’s Note: The statements, opinions and data contained in all publications are solely those of the individual author(s) and contributor(s) and not of MDPI and/or the editor(s). MDPI and/or the editor(s) disclaim responsibility for any injury to people or property resulting from any ideas, methods, instructions or products referred to in the content. |
© 2023 by the authors. Licensee MDPI, Basel, Switzerland. This article is an open access article distributed under the terms and conditions of the Creative Commons Attribution (CC BY) license (http://creativecommons.org/licenses/by/4.0/).
Copyright: This open access article is published under a Creative Commons CC BY 4.0 license, which permit the free download, distribution, and reuse, provided that the author and preprint are cited in any reuse.


