Submitted:
02 December 2023
Posted:
05 December 2023
You are already at the latest version
Abstract
The aim of this research was to undertake laboratory testing to investigate the beneficial effects of epoxy resin grouts on the physical and mechanical properties of sands with a wide range of granulometric characteristics. Six sands, of different particle size and uniformity coefficients, were grouted using epoxy resin solutions with three ratios of epoxy resin to water (3.0, 2.0 and 1.5). A set of unconfined compressive strength tests were conducted on grouted samples at different curing periods and a set of long-term unconfined compressive creep tests in dry and wet conditions after 180 days of curing were also carried out, in order to evaluate the development of the mechanical properties of the sands, as well as, the impact of water on them. The findings of the investigation showed that epoxy resin resulted in appreciable strength values in the specimens, especially those of fine sands, grouted with the different epoxy resin grouts. In general, the compressive strength varied between 0.68 - 5.60 MPa and the modulus of elasticity between 75 - 480 MPa, after a curing period of 180 days. In terms of physical properties, the permeability and porosity (before and after the grouting process) were estimated. Grouts with an epoxy resin to water ratio of 3 decreased permeability by up to four orders of magnitude. Using laboratory results and regression analysis, three mathematical equations were developed that relate each of the dependent variables; compressive strength, elastic modulus, and coefficient of permeability, with particular explanatory variables.
Keywords:
epoxy resin
; grout
; creep
; strength
; permeability
; porosity
; regression analysis
1. Introduction
In the permeation grouting method, the grouting material is injected into the voids of soil at a constant rate, without changing the arrangement of soil particles, in order to improve its physical and mechanical properties by binding soil particles together. In the case of clean sands and gravels with a coefficient of permeability higher than 10-5 m/sec [1], injectable cement slurries are of great use in many construction domains. They provide satisfactory solutions for improving ‘problematic’ soils, since they can effectively penetrate through a large area of the soil mass. However, in soils with very low permeability, such as fine sands, the propagation of cementitious grouts is highly restricted, or even impossible, if very fine cement is utilised. Because of this, permeation grouting in such soils only requires the use of chemical solutions.
For the purpose of chemical grouting, a large number of researchers investigated the efficacy of using different types of polymer grouts for soil strengthening, including polyurethane liquid [2], water soluble latex [3], acrylic resin and methylmethacrylate [4], dilute colloidal silica [5], polyvinyl acetate [6] and polyester [7]. More recently, some investigators have suggested two-component water soluble epoxy resin emulsions, which are among the most widely applied polymeric compounds in many construction and building restoration projects [8,9,10,11], as grouting agents that can significantly improve the properties of weak soils. According to the previous research activity [12,13,14,15,16,17,18,19], these chemical substances enhance the mechanical properties (compressive strength, elastic modulus, shear strength, toughness, creep strength and liquefaction resistance) and reduce the permeability and compressibility of grouted soils. However, there is still a need for broadening the research, in order to highlight the effect of some key factors (mainly the mean grain size d50, the uniformity coefficient cu and the type of soil) on the properties of the grouted soil, as well as, the impact of moisture condition on the mechanical behaviour of grouted soils under static loading.
In order to gain knowledge about the effectiveness of epoxy resin (ER) grouts in the soil improvement, an extensive laboratory study was performed to examine the relationships between the aforementioned parameters and some physical (porosity, permeability) and mechanical properties (compressive strength, elastic modulus, creep behaviour) of fine to medium grained sands, grouted with epoxy resin. The grouts were produced using various epoxy resin to water (ER/W) ratios.
2. Materials
The epoxy resin employed in this study is a two-component water soluble commercial product widely distributed in Greece. Bisphenol A (epichlorhydrin) is the epoxy resin (part A), with an average molecular weight of approximately 700, and aliphatic glycidylether (part B) is the reactant agent for the polymerisation of the resin. According to the manufacturer, the optimal mixture ratio (by weight) of the two parts is A: B = 3.
Two types of soil, calcareous and siliceous sand were collected from river deposits and utilised for the injection experiments. From calcareous sand, six different sand gradations were chosen with particle sizes ranging from 1.19 to 0.42 mm (denoted as S1), 0.42 to 0.149 mm (S2), 0.149 to 0.074 mm (S3), 1.19 to 0.074 mm (S4), 2.38 to 0.074 mm (S5) and 2.38 to 1.19 mm (S6). Their gradation curves are depicted in Figure 1 and their index properties are summarised in Table 1. For the siliceous sand, a particle size distribution in the same range as the S1 sand was chosen, as well as similar index properties.
3. Laboratory Procedure
Grouts with ER/W ratios of 1.5, 2.0 and 3.0 (by weight) were prepared for the grouting experiments. The sand columns were grouted using an arrangement constructed according to the laboratory system suggested in ASTM D 4320-09. A mixing tank with a high speed agitator, an air-operated diaphragm pump, pressure regulator, pressure meters, flow meter and plastic cylindrical moulds (with an internal diameter of 5.5 cm and 150 cm high), as well as the relevant connections, constituted the experimental set-up for the laboratory assessment of chemical grouting operations (Figure 2). In order to keep the grouted specimens intact upon removal from the moulds, after the end of injection, the inner surface of the mould was lubricated before pouring the sand. Special precautions were taken for the filling process of the columns with the gravel material, to ensure the uniformity of the specimens and the desired relative density Dr of 50%. The exact weight of sand required to fill the mould was calculated and this quantity was poured into the moulds. Throughout the filling process, in order to achieve the appropriate unit weight, the material was lightly vibrated and compacted with a rod in equal layers. After moulding the specimen at the targeted Dr, the upper and bottom end plates were clamped on tie rods.
The resin grouts with ER/W ratios of 1.5, 2.0 and 3.0 had constant viscosity values (Newtonian fluid) of 60, 75 and 85 cp, respectively, which were obtained using a capillary tube viscometer [20] at shear strain rates of up to 8,000 s-1. Despite the high viscosity values, all grouts easily penetrated the sand columns, even the columns of the finer sand, when pressure was exerted in the range of 1 – 2 bar. In order to achieve a more uniform grout flow and prevent any fingering effects that could result from top-to-bottom flow, the grouts were injected from the bottom of the sand column. During the injection experiments, the volume of grout that was passing through the specimen was unceasingly measured using a digital flow meter. When excess grout, equivalent to 120 % of the sand pore volume, had passed and collected from the outlet hose of the column, the grouting process was ceased. The grouted specimens were allowed to cure in the moulds in laboratory conditions for a period of at least 2 days, to develop adequate strength levels. Afterwards, they were demoulded and slashed into smaller equal parts with a length of 11 cm. Thereafter, the samples were stored and cured in a moist room at a temperature of 20 ± 3 oC and relative humidity of 95 %, until the day of testing. These specimens were employed in unconfined compressive strength tests after 3, 7, 30, 90 and 180 days of curing, in order to evaluate the increase of compressive strength and elastic modulus with time, as well as, unconfined creep strength tests after 180 days of curing. Although past research [14,16,19] reported that, for curing periods higher than 90 days, the polymerisation rate dramatically drops, resulting in marginal strength improvement, it was decided to investigate the mechanical properties of treated sands at curing ages of up to 180 days. This decision was made because the grouts utilised in this study had higher ER/W ratios than those of the grouts referred to in past studies, a fact that could influence the duration of the polymerisation reactions, resulting in the extension of the hardening process of polymer films beyond 90 days. All the unconfined compression tests were carried out under a constant axial strain rate of 0.1 %/min in accordance with the ASTM D 4219-02 standards. The test were carried out using a servohydraulic testing machine, incorporating a load cell (accuracy 10-5 N) and a linear variable displacement transducer (accuracy 10-5 mm), connected to a data logger/computer system for the recording of compressive stress-axial strain values during the test (Figure 3). The slope of the initial linear part of the stress-strain curve was used to compute the initial tangent modulus (elastic modulus).
Long-term unconfined compression creep tests were performed on specimens of the same size and shape as the ones used for unconfined compression tests (also cured for 180 days). Creep tests were carried out in lever-type loading equipment (modified consolidation apparatus) that were capable of receiving a sample measuring 5.5 cm in diameter and 11.0 cm in height (Figure 4a). Each specimen was subjected to a constant loading expressed as a percentage of the compressive strength. After the start of the loading, the axial strain measurement was recorded at 1 min intervals for the first hour, then every hour for the first day and then every day until the end of the test. The maximum test time was three months. The axial deformation was measured with a 10-3 mm dial gauge. To study the effect of moisture on the deformation behaviour of grouted sands under permanent loading, two kinds of test were conducted: creep tests with different loading levels on dry specimens and then on specimens immersed in water during the loading period (Figure 4b).
Porosity measurements of un-grouted sands were carried out according to the method proposed by Neithalath et al. [21]. In this method, the dry mass (M1) of a sand sample contained in a plastic cylindrical tube (9.5 cm in diameter and 15.0 cm long) was weighed. Afterwards, water was added on the top of the sample until it was full. The mass of the saturated system (M2) was then recorded. The difference between M2 – M1 gave the mass of the water in the pores. By converting this mass into a volume, and expressing it as a percentage of the total volume of the sample, an indication of the total porosity was obtained.
The porosity of grouted specimens was determined according to the saturation method suggested in ISRM with the use of a vacuum saturation device (Figure 5). Porosity was calculated using the following Equation
where Ms is the dry mass of the specimen, Msat is the surface-dry saturated mass, V is the volume of the specimen, and ρw is the density of water.
For the evaluation of water permeability of ungrouted sands, the constant head method was adopted, in accordance with ASTM D 5084-03. Figure 6 presents the set-up for the permeability tests. The coefficient of permeability k is given by
where Q is the water flow (m3/s), A is the cross section of a cylindrical specimen, Δh is the hydraulic height difference (m) and L is the sample height.
In the case of grouted sands, the constant head method was also performed for the determination of k. Specimens of the same size as the ones used for mechanical tests were placed in a triaxial cell. Triaxial permeability tests were carried out with a back-pressure system, for ensuring the constant head approach and the direction of water flow, a flow meter and a confining pressure of 1 bar. k was calculated from the constant flow rate induced by the pressure difference across the specimen, using Equation 2.
4. Results and Discussion
The results of the injection experiments demonstrated that all ER grouts, when applied at relatively low pressure, could be easily propagated through the sand columns of the different grain sizes, even those made with the finer gradations. These observations are in agreement with the statements made in previous research [16,19], indicating that ER grouts have satisfactory penetrability characteristics resulting in an isotropic strength development when injected into a soil mass. Some of the above findings are illustrated in Figure 7, which presents the results from compression tests that were performed on specimens extracted from different parts of the S5 grouted sand columns, with grouts having an ER/W ratio of 3.0 and 1.5, and aged 180 days. In general, laboratory strength tests evidenced that compressive strength and elastic modulus values were almost equal and unaffected by the distance between the inlet and outlet point of the grouted column, for all of the grouted sands with the different grouts.
The compressive strength and elastic modulus values of grouted sands with various ER/W grouts, as a function of curing time, are depicted in Figure 8 and Figure 9. It is clearly seen that strength values increased over time and the largest part of the strength was developed at the time interval between 7 and 90 days of curing. For higher curing periods, marginal increases in strength were obtained. A typical case, conforming to the above conclusion, is that of S3 sand, with an ER/W grout ratio of 3.0; it appeared to have a 90-day compressive strength and elastic modulus which was 720 and 555 % higher than those obtained at 7 days of curing, respectively. Irrespective of the distinct upward trend of strength over time, culminating in a marked elevation of its values, the detrimental effect of water in strength development at any curing age is obvious. This effect was heavily contingent upon the water content. In general, the lower the water content, the higher the strength of the grouted sands. For example, the 180-day compressive strength and elastic modulus of S2 sand, grouted with an ER/W ratio of 3.0 were 175 and 140 % higher than those of S2, when grouted with grout of an ER/W ratio equal to 1.5. The harmful effect of water on the strength development of grouted specimens may be due to the amount of water absorbed by the hydrophilic groups grafted on the molecular chain of ER, since it prohibits, to some extent, the reaction of resin with amine hardener [22]. Another explanation is the permanent weakness of the polymeric network, due to a partial hydrolysis of the ether linkages [11].
Figure 10 shows the stress-strain curves obtained from 180-day compression tests on specimens of S3 sand, grouted with grouts of an ER/W ratio equal to 3.0, 2.0 and 1.5. These curves are typical of the mechanical response exhibited by all grouted sands, with grouts of different ER/W ratios and at all curing ages. For all of the grouted sands considered in this research, the shape of the stress-strain curves demonstrated an initial elastic segment, followed by a large plastic zone extended in the pre and post-failure region over a large range of strains. During the testing of all specimens, no sudden fracture was observed, even when shear bands (fewer cases related mainly with the lower ER/W ratio or the coarser sand) or excessive lateral bulging (in most cases) were visible. Specimens were continuously deformed until the test procedure was terminated, up to a strain of at least 3 %. This ductile response reveals the domination of the strain hardening behaviour of the ER through a strong interfacial adhesion between the polymer membrane and sand grains on the deformation characteristics of the whole composite material, suggesting its application in earthworks or other geotechnical structures that may suffer significant deformations.
Figure 11 and Figure 12 illustrate the relation between strength parameters of grouted sands with the different resin grouts at a curing age of 180 days. It can be seen that there is a significant influence of d50 on the measured strength values. For example, the compressive strengths of S3 sand (the finer sand) and S6 sand (the coarser sand), grouted with grouts of ER/W ratios equal to 3.0, were 5.5 and 2.1 MPa, respectively. In the case of grouting with grouts having lower ER/W equal to 1.5, the effect of d50 on strength development is more pronounced; the compressive strength of S3 sand appeared to be 3.9 times higher than that of S6 sand. An explanation is that a decrease in the grain size of sands, or an increase in their specific surfaces, leads to an increase in the number of inter-particle contacts per unit volume and more surfaces for bonding are provided for the grouts. In general, for all ER/W ratios, a reduction in the d50 of the sands results in a considerable enhancement in strength properties of the grouted sands. For the S3, S2, S1 and S6 sands, having a similar coefficient of uniformity (cu) value, the proportion among the two factors is accurately described by the power law as:
UCS or EM = a d50b
where UCS is the unconfined compressive strength (MPa) at 180 days of curing; EM is the elastic modulus (MPa) at 180 days of curing; d50 is the mean grain size of sand (mm), and a and b are coefficients determined from regression analysis. Table 2 summarises the values of the fitting parameters and R2 for all ER/W ratios.
The curves in Figure 11 and Figure 12 show a consistent relation between mechanical indices and d50. However, in the case of S4 and S5 sands, with cu values much higher than those for other sands, their data in the graphs shifted upward with respect to the curves. This reveals the significant influence of cu on the strength of the grouted sands. Obviously, the change in strength is directly related to the distribution of grains of different sizes in the soil mass, interlocking with each other to form a more unitary matrix and increased number of contacts, providing more surfaces for the grouts to develop bond interfacial strength.
Table 3 summarises the experimental values of the porosity for all the untreated and treated sands. For each of the six sands; the higher the ER/W ratio, the lower the porosity of the grouted sand. However, a general trend relating the strength and porosity of all the grouted sands was not detected. In Figure 13, the values of the compressive strength are plotted against the values of porosity. This comparison of porosity and strength test measurements for the different grouted sands reflects the lack of any relation between the two factors. For instance, the porosity of the finer sand S3 (from which the higher strength values were obtained) and the coarser sand S6 (from which the lower strength values were obtained) was 37.04 and 34.50 %, respectively, when injected with grouts having an ER/W ratio of 3.0. These experimental results provide more evidence that the reinforcement efficacy of ER grouts is strongly dependent on the number of grain to grain contact points, a fact that is related to d50 and cu, as referred to previously. From an economic point of view, it should be mentioned that, although epoxy resin is slightly more expensive than other conventional grouting materials, the small amount of resin required for improving the soil to be grouted implies that its share of the total cost for the ground improvement operation is very low. Hence, it is worth utilising. Indeed, the current results show that the reduction of porosity for all grouted sands was low and ranged from 6.9 to 29.0 %.
Based on the experimental data, a non-linear regression analysis was conducted using a statistic software program. The analysis related the final strength indices of the grouted sands, UCS and EM (both in MPa), to the descriptor variables, including d50 (mm), ER/W ratio and cu. The performance of the regression yielded the following equations:
UCS = (d50-0.34) [-1 + (ER/W)0.001] (3.74 + cu3.53), R2 = 0.98
EM = 0.022 (d50-0.33) [-0.411 + (ER/W)1.178] (2.83 + cu3.84), R2 = 0.95
The relationships between the measured and predicted strength values from the regression formulas are visualised in Figure 14 and Figure 15.
The strength of grouted sands is affected by numerous factors, such as the proportions of water and cement, types of grout and curing time, the specific surface of both sand and cement, fines content, particle size, relative density and mineralogy of the sand [23,24,25]. The influence of mineralogical composition on the strength of grouted soils has been the subject of several studies, as shown by the research activity published in international scientific journals [26,27,28]. However, little research has been undertaken to examine its effect on the mechanical properties of ER-treated soils. Hamidi et al. [29] performed unconfined compression tests on soils containing various clay mineral types. These tests showed that the efficiency of stabilisation with ER is strongly dependent on the type and percentage of clay minerals. Consequently, injection tests were also carried out on siliceous sand columns with grouts having ER/W ratio of 3.0, 2.0 and 1.5. The strength test results obtained for grouted siliceous sand, at 180 days of curing, are compared with those of S1 calcareous sand (similar gradation and index properties with the siliceous sand) in Table 4. The comparison reveals an insignificant difference between the compressive strength and elastic modulus values of the two sands for all grouts proportioned using different ER/W ratios. However, since one type of sand has been utilised in this research effort, it is not possible to extend the current experimental results into a general conclusion and so more work needs to be undertaken on a wide range of soils.
Several authors have shown that the existence of a creep limit can be expressed as a stress level [30,31,32,33]. Soils remain stable when subjected to loadings lower than the creep limit; whereas, beyond this limit, soil exhibits large deformations and collapses over a short or long time period. The creep limit Qf assessment is based on the determination of the slope a of the strain evolution over time, for each loading. The slope variation with loading consists of two or three linear parts. The creep limit is considered to be the stress value at which the transition between the two last parts occurs [31]. The above methodology for the estimation of Qf was adopted in the current study, as depicted in Figure 16. For instance, the measurements of creep tests for S1 sand grouted with grout of an ER/W ratio equal to 3.0 are illustrated in Figure 17, which presents the variation of creep strain in time for loading levels ranging from 70-90 % of compressive strength (qc), under dry conditions. Figure 18 represents the estimation of the Qf from the a- qc curve. The curve was plotted using the data for loading equal to 70, 75, 80 and 85 % of qc. For the estimation of Qf, the loadings equal to 87.5 and 90.0 % of qc were omitted because rupture of the specimens at early stages was observed. Table 5 summarises the creep limit under dry and wet conditions for all grouted sands with the grouts of different proportions. Table 5 evidences that Qf, determined under dry or wet conditions, increased slightly with the increase of ER/W ratio, for each of the six sands. However, a general trend for all grouted sands is not identified, since their Qf values are very close and independent of the d50 and cu. An exception to this is the case of the coarser sand S6, the Qf values of which are much lower when compared with the ones for the other sands. The comparison of these experimental results confirms the detrimental influence of water on the creep behaviour of all grouted sands. However, this negative impact of water resulted in a relatively small reduction of Qf values, which ranged from 5.0 to 7.5 % in total terms. For S6 sand, this decrement of Qf was more significant and fluctuated from 10-12 %.
The values of k for ungrouted and grouted sands, obtained from permeability tests, are also included in Table 3. As for the mechanical properties, the reduction of water permeability was directly related to the ER/W ratio, d50 and cu. In the case of grouting with the thicker grouts, permeability test results verify the accretion of a dense polymer membrane on the particle surface, which fills or seals a large number of pores, resulting in the significant reduction of k values. The most appreciable decrease of k was obtained for S6 sand, grouted with grouts of an ER/W ratio equal to 3.0, by four orders of magnitude; whereas, the decrease in the values of k for the other grouted sands ranged from one to three orders of magnitude.
On the basis of the experimental results, a regression analysis was carried out to correlate the k (m/s) of grouted sands to the descriptor variables, including ER/W ratio, d50 and cu. The model that gives the best correlation is:
k = 3.26 10-4 (d500.503) [0.06 + (ER/W)-4.59] (0.135 + cu-4.48), R2 = 0.96
The relationship between the measured and predicted k values from the regression equation is illustrated in Figure 19.
5. Conclusions
Thorough experimental research was conducted to assess improvements to some physical and mechanical properties of a wide range of grouted sands with three different ER grouts. The effect of several factors on the outcome was investigated and the conclusions can be summarised as follows:
1) ER grouts, despite their high viscosity, penetrate easily into the voids between sand particles, resulting in the development of a uniform strength with distance from the injection point.
2) The compressive strength and elastic modulus of grouted sands depend directly on ER/W ratio, d50, cu and curing time.
3) All grouted sands with the different grouts gain their final strength after 90 days of curing.
4) The higher the ER/W ratio, the greater the strength development, at all curing ages.
5) The finer the sand is, the higher the strength achieved with the different grouts.
6) Coefficient of uniformity significantly affects the strength improvement.
7) The mineralogical composition of sand does not seem to influence the strength development.
8) All grouted sands have stable long-term creep behaviour with high values of Qf. Even under wet conditions, the adverse influence of water, in most of the cases, is very low.
9) Permeability of grouted sands decreases significantly, especially with the thicker grouts (ER/W = 3).
10) The models derived from non-linear regression analysis relate the UCS, EM and k of grouted sands to ER/W ratio, d50 and cu. The predictive accuracy of the regression equations was found to be remarkably high.
Author Contributions
All the co-authors contribute equally for designing the experiments, analyzing the data, writing the manuscript, revisions and editing. All the co-authors have read and agreed with the submitted version of the manuscript.
Conflicts of Interest
The authors acknowledged no conflict of interest.
References
- Celik, F. The observation of permeation grouting method as soil improvement technique with different grout flow models. Geomech. Eng. 2019, 17, 367–374. [Google Scholar]
- Saleh, S.; Yunus, N.Z.M.; Ahmad, K.; Ali, N. Improving the strength of weak soil using polyurethane grouts: A review. Constr. Build. Mater. 2019, 202, 738–752. [Google Scholar] [CrossRef]
- Anagnostopoulos, C.A. Laboratory study of an injected granular soil with polymer grouts. Tunn. Undergr. Space Technol. 2005, 20, 525–533. [Google Scholar] [CrossRef]
- Anagnostopoulos, C.A. Physical and mechanical properties of injected sand with latex-superplasticized grouts. Geotech. Test J. 2006, 29, 490–496. [Google Scholar] [CrossRef]
- Gallagher, P.M.; Lin, Y. Colloidal silica transport through liquefiable porous media. J. Geotech. Geoenvironmental Eng. 2009, 135, 1702–1712. [Google Scholar] [CrossRef]
- Ajalloeian, R.; Matinmanesh, H.; Abtani, S.M.; Rowshanzamir, M. Effect of polyvinyl acetate grout injection on geotechnical properties of fine sand. Geomech. Geoengin. 2013, 8, 86–96. [Google Scholar] [CrossRef]
- Lim, S.K.; Hussin, M.W.; Zakaria, F.; Ling, T.C. GGBFS as potential filler in polyester grout: Flexural and toughness. Constr. Build. Mater. 2009, 23, 2007–2015. [Google Scholar] [CrossRef]
- Anagnostopoulos, C.A.; Dimitriadi, M. Study on high performance polymer-modified cement grouts. CivilEng. 2021, 2, 134–157. [Google Scholar] [CrossRef]
- Xia, Q.; Wen, J.; Tang, X.; Zhu, Y.; Xu, Z.; Du, Z.; Liu, X. Optimal preparation and degradation characterization of repair mortar containing waterborne epoxy resin emulsions. Constr. Build. Mater. 2021, 298, 123839. [Google Scholar] [CrossRef]
- Issa, S.A.; Debs, P. Experimental study of epoxy repairing of cracks and concrete. Constr. Build. Mater. 2007, 21, 157–163. [Google Scholar] [CrossRef]
- Wu, L.; Hoa, S.V.; Ton-That, M. Effects of water on the curing and properties of epoxy adhesive used for bonding FRP composite sheet to concrete. J. Appl. Polym. Sci. 2003, 92, 2261–2268. [Google Scholar] [CrossRef]
- Anagnostopoulos, C.A.; Hadjispyrou, S. Laboratory study of an epoxy resin grouted sand. Proc. Inst. Civ. Eng.: Ground Improv. 2004, 8, 39–45. [Google Scholar] [CrossRef]
- Al-Khanbashi, A.; Abdala, S.W. Evaluation of three waterborne polymers as stabilizers for sandy soil. Geotech. Geol Eng. 2006, 24, 1603–1625. [Google Scholar] [CrossRef]
- Anagnostopoulos, C.A.; Kandiliotis, P.; Lola, M.; Karavatos, S. Improving properties of sand using epoxy resin and electrokinetics. Geotech. Geol. Eng. 2014, 32, 859–872. [Google Scholar] [CrossRef]
- Anagnostopoulos, C.A. Strength properties of an epoxy resin and cement-stabilized silty clay soil. Appl. Clay Sci. 2015, 114, 517–529. [Google Scholar] [CrossRef]
- Anagnostopoulos, C.A.; Sapidis, G. Mechanical behaviour of epoxy resin-grouted sand under monotonic or cyclic loading. Geotech. Lett. 2017, 7, 298–303. [Google Scholar] [CrossRef]
- Halabian, A.M.; Shakibzadeh, A.; Rowshan, Z.M.A. The static and dynamic behavior of sands grouted with amino-based resin. Proc. Inst. Civ. Eng.: Ground Improv. 2018, 171, 21–37. [Google Scholar]
- Ghasemzadeh, H.; Mehrpajouh, A.; Pishvaei, M. Laboratory analyses of kaolinite stabilized by vinyl polymers with different monomer types. Eng. Geol. 2021, 280, 105938. [Google Scholar] [CrossRef]
- Anagnostopoulos, C.A.; Dimitriadi, M.; Konstantinidis, D. Static and cyclic behavior of epoxy resin and bentonite-grouted sands. Transp. Geotech. 2022, 33, 100725. [Google Scholar] [CrossRef]
- Anagnostopoulos, C.A. Effect of different superplasticisers on the physical and mechanical properties of cement grouts. Constr. Build. Mater. 2014, 50, 162–168. [Google Scholar] [CrossRef]
- Neithalath, N.; Weiss, J.; Olek, J. Characterizing enhanced porosity concrete using electrical impedance to predict acoustic and hydraulic performance. Cem. Concr. Res. 2006, 36, 2074–2085. [Google Scholar] [CrossRef]
- Powers, D.A. Interaction of water with epoxy. U.S. Department of Energy’s National Nuclear Security Administration, New Mexico, 2009, Sandia Report, SAND2009-4405.
- Consoli, N.C.; Foppa, D.; Festugato, L.; Heineck, K.S. Key parameters for strength control of artificially cemented soils. J. Geotech. Geoenvironmental Eng. 2007, 133, 197–205. [Google Scholar] [CrossRef]
- Markou, I.; Droudakis, A. Factors affecting engineering properties of microfine cement grouted sands. Geotech. Geol. Eng. 2013, 31, 1041–1058. [Google Scholar] [CrossRef]
- Avci, E.; Mollamahmutoğlu, M. UCS properties of superfine cement–grouted sand. J. Mater. Civ. Eng. 2016, 28, 06016015. [Google Scholar] [CrossRef]
- Doherty, P.; Spagnoli, G.; Doherty, M. Laboratory investigations to assess the feasibility of employing a novel mixed-in-place offshore pile in calcareous deposits. Ships Offshore Struct. 2020, 15, 29–38. [Google Scholar] [CrossRef]
- Jafarian, Y.; Javdanian, H. Dynamic Properties of Calcareous Sand from the Persian Gulf in Comparison with Siliceous Sands Database. Int. J. Civ. Eng. 2020, 18, 245–249. [Google Scholar] [CrossRef]
- Cui, M.J.; Zheng, J.J.; Chu, J.; Wu, C.C.; Lai, H.J. Bio-mediated calcium carbonate precipitation and its effect on the shear behaviour of calcareous sand. Acta Geotech. 2021, 16, 1377–1389. [Google Scholar] [CrossRef]
- Hamidi, S.; Marandi, S.M. Clay concrete and effect of clay minerals types on stabilized soft clay soils by epoxy resin. Appl. Clay Sci. 2018, 151, 92–101. [Google Scholar] [CrossRef]
- Ata, A.; Vipulanandan, C. Factors affecting mechanical and creep properties of silicate-grouted sands. Geotech. Geol. Eng. 1999, 125, 868–876. [Google Scholar] [CrossRef]
- Ribay, E.D.; Maigre, I.D.; Cabrillac, R.; Gouvenot, D. Influence of grouts on unconfined creep behaviour of grouted Fontainebleau sand: experimental and primary creep modeling. Proc. Inst. Civ. Eng. Ground Improv. 2002, 6, 23–37. [Google Scholar] [CrossRef]
- Ribay, E.; Maigre, I.; Cabbrillac, R.; Gouvenot, D. Comparison of creep behavior and fatigue behavior of grouted sand. Soils and found. 2007, 47, 185–194. [Google Scholar] [CrossRef]
- Chen, Z.J.; Feng, W.Q.; Yin, J.H. A new simplified method for calculating short-term and long-term consolidation settlements of multi-layered soils considering creep limit. Comput. Geotech. 2021, 138, 104324. [Google Scholar] [CrossRef]
Figure 1.
Gradation curves of the used sands.
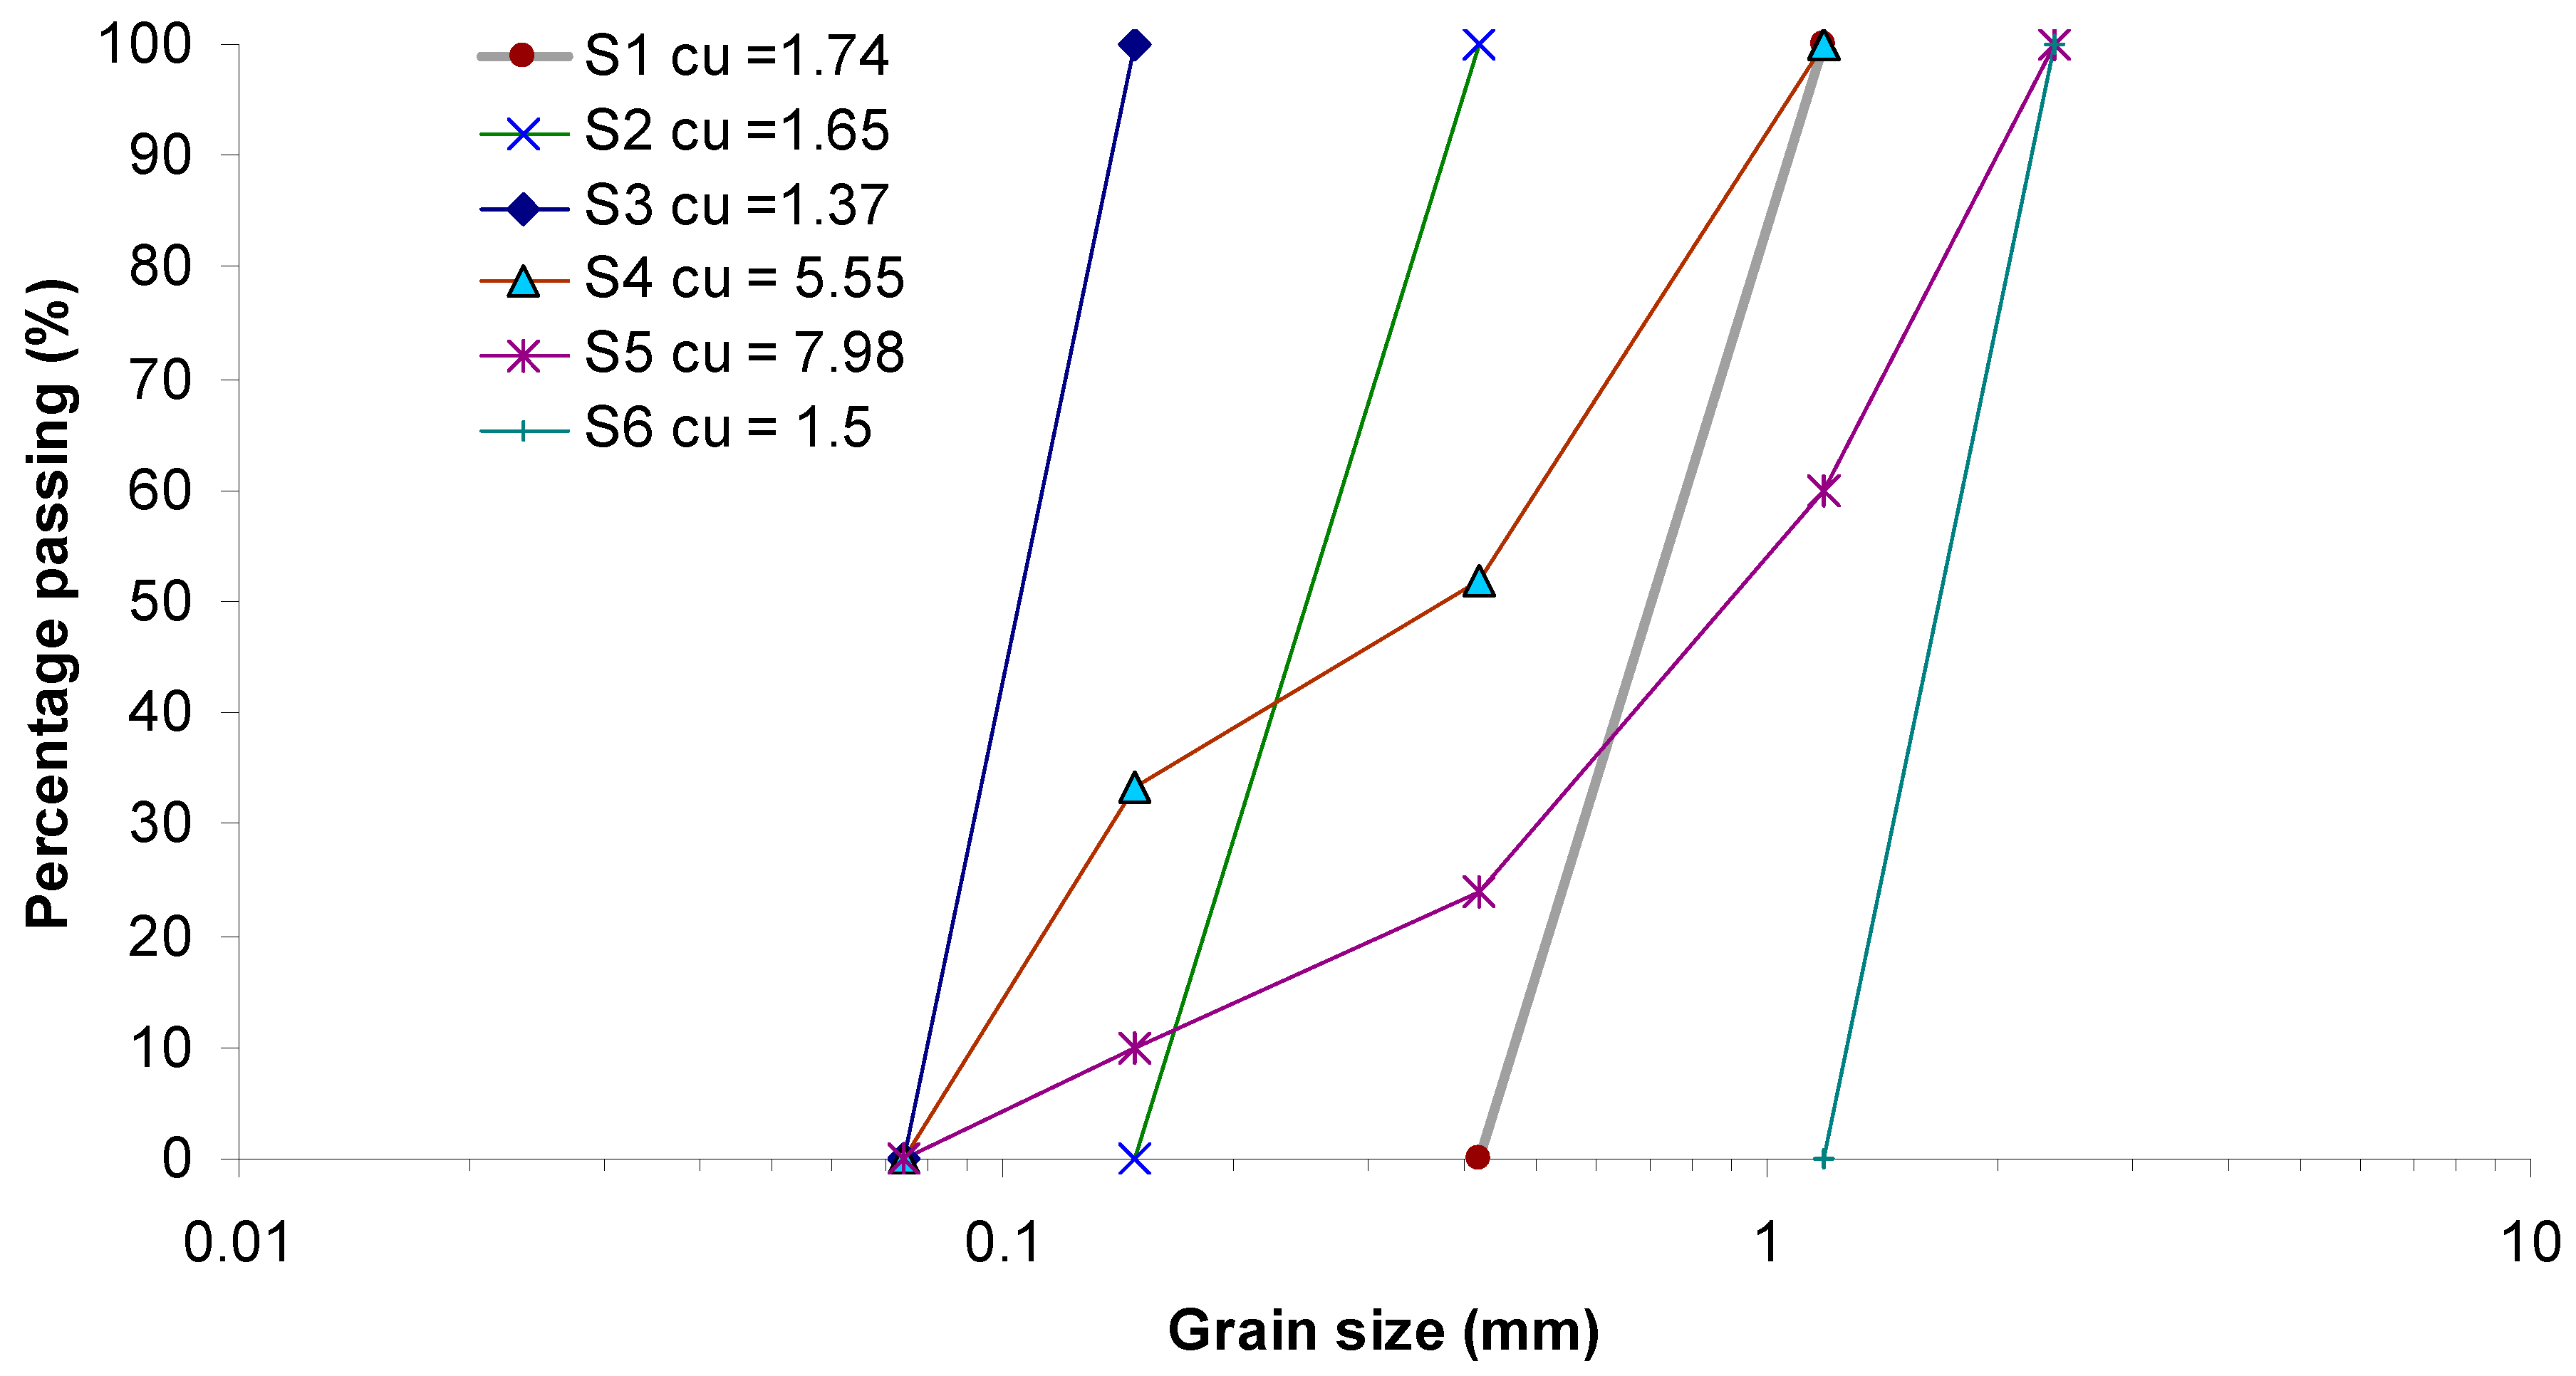
Figure 2.
Laboratory simulation of the grouting procedure.
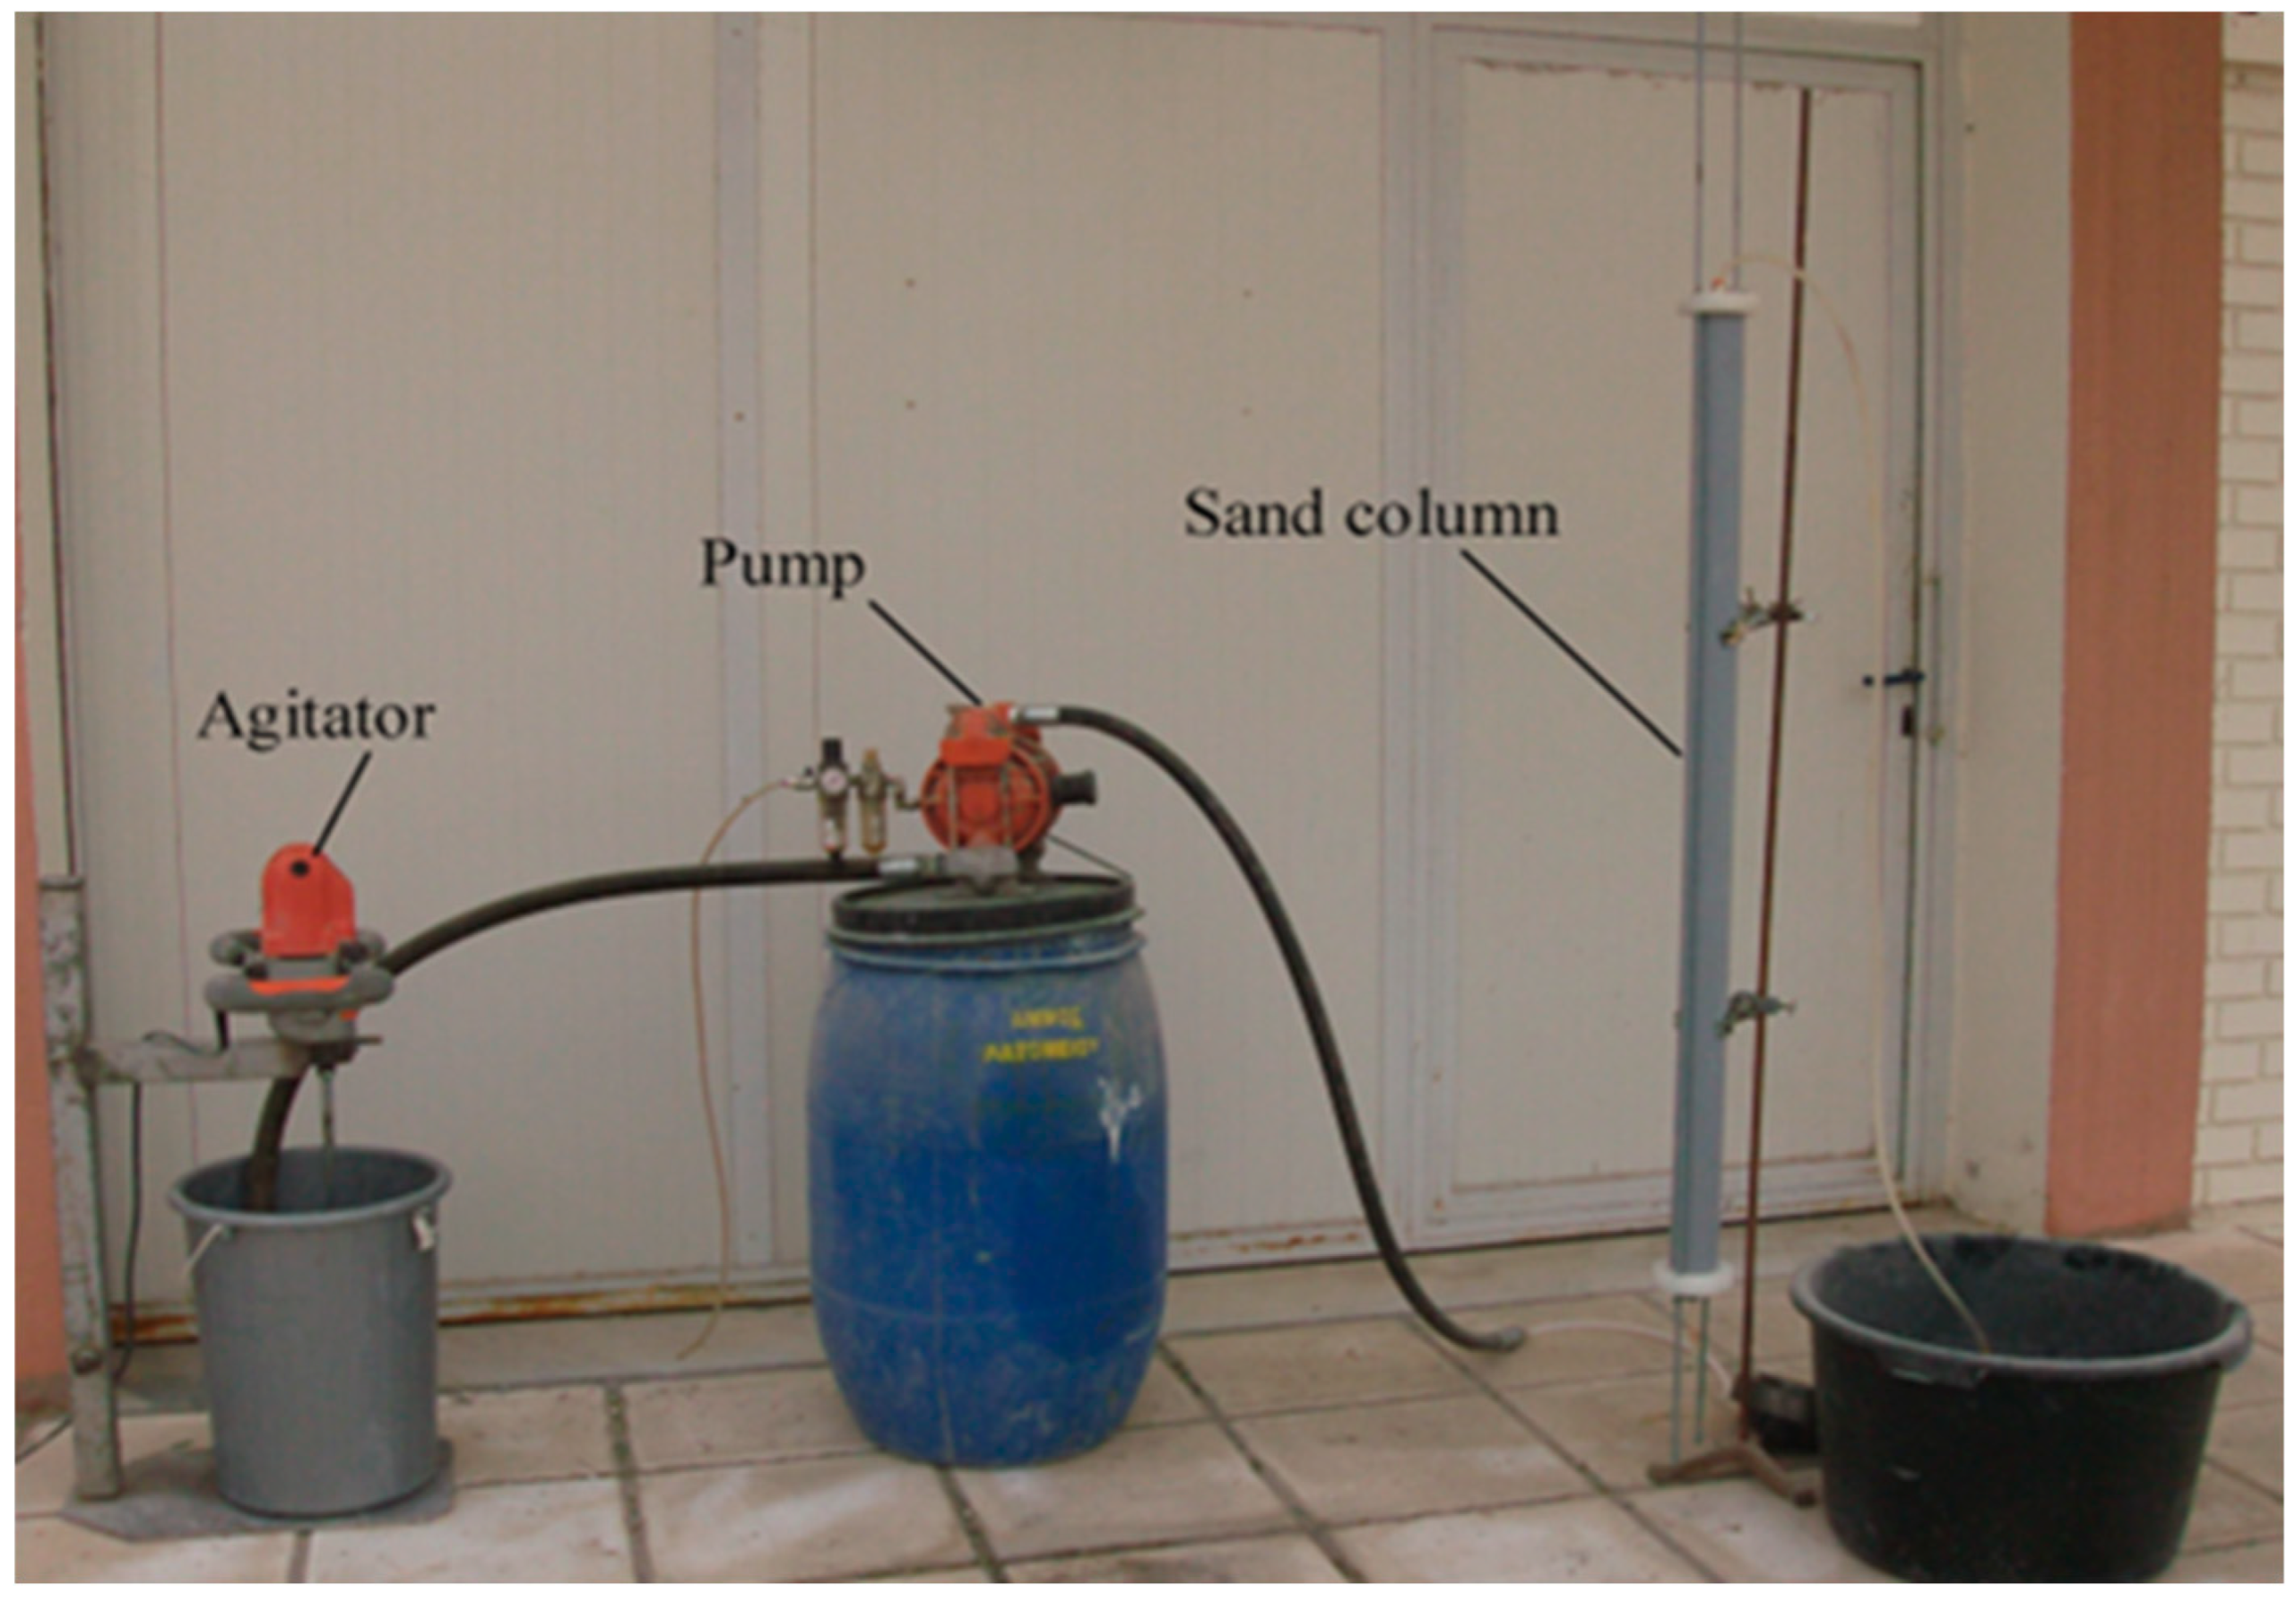
Figure 3.
(a) Machine for compression strength tests; and (b) unconfined compression strength test.
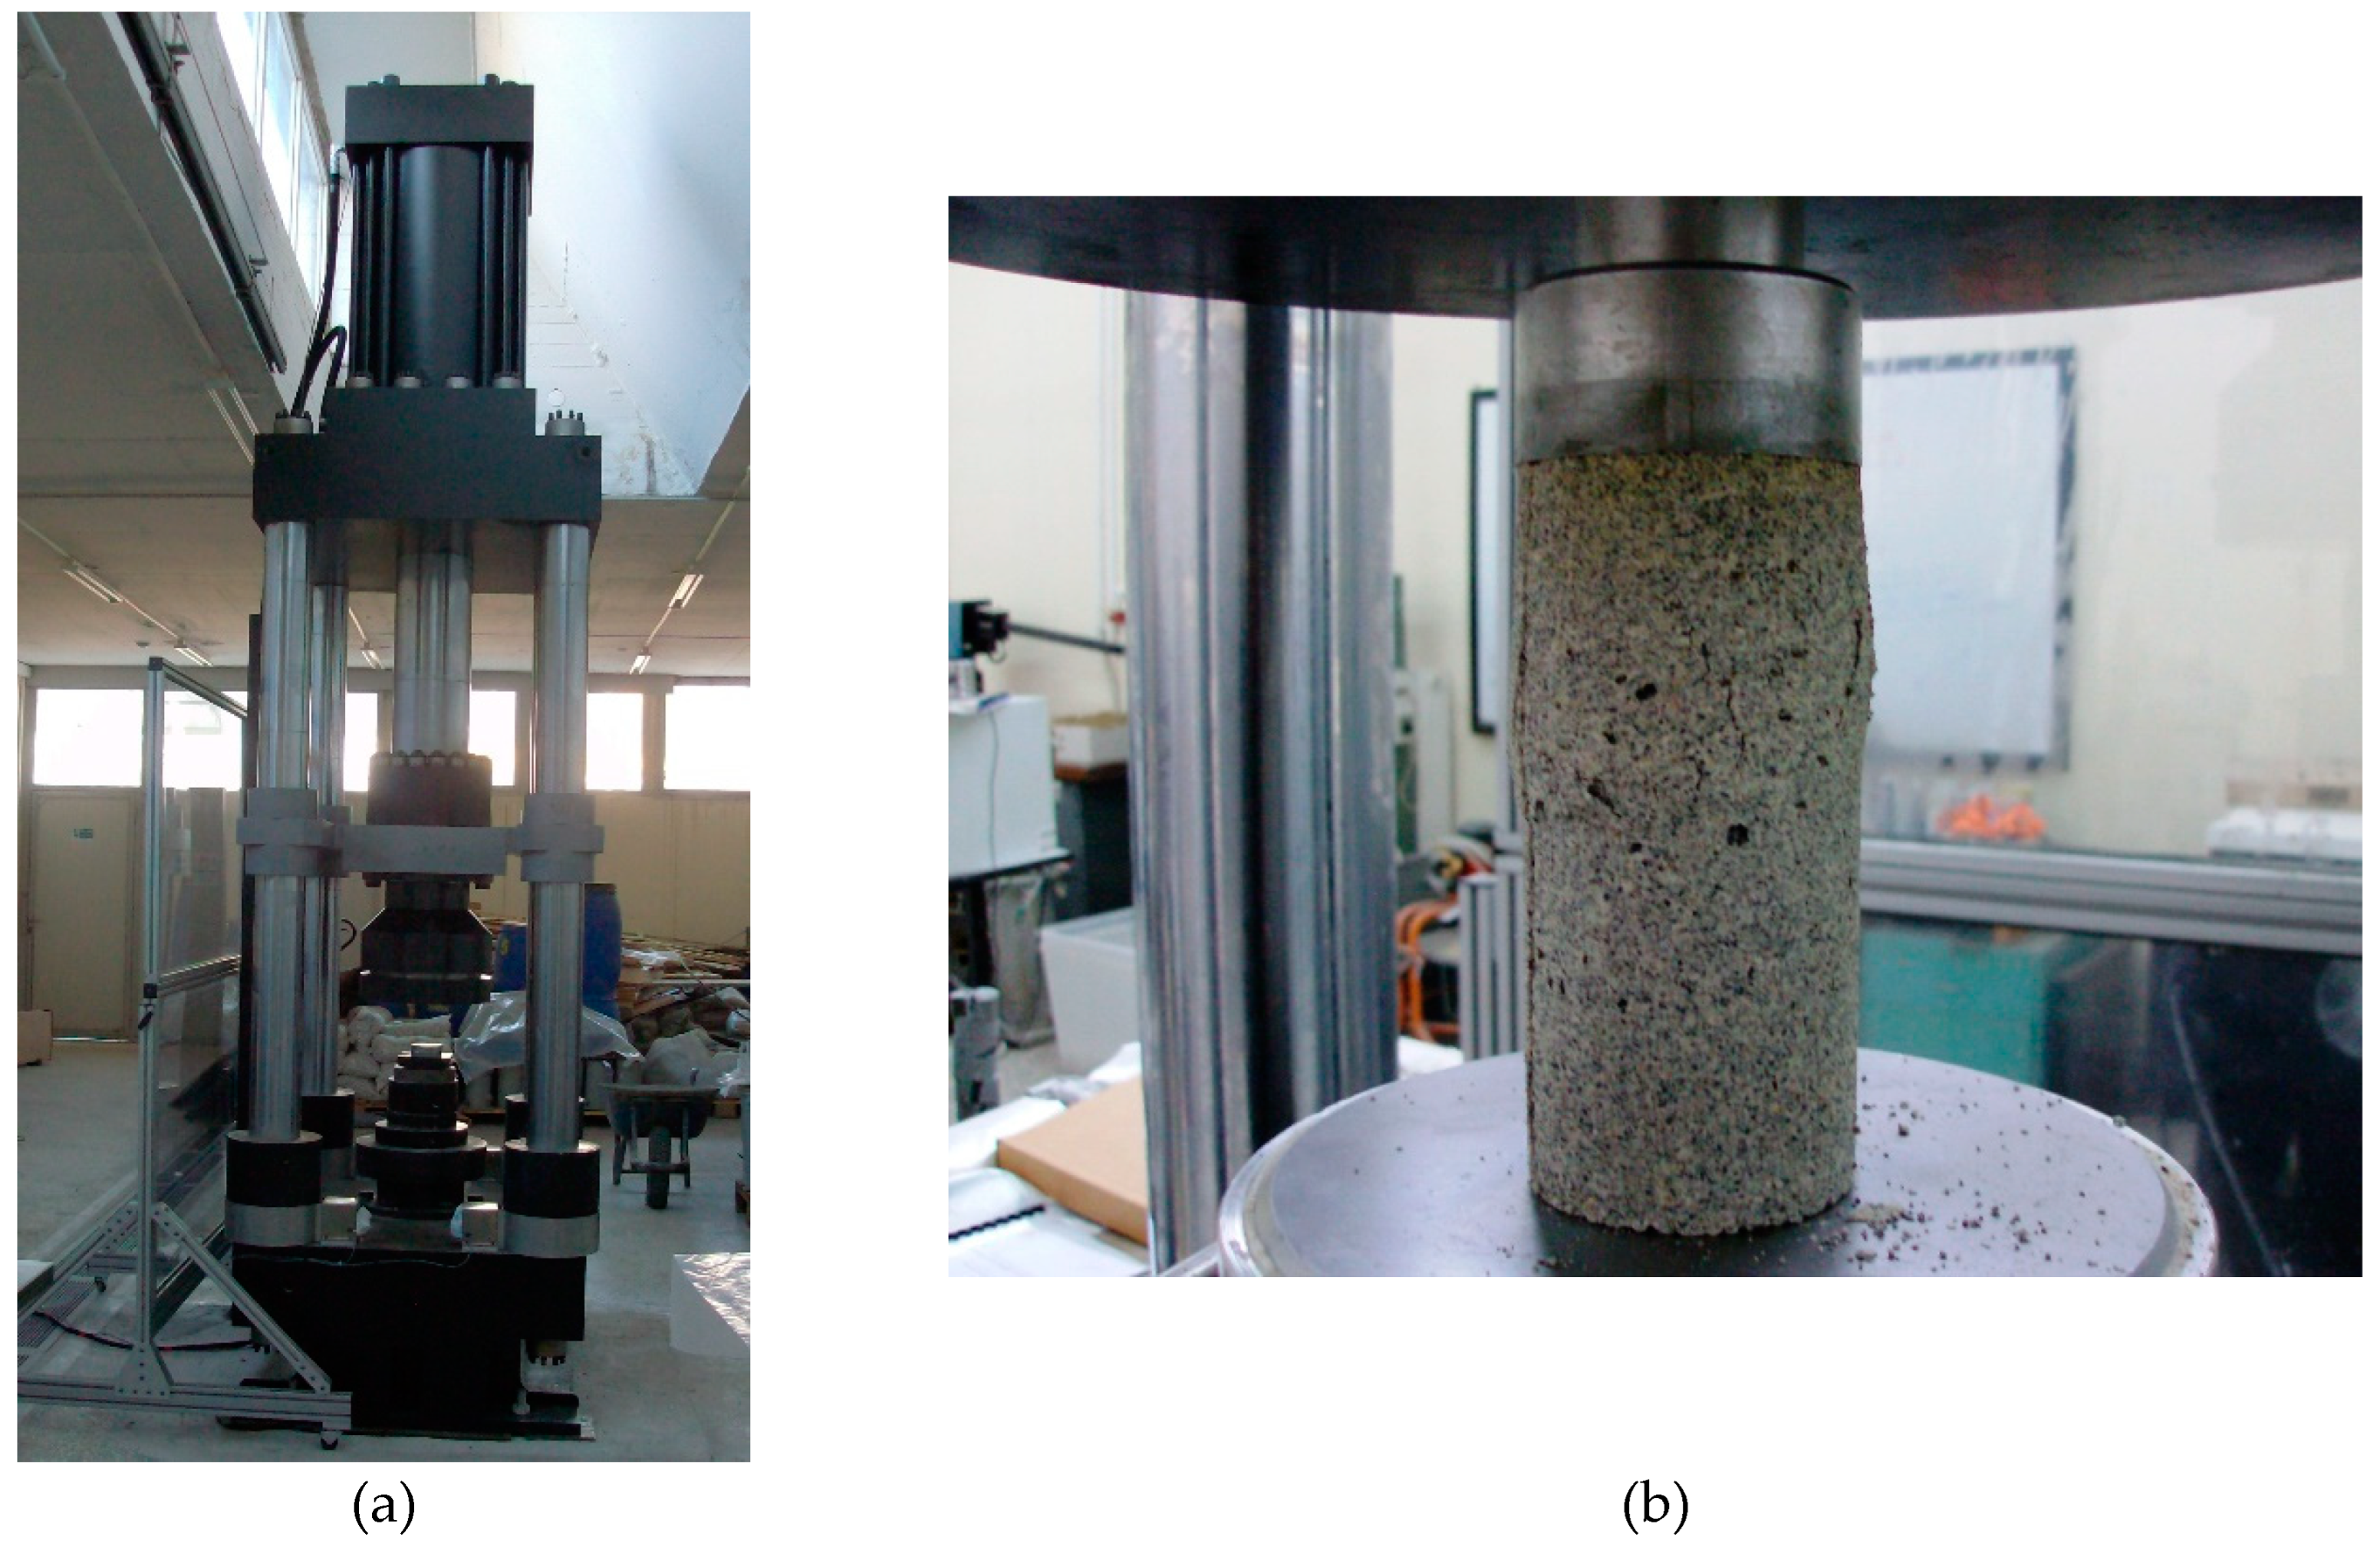
Figure 4.
Single lever consolidation apparatus for creep tests; (a) Dry conditions and (b) Wet conditions.
Figure 4.
Single lever consolidation apparatus for creep tests; (a) Dry conditions and (b) Wet conditions.
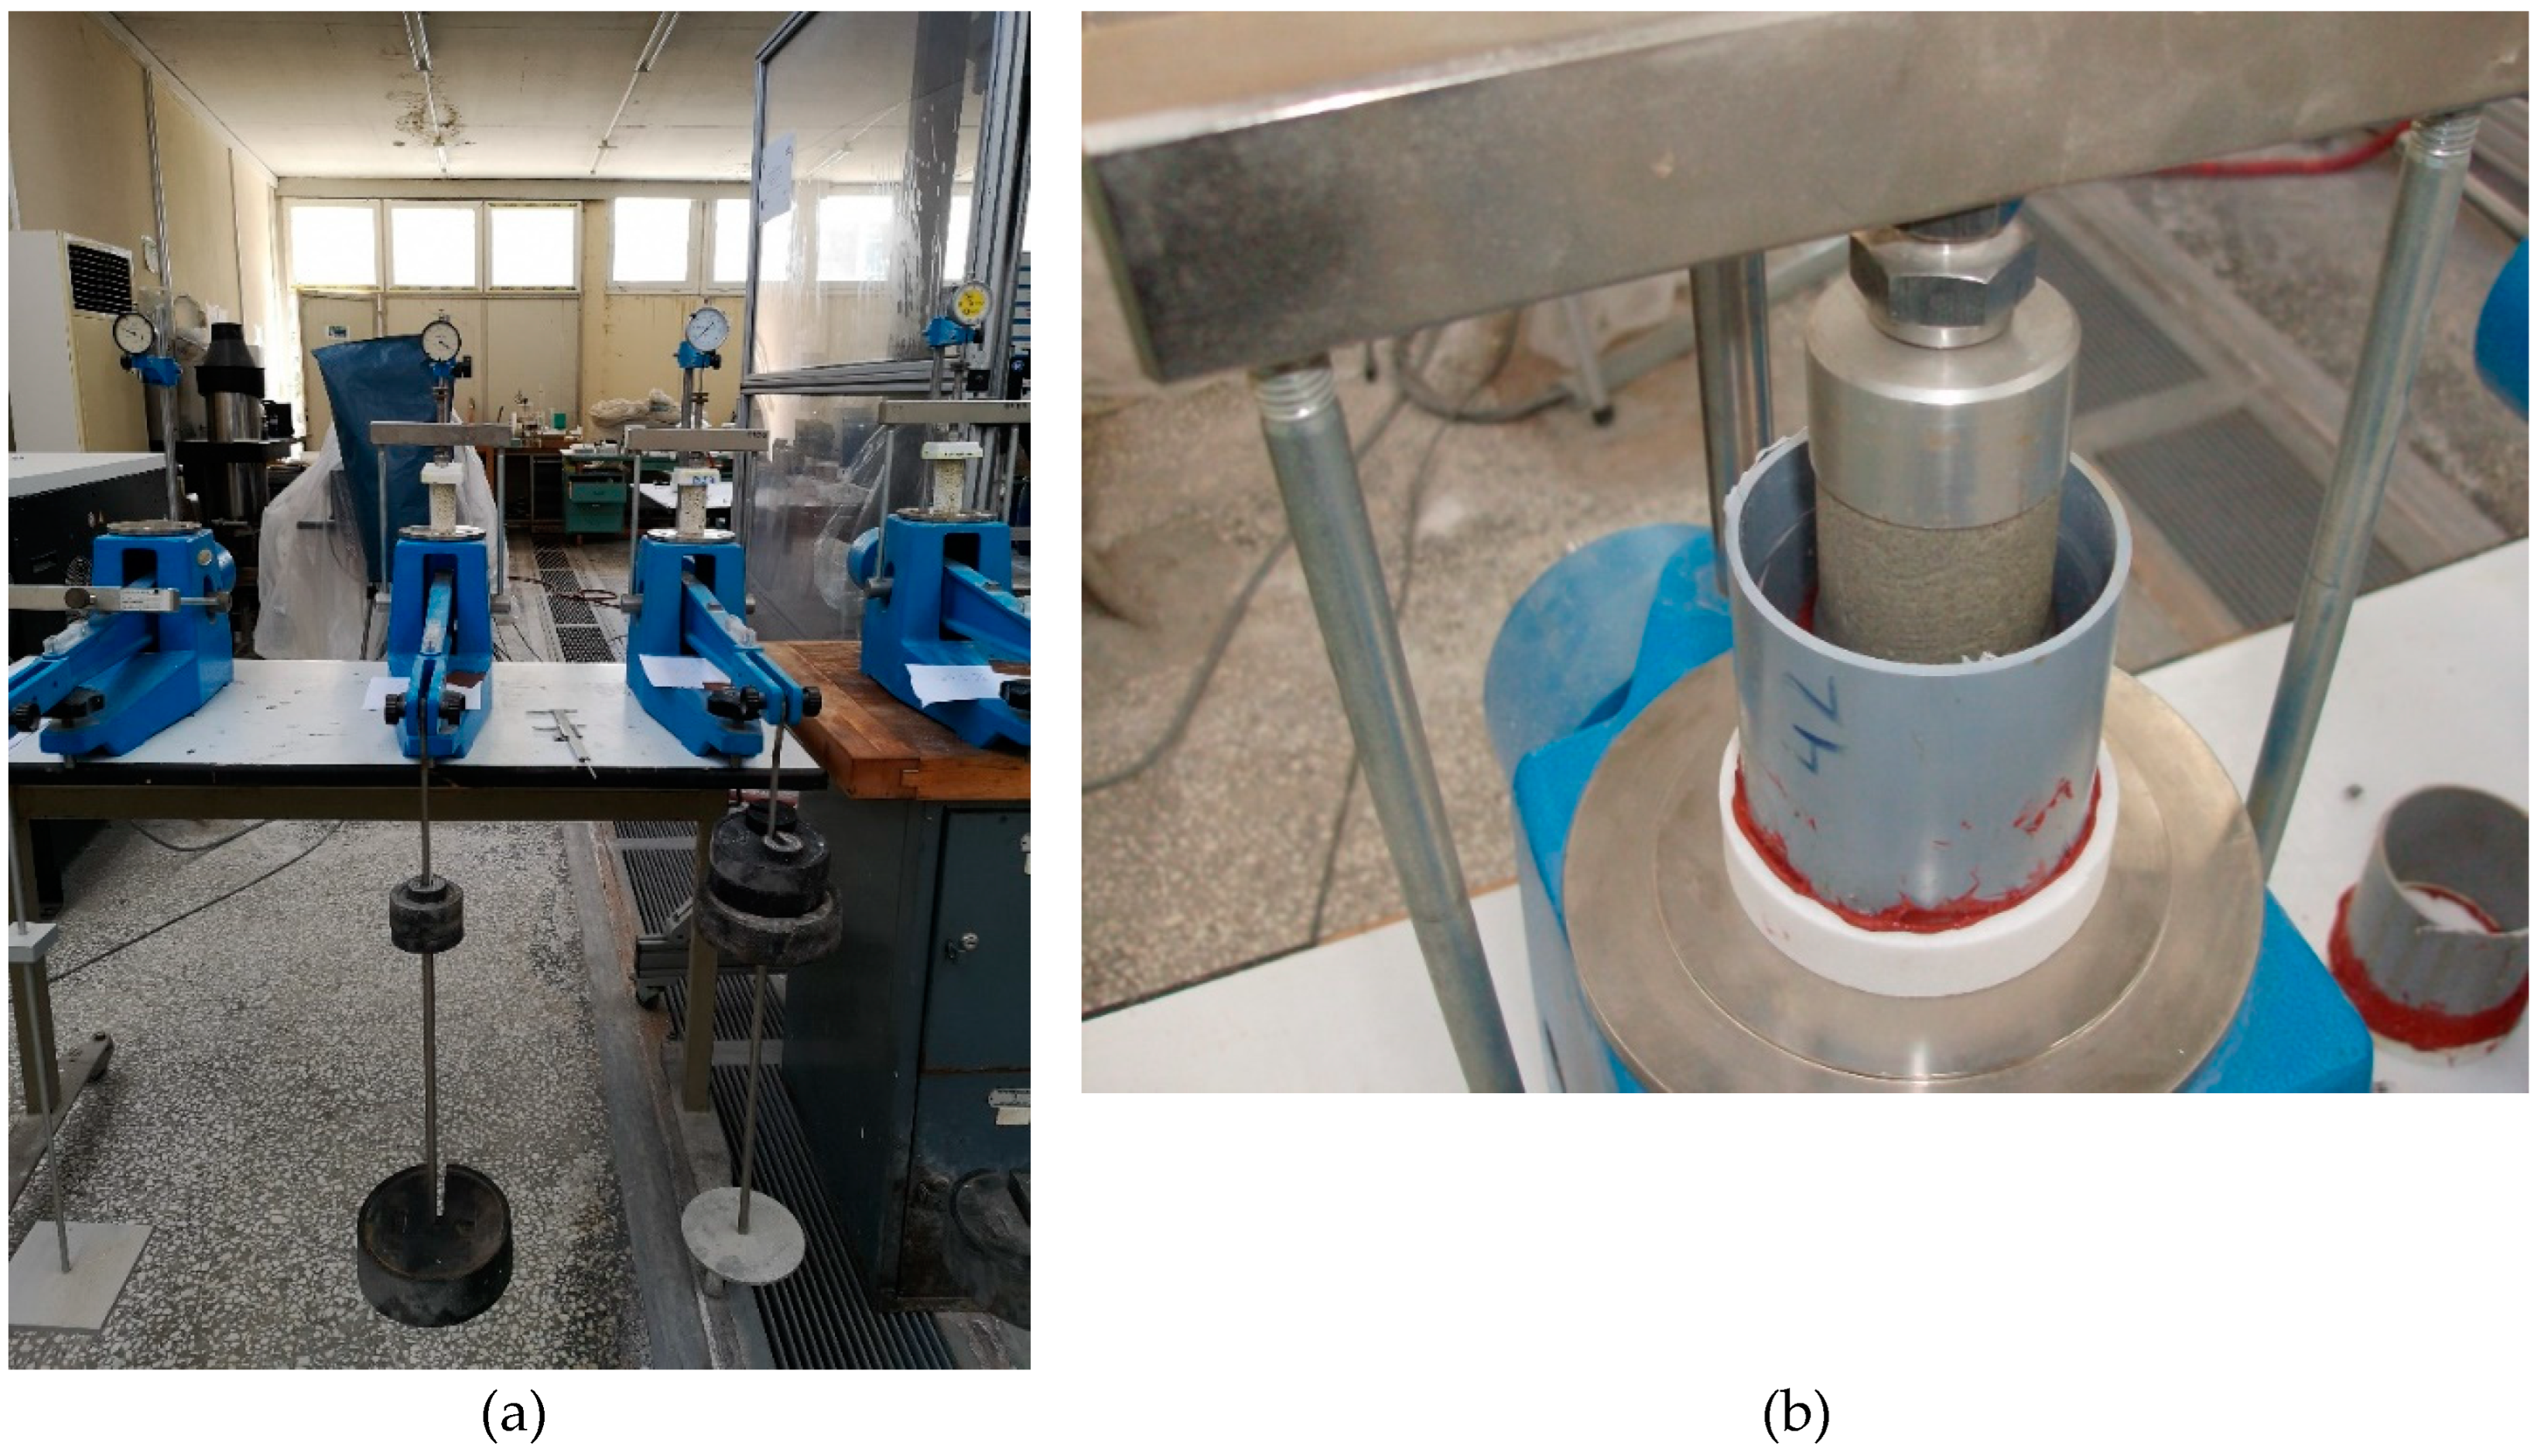
Figure 5.
Vacuum saturation device for porosity measurements of grouted sands.
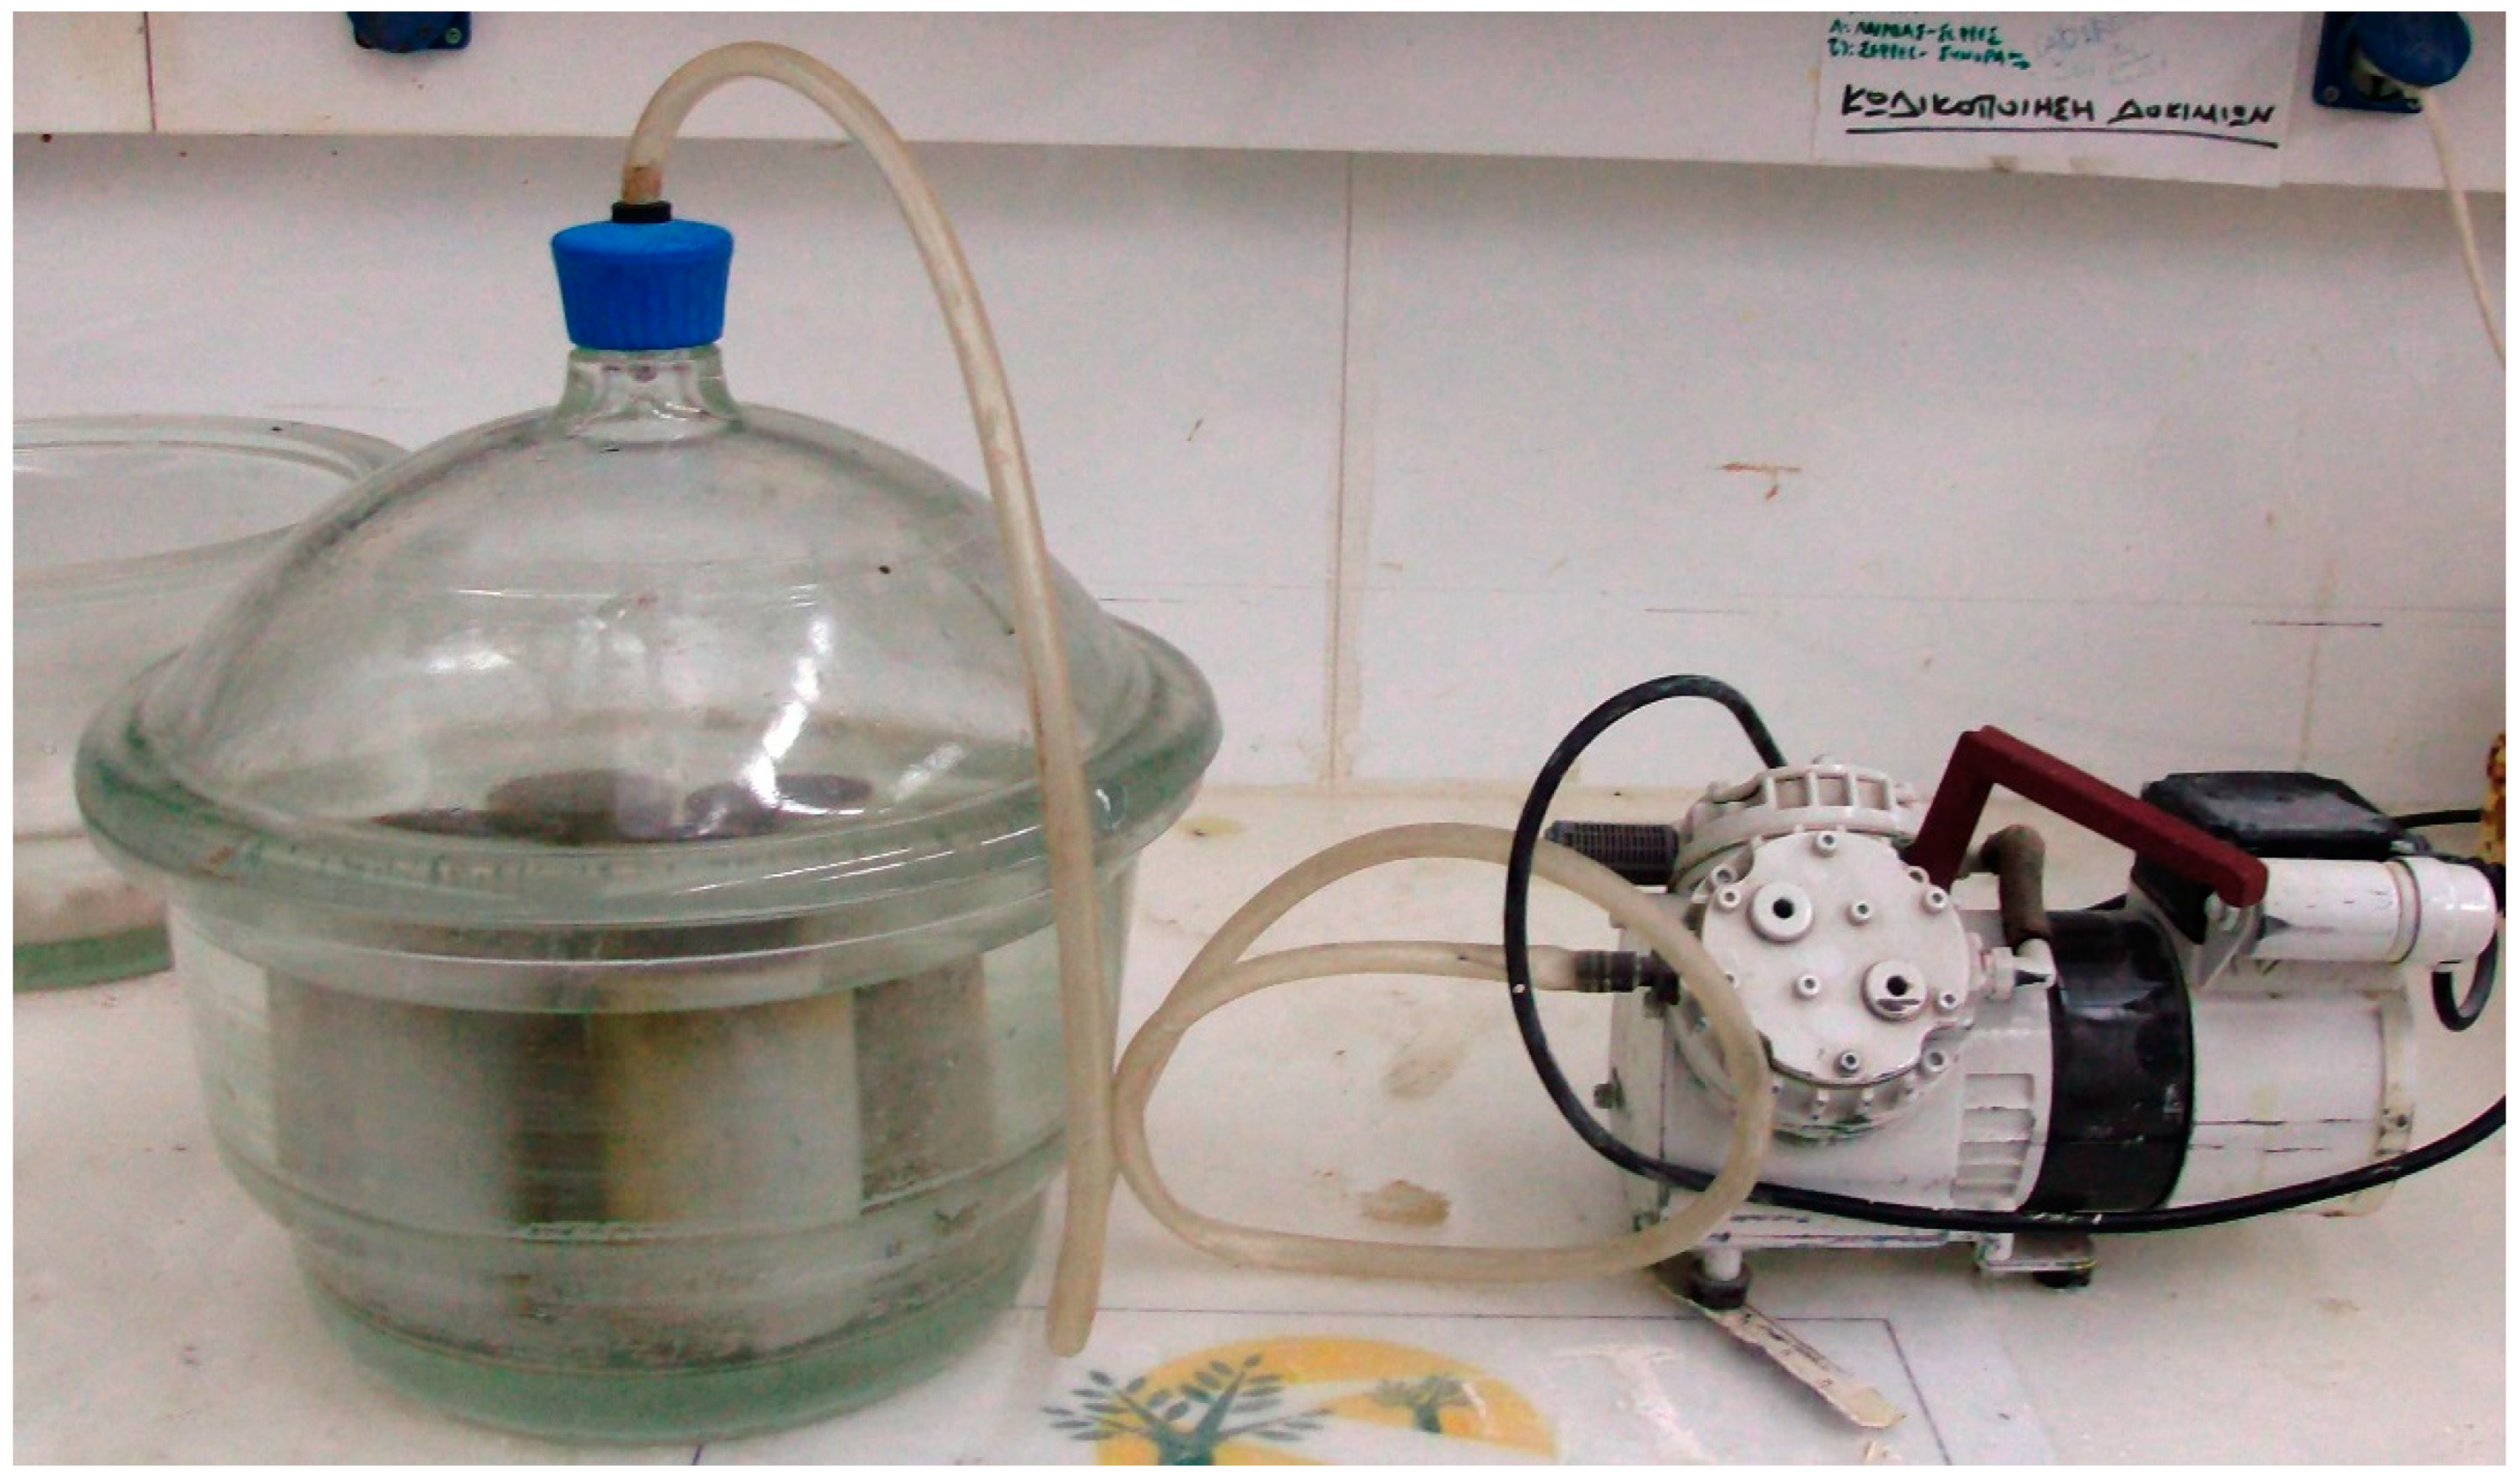
Figure 6.
Set-up for determination of permeability coefficient of pure sands.
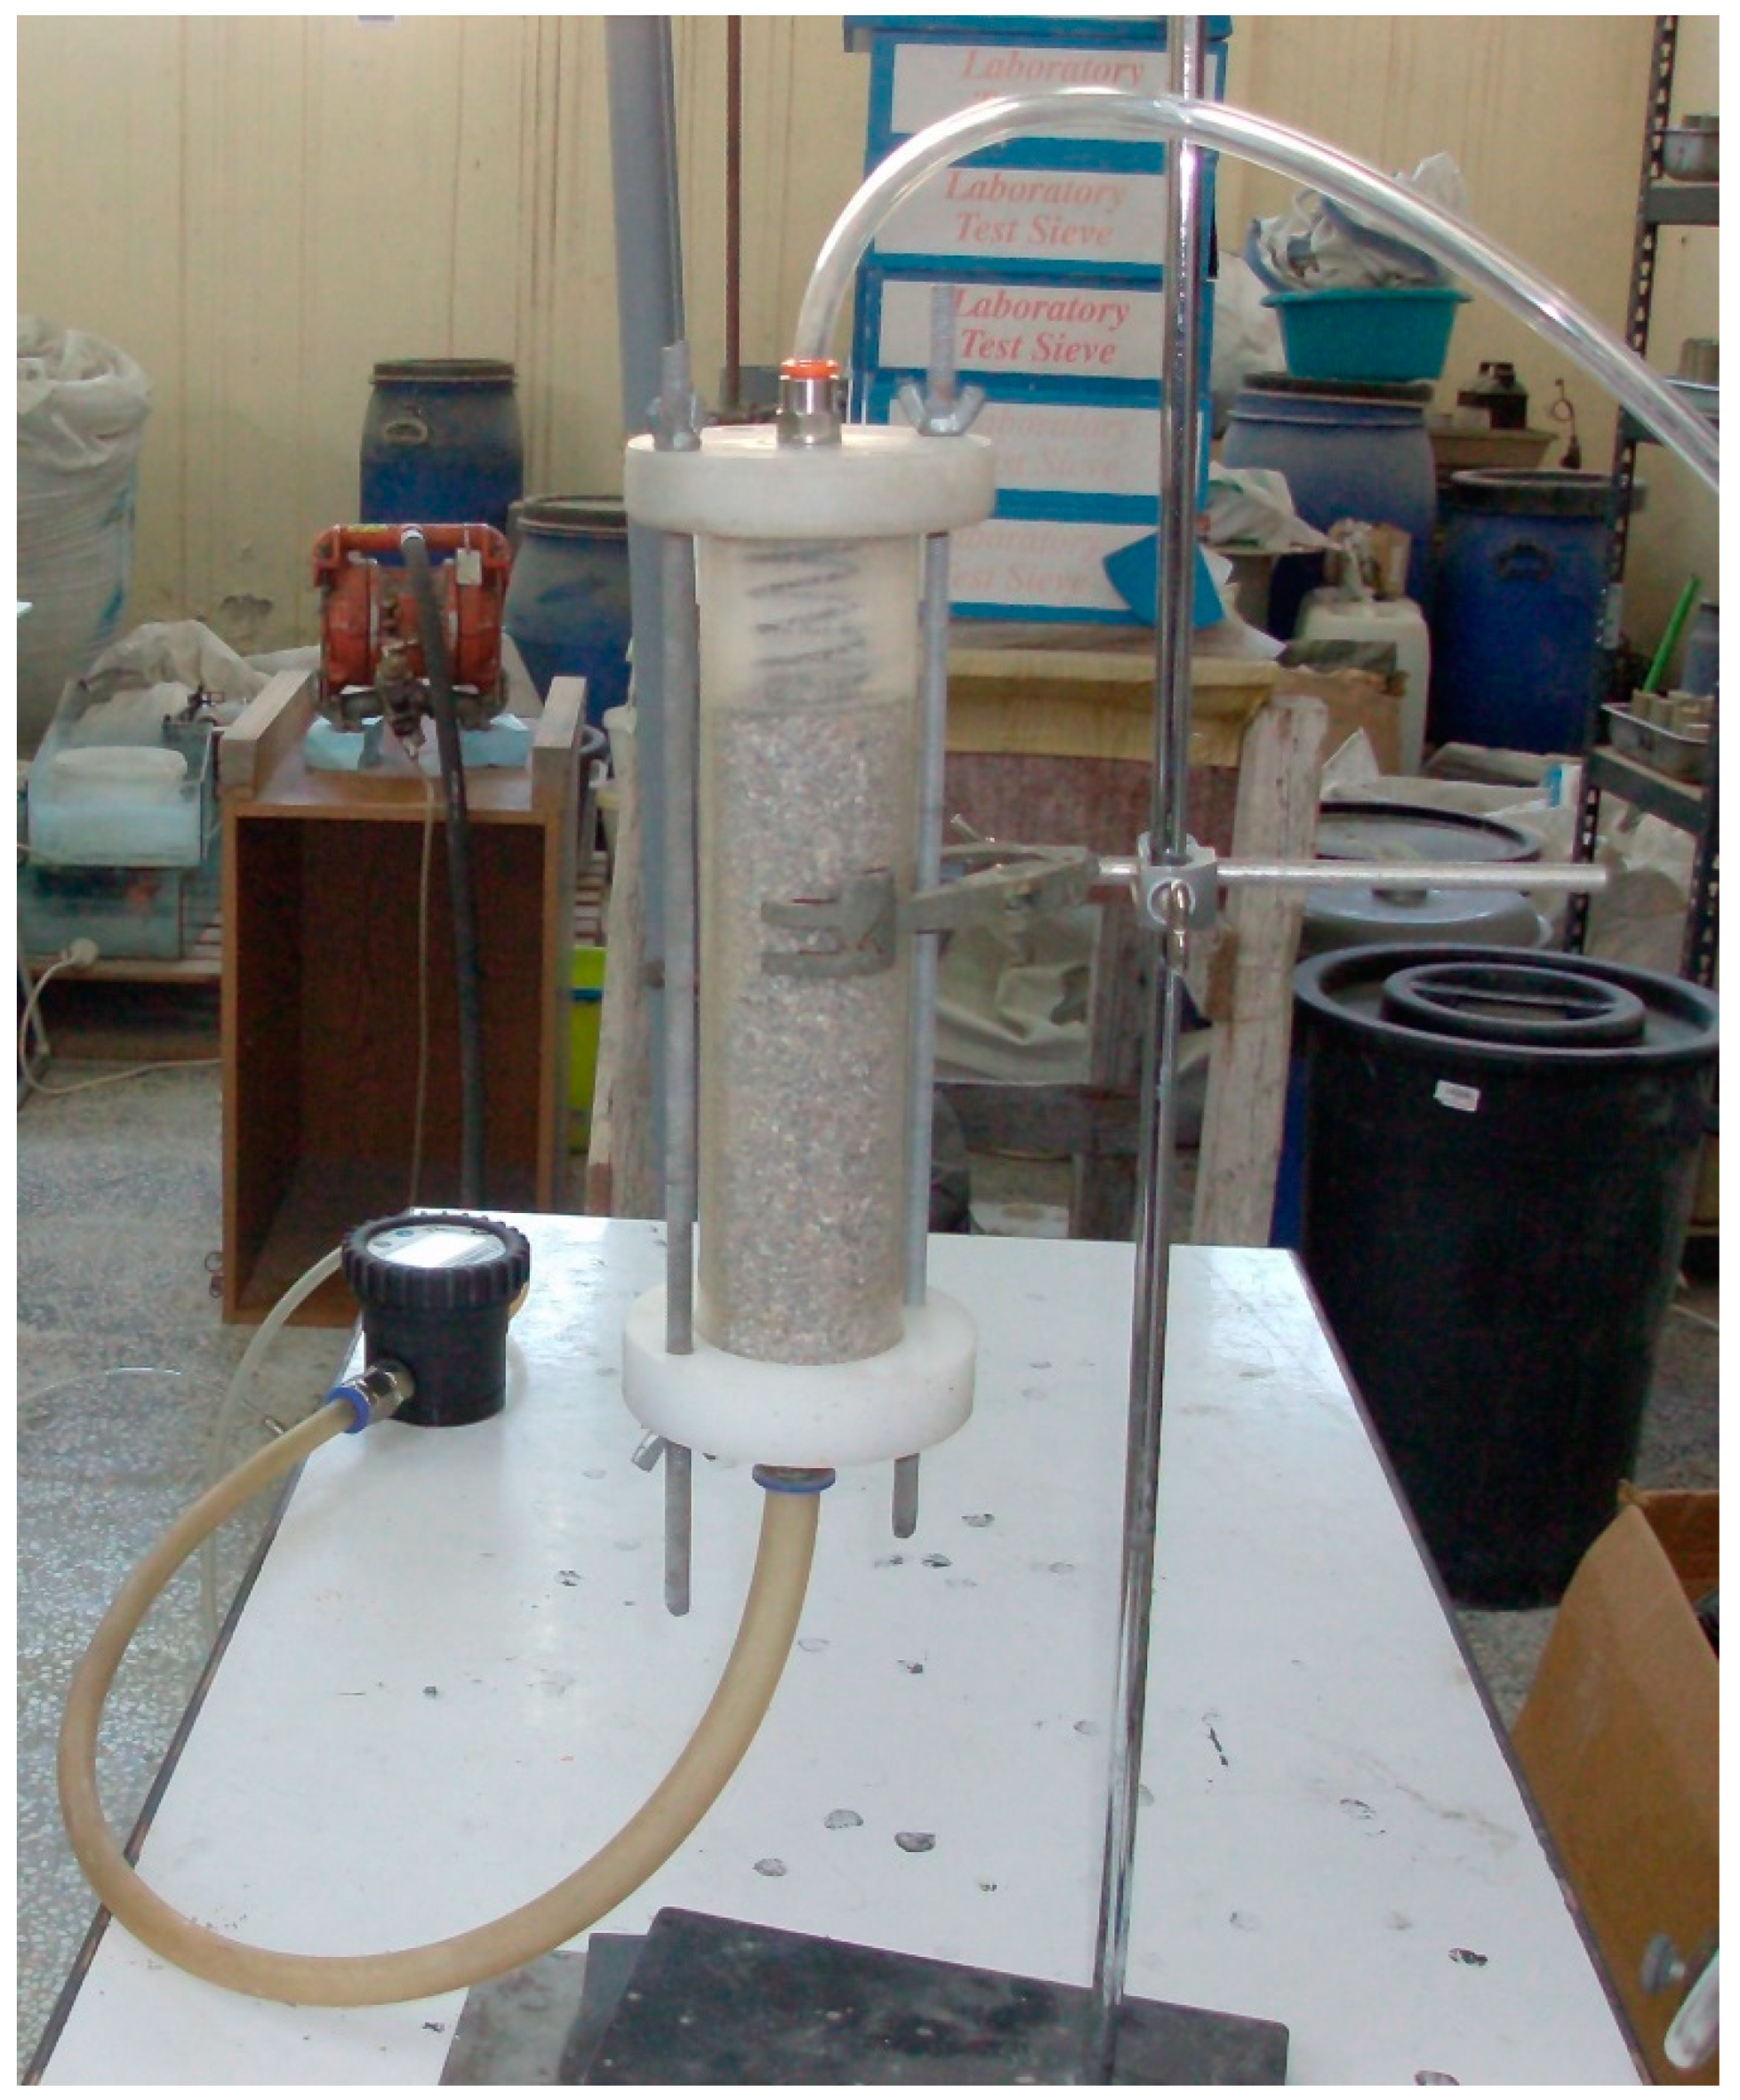
Figure 7.
Compressive strength vs. distance from injection point for S5 sand treated with grouts of ER/W ratio equal to 3.0 and 1.5.
Figure 7.
Compressive strength vs. distance from injection point for S5 sand treated with grouts of ER/W ratio equal to 3.0 and 1.5.
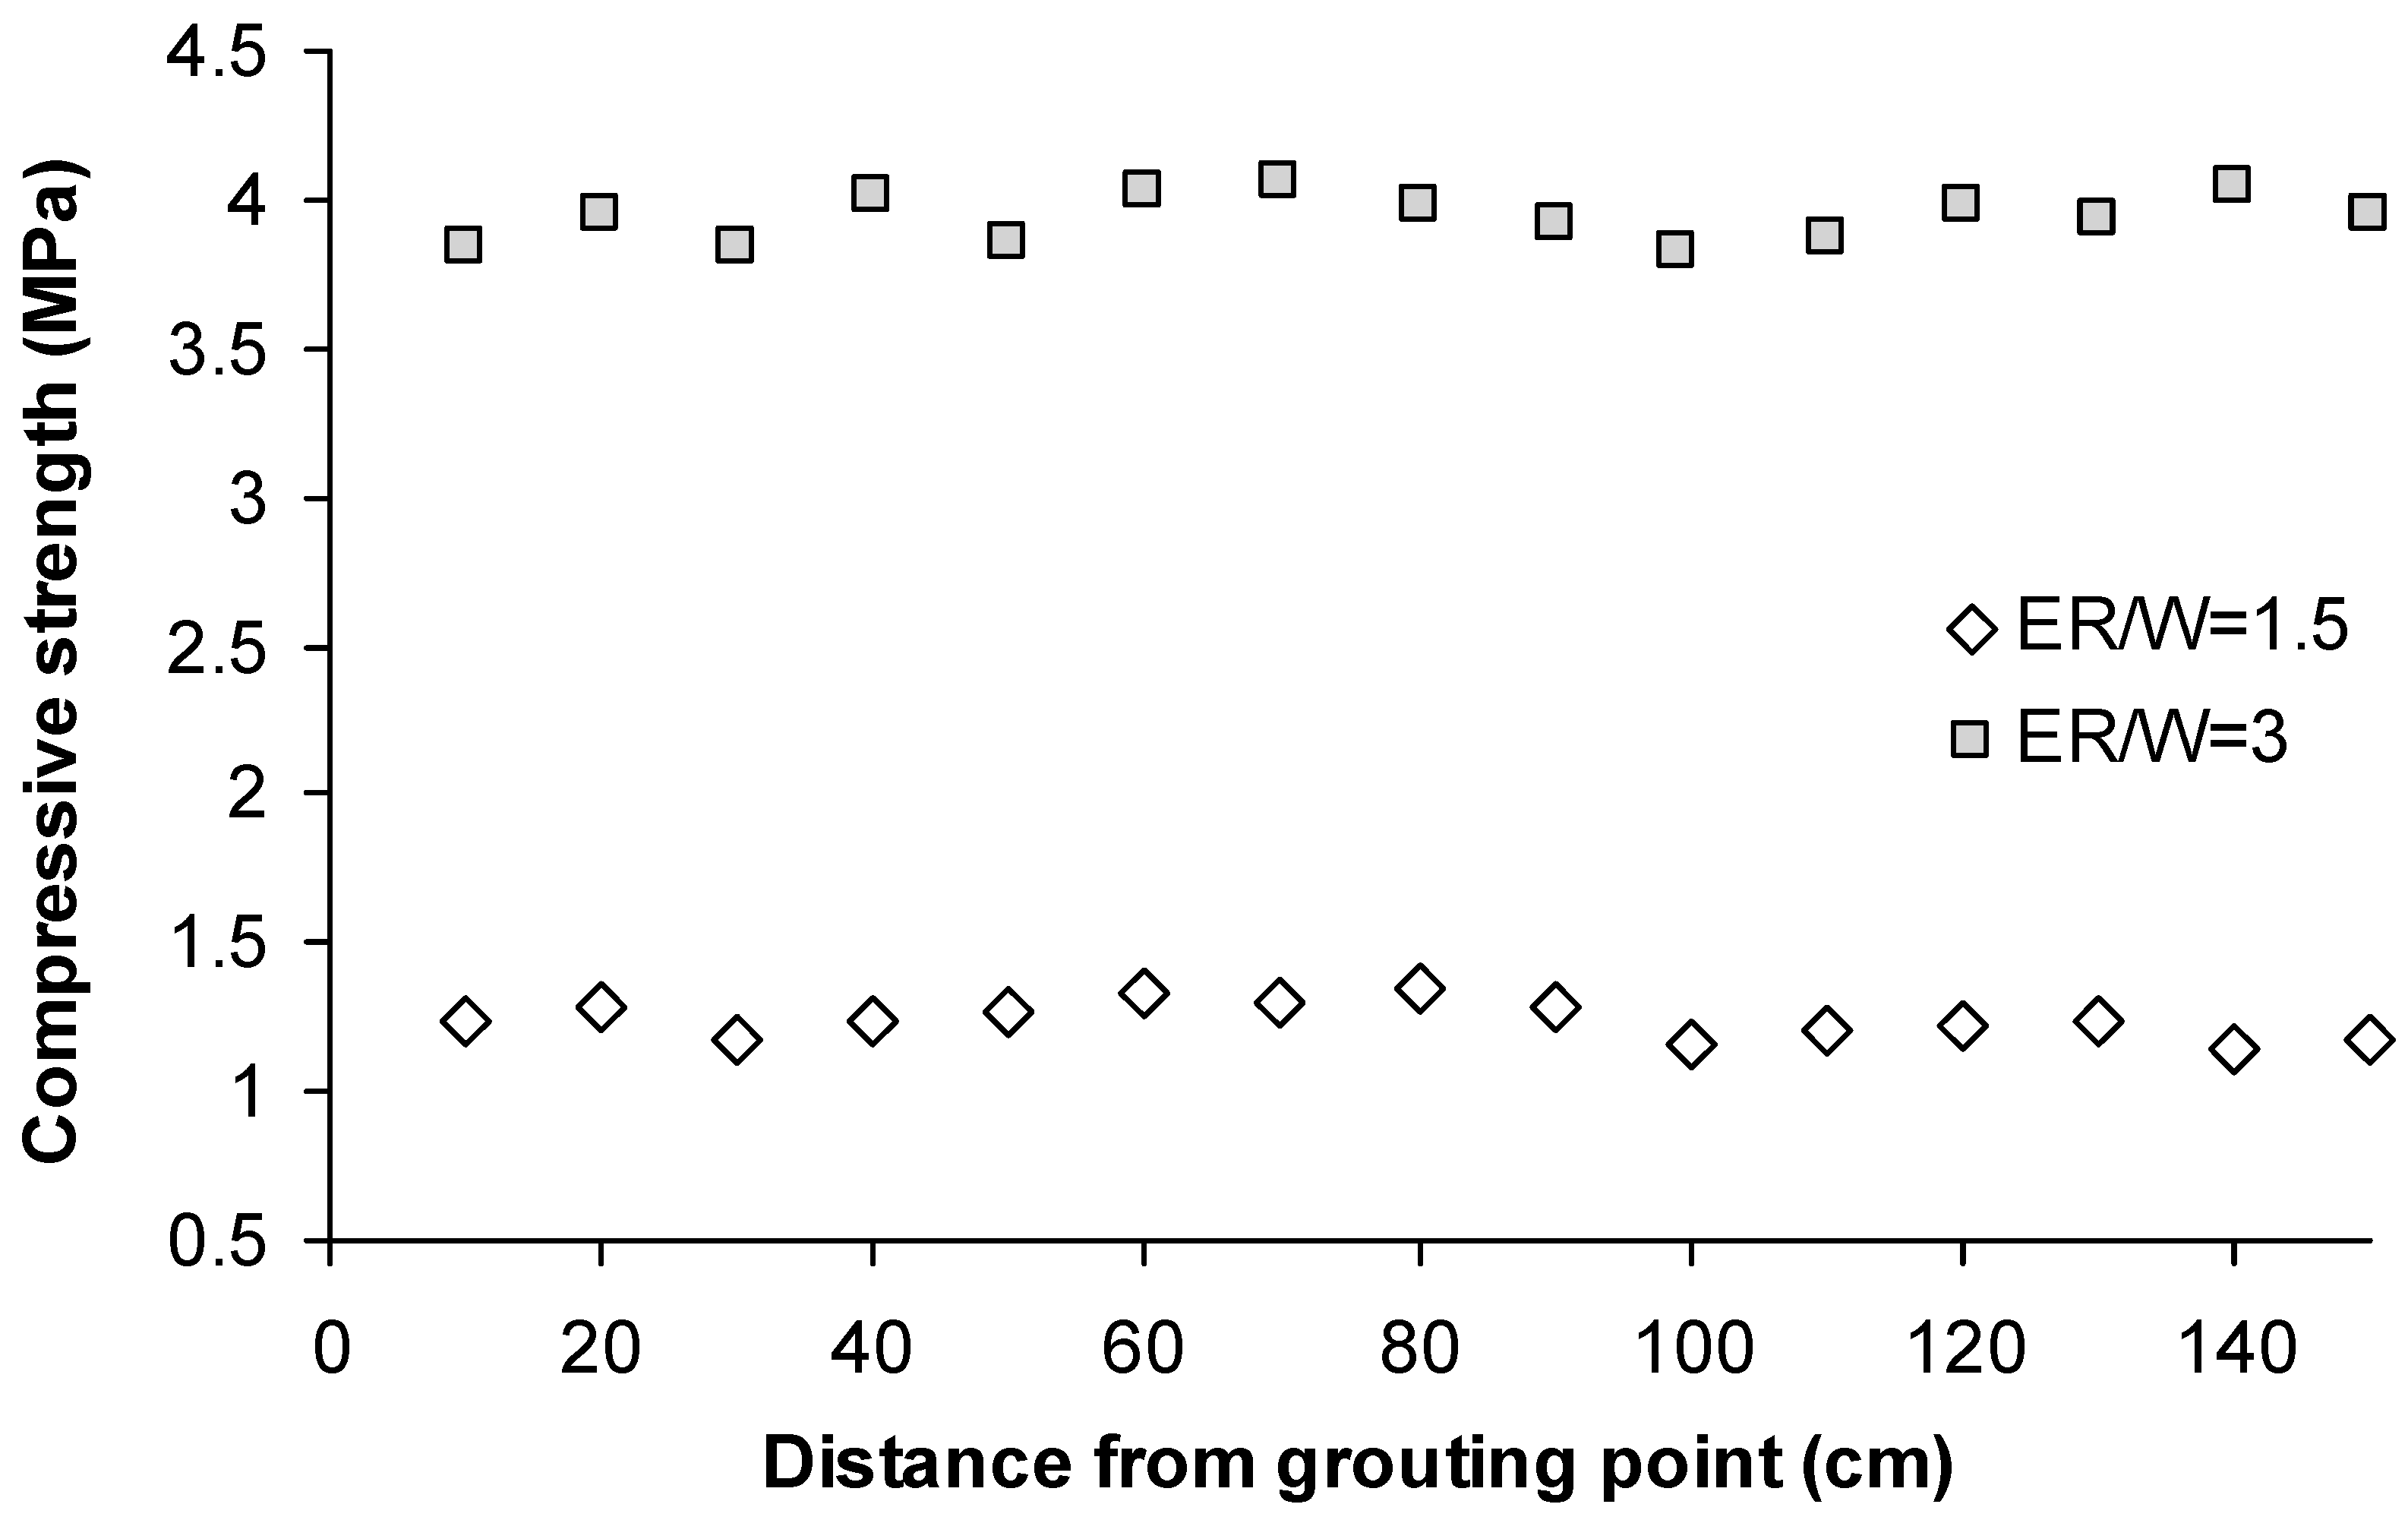
Figure 8.
(a)-(f) Development of compressive strength with time for treated sands with the different grouts.
Figure 8.
(a)-(f) Development of compressive strength with time for treated sands with the different grouts.
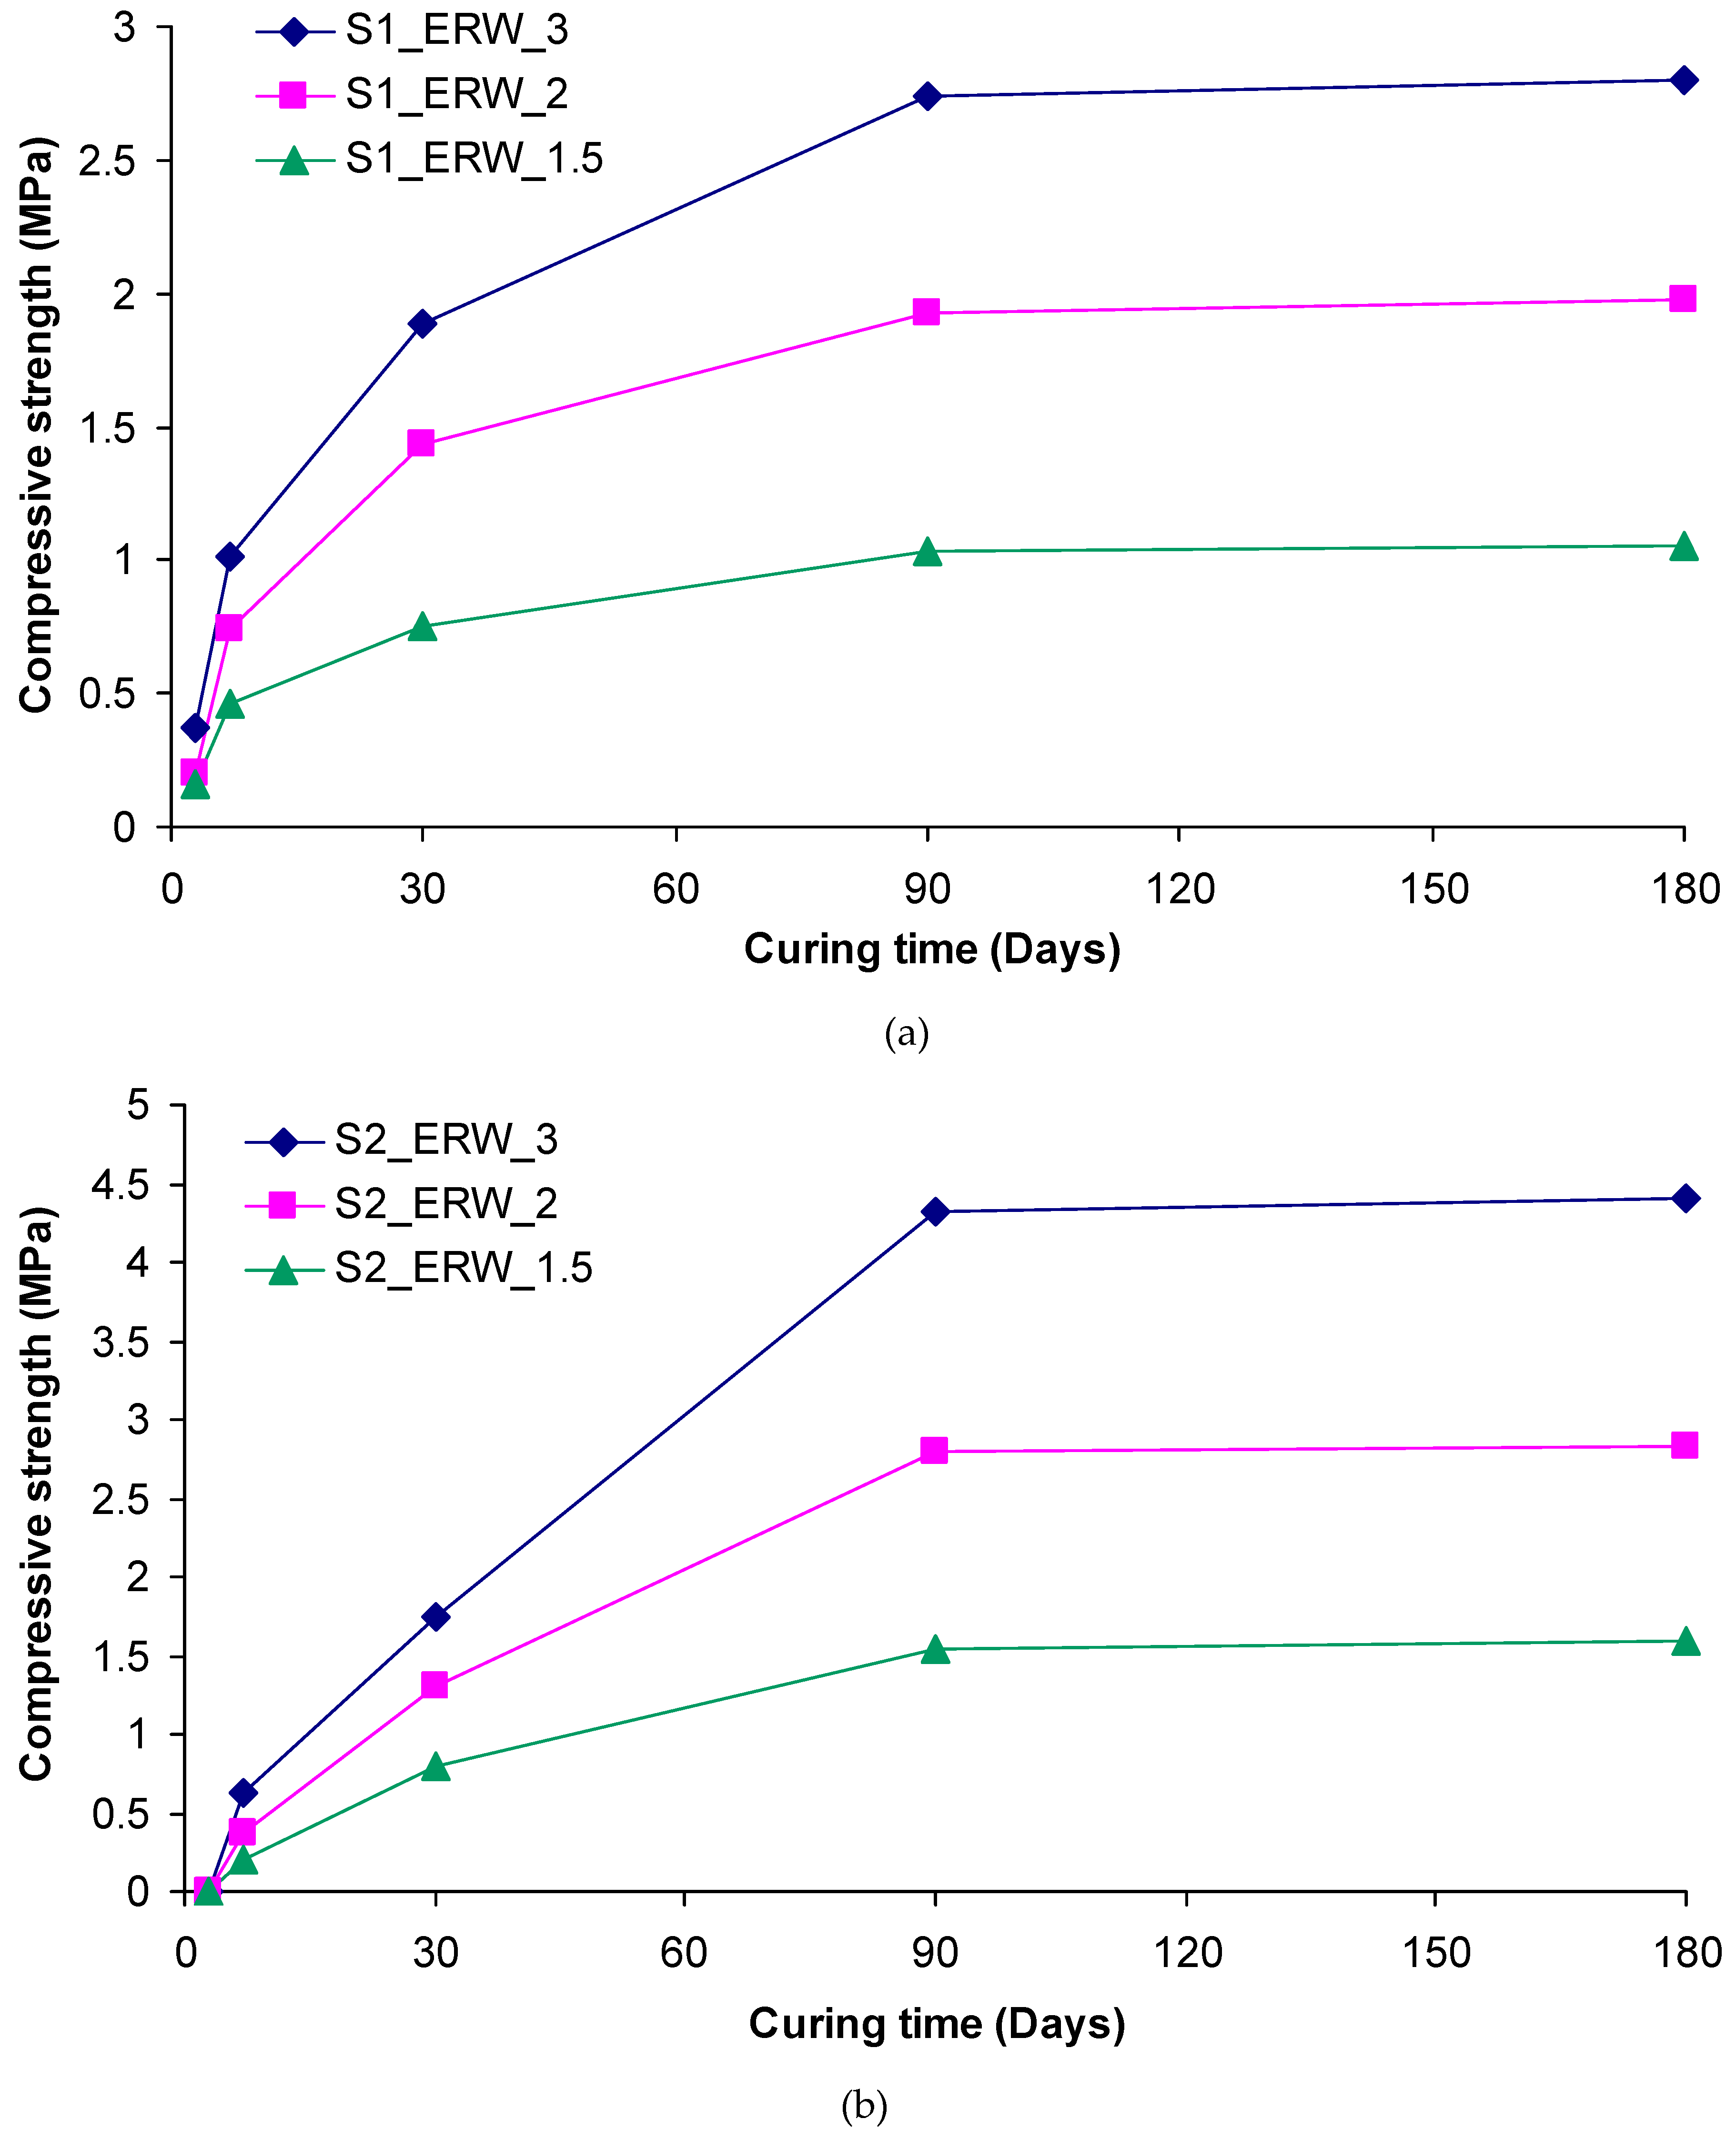
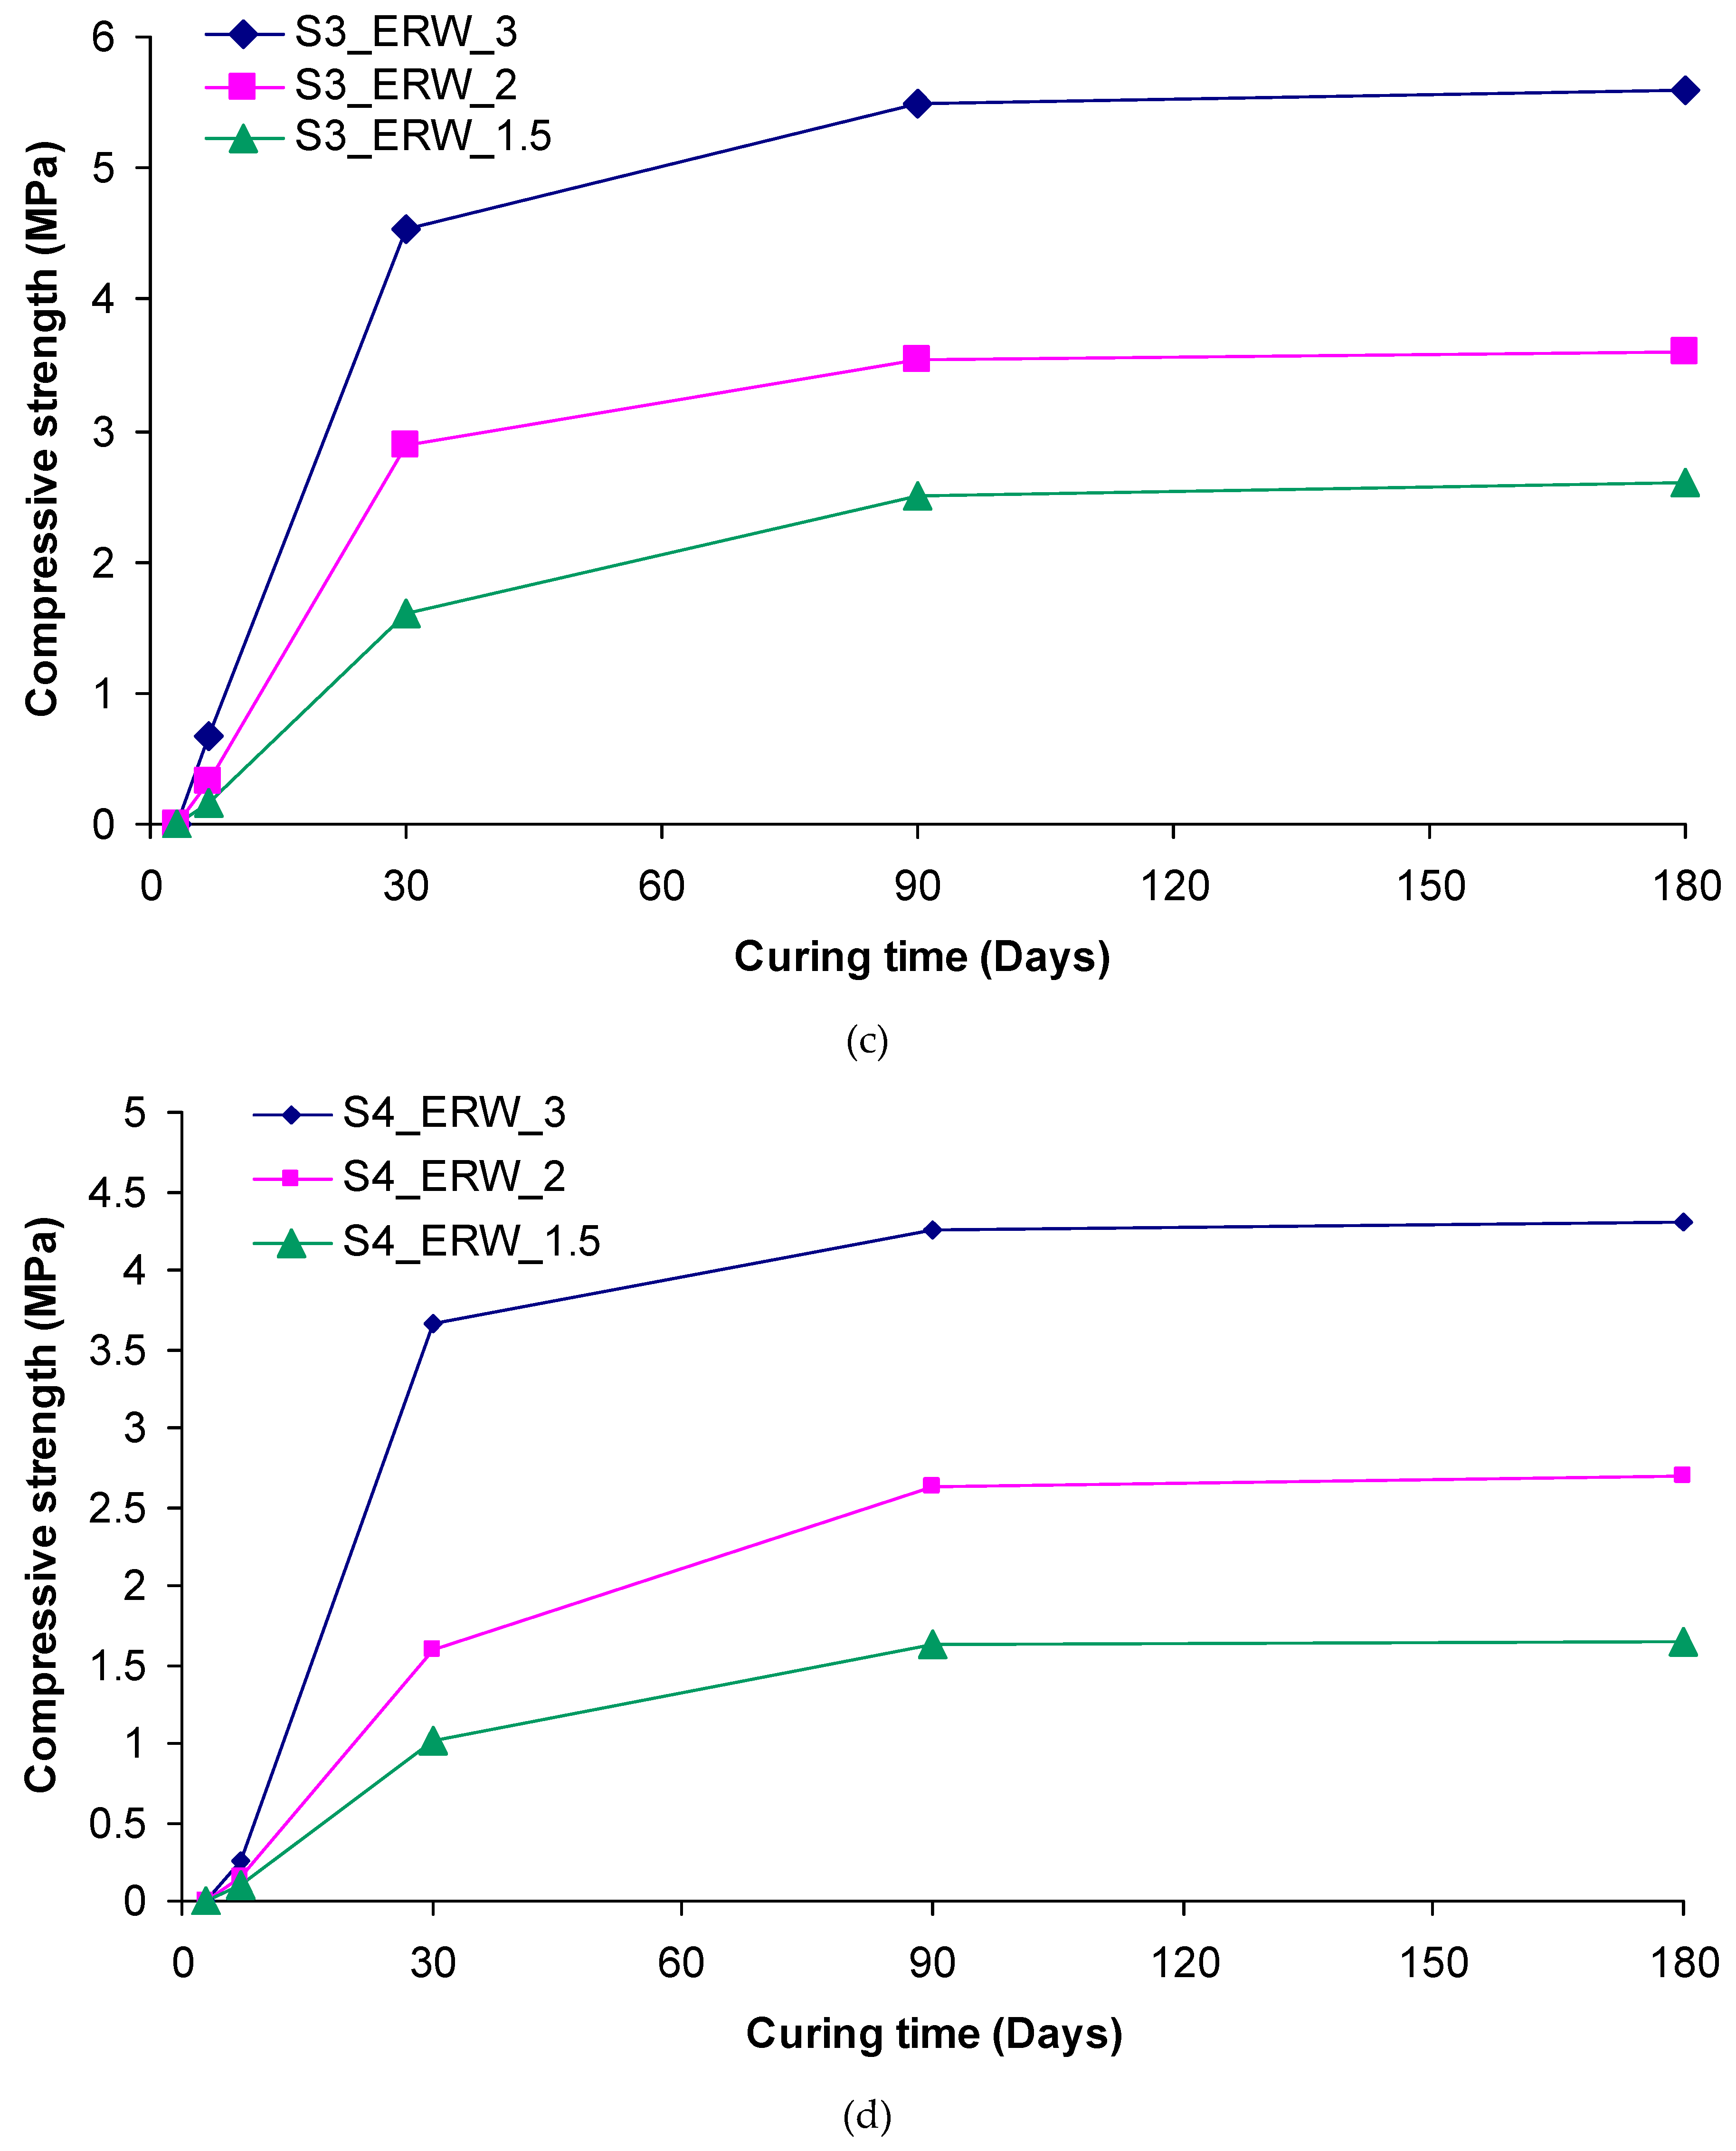

Figure 9.
(a)-(f) Development of elastic modulus with time for treated sands with the different grouts.
Figure 9.
(a)-(f) Development of elastic modulus with time for treated sands with the different grouts.
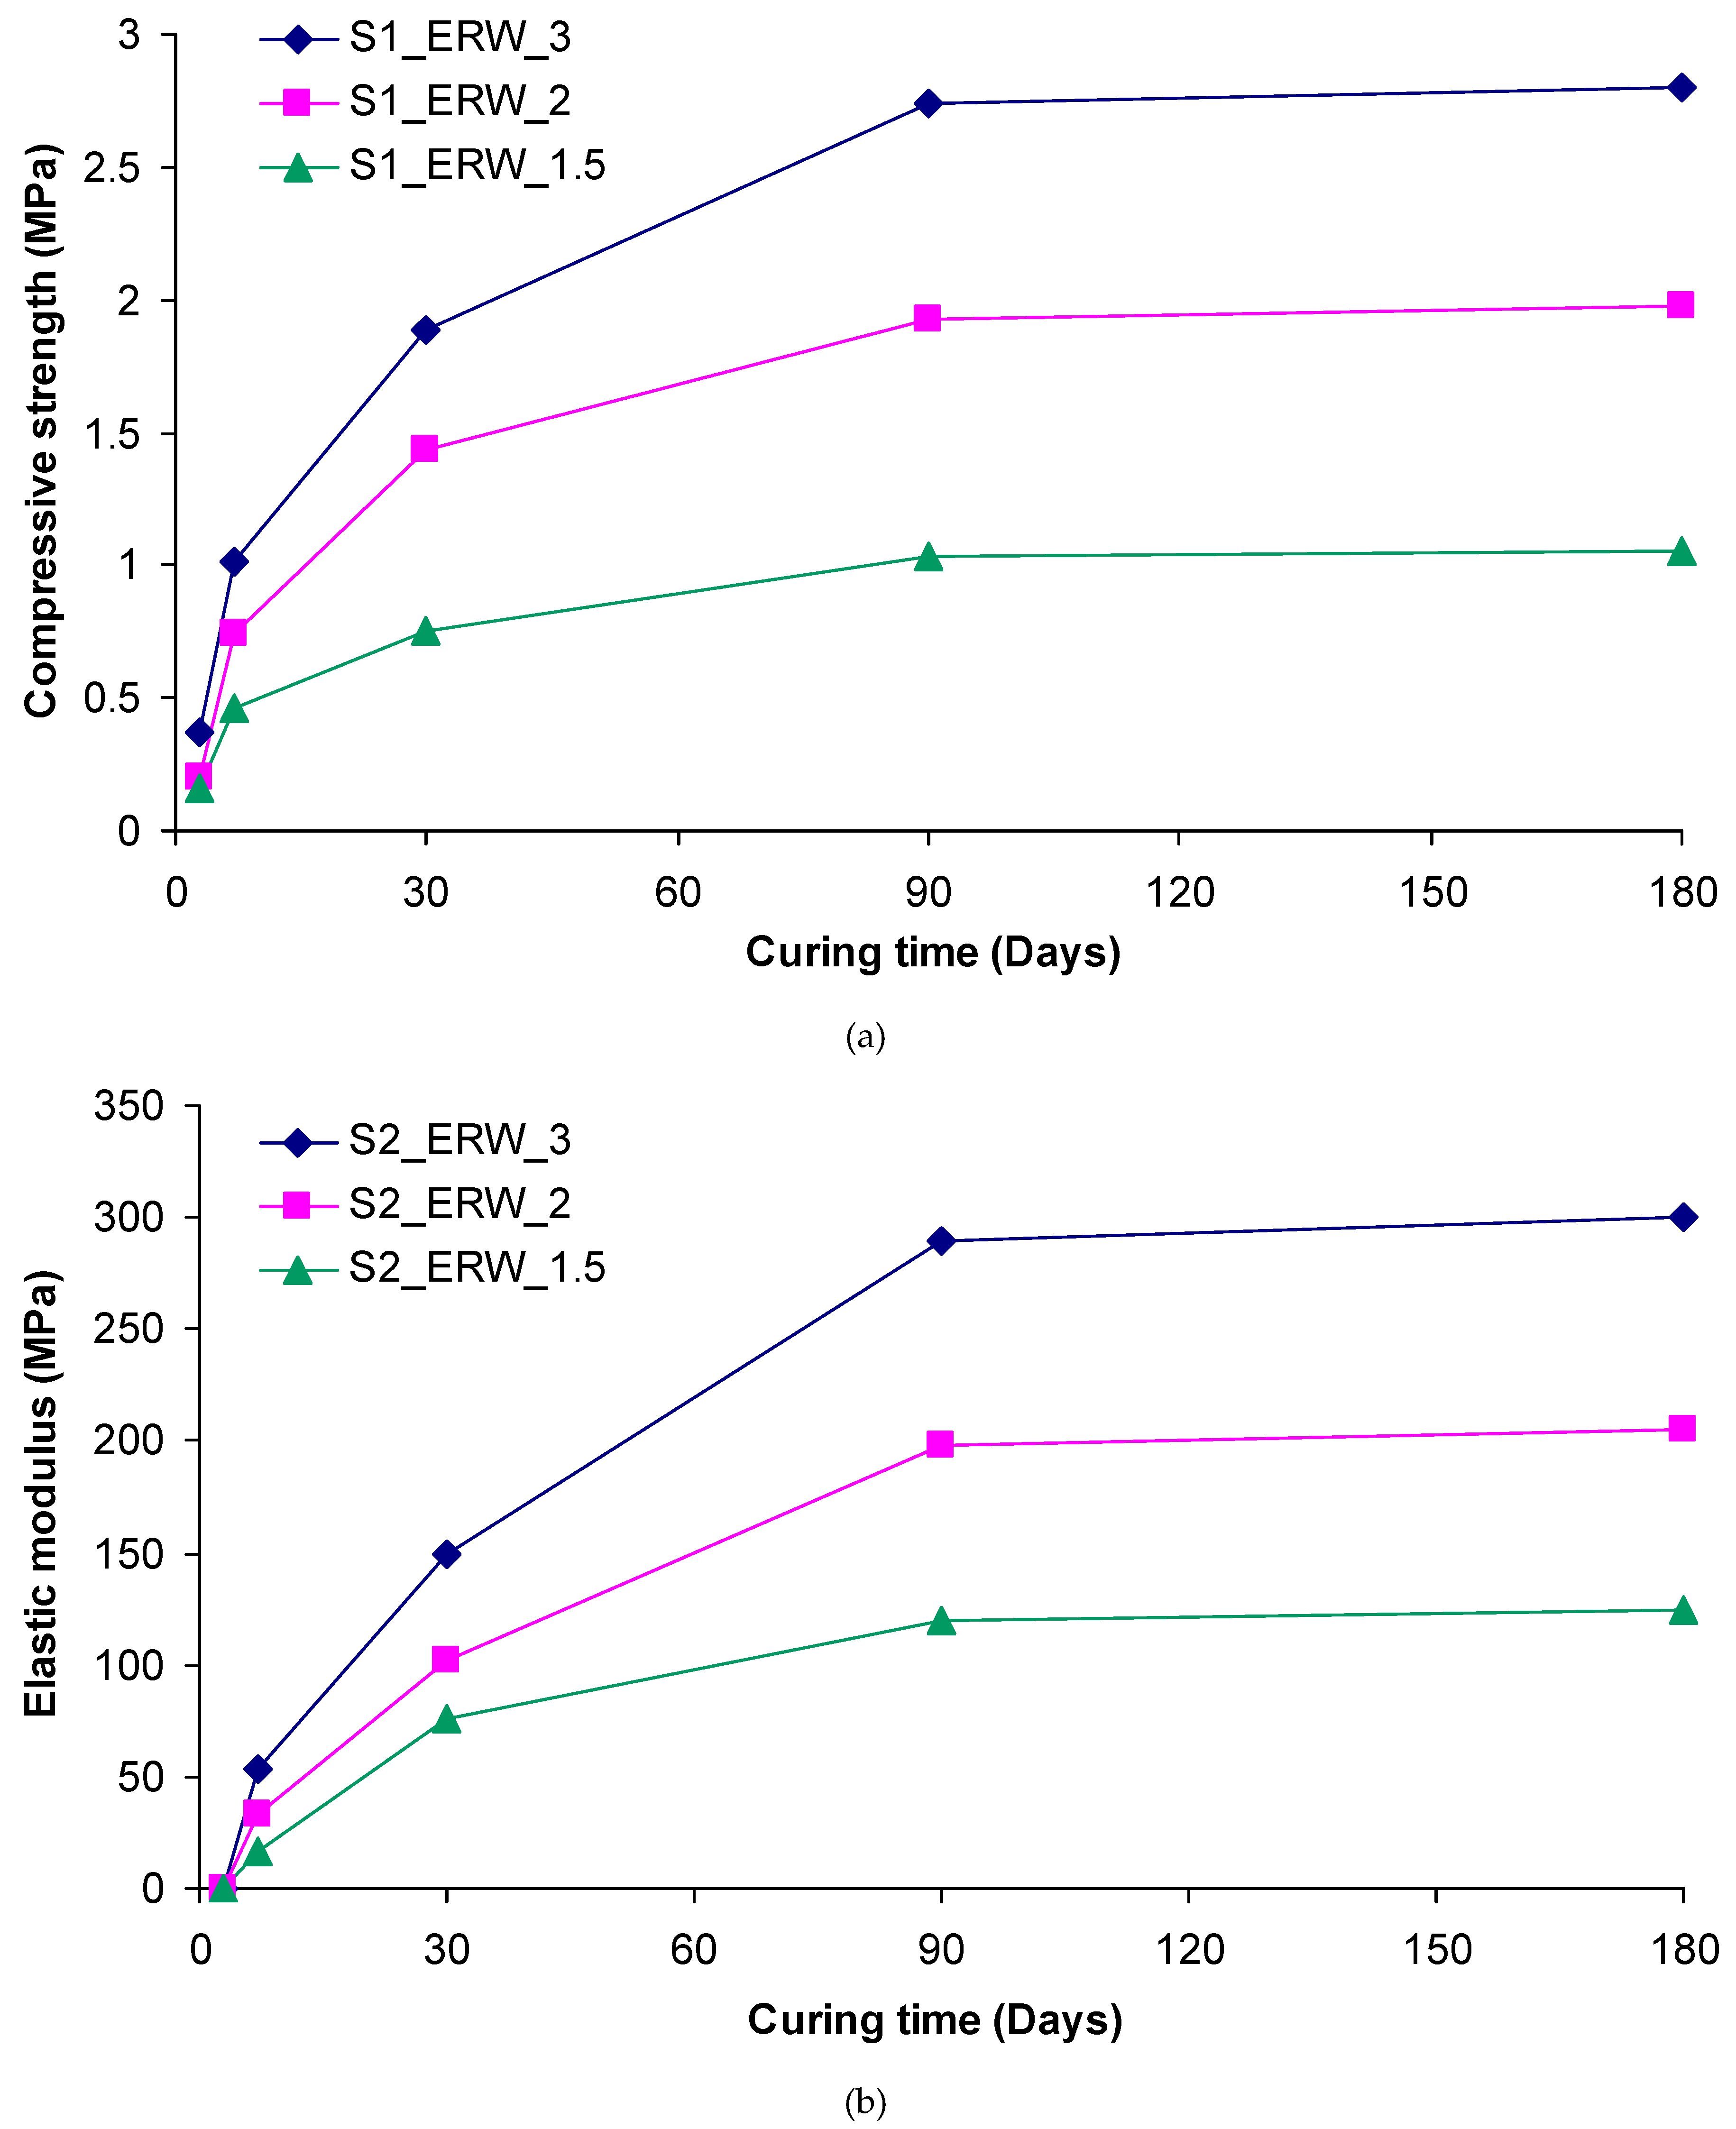
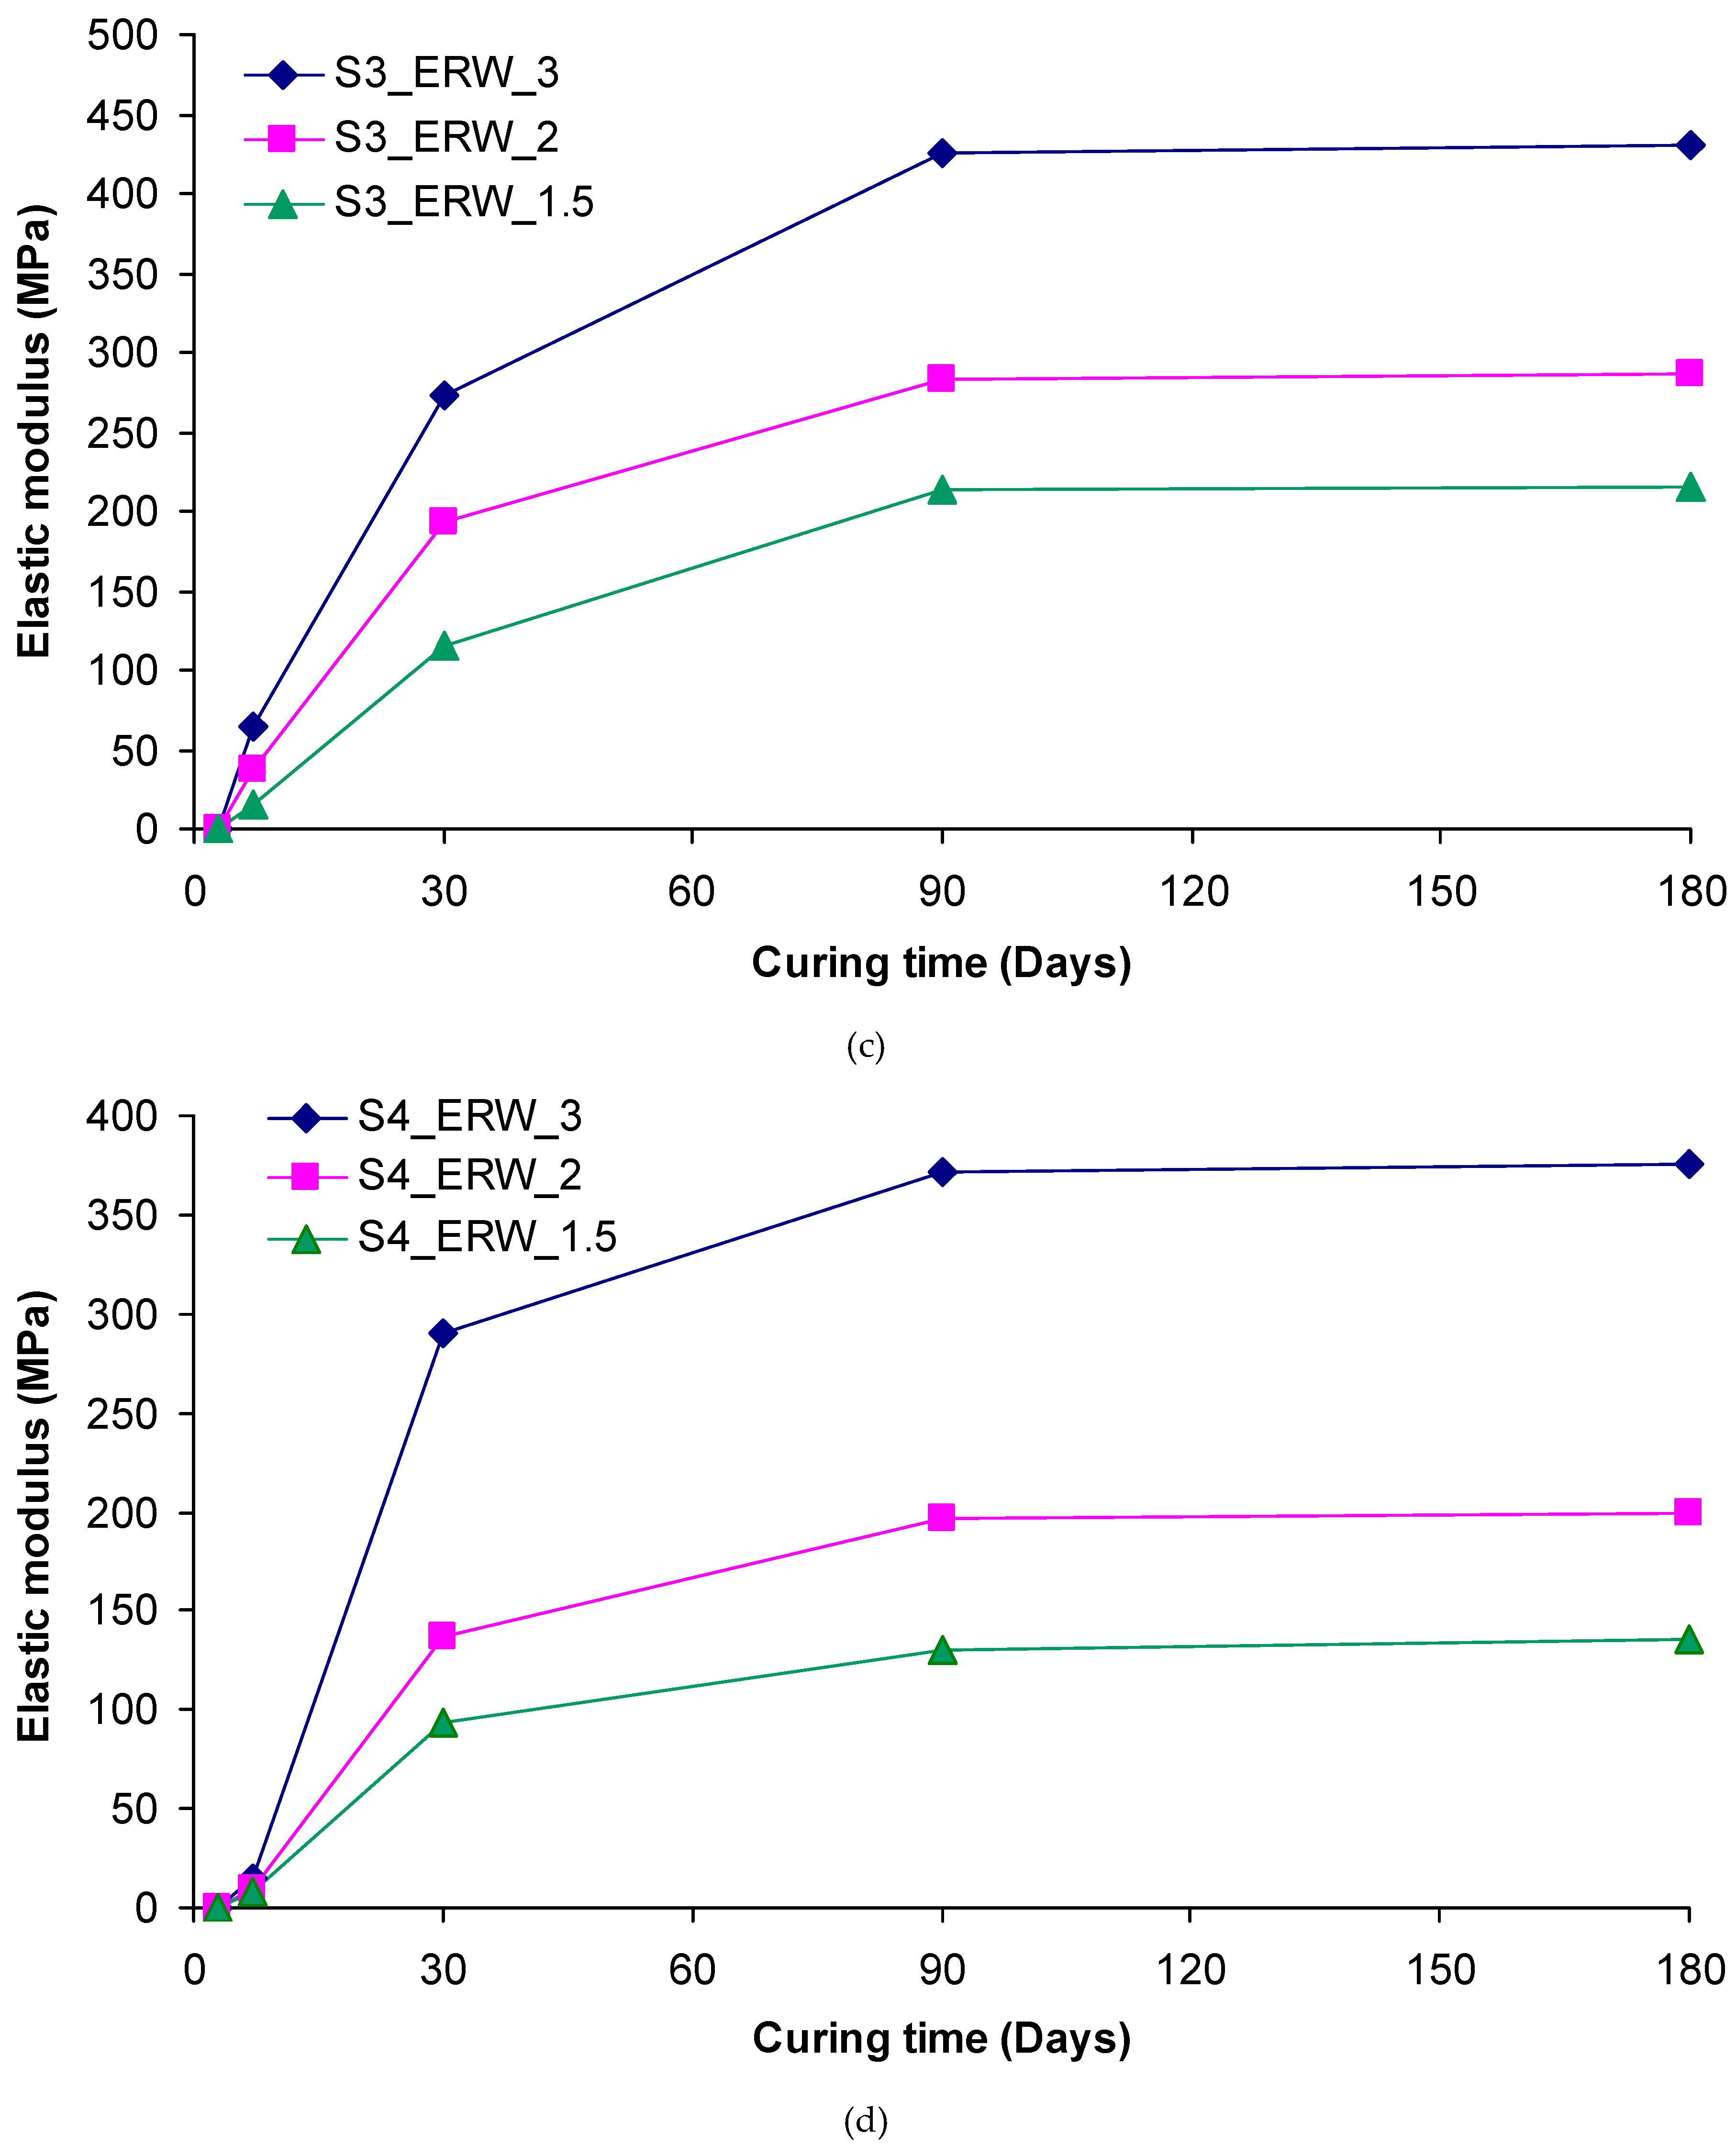
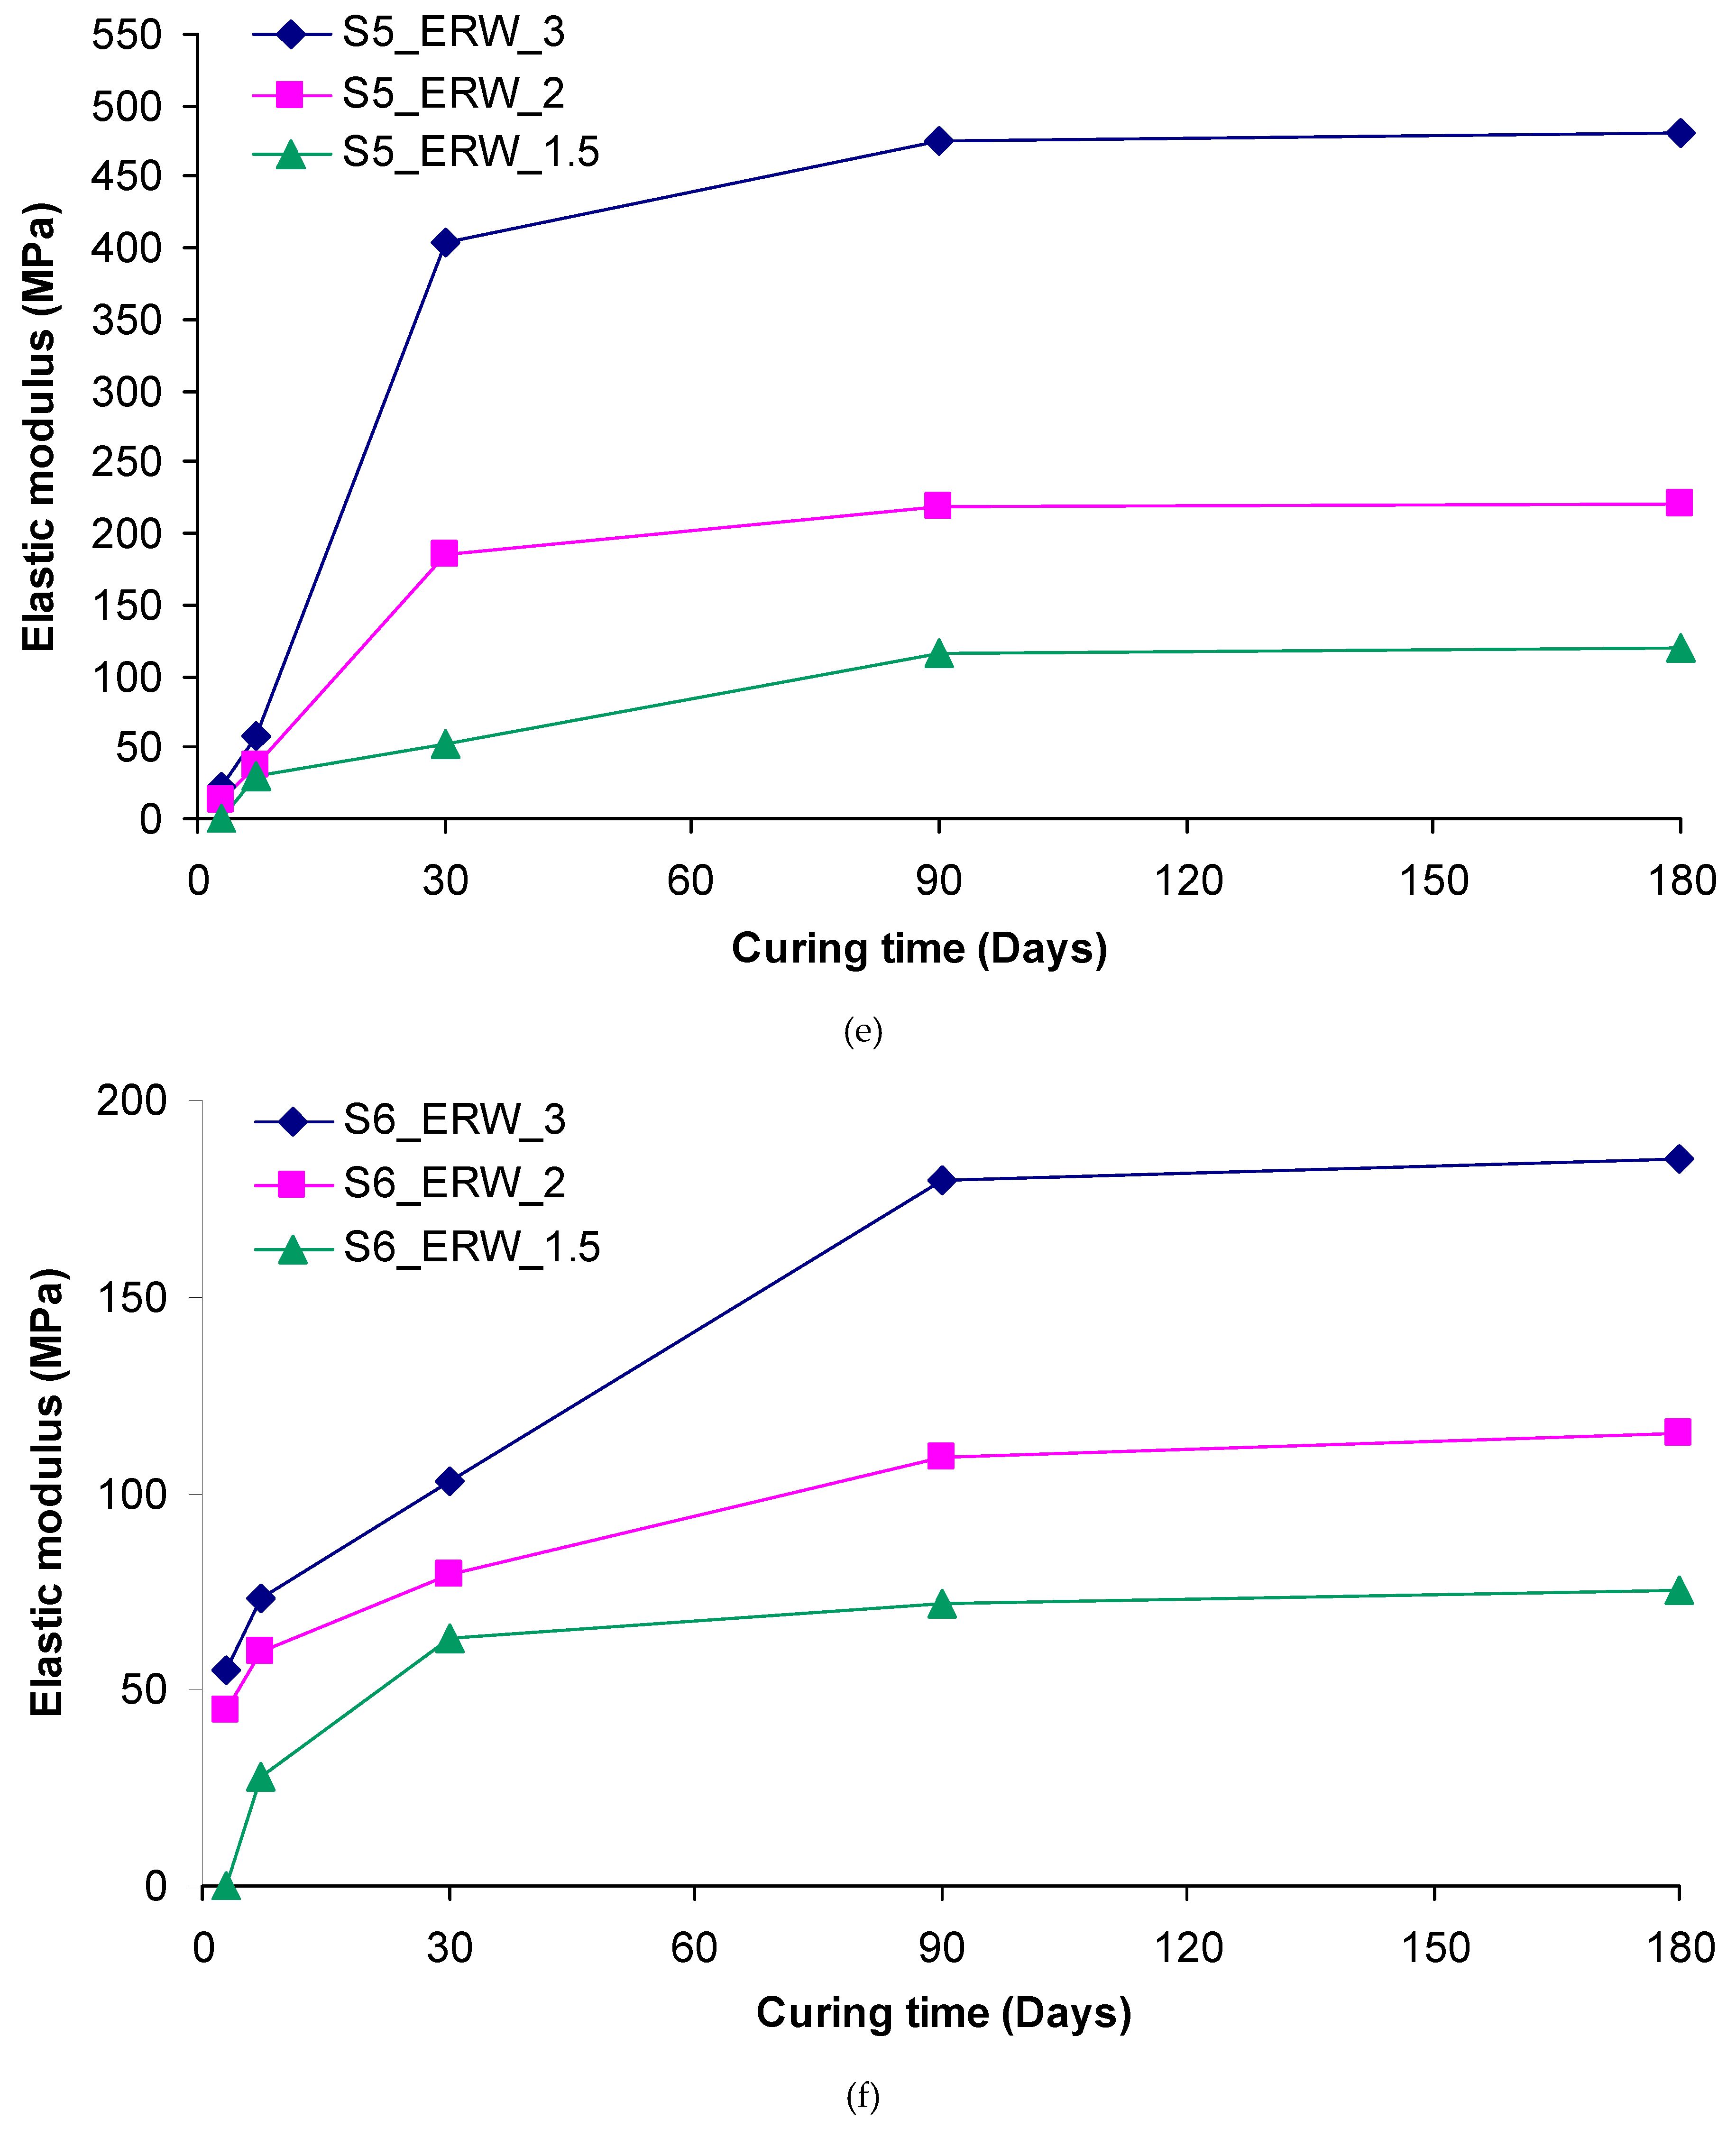
Figure 10.
Typical curves of compressive stress vs. strain for S3 sand samples treated with the different grouts after 180 days of curing.
Figure 10.
Typical curves of compressive stress vs. strain for S3 sand samples treated with the different grouts after 180 days of curing.
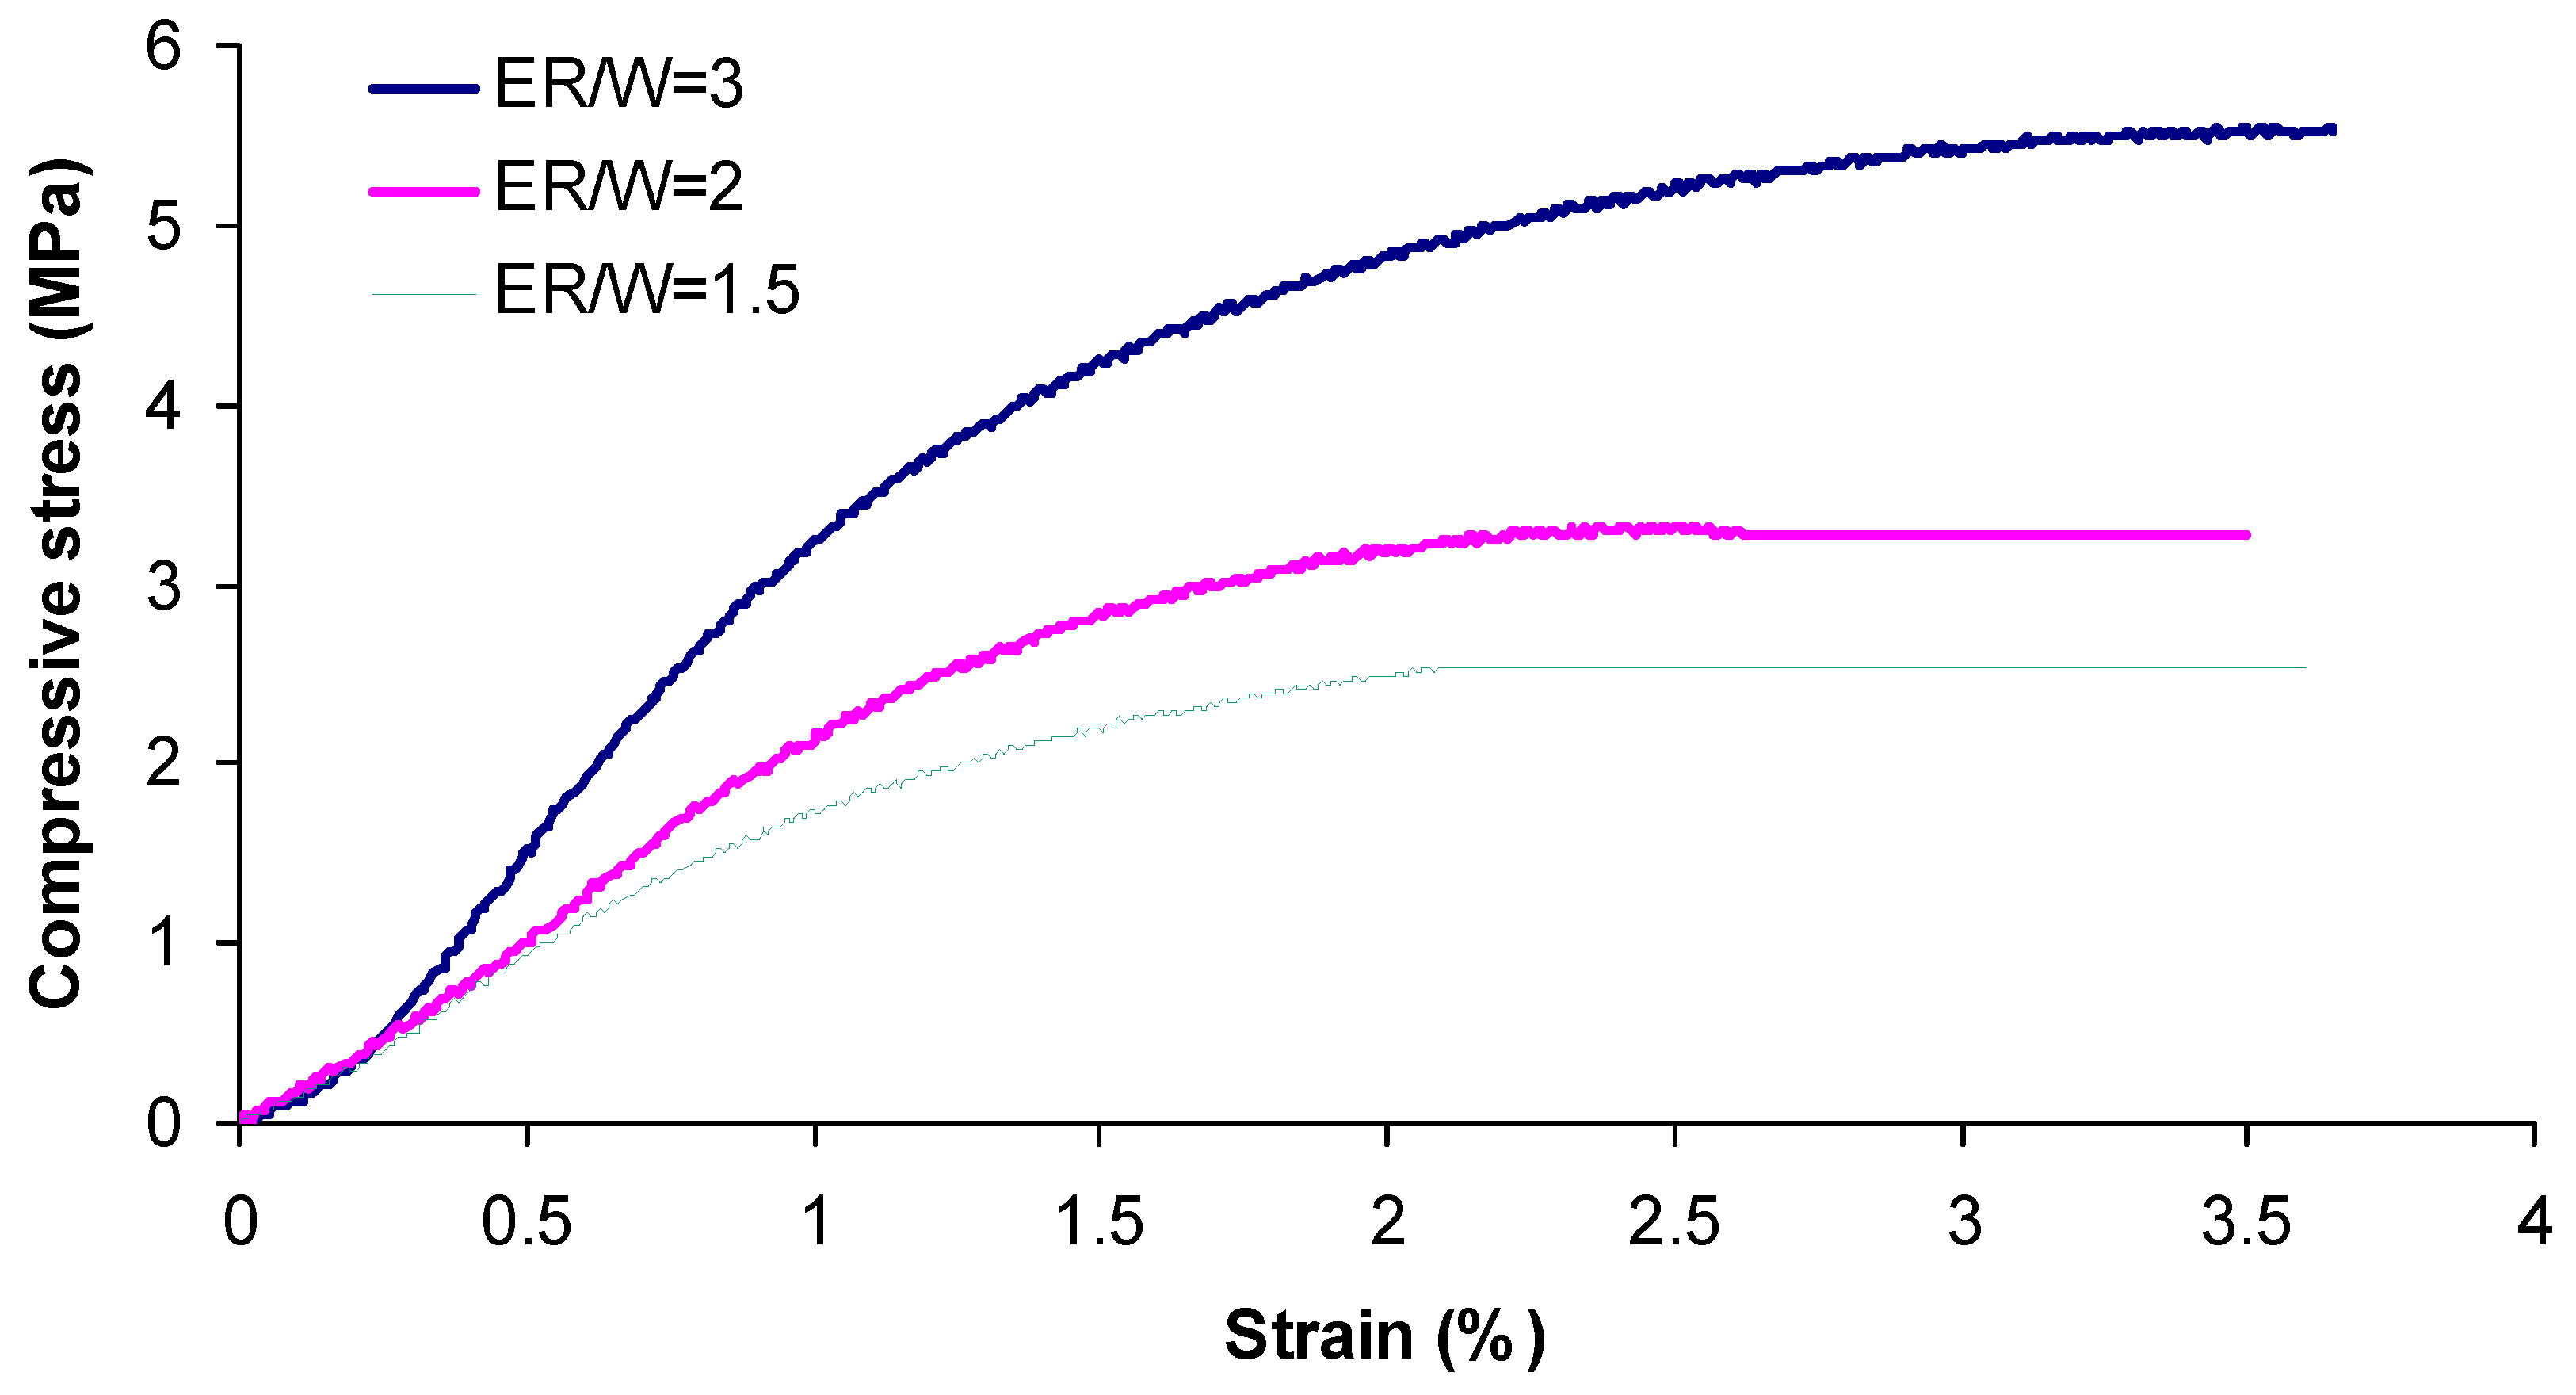
Figure 11.
Compressive strength vs. mean grain size of all grouted sands after 180 days of curing.
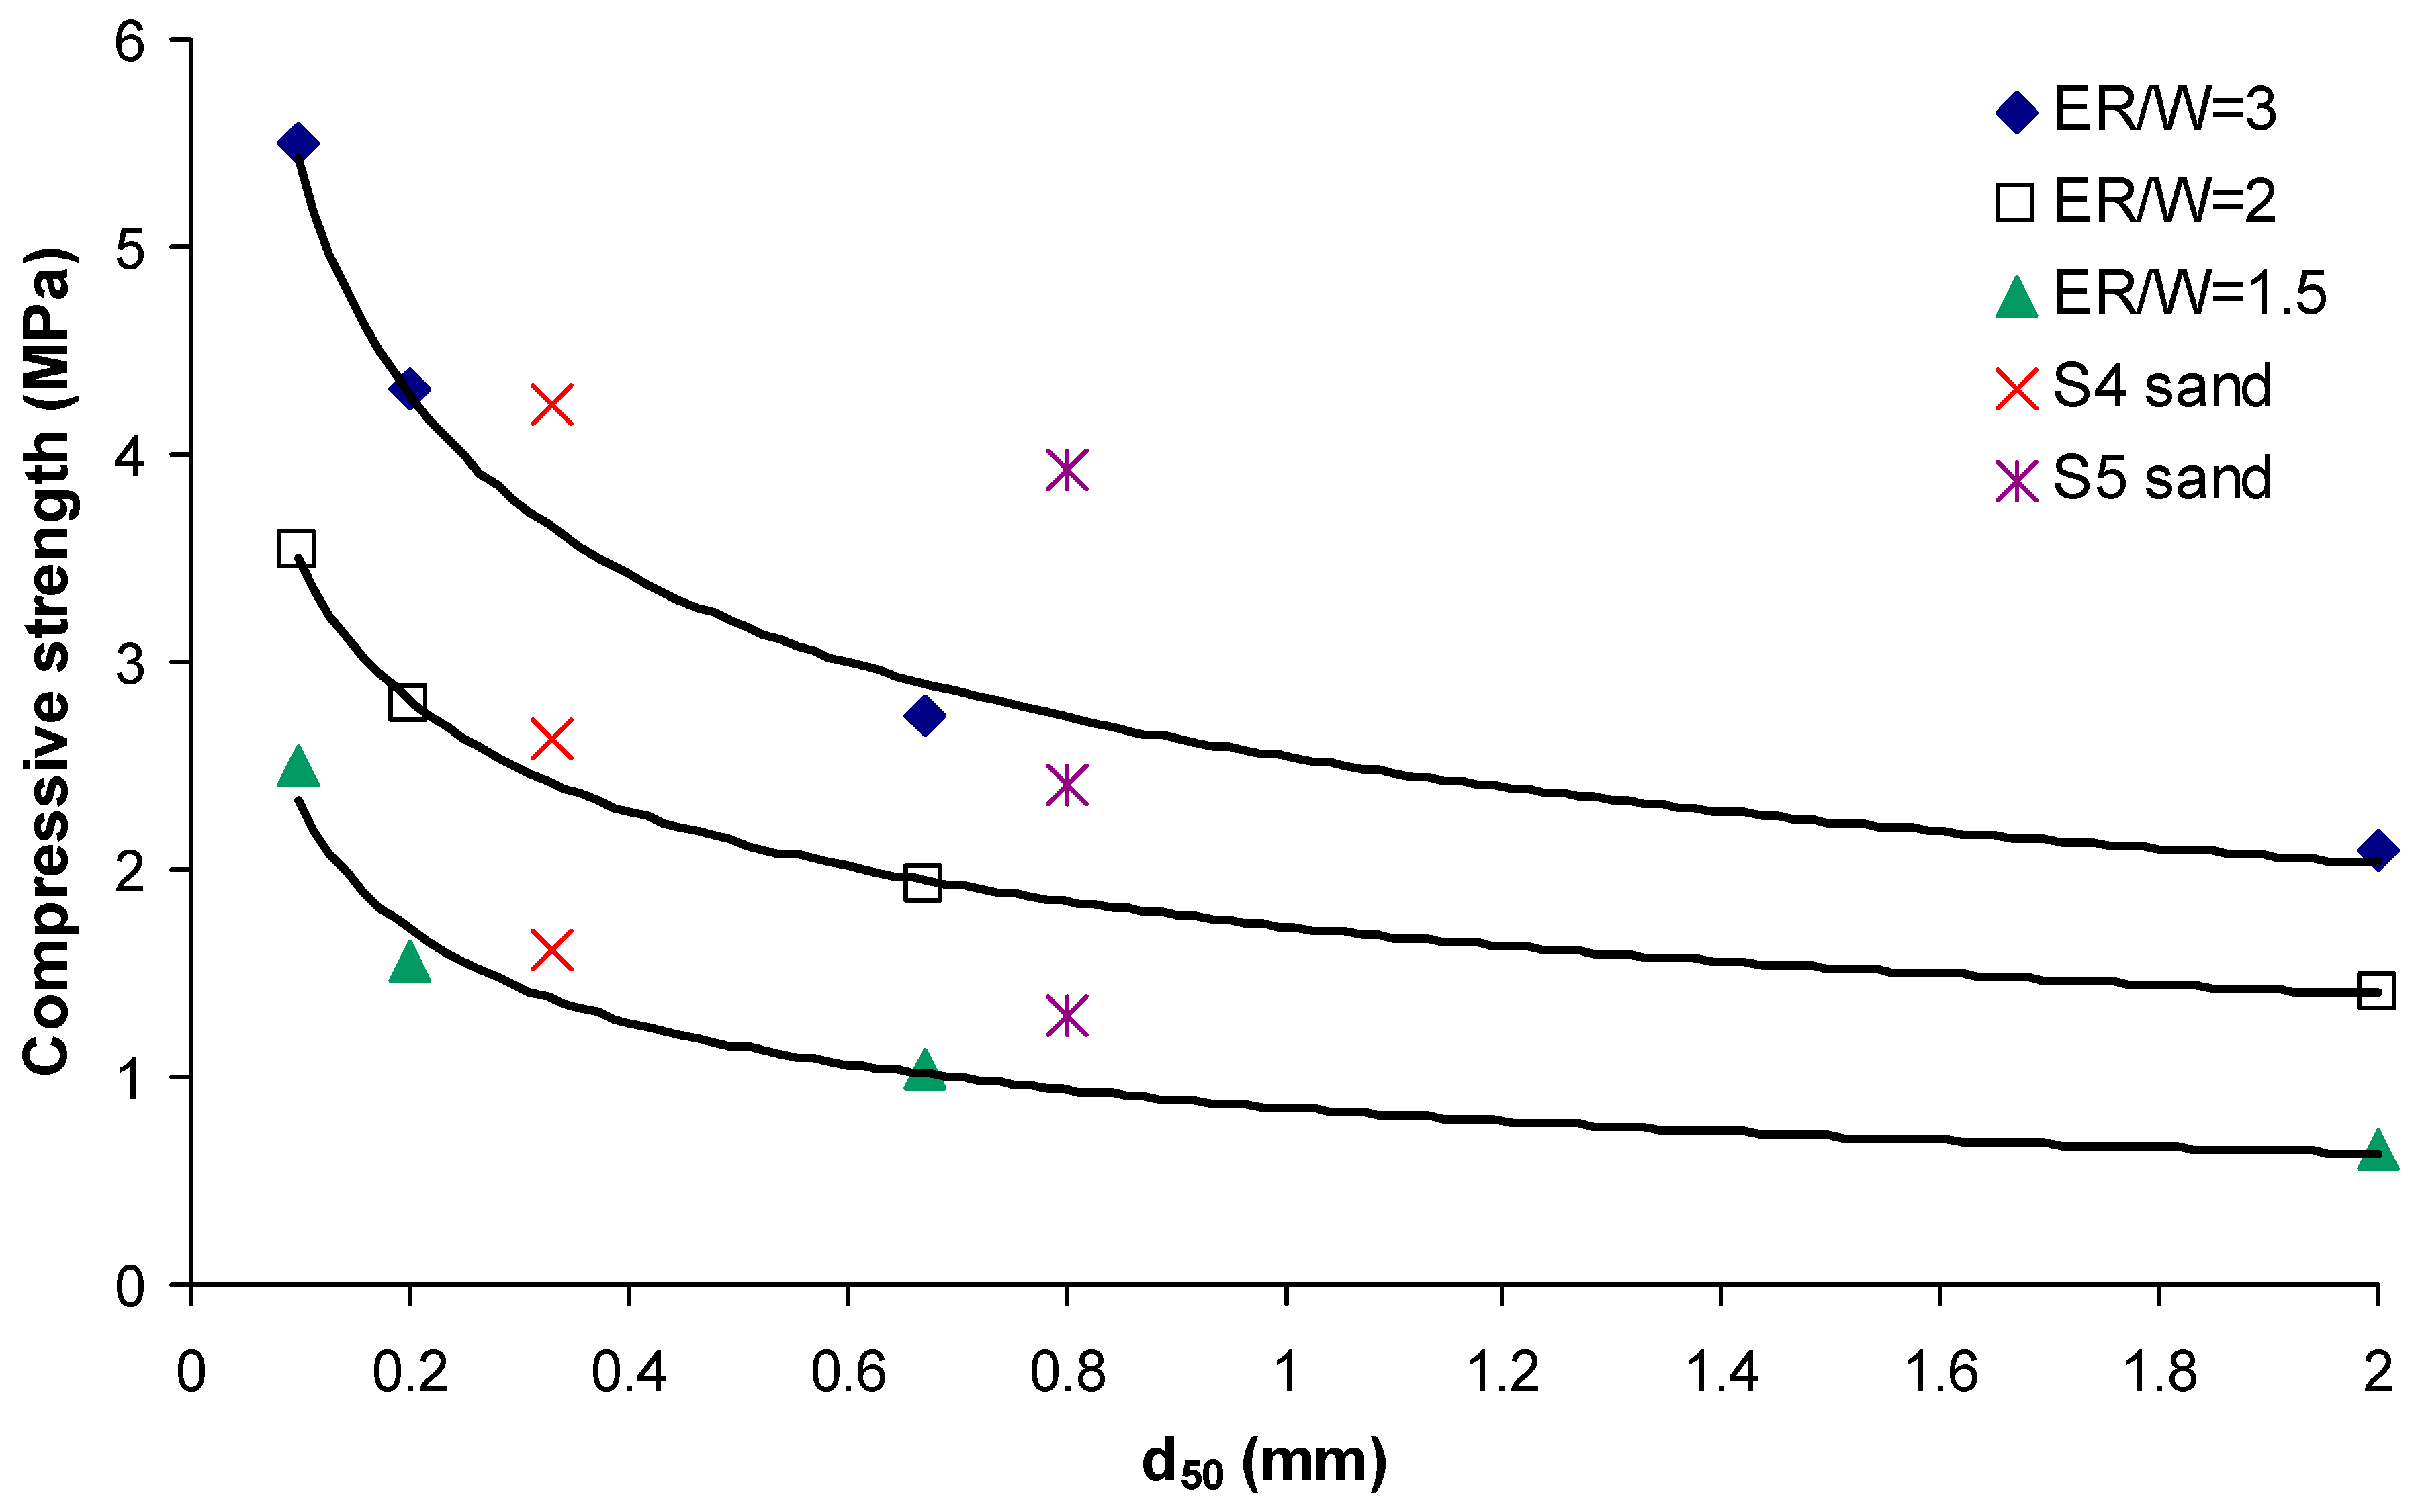
Figure 12.
Elastic modulus vs. mean grain size of all grouted sands after 180 days of curing.
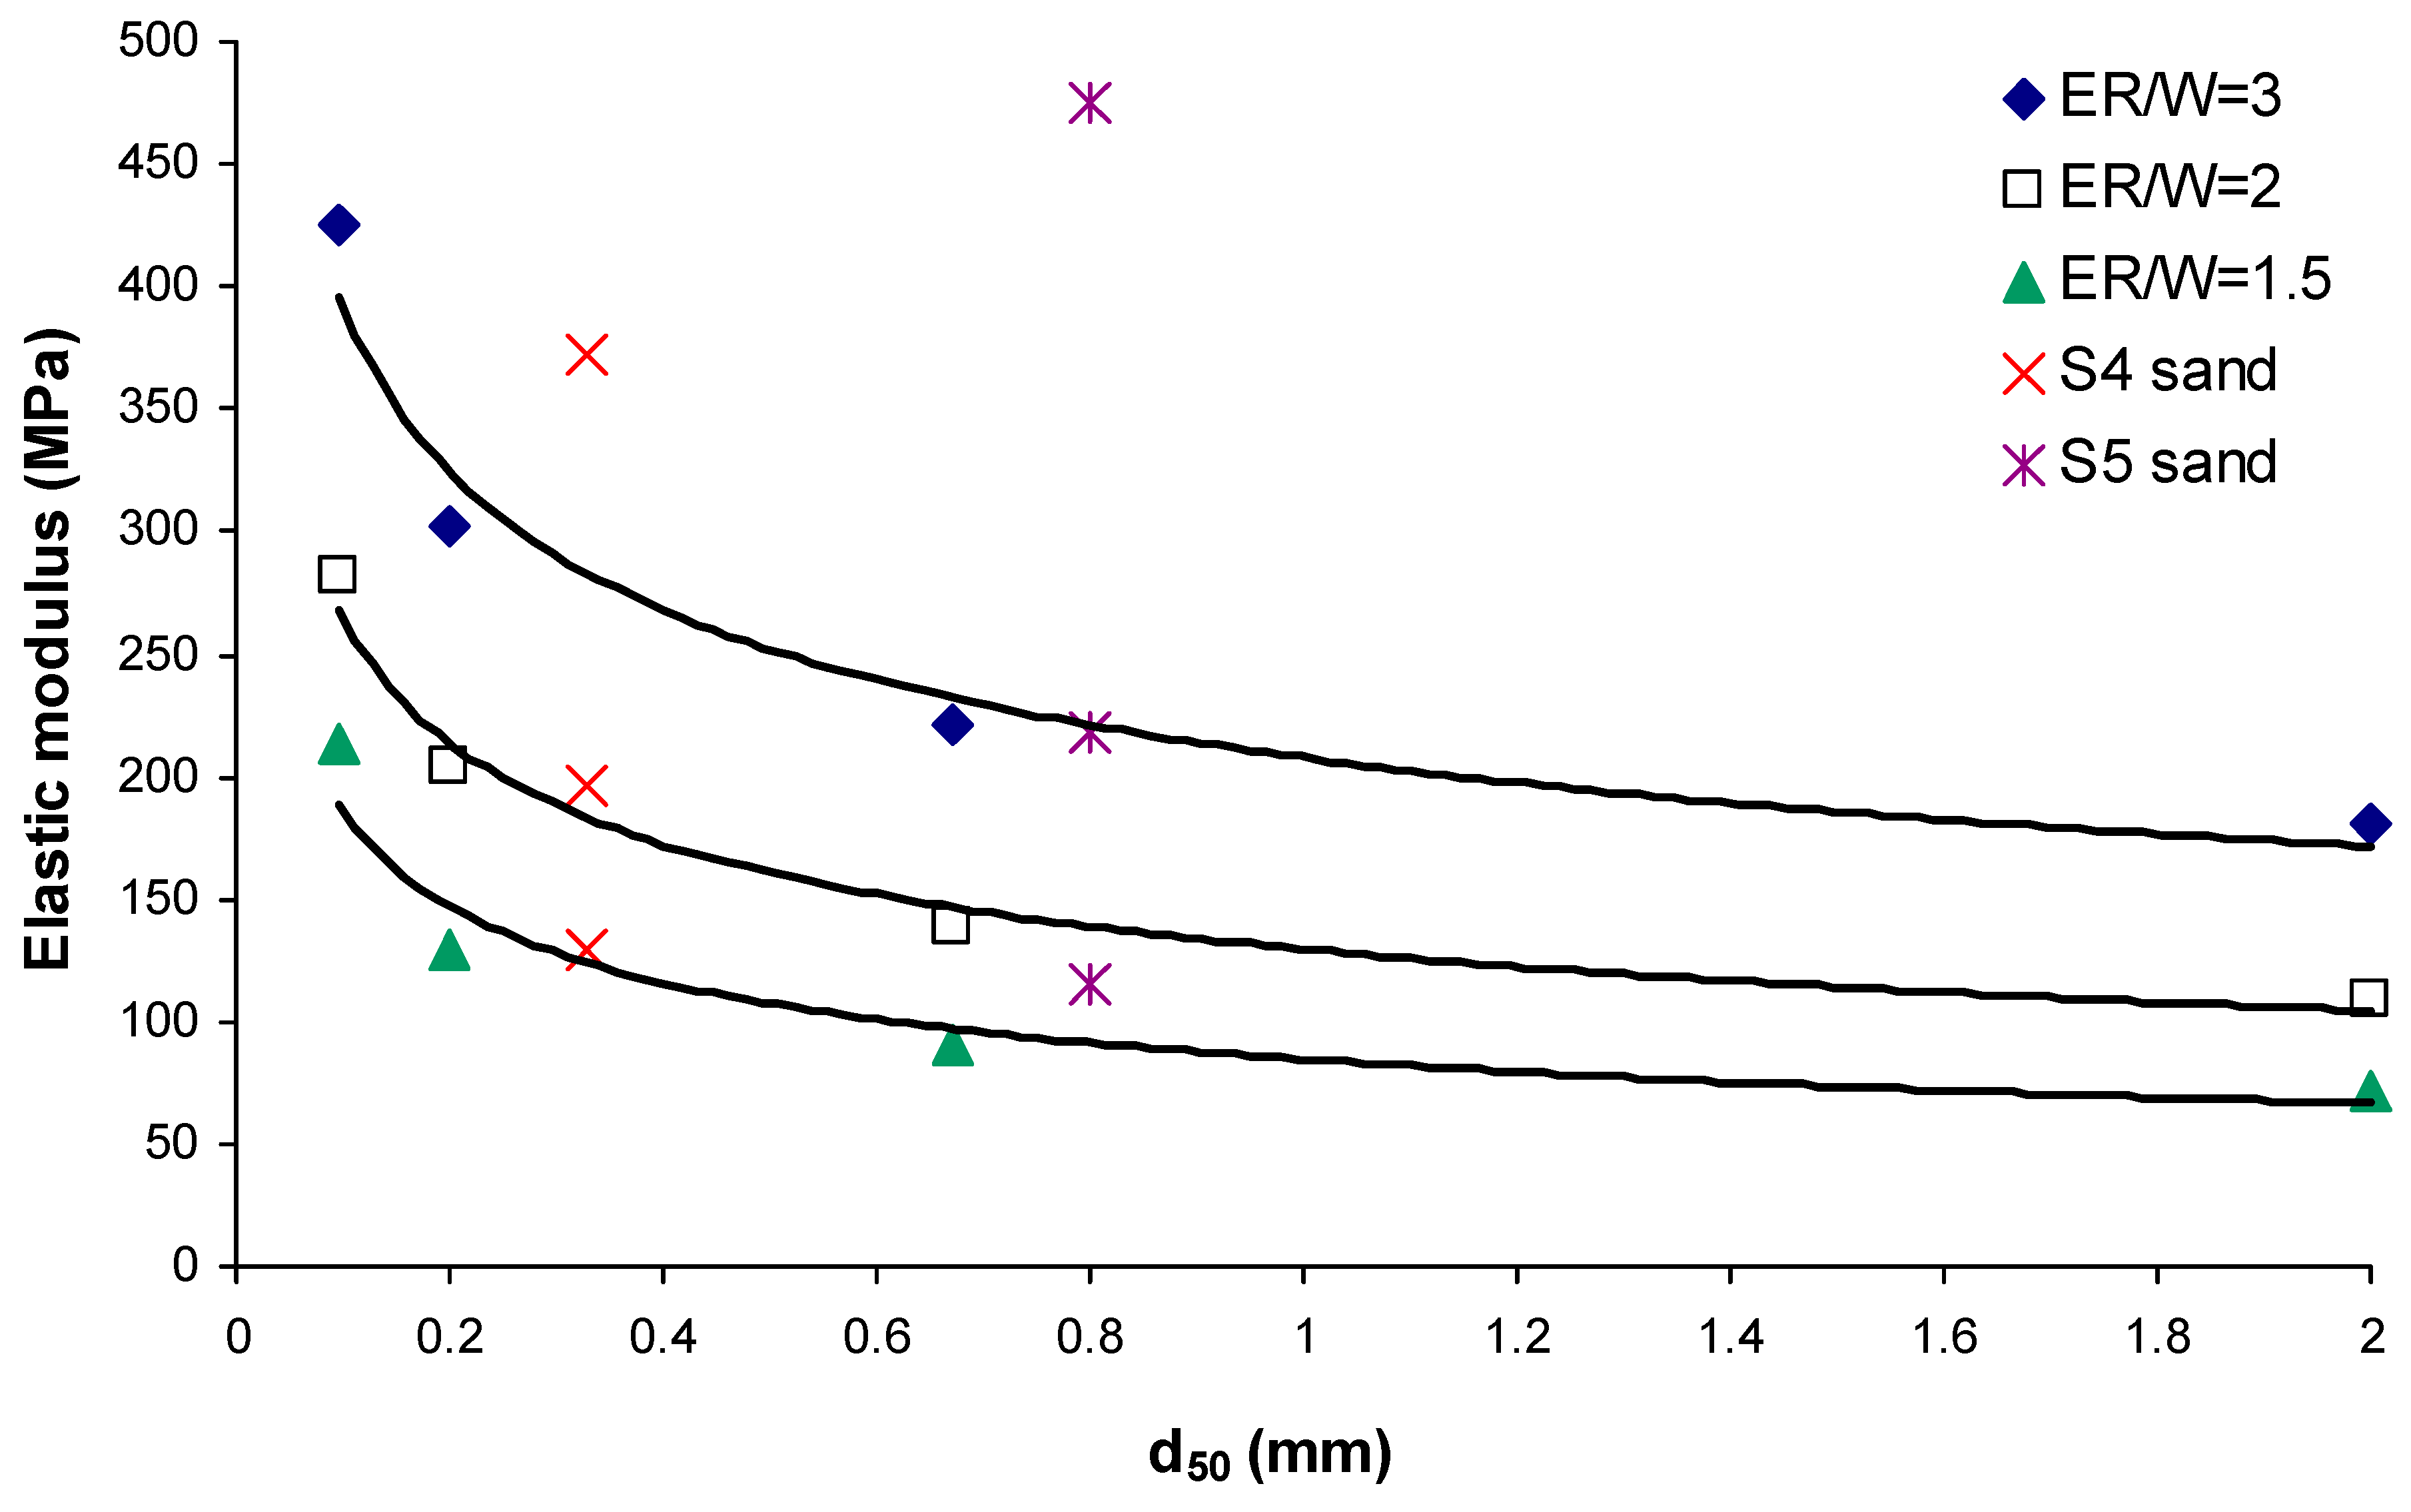
Figure 13.
Porosity vs. UCS of grouted sands.
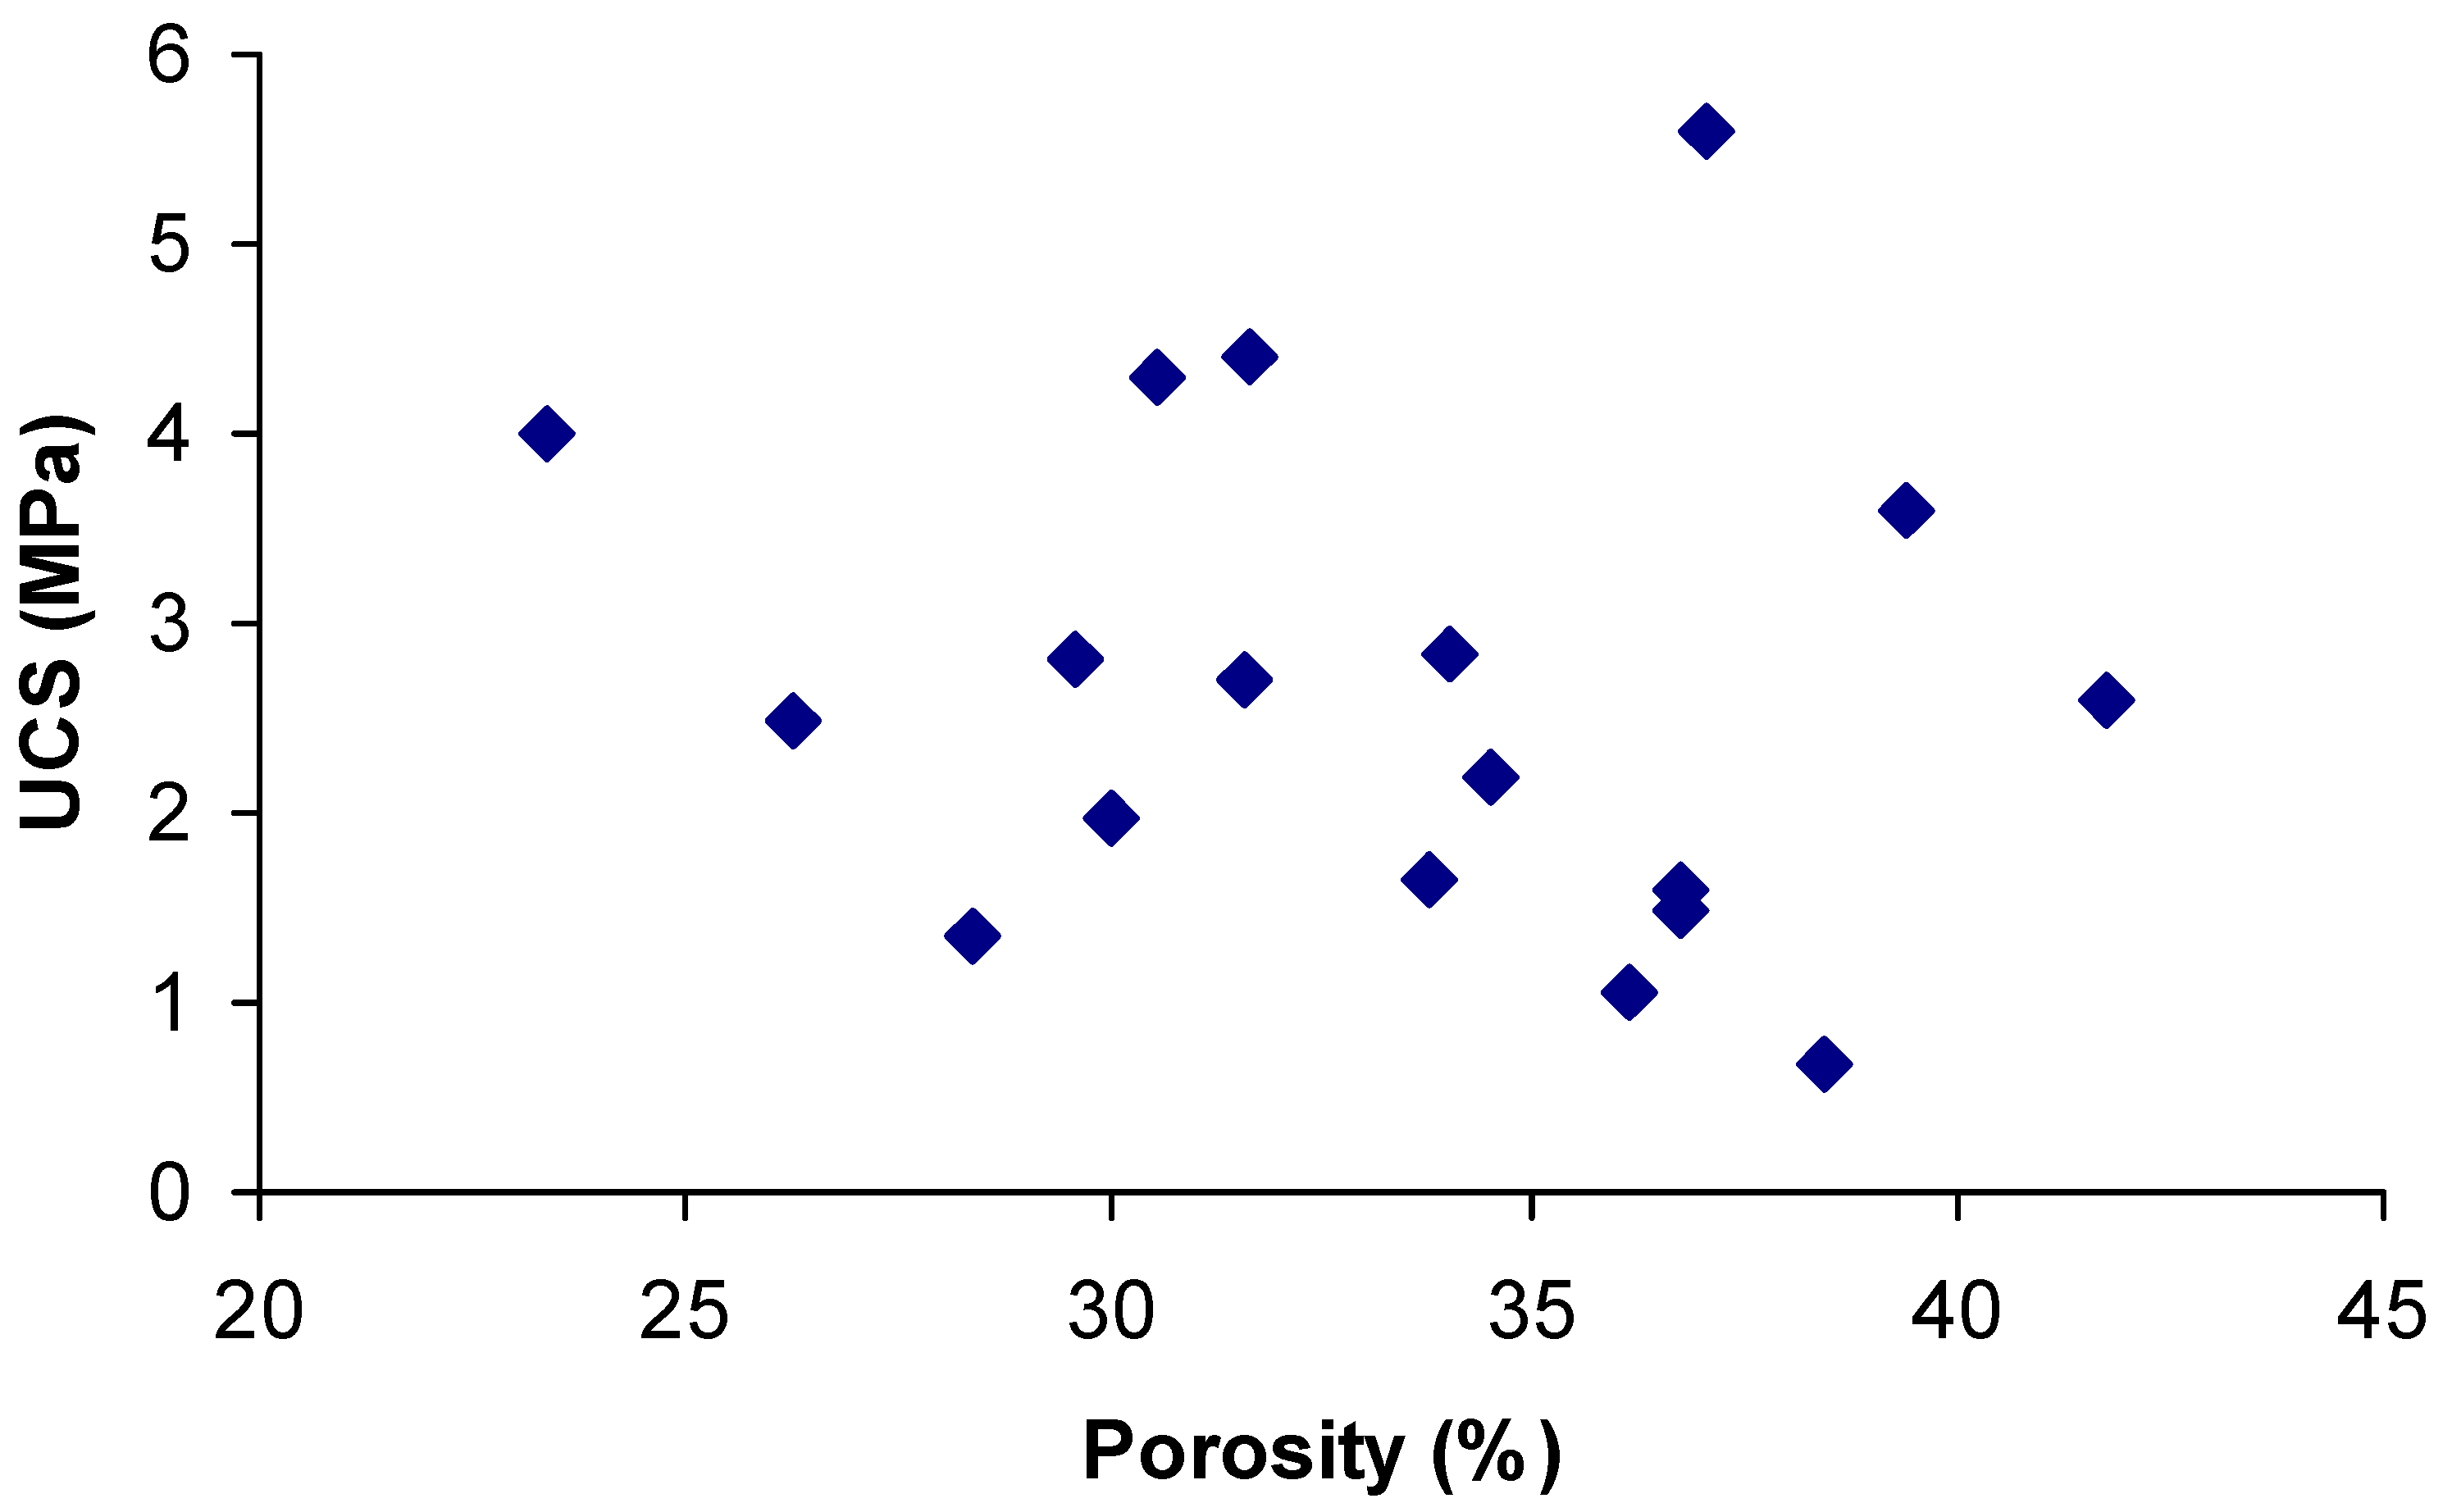
Figure 14.
Cross-plot of unconfined compressive strength values predicted from regression equation (4) vs. one from laboratory tests.
Figure 14.
Cross-plot of unconfined compressive strength values predicted from regression equation (4) vs. one from laboratory tests.
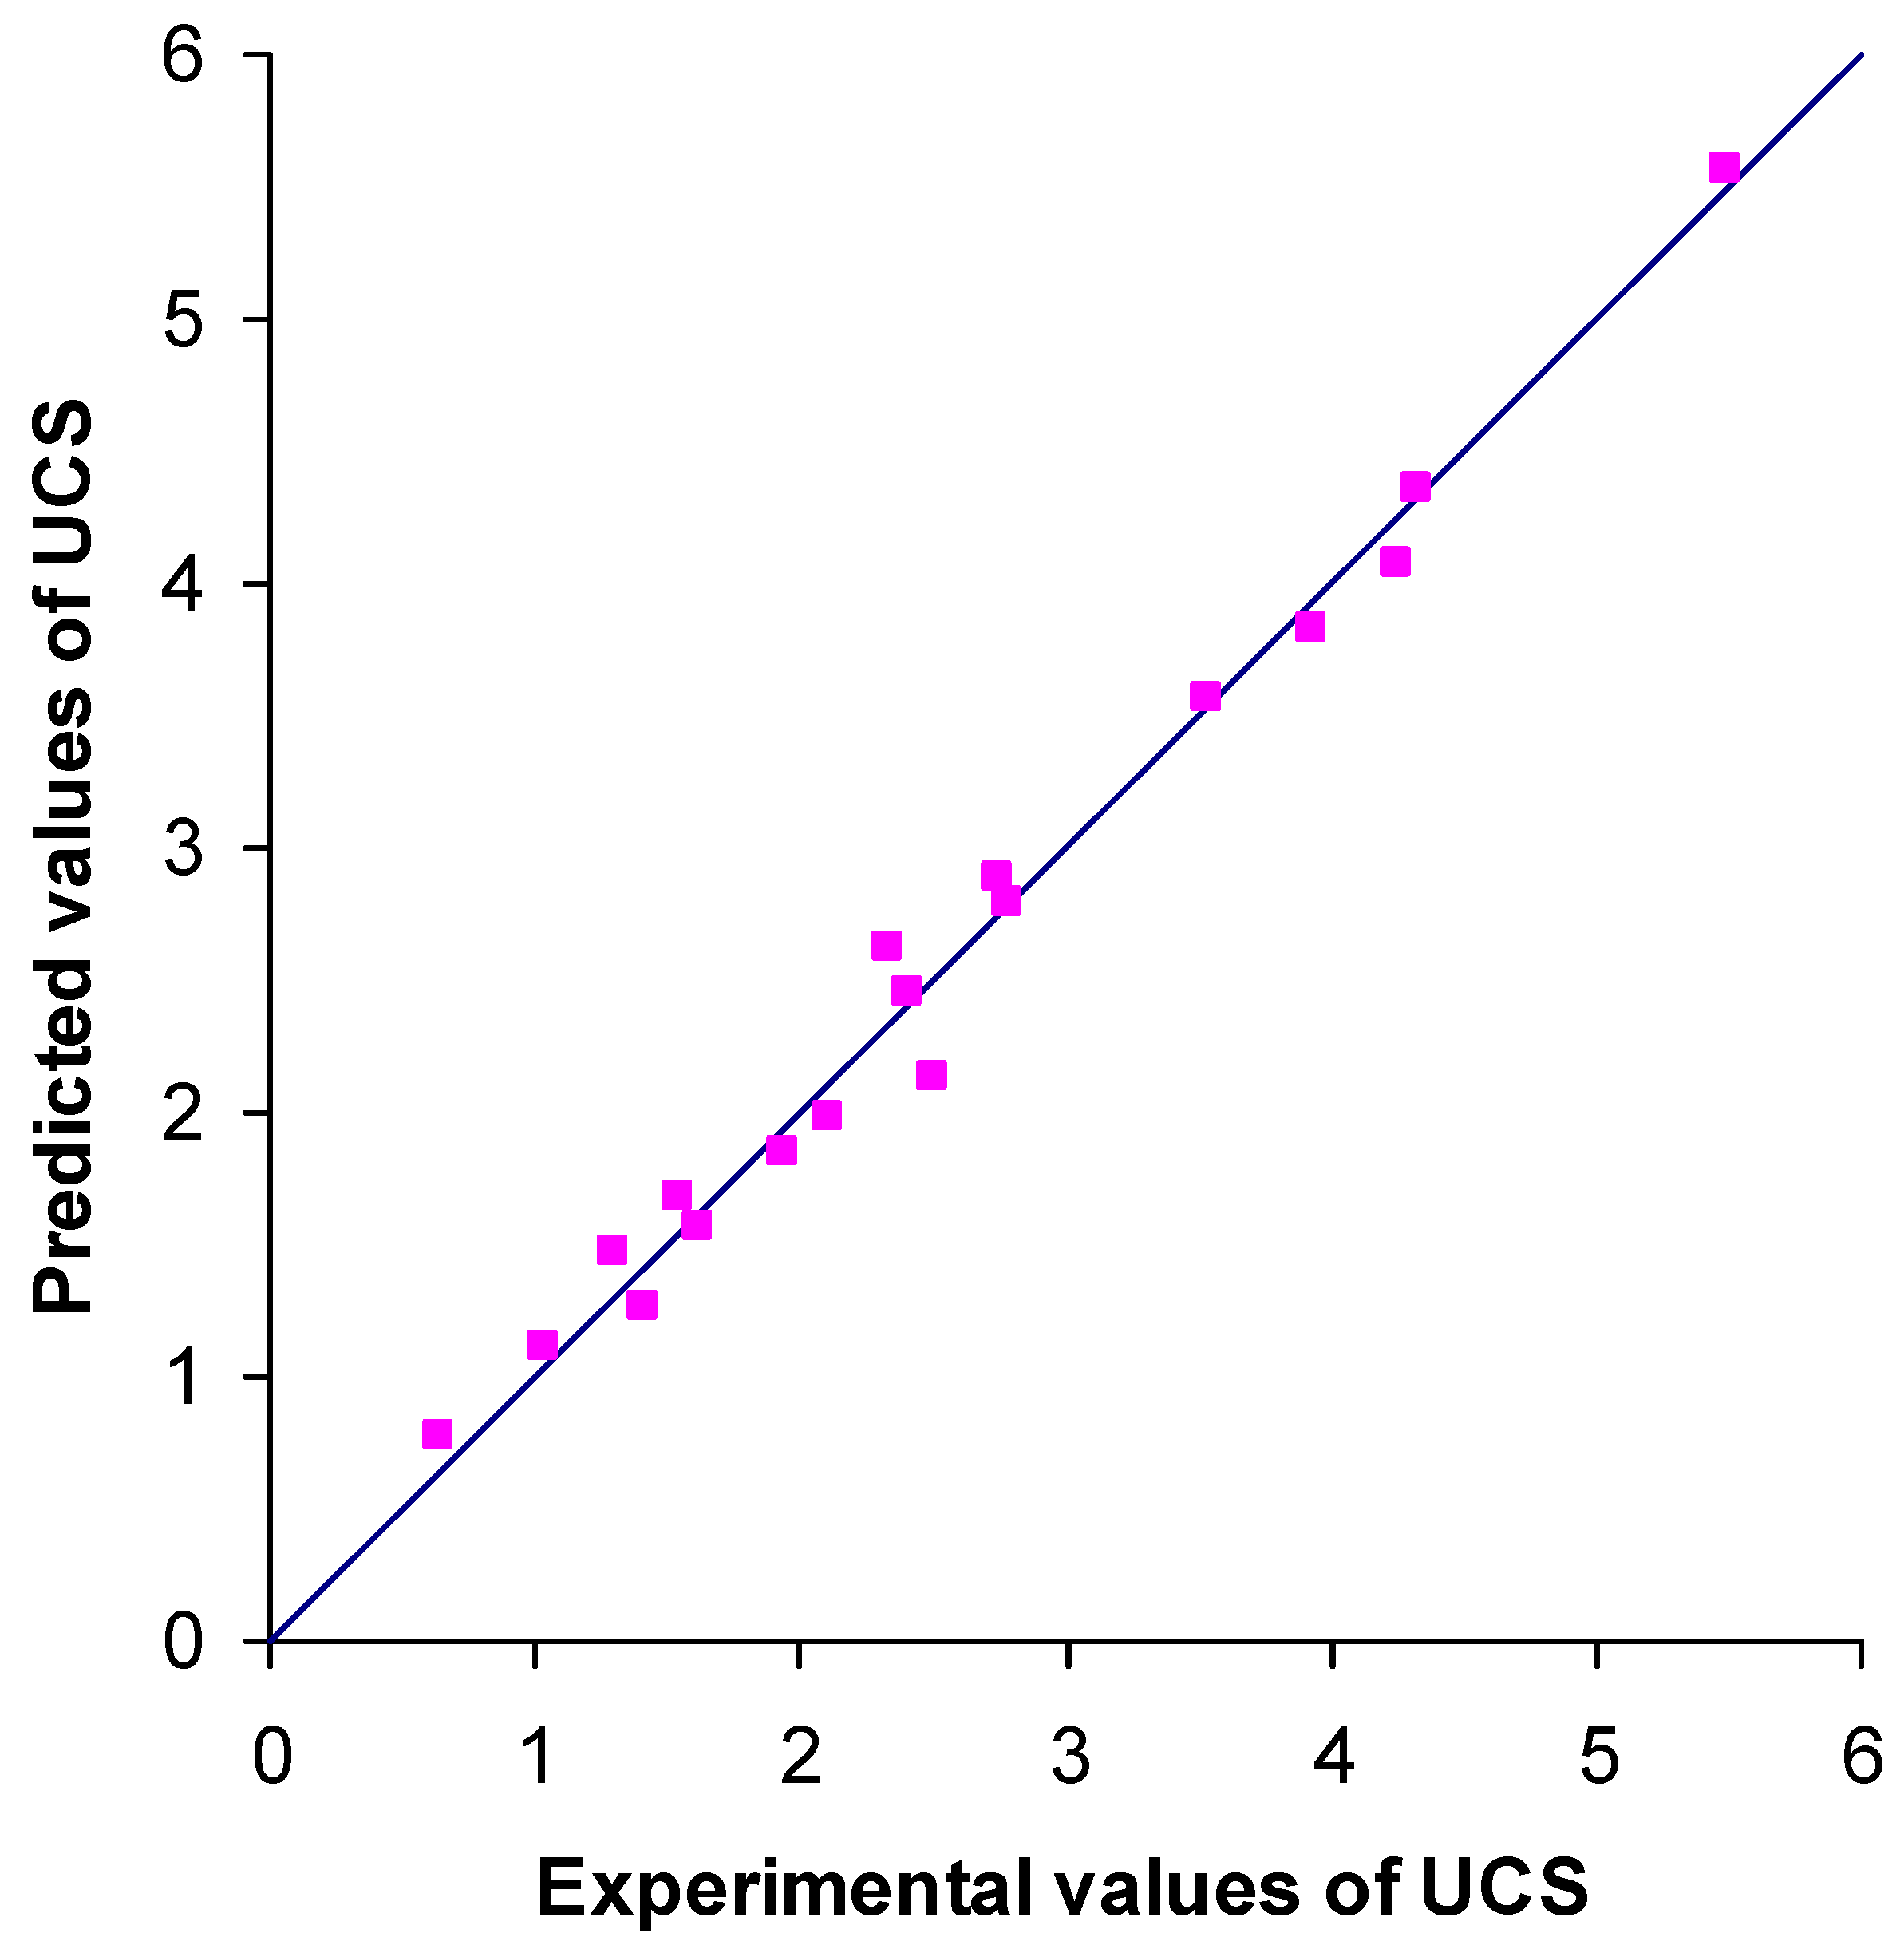
Figure 15.
Cross-plot of elastic modulus values predicted from regression equation (5) vs. one from laboratory tests.
Figure 15.
Cross-plot of elastic modulus values predicted from regression equation (5) vs. one from laboratory tests.
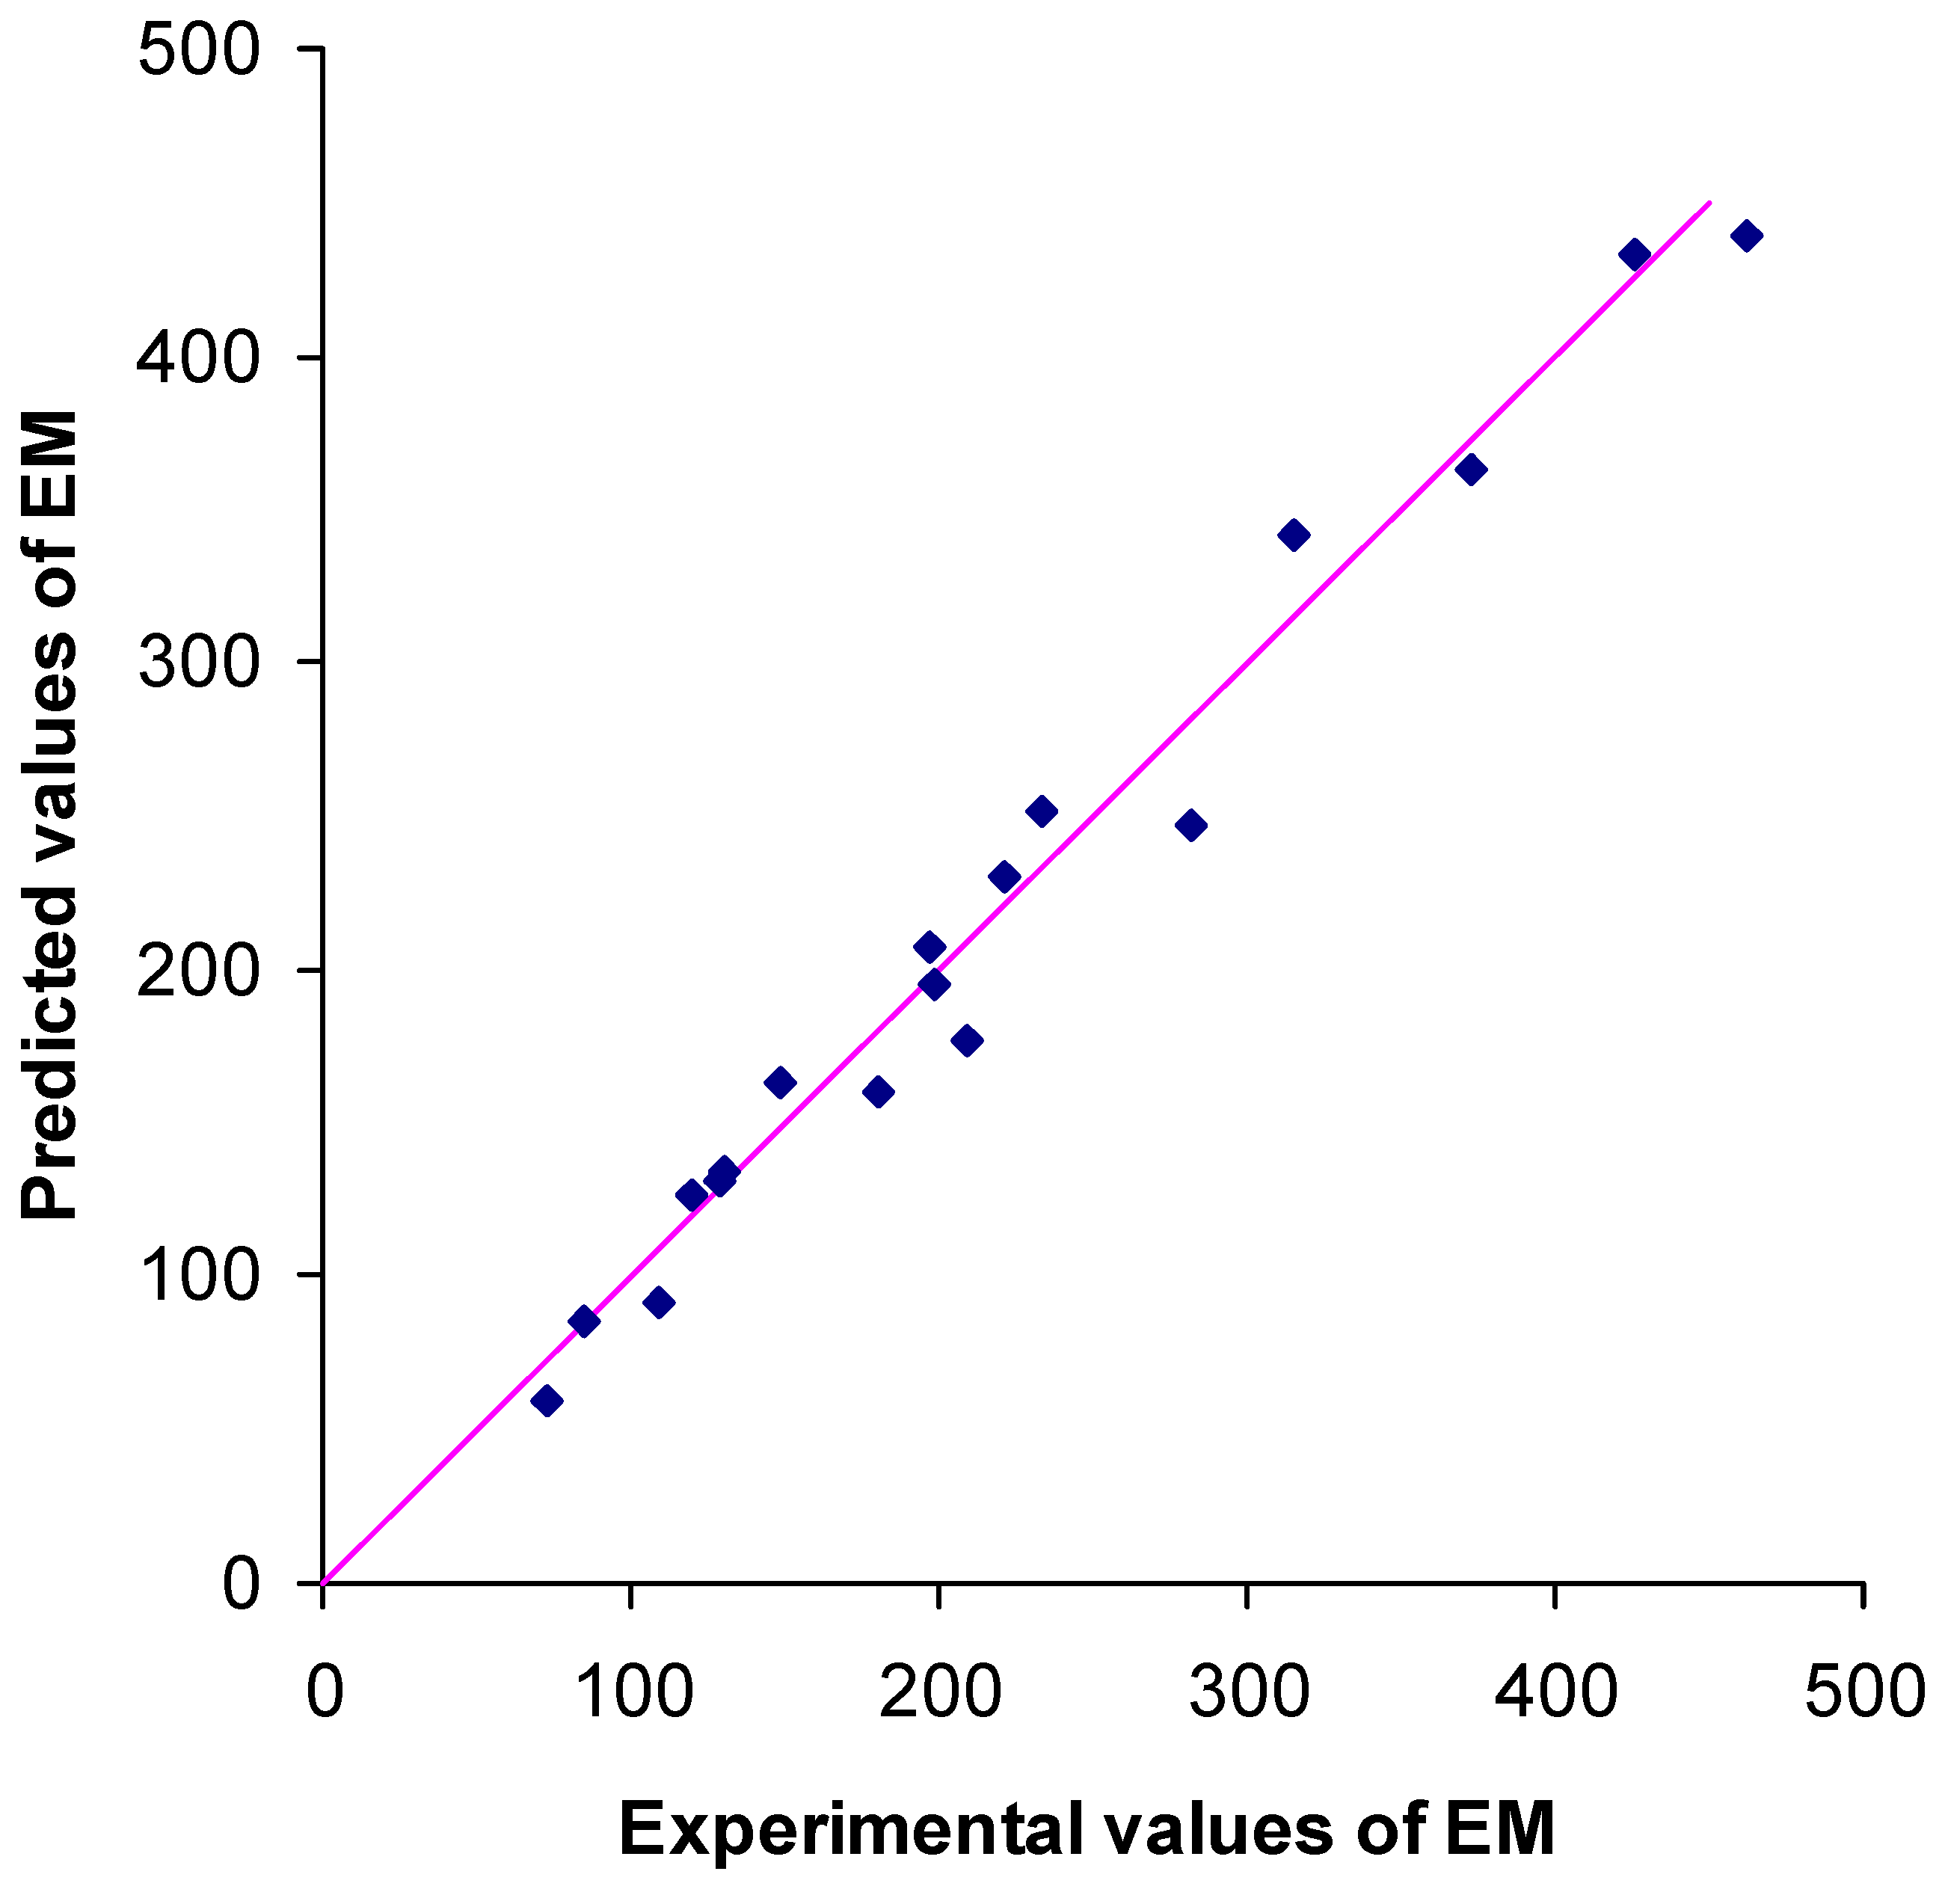
Figure 16.
Method for the estimation of creep limit.
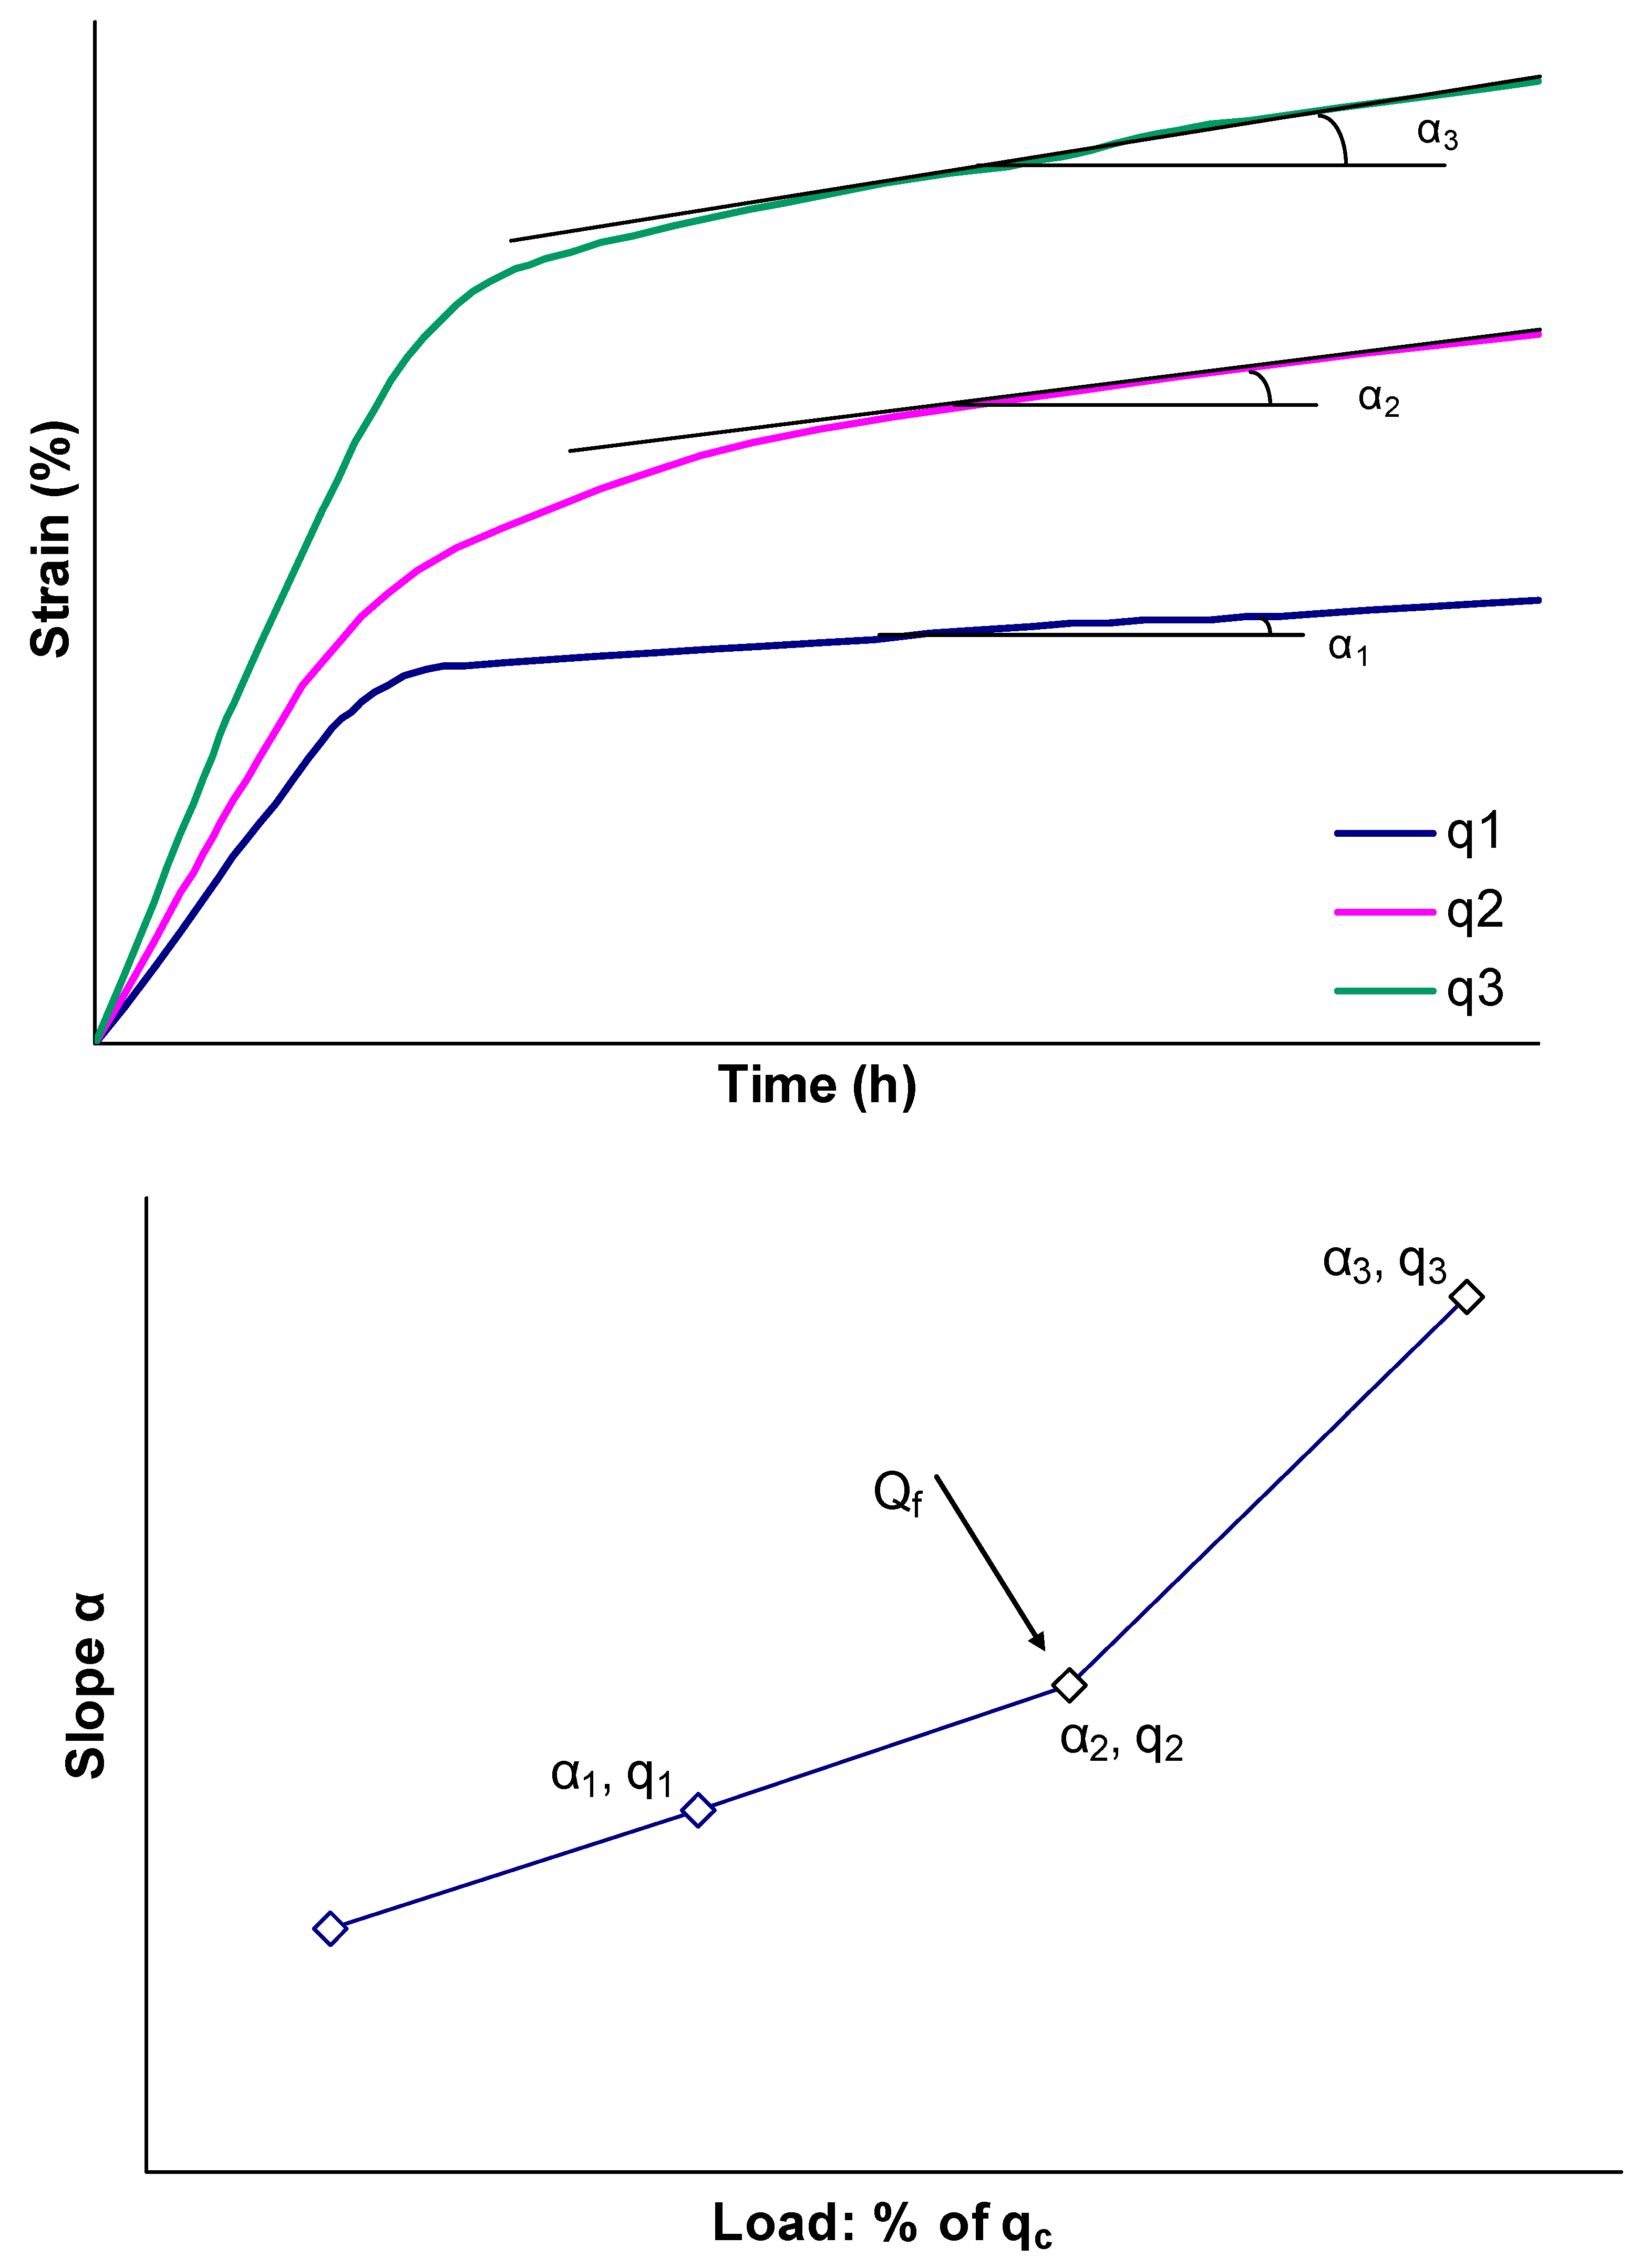
Figure 17.
Unconfined creep tests for S1 sand grouted with grouts of ER/W ratio equal to 3.
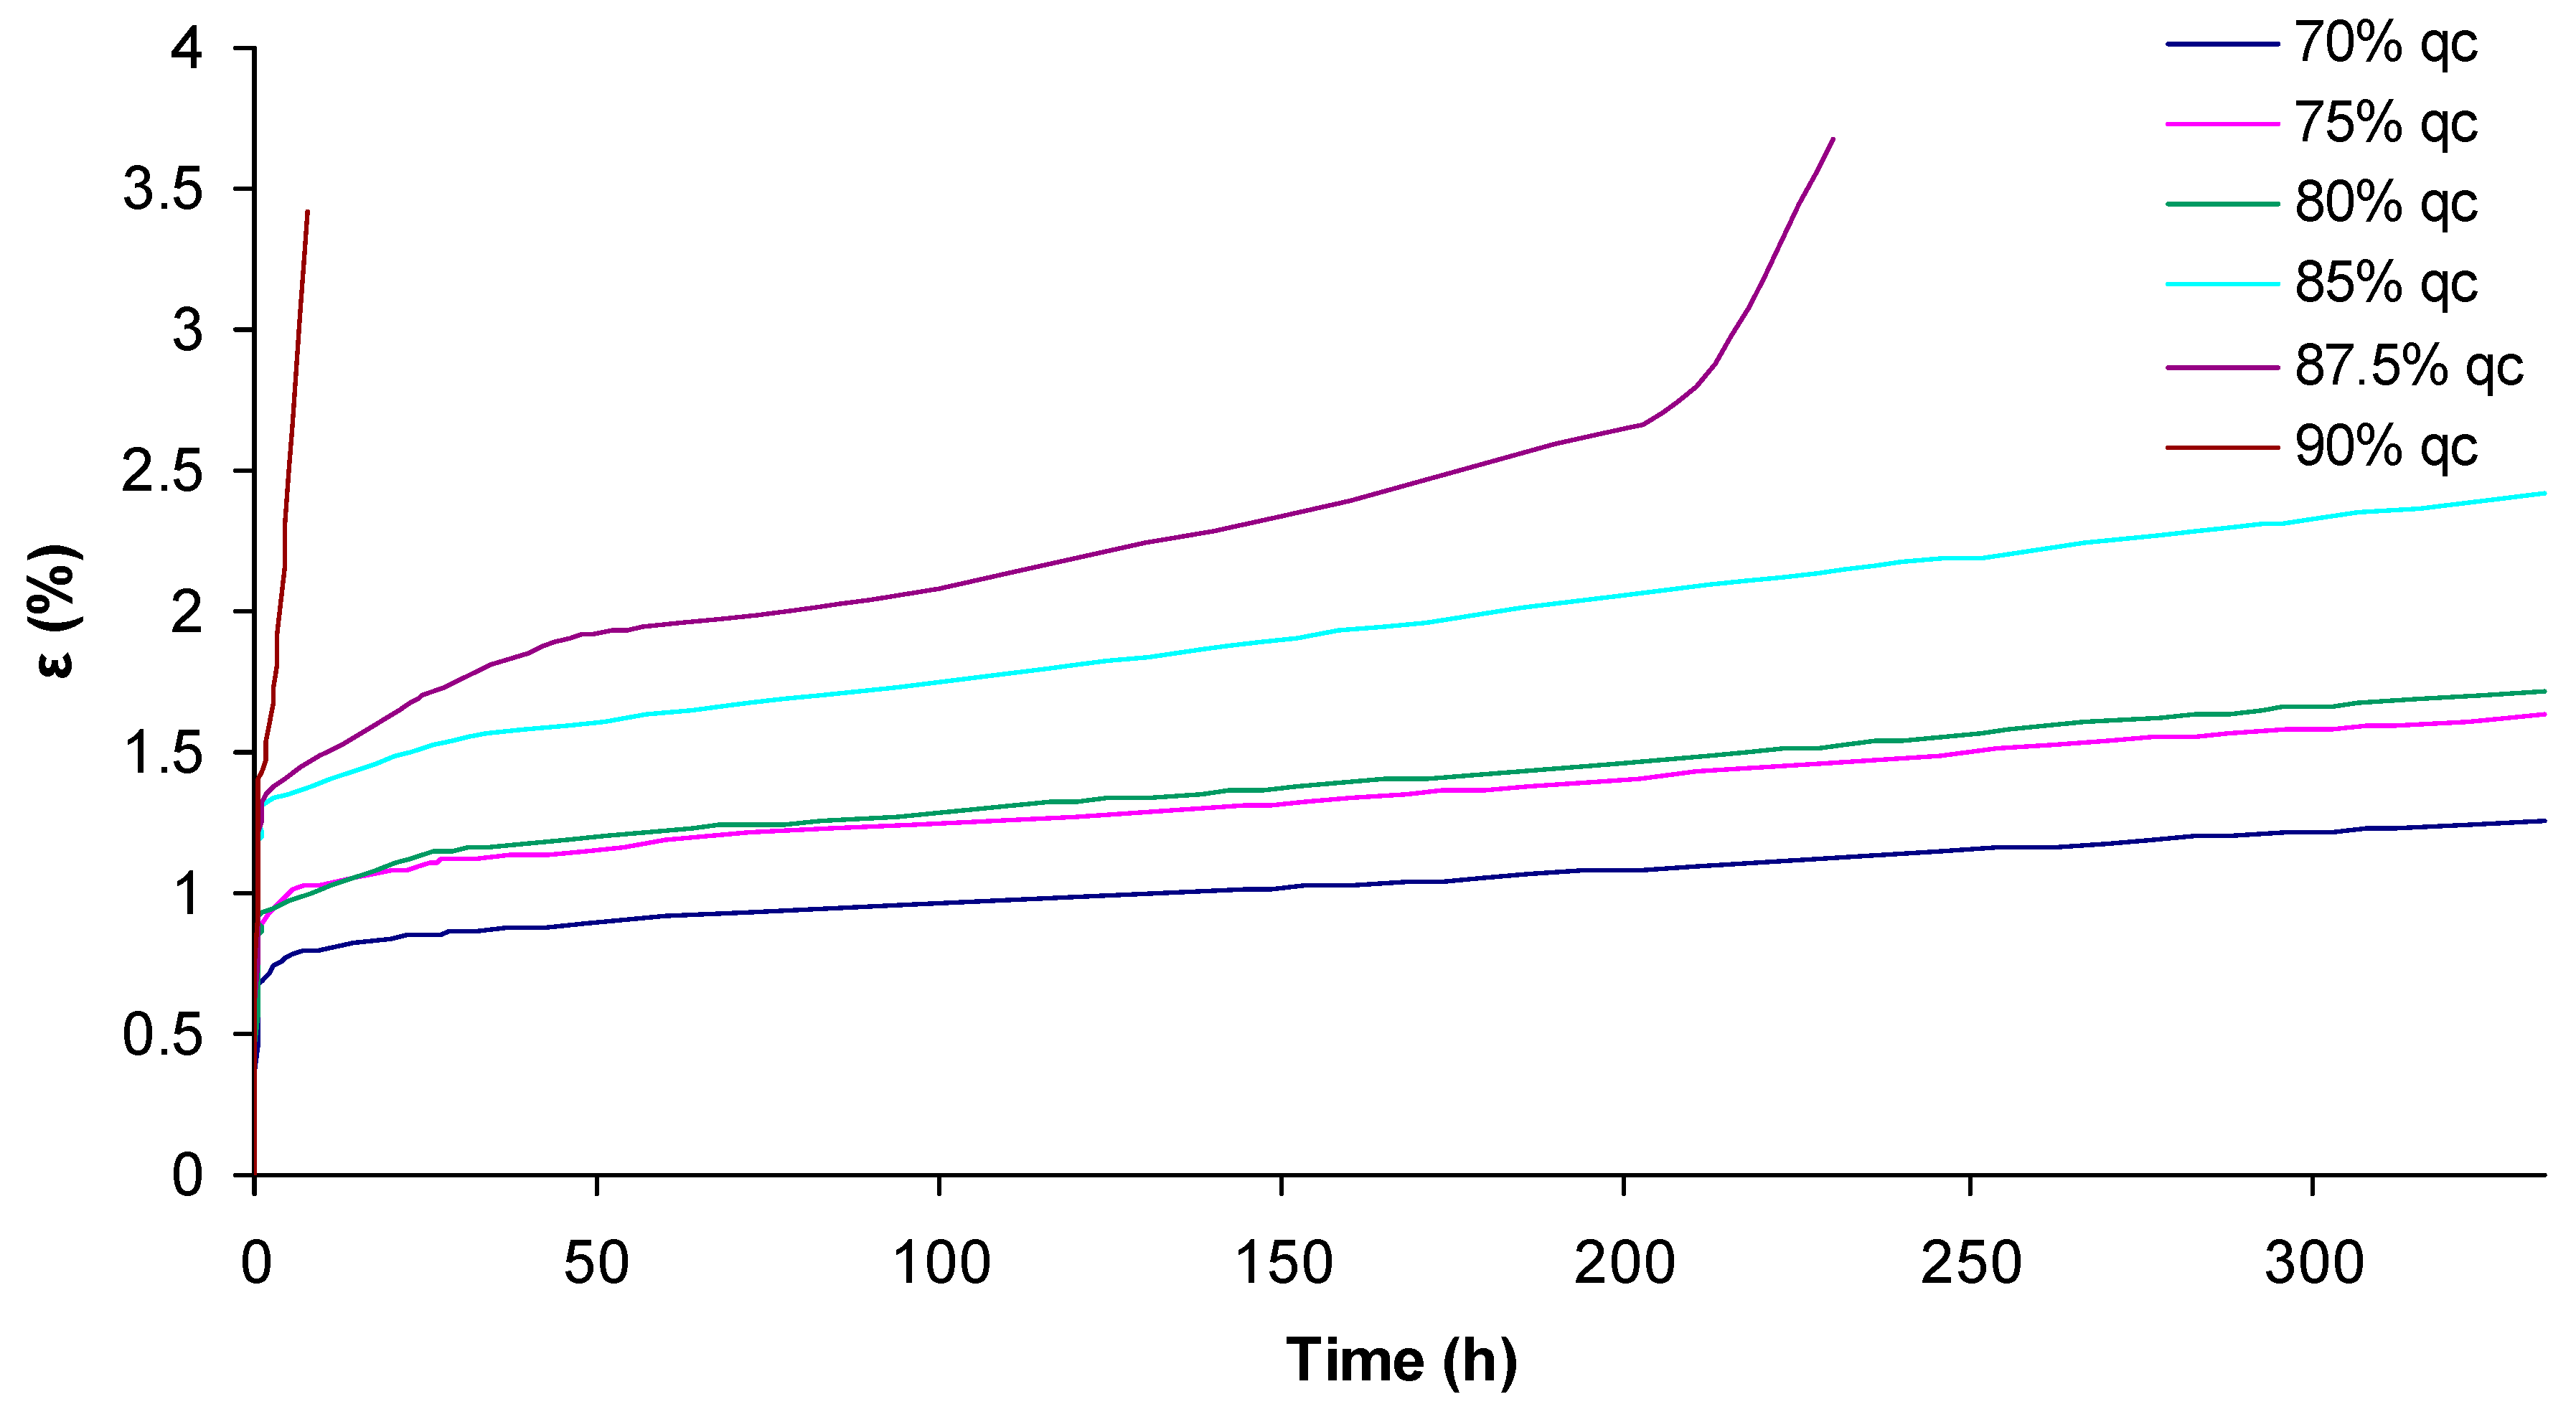
Figure 18.
Creep limit for S1 sand grouted with grouts of ER/W ratio equal to 3 under dry and wet conditions.
Figure 18.
Creep limit for S1 sand grouted with grouts of ER/W ratio equal to 3 under dry and wet conditions.
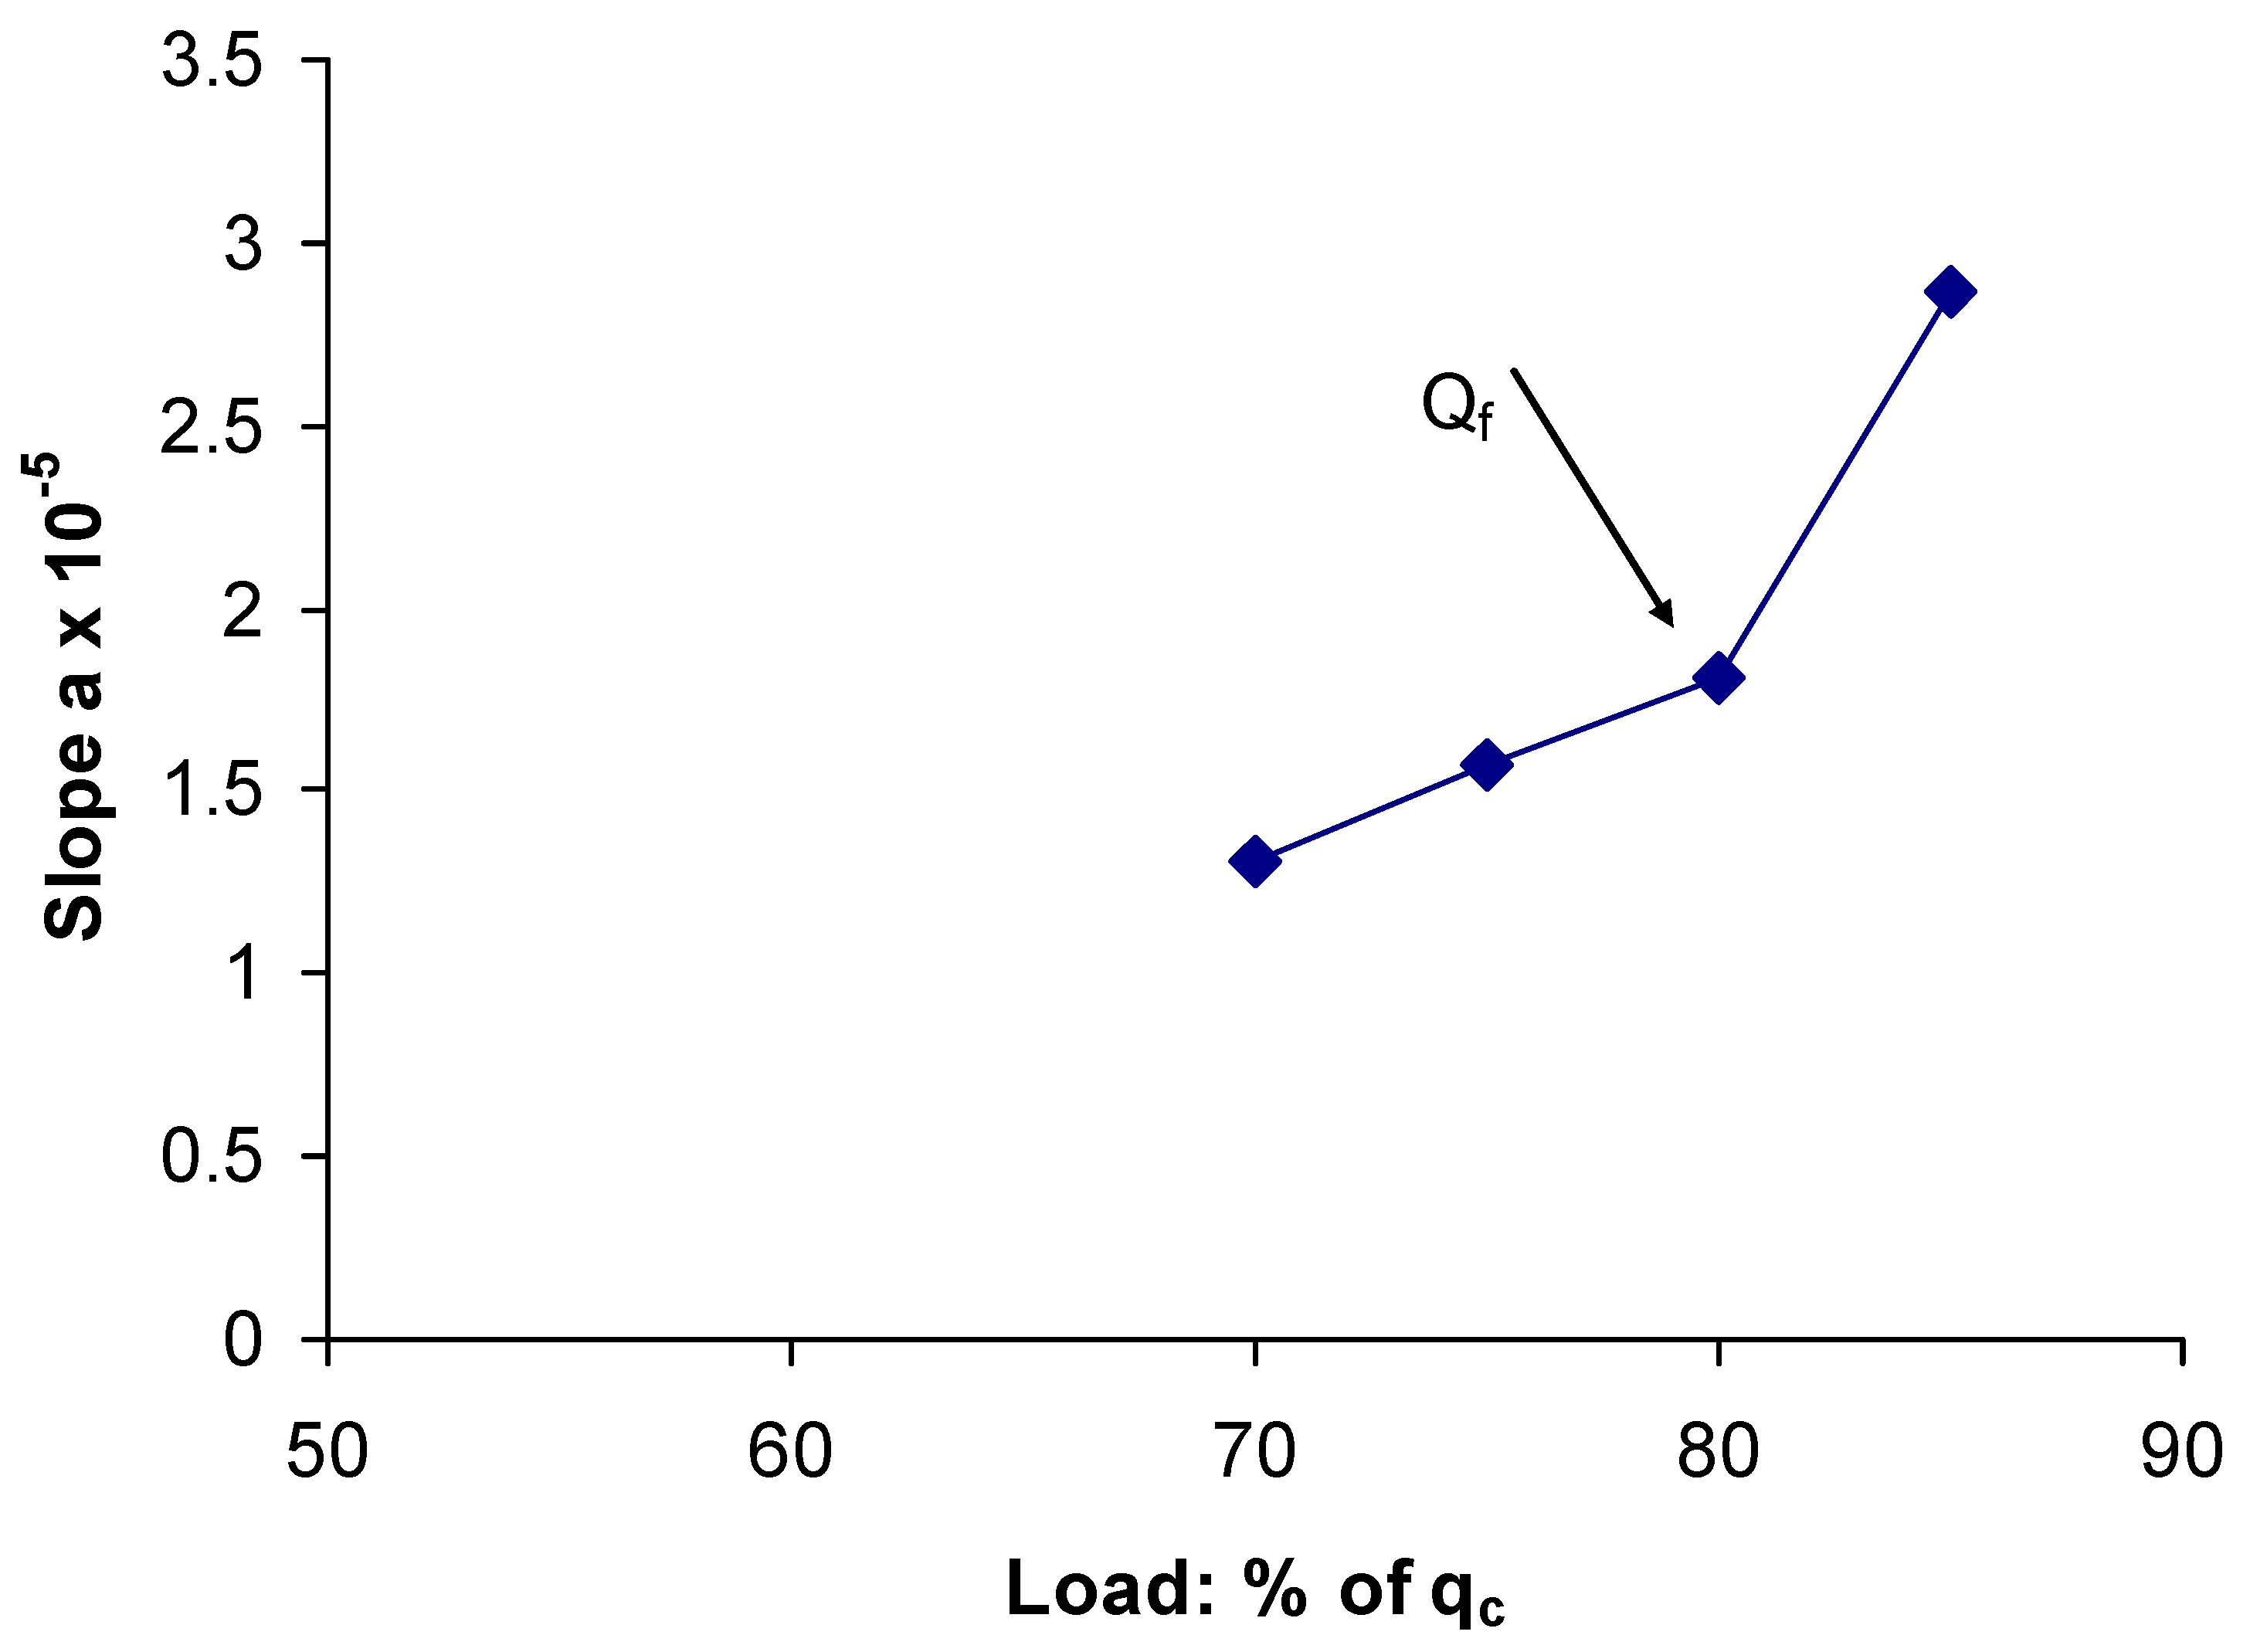
Figure 19.
Cross-plot of k values predicted from the regression equation (6) vs. one from laboratory tests.
Figure 19.
Cross-plot of k values predicted from the regression equation (6) vs. one from laboratory tests.
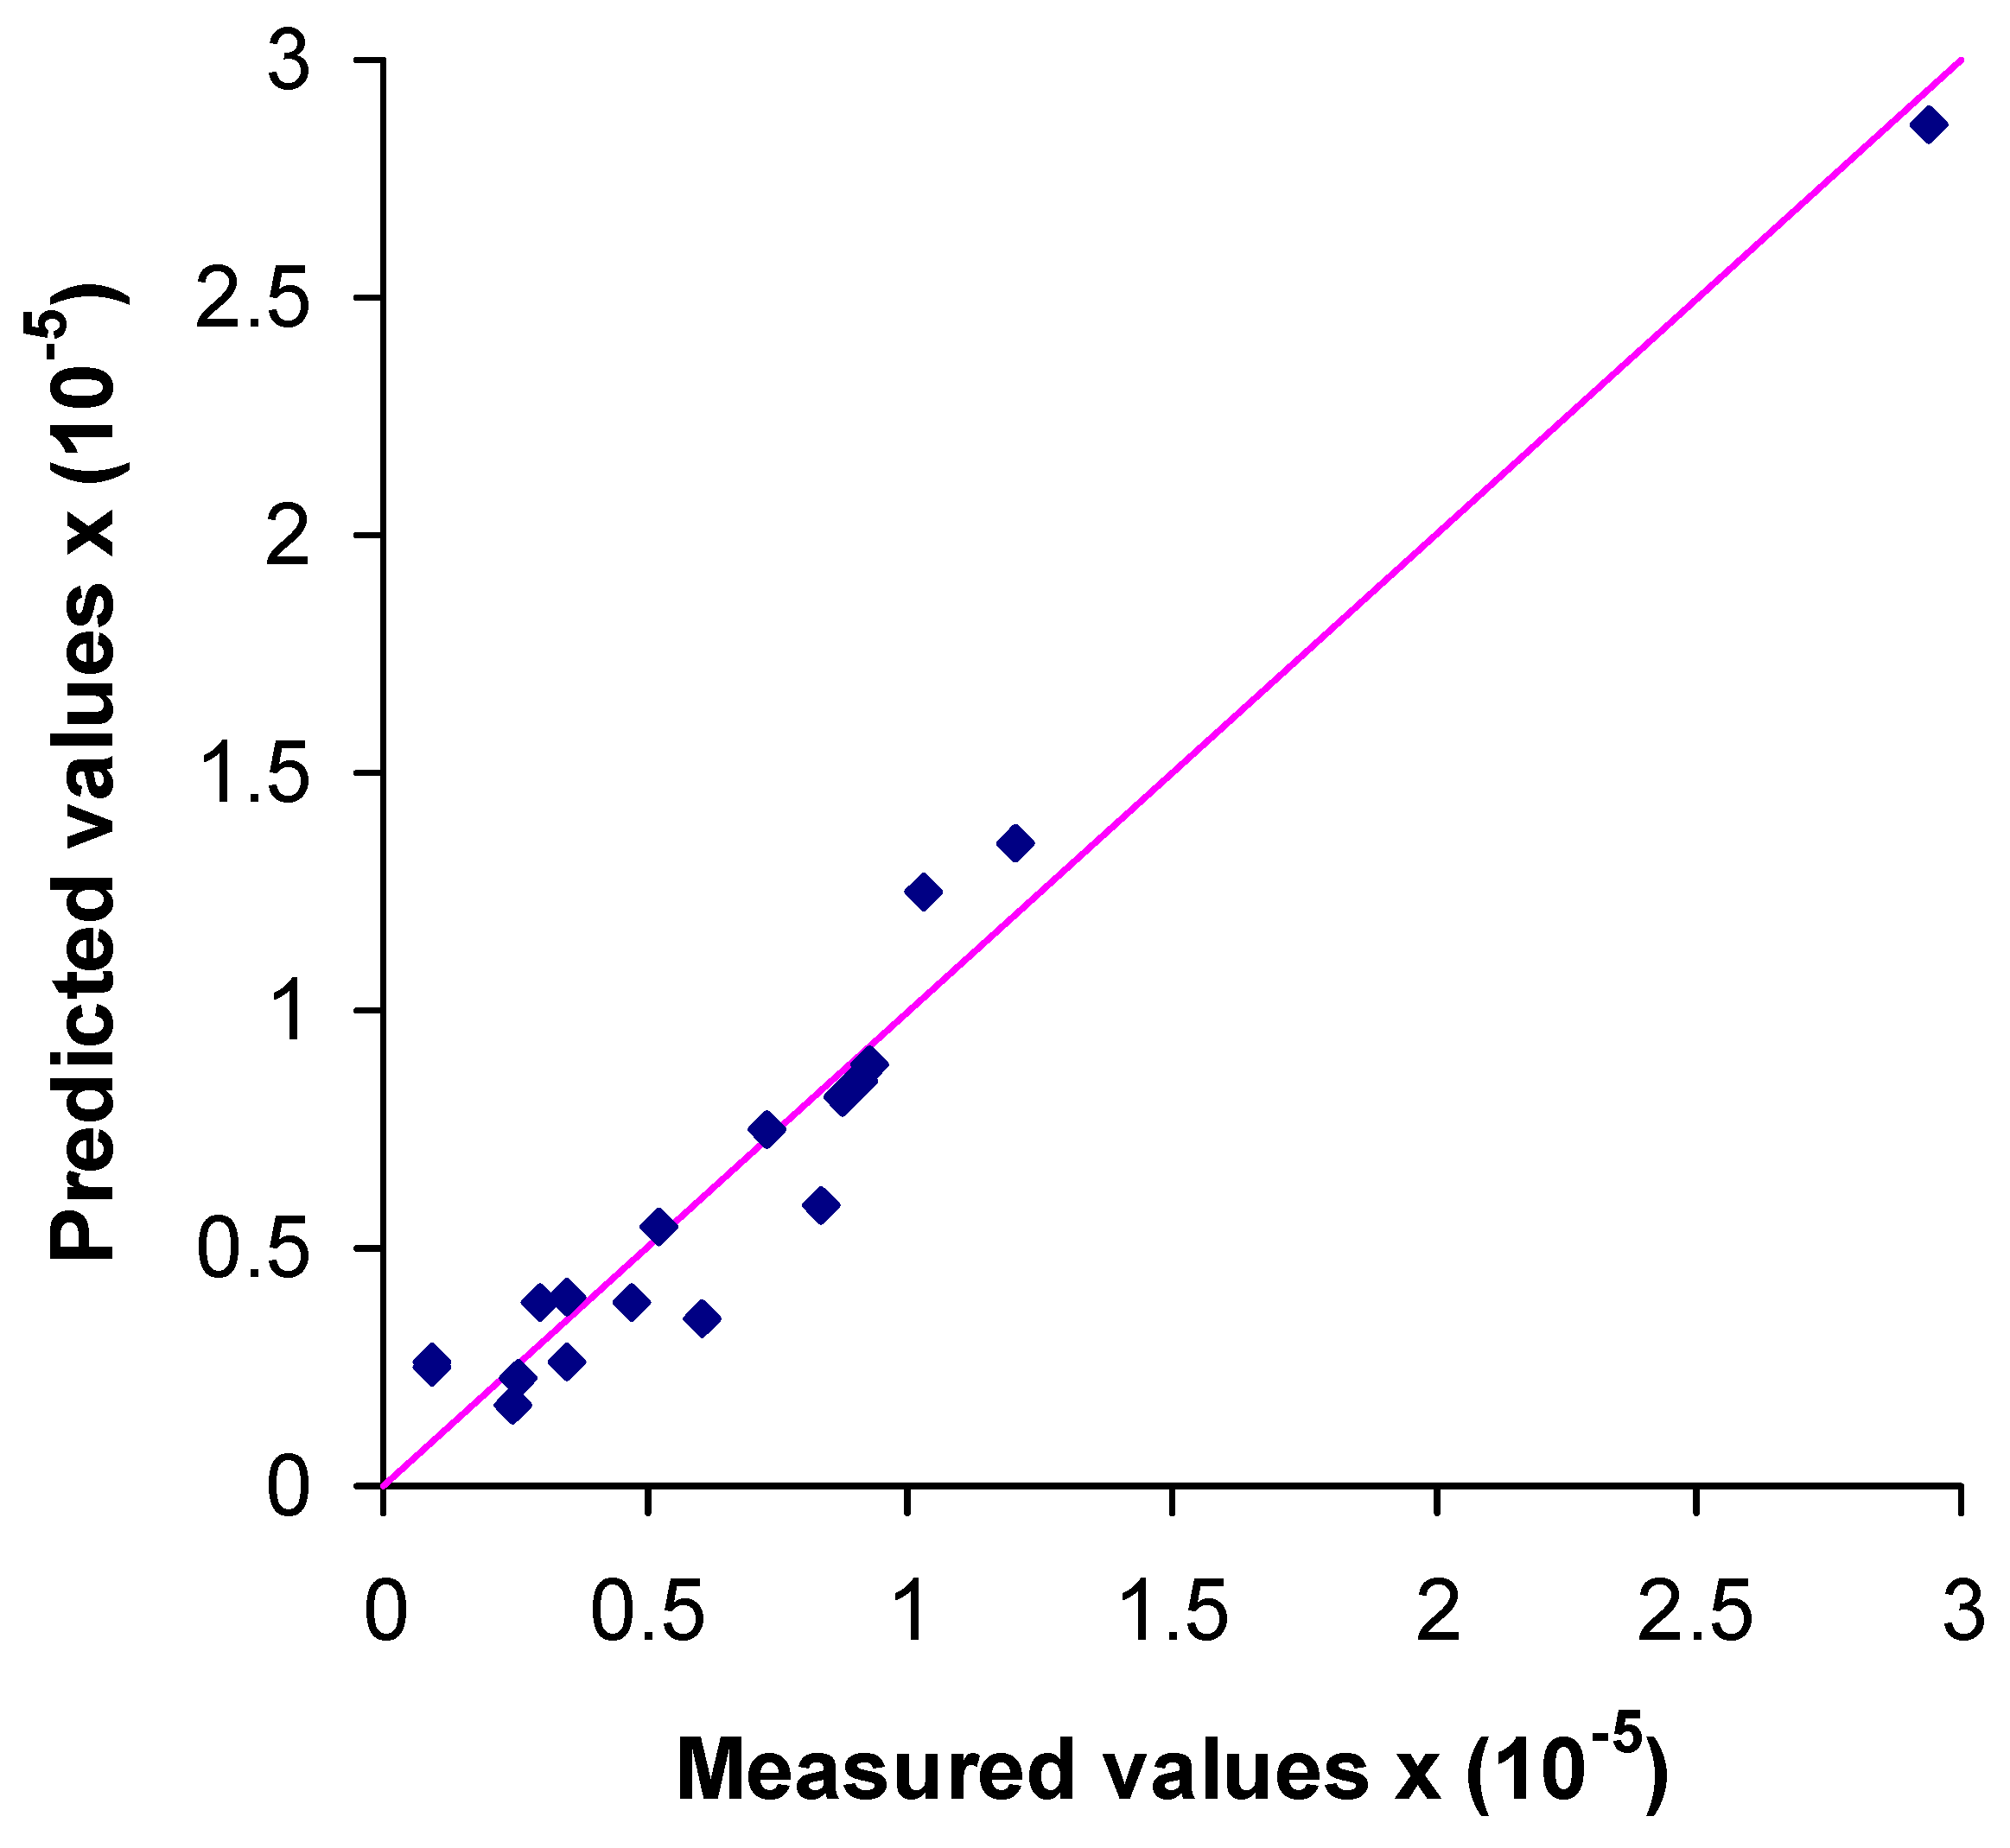

Table 1.
Index properties of the sands.
| S1 | S2 | S3 | S4 | S5 | S6 | |
| D60 (mm) | 0.8 | 0.28 | 0.11 | 0.5 | 1.19 | 1.85 |
| D50 (mm) | 0.67 | 0.2 | 0.097 | 0.33 | 0.8 | 2 |
| D30 (mm) | 0.57 | 0.21 | 0.091 | 0.15 | 0.39 | 1.31 |
| D10 (mm) | 0.46 | 0.17 | 0.08 | 0.09 | 0.149 | 1.22 |
| Coefficient of uniformity, Cu | 1.74 | 1.65 | 1.37 | 5.55 | 7.98 | 1.52 |
| Coefficient of curvature, Cc | 0.88 | 0.92 | 0.94 | 0.5 | 0.86 | 0.76 |
| Specific gravity, Gs | 2.66 | 2.66 | 2.66 | 2.66 | 2.66 | 2.66 |
| Maximum void ratio, emax | 0.78 | 0.87 | 0.96 | 0.64 | 0.564 | 0.88 |
| Minimum dry unit weight, γdmin (kN/m3) | 14.9 | 14.2 | 13.5 | 16.25 | 17 | 14.15 |
| Minimum void ratio, emin | 0.62 | 0.61 | 0.64 | 0.47 | 0.364 | 0.576 |
| Maximum dry unit weight, γdmax (kN/m3) | 16.4 | 16.5 | 16.2 | 18.1 | 19.5 | 16.87 |
Table 2.
Values of regression coefficients and R2.
| ER/W ratio | a | b | R2 | |||
| UCS | EM | UCS | EM | UCS | EM | |
| 3 | 2.543 | 206.66 | -0.324 | -0.272 | 0.99 | 0.95 |
| 2 | 1.726 | 126.05 | -0.304 | -0.313 | 0.99 | 0.96 |
| 1.5 | 0.852 | 82.08 | -0.432 | -0.339 | 0.98 | 0.92 |
Table 3.
Coefficient of permeability and porosity values of ungrouted and grouted sands.
| Notation | k (m/s) | n (%) |
| S1 | 3.04 10-3 | 41.7 |
| S1 + ER/W=3 | 4.72 10-6 | 29.62 |
| S1 + ER/W=2 | 8.29 10-6 | 30 |
| S1 + ER/W=1.5 | 1.03 10-5 | 36.14 |
| S2 | 2.89 10-4 | 43.4 |
| S2 + ER/W=3 | 2.6 10-6 | 31.68 |
| S2 + ER/W=2 | 6.1 10-6 | 34 |
| S2 + ER/W=1.5 | 7.34 10-6 | 36.7 |
| S3 | 4.94 10-5 | 45.4 |
| S3 + ER/W=3 | 8.76 10-7 | 37.04 |
| S3 + ER/W=2 | 2.97 10-6 | 39.41 |
| S3 + ER/W=1.5 | 8.72 10-6 | 41.72 |
| S4 | 7.04 10-5 | 36.3 |
| S4 + ER/W=3 | 2.46 10-6 | 30.56 |
| S4 + ER/W=2 | 3.5 10-6 | 31.6 |
| S4 + ER/W=1.5 | 5.27 10-6 | 33.79 |
| S5 | 3.4 10-4 | 32.6 |
| S5 + ER/W=3 | 9.68 10-7 | 23.4 |
| S5 + ER/W=2 | 3.47 10-6 | 26.3 |
| S5 + ER/W=1.5 | 9 10-6 | 28.4 |
| S6 | 9.56 10-2 | 43.1 |
| S6 + ER/W=3 | 9.2 10-6 | 34.5 |
| S6 + ER/W=2 | 1.2 10-5 | 36.7 |
| S6 + ER/W=1.5 | 2.94 10-5 | 38.4 |
Table 4.
Strength parameters of the two sands.
| ER/W ratio | Compressive strength (MPa) | Elastic modulus (MPa) |
||
| Calcareous | Siliceous | Calcareous | Siliceous | |
| 3 | 2.8 | 2.66 | 225 | 230 |
| 2 | 1.98 | 1.88 | 135 | 128 |
| 1.5 | 1.05 | 1.1 | 88 | 92 |
Table 5.
Creep limit of grouted sands.
| Notation | Qf | |
| Dry condition | Wet condition | |
| S1 + ER/W=3 | 80 | 72.5 |
| S1 + ER/W=2 | 77.5 | 70 |
| S1 + ER/W=1.5 | 75 | 70 |
| S2 + ER/W=3 | 82 | 75 |
| S2 + ER/W=2 | 80 | 75 |
| S2 + ER/W=1.5 | 78 | 72.5 |
| S3 + ER/W=3 | 85 | 77.5 |
| S3 + ER/W=2 | 82.5 | 75 |
| S3 + ER/W=1.5 | 80 | 75 |
| S4 + ER/W=3 | 82 | 75 |
| S4 + ER/W=2 | 80 | 72.5 |
| S4 + ER/W=1.5 | 80 | 72.5 |
| S5 + ER/W=3 | 80 | 75 |
| S5 + ER/W=2 | 78.5 | 72.5 |
| S5 + ER/W=1.5 | 77.5 | 70 |
| S6 + ER/W=3 | 72.5 | 62.5 |
| S6 + ER/W=2 | 70 | 60 |
| S6 + ER/W=1.5 | 67.5 | 55.5 |
Disclaimer/Publisher’s Note: The statements, opinions and data contained in all publications are solely those of the individual author(s) and contributor(s) and not of MDPI and/or the editor(s). MDPI and/or the editor(s) disclaim responsibility for any injury to people or property resulting from any ideas, methods, instructions or products referred to in the content. |
© 2023 by the authors. Licensee MDPI, Basel, Switzerland. This article is an open access article distributed under the terms and conditions of the Creative Commons Attribution (CC BY) license (http://creativecommons.org/licenses/by/4.0/).
Copyright: This open access article is published under a Creative Commons CC BY 4.0 license, which permit the free download, distribution, and reuse, provided that the author and preprint are cited in any reuse.


